FINANCIAL
Financial report 2005/2006 (PDF) - Vision Australia
Financial report 2005/2006 (PDF) - Vision Australia
- No tags were found...

You also want an ePaper? Increase the reach of your titles
YUMPU automatically turns print PDFs into web optimized ePapers that Google loves.
NOTES TO THE <strong>FINANCIAL</strong> STATEMENTS<br />
FOR THE <strong>FINANCIAL</strong> YEAR ENDED 30 JUNE 2006<br />
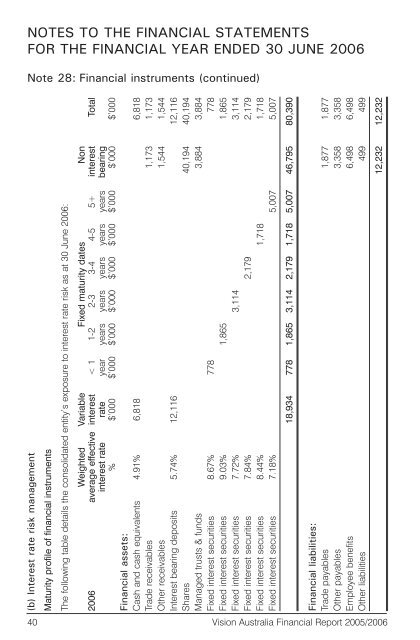
Note 28: Financial instruments (continued)<br />
(b) Interest rate risk management<br />
Maturity profile of financial instruments<br />
The following table details the consolidated entity’s exposure to interest rate risk as at 30 June 2006:<br />
Weighted Variable Fixed maturity dates Non<br />
2006 average effective interest < 1 1-2 2-3 3-4 4-5 5+ interest Total<br />
interest rate rate year years years years years years bearing<br />
% $’000 $’000 $’000 $’000 $’000 $’000 $’000 $’000 $’000<br />
Financial assets:<br />
Cash and cash equivalents 4.91% 6,818 6,818<br />
Trade receivables 1,173 1,173<br />
Other receivables 1,544 1,544<br />
Interest bearing deposits 5.74% 12,116 12,116<br />
Shares 40,194 40,194<br />
Managed trusts & funds 3,884 3,884<br />
Fixed interest securities 8.67% 778 778<br />
Fixed interest securities 9.03% 1,865 1,865<br />
Fixed interest securities 7.72% 3,114 3,114<br />
Fixed interest securities 7.84% 2,179 2,179<br />
Fixed interest securities 8.44% 1,718 1,718<br />
Fixed interest securities 7.18% 5,007 5,007<br />
18,934 778 1,865 3,114 2,179 1,718 5,007 46,795 80,390<br />
Financial liabilities:<br />
Trade payables 1,877 1,877<br />
Other payables 3,358 3,358<br />
Employee benefits 6,498 6,498<br />
Other liabilities 499 499<br />
12,232 12,232<br />
40 Vision Australia Financial Report 2005/2006