Rencontre du Non-Linéaire
l'intégralité des comptes-rendus - science non linéaire
l'intégralité des comptes-rendus - science non linéaire
- No tags were found...

Create successful ePaper yourself
Turn your PDF publications into a flip-book with our unique Google optimized e-Paper software.
70 J. J. John Soundar et al.<br />
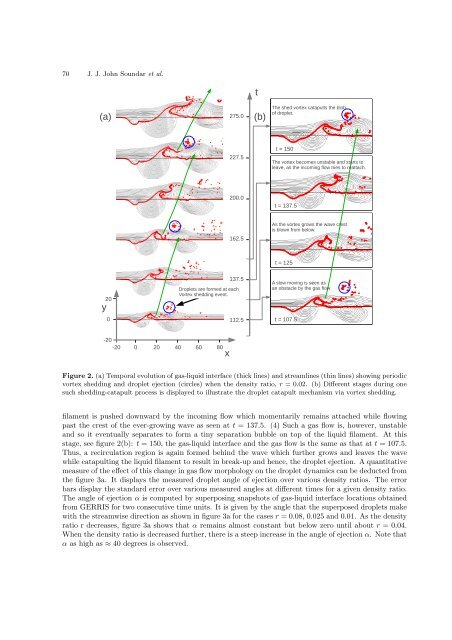
Figure 2. (a) Temporal evolution of gas-liquid interface (thick lines) and streamlines (thin lines) showing periodic<br />
vortex shedding and droplet ejection (circles) when the density ratio, r = 0.02. (b) Different stages <strong>du</strong>ring one<br />
such shedding-catapult process is displayed to illustrate the droplet catapult mechanism via vortex shedding.<br />
filament is pushed downward by the incoming flow which momentarily remains attached while flowing<br />
past the crest of the ever-growing wave as seen at t = 137.5. (4) Such a gas flow is, however, unstable<br />
and so it eventually separates to form a tiny separation bubble on top of the liquid filament. At this<br />
stage, see figure 2(b): t = 150, the gas-liquid interface and the gas flow is the same as that at t = 107.5.<br />
Thus, a recirculation region is again formed behind the wave which further grows and leaves the wave<br />
while catapulting the liquid filament to result in break-up and hence, the droplet ejection. A quantitative<br />
measure of the effect of this change in gasflow morphologyon the droplet dynamics can be de<strong>du</strong>cted from<br />
the figure 3a. It displays the measured droplet angle of ejection over various density ratios. The error<br />
bars display the standard error over various measured angles at different times for a given density ratio.<br />
The angle of ejection α is computed by superposing snapshots of gas-liquid interface locations obtained<br />
from GERRIS for two consecutive time units. It is given by the angle that the superposed droplets make<br />
with the streamwise direction as shown in figure 3a for the cases r = 0.08, 0.025 and 0.01. As the density<br />
ratio r decreases, figure 3a shows that α remains almost constant but below zero until about r = 0.04.<br />
When the density ratio is decreased further, there is a steep increase in the angle of ejection α. Note that<br />
α as high as ≈ 40 degrees is observed.