Rencontre du Non-Linéaire
l'intégralité des comptes-rendus - science non linéaire
l'intégralité des comptes-rendus - science non linéaire
- No tags were found...
Create successful ePaper yourself
Turn your PDF publications into a flip-book with our unique Google optimized e-Paper software.
Vortices catapult droplets in atomization 71<br />
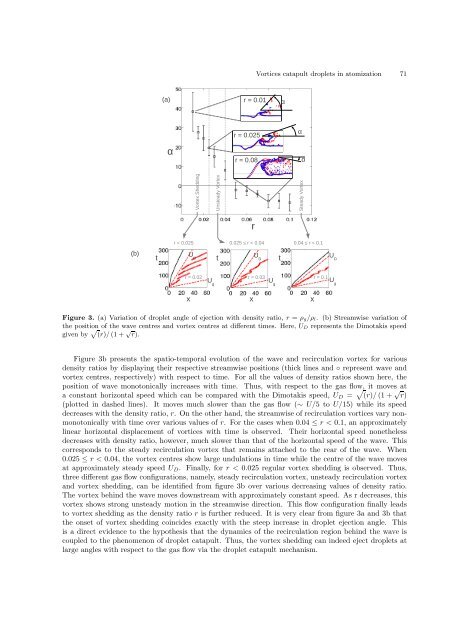
Figure 3. (a) Variation of droplet angle of ejection with density ratio, r = ρ g/ρ l . (b) Streamwise variation of<br />
the position of the wave centres and vortex centres at different times. Here, U D represents the Dimotakis speed<br />
given by √ (r)/(1+ √ r).<br />
Figure 3b presents the spatio-temporal evolution of the wave and recirculation vortex for various<br />
density ratios by displaying their respective streamwise positions (thick lines and ◦ represent wave and<br />
vortex centres, respectively) with respect to time. For all the values of density ratios shown here, the<br />
position of wave monotonically increases with time. Thus, with respect to the gas flow, it moves at<br />
a constant horizontal speed which can be compared with the Dimotakis speed, U D = √ (r)/(1+ √ r)<br />
(plotted in dashed lines). It moves much slower than the gas flow (∼ U/5 to U/15) while its speed<br />
decreases with the density ratio, r. On the other hand, the streamwise of recirculation vortices vary nonmonotonically<br />
with time over various values of r. For the cases when 0.04 ≤ r < 0.1, an approximately<br />
linear horizontal displacement of vortices with time is observed. Their horizontal speed nonetheless<br />
decreases with density ratio, however, much slower than that of the horizontal speed of the wave. This<br />
corresponds to the steady recirculation vortex that remains attached to the rear of the wave. When<br />
0.025 ≤ r < 0.04, the vortex centres show large un<strong>du</strong>lations in time while the centre of the wave moves<br />
at approximately steady speed U D . Finally, for r < 0.025 regular vortex shedding is observed. Thus,<br />
three different gas flow configurations, namely, steady recirculation vortex, unsteady recirculation vortex<br />
and vortex shedding, can be identified from figure 3b over various decreasing values of density ratio.<br />
The vortex behind the wave moves downstream with approximately constant speed. As r decreases, this<br />
vortex shows strong unsteady motion in the streamwise direction. This flow configuration finally leads<br />
to vortex shedding as the density ratio r is further re<strong>du</strong>ced. It is very clear from figure 3a and 3b that<br />
the onset of vortex shedding coincides exactly with the steep increase in droplet ejection angle. This<br />
is a direct evidence to the hypothesis that the dynamics of the recirculation region behind the wave is<br />
coupled to the phenomenon of droplet catapult. Thus, the vortex shedding can indeed eject droplets at<br />
large angles with respect to the gas flow via the droplet catapult mechanism.


