Login to T. Rowe Price
Login to T. Rowe Price
Login to T. Rowe Price
- No tags were found...

Create successful ePaper yourself
Turn your PDF publications into a flip-book with our unique Google optimized e-Paper software.
T. <strong>Rowe</strong> <strong>Price</strong><br />
Retirement Funds Investment Review<br />
Presented by:<br />
Jerome Clark, CFA<br />
Portfolio Manager<br />
February 11, 2009<br />
Wyatt Lee, CFA<br />
Investment Analyst<br />
Webinar Dial-In: 1-877-407-6910<br />
Passcode: T. <strong>Rowe</strong> <strong>Price</strong><br />
Copyright 2009. T. <strong>Rowe</strong> <strong>Price</strong> Investment Services, Inc.<br />
For Institutional Inves<strong>to</strong>r Use Only
Today’s Agenda<br />
I. Introduction<br />
II.<br />
T. <strong>Rowe</strong> <strong>Price</strong> Target Date Overview<br />
III. Case for Target Date Equity Exposure<br />
IV.<br />
2008 Retirement Fund Performance and Attribution<br />
V. Questions<br />
2<br />
Copyright 2009. T. <strong>Rowe</strong> <strong>Price</strong> Investment Services, Inc.<br />
For Institutional Inves<strong>to</strong>r Use Only
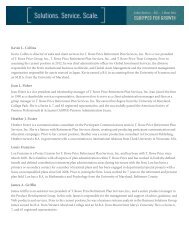
Biographical Backgrounds<br />
Jerome A. Clark, CFA<br />
Jerome Clark is a vice president of T. <strong>Rowe</strong> <strong>Price</strong> Group, Inc., T. <strong>Rowe</strong> <strong>Price</strong> Associates, Inc., and a<br />
portfolio manager in the Asset Allocation Group. He manages the Program for Charitable Giving<br />
portfolios, College Savings Plan portfolios, and the T. <strong>Rowe</strong> <strong>Price</strong> Retirement Funds. Jerome is a<br />
vice president of the Personal Strategy Funds and an Investment Advisory Committee member of<br />
the Spectrum Funds. He is also a member of the Asset Allocation Committee. Prior <strong>to</strong> joining the<br />
firm in 1992, Jerome was a Captain in the United States Marine Corps and spent three years as a<br />
mathematics instruc<strong>to</strong>r at the U.S. Naval Academy. He earned a B.S. in mathematics from the<br />
U.S. Naval Academy, an M.S. in operations research from the Naval Postgraduate School, and an<br />
M.B.A. in finance from Johns Hopkins University. Jerome has also achieved the Chartered<br />
Financial Analyst accreditation.<br />
Wyatt A. Lee, CFA<br />
Wyatt Lee is a vice president of T. <strong>Rowe</strong> <strong>Price</strong> Associates, Inc. and is an investment analyst in the<br />
Asset Allocation Group. Previously, Wyatt was based in T. <strong>Rowe</strong> <strong>Price</strong>’s London office and was<br />
responsible for developing a portfolio and performance analysis function <strong>to</strong> focus on non-U.S.<br />
equity strategies. He has also managed a team of investment performance analysts in the Equity<br />
Division. Prior <strong>to</strong> joining the firm in 1999, he was a research analyst for Summit Strategies<br />
Group, an institutional investment consultant. He earned a B.Sc. in mathematics and political<br />
science, cum laude, from Vanderbilt University and an M.B.A. in finance from the Olin School of<br />
Business at Washing<strong>to</strong>n University, where he was a Charles F. Knight Scholar. Wyatt has also<br />
achieved the Chartered Financial Analyst accreditation.<br />
3<br />
Copyright 2009. T. <strong>Rowe</strong> <strong>Price</strong> Investment Services, Inc.<br />
For Institutional Inves<strong>to</strong>r Use Only
T. <strong>Rowe</strong> <strong>Price</strong> Target Date Overview<br />
Copyright 2009. T. <strong>Rowe</strong> <strong>Price</strong> Investment Services, Inc.<br />
For Institutional Inves<strong>to</strong>r Use Only
T. <strong>Rowe</strong> <strong>Price</strong> Asset Allocation Snapshot<br />
Asset Allocation Assets Under Management: $46.2 Billion 1<br />
As of December 31, 2008<br />
1 The combined asset allocation assets under management of the T. <strong>Rowe</strong> <strong>Price</strong> group of companies. The t. <strong>Rowe</strong> <strong>Price</strong> group of<br />
companies includes T. <strong>Rowe</strong> <strong>Price</strong> Associates, Inc., T. <strong>Rowe</strong> <strong>Price</strong> international, Inc., T. <strong>Rowe</strong> <strong>Price</strong> Global Investment Services<br />
Limited, and T. <strong>Rowe</strong> <strong>Price</strong> (Canada), Inc.<br />
5<br />
Copyright 2009. T. <strong>Rowe</strong> <strong>Price</strong> Investment Services, Inc.<br />
For Institutional Inves<strong>to</strong>r Use Only
Retirement Funds Investment Philosophy<br />
6<br />
Copyright 2009. T. <strong>Rowe</strong> <strong>Price</strong> Investment Services, Inc.<br />
For Institutional Inves<strong>to</strong>r Use Only
Retirement Funds Glidepath<br />
7<br />
Copyright 2009. T. <strong>Rowe</strong> <strong>Price</strong> Investment Services, Inc.<br />
For Institutional Inves<strong>to</strong>r Use Only
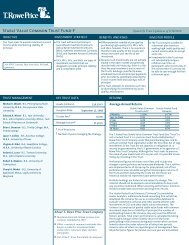
Retirement Funds Performance<br />
Current performance may be lower or higher than the quoted past performance, which cannot guarantee future results. Share price, principal<br />
value, and return will vary, and you may have a gain or loss when you sell your shares. To obtain the most recent month-end performance, call<br />
1-800-638-7890.<br />
Request a prospectus, which includes investment objectives, risks, fees, expenses, and other information that you should read and consider<br />
carefully before investing<br />
Effective May 31, 2008, the broad weighted index for each fund changed <strong>to</strong> include the Russell 3000 Index, MSCI All Country World Ex U.S.<br />
Index, the Barclays Capital U.S. Aggregate Index, and the Citigroup 3-Month Treasury Bill Index. Prior <strong>to</strong> this change, the broad weighted<br />
index for each fund was comprised of the Dow Jones Wilshire 5000 Composite Index, the MSCI EAFE Index, the Barclays Capital U.S.<br />
Aggregate Index, and the Citigroup 3-Month Treasury Bill Index. Each index is weighted at the appropriate strategic neutral allocation of<br />
its respective asset class, which is predetermined and changes over time. His<strong>to</strong>rical benchmark representations have not been restated.<br />
The most recent mix of underlying indices as of December 31, 2008 can be found on page 29.<br />
Figures include changes in principal value, reinvested dividends, and capital gain distributions.<br />
8<br />
T. <strong>Rowe</strong> <strong>Price</strong> Investment Services, Inc., Distribu<strong>to</strong>r.<br />
For Institutional Inves<strong>to</strong>r Use Only<br />
Copyright 2009. T. <strong>Rowe</strong> <strong>Price</strong> Investment Services, Inc.
Peer Group Performance Comparison<br />
9<br />
Fund Returns have been affected by market volatility and are negative for certain periods.<br />
Results will vary for other periods, and all funds are subject <strong>to</strong> market risk. Past performance cannot guarantee future results.<br />
Lipper rankings are based on cumulative <strong>to</strong>tal return.<br />
Source: Lipper, Inc.<br />
For Institutional Inves<strong>to</strong>r Use Only<br />
Copyright 2009. T. <strong>Rowe</strong> <strong>Price</strong> Investment Services, Inc.
Peer Group Comparison<br />
Fund Returns have been affected by market volatility and are negative for certain periods.<br />
Results will vary for other periods, and all funds are subject <strong>to</strong> market risk. Past performance cannot guarantee future results.<br />
Lipper rankings are based on cumulative <strong>to</strong>tal return.<br />
10<br />
Source: Lipper, Inc.<br />
For Institutional Inves<strong>to</strong>r Use Only<br />
Copyright 2009. T. <strong>Rowe</strong> <strong>Price</strong> Investment Services, Inc.
Case for Target Date Equity Exposure<br />
Copyright 2009. T. <strong>Rowe</strong> <strong>Price</strong> Investment Services, Inc.<br />
For Institutional Inves<strong>to</strong>r Use Only
Case for Target Date Equity Exposure<br />
• Target-date products are designed for inves<strong>to</strong>rs with a very diverse set of<br />
retirement needs.<br />
• T. <strong>Rowe</strong> <strong>Price</strong> target-date products are designed <strong>to</strong> provide assets from which <strong>to</strong><br />
draw retirement income over a long horizon. We recognize few inves<strong>to</strong>rs need all<br />
their assets at retirement.<br />
• Under conservative retirement assumptions, most asset allocation strategies result<br />
in successful retirement outcomes.<br />
• Higher equity allocation is especially important <strong>to</strong> compensate for under-saving and<br />
over-withdrawing behavior seen among plan participants.<br />
• An extended glidepath design maintains the potential benefits of equity exposure in<br />
retirement while re-distributing risk across the lifetime of the fund.<br />
We believe adequate equity exposure and an extended glidepath best position<br />
inves<strong>to</strong>rs for a successful retirement.<br />
12<br />
Copyright 2009. T. <strong>Rowe</strong> <strong>Price</strong> Investment Services, Inc.<br />
For Institutional Inves<strong>to</strong>r Use Only
Plan Participant Behavior<br />
Savings Rate<br />
Withdrawal Rate<br />
>15%<br />
8.8%<br />
9-10%<br />
3.2% - Employer<br />
Contribution 2<br />
5.6% - Employee<br />
Contribution 3<br />
4%<br />
Recommended Actual 1<br />
Recommended Actual 4<br />
1 Profit sharing/401(k) Council of America 51 st annual series (9/2008).<br />
2 Non-highly compensated workers.<br />
3 401(k) plan only.<br />
4 T. <strong>Rowe</strong> <strong>Price</strong> plans (60-69 years old with installment sales).<br />
Participant behavior is typically <strong>to</strong> under-save and over-withdraw.<br />
13<br />
Copyright 2009. T. <strong>Rowe</strong> <strong>Price</strong> Investment Services, Inc.<br />
For Institutional Inves<strong>to</strong>r Use Only
Longevity: Underlying Driver of Retirement Risk<br />
Odds of at Least One Member of a 65-Year-Old Couple Living <strong>to</strong> Age….<br />
Retirees face an increasing risk of “living <strong>to</strong>o long” rather than “dying <strong>to</strong> soon.”<br />
14<br />
Copyright 2009. T. <strong>Rowe</strong> <strong>Price</strong> Investment Services, Inc.<br />
For Institutional Inves<strong>to</strong>r Use Only
Importance of Equity Exposure <strong>to</strong> Minimize Risk of Outliving Assets<br />
Likelihood that payment stream duration exceeds 30 years<br />
100<br />
Stimulation Success Rate (%)<br />
90<br />
80<br />
70<br />
60<br />
50<br />
40<br />
30<br />
20<br />
10<br />
4% annual withdrawal<br />
5% annual withdrawal<br />
6% annual withdrawal<br />
8% annual withdrawal<br />
1<br />
1<br />
1<br />
1<br />
0<br />
100% Fixed Income 20% Equity/ 80%<br />
Fixed Income<br />
40% Equity/ 60%<br />
Fixed Income<br />
60% Equity/ 40%<br />
Fixed Income<br />
80% Equity/ 20%<br />
Fixed Income<br />
100% Equity<br />
• Virtually all asset allocations support a recommended 4% withdrawal rate with 90% success.<br />
• Higher (5% and above) withdrawal rates benefit from higher equity allocations.<br />
Adequate equity exposure is necessary <strong>to</strong> successfully fund long retirement horizons.<br />
15<br />
1 Withdrawal increases annually by 3%.<br />
Copyright 2009. T. <strong>Rowe</strong> <strong>Price</strong> Investment Services, Inc.<br />
For Institutional Inves<strong>to</strong>r Use Only
Importance of Equity Exposure for Balances Late in Retirement<br />
250<br />
Purchasing Power Remaining 30 Years Post-Retirement<br />
Purchasing Power Remaining (%)<br />
200<br />
150<br />
100<br />
50<br />
0<br />
100% Fixed<br />
Income<br />
20% Equity/<br />
80% Fixed<br />
Income<br />
40% Equity/<br />
60% Fixed<br />
Income<br />
60% Equity/<br />
40% Fixed<br />
Income<br />
80% Equity/<br />
20% Fixed<br />
Income<br />
100% Equity<br />
Median Purchasing Power Remaining,<br />
4% initial withdrawal1<br />
25th percentile Purchasing Power<br />
Remaining, 4% initial withdrawal<br />
1<br />
Median Purchasing Power Remaining,<br />
6% initial withdrawal1<br />
25th percentile Purchasing Power<br />
Remaining, 6% initial withdrawal 1<br />
• Purchasing power remaining is an indication of the cushion provided.<br />
• Remaining purchasing power universally increases with equity.<br />
Equity exposure in retirement can help provide a cushion against unplanned events.<br />
16<br />
1 Withdrawal increases annually by 3%.<br />
Copyright 2009. T. <strong>Rowe</strong> <strong>Price</strong> Investment Services, Inc.<br />
For Institutional Inves<strong>to</strong>r Use Only
Consideration of Downside at Retirement<br />
Likelihood of Annual Return Less Than<br />
20<br />
Probability (%)<br />
16<br />
12<br />
8<br />
100% Fixed Income<br />
20% Equity/80% Fixed Income<br />
40% Equity/60% Fixed Income<br />
60% Equity/40% Fixed Income<br />
80% Equity/20% Fixed Income<br />
100% Equity<br />
4<br />
0<br />
-5%<br />
-10%<br />
The risk of significant negative market returns should be taken in<strong>to</strong> consideration.<br />
17<br />
Copyright 2009. T. <strong>Rowe</strong> <strong>Price</strong> Investment Services, Inc.<br />
For Institutional Inves<strong>to</strong>r Use Only
Distribution<br />
A glidepath design maintains potential benefits of equity in retirement,<br />
while re-distributing the risk.<br />
1 55-20 Glidepath represents a 55% Equity/45% Fixed Income allocation at retirement that linearly decreases<br />
equity exposure over 30 years. The final allocation is 20% Equity/80% Fixed Income.<br />
18<br />
Copyright 2009. T. <strong>Rowe</strong> <strong>Price</strong> Investment Services, Inc.<br />
For Institutional Inves<strong>to</strong>r Use Only
His<strong>to</strong>rical Analysis of Alternative Glidepaths<br />
$10,000,000<br />
Resulting Value of $1MM Investment at Retirement 1<br />
30-Year Horizon, 4% Initial Withdrawal, Inflation Adjusted 2<br />
$8,000,000<br />
$6,000,000<br />
$4,000,000<br />
$2,000,000<br />
$0<br />
-$2,000,000<br />
12/55 12/60 12/65 12/70 12/75 12/80 12/85 12/90 12/95 12/00 12/05<br />
12/08<br />
T. <strong>Rowe</strong> <strong>Price</strong> Glidepath Balance 10% Equity <strong>to</strong> Fixed Income Balance 20% Equity <strong>to</strong> Fixed Income Balance<br />
3 4 5<br />
19<br />
Equity = S&P 500 Index, Fixed Income = 1926-1972 U.S. IT Gov’t Index; 1973-1975 LB Gov’t/Corp Index; 1976-Present Barclays U.S. Aggregate Index<br />
(formerly Lehman Brothers U.S. Aggregate Index), Cash = U.S. 30 Day T-Bills.<br />
1 Positive balances reflect surplus assets at the end of a 30-year retirement horizon. Negative balances reflect the shortfall amount needed <strong>to</strong> fund the<br />
specified withdrawals.<br />
2 Assumes withdrawal increases annually by the % change in the Consumer <strong>Price</strong> Index for all Urban Consumers (CPI-U), not seasonally adjusted (if<br />
greater than 0% (if annual % change of CPI-U is negative).<br />
3 See p. 7 for T. <strong>Rowe</strong> <strong>Price</strong> Glidepath.<br />
4 T. <strong>Rowe</strong> <strong>Price</strong> Glidepath with equity allocation reduced by 10% and fixed-income allocation increased by 10%, with minimum equity allocation of 20%.<br />
5 T. <strong>Rowe</strong> <strong>Price</strong> Glidepath with equity allocation reduced by 20% and fixed-income allocation increased by 20%, with minimum equity<br />
allocation of 20%.<br />
Source: Ibbotson Associates, T. <strong>Rowe</strong> <strong>Price</strong>.<br />
Copyright 2009. T. <strong>Rowe</strong> <strong>Price</strong> Investment Services, Inc.<br />
For Institutional Inves<strong>to</strong>r Use Only
His<strong>to</strong>rical Analysis of Alternative Glidepaths<br />
$3,500,000<br />
$3,000,000<br />
$2,500,000<br />
$2,000,000<br />
$1,500,000<br />
$1,000,000<br />
$500,000<br />
$0<br />
-$500,000<br />
Difference in Resulting Value of $1MM Investment at Retirement 1<br />
30-Year Horizon, 4% Initial Withdrawal, Inflation Adjusted 2<br />
12/55 12/60 12/65 12/70 12/75 12/80 12/85 12/90 12/95 12/00 12/05 12/08<br />
T. <strong>Rowe</strong> <strong>Price</strong> Glidepath Balance vs. 10% Equity <strong>to</strong> Fixed Income Balance<br />
T. <strong>Rowe</strong> <strong>Price</strong> Glidepath Balance vs. 20% Equity <strong>to</strong> Fixed Income Balance<br />
1 Positive differences reflect higher ending assets in T. <strong>Rowe</strong> <strong>Price</strong> Glidepath. Negative differences reflect<br />
lower ending assets in T. <strong>Rowe</strong> <strong>Price</strong> Glidepath.<br />
2 Assumes withdrawal increases annually by the %change in the Consumer <strong>Price</strong> Index for all Urban Consumers (CPI-U),<br />
not seasonally adjusted (if greater than 0% (if annual % change of CPI-U is negative).<br />
Source: Ibbotson Associates, T. <strong>Rowe</strong> <strong>Price</strong>.<br />
20<br />
Copyright 2009. T. <strong>Rowe</strong> <strong>Price</strong> Investment Services, Inc.<br />
For Institutional Inves<strong>to</strong>r Use Only
Accumulation<br />
Equity = S&P 500 Index, Fixed Income = 1968-1972 U.S. IT Gov’t Index; 1973-1975 LB Gov’t/Corp Index; 1976-Present Barclays U.S.<br />
Aggregate Index (formerly Lehman Brothers U.S. Aggregate Index).<br />
Source: Ibbotson Associates, T. <strong>Rowe</strong> <strong>Price</strong>.<br />
Assuming contribution rate = 9%, starting salary = $50,000, and final salary = $50,000*1.03^39.<br />
21<br />
Copyright 2009. T. <strong>Rowe</strong> <strong>Price</strong> Investment Services, Inc.<br />
For Institutional Inves<strong>to</strong>r Use Only
2008 Retirement Fund Performance & Attribution<br />
Copyright 2009. T. <strong>Rowe</strong> <strong>Price</strong> Investment Services, Inc.<br />
For Institutional Inves<strong>to</strong>r Use Only
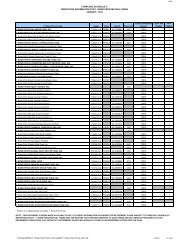
Retirement Funds Performance Relative <strong>to</strong> Benchmark<br />
Effective May 31, 2008, the broad weighted index for each fund changed <strong>to</strong> include the Russell 3000 Index, MSCI All Country World Ex U.S. Index, the Barclays<br />
Capital U.S. Aggregate Index, and the Citigroup 3-Month Treasury Bill Index. Prior <strong>to</strong> this change, the broad weighted index for each fund was comprised of the<br />
Dow Jones Wilshire 5000 Composite Index, the MSCI EAFE Index, the Barclays Capital U.S. Aggregate Index, and the Citigroup 3-Month Treasury Bill Index.<br />
Each index is weighted at the appropriate strategic neutral allocation of its respective asset class, which is predetermined and changes over time. His<strong>to</strong>rical<br />
benchmark representations have not been restated.<br />
The most recent mix of underlying indices as of December 31, 2008 can be found on page 29.<br />
Past performance cannot guarantee future results.<br />
23<br />
Copyright 2009. T. <strong>Rowe</strong> <strong>Price</strong> Investment Services, Inc.<br />
For Institutional Inves<strong>to</strong>r Use Only
Retirement Funds 1 Sources of Value Added – Total Fund<br />
1 The funds’ investment in many underlying funds means that they will be exposed <strong>to</strong> the risks of different areas of the market. Inves<strong>to</strong>rs should note that the higher the fund’s<br />
allocation <strong>to</strong> s<strong>to</strong>cks, the greater the risk.<br />
Value Added: the performance difference between the portfolio and its cus<strong>to</strong>m benchmark.<br />
Structural Effect: the impact of any differences between the portfolio's strategic neutral design and its benchmark, including the use of investment sec<strong>to</strong>rs that are not<br />
represented in the benchmark, and the performance differences between an asset class and the underlying investment sec<strong>to</strong>rs chosen <strong>to</strong> represent it.<br />
Allocation Effect: the aggregate performance impact of differences in the portfolio asset classes & sec<strong>to</strong>r weights relative <strong>to</strong> their blended sec<strong>to</strong>r benchmarks.<br />
Selection Effect: the aggregate impact of the performance difference between the underlying sec<strong>to</strong>r portfolios and their respective sec<strong>to</strong>r indices.<br />
Cash Flow & Rebalancing: the impact of intra-month cash flows and rebalancing transactions.<br />
Performance used in calculations are net of fees.<br />
Numbers may not add <strong>to</strong> 100% due <strong>to</strong> rounding; all numbers are percentages.<br />
Analysis represents the <strong>to</strong>tal fund performance of each fund relative <strong>to</strong> its respective broad weighted benchmark as calculated by T. <strong>Rowe</strong> <strong>Price</strong>’s proprietary attribution<br />
model, and includes all underlying mutual funds.<br />
Figures shown are net of fees.<br />
24 Past performance cannot guarantee future results.<br />
For Institutional Inves<strong>to</strong>r Use Only<br />
Copyright 2009. T. <strong>Rowe</strong> <strong>Price</strong> Investment Services, Inc.
Retirement Funds Major Contribu<strong>to</strong>rs & Detrac<strong>to</strong>rs<br />
Structural Effect and Allocation Effect<br />
One Year Ending December 31, 2008<br />
25<br />
Totals for each effect may not be equivalent <strong>to</strong> underlying component pieces due <strong>to</strong> the exclusion of component effects that can be<br />
considered immaterial in size.<br />
Copyright 2009. T. <strong>Rowe</strong> <strong>Price</strong> Investment Services, Inc.<br />
For Institutional Inves<strong>to</strong>r Use Only
Retirement Funds Major Contribu<strong>to</strong>rs & Detrac<strong>to</strong>rs<br />
Security Selection Effect<br />
One Year Ending December 31, 2008<br />
1 Represents International S<strong>to</strong>ck Fund, International Growth & Income Fund, and Overseas S<strong>to</strong>ck Fund.<br />
Totals for each effect may not be equivalent <strong>to</strong> underlying component pieces due <strong>to</strong> the exclusion of component effects that can<br />
26<br />
be considered immaterial in size.<br />
For Institutional Inves<strong>to</strong>r Use Only<br />
Copyright 2009. T. <strong>Rowe</strong> <strong>Price</strong> Investment Services, Inc.
Retirement Funds Benchmark Allocations<br />
27<br />
Effective May 31, 2008, the broad weighted index for each fund changed <strong>to</strong> include the Russell 3000 Index, MSCI All Country World Ex U.S. Index, the Barclays<br />
Capital U.S. Aggregate Index, and the Citigroup 3-Month Treasury Bill Index. Prior <strong>to</strong> this change, the broad weighted index for each fund was comprised of the<br />
Dow Jones Wilshire 5000 Composite Index, the MSCI EAFE Index, the Barclays Capital U.S. Aggregate Index, and the Citigroup 3-Month Treasury Bill Index. Each<br />
index is weighted at the appropriate strategic neutral allocation of its respective asset class, which is predetermined and changes over time. His<strong>to</strong>rical benchmark<br />
representations have not been restated.<br />
Copyright 2009. T. <strong>Rowe</strong> <strong>Price</strong> Investment Services, Inc.<br />
For Institutional Inves<strong>to</strong>r Use Only
Overview of Monte Carlo Analysis<br />
28<br />
Copyright 2009. T. <strong>Rowe</strong> <strong>Price</strong> Investment Services, Inc.<br />
For Institutional Inves<strong>to</strong>r Use Only
Overview of Monte Carlo Analysis<br />
29<br />
82288 2/09<br />
Copyright 2009. T. <strong>Rowe</strong> <strong>Price</strong> Investment Services, Inc.<br />
For Institutional Inves<strong>to</strong>r Use Only