No. 30 - Glatt
No. 30 - Glatt
No. 30 - Glatt

You also want an ePaper? Increase the reach of your titles
YUMPU automatically turns print PDFs into web optimized ePapers that Google loves.
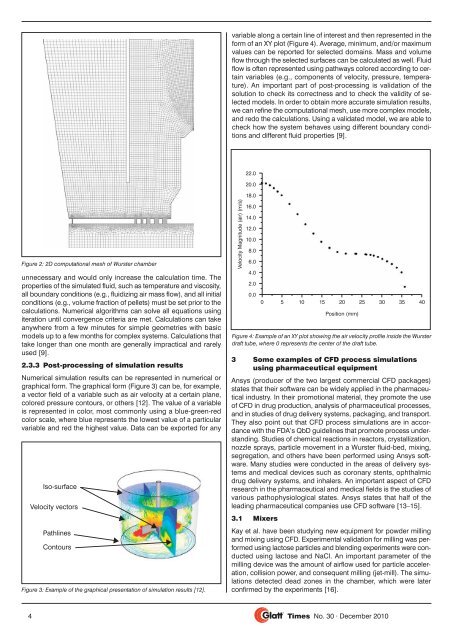
Figure 2: 2D computational mesh of Wurster chamber<br />
unnecessary and would only increase the calculation time. The<br />
properties of the simulated fluid, such as temperature and viscosity,<br />
all boundary conditions (e.g., fluidizing air mass flow), and all initial<br />
conditions (e.g., volume fraction of pellets) must be set prior to the<br />
calculations. Numerical algorithms can solve all equations using<br />
iteration until convergence criteria are met. Calculations can take<br />
anywhere from a few minutes for simple geometries with basic<br />
models up to a few months for complex systems. Calculations that<br />
take longer than one month are generally impractical and rarely<br />
used [9].<br />
2.3.3 Post-processing of simulation results<br />
Numerical simulation results can be represented in numerical or<br />
graphical form. The graphical form (Figure 3) can be, for example,<br />
a vector field of a variable such as air velocity at a certain plane,<br />
colored pressure contours, or others [12]. The value of a variable<br />
is represented in color, most commonly using a blue-green-red<br />
color scale, where blue represents the lowest value of a particular<br />
variable and red the highest value. Data can be exported for any<br />
4<br />
Iso-surface<br />
Velocity vectors<br />
Pathlines<br />
Contours<br />
Figure 3: Example of the graphical presentation of simulation results [12].<br />
variable along a certain line of interest and then represented in the<br />
form of an XY plot (Figure 4). Average, minimum, and/or maximum<br />
values can be reported for selected domains. Mass and volume<br />
flow through the selected surfaces can be calculated as well. Fluid<br />
flow is often represented using pathways colored according to certain<br />
variables (e.g., components of velocity, pressure, temperature).<br />
An important part of post-processing is validation of the<br />
solution to check its correctness and to check the validity of selected<br />
models. In order to obtain more accurate simulation results,<br />
we can refine the computational mesh, use more complex models,<br />
and redo the calculations. Using a validated model, we are able to<br />
check how the system behaves using different boundary conditions<br />
and different fluid properties [9].<br />
Velocity Magnitude (air) (m/s)<br />
22.0<br />
20.0<br />
18.0<br />
16.0<br />
14.0<br />
12.0<br />
10.0<br />
8.0<br />
6.0<br />
4.0<br />
2.0<br />
0.0<br />
0 5 10 15 20<br />
Position (mm)<br />
25 <strong>30</strong> 35 40<br />
Figure 4: Example of an XY plot showing the air velocity profile inside the Wurster<br />
draft tube, where 0 represents the center of the draft tube.<br />
3 Some examples of CFD process simulations<br />
using pharmaceutical equipment<br />
Ansys (producer of the two largest commercial CFD packages)<br />
states that their software can be widely applied in the pharmaceutical<br />
industry. In their promotional material, they promote the use<br />
of CFD in drug production, analysis of pharmaceutical processes,<br />
and in studies of drug delivery systems, packaging, and transport.<br />
They also point out that CFD process simulations are in accordance<br />
with the FDA’s QbD guidelines that promote process understanding.<br />
Studies of chemical reactions in reactors, crystallization,<br />
nozzle sprays, particle movement in a Wurster fluid-bed, mixing,<br />
segregation, and others have been performed using Ansys software.<br />
Many studies were conducted in the areas of delivery systems<br />
and medical devices such as coronary stents, ophthalmic<br />
drug delivery systems, and inhalers. An important aspect of CFD<br />
research in the pharmaceutical and medical fields is the studies of<br />
various pathophysiological states. Ansys states that half of the<br />
leading pharmaceutical companies use CFD software [13–15].<br />
3.1 Mixers<br />
Kay et al. have been studying new equipment for powder milling<br />
and mixing using CFD. Experimental validation for milling was performed<br />
using lactose particles and blending experiments were conducted<br />
using lactose and NaCl. An important parameter of the<br />
milling device was the amount of airflow used for particle acceleration,<br />
collision power, and consequent milling (jet-mill). The simulations<br />
detected dead zones in the chamber, which were later<br />
confirmed by the experiments [16].<br />
Times <strong>No</strong>. <strong>30</strong> · December 2010