


Create successful ePaper yourself
Turn your PDF publications into a flip-book with our unique Google optimized e-Paper software.
SEE TOP<br />
industries<br />
Pharma loses grip on most<br />
profitable industries ranking<br />
by Djordje Daskalovich<br />
The rubber and rubber product<br />
makers in Southeast Europe, represented<br />
by two car tire makers<br />
in the SEE TOP 100 ranking, have<br />
dislodged the pharmaceutical firms<br />
from the top spot in the most profitable<br />
industries ranking for 2014,<br />
recording a return on revenue of<br />
14.19%. The pharmaceutical sector,<br />
which had taken the top honours<br />
for four consecutive years, was dethroned<br />
even through in this year’s<br />
rankings it is represented by one<br />
more company compared to the<br />
2014 edition and has three entrants<br />
– Slovenia’s Krka and Lek and<br />
Croatia’s Pliva.<br />
Furniture, a newcomer in the rankings, took<br />
the no.2 place with 13.83% return on revenue,<br />
leaving last year’s leader in the third spot with<br />
11.71%. Furniture, however, had only one representative<br />
this year, Romaina’s Holzindustrie<br />
Schweighofer, making it impossible to make<br />
any sweeping conclusions about the state of<br />
the sector in the region as a whole. The same,<br />
although to a slightly lesser degree, applies to<br />
the rubber industry, as it only had two entrants,<br />
both coming from Romania - Continental Automotive<br />
Products and Michelin Romania.<br />
Little has changed in the top five spots on<br />
the 2015 SEE industrial ranking since its<br />
previous edition. The petroleum/natural<br />
gas industry kept its comfortable lead with<br />
total revenues rising 0.04% to 40.58 billion<br />
euro. Despite the growth in revenue, the<br />
sector recorded the biggest drop in net<br />
profit - of 716.5 million euro to 262.5 million<br />
euro.<br />
It should come as little surprise that we are<br />
seeing such a comfortable lead of the petroleum<br />
and natural gas industry having in<br />
mind that the companies from this industry<br />
had the biggest presence in the most<br />
dynamic companies ranking as well with 14<br />
entries. This ranking, which makes its debut<br />
this year, comprises the companies with the<br />
biggest change in revenue compared to the<br />
previous year. The oil and gas sector has a<br />
similarly impressive footprint in the SEE TOP<br />
100 companies ranking, where nearly one<br />
third of the companies hail from the sector,<br />
while at the same time holding spots from<br />
no.2 through to no.7.<br />
Electricity ranked second in the SEE industrial<br />
ranking, staying way below the total revenue<br />
of the leading industry at 15.3 billion euro. The<br />
sector’s revenue fell 5.56% from the previous<br />
year while its total net profit dropped to 495.8<br />
million euro from 529.8 million euro.<br />
Wholesale/retail again took the third position,<br />
recording a 7.02% year-on-year rise in<br />
revenue to 14.48 billion euro and a slightly<br />
lower net profit of 251.7 million euro versus<br />
275.4 million euro in the previous year.<br />
The automobiles sector recorded a jump in<br />
total revenue of 7.1% to 8 billion euro, managing<br />
to extend the steady rise in revenue<br />
over the past couple of years. The companies<br />
coming from this industry also returned to<br />
profitability in the 2014 rankings, recording a<br />
net profit of 84.9 million euro after posting<br />
a combined net loss of 30.5 million euro the<br />
previous year. The sector had eight entrants<br />
this year, one more than in the previous ranking.<br />
It should be noted that FCA Srbija was<br />
not included in this year’s ranking as the<br />
company’s financial data was not available<br />
by print time.<br />
The ascendency of the automobiles industry<br />
in SEE is no news if we have in mind that<br />
last year marked a turning point in the EU<br />
when it comes to the registration of new<br />
passenger cars. 2014 was the first in the last<br />
seven years to see growth of registrations<br />
in the EU.<br />
Telecommunication companies are still losing<br />
ground in terms of revenue. The combined<br />
revenue of the seven representatives<br />
of this sector in the SEE industrial ranking fell<br />
2.12% to 5.1 billion euro in 2014, while their<br />
combined net profit plummeted 26.9% to<br />
432.3 million euro with the sector continuing<br />
to face market saturation and new EU regulations.<br />
Still, telecommunications remained<br />
in the fifth spot of the most profitable industries<br />
with 8.45% return on revenue while<br />
also maintaining the same spot in the 2014<br />
SEE industrial ranking.<br />
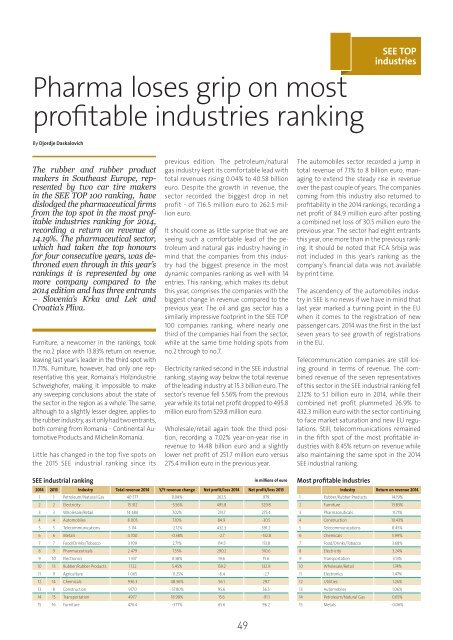
SEE industrial ranking<br />
in millions of euro<br />
2014 2013 Industry Total revenue 2014 Y/Y revenue change Net profit/loss 2014 Net profit/loss 2013<br />
1 1 Petroleum/Natural Gas 40 577 0.04% 262.5 979<br />
2 2 Electricity 15 312 -5.56% 495.8 529.8<br />
3 3 Wholesale/Retail 14 484 7.02% 251.7 275.4<br />
4 4 Automobiles 8 005 7.10% 84.9 -30.5<br />
5 5 Telecommunications 5 114 -2.12% 432.3 591.2<br />
6 6 Metals 4 700 -0.38% -2.7 -132.8<br />
7 7 Food/Drinks/Tobacco 3 109 2.71% 114.5 113.8<br />
8 9 Pharmaceuticals 2 479 7.55% 290.2 310.6<br />
9 10 Electronics 1 337 0.38% 19.6 15.6<br />
10 13 Rubber/Rubber Products 1 122 5.45% 159.2 132.9<br />
11 11 Agriculture 1 065 -11.25% -8.4 -2.7<br />
12 14 Chemicals 936.3 48.36% 56.1 29.7<br />
13 8 Construction 917.0 -57.80% 95.6 56.5<br />
14 15 Transportation 497.7 18.98% 15.6 -91.1<br />
15 16 Furniture 474.4 -3.77% 65.6 96.2<br />
Most profitable industries<br />
Industry Return on revenue 2014<br />
1 Rubber/Rubber Products 14.19%<br />
2 Furniture 13.83%<br />
3 Pharmaceuticals 11.71%<br />
4 Construction 10.43%<br />
5 Telecommunications 8.45%<br />
6 Chemicals 5.99%<br />
7 Food/Drinks/Tobacco 3.68%<br />
8 Electricity 3.24%<br />
9 Transportation 3.13%<br />
10 Wholesale/Retail 1.74%<br />
11 Electronics 1.47%<br />
12 Utilities 1.26%<br />
13 Automobiles 1.06%<br />
14 Petroleum/Natural Gas 0.65%<br />
15 Metals -0.06%<br />
49