

health school
1PfRgAZ
1PfRgAZ

You also want an ePaper? Increase the reach of your titles
YUMPU automatically turns print PDFs into web optimized ePapers that Google loves.
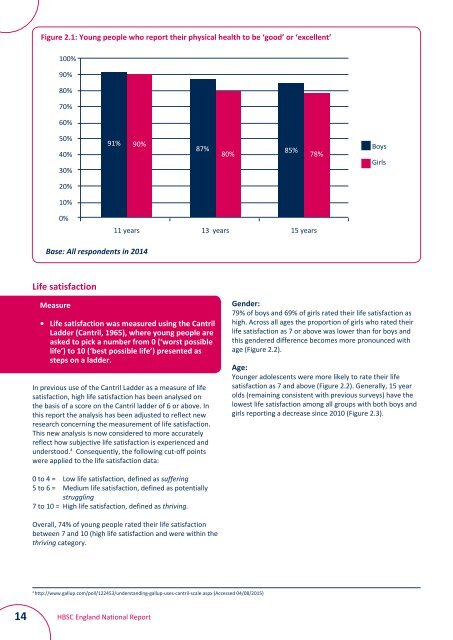
Figure 2.1: Young people who report their physical <strong>health</strong> to be ‘good’ or ‘excellent’<br />
100%<br />
90%<br />
80%<br />
70%<br />
60%<br />
50%<br />
40%<br />
30%<br />
91%<br />
90%<br />
87% 85%<br />
80% 78%<br />
Boys<br />
Girls<br />
20%<br />
10%<br />
0%<br />
11 years<br />
13 years 15 years<br />
Base: All respondents in 2014<br />
Life satisfaction<br />
Measure<br />
• Life satisfaction was measured using the Cantril<br />
Ladder (Cantril, 1965), where young people are<br />
asked to pick a number from 0 (‘worst possible<br />
life’) to 10 (‘best possible life’) presented as<br />
steps on a ladder.<br />
In previous use of the Cantril Ladder as a measure of life<br />
satisfaction, high life satisfaction has been analysed on<br />
the basis of a score on the Cantril ladder of 6 or above. In<br />
this report the analysis has been adjusted to reflect new<br />
research concerning the measurement of life satisfaction.<br />
This new analysis is now considered to more accurately<br />
reflect how subjective life satisfaction is experienced and<br />
understood. 4 Consequently, the following cut-off points<br />
were applied to the life satisfaction data:<br />
Gender:<br />
79% of boys and 69% of girls rated their life satisfaction as<br />
high. Across all ages the proportion of girls who rated their<br />
life satisfaction as 7 or above was lower than for boys and<br />
this gendered difference becomes more pronounced with<br />
age (Figure 2.2).<br />
Age:<br />
Younger adolescents were more likely to rate their life<br />
satisfaction as 7 and above (Figure 2.2). Generally, 15 year<br />
olds (remaining consistent with previous surveys) have the<br />
lowest life satisfaction among all groups with both boys and<br />
girls reporting a decrease since 2010 (Figure 2.3).<br />
0 to 4 = Low life satisfaction, defined as suffering<br />
5 to 6 = Medium life satisfaction, defined as potentially<br />
struggling<br />
7 to 10 = High life satisfaction, defined as thriving.<br />
Overall, 74% of young people rated their life satisfaction<br />
between 7 and 10 (high life satisfaction and were within the<br />
thriving category.<br />
4<br />
http://www.gallup.com/poll/122453/understanding-gallup-uses-cantril-scale.aspx (Accessed 04/08/2015)<br />
14<br />
HBSC England National Report