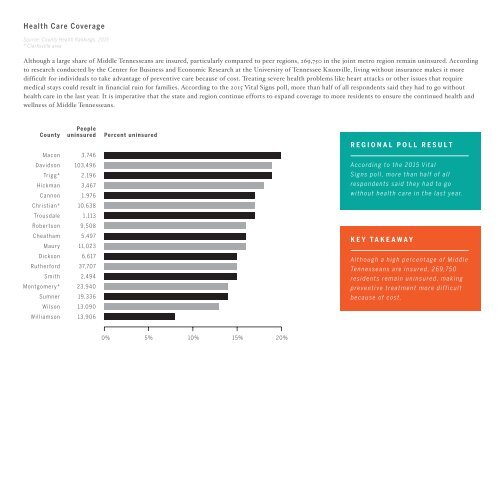
Health Care Coverage Source: County Health Rankings, <strong>2015</strong> * Clarksville area Although a large share of Middle Tennesseans are insured, particularly compared to peer regions, 269,750 in the joint metro region remain uninsured. According to research conducted by the Center for Business and Economic Research at the University of Tennessee Knoxville, living without insurance makes it more difficult for individuals to take advantage of preventive care because of cost. Treating severe health problems like heart attacks or other issues that require medical stays could result in financial ruin for families. According to the <strong>2015</strong> Vital Signs poll, more than half of all respondents said they had to go without health care in the last year. It is imperative that the state and region continue efforts to expand coverage to more residents to ensure the continued health and wellness of Middle Tennesseans. County Macon Davidson Trigg* Hickman Cannon Christian* Trousdale Robertson Cheatham Maury Dickson Rutherford Smith Montgomery* Sumner Wilson Williamson People uninsured 3,746 103,496 2,196 3,467 1 , 976 10,638 1,113 9,508 5,4 97 11,023 6,6 17 37,707 2,494 23,940 19,336 13,090 13,906 Percent uninsured REGIONAL POLL RESULT According to the <strong>2015</strong> Vital Signs poll, more than half of all respondents said they had to go without health care in the last year. KEY TAKEAWAY Although a high percentage of Middle Tennesseans are insured, 269,750 residents remain uninsured, making preventive treatment more difficult because of cost. 0% 5% 10% 15% 20%
Commercially Insured Healthcare Service Utilization by MSA Source: Truven Impatient Services and Outpatient Services Files, 2010-2012 Total Total receiving Receiving Receiving OP services MSA enrollees services inpatient services outpatient services exclusively National 51,994,763 40,082,931 (77.2%) 2,119,545 (4.1%) 40,064,939 (77.1%) 37,963,386 (73.1%) Atlanta 1,357,387 1,063,593 (78.4%) 46,778 (3.4%) 1,063,202 (78.3%) 1,016,815 (74.9%) Austin 4 24,7 1 5 325,927 (76.7%) 15,693 (3.7%) 325,804 (76.7%) 310,234 (73.0%) Charlotte 363,327 293,952 (80.9%) 13,677 (3.8%) 293,867 (80.9%) 280,275 (77.1%) Denver 365,126 278,506 (76.3%) 14,238 (3.9%) 278,409 (76.3%) 264,268 (72.4%) Indianapolis 57 7,4 8 8 448,229 (77.6%) 21,377 (3.7%) 448,041 (77.6%) 426,852 (73.9%) Kansas City 297,153 233,054 (78.4%) 14,902 (5.0%) 232,864 (78.4%) 218,152 (73.4%) Louisville 290,866 227,354 (78.2%) 12,157 (4.2%) 227,250 (78.1%) 215,197 (74.0%) Memphis 197,118 150,830 (76.5%) 8,177 (4.1%) 150,744 (76.5%) 142,653 (72.4%) Nashville MSA 310,832 247,774 (79.7%) 12,832 (4.1%) 247,715 (79.7%) 234,942 (75.6%) Raleigh 168,119 136,714 (81.3%) 5,657 (3.4%) 136,676 (81.3%) 131,057 (78.0%) Tampa 335,277 261,534 (78.0%) 15,441 (4.6%) 261,425 (78.0%) 246,093 (73.4%) Commercially Insured Enrollees with at Least One Doctor Office Visit by Physician Specialty by MSA Source: Commercial Claims Outpatient Services Files, 2012 At least one office Total office Average visits per patient type MSA visit Office visit (%) visits Average visits Primary care Specialty Other National Atlanta Austin Charlotte Denver Indianapolis Kansas City Louisville Memphis Nashville MSA Raleigh Tampa 38,380,381 1,027,483 305,615 286,847 259,589 426,760 221,223 217,884 144,608 241,203 133,084 251,002 73.9% 75.7% 72.0% 79.0% 71.1% 73.9% 74.4% 74.9% 73.4% 7 7.6% 79.2% 74.9% 255,333,985 6, 5 17, 8 9 3 2,065,111 1,884,951 1,597,820 2,506,323 1,321,290 1,443,810 922,399 1,623,752 886,215 1,655,386 6.7 6. 3 6.8 6.6 6. 2 5. 9 6.0 6.6 6.4 6.7 6.7 6.6 2 . 5 2 .7 2 .7 2 .8 2 .4 2 .4 2 .4 2 . 5 2 .7 2.8 2 .7 2 .4 2.1 2.2 2.1 2 .0 1 .7 1 .7 1.3 2.1 2.1 2.1 1 .8 2.1 2 .7 1 . 5 2 . 5 1 .6 2 .0 1 .6 2 .0 1 .6 2 .0 1.9 1 . 9 1.8 In addition to an abundance of physicians and medical facilities in the Nashville region, our residents are more likely to use health services, as measured by inpatient and outpatient experiences, than peers in competitor regions. Data also show that our region’s residents enjoy a cost advantage compared to peer regions and the nation when it comes to accessing medical care, as measured by the average inpatient net payment per stay. However, among drug costs, Nashville-area patients are at a disadvantage. Only residents in Louisville and Tampa pay more. While these data relates to individuals covered by commercial insurance, there are varying levels of coverage for a variety of health care needs, including drugs.