vital_signs_2015_web

You also want an ePaper? Increase the reach of your titles
YUMPU automatically turns print PDFs into web optimized ePapers that Google loves.
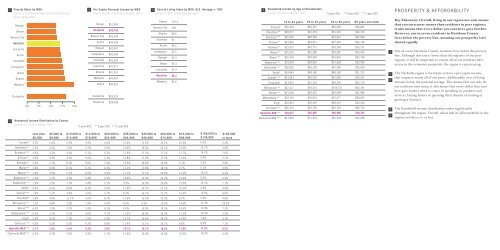
1 Poverty Rates by MSA<br />
Source: U.S. Census Bureau, American Community<br />
Survey (ACS),2013<br />
2 Per Capita Personal Income by MSA<br />
Source: Bureau of Economic Analysis, 2013<br />
3 Cost-of-Living Index by MSA (U.S. Average = 100)<br />
Source: C2ER, 2014 Annual Averages<br />
Denver 107.5<br />
Denver<br />
Raleigh<br />
$51,946<br />
Kansas City 100<br />
Nashville<br />
Denver<br />
$45,759<br />
Atlanta 99.6<br />
Kansas City<br />
Kansas City $45,558<br />
Charlotte 95<br />
Nashville<br />
Austin $44,760<br />
Austin 94.6<br />
Louisville<br />
Raleigh $43,947<br />
Indianpolis 93.5<br />
Austin<br />
Indianpolis $42,542<br />
Raleigh 93.3<br />
Charlotte<br />
Charlotte $41,645<br />
Tampa 92.4<br />
Indianpolis<br />
Louisville $41,477<br />
Louisville 91.9<br />
Tampa<br />
Atlanta $41,307<br />
Nashville 90.2<br />
Atlanta<br />
Memphis $40,987<br />
Memphis 85.6<br />
Memphis<br />
Tampa $40,425<br />
Clarksville<br />
Clarksville $39,591<br />
Tennessee $39,558<br />
0% 5% 10% 15% 20%<br />
4 Household Income Distribution by County<br />
Source: U.S. Census Bureau, 2013<br />
*5 year ACS **3 year ACS ***1 year ACS<br />
5 Household Income by Age of Householder<br />
Source: U.S. Census Bureau, 2013<br />
*5-year ACS **3-year ACS ***1-year ACS<br />
15 to 24 years 25 to 44 years 45 to 64 years 65 years and older<br />
Cannon* $35,250<br />
$49,241<br />
$46,000<br />
$26,861<br />
Cheatham** $28,577<br />
$52,259<br />
$51,281<br />
$46,379<br />
Davidson*** $30,006<br />
$48,558<br />
$51,691<br />
$42,638<br />
Dickson** $29,896<br />
$44,031<br />
$47,344<br />
$36,198<br />
Hickman** $23,972<br />
$43,777<br />
$39,336<br />
$26,731<br />
Macon** $25,216<br />
$42,588<br />
$39,387<br />
$23,543<br />
Maury*** $35,703<br />
$44,083<br />
$55,855<br />
$32,728<br />
Robertson*** $33,078<br />
$60,859<br />
$51,658<br />
$29,996<br />
Rutherford*** $28,526<br />
$66,199<br />
$67,996<br />
$39,629<br />
Smith* $34,044<br />
$48,186<br />
$48,160<br />
$31,313<br />
Sumner*** $31,941<br />
$60,252<br />
$67,928<br />
$39,437<br />
Trousdale* $13,875<br />
$51,125<br />
$48,149<br />
$35,119<br />
Williamson*** $22,117<br />
$95,215<br />
$104,751<br />
$43,181<br />
Wilson*** $21,556<br />
$62,432<br />
$62,098<br />
$41,986<br />
Montgomery*** $32,153<br />
$52,033<br />
$57,477<br />
$38,047<br />
Trigg* $32,833<br />
$54,459<br />
$48,510<br />
$33,340<br />
Christian*** $26,414<br />
$50,726<br />
$44,123<br />
$34,174<br />
Nashville MSA*** $28,627<br />
$56,905<br />
$60,906<br />
$39,235<br />
Clarksville MSA*** $31,655<br />
$51,434<br />
$56,309<br />
$34,668<br />
1<br />
2<br />
3<br />
4<br />
5<br />
PROSPERITY & AFFORDABILITY<br />
Key Takeaway: Overall, living in our region not only means<br />
that you earn more money than residents in peer regions;<br />
it also means that every dollar you earn here goes further.<br />
However, one in seven residents in Davidson County<br />
lives below the poverty line, meaning our prosperity isn’t<br />
shared equally.<br />
One in seven Davidson County residents lives below the poverty<br />
line. Although this rate is lower than the majority of our peer<br />
regions, it will be important to ensure all of our residents have<br />
access to the economic prosperity the region is experiencing.<br />
The Nashville region is fortunate to have a per capita income<br />
that outpaces nearly all of our peers. Additionally, cost of living<br />
remains below the national average. This means that not only do<br />
our residents earn more; it also means that every dollar they earn<br />
here goes further when it comes to spending on products and<br />
services, buying homes or pursuing their dreams of starting or<br />
growing a business.<br />
The household income distribution varies significantly<br />
throughout the region. Overall, about half of all households in the<br />
region earn $50,000 or less.<br />
Less than<br />
$5,000<br />
$5,000 to<br />
$9,999<br />
$10,000 to<br />
$14,999<br />
$15,000 to<br />
$19,999<br />
$20,000 to<br />
$24,999<br />
$25,000 to<br />
$34,999<br />
$35,000 to<br />
$49,999<br />
$50,000 to<br />
$74,999<br />
$75,000 to<br />
$99,999<br />
$100,000 to<br />
$149,999<br />
$150,000<br />
or more<br />
Cannon*<br />
5.3%<br />
6.6%<br />
5.2%<br />
6.9%<br />
6.6%<br />
12.3%<br />
17.4%<br />
20.2%<br />
10.5%<br />
6.6%<br />
2.3%<br />
Cheatham**<br />
3.2%<br />
2.6%<br />
3.2%<br />
5.7%<br />
5.5%<br />
12.5%<br />
16.6%<br />
23.1%<br />
12.0%<br />
11.1%<br />
4.6%<br />
Davidson***<br />
4.0%<br />
3.3%<br />
4.4%<br />
6.1%<br />
6.1%<br />
11.9%<br />
17.1%<br />
17.7%<br />
11.7%<br />
10.7%<br />
7.0%<br />
Dickson**<br />
4.0%<br />
4.9%<br />
4.4%<br />
9.5%<br />
5.1%<br />
12.8%<br />
17.9%<br />
17.3%<br />
11.0%<br />
9.4%<br />
3.7%<br />
Hickman**<br />
3.2%<br />
5.7%<br />
9.2%<br />
9.0%<br />
7.0%<br />
15.5%<br />
18.4%<br />
16.0%<br />
7.1%<br />
5.5%<br />
3.4%<br />
Macon**<br />
2.6%<br />
9.5%<br />
8.1%<br />
6.1%<br />
8.4%<br />
17.2%<br />
17.8%<br />
16.5%<br />
6.7%<br />
6.1%<br />
0.9%<br />
Maury***<br />
1.6%<br />
2.5%<br />
5.1%<br />
6.9%<br />
9.3%<br />
11.1%<br />
17.1%<br />
20.4%<br />
11.5%<br />
10.2%<br />
4.3%<br />
Robertson***<br />
2.1%<br />
2.7%<br />
3.5%<br />
6.4%<br />
6.2%<br />
14.4%<br />
13.9%<br />
23.2%<br />
13.9%<br />
9.5%<br />
4.2%<br />
Rutherford***<br />
1.9%<br />
3.3%<br />
3.7%<br />
4.4%<br />
5.1%<br />
9.2%<br />
16.0%<br />
20.6%<br />
15.5%<br />
13.3%<br />
7.1%<br />
Smith*<br />
4.3%<br />
6.6%<br />
8.4%<br />
6.3%<br />
4.3%<br />
11.4%<br />
15.7%<br />
21.1%<br />
10.2%<br />
6.8%<br />
4.9%<br />
Sumner***<br />
1.6%<br />
2.1%<br />
4.9%<br />
5.0%<br />
5.7%<br />
8.3%<br />
16.7%<br />
21.2%<br />
13.4%<br />
12.6%<br />
8.6%<br />
Trousdale*<br />
2.8%<br />
4.6%<br />
11.1%<br />
3.6%<br />
8.2%<br />
12.6%<br />
15.2%<br />
22.5%<br />
8.2%<br />
6.6%<br />
4.8%<br />
Williamson***<br />
1.1%<br />
0.8%<br />
3.5%<br />
1.9%<br />
4.0%<br />
6.6%<br />
8.6%<br />
15.9%<br />
14.6%<br />
17.3%<br />
25.9%<br />
Wilson***<br />
4.2%<br />
1.2%<br />
3.7%<br />
5.3%<br />
6.1%<br />
8.4%<br />
15.9%<br />
19.5%<br />
16.6%<br />
11.8%<br />
7.3%<br />
Montgomery***<br />
4.5%<br />
3.7%<br />
4.3%<br />
4.0%<br />
4.7%<br />
11.5%<br />
16.0%<br />
26.0%<br />
11.5%<br />
10.3%<br />
3.5%<br />
Trigg*<br />
2.6%<br />
4.5%<br />
7.3%<br />
7.5%<br />
5.0%<br />
12.2%<br />
15.4%<br />
20.2%<br />
14.9%<br />
7.4%<br />
3.1%<br />
Christian***<br />
4.2%<br />
6.2%<br />
5.3%<br />
4.7%<br />
6.8%<br />
11.0%<br />
17.1%<br />
20.1%<br />
8.6%<br />
8.9%<br />
7.1%<br />
Nashville MSA***<br />
3.1%<br />
2.8%<br />
4.4%<br />
5.3%<br />
5.8%<br />
10.7%<br />
15.7%<br />
18.9%<br />
12.9%<br />
11.8%<br />
8.5%<br />
Clarksville MSA***<br />
4.2%<br />
4.7%<br />
5.0%<br />
4.2%<br />
5.1%<br />
11.4%<br />
16.0%<br />
24.0%<br />
10.5%<br />
10.2%<br />
4.5%