vital_signs_2015_web

You also want an ePaper? Increase the reach of your titles
YUMPU automatically turns print PDFs into web optimized ePapers that Google loves.
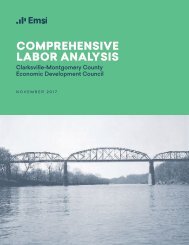
1 Housing Affordability Index Rank Out of 176 MSAs<br />
2<br />
Source: National Association of Realtors, 2014<br />
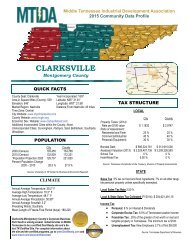
Fair Market Rent<br />
U.S. Census, American Community Survey (ACS) U.S.<br />
Department of Housing and Urban Development, <strong>2015</strong><br />
4<br />
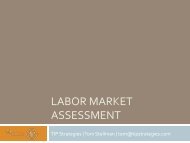
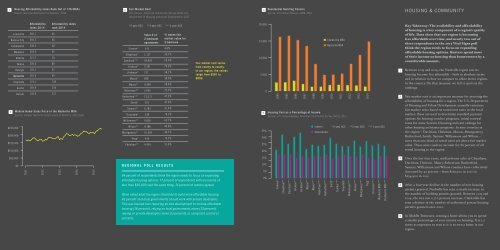
Residential Building Permits<br />
Source: U.S Census Bureau, 2004-2014<br />
HOUSING & COMMUNITY<br />
3<br />
Louisville<br />
Kansas City<br />
Indianpolis<br />
$250,000<br />
$200,000<br />
$150,000<br />
$100,000<br />
Memphis<br />
Atlanta<br />
Tampa<br />
Raleigh<br />
Nashville<br />
Charlotte<br />
Austin<br />
Denver<br />
Affordability<br />
index 2014<br />
246.1<br />
240.3<br />
238.5<br />
224.3<br />
221.7<br />
205.6<br />
193.1<br />
191.4<br />
174.1<br />
169.9<br />
135.9<br />
Affordability index<br />
rank 2014<br />
Median Home Sales Price in the Nashville MSA<br />
Source: Greater Nashville Asssociation of Realtors, 2011-<strong>2015</strong><br />
42<br />
46<br />
48<br />
62<br />
70<br />
80<br />
97<br />
99<br />
128<br />
134<br />
157<br />
*5-year ACS **3-year ACS ***1-year ACS<br />
Cannon*<br />
Cheatham*<br />
Davidson***<br />
Dickson*<br />
Hickman*<br />
Macon*<br />
Maury**<br />
Robertson**<br />
Rutherford***<br />
Smith*<br />
Sumner**<br />
Trousdale*<br />
Williamson**<br />
Wilson**<br />
Montgomery**<br />
Trigg*<br />
Christian**<br />
Total # of<br />
2-bedroom<br />
apartments<br />
511<br />
1,127<br />
54,602<br />
2,201<br />
717<br />
838<br />
4,499<br />
2,045<br />
13,171<br />
931<br />
6,783<br />
330<br />
4,838<br />
4,188<br />
10,309<br />
415<br />
4,434<br />
% above fair<br />
market value for<br />
2-bedroom<br />
4.6%<br />
32.7%<br />
53.0%<br />
24.6%<br />
36.1%<br />
38.0%<br />
28.8%<br />
22.9%<br />
47.9%<br />
47.6%<br />
41.4%<br />
19.1%<br />
62.7%<br />
45.8%<br />
44.7%<br />
19.5%<br />
31.6%<br />
Fair market rent varies<br />
from county to county.<br />
In our region, the values<br />
range from $581 to<br />
$850.<br />
20,000<br />
15,000<br />
Clarksville MSA<br />
Nashville MSA<br />
10,000<br />
5,000<br />
0<br />
2004<br />
2005<br />
2006<br />
2007<br />
2008<br />
2009<br />
2010<br />
2011<br />
2012<br />
2013<br />
2014<br />
5 Housing Cost as a Percentage of Income<br />
Source: U.S. Census Bureau, American Community Survey (ACS), 2013<br />
renters *5-year ACS **3-year ACS ***1-year ACS<br />
35%<br />
homeowners<br />
30%<br />
25%<br />
20%<br />
1<br />
2<br />
Key Takeaway: The availability and affordability<br />
of housing is a key component of a region’s quality<br />
of life. Data show that our region is becoming<br />
less affordable over time, and nearly two out of<br />
three respondents to the <strong>2015</strong> Vital Signs poll<br />
think the region needs to focus on expanding<br />
affordable housing options. Renters spend more<br />
of their income on housing than homeowners by a<br />
considerable amount.<br />
Between 2013 and 2014, the Nashville region saw its<br />
housing become less affordable – both in absolute terms<br />
and in relation to how we compare to other metro regions<br />
in the country. On that measure, we fell 12 spots in the<br />
rankings.<br />
Fair market rent is an important measure for assessing the<br />
affordability of housing for a region. The U.S. Department<br />
of Housing and Urban Development annually estimates<br />
fair market rents based on rental unit rates in the local<br />
market; these are used to determine standard payment<br />
options for housing voucher programs, initial renewal<br />
rents for some Section 8 housing and rent ceilings for<br />
other housing assistance programs. In nine counties in<br />
the region – Davidson, Hickman, Macon, Montgomery,<br />
Rutherford, Smith, Sumner, Williamson and Wilson –<br />
more than one-third of rental units are above fair market<br />
value. These nine counties account for 86 percent of all<br />
rental housing in the region.<br />
$50,000<br />
$0<br />
2011<br />
2012<br />
2013<br />
2014<br />
<strong>2015</strong><br />
REGIONAL POLL RESULTS<br />
64 percent of respondents think the region needs to focus on expanding<br />
affordable housing options. 77 percent of respondents with an income of<br />
less than $50,000 said the same thing. 74 percent of renters agreed.<br />
When asked what the region should do to build more affordable housing,<br />
49 percent said local governments should work with private developers.<br />
This was favored over requiring all new development to include affordable<br />
housing (18 percent), relying on local governments alone (13 percent),<br />
relying on private developers alone (11 percent), or using rent control (1<br />
percent).<br />
15%<br />
10%<br />
5%<br />
0%<br />
Cannon*<br />
Cheatham**<br />
Davidson***<br />
Dickson**<br />
Hickman**<br />
Macon**<br />
Maury***<br />
Robertson***<br />
Rutherford***<br />
Smith*<br />
Sumner***<br />
Trousdale*<br />
Williamson***<br />
Wilson***<br />
Montgomery***<br />
Trigg*<br />
Christian***<br />
Nashville MSA***<br />
Clarksville MSA***<br />
3<br />
4<br />
5<br />
Over the last four years, median home sales in Cheatham,<br />
Davidson, Dickson, Maury, Robertson, Rutherford,<br />
Sumner, Williamson and Wilson counties have collectively<br />
increased by 42 percent – from $165,500 in 2011 to<br />
$234,900 in <strong>2015</strong>.<br />
After a four-year decline in the number of new housing<br />
permits granted, Nashville has seen a steady increase in<br />
the number of building permits granted. Between 2013 and<br />
2014, the city saw a 37.2 percent increase. Clarksville has<br />
seen a decline in the number of authorized private housing<br />
permits granted since 2012.<br />
In Middle Tennessee, owning a home allows you to spend<br />
a smaller percentage of your income on housing. It is 1.5<br />
times as expensive to rent as it is to own a home in our<br />
region.