Consultar el Programa Maestro de Desarrollo Portuario 2011-2016
Consultar el Programa Maestro de Desarrollo Portuario 2011-2016
Consultar el Programa Maestro de Desarrollo Portuario 2011-2016

You also want an ePaper? Increase the reach of your titles
YUMPU automatically turns print PDFs into web optimized ePapers that Google loves.
PROGRAMA MAESTRO DE DESARROLLO PORTUARIO<br />
DEL PUERTO DE SALINA CRUZ <strong>2011</strong>-<strong>2016</strong><br />
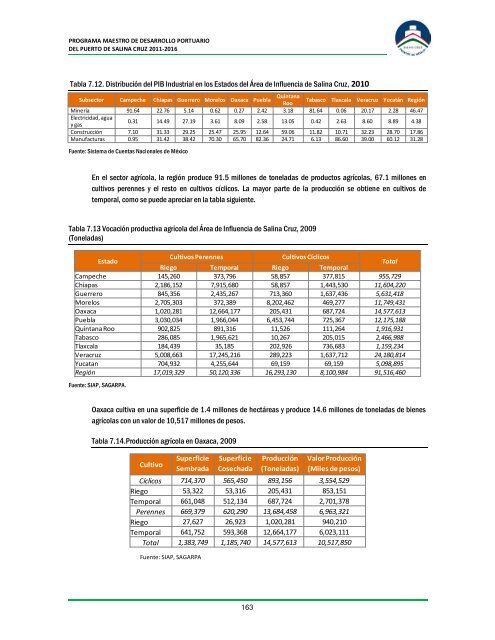
Tabla 7.12. Distribución d<strong>el</strong> PIB Industrial en los Estados d<strong>el</strong> Área <strong>de</strong> Influencia <strong>de</strong> Salina Cruz, 2010<br />
Subsector Campeche Chiapas Guerrero Mor<strong>el</strong>os Oaxaca Puebla<br />
Quintana<br />
Roo<br />
Tabasco Tlaxcala Veracruz Yucatán Región<br />
Minería 91.64 22.76 5.14 0.62 0.27 2.42 3.18 81.64 0.06 20.17 2.28 46.47<br />
Electricidad, agua<br />
y gas<br />
0.31 14.49 27.19 3.61 8.09 2.58 13.05 0.42 2.63 8.60 8.89 4.38<br />
Construcción 7.10 31.33 29.25 25.47 25.95 12.64 59.06 11.82 10.71 32.23 28.70 17.86<br />
Manufacturas 0.95 31.42 38.42 70.30 65.70 82.36 24.71 6.13 86.60 39.00 60.12 31.28<br />
Fuente: Sistema <strong>de</strong> Cuentas Nacionales <strong>de</strong> México<br />
En <strong>el</strong> sector agrícola, la región produce 91.5 millones <strong>de</strong> ton<strong>el</strong>adas <strong>de</strong> productos agrícolas, 67.1 millones en<br />
cultivos perennes y <strong>el</strong> resto en cultivos cíclicos. La mayor parte <strong>de</strong> la producción se obtiene en cultivos <strong>de</strong><br />
temporal, como se pue<strong>de</strong> apreciar en la tabla siguiente.<br />
Tabla 7.13 Vocación productiva agrícola d<strong>el</strong> Área <strong>de</strong> Influencia <strong>de</strong> Salina Cruz, 2009<br />
(Ton<strong>el</strong>adas)<br />
Estado<br />
Cultivos Perennes<br />
Cultivos Cíclicos<br />
Riego Temporal Riego Temporal<br />
Total<br />
Campeche 145,260 373,796 58,857 377,815 955,729<br />
Chiapas 2,186,152 7,915,680 58,857 1,443,530 11,604,220<br />
Guerrero 845,356 2,435,267 713,360 1,637,436 5,631,418<br />
Mor<strong>el</strong>os 2,705,303 372,389 8,202,462 469,277 11,749,431<br />
Oaxaca 1,020,281 12,664,177 205,431 687,724 14,577,613<br />
Puebla 3,030,034 1,966,044 6,453,744 725,367 12,175,188<br />
Quintana Roo 902,825 891,316 11,526 111,264 1,916,931<br />
Tabasco 286,085 1,965,621 10,267 205,015 2,466,988<br />
Tlaxcala 184,439 35,185 202,926 736,683 1,159,234<br />
Veracruz 5,008,663 17,245,216 289,223 1,637,712 24,180,814<br />
Yucatan 704,932 4,255,644 69,159 69,159 5,098,895<br />
Región 17,019,329 50,120,336 16,293,130 8,100,984 91,516,460<br />
Fuente: SIAP, SAGARPA.<br />
Oaxaca cultiva en una superficie <strong>de</strong> 1.4 millones <strong>de</strong> hectáreas y produce 14.6 millones <strong>de</strong> ton<strong>el</strong>adas <strong>de</strong> bienes<br />
agrícolas con un valor <strong>de</strong> 10,517 millones <strong>de</strong> pesos.<br />
Tabla 7.14.Producción agrícola en Oaxaca, 2009<br />
Cultivo<br />
Superficie<br />
Sembrada<br />
Fuente: SIAP, SAGARPA<br />
Superficie<br />
Cosechada<br />
Producción<br />
(Ton<strong>el</strong>adas)<br />
Valor Producción<br />
(Miles <strong>de</strong> pesos)<br />
Cíclicos 714,370 565,450 893,156 3,554,529<br />
Riego 53,322 53,316 205,431 853,151<br />
Temporal 661,048 512,134 687,724 2,701,378<br />
Perennes 669,379 620,290 13,684,458 6,963,321<br />
Riego 27,627 26,923 1,020,281 940,210<br />
Temporal 641,752 593,368 12,664,177 6,023,111<br />
Total 1,383,749 1,185,740 14,577,613 10,517,850<br />
163