Isotope ratio mass spectrometry - Ohio University
Isotope ratio mass spectrometry - Ohio University
Isotope ratio mass spectrometry - Ohio University

You also want an ePaper? Increase the reach of your titles
YUMPU automatically turns print PDFs into web optimized ePapers that Google loves.
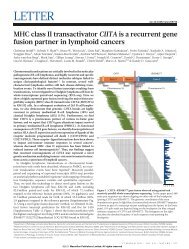
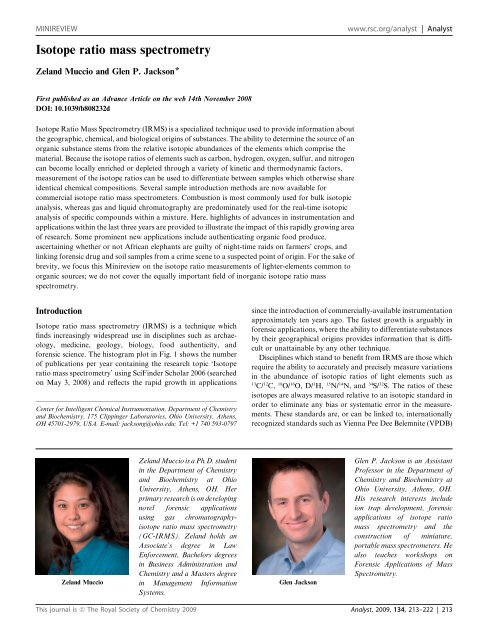
MINIREVIEW www.rsc.org/analyst | Analyst<br />
<strong>Isotope</strong> <strong>ratio</strong> <strong>mass</strong> <strong>spectrometry</strong><br />
Zeland Muccio and Glen P. Jackson*<br />
First published as an Advance Article on the web 14th November 2008<br />
DOI: 10.1039/b808232d<br />
<strong>Isotope</strong> Ratio Mass Spectrometry (IRMS) is a specialized technique used to provide information about<br />
the geographic, chemical, and biological origins of substances. The ability to determine the source of an<br />
organic substance stems from the relative isotopic abundances of the elements which comprise the<br />
material. Because the isotope <strong>ratio</strong>s of elements such as carbon, hydrogen, oxygen, sulfur, and nitrogen<br />
can become locally enriched or depleted through a variety of kinetic and thermodynamic factors,<br />
measurement of the isotope <strong>ratio</strong>s can be used to differentiate between samples which otherwise share<br />
identical chemical compositions. Several sample introduction methods are now available for<br />
commercial isotope <strong>ratio</strong> <strong>mass</strong> spectrometers. Combustion is most commonly used for bulk isotopic<br />
analysis, whereas gas and liquid chromatography are predominately used for the real-time isotopic<br />
analysis of specific compounds within a mixture. Here, highlights of advances in instrumentation and<br />
applications within the last three years are provided to illustrate the impact of this rapidly growing area<br />
of research. Some prominent new applications include authenticating organic food produce,<br />
ascertaining whether or not African elephants are guilty of night-time raids on farmers’ crops, and<br />
linking forensic drug and soil samples from a crime scene to a suspected point of origin. For the sake of<br />
brevity, we focus this Minireview on the isotope <strong>ratio</strong> measurements of lighter-elements common to<br />
organic sources; we do not cover the equally important field of inorganic isotope <strong>ratio</strong> <strong>mass</strong><br />
<strong>spectrometry</strong>.<br />
Introduction<br />
<strong>Isotope</strong> <strong>ratio</strong> <strong>mass</strong> <strong>spectrometry</strong> (IRMS) is a technique which<br />
finds increasingly widespread use in disciplines such as archaeology,<br />
medicine, geology, biology, food authenticity, and<br />
forensic science. The histogram plot in Fig. 1 shows the number<br />
of publications per year containing the research topic ‘<strong>Isotope</strong><br />
<strong>ratio</strong> <strong>mass</strong> <strong>spectrometry</strong>’ using SciFinder Scholar 2006 (searched<br />
on May 3, 2008) and reflects the rapid growth in applications<br />
Center for Intelligent Chemical Instrumentation, Department of Chemistry<br />
and Biochemistry, 175 Clippinger Laboratories, <strong>Ohio</strong> <strong>University</strong>, Athens,<br />
OH 45701-2979, USA. E-mail: jacksong@ohio.edu; Tel: +1 740 593-0797<br />
Zeland Muccio<br />
Zeland Muccio is a Ph.D. student<br />
in the Department of Chemistry<br />
and Biochemistry at <strong>Ohio</strong><br />
<strong>University</strong>, Athens, OH. Her<br />
primary research is on developing<br />
novel forensic applications<br />
using gas chromatographyisotope<br />
<strong>ratio</strong> <strong>mass</strong> <strong>spectrometry</strong><br />
(GC-IRMS). Zeland holds an<br />
Associate’s degree in Law<br />
Enforcement, Bachelors degrees<br />
in Business Administ<strong>ratio</strong>n and<br />
Chemistry and a Masters degree<br />
in Management Information<br />
Systems.<br />
since the introduction of commercially-available instrumentation<br />
approximately ten years ago. The fastest growth is arguably in<br />
forensic applications, where the ability to differentiate substances<br />
by their geographical origins provides information that is difficult<br />
or unattainable by any other technique.<br />
Disciplines which stand to benefit from IRMS are those which<br />
require the ability to accurately and precisely measure variations<br />
in the abundance of isotopic <strong>ratio</strong>s of light elements such as<br />
13 C/ 12 C, 18 O/ 16 O, D/ 1 H, 15 N/ 14 N, and 34 S/ 32 S. The <strong>ratio</strong>s of these<br />
isotopes are always measured relative to an isotopic standard in<br />
order to eliminate any bias or systematic error in the measurements.<br />
These standards are, or can be linked to, internationally<br />
recognized standards such as Vienna Pee Dee Belemnite (VPDB)<br />
Glen Jackson<br />
Glen P. Jackson is an Assistant<br />
Professor in the Department of<br />
Chemistry and Biochemistry at<br />
<strong>Ohio</strong> <strong>University</strong>, Athens, OH.<br />
His research interests include<br />
ion trap development, forensic<br />
applications of isotope <strong>ratio</strong><br />
<strong>mass</strong> <strong>spectrometry</strong> and the<br />
construction of miniature,<br />
portable <strong>mass</strong> spectrometers. He<br />
also teaches workshops on<br />
Forensic Applications of Mass<br />
Spectrometry.<br />
This journal is ª The Royal Society of Chemistry 2009 Analyst, 2009, 134, 213–222 | 213
Fig. 1 Histogram showing the number of publications per year containing the research topic ‘<strong>Isotope</strong> <strong>ratio</strong> <strong>mass</strong> <strong>spectrometry</strong>’. The total number of<br />
hits for research topic, as entered, was 2050. Search performed using SciFinder Scholar 2006 on May 3, 2008.<br />
for carbon, Vienna Canyon Diablo Troilite meteorite (V-CDT)<br />
for sulfur, Vienna Standard Mean Ocean Water (VSMOW) for<br />
oxygen and hydrogen, and laboratory air for nitrogen. 1 As<br />
primary standards can become environmentally depleted,<br />
secondary standards must sometimes be used in their place.<br />
Several of these secondary standards are discussed in detail by<br />
Valkiers et al. 2,3 The International Atomic Energy Agency<br />
(IAEA; Vienna, Austria) and the National Institute of Standards<br />
and Technology (NIST; Washington, DC, USA) both supply<br />
a range of natural abundance standards. 4 <strong>Isotope</strong> <strong>ratio</strong>s of<br />
samples of interest are measured relative to universal standards<br />
and are reported in the delta notation, d:<br />
d ¼ 1000(R sample R standard)/R standard (1)<br />
The value R sample is the abundance <strong>ratio</strong> of the minor, heavier<br />
isotope of the element to the major, lighter isotope (e.g. 13 C/ 12 C).<br />
Samples which establish the R standard values are usually selected<br />
because they represent a stable material which is highly enriched<br />
in the heavy (minor) isotopes. Most analyzed substances are<br />
depleted in the heavy-isotope relative to the standard and will<br />
therefore have negative delta values. Guidelines for the selection<br />
of working standards and a review of strategies to institute<br />
universal isotopic referencing procedures have been reported by<br />
Werner and Brand. 5<br />
Commonly used <strong>mass</strong> spectrometers such as single quadrupoles,<br />
ion traps, and time-of-flight <strong>mass</strong> spectrometers typically do not<br />
provide the sensitivity or precision required to detect the subtle<br />
differences in naturally-occurring isotopic abundances. It should be<br />
noted that these instruments can be useful when used with isotope<br />
dilution 6 – a technique in which the heavier isotopes are deliberately<br />
enriched well beyond their natural levels. However, the measurement<br />
of natural isotopic abundances requires a specialized instrument<br />
such as a multi-collector magnetic sector <strong>mass</strong> spectrometer,<br />
also known as an isotope <strong>ratio</strong> <strong>mass</strong> spectrometer (IRMS).<br />
Several authors have investigated the precision and accuracy<br />
of IRMS. Continuous flow IRMS instruments have shown<br />
precisions of 0.1&, with the lowest reported detection limits for<br />
monoaromatic compounds between 0.07 and 0.35 mg L 1 . 7 In<br />
general, detection limits vary according to the analyte: for<br />
example, halogenated hydrocarbons are reported between 0.76<br />
and 27 mg L 1 , 7 which is significantly higher than the limits seen<br />
for monoaromatics. Although the analyte is also the most<br />
important variable in instrumental performance, certain benchmarks<br />
in accuracy and precision can be reasonably anticipated.<br />
Wong et al. 8 tested three commercially-available GC-IRMS<br />
instruments to determine differences in precision and accuracy.<br />
The average precision was 0.12& with reproducibility of 1.48&<br />
and accuracy of 1.11 2.16%. Additional experimental variables<br />
such as the stability of the ion current, 7 dead time, bit board<br />
size dependencies, 9 and even the possibilities of sample vial<br />
influences 10 can all effect precision and accuracy on individual<br />
instruments.<br />
Another technique which can be used for isotope <strong>ratio</strong><br />
measurements is known as multiple collector inductively coupled<br />
plasma <strong>mass</strong> <strong>spectrometry</strong> (MC-ICP-MS). MC-ICP-MS is<br />
a technique which has undergone extensive research to enhance<br />
the accuracy and precision of stable isotopic measurement. 11–13<br />
Clough et al. 14 have demonstrated that MC-ICP-MS can be used<br />
as a high-throughput tool for the d 34 S measurements of bulk<br />
aqueous and solid samples, using Si as an internal standard for<br />
correction of instrumental <strong>mass</strong> bias effects in both pure solutions<br />
and in samples with high matrix content. This technique is<br />
limited, by plasma instabilities and the performance of data<br />
acquisition in sequential mode, to the identification of large<br />
variations in isotopic abundances.<br />
There are five main sections of an IRMS instrument: a sample<br />
introduction system, an electron ionization source, a magnetic<br />
sector analyzer, a Faraday-collector detector array, and<br />
a computer-controlled data acquisition system. Several different<br />
interfaces are used to introduce samples into the IRMS, the two<br />
most common being elemental analyzers (EA-IRMS) and gas<br />
chromatographs (GC-IRMS). Fig. 2 demonstrates how each of<br />
these sample introduction systems can be coupled to the same<br />
<strong>mass</strong> spectrometer. Although liquid chromatographs (LC-<br />
IRMS) have recently gained interest for some applications, there<br />
are only a limited number of publications that have shown this<br />
technique to be successful. Here, we examine the present state of<br />
research involving IRMS and explore some of the most interesting<br />
and unusual applications.<br />
EA-IRMS<br />
EA-IRMS is a bulk measurement technique which provides<br />
representative data for the average isotopic signal of the entire<br />
sample. Without significant sample prepa<strong>ratio</strong>n, this method<br />
214 | Analyst, 2009, 134, 213–222 This journal is ª The Royal Society of Chemistry 2009
Fig. 2 Schematics to show how the three most common sample introduction systems/interfaces for carbon isotope measurements (as CO 2) and an<br />
isotope <strong>ratio</strong> <strong>mass</strong> spectrometer. LC ¼ liquid chromatography, EA ¼ elemental analyzer, GC ¼ gas chromatography.<br />
cannot divulge how each constituent of the sample contributes to<br />
the total average value. In order to measure the average isotope<br />
<strong>ratio</strong>s for non-volatile liquids or solids, the bulk sample can<br />
simply be weighed and placed in a tin or silver capsule. The<br />
sample capsule is lowered into a combustion furnace through an<br />
autosampler carousel, at which time the sample is combusted at<br />
elevated temperatures under a flow of oxygen into NOx, CO2,<br />
SO 2, or H 2O. Depending on the isotopes of interest, the<br />
combustion products may need to be specifically treated to<br />
reduce interferences. In carbon isotope <strong>ratio</strong> analysis – by far the<br />
most common application – the combusted sample is carried by<br />
a helium gas stream into a reduction chamber where nitrous<br />
oxides are converted into N2 and excess O2 is removed. The<br />
analyte is next carried through a chemical trap to remove water<br />
that was produced from combustion, and then into the gas<br />
chromatograph where sepa<strong>ratio</strong>n of CO2 and N2 is performed.<br />
Effluent from the elemental analyzer is then sent to the IRMS.<br />
Because the isotope <strong>ratio</strong>s for questioned samples are reported<br />
relative to a reference gas standard, best results are obtained<br />
when the signal intensities for the two samples are of similar<br />
magnitude and are analyzed as closely together in time as<br />
possible. The flow of each reference gas is regulated using<br />
a dedicated sample introduction interface system which toggles<br />
quickly between the reference gas and the sample using pneumatic<br />
actuators.<br />
GC-IRMS<br />
By performing a sepa<strong>ratio</strong>n prior to isotope <strong>ratio</strong> analysis,<br />
hyphenated techniques such as GC-IRMS and LC-IRMS can<br />
provide isotopic analysis of a complex mixture, thereby<br />
providing additional information and higher discriminatory<br />
power. IRMS instruments require a somewhat steady stream of<br />
a fixed gas (such as CO 2) for precise analysis. The sample first<br />
elutes from the GC column into an oxidation chamber, usually<br />
housed on the side of the GC oven. The oxidation chamber is<br />
normally a non-porous alumina tube that contains three separate<br />
twisted wires made of copper, nickel, and platinum. The samples<br />
are combusted at elevated temperatures into a combination of<br />
gases such as CO2, NOx, and H2O. For d 13 C measurements, the<br />
combusted sample is then carried into a reduction chamber<br />
where nitrous oxides are converted into N2 and any excess O2 is<br />
removed. Since CO2, NOx, and H2O will not condense at room<br />
temperature, the transfer line from the oxidation chamber to the<br />
reduction chamber does not need to be heated. The reduction<br />
chamber and subsequent valves, splitters, and pneumatic actuators,<br />
etc., are contained in a stand-alone interface system. To<br />
avoid H2O from protonating CO2 in the MS source – and causing<br />
deleterious isobaric interference of 12 CO2H + with the 13 CO2 + peak<br />
at m/z 45 – the analyte stream is passed through a semipermeable<br />
membrane such as NafionÔ. Here, a dry helium<br />
This journal is ª The Royal Society of Chemistry 2009 Analyst, 2009, 134, 213–222 | 215
counter-flow is used to remove the H 2O. The flow rate of the<br />
subsequent sample stream is carefully controlled to provide<br />
a stable flow rate to the IRMS ion source of approximately 0.5<br />
mL min 1 . Deactivated fused silica capillaries are used<br />
throughout the interface systems to restrict the analyte flow to<br />
the required flow rates. The interface system also uses electronically-controlled<br />
pneumatic actuators to toggle the flow of the<br />
effluent stream between that of the analyte and that of a reference<br />
gas, such as a cylinder of CO2.<br />
LC-IRMS<br />
LC-IRMS applications are typically dedicated to carbon isotope<br />
<strong>ratio</strong> analyses. When the solution elutes from a high pressure<br />
liquid chromatograph (HPLC) column, the solution is directly<br />
injected onto or into one of two interfaces. These two interfaces<br />
are (1) a moving wire interface, 15 and (2) a wet-chemical oxidation<br />
interface. 16,17 The wet-chemical oxidation interface is<br />
currently being offered as a commercial instrument by Thermo<br />
(LC IsoLink) and shows somewhat more promise 18–21 than the<br />
moving wire interface, which only has one prototype. The wetchemical<br />
oxidation method converts organic compounds present<br />
in the effluent of the HPLC column into CO2 gas directly in the<br />
mobile phase. To reduce interferences, the HPLC mobile phase<br />
must be void of any organic or oxidizable components that could<br />
interfere with the results. It should be noted that because most<br />
HPLC sepa<strong>ratio</strong>ns are greatly enhanced with organic solvents or<br />
modifiers, this requirement poses significant restrictions on the<br />
potential application of LC-IRMS. The effluent from the HPLC<br />
column is then mixed with a stream of an oxidizing agent such as<br />
ammonium peroxodisulfate, and a catalyst such as phosphoric<br />
acid and silver nitrate. 17 The mobile phase and the combined<br />
reagents pass through a capillary oxidation reactor where the<br />
organic compounds are converted into CO2. A membrane<br />
exchanger separates CO 2 gases from the other gases (water<br />
vapor, oxygen, argon, etc.) that originate from the liquid phase.<br />
The CO 2 is then transferred through a gas-permeable<br />
membrane 22 into a counter-flow of helium. The CO 2 in the<br />
helium stream is then dried in an online gas drying semipermeable<br />
membrane (NafionÔ) and admitted to the isotope<br />
<strong>ratio</strong> <strong>mass</strong> spectrometer via an open split. The wet-chemical<br />
oxidation interface allows for the 13 C/ 12 C determination of<br />
organic compounds with a completely automated online high<br />
precision method.<br />
Origins of variations in isotopic abundances<br />
Although the average isotope <strong>ratio</strong> of each terrestrial element<br />
was fixed around the time of the earth’s formation, localized<br />
variations occur based on selective enrichment/depletion of the<br />
heavier isotopes relative to the average values. For example, even<br />
though all plants use atmospheric or dissolved CO2 as a source of<br />
carbon, various factors can influence a plant’s ability to enrich or<br />
deplete 13 C from these common sources in a process known as<br />
fractionation. One such fractionation factor is genetic. Monocotyledonous<br />
plants (C 4 plants), such as sugar cane, corn,<br />
tropical grasses, desert plants and marine plants, utilize the<br />
Hatch–Slack photosynthetic cycle. 21 These plants typically have<br />
d 13 C values varying from 8 to 20&. 23 Most dicotyledons<br />
plants (C 3 plants), such as flowering plants, wheat, rice, rye and<br />
cotton employ the Calvin–Benson photosynthetic cycle and have<br />
d 13 C values varying from 22 to 35&. 23 Crassulacean acid<br />
metabolism (CAM) plants, such as pineapple, cactus, and<br />
orchids, can utilize either the C3 or C4 metabolic systems,<br />
depending on sunlight, and therefore have d 13 C values ranging<br />
between 10 and 34&. 23 Because animals can only incorporate<br />
carbon through the ingestion of plant or animal matter, the<br />
carbon isotope <strong>ratio</strong>s in an animal will reflect the isotope <strong>ratio</strong>s of<br />
the food source; i.e. ‘you are what you eat’. This fact can be used<br />
to great advantage, as shown in Fig. 3. For example, human<br />
European diets are richer in C 3 plants (wheat, barley, and rye),<br />
whereas human North American diets are richer in C 4 plants<br />
(corn, sugar cane and millet). Therefore, a person living in North<br />
America will have body matter with isotope <strong>ratio</strong>s more similar<br />
to C4 plants and will have lower 13 C levels (i.e. less negative<br />
d values) relative to Europeans.<br />
In addition to genetic factors, environmental factors such as<br />
temperature, rainfall, and hours of sunlight also influence fractionation.<br />
These factors can influence kinetic processes such as<br />
the diffusion of CO2 through the stomata in plant leaves. Clear<br />
evidence for environmental sensitivity to fractionation was presented<br />
by Ehleringer et al. in 2000, wherein they demonstrated<br />
the ability to determine the local geographic farming regions in<br />
South America from which different cocaine plants were<br />
obtained. 24<br />
Fractionation also occurs in common elements such as sulfur,<br />
hydrogen, oxygen and nitrogen. In the case of sulfur, fractionation<br />
occurs in an equilibrium (between reactants and products)<br />
and non-equilibrium (kinetic) mode. Kinetic effects are due to<br />
fast, incomplete, or unidirectional processes, typically resulting<br />
in a preferential enrichment of the lighter isotope in the reaction<br />
products. 25 Grassineau 26 studied fractionation of both carbon<br />
and sulfur and concluded that it is possible to limit the effects of<br />
fractionation with careful attention to detail. Hydrogen fractionation<br />
was studied by Maruoka et al., 27 who showed that<br />
hydrogen comparatively has the most extreme fractionation<br />
Fig. 3 Examples of variations of carbon isotopic abundances of plants<br />
and human diets.<br />
216 | Analyst, 2009, 134, 213–222 This journal is ª The Royal Society of Chemistry 2009
effects. Bond strength also plays an important role in kinetic<br />
effects due to the greater strength of a deuterium–carbon bond<br />
relative to a hydrogen–carbon bond. 28 Oxygen fractionation is<br />
largely due to the combustion of the sample, with temperature<br />
a deciding factor as to whether or not the sample is completely<br />
combusted. If the sample is only partially combusted, or if the<br />
oxygen levels are depleted in the oxidation chamber, this can<br />
affect the results of the isotopic <strong>ratio</strong>. It has also been shown that<br />
oxygen fractionation can occur within a sample vial. 10 Additionally,<br />
oceanic vapors have had a large effect on the oxygen<br />
content. 29 Nitrogen fractionations in nature are due to kinetic<br />
effects: there are also two non-biological fractionation effects,<br />
dissolution in water and diffusion in water. Bacteria, in particular,<br />
display several fractionation processes: nitrification, denitrification,<br />
and nitrogen fixation. 29<br />
General fractionation also occurs with ambient diffusion. 29<br />
Chemical reactions and physical processes like evapo<strong>ratio</strong>n and<br />
condensation create products that are isotopically distinct from<br />
their starting materials. 30 For example, in the hydrologic cycle,<br />
snow falling at the poles is depleted in 2 H (D) and 18 O content<br />
with respect to rainfall at the equator. 30 Fractionation effects are<br />
also observed in purely chemical reactions. As a result, any<br />
simple or complex substance will be composed of isotope <strong>ratio</strong>s<br />
that provide a key in unravelling the history and origins of its<br />
precursor elements. This fact has been pivotal in solving a variety<br />
of interesting and important problems, as described below. For<br />
additional information, a complete description of isotope fractionation<br />
effects for 13 C/ 12 C, 18 O/ 16 O, D/ 1 H, 15 N/ 14 N, 34 S/ 32 S, and<br />
several others not mentioned in this Minireview, was written by<br />
Mook and Vries. 29<br />
Applications<br />
Forensic<br />
Forensic science researchers have long-recognized the need to<br />
distinguish between different sources of evidential material. Such<br />
determinations were formerly difficult or impossible in cases<br />
where two samples had identical physical or chemical properties.<br />
However, isotopic analysis now provides a means to look beyond<br />
the chemical composition of matter to the level of the nucleus. To<br />
help monitor and disseminate the developing forensic applications<br />
of isotope <strong>ratio</strong> <strong>mass</strong> <strong>spectrometry</strong>, a specialized network<br />
called the Forensic <strong>Isotope</strong> Ratio Mass Spectrometry (FIRMS)<br />
Network was developed in January 2002. This voluntary<br />
network is mostly composed of British and European members<br />
from universities and forensic laboratories. FIRMS have also<br />
organized several inter-laboratory studies as well as the European<br />
Institute for Reference Materials and Measurements<br />
(IRMM) and the National Physical Laboratory (NPL). An<br />
extensive review of analytical chemistry inter-laboratory studies<br />
was written by Hund et al., 31 while an excellent example of an<br />
inter-comparison study was that done on tetramethylurea by<br />
Breas et al. 32<br />
Until recently, the notion that the carbon isotopic <strong>ratio</strong> of soil<br />
could be used to determine whether soil recovered from a suspect<br />
matched a crime scene would have been regarded as implausible.<br />
The use of carbon and nitrogen EA-IRMS analysis of soil to<br />
partially exonerate a suspect is thus yet another example of how<br />
far the forensic applications of IRMS have advanced. 33 In<br />
another application, it was proven that a carbonate rock was<br />
switched during transit from a supplier’s factory in South Africa<br />
to a client’s factory in Israel. 34 Isotopic analysis of the carbon in<br />
the sample indicated that the origin of the carbonate rock was<br />
likely the client’s site in Israel, which substantiated the claim that<br />
the rock was switched after arrival. Further elemental flexibility<br />
of EA-IRMS was exhibited by the analysis of carbon, oxygen,<br />
and hydrogen in matches. 35 The results of these tests indicated<br />
that matches recovered from a suspect’s house and crime scene<br />
were different, which underscores the potential importance of<br />
this technique to criminal justice. EA-IRMS has also been used<br />
to measure the carbon isotopic abundance of 28 samples of white<br />
architectural paint. 36 Specifically, the effects of drying time,<br />
layering, ageing, and homogeneity on discriminatory results were<br />
reported.<br />
As a result of constant legal demand, the analysis of controlled<br />
drugs is one of the largest areas of active development. For<br />
example, the presence of elevated levels of g-hydroxybutyric acid<br />
(GHB) in blood, urine, or hair samples is often necessary to<br />
support claims of drug-facilitated sexual assault (DFSA). GC-<br />
IRMS of carbon isotopic <strong>ratio</strong>s has been used to discriminate<br />
between endogenous production of GHB and exogenous ingestion<br />
levels. 37 Fig. 4 shows the IRMS results of such an analysis.<br />
The figure shows the m/z 44 peak for the esterifed version of<br />
GHB (g-butyrolactone; GBL) and the internal standard 3-caprolactone.<br />
In a broader sense, IRMS may also be useful in the<br />
struggle against drug trafficking. A notable illust<strong>ratio</strong>n of this<br />
application is the nitrogen isotopic comparison of 20 samples of<br />
heroin seized from a North Korean-flagged cargo vessel versus<br />
a database of more than 200 authentic samples. It was determined<br />
that the samples from the seizure had not originated from<br />
a source currently on record and were therefore likely to have<br />
come from a new source. 38<br />
With the threat of terrorism omnipresent in our modern lives,<br />
techniques are needed to address unique problems associated<br />
with <strong>mass</strong>-disasters. For example, the ability to reconstruct<br />
a victim’s remains following an event of <strong>mass</strong> destruction is<br />
useful from both a forensic point of view and to provide closure<br />
for the families and friends of deceased victims. When DNA<br />
cannot be collected, or when DNA reference samples are not<br />
available, IRMS is a potential option to link recovered body<br />
parts to each other or to a geographic location. EA-IRMS has<br />
been used to analyze the hydrogen and oxygen isotope <strong>ratio</strong>s of<br />
human scalp hair and fingernails. 39 In another case, 40 isotope<br />
<strong>ratio</strong> analysis of oxygen and hydrogen from an unknown<br />
deceased person in Ireland was used to verify that the person<br />
almost certainly had not lived in the local geographical region for<br />
a significant amount of time. Isotopic analysis instead suggested<br />
that the person was likely from Eastern Europe or Scandinavia.<br />
Further studies by the same authors proved that hydrogen<br />
isotope <strong>ratio</strong>s provided much more valuable information when<br />
analyzing human hair then when analyzing nails. 41 In a separate<br />
study, a model was developed to predict the geographical region<br />
of North America from which a person resides by cross-referencing<br />
the hydrogen and oxygen isotopic abundances of scalp<br />
hair with tap water. 42 For the initial data in this model, individual<br />
hair samples were collected from 65 cities across the United<br />
States, while tap water samples were collected from 18 states. The<br />
This journal is ª The Royal Society of Chemistry 2009 Analyst, 2009, 134, 213–222 | 217
Fig. 4 The path of GHB/GBL, from spiked drink, to victim, to hair, and eventually to the GC/C/IRMS m/z 44 chromatogram. The peaks were obtained<br />
from the liquid injection of a standard of GBL and 3-caprolactone at 50 ng each (on column). The square-topped peaks represent pulses of CO2 reference<br />
gas. 37 (Adapted with permission from ref. 37. Copyright 2007, Wiley-InterScience.)<br />
accuracy of this model was confirmed by collecting hair samples<br />
from local barbershops in the same cities and comparing them<br />
with previous samples. The findings showed an agreement of 85%<br />
with the model, which relies upon the assumption that all hair in<br />
the local barbershops originated from indigenous citizens. A<br />
more-thorough review on forensic applications of IRMS,<br />
including earlier studies of explosives and synthetic drugs, was<br />
written by Benson et al. 4<br />
Food and drugs<br />
In the food and drug industries, it is necessary to determine<br />
whether or not a product’s actual contents agree with the labeled<br />
contents. Although food and drinks are sometimes laced with<br />
relatively innocuous substances such as artificial sweeteners, they<br />
are not always marked as such. <strong>Isotope</strong> <strong>ratio</strong> analysis can be used<br />
to establish whether or not the product contains natural sweeteners<br />
(from the original food source), or artificial sweeteners<br />
(such as corn syrup). A recent study showed that sugars could be<br />
analyzed using LC-IRMS to obtain carbon isotopic <strong>ratio</strong> abundances<br />
of each sugar of interest. 20 Because of their similar<br />
carbohydrate contents, cheap beet sugars are sometimes undetected<br />
when added to honey products as sweeteners. However,<br />
through the isotopic analysis of each sugar within the questioned<br />
honey samples, it is possible to determine which honeys are<br />
altered and which are not. Moreover, the detection of other<br />
modifiers such as corn, sugar cane, or sweeteners other than high<br />
fructose corn syrup is possible. In a similar vein, an internal<br />
standard of malic acid, found only in very low abundances in<br />
commercial sweeteners, was employed to study which of 56<br />
selected maple syrup samples were unsweetened. 21<br />
Other food products known to be altered are fruit juices and<br />
sparkling drinks. Authentic sparkling drinks are usually pressurized<br />
with CO2 through a fermentation process, whereas<br />
a cheaper and easier method for carbonation is to pressurize the<br />
drinks with CO2 from an external cylinder. GC-IRMS can detect<br />
the different modes of carbonation by testing the carbon and<br />
hydrogen isotope <strong>ratio</strong>s of natural versus injected CO2. 43 In<br />
a different application to food produce, IRMS was used for the<br />
quality assessment of apple aroma profiles in apple juices. 44<br />
Analysis of food additives, in this case citric acid, for the<br />
authentication of fruit juices were also studied using 20<br />
commercial citric acids and 79 citric acids extracted from fruit<br />
juices. 45 A disadvantage encountered in this study was that the<br />
exchangeable hydrogen sites bound to the oxygen atoms are<br />
included in the overall D/H result. Therefore, an offline prepa<strong>ratio</strong>n<br />
step was necessary. The capability of the developed<br />
method to detect an addition of citric acid was confirmed by<br />
spiking an orange juice sample with known amounts of citric<br />
acid.<br />
The increasing popularity of organic produce has been<br />
accompanied by prices that are significantly higher than nonorganic<br />
produce. To validate whether or not more expensive<br />
produce is truly organic, and thus warrants the higher prices,<br />
isotope <strong>ratio</strong> analyses have been used to authenticate organic<br />
produce. Based on the premise that ‘you are what you eat’, the<br />
isotope <strong>ratio</strong>s of flesh (meat) from animals such as cows are<br />
determined by their feed source. Bahar et al. 46 investigated the<br />
seasonal variations of beef using EA-IRMS to study the carbon,<br />
nitrogen, and sulfur isotopic <strong>ratio</strong>s of 242 beef samples. Between<br />
the months of December and June an isotopic shift was apparent,<br />
most likely due to indoor winter feeding practices. By applying<br />
the shift during these months, it was possible to use isotopic<br />
<strong>ratio</strong>s to determine whether or not a beef sample was indeed<br />
organic or merely conventional Irish beef. In a related study, the<br />
accuracy of beef-rearing labeling was questioned in part by<br />
measuring the hydrogen and oxygen isotopic <strong>ratio</strong>s of lipid<br />
fractions with EA-IRMS. 47 Carbon and nitrogen isotope<br />
composition of beef defatted dry <strong>mass</strong> comprised the other<br />
component of the analysis. The study suggested that it was not<br />
218 | Analyst, 2009, 134, 213–222 This journal is ª The Royal Society of Chemistry 2009
only possible to determine where the beef was reared, but also to<br />
validate the accuracy of the information on the labels.<br />
Although the above analyses require that the animal be<br />
sacrificed prior to analysis, it is also possible to test for isotope<br />
<strong>ratio</strong>s without these invasive measures. For example, a noninvasive<br />
method to test carbon and nitrogen isotopic abundances<br />
has been performed using urine and milk from cattle. 48 Specifically,<br />
isotope <strong>ratio</strong> analysis helped determine which type of feed<br />
was being used during what season. Further, from the identity of<br />
the feed, it was possible to distinguish whether or not the beef<br />
production was organic or conventional.<br />
Diet, biochemistry and metabolism<br />
Isotopic abundance <strong>ratio</strong>s can also establish dietary patterns and<br />
movements of cattle. One such study reconstructed the dietary<br />
history of cattle by measuring the carbon and nitrogen isotopic<br />
abundances of bovine hooves with EA-IRMS. 49 Specifically, the<br />
keratin within the hoof was used in order to establish the shortterm<br />
dietary changes and history of the cattle. This was taken<br />
a step further using a three-dimensional growth of the bovine<br />
hoof to study the seasonal and ontogenetic feeding patterns, as<br />
well as the movement, of the cattle. 50 Feeding patterns have also<br />
been characterized using bone collagen to perform palaeodietary<br />
reconstruction and distinction between marine- and C4-based<br />
diets. 18 To make this contrast, LC-IRMS was used to separate 18<br />
amino acids from modern protein and archeological bone<br />
collagen hydrolysates taken from human and faunal bone<br />
collagen. Bone collagen has also provided evidence that indicated<br />
maize as the primary source of sustenance in many regions of the<br />
Central Andes during the era of Inka hegemony. 51 The effects of<br />
preferential fertilization of maize relative to manure were<br />
determined by using the carbon and nitrogen isotopic <strong>ratio</strong>s<br />
within the bone collagen. To augment these findings, muscle and<br />
skin from mummies dating back to the late prehistoric early<br />
colonial (AD1490–1640) time from Peru’s Ayacucho Valley was<br />
analyzed as well.<br />
When dealing with non-volatile compounds such as amino<br />
acids or fatty acids, extensive sample prepa<strong>ratio</strong>n or derivatization<br />
is needed prior to introduction into the GC-IRMS. 52 This adds<br />
complexity to the data interpretation, particularly if the number<br />
or type of atoms in the molecule is increased through the derivatization<br />
process. Corr et al. 53 demonstrated a less extensive<br />
derivatization method using four novel derivatives on 15 amino<br />
acids. N-Acetylmethyl esters (NACMEs) were shown to add the<br />
fewest amount of carbon atoms and resulted in the smallest d 13 C<br />
errors relative to the underivatized amino acids. The same authors<br />
later confirmed these findings 54 by utilizing this derivatization<br />
technique to study amino acids from rat tissue (bone collagen).<br />
Zoology has also been the beneficiary of IRMS research, such<br />
as in the study of the dietary and mig<strong>ratio</strong>n patterns of elephants<br />
by Cerling et al. 55 This project used an EA-IRMS analyzer to<br />
determine the carbon and nitrogen isotopic <strong>ratio</strong>s of hair taken<br />
from wild elephants, as shown in Fig. 5. Segmented analysis of<br />
the hair from the elephants was then used to generate a chronological<br />
history of the elephants’ eating habits, and even their<br />
feeding locations. The isotope <strong>ratio</strong>s for the average of all the<br />
elephants in the study showed gradual changes from season to<br />
season. The results also showed that an individual elephant’s hair<br />
could be significantly different from the control group if the<br />
elephant in question was involved in night-time crop raiding.<br />
Such differences are only possible when the crops under discussion<br />
are of a different metabolic class than the control group’s<br />
native diet.<br />
Fig. 5 Carbon and nitrogen isotope <strong>ratio</strong> analysis of wild elephants’ hair can be used to detect the occurrence of night-time raids on farmers’ crops. 55<br />
(Adapted with permission from ref. 55. Copyright 2006, National Academy of Sciences.)<br />
This journal is ª The Royal Society of Chemistry 2009 Analyst, 2009, 134, 213–222 | 219
Another zoological study examined the mig<strong>ratio</strong>n patterns of<br />
wild birds. 56 Using feathers from vertebrate and invertebrate<br />
species of birds, the migrating patterns as a function of isotopic<br />
carbon and hydrogen abundance <strong>ratio</strong>s were developed. Additional<br />
analysis of the birds’ summer plover feathers established<br />
the bird’s origin within several kilometers of their known origin.<br />
An earlier, related report of migratory patterns of other species<br />
can be found in an article by Bowen et al. 57 on global applications<br />
of stable hydrogen and oxygen isotopes in wildlife forensics. In<br />
short, isotope grids were used to statistically constrain the<br />
unknown origin of North American and European feathers and<br />
water isotopes.<br />
Medical problems such as digestion patterns and mechanisms<br />
have also been an area of interest. A recent study examined<br />
carbohydrate digestion and glucose absorption by measuring<br />
plasma glucose with EA-IRMS after oral administ<strong>ratio</strong>n of<br />
naturally-occurring 13 C enriched carbohydrates. 58 By using<br />
Saccharomyces cerevisiae (yeast) to convert the samples into<br />
CO2, the magnitude of glucose digestion was determined.<br />
Another biochemical investigation used a tracer from blood to<br />
measure the fractional synthesis rate of glutathione (GSH) after<br />
infusion of (1- 13 C)-glycine. 59 Amino acids from low birth weight<br />
infants admitted into the neonatal intensive care unit were<br />
analyzed using LC-IRMS. To achieve higher resolution, the<br />
oxidated form of glutathione, GSSR, was used: this tracer made<br />
it possible to determine both the individual carbon isotopic <strong>ratio</strong><br />
of GSSR and the fractional synthesis rate of glutathione.<br />
Given current circumstances, environmental investigations<br />
may be among the most important IRMS applications. Environmental<br />
effects are known to contribute to carbon isotopic<br />
abundance <strong>ratio</strong>s of plant matter, although the manner and<br />
extent of this interaction is still a mystery. To partially address<br />
this question, the effects of turbulent water on the CO 2 flux of<br />
herbarium material from members of fresh water torrenticolous<br />
families have been studied. 60 Fast-flowing water removes the<br />
boundary layer of CO 2 on the plant surface, which in turn causes<br />
faster diffusion rates and thus noticeable differences in the<br />
isotopic <strong>ratio</strong>s of fixed CO2. In this application, EA-IRMS was<br />
used to analyze the levels of carbon isotope <strong>ratio</strong> variability<br />
of the torrenticolous families Podostemaceae and Hydrostachyaceae.<br />
Athletics and doping<br />
Doping in the athletics world has been a problem for decades.<br />
Many sports governing bodies rely on isotope <strong>ratio</strong> analyses to<br />
determine elevated levels of exogenous sources of illicit steroids<br />
versus elevated levels of endogenous hormones, which is possibly<br />
indicative of a genetic anomaly. Because of its specificity, IRMS<br />
is the preferred analytical technique to confirm steroid use. GC-<br />
IRMS has been used to analyze urine for the carbon isotope<br />
<strong>ratio</strong>s of nandrolone (NAD), an endogenous steroid hormone<br />
metabolite used to enhance the performance of race horses and<br />
athletes. 61 One of the most abundant metabolites of the synthetic<br />
steroid 19-nortestosterone is 19-norandrosterone. Utilizing<br />
reference compounds to compare isotopic carbon <strong>ratio</strong>s to<br />
distinguish between endogenous and exogenous concent<strong>ratio</strong>n<br />
levels, EA-IRMS determined the origin of urinary norandrosterone<br />
traces. 62 Urine samples can also be a vehicle to detect<br />
steroid use. 63 To detect the effects of undecanoate over a fourweek<br />
period, GC-IRMS was used to measure the carbon isotope<br />
<strong>ratio</strong>s of androsterone and etiocholanolone metabolites in seven<br />
Caucasian male volunteers.<br />
Environmental pollution<br />
For obvious public health reasons, the effects of pollutants on<br />
the environment are an area of great research importance. In<br />
a common post-industrial scenario, sediment with elevated<br />
polycyclic aromatic hydrocarbons (PAHs) found in a lakebed<br />
near a former gas-manufacturing plant was studied. 64 Carbon<br />
isotopic analysis of the sediment samples was carried out using<br />
a GC-IRMS to prove that the samples were not the same as the<br />
tarry soil samples recovered from the gas plant. Instead, results<br />
indicated that the hydrocarbons most likely came from a mixture<br />
of PAH sources such as coal tars and carbureted water gas tars.<br />
Perhaps the most significant contemporary environmental issue<br />
is that of global warming. Keppler et al. 65 found that it was<br />
possible to use lignin methoxyl groups within wood to determine<br />
past climatic changes. Lignin methoxyl is a major component of<br />
wood (up to 3%) contained in cellulose cell walls and is produced<br />
by secondary metabolic processes. The researchers discovered<br />
that converting lignin methoxyl into CH 3I made determination<br />
of hydrogen isotopic <strong>ratio</strong>s via EA-IRMS straightforward. In the<br />
future, it is hoped that this method could reconstruct annual<br />
climate histories and assist in ecophysiological research.<br />
Summary<br />
IRMS has been shown to have both wide applicability and<br />
versatility to be coupled with several different interfaces. In<br />
determining which interface would be best suited for coupling to<br />
the IRMS, the sample itself is the most important determining<br />
factor. Non-volatile substances such as foods, drugs, amino<br />
acids, and fatty acids can be most easily measured with EA-<br />
IRMS, even though this technique only provides an average<br />
isotope <strong>ratio</strong> value for the entire sample. Analysis can typically<br />
be performed on samples as small as 0.5 mg and often avoids the<br />
complex sample prepa<strong>ratio</strong>n procedures that are usually needed<br />
for GC- or LC-IRMS analysis. With that said, it is important to<br />
note that GC-IRMS can be used for most volatile organic<br />
substances without sample prepa<strong>ratio</strong>n. LC-IRMS is still the<br />
least mature sample introduction method. As such, it seems that<br />
the most important obstacle in this technique is ensuring<br />
adequate baseline-resolution, in the absence of organic modifiers,<br />
in the chromatographic stage of the analysis.<br />
Regardless of the sample introduction method, IRMS has<br />
great potential for forensic applications in high volume or high<br />
value crimes such as burglary, homicide, and drug dealing cases.<br />
In the future, the analysis of drugs using IRMS will undoubtedly<br />
become more common for both controlled and illegal drugs. A<br />
particularly key benefit is the possibility of linking trace amounts<br />
of drugs to a bulk source in order to determine trafficking routes.<br />
A noticeable gap in the market exists for compound-specific<br />
isotope <strong>ratio</strong> standards, although several suppliers are available<br />
for bulk isotope <strong>ratio</strong> standards such as polyethylene, sugar, and<br />
flour. Thus, the availability of IRMS standards and standardized<br />
methods are both important goals. Another major current and<br />
220 | Analyst, 2009, 134, 213–222 This journal is ª The Royal Society of Chemistry 2009
future issue is the rendering of compatible isotopic measurement<br />
referencing strategies. To address this issue, Serra et al. 66 have<br />
already begun development of a standardization method for<br />
inter-laboratory d 13 C elemental analysis and gas chromatography<br />
combustion isotope <strong>ratio</strong> <strong>mass</strong> <strong>spectrometry</strong> measurements.<br />
Several suitable compounds for GC-IRMS isotopic<br />
reference materials were investigated in order to comprise<br />
a standardized Grob-test. For forensic applications, validated<br />
sampling protocols and sampling kits would be additionally<br />
advantageous.<br />
Improvements continue to be made as researchers find new<br />
ways to utilize this technique. IRMS offers the potential of<br />
unlimited applications for non-volatile and volatile compounds<br />
while achieving higher accuracy and precision via increased<br />
automation. Through continued progress in fundamental<br />
understanding and application development, IRMS should be<br />
able to transition from its current status as a specialized practice<br />
into a more routine method. Future instrumentation goals could<br />
then focus on shrinking the footprint and cost of the instrumentation,<br />
reducing analysis times, obtaining higher resolution<br />
data, and perhaps even looking towards miniaturization or<br />
portable instruments.<br />
Acknowledgements<br />
The authors thank Derrell Hood for editing and Roger Husted<br />
from ThermoFinnigan for technical support. We also thank NSF<br />
for funding through grant numbers 0649757 and 0745590.<br />
References<br />
1 Reference and intercomparison materials for stable isotopes of light<br />
elements, IAEA-TECDOC-825, International Atomic Energy<br />
Agency, Vienna, 1995, pp. 1–159.<br />
2 S. Valkiers, M. Varlam, K. Russe, M. Berglund, P. Taylor, J. Wang,<br />
M. J. T. Milton and P. De Bievre, Int. J. Mass Spectrom., 2007, 264,<br />
10–21.<br />
3 S. Valkiers, M. Varlam, K. Russe, M. Berglund, P. Taylor, J. Wang,<br />
M. Milton and P. De Bievre, Int. J. Mass Spectrom., 2007, 263, 195–<br />
203.<br />
4 S. Benson, C. Lennard, P. Maynard and C. Roux, Forensic Sci. Int.,<br />
2006, 157, 1–22.<br />
5 R. A. Werner and W. A. Brand, Rapid Commun. Mass Spectrom.,<br />
2001, 15, 501–519.<br />
6 J. Meija and Z. Mester, Anal. Chim. Acta, 2008, 607, 115–125.<br />
7 M. A. Jochmann, M. Blessing, S. B. Haderlein and T. C. Schmidt,<br />
Rapid Commun. Mass Spectrom., 2006, 20, 3639–3648.<br />
8 W. Wong, D. Hachey, S. Zhang and L. Clarke, Rapid Commun. Mass<br />
Spectrom., 1995, 9, 1007–1011.<br />
9 U. Nygren, H. Rameback, M. Berglund and D. C. Baxter, Int. J. Mass<br />
Spectrom., 2006, 257, 12–15.<br />
10 S. Nelson, Rapid Commun. Mass Spectrom., 2000, 14, 293–297.<br />
11 P. Mason, J. Kosler, J. de Hoog, P. Sylvester and S. Meffan-Main,<br />
J. Anal. At. Spectrom., 2006, 21, 177–186.<br />
12 R. Santamaria-Fernandez and R. Hearn, Rapid Commun. Mass<br />
Spectrom., 2008, 22, 401–408.<br />
13 R. Carlson, M. Boyet and M. Schonbachler, Geochim. Cosmochim.<br />
Acta, 2007, 71, A145.<br />
14 R. Clough, P. Evans, T. Catterick and E. Evans, Anal. Chem., 2006,<br />
78, 6126–6132.<br />
15 A. L. Sessions, S. P. Sylva and J. M. Hayes, Anal. Chem., 2005, 77,<br />
6519–6527.<br />
16 M. Krummen, A. W. Hilkert, D. Juchelka, A. Duhr, H. J. Schluter<br />
and R. Pesch, Rapid Commun. Mass Spectrom., 2004, 18, 2260–2266.<br />
17 J. P. Godin, L. B. Fay and G. Hopfgartner, Mass Spectrom. Rev.,<br />
2007, 26, 751–774.<br />
18 J. S. O. McCullagh, D. Juchelka and R. E. M. Hedges, Rapid<br />
Commun. Mass Spectrom., 2006, 20, 2761–2768.<br />
19 J. P. Godin, J. Hau, L. B. Fay and G. Hopfgartner, Rapid Commun.<br />
Mass Spectrom., 2005, 19, 2689–2698.<br />
20 A. I. Cabanero, J. L. Recio and M. Ruperez, J. Agric. Food Chem.,<br />
2006, 54, 9719–9727.<br />
21 P. Tremblay and R. Paquin, J. Agric. Food Chem., 2007, 55, 197–203.<br />
22 M. Leuenberger and C. Huber, Anal. Chem., 2002, 74, 4611–4617.<br />
23 I. T. Platzner, Modern <strong>Isotope</strong> Ratio Mass Spectrometry, John Wiley<br />
& Sons, Inc., New York, NY, 1997.<br />
24 J. R. Ehleringer, J. F. Casale, M. J. Lott and V. L. Ford, Nature, 2000,<br />
408, 311–312.<br />
25 J. Prietzel and B. Mayer, Chem. Geol., 2005, 525–535.<br />
26 N. Grassineau, Appl. Geochem., 2006, 21, 756–765.<br />
27 T. Maruoka, C. Koeberl, J. Matsuda and Y. Syono, Meteorit. Planet.<br />
Sci., 2003, 38, 1255–1262.<br />
28 G. Rieley, Analyst, 1994, 119, 915–919.<br />
29 W. Mook and J. Vries, in Environmental <strong>Isotope</strong>s in the Hydrological<br />
Cycle Principles and Applications. Volume 1: Introduction – Theory,<br />
Methods, Review, ed. W. Mook, International Atomic Energy<br />
Agency, Vienna, 2003–2004, pp. 1–271.<br />
30 A. Barrie and S. J. Prosser, Mass Spectrom. Soils, 1996, 1–46.<br />
31 E. Hund, D. Massart and J. Smeyers-Verbeke, Anal. Chim. Acta,<br />
2000, 423, 145–165.<br />
32 O. Breas, F. Thomas, R. Zeleny, G. Calderone, E. Jamin and<br />
C. Guillou, Rapid Commun. Mass Spectrom., 2007, 21, 1555–1560.<br />
33 K. Pye, S. J. Blott, D. J. Croft and J. F. Carter, Forensic Sci. Int.,<br />
2006, 163, 59–80.<br />
34 F. H. Roelofse and U. E. Horstmann, Forensic Sci. Int., 2008, 174, 63–66.<br />
35 N. L. Farmer, A. Ruffell, W. Meier-Augenstein, J. Meneely and<br />
R. M. Kalin, Sci. Justice, 2007, 47, 88–98.<br />
36 L. J. Reidy, W. Meier-Augenstein and R. M. Kalin, Rapid Commun.<br />
Mass Spectrom., 2005, 19, 1899–1905.<br />
37 M. M. Saudan, C, P. Augsburger and M. Saugy, Rapid Commun.<br />
Mass Spectrom., 2007, 21, 3956–3962.<br />
38 J. Casale, E. Casale, M. Collins, D. Morello, S. Cathapermal and<br />
S. Panicker, J. Forensic Sci., 2006, 51, 603–606.<br />
39 I. Fraser, W. Meier-Augenstein and R. M. Kalin, Rapid Commun.<br />
Mass Spectrom., 2006, 20, 1109–1116.<br />
40 W. Meier-Augenstein, ‘Stable isotope fingerprinting’, in Forensic<br />
human identification: an introduction, ed. S. M. Black and T. J. U.<br />
Thomson, CRC Press, Boca Raton, Florida, 2007, pp. 29–54.<br />
41 I. Fraser and W. Meier-Augenstein, Rapid Commun. Mass Spectrom.,<br />
2007, 21, 3279–3285.<br />
42 J. R. Ehleringer, G. J. Bowen, L. A. Chesson, A. G. West,<br />
D. W. Podlesak and T. E. Cerling, Proc. Natl. Acad. Sci. U. S. A.,<br />
2008, 105, 2788–2793.<br />
43 G. Calderone, C. Guillou, F. Reniero and N. Naulet, Food Res. Int.,<br />
2007, 40, 324–331.<br />
44 S. Elss, C. Preston, M. Appel, F. Heckel and P. Schreier, Food Chem.,<br />
2006, 98, 269–276.<br />
45 E. Jamin, F. Martin, R. Santamaria-Fernandez and M. Lees, J. Agric.<br />
Food Chem., 2005, 53, 5130–5133.<br />
46 B. Bahar, O. Schmidt, A. P. Moloney, C. M. Scrimgeour, I. S. Begley<br />
and F. J. Monahan, Food Chem., 2008, 106, 1299–1305.<br />
47 K. Heaton, S. D. Kelly, J. Hoogewerff and M. Woolfe, Food Chem.,<br />
2008, 107, 506–515.<br />
48 N. Knobbe, J. Vogl, W. Pritzkow, U. Panne, H. Fry, H. M. Lochotzke<br />
and A. Preiss-Weigert, Anal. Biochem., 2006, 386, 104–108.<br />
49 A. B. Harrison, S, B. Zazzo, F. Monahan, A. Moloney, C. Scrimgeour<br />
and O. Schmidt, Rapid Commun. Mass Spectrom., 2007, 21, 479–486.<br />
50 F. Z. Harrison, S, A. Monahan, B. Bahar, A. Moloney,<br />
C. Scrimgeour and O. Schmidt, Rapid Commun. Mass Spectrom.,<br />
2007, 21, 3971–3976.<br />
51 B. C. Finucane, J. Arch. Sc., 2007, 34, 2115–2124.<br />
52 A. L. Sessions, J. Sep. Sci., 2006, 29, 1946–1961.<br />
53 L. T. Corr, R. Berstan and R. P. Evershed, Rapid Commun. Mass<br />
Spectrom., 2007, 21, 3759–3771.<br />
54 L. T. Corr, R. Berstan and R. P. Evershed, Anal. Chem., 2007, 79,<br />
9082–9090.<br />
55 T. E. Cerling, G. Wittemyer, H. B. Rasmussen, F. Vollrath,<br />
C. E. Cerling, T. J. Robinson and I. Douglas-Hamilton, Proc. Natl.<br />
Acad. Sci. U. S. A., 2006, 103, 371–373.<br />
56 D. A. Rocque, M. Ben-David, R. P. Barry and K. Winker, J. Field<br />
Ornithol., 2006, 147, 395–404.<br />
This journal is ª The Royal Society of Chemistry 2009 Analyst, 2009, 134, 213–222 | 221
57 G. Bowen, L. Wassenaar and K. Hobson, Oecologia, 2005, 143, 337–<br />
348.<br />
58 K. P. Rembacz, K. N. Faber and F. Stellaard, Rapid Commun. Mass<br />
Spectrom., 2007, 21, 3169–3174.<br />
59 H. Schierbeek, F. T. Braake, J. P. Godin, L. B. Fay and J. B. van<br />
Goudoever, Rapid Commun. Mass Spectrom., 2007, 21, 2805–2812.<br />
60 H. H. Ziegler, FLORA, 2007, 202, 647–652.<br />
61 M. Yamada, K. Kinoshita, M. Kurosawa, K. Saito and<br />
H. Nakazawa, J. Pharm. Biomed. Anal., 2007, 45, 654–658.<br />
62 M. Hebestreit, U. Flenker, G. Fussholler, H. Geyer, U. Guntner,<br />
U. Mareck, T. Piper, M. Thevis, C. Ayotte and W. Schanzer,<br />
Analyst, 2006, 131, 1021–1026.<br />
63 N. Baume, C. Saudan, A. Desmarchelier, E. Strahm, P. E. Sottas,<br />
C. Bagutti, M. Cauderay, Y. O. Schumacher, P. Manyin and<br />
M. Saugy, Steroids, 2006, 71, 364–370.<br />
64 D. Saber, D. Mauro and T. Sirivedhin, Environ. Forensics, 2006, 7,<br />
65–75.<br />
65 F. Keppler, D. B. Harper, R. M. Kalin, W. Meier-Augenstein,<br />
N. Farmer, S. Davis, H. L. Schmidt, D. M. Brown and<br />
J. T. G. Hamilton, New Phytol., 2007, 176, 600–609.<br />
66 F. Serra, A. Janeiro, G. Calderone, J. M. M. Rojas, C. Rhodes,<br />
L. A. Gonthier, F. Martin, M. Lees, A. Mosandl, S. Sewenig,<br />
U. Hener, B. Henriques, L. Ramalho, F. Reniero, A. J. Teixeira<br />
and C. Guillou, J. Mass Spectrom., 2007, 42, 361–369.<br />
222 | Analyst, 2009, 134, 213–222 This journal is ª The Royal Society of Chemistry 2009