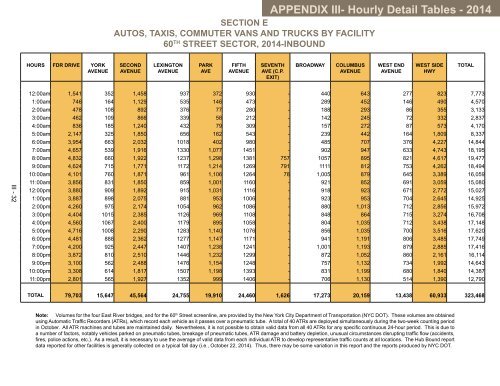
APPENDIX III- Hourly Detail Tables - <strong>2014</strong> SECTION E AUTOS, TAXIS, COMMUTER VANS AND TRUCKS BY FACILITY 60 TH STREET SECTOR, <strong>2014</strong>-INBOUND HOURS FDR DRIVE YORK AVENUE SECOND AVENUE LEXINGTON AVENUE PARK AVE FIFTH AVENUE SEVENTH AVE (C.P. EXIT) BROADWAY COLUMBUS AVENUE WEST END AVENUE WEST SIDE HWY TOTAL III - 32 12:00am 1,541 352 1,458 937 372 930 - 440 643 277 823 7,773 1:00am 746 164 1,129 535 146 473 - 289 452 146 490 4,570 2:00am 478 108 892 376 77 280 - 188 293 86 355 3,133 3:00am 462 109 866 339 58 212 - 142 245 72 332 2,837 4:00am 836 185 1,240 432 79 309 - 157 272 87 573 4,170 5:00am 2,147 325 1,850 656 162 543 - 239 442 164 1,809 8,337 6:00am 3,954 663 2,032 1018 402 980 - 485 707 376 4,227 14,844 7:00am 4,657 539 1,916 1330 1,077 1451 - 902 947 633 4,743 18,195 8:00am 4,832 660 1,922 1237 1,298 1381 757 1057 895 821 4,617 19,477 9:00am 4,624 715 1,771 1172 1,214 1269 791 1111 812 753 4,262 18,494 10:00am 4,101 760 1,871 961 1,106 1264 78 1,005 879 645 3,389 16,059 11:00am 3,856 831 1,850 859 1,001 1160 - 921 852 691 3,059 15,080 12:00pm 3,880 909 1,892 915 1,031 1116 - 918 923 671 2,772 15,027 1:00pm 3,887 898 2,075 881 953 1006 - 923 953 704 2,645 14,925 2:00pm 4,260 975 2,174 1054 962 1086 - 880 1,013 712 2,856 15,972 3:00pm 4,404 1015 2,385 1126 969 1108 - 848 864 715 3,274 16,708 4:00pm 4,560 1067 2,400 1179 895 1058 - 804 1,035 712 3,438 17,148 5:00pm 4,716 1008 2,290 1283 1,140 1076 - 856 1,035 700 3,516 17,620 6:00pm 4,481 888 2,362 1277 1,147 1171 - 941 1,191 806 3,485 17,749 7:00pm 4,200 925 2,447 1407 1,238 1241 - 1,001 1,193 879 2,885 17,416 8:00pm 3,872 810 2,510 1446 1,232 1299 - 872 1,052 860 2,161 16,114 9:00pm 3,100 562 2,488 1476 1,154 1248 - 757 1,132 734 1,992 14,643 10:00pm 3,308 614 1,817 1507 1,198 1393 - 831 1,199 680 1,840 14,387 11:00pm 2,801 565 1,927 1352 999 1406 - 706 1,130 514 1,390 12,790 TOTAL 79,703 15,647 45,564 24,755 19,910 24,460 1,626 17,273 20,159 13,438 60,933 323,468 Note: Volumes for the four East River bridges, and for the 60 th Street screenline, are provided by the New York City Department of Transportation (NYC DOT). These volumes are obtained using Automatic Traffic Recorders (ATRs), which record each vehicle as it passes over a pneumatic tube. A total of 40 ATRs are deployed simultaneously during the two-week counting period in October. All ATR machines and tubes are maintained daily. Nevertheless, it is not possible to obtain valid data from all 40 ATRs for any specific continuous 24-hour period. This is due to a number of factors, notably vehicles parked on pneumatic tubes, breakage of pneumatic tubes, ATR damage and battery depletion, unusual circumstances disrupting traffic flow (accidents, fires, police actions, etc.). As a result, it is necessary to use the average of valid data from each individual ATR to develop representative traffic counts at all locations. The Hub <strong>Bound</strong> report data reported for other facilities is generally collected on a typical fall day (i.e., October 22, <strong>2014</strong>). Thus, there may be some variation in this report and the reports produced by NYC DOT.
SECTION E AUTOS, TAXIS, COMMUTER VANS AND TRUCKS BY FACILITY 60TH STREET SECTOR, <strong>2014</strong>-OUTBOUND HOURS FDR DRIVE YORK AVE FIRST AVE QUEENS- BORO RAMP THIRD AVE PARK AVE MADISON AVE SIXTH AVE (C.P. Entrance) EIGHT AVE BROADWAY AMSTER- DAM AVE WEST END AVEWEST SIDE HWY TOTAL III - 33 12:00am 1,710 301 937 748 859 294 785 - 346 370 451 107 1,431 8,339 1:00am 875 156 645 498 546 134 428 - 198 246 284 63 771 4,844 2:00am 532 104 496 444 411 69 257 - 133 166 201 48 525 3,386 3:00am 457 101 448 581 365 58 206 - 94 125 186 41 367 3,029 4:00am 684 163 566 1,074 455 74 237 - 109 122 238 53 408 4,183 5:00am 1,526 326 762 2,032 622 158 351 - 190 176 406 147 562 7,258 6:00am 3,399 796 1,389 1,913 1,057 481 757 - 385 353 736 374 1,346 12,986 7:00am 3,772 1,088 1,823 1,749 1,222 1,182 1,101 216 650 604 967 519 2,280 17,173 8:00am 3,777 1,080 1,796 1,580 1,301 1,255 984 273 676 637 868 472 2,491 17,190 9:00am 3,390 992 1,747 1,523 1,262 1,112 913 265 685 554 968 633 1,967 16,011 10:00am 3,265 868 1,530 1,510 1,203 1,046 813 282 711 548 992 617 2,048 15,433 11:00am 3,208 797 1,444 1,421 1,160 999 751 275 680 571 1,024 543 2,187 15,060 12:00pm 3,217 850 1,473 1,408 1,138 951 775 305 691 585 970 496 2,348 15,207 1:00pm 3,414 887 1,505 1,464 1,195 956 791 300 708 562 958 500 2,548 15,788 2:00pm 3,768 995 1,545 1,578 1,156 990 811 354 754 616 838 490 2,974 16,869 3:00pm 3,971 1,093 1,686 1,506 1,212 1,067 839 411 724 617 1,054 541 3,563 18,284 4:00pm 3,816 1,026 1,697 1,591 1,026 1,121 903 498 722 581 1,144 575 3,546 18,246 5:00pm 3,630 1,017 1,902 1,625 1,234 1,260 986 514 749 696 1,206 764 3,272 18,855 6:00pm 3,665 1,012 1,966 1,493 1,401 1,281 1,156 431 794 821 1,230 796 3,170 19,216 7:00pm 3,481 903 1,842 1,366 1,473 1,295 1,383 - 866 857 1,169 548 3,229 18,412 8:00pm 3,307 766 1,719 1,384 1,468 1,094 1,449 - 815 695 982 357 3,151 17,187 9:00pm 2,986 679 1,738 1,334 1,437 985 1,508 - 807 684 984 328 3,254 16,724 10:00pm 2,955 608 1,591 1,365 1,305 957 1,510 - 787 620 954 310 3,353 16,315 11:00pm 2,468 453 1,350 1,180 1,112 641 1,290 - 641 521 731 220 2,462 13,069 TOTAL 67,273 17,061 33,597 32,367 25,620 19,460 20,984 4,124 13,915 12,327 19,541 9,542 53,253 329,064 Note: Volumes for the four East River bridges, and for the 60 th Street screenline, are provided by the New York City Department of Transportation (NYC DOT). These volumes are obtained using Automatic Traffic Recorders (ATRs), which record each vehicle as it passes over a pneumatic tube. A total of 40 ATRs are deployed simultaneously during the two-week counting period in October. All ATR machines and tubes are maintained daily. Nevertheless, it is not possible to obtain valid data from all 40 ATRs for any specific continuous 24-hour period. This is due to a number of factors, notably vehicles parked on pneumatic tubes, breakage of pneumatic tubes, ATR damage and battery depletion, unusual circumstances disrupting traffic flow (accidents, fires, police actions, etc.). As a result, it is necessary to use the average of valid data from each individual ATR to develop representative traffic counts at all locations. The Hub <strong>Bound</strong> report data reported for other facilities is generally collected on a typical fall day (i.e., October 22, <strong>2014</strong>). Thus, there may be some variation in this report and the reports produced by NYC DOT. APPENDIX III- Hourly Detail Tables - <strong>2014</strong>
- Page 1 and 2:
New York Metropolitan Transportatio
- Page 3 and 4:
About NYMTC: The New York Metropoli
- Page 5 and 6:
TABLE OF CONTENTS Table of Contents
- Page 7 and 8:
QUICK REFERENCE DATA PERSONS ENTERI
- Page 9 and 10:
Appendix I Time Series Tables - 201
- Page 11 and 12:
TABLE 1A PERSONS AND VEHICLES ENTER
- Page 13 and 14:
TABLE 1A (continued) PERSONS AND VE
- Page 15 and 16:
TABLE 1B PERSONS ENTERING THE HUB O
- Page 17 and 18:
TABLE 3 TOTAL PERSONS ENTERING THE
- Page 19 and 20:
TABLE 5 TOTAL PUBLIC TRANSIT PASSEN
- Page 21 and 22:
TABLE 6 TOTAL RAIL TRAINS ENTERING
- Page 23 and 24:
TABLE 8 AVERAGE FLOOR SPACE PER PAS
- Page 25 and 26:
TABLE 10 TOTAL PERSONS ENTERING AND
- Page 27 and 28:
TABLE 12 REVERSE TRAVEL FROM THE HU
- Page 29 and 30:
Appendix II Summary Tables - 2014
- Page 31 and 32:
TABLE 14 A WHERE, WHEN AND HOW PEOP
- Page 33 and 34:
TABLE 14 C WHERE, WHEN AND HOW PEOP
- Page 35 and 36: TABLE 15 B WHERE, WHEN AND HOW PEOP
- Page 37 and 38: TABLE 16 WHERE AND WHEN MOTOR VEHIC
- Page 39 and 40: TABLE 18 WHERE AND WHEN BUS PASSENG
- Page 41 and 42: TABLE 20 LEVEL OF COMFORT AND HEADW
- Page 43 and 44: TABLE 21B CUMULATIVE TOTAL OF PERSO
- Page 45 and 46: TABLE 22B CUMULATIVE TOTAL OF PASSE
- Page 47 and 48: TABLE 23B CUMULATIVE TOTAL OF MOTOR
- Page 49 and 50: TABLE 25 TOTAL PERSONS LEAVING THE
- Page 51 and 52: TABLE 27 TOTAL PERSONS LEAVING THE
- Page 53 and 54: Appendix III Hourly Detail Tables -
- Page 55 and 56: SECTION A BUS TRANSIT BY SECTOR SUM
- Page 57 and 58: HOURS SECTION A BUS TRANSIT BY ROUT
- Page 59 and 60: HOURS SECTION A BUS TRANSIT BY ROUT
- Page 61 and 62: SECTION A EXPRESS BUS RIDERSHIP BY
- Page 63 and 64: SECTION B SUBWAY BY SECTOR SUMMARY,
- Page 65 and 66: SECTION B SUBWAY BY SECTOR MTA NYC
- Page 67 and 68: SECTION B SUBWAY BY LOCATION 60 TH
- Page 69 and 70: SECTION B SUBWAY BY LOCATION BROOKL
- Page 71 and 72: SECTION B SUBWAY BY LOCATION BROOKL
- Page 73 and 74: SECTION B SUBWAY BY LOCATION QUEENS
- Page 75 and 76: SECTION B SUBWAY BY LINE NEW JERSEY
- Page 77 and 78: SECTION C SUBURBAN AND INTERCITY RA
- Page 79 and 80: SECTION C SUBURBAN AND INTERCITY RA
- Page 81 and 82: SECTION D AUTO, TAXI, COMMUTER VAN
- Page 83 and 84: SECTION D AUTO, TAXI, COMMUTER VAN
- Page 85: SECTION E AUTOS, TAXIS, COMMUTER VA
- Page 89 and 90: SECTION E AUTOS, TAXIS, COMMUTER VA
- Page 91 and 92: HOURS 60TH STREET SECTOR SECTION G
- Page 93 and 94: SECTION G BICYCLE VOLUMES BY LOCATI
- Page 95 and 96: Appendix IV List of Data Sources -
- Page 97 and 98: LIST OF DATA SOURCES The Hub Bound