Inequality and Climate Change Inégalité et changement climatique
Inequality
Inequality

Create successful ePaper yourself
Turn your PDF publications into a flip-book with our unique Google optimized e-Paper software.
Velan & Mohanty: Gender-wise Rural-to-Urban Migration in Orissa, India 157<br />
Adverse climatic changes are found to encourage female <strong>and</strong> combined<br />
migration, which emerges significant in model-II, when social capital variable is<br />
dropped from the regression under step-wise analysis. This clearly implies that the<br />
sample respondents prefer to move to safer locations under environmental threat,<br />
both for survival <strong>and</strong> livelihood. On the other h<strong>and</strong>, the association emerges<br />
negative, but insignificant for males, which could be because the males tend to<br />
migrate even otherwise.<br />
The inclusion of gender into the model indicates an ind<strong>et</strong>erminate <strong>and</strong><br />
insignificant influence of being a male on the decision to migrate.<br />
The pseudo R2 values indicate that the included independent variables in the<br />
regression models explain 56 to 88 per cent of the variations in the dependent<br />
variable.<br />
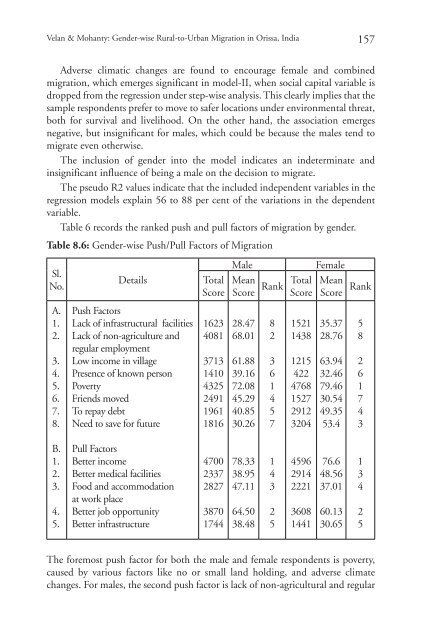
Table 6 records the ranked push <strong>and</strong> pull factors of migration by gender.<br />
Table 8.6: Gender-wise Push/Pull Factors of Migration<br />
Sl.<br />
No.<br />
D<strong>et</strong>ails<br />
Total<br />
Score<br />
Male<br />
Mean<br />
Score<br />
Rank<br />
Total<br />
Score<br />
Female<br />
Mean<br />
Score Rank<br />
A.<br />
1.<br />
2.<br />
3.<br />
4.<br />
5.<br />
6.<br />
7.<br />
8.<br />
Push Factors<br />
Lack of infrastructural facilities<br />
Lack of non-agriculture <strong>and</strong><br />
regular employment<br />
Low income in village<br />
Presence of known person<br />
Poverty<br />
Friends moved<br />
To repay debt<br />
Need to save for future<br />
1623<br />
4081<br />
3713<br />
1410<br />
4325<br />
2491<br />
1961<br />
1816<br />
28.47<br />
68.01<br />
61.88<br />
39.16<br />
72.08<br />
45.29<br />
40.85<br />
30.26<br />
8<br />
2<br />
3<br />
6<br />
1<br />
4<br />
5<br />
7<br />
1521<br />
1438<br />
1215<br />
422<br />
4768<br />
1527<br />
2912<br />
3204<br />
35.37<br />
28.76<br />
63.94<br />
32.46<br />
79.46<br />
30.54<br />
49.35<br />
53.4<br />
5<br />
8<br />
2<br />
6<br />
1<br />
7<br />
4<br />
3<br />
B.<br />
1.<br />
2.<br />
3.<br />
4.<br />
5.<br />
Pull Factors<br />
B<strong>et</strong>ter income<br />
B<strong>et</strong>ter medical facilities<br />
Food <strong>and</strong> accommodation<br />
at work place<br />
B<strong>et</strong>ter job opportunity<br />
B<strong>et</strong>ter infrastructure<br />
4700<br />
2337<br />
2827<br />
3870<br />
1744<br />
78.33<br />
38.95<br />
47.11<br />
64.50<br />
38.48<br />
1<br />
4<br />
3<br />
2<br />
5<br />
4596<br />
2914<br />
2221<br />
3608<br />
1441<br />
76.6<br />
48.56<br />
37.01<br />
60.13<br />
30.65<br />
1<br />
3<br />
4<br />
2<br />
5<br />
The foremost push factor for both the male <strong>and</strong> female respondents is poverty,<br />
caused by various factors like no or small l<strong>and</strong> holding, <strong>and</strong> adverse climate<br />
changes. For males, the second push factor is lack of non-agricultural <strong>and</strong> regular