Inequality and Climate Change Inégalité et changement climatique
Inequality
Inequality

You also want an ePaper? Increase the reach of your titles
YUMPU automatically turns print PDFs into web optimized ePapers that Google loves.
Ca<strong>et</strong>ano <strong>and</strong> Thurlow: The Socioeconomic Implications of Renewable Energy 13<br />
The least-cost technology option in South Africa is coal, with coal-fired plants<br />
supplying over 90 per cent of South Africa’s electricity. This is apparent in the<br />
baseline scenario where capacity for coal-fired electricity generation almost<br />
doubles over the period to 2030. There are a number of capacity build plans that<br />
are considered ‘firm commitments’ <strong>and</strong> are either in the process of being built or<br />
in the final stages of planning. Two large coal-fired plants, Medupi <strong>and</strong> Kusile,<br />
make up the bulk of the committed builds <strong>and</strong> are planned to add 8,760 MW of<br />
capacity by 2020 (dependent on delays). A number of small renewable electricity<br />
generation plants are also considered ‘committed’, however their contribution is<br />
minor in comparison, with an estimated 2,400 MW by 2030.<br />
The policy-adjusted scenario displays a more diversified electricity build plan,<br />
with the inclusion of 9600MW of nuclear power, <strong>and</strong> 8400 MW each of wind <strong>and</strong><br />
solar photovoltaic (PV). There is also an increase in peaking capacity, open-cycle<br />
gas turbines (OCGT) <strong>and</strong> closed-cycle gas turbines (CCGT), with 6280 MW of<br />
capacity in total. The emissions 3 scenario relies heavily on the use of renewable<br />
energy, contributing to approximately 60 per cent of total electricity capacity by<br />
2030. As in the policy-adjusted scenario, 9600MW of nuclear power is planned<br />
to come online during the period with no additional base-load capacity from coalfired<br />
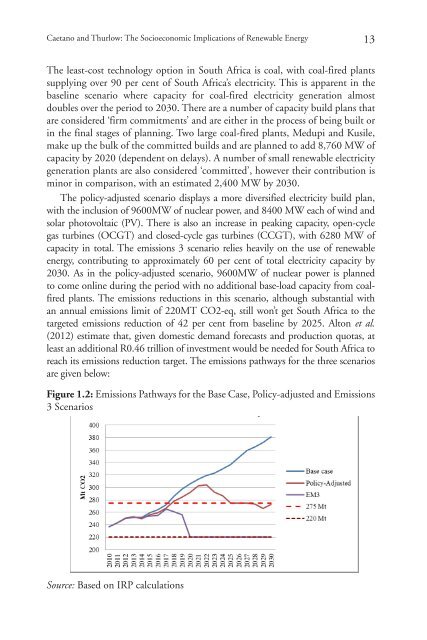
plants. The emissions reductions in this scenario, although substantial with<br />
an annual emissions limit of 220MT CO2-eq, still won’t g<strong>et</strong> South Africa to the<br />
targ<strong>et</strong>ed emissions reduction of 42 per cent from baseline by 2025. Alton <strong>et</strong> al.<br />
(2012) estimate that, given domestic dem<strong>and</strong> forecasts <strong>and</strong> production quotas, at<br />
least an additional R0.46 trillion of investment would be needed for South Africa to<br />
reach its emissions reduction targ<strong>et</strong>. The emissions pathways for the three scenarios<br />
are given below:<br />
Figure 1.2: Emissions Pathways for the Base Case, Policy-adjusted <strong>and</strong> Emissions<br />
3 Scenarios<br />
Source: Based on IRP calculations