

Oliver et al (2004) Monitoring bleaching
Oliver et al (2004) Monitoring bleaching.pdf
Oliver et al (2004) Monitoring bleaching.pdf

Create successful ePaper yourself
Turn your PDF publications into a flip-book with our unique Google optimized e-Paper software.
of satellite images, aeri<strong>al</strong> photos and nautic<strong>al</strong> charts. Further d<strong>et</strong>ails can be found in English <strong>et</strong> <strong>al</strong>.<br />
(1997) and Devantier <strong>et</strong> <strong>al</strong>. (1998).<br />
Sample size<br />
Never take just one sample from any area which you hope to draw conclusions about, or which you<br />
wish to compare with another area. If you have no idea of how variable the area is (how different one<br />
sample is likely to be from another in the same area), then 3 samples should be the absolute<br />
minimum, and 5 is likely to yield much more useful results. Areas which exhibit substanti<strong>al</strong><br />
differences b<strong>et</strong>ween sampling sites, in the measured param<strong>et</strong>er, require larger numbers of samples. In<br />
gener<strong>al</strong>, more samples will yield a more precise result and a less ambiguous resutls . The optim<strong>al</strong><br />
sampling size will depend both on how variable the area is, and on what magnitude of difference<br />
b<strong>et</strong>ween areas you are hoping to d<strong>et</strong>ect (or how precise you wish your description of a single area to<br />
be). If your questions involve d<strong>et</strong>ecting differences at different spati<strong>al</strong> sc<strong>al</strong>es, or if you believe that the<br />
variability changes at different sc<strong>al</strong>es, then you should consider nested sampling, where replicate<br />
measurement are taken at replicate sites within replicate broader locations. A more comprehensive<br />
review of this topic can be found in Underwood (1997) and Andrew & Mapstone (1987).<br />
Fixed vs Random vs Haphazard sampling<br />
In order to ensure that the samples you monitor are representative, they should be randomly placed<br />
within the area of interest. Truly random sampling requires the use of random number tables (or a<br />
c<strong>al</strong>culator which produces random numbers). Because this can be time consuming researchers often<br />
resort to “haphazard” or “arbitrary” sampling. Haphazard sampling means that the researcher places<br />
(or selects) samples without regard to any features on the reef, and without favouring any area or cor<strong>al</strong><br />
types. Haphazard sampling is not truly random, and can result in significant biases if an inexperienced<br />
person is involved in sampling cor<strong>al</strong>s for a conspicuous phenomenon such as <strong>bleaching</strong>. There is a<br />
strong temptation to over-sample bleached colonies in most situations. Efforts to reduce this type of<br />
bias should be used, either by using random number tables and <strong>al</strong>location schemes, or by choosing a<br />
m<strong>et</strong>hod whereby the researcher cannot see what the area which is to be selected looks like until after is<br />
has been selected. For instance, choosing sites from a boat without looking down at the reef is<br />
advisable. In placing quadrats or laying out lines, the diver should keep his eyes closed. <strong>Monitoring</strong><br />
sites can <strong>al</strong>so be established prior to a <strong>bleaching</strong> event to limit some sampling bias.<br />
If a series of measurement of the same area are to be made in order to track changes over time<br />
(increasing <strong>bleaching</strong>, increasing mort<strong>al</strong>ity, recovery) then consideration should be given to the use of<br />
fixed units (quadrats or transects) which are re-measured each time. These units are initi<strong>al</strong>ly placed<br />
randomly but are then fixed for <strong>al</strong>l other sampling times. <strong>Monitoring</strong> sites which are established prior<br />
to a <strong>bleaching</strong> event to limit some sampling bias. The <strong>al</strong>ternative is to measure from a new s<strong>et</strong> of<br />
randomly selected transects each time. There is some debate amongst experts regarding the use of fixed<br />
vs random samples for long-term monitoring. Here is a quick outline of the advantages and<br />
disadvantages of both.<br />
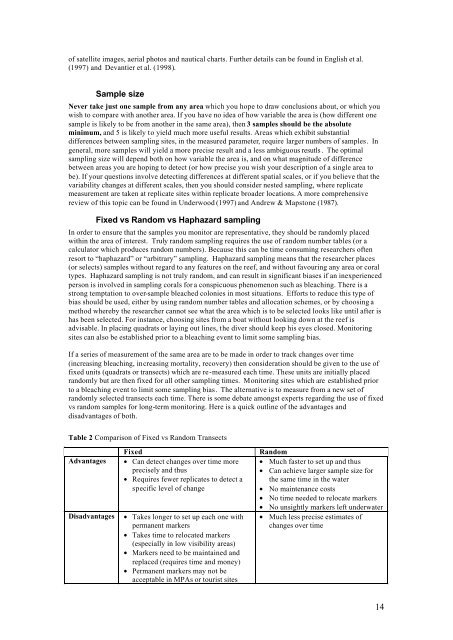
Table 2 Comparison of Fixed vs Random Transects<br />
Advantages<br />
Disadvantages<br />
Fixed<br />
• Can d<strong>et</strong>ect changes over time more<br />
precisely and thus<br />
• Requires fewer replicates to d<strong>et</strong>ect a<br />
specific level of change<br />
• Takes longer to s<strong>et</strong> up each one with<br />
permanent markers<br />
• Takes time to relocated markers<br />
(especi<strong>al</strong>ly in low visibility areas)<br />
• Markers need to be maintained and<br />
replaced (requires time and money)<br />
• Permanent markers may not be<br />
acceptable in MPAs or tourist sites<br />
Random<br />
• Much faster to s<strong>et</strong> up and thus<br />
• Can achieve larger sample size for<br />
the same time in the water<br />
• No maintenance costs<br />
• No time needed to relocate markers<br />
• No unsightly markers left underwater<br />
• Much less precise estimates of<br />
changes over time<br />
14


