
Create successful ePaper yourself
Turn your PDF publications into a flip-book with our unique Google optimized e-Paper software.
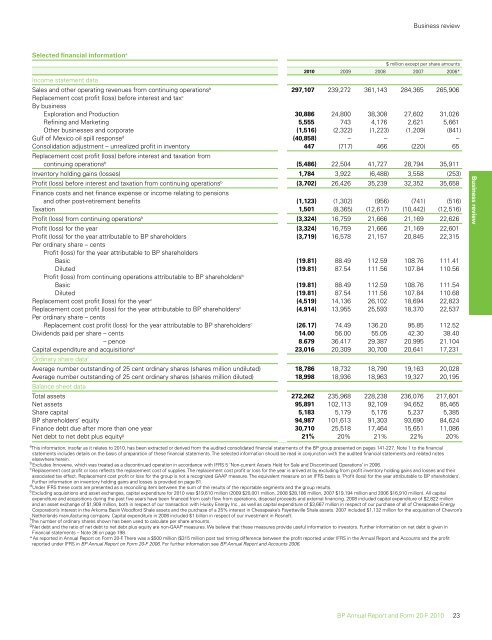
Selected financial information a<br />
Business review<br />
$ million except per share amounts<br />
<strong>20</strong>10 <strong>20</strong>09 <strong>20</strong>08 <strong>20</strong>07 <strong>20</strong>06*<br />
Income statement data<br />
Sales <strong>and</strong> other operating revenues from continuing operationsb Replacement cost profit (loss) before interest <strong>and</strong> tax<br />
297,107 239,272 361,143 284,365 265,906<br />
c<br />
By business<br />
Exploration <strong>and</strong> Production 30,886 24,800 38,308 27,602 31,026<br />
Refining <strong>and</strong> Marketing 5,555 743 4,176 2,621 5,661<br />
Other businesses <strong>and</strong> corporate (1,516) (2,322) (1,223) (1,<strong>20</strong>9) (841)<br />
Gulf of Mexico oil spill responsed (40,858) – – – –<br />
Consolidation adjustment – unrealized profit in inventory<br />
Replacement cost profit (loss) before interest <strong>and</strong> taxation from<br />
447 (717) 466 (2<strong>20</strong>) 65<br />
continuing operationsb (5,486) 22,504 41,727 28,794 35,911<br />
Inventory holding gains (losses) 1,784 3,922 (6,488) 3,558 (253)<br />
Profit (loss) before interest <strong>and</strong> taxation from continuing operationsb Finance costs <strong>and</strong> net finance expense or income relating to pensions<br />
(3,702) 26,426 35,239 32,352 35,658<br />
<strong>and</strong> other post-retirement benefits (1,123) (1,302) (956) (741) (516)<br />
Taxation 1,501 (8,365) (12,617) (10,442) (12,516)<br />
Profit (loss) from continuing operationsb (3,324) 16,759 21,666 21,169 22,626<br />
Profit (loss) for the year (3,324) 16,759 21,666 21,169 22,601<br />
Profit (loss) for the year attributable to <strong>BP</strong> shareholders<br />
Per ordinary share – cents<br />
Profit (loss) for the year attributable to <strong>BP</strong> shareholders<br />
(3,719) 16,578 21,157 <strong>20</strong>,845 22,315<br />
Basic (19.81) 88.49 112.59 108.76 111.41<br />
Diluted<br />
Profit (loss) from continuing operations attributable to <strong>BP</strong> shareholders<br />
(19.81) 87.54 111.56 107.84 110.56<br />
b<br />
Basic (19.81) 88.49 112.59 108.76 111.54<br />
Diluted (19.81) 87.54 111.56 107.84 110.68<br />
Replacement cost profit (loss) for the yearc (4,519) 14,136 26,102 18,694 22,823<br />
Replacement cost profit (loss) for the year attributable to <strong>BP</strong> shareholdersc Per ordinary share – cents<br />
(4,914) 13,955 25,593 18,370 22,537<br />
Replacement cost profit (loss) for the year attributable to <strong>BP</strong> shareholdersc (26.17) 74.49 136.<strong>20</strong> 95.85 112.52<br />
Dividends paid per share – cents 14.00 56.00 55.05 42.30 38.40<br />
Dividends paid per share – pence 8.679 36.417 29.387 <strong>20</strong>.995 21.104<br />
Capital expenditure <strong>and</strong> acquisitionse Ordinary share data<br />
23,016 <strong>20</strong>,309 30,700 <strong>20</strong>,641 17,231<br />
f<br />
Average number outst<strong>and</strong>ing of 25 cent ordinary shares (shares million undiluted) 18,786 18,732 18,790 19,163 <strong>20</strong>,028<br />
Average number outst<strong>and</strong>ing of 25 cent ordinary shares (shares million diluted)<br />
Balance sheet data<br />
18,998 18,936 18,963 19,327 <strong>20</strong>,195<br />
Total assets 272,262 235,968 228,238 236,076 217,601<br />
Net assets 95,891 102,113 92,109 94,652 85,465<br />
Share capital 5,183 5,179 5,176 5,237 5,385<br />
<strong>BP</strong> shareholders’ equity 94,987 101,613 91,303 93,690 84,624<br />
Finance debt due after more than one year 30,710 25,518 17,464 15,651 11,086<br />
Net debt to net debt plus equityg 21% <strong>20</strong>% 21% 22% <strong>20</strong>%<br />
a<br />
This information, insofar as it relates to <strong>20</strong>10, has been extracted or derived from the audited consolidated financial statements of the <strong>BP</strong> group presented on pages 141-227. Note 1 to the financial<br />
statements includes details on the basis of preparation of these financial statements. The selected information should be read in conjunction with the audited financial statements <strong>and</strong> related notes<br />
elsewhere herein.<br />
b<br />
Excludes Innovene, which was treated as a discontinued operation in accordance with IFRS 5 ‘Non-current Assets Held for Sale <strong>and</strong> Discontinued Operations’ in <strong>20</strong>06.<br />
c<br />
Replacement cost profit or loss reflects the replacement cost of supplies. The replacement cost profit or loss for the year is arrived at by excluding from profit inventory holding gains <strong>and</strong> losses <strong>and</strong> their<br />
associated tax effect. Replacement cost profit or loss for the group is not a recognized GAAP measure. The equivalent measure on an IFRS basis is ‘Profit (loss) for the year attributable to <strong>BP</strong> shareholders’.<br />
Further information on inventory holding gains <strong>and</strong> losses is provided on page 81.<br />
d<br />
Under IFRS these costs are presented as a reconciling item between the sum of the results of the reportable segments <strong>and</strong> the group results.<br />
e<br />
Excluding acquisitions <strong>and</strong> asset exchanges, capital expenditure for <strong>20</strong>10 was $19,610 million (<strong>20</strong>09 $<strong>20</strong>,001 million, <strong>20</strong>08 $28,186 million, <strong>20</strong>07 $19,194 million <strong>and</strong> <strong>20</strong>06 $16,910 million). All capital<br />
expenditure <strong>and</strong> acquisitions during the past five years have been financed from cash flow from operations, disposal proceeds <strong>and</strong> external financing. <strong>20</strong>08 included capital expenditure of $2,822 million<br />
<strong>and</strong> an asset exchange of $1,909 million, both in respect of our transaction with Husky Energy Inc., as well as capital expenditure of $3,667 million in respect of our purchase of all of Chesapeake Energy<br />
Corporation’s interest in the Arkoma Basin Woodford Shale assets <strong>and</strong> the purchase of a 25% interest in Chesapeake’s Fayetteville Shale assets. <strong>20</strong>07 included $1,132 million for the acquisition of Chevron’s<br />
Netherl<strong>and</strong>s manufacturing company. Capital expenditure in <strong>20</strong>06 included $1 billion in respect of our investment in Rosneft.<br />
f<br />
The number of ordinary shares shown has been used to calculate per share amounts.<br />
g<br />
Net debt <strong>and</strong> the ratio of net debt to net debt plus equity are non-GAAP measures. We believe that these measures provide useful information to investors. Further information on net debt is given in<br />
Financial statements – Note 36 on page 198.<br />
*As reported in <strong>Annual</strong> <strong>Report</strong> on <strong>Form</strong> <strong>20</strong>-F. There was a $500 million ($315 million post tax) timing difference between the profit reported under IFRS in the <strong>Annual</strong> <strong>Report</strong> <strong>and</strong> Accounts <strong>and</strong> the profit<br />
reported under IFRS in <strong>BP</strong> <strong>Annual</strong> <strong>Report</strong> on <strong>Form</strong> <strong>20</strong>-F <strong>20</strong>06. For further information see <strong>BP</strong> <strong>Annual</strong> <strong>Report</strong> <strong>and</strong> Accounts <strong>20</strong>06.<br />
<strong>BP</strong> <strong>Annual</strong> <strong>Report</strong> <strong>and</strong> <strong>Form</strong> <strong>20</strong>-F <strong>20</strong>10 23<br />
Business review

![[PDF] Deepwater Horizon: Accident Investigation Report - BP](https://img.yumpu.com/51697031/1/190x245/pdf-deepwater-horizon-accident-investigation-report-bp.jpg?quality=85)