Research Methods in Toxicology and Insecticide Resistance ...
Research Methods in Toxicology and Insecticide Resistance ...
Research Methods in Toxicology and Insecticide Resistance ...

Create successful ePaper yourself
Turn your PDF publications into a flip-book with our unique Google optimized e-Paper software.
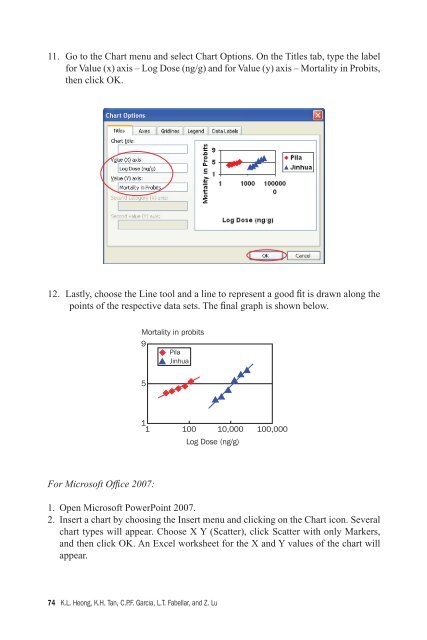
11. Go to the Chart menu <strong>and</strong> select Chart Options. On the Titles tab, type the label<br />
for Value (x) axis – Log Dose (ng/g) <strong>and</strong> for Value (y) axis – Mortality <strong>in</strong> Probits,<br />
then click OK.<br />
12. Lastly, choose the L<strong>in</strong>e tool <strong>and</strong> a l<strong>in</strong>e to represent a good fi t is drawn along the<br />
po<strong>in</strong>ts of the respective data sets. The fi nal graph is shown below.<br />
For Microsoft Offi ce 2007:<br />
Mortality <strong>in</strong> probits<br />
9<br />
Pila<br />
J<strong>in</strong>hua<br />
1. Open Microsoft PowerPo<strong>in</strong>t 2007.<br />
2. Insert a chart by choos<strong>in</strong>g the Insert menu <strong>and</strong> click<strong>in</strong>g on the Chart icon. Several<br />
chart types will appear. Choose X Y (Scatter), click Scatter with only Markers,<br />
<strong>and</strong> then click OK. An Excel worksheet for the X <strong>and</strong> Y values of the chart will<br />
appear.<br />
74 K.L. Heong, K.H. Tan, C.P.F. Garcia, L.T. Fabellar, <strong>and</strong> Z. Lu<br />
5<br />
1 1 100 10,000 100,000<br />
Log Dose (ng/g)