Emissions Trading Worldwide
1TbjEHd
1TbjEHd

You also want an ePaper? Increase the reach of your titles
YUMPU automatically turns print PDFs into web optimized ePapers that Google loves.
The California Cap-and-Trade Program<br />
Looking Back on the First Phase<br />
David Clegern & Mary Jane Coombs, California Air Resources Board<br />
Background on California’s program<br />
Groundbreaking legislation passed in 2006 by the California<br />
State Legislature requires that the state return to 1990 levels of<br />
greenhouse gas (GHG) emissions by 2020. The economy-wide<br />
California Cap-and-Trade Program (the Program) is a key element<br />
of California’s climate plan. It sets a statewide limit on sources<br />
responsible for 85% of California’s GHG emissions, and establishes<br />
a price signal in order to drive long-term investment in cleaner<br />
fuels and a more efficient use of energy.<br />
The Program is designed as part of a comprehensive set of<br />
policies. It works in concert with California’s Low Carbon Fuel<br />
Standard which reduces the carbon intensity of transportation fuels,<br />
California’s Advanced Clean Car Program which forces the transition<br />
to a largely zero-emission vehicle fleet, and California’s Renewables<br />
Portfolio Standard which obliges electricity utilities to increase purchases<br />
of renewable electricity to 33% of their total by 2020, and to<br />
50% by 2030. Together, these policies drive down emissions while<br />
spurring economic growth and technology development.<br />
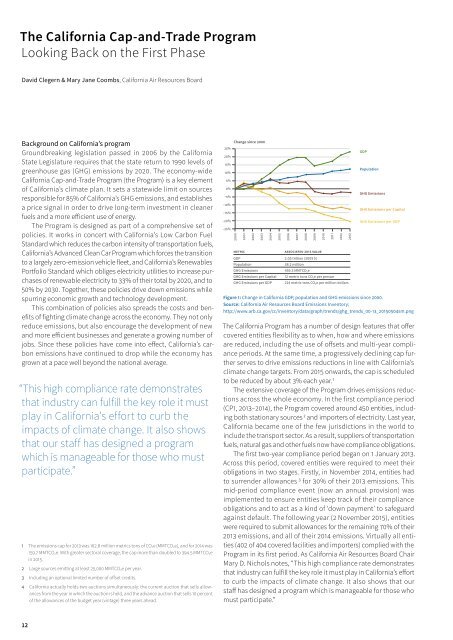
This combination of policies also spreads the costs and benefits<br />
of fighting climate change across the economy. They not only<br />
reduce emissions, but also encourage the development of new<br />
and more efficient businesses and generate a growing number of<br />
jobs. Since these policies have come into effect, California’s carbon<br />
emissions have continued to drop while the economy has<br />
grown at a pace well beyond the national average.<br />
“This high compliance rate demonstrates<br />
that industry can fulfill the key role it must<br />
play in California’s effort to curb the<br />
impacts of climate change. It also shows<br />
that our staff has designed a program<br />
which is manageable for those who must<br />
participate.”<br />
1 The emissions cap for 2013 was 162.8 million metrics tons of CO2e (MMTCO2e), and for 2014 was<br />
159.7 MMTCO2e. With greater sectoral coverage, the cap more than doubled to 394.5 MMTCO2e<br />
in 2015.<br />
2 Large sources emitting at least 25,000 MMTCO2e per year.<br />
3 Including an optional limited number of offset credits.<br />
4 California actually holds two auctions simultaneously: the current auction that sells allowances<br />
from the year in which the auction is held, and the advance auction that sells 10 percent<br />
of the allowances of the budget year (vintage) three years ahead.<br />
25%<br />
20%<br />
15%<br />
10%<br />
5%<br />
0%<br />
–5%<br />
–10%<br />
–15%<br />
–20%<br />
–25%<br />
Change since 2000<br />
2000<br />
2001<br />
2002<br />
2003<br />
2004<br />
Metric<br />
GDP<br />
Population<br />
GHG <strong>Emissions</strong><br />
GHG <strong>Emissions</strong> per Capital<br />
GHG <strong>Emissions</strong> per GDP<br />
2005<br />
2006<br />
2007<br />
2008<br />
2009<br />
The California Program has a number of design features that offer<br />
covered entities flexibility as to when, how and where emissions<br />
are reduced, including the use of offsets and multi-year compliance<br />
periods. At the same time, a progressively declining cap further<br />
serves to drive emissions reductions in line with California’s<br />
climate change targets. From 2015 onwards, the cap is scheduled<br />
to be reduced by about 3% each year. 1<br />
The extensive coverage of the Program drives emissions reductions<br />
across the whole economy. In the first compliance period<br />
(CP1, 2013–2014), the Program covered around 450 entities, including<br />
both stationary sources 2 and importers of electricity. Last year,<br />
California became one of the few jurisdictions in the world to<br />
include the transport sector. As a result, suppliers of transportation<br />
fuels, natural gas and other fuels now have compliance obligations.<br />
The first two-year compliance period began on 1 January 2013.<br />
Across this period, covered entities were required to meet their<br />
obligations in two stages. Firstly, in November 2014, entities had<br />
to surrender allowances 3 for 30% of their 2013 emissions. This<br />
mid-period compliance event (now an annual provision) was<br />
implemented to ensure entities keep track of their compliance<br />
obligations and to act as a kind of ‘down payment’ to safeguard<br />
against default. The following year (2 November 2015), entities<br />
were required to submit allowances for the remaining 70% of their<br />
2013 emissions, and all of their 2014 emissions. Virtually all entities<br />
(402 of 404 covered facilities and importers) complied with the<br />
Program in its first period. As California Air Resources Board Chair<br />
Mary D. Nichols notes, “This high compliance rate demonstrates<br />
that industry can fulfill the key role it must play in California’s effort<br />
to curb the impacts of climate change. It also shows that our<br />
staff has designed a program which is manageable for those who<br />
must participate.”<br />
2010<br />
2011<br />
2012<br />
2013<br />
Associated 2013 Value<br />
2.05 trillion (2009 $)<br />
38.2 million<br />
459.3 MMTCO2e<br />
12 metric tons CO2e per person<br />
224 metric tons CO2e per million dollars<br />
GDP<br />
Population<br />
GHG <strong>Emissions</strong><br />
GHG <strong>Emissions</strong> per Capital<br />
GHG <strong>Emissions</strong> per GDP<br />
Figure 1: Change in California GDP, population and GHG emissions since 2000.<br />
Source: California Air Resources Board <strong>Emissions</strong> Inventory;<br />
http://www.arb.ca.gov/cc/inventory/data/graph/trends/ghg_trends_00-13_20150504sm.png<br />
12