t+h_FinRep_i1

Create successful ePaper yourself
Turn your PDF publications into a flip-book with our unique Google optimized e-Paper software.
UNIVERSITY OF OXFORD<br />
TRANSPORT STUDIES UNIT<br />
(A Research Unit of the School of Geography and the Environment)<br />
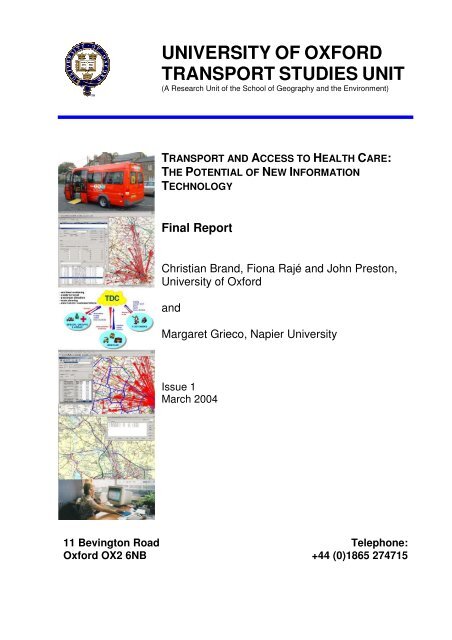
TRANSPORT AND ACCESS TO HEALTH CARE:<br />
THE POTENTIAL OF NEW INFORMATION<br />
TECHNOLOGY<br />
Final Report<br />
Christian Brand, Fiona Rajé and John Preston,<br />
University of Oxford<br />
and<br />
Margaret Grieco, Napier University<br />
Issue 1<br />
March 2004<br />
11 Bevington Road<br />
Oxford OX2 6NB<br />
Telephone:<br />
+44 (0)1865 274715
Transport and Access to Health Care: The Potential of New Information Technology<br />
Final Report<br />
CONTENTS<br />
EXECUTIVE SUMMARY ....................................................................................................... 3<br />
1 INTRODUCTION............................................................................................................ 7<br />
1.1 Objectives ................................................................................................................. 7<br />
1.2 Setting the Scene ..................................................................................................... 7<br />
1.3 This Report ............................................................................................................... 8<br />
2 TRANSPORT AND ACCESS TO HEALTH CARE: SUMMARY OF THE EVIDENCE ... 9<br />
2.1 Introduction .............................................................................................................. 9<br />
2.2 The need for new perspectives on transport and health ....................................... 9<br />
2.3 Missed appointments and transport ..................................................................... 10<br />
2.4 Transport as a determinant of health .................................................................... 11<br />
2.5 Non-emergency patient transport – the need for action ...................................... 11<br />
2.6 The emergence of the demand responsive transport option .............................. 12<br />
2.7 The expansion of demand responsive transport schemes ................................. 12<br />
2.8 Telematics and demand responsive transport ..................................................... 12<br />
2.9 Demand responsive transport, health and social inclusion ................................ 13<br />
2.10 The role of the community in designing appropriate access solutions ......... 14<br />
3 CURRENT TRANSPORT AND HEALTH CARE PROFILES IN THE STUDY AREA .. 15<br />
3.1 Introduction ............................................................................................................ 15<br />
3.2 Mapping Existing Transport Facilities .................................................................. 15<br />
3.3 Mapping Transport Needs ..................................................................................... 18<br />
4 TOWARDS AN ALTERNATIVE HEALTH CARE TRANSPORT PLAN ....................... 21<br />
4.1 Introduction ............................................................................................................ 21<br />
4.2 Telematics-based Demand Responsive Transport .............................................. 21<br />
4.3 The alternative model for transport provision ...................................................... 22<br />
4.3.1 Setup of the model demonstration .................................................................... 23<br />
4.3.2 Demonstration results – hospitals ..................................................................... 29<br />
4.3.3 Demonstration results – GP surgeries .............................................................. 33<br />
4.4 Potential impacts .................................................................................................... 34<br />
4.5 Demand and cost estimate .................................................................................... 35<br />
4.5.1 Demand ............................................................................................................ 36<br />
4.5.2 Estimated lifetime costs of the demonstrated DRT model ................................. 36<br />
4.6 Discussion .............................................................................................................. 38<br />
5 CONCLUSIONS AND OUTLOOK ............................................................................... 40<br />
ACKNOWLEDGEMENTS.................................................................................................... 44<br />
REFERENCES .................................................................................................................... 44<br />
GLOSSARY ........................................................................................................................ 46<br />
APPENDIX A DRT SPREADSHEET MODEL ................................................................. 47<br />
1
Transport and Access to Health Care: The Potential of New Information Technology<br />
Final Report<br />
LIST OF TABLES<br />
Table 1: Example of the current transport service profile for Bladon village ................................17<br />
Table 2: Parameters underlying the feasibility cost analysis for the DRT model .........................37<br />
Table 3: Results of the financial analysis of the DRT model income and outgoings ...................37<br />
LIST OF FIGURES<br />
Figure 1: Screenshot of the Mobirouter DRT system software, showing an example vehicle<br />
route with passenger pick-ups and drop-offs along the way .................................................... 5<br />
Figure 2: Map of Oxford showing location of hospitals (in ovals) ..................................................15<br />
Figure 3: Overview of research area, indicating the district council boundaries .........................16<br />
Figure 4: ‘Trip distribution map’ of travel to/from the hospitals in Oxford ....................................19<br />
Figure 5: ‘Trip distribution map’ of travel to/from selected GP surgeries .....................................20<br />
Figure 6: Passenger trips (red or grey) in Woodstock (GP surgery) and Tackley areas ..............20<br />
Figure 7: Schematic representation of telematics-based DRT services ........................................21<br />
Figure 8: Stops and service areas defined in the demonstration ...................................................23<br />
Figure 9: Example of convex-shaped 10-minute isochrones around Witney (in black) ...............24<br />
Figure 10: Example of spider-web shaped 10-minute isochrones around the Oxford John<br />
Radcliffe hospital (in dark blue) ..................................................................................................25<br />
Figure 11: Definition of the Banbury corridor service route and schedules .................................26<br />
Figure 12: Definition of the Bicester corridor service route and schedules ..................................26<br />
Figure 13: Definition of the Witney corridor service route and schedules ....................................27<br />
Figure 14: Example vehicle driving route utilising the Mobirouter ‘Driving Route’ tool ..............28<br />
Figure 15: Vehicles dialog box showing ‘Minibus 3’ with a capacity of 16 passengers ...............28<br />
Figure 16: Passenger order form showing example booking details (order No. 3344) and a grey<br />
arrow on the map representing the order ..................................................................................29<br />
Figure 17: ‘Select FLEX’ dialog box, showing a possible service route ........................................30<br />
Figure 18: Example vehicle route No. 1356 showing passenger pick-ups and drop-offs along<br />
the way (route in black, orders in red or grey) ..........................................................................31<br />
Figure 19: Example vehicle route No. 1417 showing passenger pick-ups and drop-offs along<br />
the way (route in black, no orders shown) ................................................................................32<br />
Figure 20: Example vehicle route No. 1422 showing passenger pick-ups and drop-offs along<br />
the way (route in black, no orders shown) ................................................................................34<br />
Figure 21: Cumulative profit/loss by demand scenario (14-LOW, 29-CENTRAL, 43-HIGH;<br />
positive numbers are profit, negative loss) ...............................................................................38<br />
Figure 22: Overview of the FAMS conceptual framework (Finn, 2002) ..........................................41<br />
2
Transport and Access to Health Care: The Potential of New Information Technology<br />
Final Report<br />
EXECUTIVE SUMMARY<br />
The objectives of this research are to:<br />
1. Map the existing transport facilities supported by public agencies and the voluntary<br />
sector to the Oxford Radcliffe Hospitals and selected GP surgeries;<br />
2. Map the transport services needed to enable people to access health care facilities;<br />
3. Compare the existing provision with transport needs and establish revised models for<br />
the provision of transport to improve access.<br />
In achieving these objectives, the research specifically seeks to address the following:<br />
1. Study the potential for on-line communication and scheduling of travel and access to<br />
hospital;<br />
2. Develop a demand responsive transport plan for a hospital trust;<br />
3. Determine the impact of implementing such a plan on both the hospital and those<br />
who experience difficulty accessing it.<br />
This work focuses on the potential for demand responsive transport (DRT) solutions to<br />
facilitate easier access. DRT services provide transport “on demand” from passengers using<br />
fleets of vehicles scheduled to pick up and drop off people in accordance with their needs.<br />
DRT is an intermediate form of transport, somewhere between bus and taxi and covers a<br />
wide range of transport services ranging from less formal community transport through to<br />
area-wide service networks. In recent years, the ability of DRT concepts to provide efficient,<br />
viable transport services has been greatly enhanced by the use of transport telematics<br />
software and hardware.<br />
There appears to be relatively little written about the links between transport and health care<br />
access. Recent policy review by the Government and bodies such as the National Health<br />
Service (NHS), Audit Commission and Social Exclusion Unit have started to refer to the<br />
concept of hospital and general practitioner (GP) access in relation to transport issues. In<br />
Section 2, this report summarises the evidence collated and analysed in the literature review<br />
(Rajé et al, 2003a), grouped into key themes of policy and practice:<br />
• The need for new perspectives on transport and health;<br />
• Missed appointments and transport;<br />
• Transport as a determinant of health;<br />
• Non-emergency patient transport – the need for action;<br />
• The emergence of the demand responsive transport option;<br />
• The expansion of demand responsive transport schemes;<br />
• Telematics and demand responsive transport;<br />
• Demand responsive transport, health and social inclusion; and<br />
• The role of the community in designing appropriate access solutions.<br />
Section 3 summarises the findings of a two-pronged approach to developing an overview of<br />
current health care and transport provision in Oxfordshire (Rajé et al, 2003b). It provides<br />
information obtained from secondary sources on public transport services and health care<br />
facilities in a number of geographical locations in the county and also provides the findings of<br />
primary research carried out to ascertain in greater detail how people access the John<br />
Radcliffe and Churchill Hospitals in Oxford as well as general practitioner services in West<br />
Oxfordshire District, Cherwell District and the City of Oxford.<br />
3
Transport and Access to Health Care: The Potential of New Information Technology<br />
Final Report<br />
The empirical research was designed to fill what appears to be a gap in available data which<br />
was underlined in the literature review process: although there is a large body of literature<br />
available on transport and health, it is mainly focused on the health impacts of transport such<br />
as emissions and accidents. Separate questionnaires were used for the hospital and GP<br />
elements of the survey. The hospital questionnaires sought information on non-staff travel<br />
and the GP questionnaires on patient travel. A total of 1366 questionnaires were distributed,<br />
of which 221 hospital questionnaires and 144 GP questionnaires were returned and<br />
analysed.<br />
From this it appears that journeys to the hospitals at Headington can be quite complex,<br />
requiring interchanges in public transport, coordination with other family members and<br />
friends and the use of taxis. Nearly all areas have some form of community transport service<br />
available but there are often restrictions on these services and some people are unsure<br />
about their eligibility for such services. There is also an apparent need for information about<br />
available transport services to hospitals. As may be expected, travel to GP facilities appears<br />
to pose rather less difficulties than travel to hospital. Other key results were:<br />
• The most frequent problems described by respondents in travelling to hospital were<br />
parking problems, difficult/impossible to get there/back by public transport, traffic<br />
congestion and having to rely on someone else to take them.<br />
• Most people (almost half) reported driving to and from hospital and the median travel time<br />
in either direction was 30 minutes.<br />
• The hospital survey indicates that the greatest number of arrivals appear to have been<br />
between 0900 and 1100. Times of departure from hospital appear to peak between 1100<br />
and 1300.<br />
• The median total cost for a round trip to hospital was £5.00, although costs varied<br />
between £0.40 and £31.00.<br />
• Most patients drove to their GPs while just over a quarter walked.<br />
• Visits to/from the GP appear to have involved a median travel time of about 10 minutes.<br />
• The average total travel time to and from a GP surgery was 20 minutes and total cost<br />
was estimated at £2.00.<br />
The main and solely new part of this report is presented in Section 4. This specifically<br />
addresses study objective number 3 by comparing the existing provision with transport needs<br />
and establishing a revised model for the provision of transport to improve access. The<br />
Mobirouter DRT software package was used to develop this model employing a range of<br />
flexible demand responsive transport services. These services are viewed as being both<br />
supplementary and an alternative to existing service provision such as taxi, bus, ambulance<br />
patient transport services and private motoring. The software tool allows for testing a range<br />
of service definitions and scenarios on a ‘what if’ basis (see Figure 1 for an example vehicle<br />
route assigned by the software). The model represents a first step towards an alternative<br />
health care transport plan for Oxfordshire.<br />
The main results of the modelling exercise are:<br />
• Overall, about 40% of the hospital orders were assigned to a service route within a 20-<br />
minute time window for this initial setup. Note the same ‘success rate’ applies to the GP<br />
surgery services developed separately from the hospital ones.<br />
• For non-car drivers and/or the elderly, the DRT service routes have significant<br />
accessibility benefits. This is particularly true where access to public transport is poor.<br />
• The £5 per average single DRT trip compares favourably to complex public transport<br />
journeys, some car journeys (incl. parking charges) and most taxi trips.<br />
• The picture is not entirely clear when assessing DRT journey time savings compared to<br />
actual journey times reported by the hospital patients/visitors, with a wide range of time<br />
4
Transport and Access to Health Care: The Potential of New Information Technology<br />
Final Report<br />
savings and increases for individual passengers. Savings can be significant when<br />
compared to journeys involving existing public transport, intra- or inter-modal transfers,<br />
walking and waiting. Again, the picture is similar for trips to/from GP surgeries.<br />
• The improved reliability of transport to hospital is likely to show significant benefits of<br />
lowering number of missed appointments. However, this could not be verified in this<br />
work.<br />
Figure 1: Screenshot of the Mobirouter DRT system software, showing an example<br />
vehicle route with passenger pick-ups and drop-offs along the way<br />
• The 215 completed surveys amount to 10.8% of the daily hospital patronage with<br />
destinations in the study area of 2,000 (SDG, 2001). This is slightly more than the share<br />
of respondents without access to a car (8.8%) and substantially less than respondents’<br />
‘expression of interest’ for DRT (27.4%).<br />
• Given the uncertainty in estimating potential demand for DRT, three demand scenarios<br />
were tested in terms of financial viability: a CENTRAL market share for DRT of 5%, and<br />
LOW and HIGH market shares of 2.5% and 7.5%. In light of the empirical evidence of<br />
this study and other sources (e.g. Grosso et al, 2002; Jones, 2002; Rajé et al, 2003a;<br />
Brand, 2003), this range of demand figures appears to be a reasonable for the purpose of<br />
this demonstration. The financial feasibility analysis provides a range of net present<br />
values for the three market shares. According to this analysis, the ‘breakeven demand’<br />
for zero profit/loss is about 34 passengers per vehicle per day (or 6% of total demand)<br />
based on an average passenger charge of £5.<br />
• The model has the potential to introduce greater equity of transport access.<br />
5
Transport and Access to Health Care: The Potential of New Information Technology<br />
Final Report<br />
The average charge per passenger was chosen here somewhere between bus and taxi<br />
charges. It lies well in the range of charges observed for existing DRT schemes in the UK. If<br />
replacing subsidised services such as community transport or non-emergency Patient<br />
Transport Services, a subsidy for DRT could significantly lower this charge to levels<br />
comparable to, for example, parking charges that are most ‘visible’ to the patient/visitor.<br />
Furthermore, the above demand figures are for hospital users only. It may be beneficial to<br />
combine demand and service supply with GP surgery demand. This might be tested in<br />
future work.<br />
The demand figures employed are well within the usage figures reported by CfIT (2002),<br />
ranging from 10 to 51 passengers per vehicle per day for flexible DRT services with similar<br />
service frequencies and daily coverage. However, more detailed demand forecasting work<br />
will be required to substantiate the case for DRT services for health care services in the area.<br />
Given the demonstrative nature of the model, there was insufficient time for the level of<br />
iteration necessary to make the services truly efficient. Further iterations would be required<br />
to make this a more efficient setup, with higher ‘FLEX success rates’ expected. Real world<br />
applications have shown that timings have to be fine tuned on a regular basis, reflecting<br />
weekly and seasonal differences in demand patterns. Indeed, this flexible approach can be<br />
seen as one of the strengths of DRT services and is most suitable to transport to health care<br />
provision.<br />
Further work is required to test the feasibility of closely linking any DRT services with existing<br />
public transport provision (as feeder services) and major private transport interchanges (e.g.<br />
P&R). This would demonstrate a truly integrated transport provision, not only for transport to<br />
health care but supplementary to other forms of transport such as taxi, community transport,<br />
bus, rail etc.<br />
Last but not least, the authors believe that modern DRT services have an important role to<br />
play in areas of poor provision, which in turn could contribute to the NHS’ founding principle<br />
of providing access to care to all on the basis of need.<br />
6
Transport and Access to Health Care: The Potential of New Information Technology<br />
Final Report<br />
1 INTRODUCTION<br />
1.1 Objectives<br />
This report has been prepared by the Transport Studies Unit (TSU), University of Oxford, in<br />
association with the Transport Research Institute (TRI), Napier University, the Oxford<br />
Radcliffe Hospital Trust and Jeff Duffell, an external IT consultant. It reports on the findings<br />
of a study on Transport and Access to Health Care: The Potential of New Information<br />
Technology for the Department for Transport – New Horizons Programme.<br />
This research is specifically aimed at mapping the existing transport facilities supported by<br />
public agencies and the voluntary sector and mapping the transport services needed to<br />
enable people to access health care facilities in order to compare the existing provision with<br />
transport needs and develop a revised model for the provision of transport to improve<br />
access.<br />
In achieving these objectives, the research specifically seeks to address the following:<br />
1. Study the potential for on-line communication and scheduling of travel and access to<br />
hospital<br />
2. Develop a demand responsive transport plan for a hospital trust<br />
3. Determine the impact of implementing such a plan on both the hospital and those who<br />
experience difficulty accessing it.<br />
1.2 Setting the Scene<br />
While there are other solutions to health care access problems such as the development of<br />
telemedicine and e-health, this work concentrates on the potential for demand responsive<br />
transport (DRT) solutions to facilitate easier access. DRT services provide transport “on<br />
demand” from passengers using fleets of vehicles scheduled to pick up and drop off people<br />
in accordance with their needs (Grosso et al, 2002). DRT is an intermediate form of<br />
transport, somewhere between bus and taxi and covers a wide range of transport services<br />
ranging from less formal community transport through to area-wide service networks. In<br />
recent years, the ability of DRT concepts to provide efficient, viable transport services has<br />
been greatly enhanced by the use of transport telematics software and hardware and its<br />
successful demonstration in a variety of environments in EC-funded R&D projects such as<br />
SAMPO, SAMPLUS and INVETE and currently in the FAMS and EMIRES projects (Nelson<br />
and Mageean, 1999; Grosso et al, 2002).<br />
In the UK the Government in its Ten Year Plan for Transport has pledged to remove or (at<br />
least) relax constraints on the development of flexibly-routed bus services and to promote a<br />
greater role for community-based services. Recently-published research argues that flexible<br />
public transport services, provided by local authorities and bus operators in partnerships with<br />
employers, stores and leisure centres would help break down social exclusion (DETR,<br />
2000a; DETR, 2000b). The recent successes of local authorities in winning substantial<br />
funding under the Rural (and indeed Urban) Bus Challenge programmes for the<br />
implementation of DRT confirms this new interest in flexible forms of transport (Jones, 2002;<br />
Grosso et al, 2002).<br />
For many there is a call for a transport solution that is reliable, involves no interchange,<br />
precludes the need to rely on friends/relatives and provides door-to-door travel. Efficient and<br />
7
Transport and Access to Health Care: The Potential of New Information Technology<br />
Final Report<br />
effective demand responsive transport can meet these needs, at a cost per trip somewhere<br />
in between taxi and public transport (Rajé et al, 2003a; Grosso et al, 2002).<br />
1.3 This Report<br />
Following this introductory Section, Section 2 of this report gives an overview of what has<br />
been written about transport and access to health care by briefly summarising the literature<br />
in the field. This is mainly based on the more detailed literature review carried out earlier in<br />
the project (Rajé et al, 2003a). Section 3 presents a summary of the results of profiling<br />
transport and health care in the study area. Again, this is based on work reported on in more<br />
detail earlier in the project (Rajé et al, 2003b). However, it has strong links with the current<br />
work and is therefore summarised here.<br />
Section 4 represents the main part of this report, providing the results of the development of<br />
an alternative demand responsive transport plan built on telematics-based DRT service<br />
provision and on-line communications. This also includes a brief excursion into current DRT<br />
software provision and use, based on work reported earlier (Brand, 2003). Conclusions and<br />
an outlook are given in Section 5.<br />
8
Transport and Access to Health Care: The Potential of New Information Technology<br />
Final Report<br />
2 TRANSPORT AND ACCESS TO HEALTH CARE:<br />
SUMMARY OF THE EVIDENCE<br />
2.1 Introduction<br />
The literature review (Rajé et al, 2003a) found that there appears to be relatively little written<br />
about the links between transport and health care access. Recent policy review by the<br />
Government and bodies such as the National Health Service (NHS), Audit Commission and<br />
Social Exclusion Unit have started to refer to the concept of hospital and general practitioner<br />
(GP) access in relation to transport issues. This Section summarises the evidence collated<br />
and analysed in the literature review, grouped into key themes of policy and practice:<br />
• The need for new perspectives on transport and health;<br />
• Missed appointments and transport;<br />
• Transport as a determinant of health;<br />
• Non-emergency patient transport – the need for action;<br />
• The emergence of the demand responsive transport option;<br />
• The expansion of demand responsive transport schemes;<br />
• Telematics and demand responsive transport;<br />
• Demand responsive transport, health and social inclusion; and<br />
• The role of the community in designing appropriate access solutions.<br />
2.2 The need for new perspectives on transport and health<br />
A key barrier to improved health and well-being is access to health services. The Audit<br />
Commission (2001a) states that ‘Patients’ expectations about both the availability and the<br />
quality of the transport needed to allow them to access health services are likely to rise.’ The<br />
public’s concerns about the NHS are wide-ranging but include ‘better transport and access to<br />
services, better community care, and more joined up services’ (NHS, 2000).<br />
It is widely acknowledged that current provision of health care transport is inefficient and poor<br />
transport connections negatively affect health quality. Issues of accessibility in the health<br />
care literature have been found to cover a range of concepts such as waiting lists and<br />
physical access (Martin et al, 2002). Indeed, even the term access can be nebulous and has<br />
been described as both geographic and sociological in nature (Wakeman, 1999).<br />
Building on Martin et al’s (2002) conception that there are large variations in access to<br />
transportation between those adjacent to, and those remote from, nodes in the transportation<br />
network, the current study looks at the ways in which demand responsive transport can bring<br />
people from areas that are remote from the mainstream transportation network towards<br />
those who are adjacent to the network to provide a service that makes efficient use of the<br />
existing network and allows access to health care that is at once timely and tailored for<br />
individual needs.<br />
Martin et al (2002) go on to describe some of the complexities associated with travel to<br />
hospital such as the reliance on lifts, use of voluntary car schemes and public transport.<br />
Where public transport is poor, the authors suggest that difficulties associated with travel to<br />
hospital are compounded by the absence of any voluntary scheme.<br />
Turning to health care provision itself, some believe that health care provision in general and<br />
GP services in particular are scarce in rural areas. This points to the dependence of rural<br />
residents on travel over relatively long distances in order to access health care. Transport<br />
9
Transport and Access to Health Care: The Potential of New Information Technology<br />
Final Report<br />
must then be an even more important facilitator of health service access. Furthermore, the<br />
Rural Development Commission (1995) found that ‘consultation rates for rural GP’s tend to<br />
be lower than for those in urban practices, even where the village has a surgery, and lowest<br />
of all in the more remote villages’. Interestingly, the authors also report that when a branch<br />
surgery is added ‘increases in attendance have been achieved without any major impact on<br />
the numbers attending the main practice (Fearn et al, 1984 and Bentham and Haynes,<br />
1992), though significantly most of these gains have been from the elderly, those suffering<br />
from long-standing illnesses and, particularly, households without a car’. This indicates that<br />
for households without a car, access to health care must be subject to suppression when<br />
there is no conveniently located GP facility.<br />
In addition, there is evidence from research on social variation in use of an out of hours<br />
patient transport service (O’Donnell et al, 1999) that indicates that equity of access to out of<br />
hours primary care is a major issue, ‘particularly in areas of socio-economic deprivation<br />
where demand is high but access to transport is poor’.<br />
2.3 Missed appointments and transport<br />
It has been suggested that 20 per cent of adults experience some difficulty getting to their<br />
hospital while less than 6 per cent experience difficulty in accessing services such as the<br />
chemist or GP (Rushton, 2002).<br />
A recent study to examine the problems faced by outpatients travelling to the Royal United<br />
Hospital Bath showed that 48% of respondents said that they come to hospital by car<br />
because it is the quickest way to travel and 18% said that there was no alternative means of<br />
travel (Bath and NE Somerset Council, 2002). Interestingly, however, 42% said they would<br />
consider using public transport if improvements were made. This study also found that the<br />
most seriously affected by these transport difficulties are people who do not own a car,<br />
people who live in remote rural areas, people who are elderly and people who are disabled<br />
or whose physical condition makes travel difficult. A report on barriers to access to essential<br />
services in Northern Ireland (Independent Research Solutions, 2001) states that healthcare<br />
was reported most frequently as causing difficulties and was exacerbated where long<br />
distances and limited availability of transport made it difficult to time visits to coincide with<br />
surgery hours.<br />
According to the Department of Health, 5.2 million hospital outpatient appointments are<br />
missed in one year (MORI, 2002) resulting in a cost of £250 million a year (BBC, 1999). The<br />
Social Exclusion Unit states that over a 12-month period, 1.4 million people miss, turn down<br />
or choose not to seek medical help because of transport problems. 1 The Department of<br />
Health’s activity summary for 2001-02 reports that, at the Oxford Radcliffe Hospitals NHS<br />
Trust, from April to Sept 2001 there were 207,966 outpatient attendances and 22,100<br />
appointments for which people did not arrive. Of the 10% of outpatients who did not attend, it<br />
would be interesting to determine how many attributed this to transport or access difficulties.<br />
Hamilton and Gourlay’s (2002) investigation into whether there is a link between missed<br />
hospital appointments and transport indicates that although health professionals consider<br />
that patient apathy is the main cause of missed appointments, ‘transport rather than apathy<br />
was a significant factor’. In addition, transport related factors, such as travelling with children,<br />
were also cited as a reason for failing to attend appointments. These findings imply that<br />
provision of an efficient transport solution could result in considerable cost savings to the<br />
NHS.<br />
Against this background, the crisis in the health care service is highlighted even further in a<br />
news release by the Oxfordshire Health Authority (1999) which urged patients not to use<br />
1 http://www.socialexclusionunit.gov.uk/publications/reports/html/transportfinal/chapter1.html<br />
10
Transport and Access to Health Care: The Potential of New Information Technology<br />
Final Report<br />
hospital transport unnecessarily, suggesting that they ‘find alternative means where possible<br />
to get to their routine appointments, perhaps using public transport or enlisting the help of<br />
relatives and friends’. This press release was issued during a holiday period, a time when an<br />
effective new technology-based demand responsive transport system could have helped<br />
satisfy the surge in demand for transport, particularly since volunteer availability is usually<br />
greater during vacation time when people’s travel patterns tend to differ considerably from<br />
their norm.<br />
The Social Exclusion Unit states that ‘three areas affect people's ability to get to healthcare<br />
services: access to mainstream and specialist transport, financial support for people on low<br />
incomes and the location of healthcare facilities’. 2 In this light the importance of transport<br />
away from the health care facility must not be overlooked. The Audit Commission (2001b)<br />
suggests that prompt transport for discharged patients ‘helps to ensure that people leave<br />
hospital as soon as they are fit to do so, reducing bed blocking.’<br />
It must also be noted that, where transport is provided, there are new initiatives in place to<br />
prevent intentional missing of appointments and consequent unnecessary trips being made<br />
by the patient transport provider. The Audit Commission (2001a) provides further details<br />
about efforts to save ‘wasted trips’ involving clerical officers telephoning patients the day<br />
before their appointment to find out whether they intend to attend. The Audit Commission<br />
reports that ‘this has both increased hospital attendance and reduced the incidence of nonemergency<br />
Patient Transport Services (PTS) crews arriving to pick up a patient who is not<br />
planning to travel’.<br />
2.4 Transport as a determinant of health<br />
The Department of Health and Neighbourhood Renewal Unit (DH, 2002) in a joint report<br />
identify transport as one of the determinants of health. The report also states ‘When people<br />
think about health, they tend to think about illness and access to specific NHS facilities, such<br />
as the local doctor’s surgery or the nearest hospital’, thereby underlining the importance of<br />
access to health care facilities.<br />
2.5 Non-emergency patient transport – the need for action<br />
In its guide for managers on improving PTS, the Audit Commission (2001a) recognizes that<br />
‘poor access to health services because of a lack of, or infrequent, public transport, or high<br />
transport costs, is a major factor in social exclusion and rural isolation. Free non-emergency<br />
PTS helps to overcome this problem.’<br />
Following a clinical governance review, Mersey Regional Ambulance Trust NHS Trust<br />
reported (Commission for Health Improvement, 2002) that ‘many patients are frustrated by<br />
cancellations and long delays in the patient transport service’.<br />
People experiencing the long delays in the patient transport service described above are<br />
likely to be dependent on a variety of transport services as they endeavour to participate in<br />
key social activities not just accessing health care. This dependence on multiple providers<br />
leads to difficulties described by the Audit Commission (2001a) related to the arrangements<br />
that may have to be made with each service by an individual (e.g. social services transport to<br />
go to a day-centre, Dial-a-Ride to go shopping and non-emergency patient transport to<br />
attend hospital). The Audit Commission sees this as particularly problematic for elderly or<br />
frail people, those with learning or literacy difficulties, or those whose first language is not<br />
English. For many people, applying for help is complex and may be a significant barrier to<br />
obtaining support. This indicates a need for lessening the burden of trip-planning for these<br />
2 http://www.socialexclusionunit.gov.uk/publications/reports/html/transportfinal/chapter11.html<br />
11
Transport and Access to Health Care: The Potential of New Information Technology<br />
Final Report<br />
vulnerable transport users – a flexible DRT service can be the path towards easier access for<br />
such people.<br />
2.6 The emergence of the demand responsive transport option<br />
DRT options have recently emerged as an important policy option in the context of policy<br />
concern with congestion and the constraining of car based mobility. Given that travel to<br />
health care facilities is particularly difficult for those who do not have access to a car<br />
(Rushton, 2002), ‘small scale, on-demand public transport services could be the social and<br />
economic answer’ (Schwartz, 2000).<br />
New information technology can readily collect together information on persons with low<br />
mobility wishing to make similar journeys, provide a booking system or intelligent reservation<br />
system which permits the pick up and drop off at home and organize this in a way which is<br />
cost effective at the community level (Grieco and Hine, 2002). The authors suggest that<br />
buses routing around the needs of low mobility passengers is an existing capability of the<br />
new information age.<br />
2.7 The expansion of demand responsive transport schemes<br />
In its study of European best practice in the delivery of integrated transport, the Commission<br />
for Integrated Transport (CfIT, 2001) states that demand responsive transport schemes are<br />
becoming more common in the UK but are still basic in comparison to services provide<br />
abroad. CfIT suggests that ‘Although front-end costs are much higher than low-tech<br />
systems, introducing similar technology in the UK could help optimise resources in the long<br />
term by lowering subsidy costs per passenger’.<br />
One of the areas where examples of more flexible transport schemes can be found is in<br />
Scandinavia. A concept called FlexRoute was developed in Gothenburg. It is described as<br />
an intermediate form between shared-ride taxi and traditional service routes for the mobility<br />
impaired (Ståhl, 1999). In Finland, demand responsive services are provided by low floor<br />
minibuses, taxis and service taxis (specially equipped for mobility impaired people).<br />
Lindstrom (1999) indicates that the appropriate vehicle is chosen according to the needs of<br />
the customers and the number of customers that have booked a trip.<br />
It may be argued that for certain journeys demand responsive transport would be an<br />
appropriate solution, given the need to increase the route pattern and frequency of buses<br />
and the perceived high cost of taxis. This type of service could involve vehicles operating<br />
between a fixed pair of points but with flexible routes so that passengers can be delivered to<br />
their doors to overcome the problems of carrying heavy goods and fears about personal<br />
safety, and helping to reduce the impact of bad weather.<br />
2.8 Telematics and demand responsive transport<br />
In the health sphere, the use of new information technology (IT) is becoming increasingly<br />
widespread. Through investment in modernizing IT, the NHS has set out a number of goals<br />
including electronic booking of appointments for patient treatment by 2005 and connection of<br />
all GP practices to NHSnet, giving patients improved diagnosis, information and referral<br />
(NHS, 2000).<br />
In the transport sector, telematic developments create opportunities for 'smart' or 'intelligent'<br />
demand responsive transport schemes which can reduce the length of booking window<br />
required. There are several software solutions available which have been explored during<br />
the research for suitability for application to improving hospital access. Some of these are<br />
briefly described below:<br />
12
Transport and Access to Health Care: The Potential of New Information Technology<br />
Final Report<br />
• There is on-going work in Australia to develop technology that can meet the needs of<br />
scheduling new forms of public transport such as demand responsive transport (see<br />
CSIRO, 2000).<br />
• Other transportation software tools are available such as tod (Transport Optimized on<br />
Demand) which is intended for persons who are poorly served by traditional<br />
transportation services. The goal of the application is to never have empty vehicles in<br />
circulation and to use the vehicle best suited to transportation needs in order to satisfy<br />
customer demand. By pooling users together in the same vehicle, customized<br />
transportation moves more people, more quickly and at a lesser cost.<br />
• Mobisoft (UK) Ltd. produce MobiRouter which is a software package which allows realtime<br />
scheduling and despatch of vehicles.<br />
The software review (Brand, 2003) contains further information on these and other<br />
(overseas) schemes. This includes the following DRT applications in the UK, covering a<br />
wide range of geographical locations:<br />
• Wiggly Bus, Vale of Pewsey, Wiltshire<br />
• CallConnect, Lincolnshire<br />
• U Call, West Newcastle and Airport, Tyne and Wear<br />
• Phone and Go, Northumberland<br />
• Click and Go, Northumberland<br />
• Cango, Andover, Hampshire<br />
• Village Link, Southern Vale of Gloucester<br />
• Local Link, Wythenshawe, Manchester<br />
• Meltham’s Minibus, West Yorkshire<br />
• Hampole and Skelbrooke Taxibus, Doncaster, South Yorkshire<br />
• DoRiS, West Sussex and South Waverley, Surrey<br />
• InterConnect, Lincolnshire<br />
• FAMS EU project, Angus<br />
• Corlink, Cornwall<br />
• EMIRES EU project, Highlands<br />
• Flintshire<br />
Horn (2002) describes fleet scheduling and dispatch in the context of demand responsive<br />
passenger services. He states that ‘Responsiveness to demand…requires effective<br />
communication between prospective travellers and a scheduling centre, and between the<br />
centre and the drivers of the various vehicles’. Schwartz (2000) has explored ‘the role of<br />
demand responsive public transport as a tool for providing an equitable and cost effective<br />
transport service to supplement mass transit and reduce transport disadvantage’. The<br />
current research focuses on the application of new technology to demand responsive<br />
transport to lessen transport disadvantage even more than conventional demand responsive<br />
services have done until now.<br />
2.9 Demand responsive transport, health and social inclusion<br />
The Audit Commission (2001a) recognises the links between health, social inclusion and<br />
transport when it states that ‘Inability to access health services is one example of social<br />
exclusion. Some people cannot afford private transport. People who use wheelchairs need<br />
to travel in vehicles that can carry their chairs; these tend to be larger and costlier than the<br />
average private car, increasing affordability barriers. Alternatively, people may not use<br />
private transport because no one in the household knows how to drive. Illness or disability<br />
may prevent younger people from learning to drive; many older people may never have<br />
learnt to do so. While increasing proportions of elderly people have driving licences, many<br />
13
Transport and Access to Health Care: The Potential of New Information Technology<br />
Final Report<br />
still do not, particularly women. Elderly women, most of whom live alone, are therefore less<br />
likely than elderly men to have access to a car. Other people may no longer be able to drive’.<br />
In light of the indicated links between transport, health and social inclusion, the Audit<br />
Commission’s (2001a) report goes on to describe a number of schemes other than the<br />
Hospital Travel Costs Scheme 3 which try to address the accessibility and financial barriers to<br />
travel. Of particular relevance to the current study are the Dial-a-Ride and ring and ride,<br />
Taxicard and Voluntary sector community bus schemes and voluntary car schemes. The<br />
potential for linking such schemes into a flexible demand responsive transport service is<br />
greatly heightened through the availability of software that allows efficient management of<br />
vehicles from a number of fleets.<br />
2.10 The role of the community in designing appropriate access<br />
solutions<br />
In order for any transport service to be designed appropriately for its users, it is clear that the<br />
evolution of such a scheme must take account of the needs expressed by the potential users<br />
in the community. The Audit Commission (2001a) refers to patient-centred service provision<br />
stating that ‘In the transport context, this means that patients should be asked regularly<br />
whether current standards and arrangements are meeting their needs and, if they are not, to<br />
identify what improvements are needed’.<br />
It is apparent then that the development of a truly flexible demand responsive transport<br />
service must take account of issues such as the minimum time prior to travel that people say<br />
they would prefer to be able to book the service (time window, latest drop-off), the nature of<br />
trips (in terms of length, number of stops etc) that they would find acceptable and the length<br />
of time they would be willing to wait for transport home after an appointment (time window,<br />
earliest pick-up). Arguably a service that grows out of its users’ expressed needs is much<br />
more likely to provide them with a transport solution that they find easy to use.<br />
3 More information on Hospital Travel Costs Scheme is available in Rajé et al (2003), Appendix 1.<br />
14
Transport and Access to Health Care: The Potential of New Information Technology<br />
Final Report<br />
3 CURRENT TRANSPORT AND HEALTH CARE<br />
PROFILES IN THE STUDY AREA<br />
3.1 Introduction<br />
This Section summarises the findings of the second phase of the project, which aimed at<br />
mapping the existing transport facilities supported by public agencies and the voluntary<br />
sector to compare the existing provision with transport needs.<br />
The main output of this research exercise, the Report on Transport and Health Profiles (Rajé<br />
et al, 2003b), describes the findings of a two-pronged approach to developing an overview of<br />
current health care and transport provision in Oxfordshire. It provides information obtained<br />
from secondary sources on public transport services and health care facilities in a number of<br />
geographical locations in the county and also provides the findings of primary research<br />
carried out to ascertain in greater detail how people access the John Radcliffe and Churchill<br />
Hospitals in Oxford as well as general practitioner services in West Oxfordshire District,<br />
Cherwell District and the City of Oxford.<br />
3.2 Mapping Existing Transport Facilities<br />
Transport and health care profiles were drawn up for 12 locations in the Oxford Radcliffe<br />
Hospitals NHS Trust catchment area. Nine of these locations were outside of the city of<br />
Oxford boundary – 4 in West Oxfordshire and 5 in Cherwell. In addition, profiles of 3<br />
residential areas of the city were also put together. Figure 2 shows the location of the two<br />
hospitals on a map of Oxford while Figure 3 gives an overview of the research area,<br />
indicating the district council boundaries.<br />
Figure 2: Map of Oxford showing location of hospitals (in ovals)<br />
Under license from Ordnance Survey (via digimap), 2003<br />
15
Transport and Access to Health Care: The Potential of New Information Technology<br />
Final Report<br />
Figure 3: Overview of research area, indicating the district council boundaries<br />
Under license from Ordnance Survey (via digimap), 2003<br />
The sources of information included public transport timetables, community transport<br />
information and the NHS databases of GP and hospital services (Rajé et al, 2003b).<br />
An example of the current transport service profile for Bladon village is given in Table 1. The<br />
village was chosen because it is relatively near to an urban area but without direct public<br />
transport to Oxford city (and the hospitals) 4 . Note for access to the John Radcliffe Hospital a<br />
patient/visitor would need to:<br />
4 Note the relatively good availability of community transport services.<br />
16
Transport and Access to Health Care: The Potential of New Information Technology<br />
Final Report<br />
1. Get a bus to Woodstock (or walk to the main road);<br />
2. Get another bus to Oxford City Centre;<br />
3. Walk to another bus stop (up to 10 minutes);<br />
4. Get a bus to the hospital.<br />
Table 1: Example of the current transport service profile for Bladon village<br />
GP Services Hospitals* Public Transport<br />
Services to<br />
JR/Churchill<br />
Available at Woodstock (3<br />
km).<br />
The Surgery<br />
Park Lane, OX20 1UB<br />
Opening times:<br />
Mon 0830-1130 1330-1830<br />
Tue 0830-1300<br />
Wed 0830-1130 1630-1830<br />
Thu 0830-1300 1600-1830<br />
Fri 0830-1300 1600-1830<br />
Sat 0830-1230<br />
This GP practice operates<br />
from more than one site, so<br />
opening times may vary.<br />
PCT: North East<br />
Oxfordshire<br />
No. of GPs: 5<br />
Available at Long<br />
Hanborough (3.4 km)<br />
56 Churchill Way<br />
Long Hanborough<br />
OX29 8JL<br />
Opening times:<br />
Mon 0830-1300 1400-1830<br />
Tue 0830-1300 1400-1700<br />
Wed 0830-1300 1400-1830<br />
Thu 0830-1300 1400-1830<br />
Fri 0830-1300 1400-1800<br />
Sat 0900-1000<br />
Nearest: Witney<br />
Community<br />
11.5km<br />
John Radcliffe:<br />
13.1 km<br />
Churchill: 14.4km<br />
No direct bus<br />
services found.<br />
There is a direct bus<br />
service from<br />
Woodstock to Oxford<br />
City Centre.<br />
1133 1135 RH<br />
Transport No. 242<br />
Bladon Woodstock<br />
1140 1155 RH<br />
Transport 203<br />
Woodstock Kidlington<br />
1207 1232 Oxford<br />
Bus Co. No. 2A<br />
Kidlington to Oxford<br />
George St<br />
1251 1315<br />
Stagecoach No. 10<br />
Oxford Rail Station to<br />
JR<br />
Saturday service<br />
resembles weekdays.<br />
No Sunday services.<br />
Community Transport Services<br />
1.Cherwell District Dial-A-Ride –<br />
Kidlington Area<br />
Bookings taken Mon –Fri 0900-1100.<br />
Wheelchair accessible. Seating<br />
capacity: 1-16<br />
2.Hanborough Community Care<br />
Group – Care Scheme<br />
Long Hanborough surgery catchment.<br />
Seating capacity: 1-4<br />
3. Ring-A-Ride – West Oxfordshire<br />
Book up to 7 days in advance 0930-<br />
1230. Anywhere within West<br />
Oxfordshire District. Passengers<br />
limited to 2 journeys per 7-day period.<br />
Wheelchair accessible. Seating<br />
capacity: 1-16<br />
4. Villager Community Bus Services<br />
Timetabled. North Gloucestershire<br />
and West Oxfordshire. Covers 61<br />
villages. Low step for disabled users.<br />
Seating capacity: 1-16<br />
5.Witney Volunteer Link-Up Car<br />
Scheme<br />
Open Mon-Fri 0900-1300,<br />
answerphone other times Seating<br />
capacity: 1-4<br />
6.Kidlington Lynx – Route 1<br />
Timetabled community bus operating<br />
on route: Kidlington, Yarnton,<br />
Cassington, Church and Long<br />
Hanborough, Bladon, Woodstock.<br />
Driven by volunteers and vehicle<br />
available for hire. Wheelchair<br />
accessible. Seating capacity: 1-16<br />
PCT: South West<br />
Oxfordshire<br />
No. of GPs: 8<br />
Source: Rajé et al (2003b)<br />
Overall, it appears that journeys to the hospitals at Headington can be quite complex for<br />
people who live outside of the city of Oxford. Trips from these, more rural locations, can<br />
involve a number of changes of not only buses but also bus operators. Other trips involve<br />
both train and bus travel.<br />
In addition, for some areas, the outbound trip is via one transit point whereas the return<br />
involves another. There is also a need, for nearly every journey, for the passenger to walk to<br />
either St. Aldates or the Railway Station in Oxford to catch the bus to the hospital. As this<br />
17
Transport and Access to Health Care: The Potential of New Information Technology<br />
Final Report<br />
can take up to 15 minutes, it has implications for less able-bodied people and those who are<br />
debilitated.<br />
Nearly all areas appear to have some form of community transport service available. Yet<br />
there are often restrictions on these services, in terms of times that bookings can be made<br />
(people often do not know in advance when they may need to make a crisis journey to<br />
hospital), number of journeys that can be made in a 7-day period (an individual may wish to<br />
visit a relative in hospital several times over a one-week period) or breadth of geographical<br />
coverage of the service (transport may not be available to the hospitals).<br />
3.3 Mapping Transport Needs<br />
Primary data was collected through questionnaires designed to obtain a snapshot of how<br />
people currently travel to health care facilities in these geographic areas. The empirical<br />
findings, described in more detail in Rajé et al (2003b), are based on a two-pronged survey<br />
of a) how people travel to the John Radcliffe and Churchill Hospitals in Oxford and b) how<br />
people travel to their GP’s facilities. Separate questionnaires were used for each of these<br />
elements of the survey. The hospital questionnaires sought information on non-staff travel<br />
and the GP questionnaires on patient travel. A total of 1366 questionnaires were distributed.<br />
221 hospital questionnaires and 144 GP questionnaires were returned and analysed, with<br />
the following headline results:<br />
Hospitals<br />
• The hospital survey indicates that respondents made a median of 2 trips to the John<br />
Radcliffe and 1 to the Churchill in the last year.<br />
• 57% of the trips reported on in the survey were to the John Radcliffe and 39% of trips<br />
made to both hospitals were for follow-up appointments or treatment.<br />
• Most people (almost half) reported driving to and from hospital and the median travel<br />
time in either direction was 30 minutes.<br />
• The hospital survey indicates that the greatest number of arrivals appear to have<br />
been between 0900 and 1100.<br />
• Times of departure from hospital appear to peak between 1100 and 1300.<br />
• While the results indicate large variations in length of visit to hospital, the median<br />
duration of a visit was one and a half hours.<br />
• The median total cost for a round trip to hospital was £5.00, although costs varied<br />
between £0.40 and £31.00.<br />
• The most frequent problems described by respondents in travelling to hospital were<br />
parking problems, difficult/impossible to get there/back by public transport, traffic<br />
congestion and having to rely on someone else to take them.<br />
GP surgeries<br />
• The average number of trips made to the GP in the last year was 6.<br />
• Most patients drove to their GP’s while just over a quarter walked.<br />
• Visits to/from the GP appear to have involved a median travel time of about 10<br />
minutes.<br />
• The average total travel time to and from the GP’s was 20 minutes and total cost was<br />
estimated at £2.00.<br />
• The average duration of a visit to the GP’s was 30 minutes.<br />
‘Trip distribution maps’ of travel to the hospitals in Oxford and to their GP’s facilities are<br />
provided in Figure 4 and Figure 5 respectively, showing as-the-crow-flies trip patterns for<br />
18
Transport and Access to Health Care: The Potential of New Information Technology<br />
Final Report<br />
both ‘to’ and ‘from’ journeys. The hospital trip pattern illustrates that Banbury, Bicester and<br />
Witney are the main trip origins and destinations. As expected, the average trip length is<br />
significantly higher for journeys to/from hospitals than for trips to/from GP surgeries. People<br />
make trips of more than 50km to the hospitals while trips to GP surgeries are often short<br />
(
Transport and Access to Health Care: The Potential of New Information Technology<br />
Final Report<br />
Figure 5: ‘Trip distribution map’ of travel to/from selected GP surgeries<br />
Figure 6: Passenger trips (red or grey) in Woodstock (GP surgery) and Tackley areas<br />
20
Transport and Access to Health Care: The Potential of New Information Technology<br />
Final Report<br />
4 TOWARDS AN ALTERNATIVE HEALTH CARE<br />
TRANSPORT PLAN<br />
4.1 Introduction<br />
This Section provides the results of the final phase of the project: the development of the<br />
revised model for the provision of transport to improve access. The Mobirouter DRT<br />
software package was used to develop this model employing a range of flexible demand<br />
responsive transport services. These services are viewed as being both supplementary and<br />
an alternative to existing service provision such as taxi, bus, ambulance patient transport<br />
services and private motoring. The software tool allows for testing a range of service<br />
definitions and scenarios on a ‘what if’ basis. The scenario described below represents a<br />
first step towards an alternative health care transport plan for Oxfordshire.<br />
Prior to presenting the alternative model and results of the demonstration, a reminder of what<br />
underlies telematics-based DRT is given below, taken from the previous Report on Software<br />
Review (Brand, 2003).<br />
4.2 Telematics-based Demand Responsive Transport<br />
Telematics-based DRT systems are based upon organisation via Travel Dispatch Centres<br />
(TDC) using booking and reservation systems which have the capacity to dynamically assign<br />
passengers to vehicles and optimise the routes. Automated Vehicle Locationing (AVL)<br />
systems are used to provide real-time information on the status and location of the fleet for<br />
the route optimising software. A schematic representation of telematics-based DRT services<br />
is shown in Figure 7.<br />
Figure 7: Schematic representation of telematics-based DRT services<br />
DEMAND<br />
RESPONSIVE<br />
TRANSPORT<br />
(DRT) USER<br />
USER<br />
TRAVEL DISPATCH CENTRE (TDC)<br />
AUTOMATED<br />
BOOKING<br />
BOOKING,<br />
PLANNING<br />
AND<br />
DISPATCHING<br />
SYSTEM<br />
MANUAL<br />
BOOKING<br />
“SMART” BUS STOP<br />
MEETING<br />
POINT<br />
VEHICLE<br />
ON-BOARD UNIT (OBU)<br />
Source: Mageean and Nelson (2003)<br />
Booking the Journey<br />
Making the Journey<br />
21
Transport and Access to Health Care: The Potential of New Information Technology<br />
Final Report<br />
The TDC booking, planning and dispatching system can be a based on a single PC/server or<br />
multiple servers networked together via high-speed Local/Wide Area Network (LAN/WAN)<br />
connections. For example, the Northumberland TDC offering Phone & Go and Click & Go<br />
DRT services incorporates the existing Northumberland Journey Planner (a fixed routes<br />
database) into the new flexible route system (running Mobirouter). The so-called Intelligent<br />
Mobility Engine serves as the pivot, with additional external links to the VISUM traffic model<br />
database. As described further down below, the setup used in this demonstration uses a<br />
single PC workstation without external links to simulate the booking and planning<br />
procedures. The workstation acts both as server (i.e. database management, processing<br />
power) and client (mainly the user interface).<br />
The TDC software is usually based on digital mapping and address data (for example,<br />
Ordnance Survey TrafficMaster © and AddressPoint © ). The maps assist with locating<br />
addresses and seeing vehicle positions. The address database makes it easy to find<br />
addresses or post-codes. Depending on the application, the customer database contains<br />
customer details and requirements, which in some cases can be automatically sent to the<br />
driver. The TDC operator can define all kinds of demand-responsive services, including<br />
fixed, semi flexed, deviating fixed route or free route. In addition, the supply side is covered<br />
by a vehicle database consisting of those vehicles that are offering DRT services (e.g. minibuses,<br />
buses and taxis). Vehicle capacity and availability information are key parameters –<br />
in some cases service offerings such as wheelchair and bicycle rack can be defined and<br />
used to appropriately match users and vehicles.<br />
One of the main design features for the call centre software is to allow quick and efficient<br />
order taking and allocation of customers to vehicles with, for example, the facility to preregister<br />
customers and default journeys. DRT software has come a long way since first<br />
introduced to assist dial-a-ride operations. Today’s powerful hardware and database<br />
software environments have changed the scale, complexity and speed of Travel Dispatch<br />
Centre operations as seen in a range of case studies and supporting software features in<br />
Brand (2003). It is now possible to dynamically assign passengers to vehicles and optimise<br />
routes in real time – e.g. while the customer is on the (mobile) phone or on-line using an<br />
internet terminal at a hospital.<br />
The Final Report on Transport and Social Exclusion (ODPM, 2003) states that<br />
“The use of technology in Gothenburg [the FlexLine DRT service] to ensure a<br />
rapid demand-responsive service has few parallels in the UK”.<br />
However, as demonstrated in Brand (2003), there are many not few applications of modern<br />
telematics-based DRT services currently operating in the UK, many of which are operating<br />
MobiRouter as the software tool. This was one of the reasons why the project team chose<br />
MobiRouter for the following model of an alternative health care transport plan.<br />
4.3 The alternative model for transport provision<br />
The setup of the Mobirouter model demonstration is presented first, including data sources,<br />
service definitions, routes and schedules. This is followed by the results of trying to match<br />
passenger trips from the empirical survey (Section 3) to the developed DRT service supply.<br />
Last but not least, the model is discussed with regards to its viability and potential<br />
improvements.<br />
22
Transport and Access to Health Care: The Potential of New Information Technology<br />
Final Report<br />
4.3.1 Setup of the model demonstration<br />
Digital mapping<br />
The heart of Mobirouter is an Oracle database application running in so-called ‘clientserver<br />
mode’ – ‘client’ representing the dispatcher’s PC and ‘server’ a central PC holding the<br />
databases needed to run the operation (and likely linked to other databases and<br />
applications). This demonstration was developed on a single laptop PC, hence ‘server’ and<br />
‘client’ are represented by this one PC. 5<br />
The databases underlying this setup include digital maps, address data and so-called vector<br />
maps (consisting of location and direction information). Some of the mapping data were<br />
provided by the Department for Transport (New Horizons Programme and Statistics<br />
Division), including Ordnance Survey raster maps (1:50,000, 1:10,000) and AddressPoint ©<br />
location maps of every address in Oxfordshire. The road network vector maps were<br />
provided by Mobisoft (UK) Ltd for the purpose of this project. The latter are required to<br />
model road traffic and service routes. All in all, the Oxfordshire data fit on 3-4 CD ROMs and<br />
use about 3GB of hard disk space.<br />
Defining stops and service areas<br />
An important part of setting up flexible DRT services is the definition of stops and service<br />
areas. 6 In this demonstration, the two main stops were chosen to be the hospitals, with an<br />
additional stop representing a frequently visited surgery in Bicester (Figure 8).<br />
Figure 8: Stops and service areas defined in the demonstration<br />
5 In a real world application, the connection between the then separate machines would be an internetbased<br />
link (using IP connection).<br />
6 ‘Stops’ are obligatory call points for service vehicles. ‘Service areas’ define an area which vehicles<br />
may or may not service. In the latter, service vehicles deviate ‘on demand’ from the general service<br />
direction to pick up and drop off passengers.<br />
23
Transport and Access to Health Care: The Potential of New Information Technology<br />
Final Report<br />
Following consultation with the software provider, the service areas were defined as convex<br />
polygons. In terms of size and shape, the key criterion was to allow a vehicle to get from one<br />
end to the other in about 10 minutes time. The software’s ‘Range’ tool was used to design<br />
the convex area shapes as shown in an example in Figure 9. This tool visualises isochrones<br />
and isodistances around a central point such as a stop or area centre in three alternative<br />
shapes: spider, convex and non-convex. Figure 9 gives the 10-minute isochrones around<br />
Witney as a convex polygon shape (in black). Note the shape and size of an area varies<br />
according to the variations in geography and speed (or distance and time) of the underlying<br />
road network.<br />
Figure 9: Example of convex-shaped 10-minute isochrones around Witney (in black)<br />
Similarly, Figure 10 shows an example of spider-web shaped 10-minute isochrones (in dark<br />
blue) around the Oxford John Radcliffe hospital.<br />
Obviously, the ‘reach’ of the isochrones depends heavily on the road link speeds set in<br />
Mobirouter. The demonstration setup utilises 20 different road categories with speeds based<br />
on observed averages in non-congested conditions. Motorway and double carriageway<br />
speeds range from 65-80km/h; 60-65km/h for major ‘A’ roads; 40-55km/h for minor/rural ‘A/B’<br />
roads and 25-40km/h for local urban roads. The important feature is that the user can<br />
change the speeds by road category and time of day down to the level of hourly intervals.<br />
For example, the speed for ‘motorway category 10’ is, by default, 80km/h all day; this could<br />
be changed to, say, 70km/h for peak times 8-900 and 16-1800. Note junction delays cannot<br />
be modelled at present. One way around this would be to lower link speeds for links<br />
approaching a particular junction. In future applications, it might be worth varying speeds by<br />
time of day to simulate traffic conditions at, for example, peak and off-peak times. The<br />
resultant service areas are described in the following section on service definition.<br />
24
Transport and Access to Health Care: The Potential of New Information Technology<br />
Final Report<br />
Figure 10: Example of spider-web shaped 10-minute isochrones around the Oxford<br />
John Radcliffe hospital (in dark blue)<br />
Service definition: vehicles, routes, departures and schedules<br />
As mentioned in the Section 3, three main hospital trip demand ‘corridors’ were identified,<br />
with origins/destinations in the Banbury, Bicester and Witney areas. 7 services were<br />
developed with the aim to match this demand as completely as possible. These services are<br />
based around 3 service routes utilising a total of 7 minibuses (at capacity of 16 passengers<br />
each). In more detail, the 3 service routes are:<br />
1. Hospitals-Banbury-Hospitals: 3 overlapping service routes, taking 3h to complete the<br />
circle; departing at 700, 800, 900, … , 1800h, returning at 1000, 1100…2100h.<br />
2. Bicester Health Centre-Hospitals-Bicester Health Centre: 1 service route, taking 1.5h to<br />
complete the circle; departing at 730, 900, 1030, …, 1630, returning at 900, 1030…1800.<br />
3. Hospitals-Witney-Hospitals: three overlapping service routes, taking 3h to complete the<br />
circle; departing at 600, 700, 800, …, 1700, returning at 900, 1000, …, 2000.<br />
The 3 service routes are shown graphically in Figure 11, Figure 12 and Figure 13. The<br />
‘Routes and Schedules’ boxes on the left detail scheduled departure and arrival times at<br />
stops as well as deviation time windows for service areas. Note that the obligatory stops (in<br />
blue) have fixed departure and arrival times, sometimes extended to allow for delays due to<br />
traffic conditions (e.g. stop 1 John Radcliffe on the Banbury service route, Figure 11). In<br />
contrast, the semi-flexible nature of DRT services allows vehicles to deviate in or not service<br />
at all the defined service areas (also in blue), with time windows set for pick up or drop off ‘at<br />
the earliest’ and ‘at the latest’ time possible.<br />
25
Transport and Access to Health Care: The Potential of New Information Technology<br />
Final Report<br />
Figure 11: Definition of the Banbury corridor service route and schedules<br />
Figure 12: Definition of the Bicester corridor service route and schedules<br />
26
Transport and Access to Health Care: The Potential of New Information Technology<br />
Final Report<br />
Figure 13: Definition of the Witney corridor service route and schedules<br />
Route departure times and schedules are based on three main assessments:<br />
1. An assessment of likely round trip times using Mobirouter’s ‘Driving Route’ tool (see<br />
below for an example);<br />
2. The observed frequency and timings of trip demand data reported in the survey work<br />
(Rajé et al, 2003b); and<br />
3. Advice given by the external DRT consultant on service route frequency providing a<br />
trade-off between costs and successfully matching demand and supply. 7<br />
Figure 14 illustrates an example driving route (Bladon-Churchill Hospital Eynsham Post<br />
Office Botley Post Office, in purple), taking 45min to complete based on default road link<br />
speeds.<br />
It is worth pointing out at this stage that the geographical characteristics and timings of the<br />
service routes and schedules are a first attempt to provide an efficient demand responsive<br />
transport service for access to the hospitals. This is appropriate for a demonstration of the<br />
utilised DRT system and software. Further iterations would be required to make this a more<br />
efficient setup. Real world applications (e.g. Gloucestershire, Northumberland) have shown<br />
that timings have to be fine tuned on a regular basis, reflecting weekly and seasonal<br />
differences in demand patterns. Indeed, this flexible approach can be seen as one of the<br />
strengths of DRT services. In this case, it is most suitable for transport provision to health<br />
7 Without resource constraints, a service frequency of the maximum time window for bookings is<br />
desirable, e.g. a vehicle scheduled to depart every 20min (given a 20min time window for bookings).<br />
However, this is most likely not to be commercially feasible unless trip demand is relatively high (e.g.<br />
for combined patient, visitor and staff DRT services).<br />
27
Transport and Access to Health Care: The Potential of New Information Technology<br />
Final Report<br />
care services where weekly changes in appointment schedules cause variations in trip<br />
patterns to and from the hospitals.<br />
Figure 14: Example vehicle driving route utilising the Mobirouter ‘Driving Route’ tool<br />
The above services utilise a number of vehicles, which can be defined in a simple dialog box<br />
as shown in Figure 15. In this case, 7 identical minibuses were defined with a capacity of 16<br />
passengers each. Note the system allows for special conditions to be taken into account,<br />
e.g. wheelchair access. In addition, vehicle operating costs can be set in the dialog box<br />
(under the ‘Additional data’ tab), allowing the operator to assess likely DRT service operating<br />
costs.<br />
Figure 15: Vehicles dialog box showing ‘Minibus 3’ with a capacity of 16 passengers<br />
28
Transport and Access to Health Care: The Potential of New Information Technology<br />
Final Report<br />
4.3.2 Demonstration results – hospitals<br />
Once the model system was set up, the actual demonstration was performed, providing an<br />
insight into how successful the defined DRT services may be in improving accessibility to the<br />
hospitals. This involved ‘taking’ passenger orders and assigning the passengers to, if<br />
possible, an available vehicle on an evolving but not yet dispatched vehicle route. The<br />
following sections aim to clarify this process.<br />
Passenger orders<br />
For hospital trips, the 221 return passenger orders obtained in the survey work (Rajé et al,<br />
2003b, see also Section 3) were entered into the Mobirouter ‘Orders’ database for a chosen<br />
future date, the 1 st of February 2005. Note a return trip has to be entered as 2 single trips,<br />
making the total number of orders 442. The data needed for taking fresh orders is outlined in<br />
a screenshot in Figure 16. This includes:<br />
• Origin and destination postcodes and first lines of address (unless either of them are<br />
predefined stops such as the hospitals where the stop identifier is sufficient);<br />
• Earliest pick-up or latest drop-off times;<br />
• The desired time window (the default was 20min);<br />
• Any special requirements such as wheelchair access.<br />
Figure 16: Passenger order form showing example booking details (order No. 3344)<br />
and a grey arrow on the map representing the order<br />
The example order (Figure 16) shows a trip from the John Radcliffe Hospital in Oxford to an<br />
address in Banbury, represented by a grey arrow. The passenger left the hospital at 1000<br />
hours, hence requested an ‘earliest pick-up’ time of 1000 hours. The time window for the<br />
29
Transport and Access to Health Care: The Potential of New Information Technology<br />
Final Report<br />
booking was 20 minutes, making the ‘latest pick-up’ time at 1020 hours. At this stage, the<br />
system further calculates the likely arrival time window based on road link speeds (direct trip,<br />
no deviation), in this case between 1040 and 1100 hours. This helps the dispatcher to<br />
convey to the passenger (on the phone/mobile/online) the likely arrival time before confirming<br />
the booking. 8<br />
The choice of a single date for all collected orders raised the question how representative the<br />
total figure of 221 return trips and the trip pattern are compared to the likely demand for DRT<br />
services on a given day. This important point is discussed in the following Sections. For the<br />
purpose of this demonstration it was assumed that the total demand figure and trip pattern<br />
represent a typical day in the near future.<br />
FLEXing orders to vehicle routes<br />
Once an order is ‘taken’, the dispatcher uses the Mobirouter FLEX tool to try and get the<br />
passenger assigned to an open vehicle route only defined by obligatory stops and optional<br />
service areas. In this demonstration without real online communication to the passenger or<br />
the vehicle, this is simply done by clicking the FLEX button (or F10 key) in the ‘Orders’ dialog<br />
box (Figure 16). Three things can then happen:<br />
1. Mobirouter opens a new dialog box, implying that a number of possible routes that match<br />
the given criteria were found (Figure 17). This may be followed by:<br />
a. successfully choosing a suitable vehicle route by clicking OK, in which case the order<br />
has been assigned to a vehicle route. The Select FLEX form disappears and the<br />
order form now shows the vehicle ride of that order.<br />
b. an unsuccessful assignment due to timetable, route direction or vehicle capacity<br />
constraints, in which case the dispatcher can go back to the passenger, change the<br />
trip criteria and repeat the process until a successful assignment is achieved.<br />
2. Mobirouter cannot find a close enough match to predefined DRT services, indicating a<br />
mismatch of key selection criteria such as the time of day of the order not being near<br />
enough to the offered service times. No new dialog box appears.<br />
Figure 17: ‘Select FLEX’ dialog box, showing a possible service route<br />
Note in a real world application, this happens while the prospective passenger is on the<br />
telephone/mobile or online via an internet terminal (e.g. in a hospital). If (1.b) or (2.) occur,<br />
there is therefore the possibility to consult the passenger and change some of the booking<br />
criteria such as the booking time window and try to FLEX again. If this doesn’t work, the<br />
order can’t be taken. The point to make is that the speed and convenience of online<br />
8 Note no fares or costs were modelled in the Mobirouter part of the demonstration.<br />
30
Transport and Access to Health Care: The Potential of New Information Technology<br />
Final Report<br />
communications allow for a flexible approach to taking orders that is likely to increase<br />
ridership and hence service efficiency.<br />
For the purpose of this demonstration, the orders were put in order of time of day, starting<br />
with the first order at around 0200 hours and so on. Given that the first service starts at 0600<br />
hours, that first order was unsuccessfully assigned to a service route. However, a significant<br />
number of orders were successfully assigned during peak hours, i.e. 0900-1200 hours and<br />
1300-1600 hours, depending on the hospital.<br />
Overall, about 40% of the hospital orders were assigned to a service route within a 20-minute<br />
time window for this initial setup.<br />
To illustrate the ‘FLEXed’ vehicle routes, two examples are described below. The first<br />
example is shown in Figure 18 for one of the 3 Witney services. 9 This clearly shows<br />
passenger pick-ups and drop-offs along the way. It also shows that the vehicle does not<br />
serve all service areas defined for this service. For example, the vehicle does not go far<br />
beyond Witney on this route. 10 This demonstrates the semi-flexible nature of DRT: a mix of<br />
obligatory and optional stops and service areas.<br />
Figure 18: Example vehicle route No. 1356 showing passenger pick-ups and drop-offs<br />
along the way (route in black, orders in red or grey)<br />
9 The vehicle route with number 1356 is shown in black. Orders are shown as red or grey arrows.<br />
The 1300 hours pick-up of passenger 1049 is highlighted in the route stop list and also as a bold grey<br />
arrow on the map.<br />
10 It may do so in a real world application if a suitable order came in requesting, say, a drop-off near<br />
Burford. Of course, this would have to be requested before the vehicle is finally dispatched.<br />
31
Transport and Access to Health Care: The Potential of New Information Technology<br />
Final Report<br />
The picture is not entirely clear when assessing DRT journey time savings compared to<br />
actual journey times reported by the patients. For example in the case of ‘passenger 80’, the<br />
in-vehicle time from the John Radcliffe hospital back home is 35 minutes (on vehicle route<br />
1356, Figure 18), matching the reported journey time (Rajé et al, 2003b). ‘Passenger 209’<br />
would have spent 22 minutes on the same vehicle route from Eynsham to the John Radcliffe,<br />
compared to the reported 15 minutes in a car at off-peak times – the latter clearly a result of<br />
good direct access by car from the village to the hospital via the A40 and the ring road.<br />
‘Passengers 201’ and ‘204’ would have spent 90 and 59 minutes to and from Aston village<br />
on DRT, compared to significantly shorter journey times of 30 and 45 minutes reported in the<br />
survey. On the more positive side, 85-year old ‘passenger 62’ would have spent 7 minutes<br />
on DRT going from the John Radcliffe to Summertown, 23 minutes less than reported. All in<br />
all, there can be journey time savings, however not guaranteed, and it can take longer due to<br />
deviation at busy (DRT) times or simply due to the unfortunate service definition. The main<br />
point from the analysis though is that accessibility for non-car users and the elderly is greatly<br />
enhanced.<br />
The second example (Figure 19) shows one of the 3 Banbury services, indicating passenger<br />
pick-ups and drop-offs along the way. In this case, the vehicle does serve all service areas<br />
defined for this service. 11<br />
Figure 19: Example vehicle route No. 1417 showing passenger pick-ups and drop-offs<br />
along the way (route in black, no orders shown)<br />
11 For illustration, the 1657 hours drop-off in Banbury of passenger 177 is highlighted in the route stop<br />
list and on the map as a thin dark red arrow.<br />
32
Transport and Access to Health Care: The Potential of New Information Technology<br />
Final Report<br />
Again, the picture is not clear cut in terms of journey time savings. However, for non-car<br />
drivers or the elderly, the DRT service route to Banbury has significant accessibility benefits.<br />
4.3.3 Demonstration results – GP surgeries<br />
Passenger orders<br />
Similar to hospital orders, the 144 return passenger orders to/from GP surgeries collated in<br />
the survey work (Rajé et al, 2003b) were entered into the Mobirouter ‘Orders’ database,<br />
however for a different future date, the 2 nd of February 2005. Again, a return trip has to be<br />
entered as 2 single trips, making the total number of GP surgery orders 288. An overview of<br />
the orders is shown in Figure 5, while Figure 6 zooms in on the Woodstock-Tackley area.<br />
Different dates for hospitals and GP surgeries were chosen because of better separation in<br />
the system.<br />
FLEXing orders to vehicle routes<br />
As the focus of this work was on hospitals, the booking of passengers on semi-flexible DRT<br />
services is demonstrated here only briefly. The different date for orders means that this part<br />
of the demonstration is purely for GP surgery orders. A combined service supply was not<br />
tested but could be done in future work. Note the design of the DRT services was with<br />
hospital trips in mind (3 radial routes centred on the hospital stops). Therefore, GP surgery<br />
services may well require a completely different service pattern in terms of where and when.<br />
The default time window for surgery bookings was 10 minutes, reflecting shorter trip lengths<br />
and times. Again, the bookings were entered in order of time of day. As in this part there are<br />
no hospital bookings to “distract” the vehicles from GP surgery bookings, a similar ‘FLEX<br />
success rate’ of about 40% of entered orders was achieved.<br />
To illustrate the ‘FLEXed’ vehicle routes, an example is described below. In this<br />
demonstration, three Banbury services cover the GP surgeries between Oxford and Banbury,<br />
including the one in Woodstock. Figure 20 shows passenger pick-ups and drop-offs at home<br />
and surgeries (Kidlington, Woodstock, Banbury) along the way. The total route basically<br />
represents a series of mainly local pick-ups and drop-offs, in contrast to a somewhat different<br />
trip pattern in the hospitals case with longer trip distances.<br />
33
Transport and Access to Health Care: The Potential of New Information Technology<br />
Final Report<br />
Figure 20: Example vehicle route No. 1422 showing passenger pick-ups and drop-offs<br />
along the way (route in black, no orders shown)<br />
Zooming in on the Woodstock surgery area, the five trips from Tackley to the GP surgery en<br />
route back from Banbury suggest significant in-vehicle time savings compared to actual<br />
journey times reported by the patients. In this selected case, the passenger in-vehicle times<br />
from Tackley to Woodstock surgery range between 8 and 12 minutes, compared to a range<br />
between 10 and 40 minutes reported for the actual journeys (Rajé et al, 2003b). 12 A 10-<br />
minute journey time seems to be typical for reported car journeys, while the 40 minute end of<br />
the range corresponds to a public transport trip. Without going into detail, this holds true for<br />
other surgeries and/or origins with poor non-car transport accessibility.<br />
It is worth keeping in mind that many trips to/from surgeries are shorter than the Tackley-<br />
Woodstock trips, indeed within cycling or even walking distance for the reasonably fit.<br />
Therefore, the potential for DRT to offer a viable alternative or addition to the current<br />
transport system on surgery trip grounds alone may be limited.<br />
4.4 Potential impacts<br />
The potential benefits of telematics based DRT services have been covered elsewhere<br />
(Brand, 2003; Rajé et al, 2003a; Duffell, 2002). The likely impacts of implementing the DRT<br />
12 Given the door-to-door (taxi-like) service characteristics of DRT services, in-vehicle times and total<br />
journey times should not differ much at all, hence the comparison is appropriate and fair.<br />
34
Transport and Access to Health Care: The Potential of New Information Technology<br />
Final Report<br />
model presented above on both the hospital and those who experience difficulty accessing it<br />
are briefly discussed in this Section. The main potential impacts are:<br />
• Accessibility impacts for non-car drivers;<br />
• Accessibility impacts for the elderly;<br />
• Accessibility impacts for people with disabilities;<br />
• Effects of journey time savings for patients;<br />
• Benefits of lowering number of missed appointments by improving reliability of transport<br />
to hospital;<br />
• Journey cost savings.<br />
The main positive effect is the significantly improved accessibility for non-car drivers, the<br />
elderly and people with disabilities (although the latter could not be demonstrated). This is<br />
particularly true where access to public transport is poor. The hospitals are 2 miles away<br />
and up a steep hill from the main public transport hubs in the city centre, with fairly regular<br />
buses connecting to the city centre and the railway station. However, from almost anywhere<br />
else transfers (e.g. bus Summertown-City Centre .. walk .. bus City Centre-JR) and mode<br />
changes (e.g. car to P&R .. bus P&R-City Centre .. walk .. bus City Centre-JR) are required,<br />
resulting in poor non-car accessibility for most of the population in the study area. 13 The DRT<br />
services modelled here could potentially lessen this ‘accessibility gap’ by providing direct ondemand<br />
service, in particular for pre-registered non-car drivers, the elderly and people with<br />
disabilities. The latter potential is highlighted by the fact that of the 21 respondents<br />
registered disabled, 15 stated they would find DRT a useful or very useful addition/alternative<br />
(Rajé et al, 2003b).<br />
The effects on journey times can be profound, as the examples above show, however not<br />
always positive especially when compared to direct car journeys. 14 It may be argued that in<br />
terms of journey times comparing DRT with car trips is unfair, as the car taking direct nonstop<br />
routes should always be quicker than a deviating, multi pick-up and drop-off service,<br />
however efficiently it is run on dynamic demand and schedule. 15 So a comparison with public<br />
transport, community transport and other non-car modes is more appropriate, at least in<br />
service level terms. And here DRT fares particularly well, with likely benefits of lowering the<br />
significant number of missed appointments by improving reliability of transport to hospital.<br />
Journey cost savings may be possible, but this depends heavily on how prices are set and<br />
the achieved service take-up. This is discussed further in the following Section.<br />
4.5 Demand and cost estimate<br />
This Section seeks to address the crucial question of how representative the data collected<br />
above are in terms of a “typical” day of patient and visitor trips to the hospitals. Furthermore,<br />
a rough and ready cost estimate is made to give an idea of how much the DRT model may<br />
cost.<br />
13 Note the Oxford Bus Company’s X13 Express bus from Abingdon now goes direct to the John<br />
Radcliffe via the city centre in 43 minutes. However, Abingdon is outside the study area and is not<br />
included here.<br />
14 In this work, it was not attempted to assess the potential journey time savings for all the ‘booked’<br />
and FLEXed journeys due to resource constraints.<br />
15 When car parking charges (min. £2 for 1hr) and the time spent finding a car parking space (5-10min<br />
during busy times, i.e. daytime after 10am) are included, the car becomes less attractive. Yet most<br />
people with easy access to a car still perceive it as the best and often only viable option.<br />
35
Transport and Access to Health Care: The Potential of New Information Technology<br />
Final Report<br />
4.5.1 Demand<br />
Of the 221 hospital journeys entered 215 gave all necessary details suitable for further<br />
analysis. Of these 215, 125 were to the John Radcliffe, and 90 to the Churchill hospitals.<br />
The survey work revealed that 59 out of 215 respondents (27.4%) would find DRT ‘very<br />
useful’ and 97 would find it ‘useful OR very useful’ (45.1%) (Rajé et al, 2003b). Furthermore,<br />
19 out of 215 (8.8%) did not have access to a car, many of whom have to use more than one<br />
mode to get to the hospitals. This will include walking, waiting for public transport, transfer<br />
times between modes and perceived transfer penalties 16 .<br />
Travel plan survey work done by Steer Davies Gleave (SDG) for the Oxford Radcliffe<br />
Hospitals NHS Trust (ORH) in 2001 provides figures for patient and visitor frequencies. The<br />
average daily frequency for the John Radcliffe and the Churchill were estimated as 3,000<br />
and 1,060 patients and visitors per day, or 4,060 in total (SDG, 2001). Note this covers all<br />
destinations, i.e. more than this study. In fact, SDG (2001) report that 75% of that survey’s<br />
respondents came from the OX postcode areas.<br />
So how do these figures compare? We have covered 11 out of 17 OX postcode areas, or<br />
65% of all OX postcode areas. Assuming that each OX postcode area covers the same<br />
number of residents each, we have covered (75% * 65% =) 49.3% of the SDG study.<br />
Therefore, the basis for comparison in this exercise is assumed to be 2,000 patients and<br />
visitors per day. The 215 completed responses therefore amount to 10.8% of the estimated<br />
daily hospital patronage. This is slightly more than the share of respondents without access<br />
to a car (19 out of 215, or 8.8%) and substantially less than respondents’ ‘expression of<br />
interest’ for DRT (59 out of 215, or 27.4%).<br />
Given the uncertainty in estimating potential demand for DRT, and following discussion with<br />
the IT consultant to the project, we have assumed 3 demand scenarios that reflect the results<br />
of the discussion above. The CENTRAL market share for DRT is assumed to be 5% (100<br />
return trips per day), with LOW and HIGH market shares as 2.5% (50 return trips per day)<br />
and 7.5% (150 return trips), respectively. In light of what was discussed above and the<br />
evidence reported elsewhere (see e.g. Grosso et al, 2002; Jones, 2002; Rajé et al, 2003a;<br />
Brand, 2003), this range of demand figures appears to be a reasonable for the purpose of<br />
this demonstration. The implications are discussed further in the following Sections.<br />
4.5.2 Estimated lifetime costs of the demonstrated DRT model<br />
A simple spreadsheet model was developed to assess the feasibility of the model in terms of<br />
lifetime costs of the software based DRT services. This was done on the basis of net<br />
present value of costs and revenues. A range of demand market shares were chosen to<br />
conduct a limited sensitivity analysis, partly based on the data and analysis presented above.<br />
1. LOW demand = 2.5% market share, or (2.5% * 2,000 * 2 =) 100 single trips;<br />
2. CENTRAL demand = 5% market share, or (5% * 2,000 * 2 =) 200 single trips; and<br />
3. HIGH demand = 7.5% market share, or (7.5% * 2,000 * 2 =) 300 single trips.<br />
Assuming the 7 vehicles carry equal loadings on average, the number of passengers per day<br />
per vehicle can be derived as 14, 29 and 43 (rounded) for the LOW, CENTRAL and HIGH<br />
scenarios, respectively. While demand was analysed across this range, other input<br />
parameters stayed fixed as shown in Table 2. This includes the average cost per passenger<br />
trip of £5. The price per passenger will obviously depend on the pricing structure (flat or<br />
staged) and subsidy levels (as in most DRT services).<br />
16 Such a penalty is often simulated by adding a transfer penalty time/cost to the generalised time/cost<br />
of the journey.<br />
36
Transport and Access to Health Care: The Potential of New Information Technology<br />
Final Report<br />
The net present values of the investment and revenue over a 25 year period are shown in<br />
Table 3. A time series of the cumulative profit/loss is provided in Figure 21. See Appendix A<br />
for further details of the spreadsheet model.<br />
Table 2: Parameters underlying the feasibility cost analysis for the DRT model<br />
Description<br />
Value<br />
Number of vehicles 1 7<br />
Number of shifts per day 2<br />
Number of days per year 2 313<br />
Number of vehicles per dispatcher 10<br />
Number of vehicles per dispatcher with Internet booking 50<br />
Cost of driver £20,000<br />
Cost of dispatcher £20,000<br />
Discount rate 3.5%<br />
Scheduling system costs<br />
MobiRouter software £50,000<br />
Maintenance & support (p.a.) £7,500<br />
Internet booking (if applicable) £20,000<br />
Maintenance & support (p.a.) £4,000<br />
Dispatch centre and vehicle hardware £6,000<br />
Years to replacement 5<br />
Dispatch centre staff 1<br />
Vehicle costs<br />
Capital cost per vehicle £25000<br />
Years to replacement 6.25<br />
Fuel (diesel) cost per litre (net of BSOG, excl. VAT) 3<br />
30p<br />
Fuel efficiency (litres/100km) 4 12<br />
Fuel costs per km (pence/km) 4 3.6<br />
Mileage per vehicle per day (km) 5 200<br />
Office expenses (p.a.) £15000<br />
Income related<br />
Charge per passenger (average across network) £5<br />
Notes: 1 Equals the number of service routes. 2 Mon-Sat only. 3 Assuming the BSOG (Bus Service Operators<br />
Grant) is available for community bus transport, currently at 80% of duty. Fuel price = 21p; pre-VAT duty 47p;<br />
pre-VAT duty net of BSOG = 9.4p. 4 Based on combined driving cycle for typical 16-seater minibus. The smaller<br />
Ford Transit and VW Transporter consume 8 to 9 l/100km while urban buses consume 25-30l/100km (VCA, 2004;<br />
NAEI, 2002). 5 The daily mileage is based on an average of 4 round trips at 50km each.<br />
Table 3: Results of the financial analysis of the DRT model income and outgoings<br />
Demand scenario Demand per<br />
vehicle per day<br />
Income Outgoings Net Present<br />
Value<br />
LOW 14 1,428,236 -3,482,107 -2,053,872<br />
CENTRAL 29 2,958,488 -3,482,107 -523,619<br />
HIGH 43 4,386,724 -3,482,107 904,616<br />
37
Transport and Access to Health Care: The Potential of New Information Technology<br />
Final Report<br />
The results show that for LOW and CENTRAL demand, the system requires some kind of<br />
subsidy to be viable. For HIGH demand, the system is profitable. The ‘breakeven demand’<br />
is at 34.1 passengers per vehicle per day at £5 per passenger trip.<br />
Figure 21: Cumulative profit/loss by demand scenario (14-LOW, 29-CENTRAL, 43-<br />
HIGH; positive numbers are profit, negative loss)<br />
£3,000,000<br />
£2,000,000<br />
14<br />
29<br />
43<br />
£1,000,000<br />
£0<br />
-£1,000,000<br />
-£2,000,000<br />
-£3,000,000<br />
-£4,000,000<br />
-£5,000,000<br />
-£6,000,000<br />
4.6 Discussion<br />
Year1<br />
Year2<br />
Year3<br />
Year4<br />
Year5<br />
Year6<br />
Year7<br />
Year8<br />
Year9<br />
Year10<br />
Year11<br />
Year12<br />
Year13<br />
Year14<br />
Year15<br />
Year16<br />
Year17<br />
Year18<br />
Year19<br />
Year20<br />
Year21<br />
Year22<br />
Year23<br />
Year24<br />
Year25<br />
The model appears to be beneficial as well as viable based on the assumptions and<br />
definitions employed. This Section discusses some of the key issues raised during model<br />
development and testing.<br />
The average charge per passenger is somewhat arbitrary and was chosen here somewhere<br />
between bus and taxi charges. It lies well in the range of charges observed for existing DRT<br />
schemes in the UK (CfIT, 2002; Grosso et al, 2002; Brand, 2003). For example, the<br />
Commission for Integrated Transport (2002) reports heavy subsidies for flexible rural<br />
transport projects, ranging from £4.60 to £17.00 per passenger. If DRT services would<br />
replace some or all of the non-emergency PTS, this charge could arguably be lowered by a<br />
subsidy from the hospital trust or local authority.<br />
The range of demand market shares for DRT was assumed on the basis of results of the<br />
survey work and the most recent travel plan survey work by SDG (2001). The demand<br />
figures used are well within the usage figures reported by CfIT (2002), ranging from 10 to 51<br />
passengers per vehicle per day for flexible DRT services with similar service frequencies and<br />
daily coverage.<br />
38
Transport and Access to Health Care: The Potential of New Information Technology<br />
Final Report<br />
In addition, the demand figures developed in the previous Section are for hospital users only.<br />
It may be beneficial to combine demand and service supply with GP surgery demand.<br />
Although not thoroughly tested, the data collected suggests that there may well be a synergy<br />
between the two datasets (hospital and GP) that would provide more useful levels of demand<br />
than just the hospital data set on its own. In that way, it may be possible for services to<br />
operate via GP practices en-route to hospital and vice versa, allowing the GP practice to be a<br />
hub for some passengers while others are picked up at home (since many people report less<br />
difficulty getting to the GP than they do getting to the hospital). The limited demonstration of<br />
‘FLEXing’ GP surgery trips shed some light on this but it will require further work.<br />
There was probably insufficient time to really make the services efficient. The geographical<br />
characteristics and timings of the service routes and schedules are a first attempt to provide<br />
an efficient demand responsive transport service for access to the hospitals. This is<br />
appropriate for a demonstration of the utilised DRT system and software. Further iterations<br />
would be required to make this a more efficient setup. Real world applications (e.g.<br />
Gloucestershire, Northumberland) have shown that timings have to be fine tuned on a<br />
regular basis, reflecting weekly and seasonal differences in demand patterns. Indeed, this<br />
flexible approach can be seen as one of the strengths of DRT services. In this case, it is<br />
most suitable for transport provision to health care services where weekly changes in<br />
appointment schedules cause variations in trip patterns to and from the hospitals (Grosso et<br />
al, 2002).<br />
Furthermore, the flexibility of a powerful database system enables 'what ifs' to be tried easily.<br />
For example, service routes and schedules can be changed easily to accommodate changes<br />
in demand patterns. This could be useful for adapting to changes in clinic times for patients<br />
and visitors.<br />
The demonstration suggests that the Graphical Information Systems (GIS) interface gives an<br />
excellent mechanism for visualising the requirement. Note that in addition to the visualisation<br />
presented above, vehicle positions would show on screen in a real world application with<br />
General Packet Radio Service (GPRS) equipment fitted to the vehicle.<br />
A key further step would be to look at feeder services, perhaps to existing fixed route lines or<br />
new ones. This could involve developing the DRT services around the main public transport<br />
hubs (railway stations, bus terminals and stops on frequent routes) as well as private<br />
transport interchanges such as the P&R sites around Oxford City. All this could be modelled<br />
in the system presented here.<br />
39
Transport and Access to Health Care: The Potential of New Information Technology<br />
Final Report<br />
5 CONCLUSIONS AND OUTLOOK<br />
This research was specifically aimed at mapping the existing transport facilities supported by<br />
public agencies and the voluntary sector and mapping the transport services needed to<br />
enable people to access health care facilities in order to compare the existing provision with<br />
transport needs and develop a revised model for the provision of transport to improve<br />
access. In so doing, the research aimed to examine the potential for on-line communication<br />
and scheduling of travel and access to hospital and develop a demand responsive transport<br />
plan for a hospital trust.<br />
The study has determined the impact of implementing such a plan on both the hospital and<br />
those who experience difficulty accessing it. The introduction of the demand responsive<br />
option to the hospital travel discourse will also be relevant for staff travel and will, hopefully,<br />
be considered as one of the potential solutions to be considered in the traditional Green<br />
Travel Plan arena.<br />
Evidence in the public domain<br />
The first phase of the study concluded that there appears to be relatively little written about<br />
the links between transport and health care access. Recent policy review by the<br />
Government and bodies such as the NHS, Audit Commission and Social Exclusion Unit have<br />
started to refer to the concept of hospital and GP access in relation to transport issues. This<br />
research has built on these foundations and as a result defined a new model for health care<br />
provision that harnesses readily available technology to meet the needs of people who find<br />
access to health care services difficult at present.<br />
Existing provision and demand<br />
The second phase of the work concluded that travel to the John Radcliffe and Churchill<br />
hospitals is often difficult. For some the difficulties relate to the lack of suitable public<br />
transport services, while others report problems with congestion en route and parking at the<br />
hospitals themselves. As expected some people from rural locations reported difficulties but<br />
the problems described by residents of areas such as North and West Oxford and Bladon in<br />
accessing the hospitals by public transport were unanticipated.<br />
The transport and health profiles provided a good indication of the types of trips that local<br />
people may face and the questionnaire survey gave empirical evidence to support these<br />
findings.<br />
The work highlights that, for many, there is a call for a transport solution that is reliable,<br />
involves no interchange, precludes the need to rely on friends/relatives and provides door-todoor<br />
travel. Efficient and effective demand responsive transport can meet these needs. In<br />
addition, the empirical research reveals a peaked nature to demand. The demonstration of<br />
DRT services in the study area suggests that satisfying such demand through demand<br />
responsive transport solutions is feasible in both efficiency and cost terms.<br />
Telematics-based DRT systems<br />
DRT software has come a long way since first introduced to assist dial-a-ride operations.<br />
Today’s powerful hardware and database software environments have changed the scale,<br />
complexity and speed of Travel Dispatch Centre operations as seen in the case studies and<br />
supporting software features. It is now possible to dynamically assign passengers to<br />
vehicles and optimise routes in real time – e.g. while the customer is on the (mobile) phone<br />
or on-line using his/her own PDA or a public internet terminal at a hospital or GP surgery.<br />
40
Transport and Access to Health Care: The Potential of New Information Technology<br />
Final Report<br />
The software review showed that in contrast to what was said in the Final Report on<br />
Transport and Social Exclusion (ODPM, 2003) there are many not few applications of<br />
modern telematics based DRT services currently operating in the UK, many of which are<br />
operating MobiRouter as the software tool.<br />
The current 'movement' in Europe is to start linking DRT much more closely with taxis. The<br />
Dispatch Travel Centre could be the centralised transport services hub that starts to pull<br />
together many forms of transport (fixed PT, DRT, taxi, P&R bus etc), giving a truly integrated<br />
transport system (Duffell, 2002). The FAMS concept developed for the EC (DG INFOSCO),<br />
for example, enhances the service provision by developing a ‘virtual agency’ co-ordinating<br />
multiple transport resources (Finn, 2002). This is illustrated in Figure 22.<br />
Figure 22: Overview of the FAMS conceptual framework (Finn, 2002)<br />
Any future vision for transport must recognise the importance of remote communications and<br />
hand held devices. This is important for transport operators but even more crucial for the<br />
public. Arguably they will be using their Personal Digital Assistant (PDA)/Mobile phone (or<br />
whatever they get to be called) to book travel. A Travel Dispatch Centre with modern<br />
technology is key to this.<br />
‘An alternative plan’<br />
While there are other planning solutions to health care access problems such as the<br />
development of telemedicine, this work concentrated on the potential for demand responsive<br />
transport solutions to facilitate easier access. Hence the ‘alternative plan’ is the DRT model<br />
developed here. The Oxfordshire case has shown that the demand for patient and visitor<br />
transport to/from hospitals can partly be met by modern DRT services, overall improving the<br />
accessibility and efficiency of the transport system.<br />
The assumptions and definitions employed in the DRT model were developed based on<br />
current experience of setting up and running a telematics-based DRT system. However, the<br />
demonstration setup is only a first attempt to provide an efficient demand responsive<br />
41
Transport and Access to Health Care: The Potential of New Information Technology<br />
Final Report<br />
transport service for access to the hospitals. Further iterations would be required to make<br />
this a more efficient setup, with routes and schedules fine-tuned on a regular basis reflecting<br />
weekly and seasonal differences in demand patterns. This flexible approach can be seen as<br />
one of the strengths of DRT services, enabling 'what ifs' to be tried easily.<br />
The outcomes of the modelling exercise appear to be beneficial mainly in terms of<br />
accessibility improvements. It is also feasible in terms of cost and revenue. However, this<br />
depends heavily on demand forecasts and service pricing. The empirical evidence suggests<br />
that there is demand; to what extent this materialises in the case of model implementation<br />
remains to be seen. Prices depend on how the service would be financed: publicly, privately,<br />
or a mix of the two (e.g. PPP, quality contracts). One suggestion is to strip the Ambulance<br />
Services of their somewhat costly and inefficient responsibility to provide non-emergency<br />
PTS, which could be provided by DRT more efficiently and more cheaply.<br />
More detailed demand forecasting work will be required to make more reliable forecasts and<br />
answer questions such as:<br />
• How many car users may switch to DRT?<br />
• How many non-car users are likely to switch from public transport/taxi to DRT?<br />
• How much demand is latent, i.e. how many trips are currently not made due to<br />
accessibility problems that DRT could take up?<br />
A stochastic model (e.g. binary logit) or a deterministic model (switch to DRT if its<br />
generalised cost is less than that of the existing mode) could be developed in order to<br />
determine likely market shares of DRT vs. existing modes. The key issues of such a model<br />
are likely to be:<br />
• The value of time at the local level;<br />
• The dispersion parameter of the logit model;<br />
• The interchange penalty (usually 5 minutes on top of the actual time an interchange<br />
takes);<br />
• The level of escorting of family members 17 .<br />
This study never aimed to perform this type of analysis and forecasting. It would become<br />
important, however, if the local authorities and/or hospital trust would take the idea of DRT<br />
services in Oxfordshire any further.<br />
Given the demonstrative nature of the model, there was insufficient time for the level of<br />
iteration necessary to make the services truly efficient. Further work will be required to test<br />
the feasibility of closely linking any DRT services with existing public transport provision (as<br />
feeder services) and major private transport interchanges (e.g. P&R). Arguably DRT should<br />
not seek to replace efficient existing services such as taxis and bus services, but be<br />
supplementary and integrated, especially in areas and at times where existing provision is<br />
poor.<br />
It is worth stressing again that the above is a model and can be used by other organisations<br />
wishing to test out similar ideas. It's not meant to be definitive for the Oxfordshire case.<br />
17 Where somebody is being driven by a family member then it may very well be the real time cost<br />
calculation is the journey of the patient x 2. Reducing the level of escorting is a time saving which<br />
demand responsive transport can make but conventional public transport can not provide. The point<br />
to point character of the journey substitutes for the escort.<br />
42
Transport and Access to Health Care: The Potential of New Information Technology<br />
Final Report<br />
Last but not least, the model has the potential to introduce greater equity of transport access<br />
which in turn could contribute to the NHS’ founding principle of providing access to care to all<br />
on the basis of need (NHS, 2000).<br />
43
Transport and Access to Health Care: The Potential of New Information Technology<br />
Final Report<br />
ACKNOWLEDGEMENTS<br />
The authors would like to acknowledge the support of Mr Jeff Duffell (of Mobisoft, UK) in the<br />
work reported here. Mr Duffell mainly assisted in developing the technical side of developing<br />
the DRT model. The authors would also like to thank Mr David Edwards (of Radcliffe<br />
Hospitals NHS Trust), who supplied valuable data and expertise.<br />
REFERENCES<br />
Audit Commission (2001a) Improving Non-Emergency Patient Transport Services: A<br />
practical guide for managers. Audit Commission, London.<br />
Audit Commission (2001b) Going Places: Taking people to and from Education, Social<br />
Services and Health Care. Audit Commission, London.<br />
Bath and NE Somerset Council (undated) Transport to the Royal United Hospital Bath: Is<br />
there a Cure? Committee Paper:<br />
http://www.bathnes.gov.uk/Committee_papers/Council/co020411/09ZAppxBRUH.htm<br />
BBC (1999) £20m Boost for NHS Appointments System. BBC, Sept. 2 1999:<br />
http://news.bbc.co.uk/hi/english/health/newsid_435000/435986.stm<br />
Bentham, C.G. and Haynes, R.M. (1992). “Evaluation of a mobile branch surgery in a rural<br />
area”. Social Science Medicine 34, 1, 97–102.<br />
Brand, C. (2003) Transport and Access to Health Care: The Potential of New Information<br />
Technology, Report on Software Review. Transport Studies Unit, University of Oxford.<br />
CfIT (2001) European Best Practice in Delivering Integrated Transport, Key Findings.<br />
Commission for Integrated Transport (CfIT), London.<br />
CfIT (2002) Obtaining Best Value for Public Subsidy for the Bus Industry: Final Report. LEK<br />
Consulting LLP for the Commission for Integrated Transport (CfIT), London.<br />
Commission for Health Improvement (2002) Report on Mersey Regional Ambulance Service,<br />
NHS Trust Review Published. News Release 12 Nov 2002.<br />
CSIRO (2002) LITRES-2. Mathematical and Information Sciences Projects, September 2000.<br />
Commonwealth Scientific and Industrial Research Organisation (CSIRO):<br />
http://www.cmis.csiro.au/its/projects/litres2.htm.<br />
DETR (2000a) Transport 2010: the 10 year plan. DETR, London.<br />
DETR (2000b) Social Exclusion and the Provision and Availability of Public Transport.<br />
DETR, London.<br />
DH (2002) More NHS Patients to Benefit from Faster and More Convenient Appointments.<br />
Press Release 2002/0478, Nov 19, 2002.<br />
Duffell, J. (2002) “Journeys on Demand”. In Surveyor, 24 January.<br />
44
Transport and Access to Health Care: The Potential of New Information Technology<br />
Final Report<br />
Fearn, R.M.G., Haynes, R.M. and Bentham, C.G. (1984). “The role of branch surgeries in a<br />
rural area”. Journal of the Royal College of General Practitioners 34, 488–491.<br />
Finn, B. (2002) “FAMS – Demand Responsive Transport Systems: Possibilities of ITS”.<br />
INVETE Workshop, 16th May 2002.<br />
Grieco, M and Hine, J. (2002) Transport, Information Communication Technology and Public<br />
Service Failure: Community Monitoring and Demand Responsive Transport. Paper<br />
presented to National Science Foundation under auspices of STELLA network, Arlington,<br />
Virginia, January 2002.<br />
Grosso, S., Higgins, J., Mageean, J. and Nelson, J.D. (2002) “Demand Responsive<br />
Transport: Towards Best Practice in Rural Applications”. Proceedings of the European<br />
Transport Conference 2002, Association for European Transport, London.<br />
Hamilton, K and Gourlay, M (2002) Missed hospital appointments and transport. University<br />
of East London.<br />
Horn (2002) “Fleet scheduling and dispatching for demand-responsive passenger services”.<br />
Transportation Research Part C: Emerging Technologies, 10, 1, 35-63.<br />
Independent Research Solutions (2001) Barriers to Access to Essential Services. Office of<br />
the First Minister & Deputy First Minister, Belfast.<br />
Jones, M. (2002) Demanding Times, Community Transport, 21.2, 20-25, March/April.<br />
Lindtrom, S (1999) Demand Responsive Public Transport Services in Finland. Paper<br />
presented at “Strengthening the Transport Chain” Seminar, Gothenburg.<br />
Martin, D, Wrigley, H, Barnett, S and Roderick, P. (2002) “Increasing the sophistication of<br />
access measurement in a rural healthcare study”. Health and Place, 8, 1, 3-13.<br />
MORI (2002) What Patients Really Think of the NHS. KPMG Consulting, February 2002.<br />
NAEI (2002) Vehicle Speed Emission Factors (Version 02/3), UK National Atmospheric<br />
Emissions Inventory. AEA Technology, Culham.<br />
NHS (2000) The NHS Plan: A plan for investment, a plan for reform. NHS, London.<br />
Nelson, J.D. and Mageean, J.F. (Eds) (1999) Results of the Evaluation and Market<br />
Assessment of SAMPLUS Technologies, Telematics Application Programme Transport<br />
Sector Project TR3321 Contract Report No. 7.2, European Commission, Brussels.<br />
O’Donnell, C., McConnachie, A., Moffat, K., Drummond, N., Wilson, P. and Ross, S. (1999)<br />
“Cross sectional study of social variation in use of an out of hours patient transport services”.<br />
British Medical Journal, 318.<br />
ODPM (2003) Making the Connections: Final Report on Transport and Social Exclusion.<br />
Office of the Deputy Prime Minister (ODPM), London.<br />
Oxfordshire Health Authority (1999) Hospital Transport Plea to Patients. Press Release.<br />
Rajé, F., Brand, C., Preston, J. and Grieco, M. (2003a) Transport and Access to Health<br />
Care: The Potential of New Information Technology, Report on Literature Review. University<br />
of Oxford and Napier University (TSU Ref. 945).<br />
45
Transport and Access to Health Care: The Potential of New Information Technology<br />
Final Report<br />
Rajé, F., Brand, C., Preston, J. and Grieco, M. (2003b) Transport and Access to Health<br />
Care: The Potential of New Information Technology, Report on Transport and Health<br />
Profiles. University of Oxford and Napier University (TSU Ref. 952).<br />
Rushton, D. (2002) Difficulty in Accessing Key Services. Social Analysis and Reporting<br />
Division. Office for National Statistics.<br />
Schwartz, S. (2000) Demand Responsive Public Transport. Smogbusters, Brisbane.<br />
SDG (2001) Report to Travel Surveys for Oxford Radcliffe Hospitals. Steer Davies Gleave<br />
(SDG), London.<br />
Ståhl, A. (1999) Public Transport or Special Service or a Mix? Dept of Technology and<br />
Society, Lund University, Sweden.<br />
VCA (2004) New Car Fuel Consumption and Emissions Figures, online database. Vehicle<br />
Certification Agency, Bristol.<br />
Wakeman (1999) Access to health-care-services in remote areas. Regional Australia<br />
Summit, Canberra.<br />
GLOSSARY<br />
Term Description<br />
AVL Automated Vehicle Locationing<br />
CPU Central Processing Unit<br />
DDR Double Data Rate memory, a key part of any computer hardware<br />
DRT Demand Responsive Transport<br />
GIS Geographical Information Systems<br />
GPRS General Packet Radio Service<br />
GPS Geographical Positioning System<br />
IVRS Interactive Voice Response System<br />
LAN/WAN Local/Wide Area Network<br />
MB Megabyte, standard unit of memory and data storage<br />
PDA Personal Digital Assistant<br />
PTS (Non-emergency) Patient Transport Services<br />
TDC Travel Dispatch Centre<br />
VISUM Name of a traffic network model<br />
46
Transport and Access to Health Care: The Potential of New Information Technology<br />
Final Report<br />
APPENDIX A DRT SPREADSHEET MODEL<br />
47
Transport and Access to Health Care: The Potential of New Information Technology<br />
Final Report<br />
DRT business case spreadsheet model<br />
Number of vehicles 7 Demand per Income day per vehicle Outgoings NPV<br />
Number of shifts per day 2 14 1,428,236 - 3,482,107 - 2,053,872<br />
Number of passengers per day per vehicle (ave.) 35 29 2,958,488 - 3,482,107 - 523,619<br />
Charge per passenger (ave.) £5.00 43 4,386,724 - 3,482,107 904,616<br />
Number of days per year 313 Mon-Sat only (for £5 charge)<br />
Number of vehicles per dispatcher 10<br />
Number of vehicles per dispatcher with Internet booking 50<br />
Cost per vehicle £25,000<br />
Cost of driver £20,000<br />
Cost of dispatcher £20,000<br />
Fuel cost per km, net of BOSG, no VAT (£) £0.036<br />
Time horizon (years) 25<br />
Mileage per vehicle per day (km) 200<br />
Discount rate 3.5%<br />
Income 0 1 2 3 4 5 6 7 8 9<br />
Item Year1 Year2 Year3 Year4 Year5 Year6 Year7 Year8 Year9 Year10<br />
Income from fares £383,250 £383,250 £383,250 £383,250 £383,250 £383,250 £383,250 £383,250 £383,250 £383,250<br />
NPV +<br />
Total income £3,570,589 £383,250 £383,250 £383,250 £383,250 £383,250 £383,250 £383,250 £383,250 £383,250 £383,250<br />
Outgoings<br />
Scheduling system<br />
MobiRouter software 50000 2000 2000 2000 2000 2000 2000 2000 2000 2000 2000<br />
Maintenance & support (PA) 7500 7500 7500 7500 7500 7500 7500 7500 7500 7500 7500<br />
Internet booking 20000 0 800 800 800 800 800 800 800 800 800<br />
Maintenance & support (PA) 4000 0 4000 4000 4000 4000 4000 4000 4000 4000 4000<br />
Dispatch centre and vehicle hardware 6000 1200 1200 1200 1200 1200 1200 1200 1200 1200 1200<br />
Years to replacement (hardware) 5<br />
Vehicles<br />
Capital cost £175,000 28000 28000 28000 28000 28000 28000 28000 28000 28000 28000<br />
Years to replacement 6.25<br />
Fuel cost (net of BOSG, no VAT, in £) 15768 15768 15768 15768 15768 15768 15768 15768 15768 15768<br />
Office expenses 15000 15000 15000 15000 15000 15000 15000 15000 15000 15000<br />
People costs<br />
Drivers £280,000 £280,000 £280,000 £280,000 £280,000 £280,000 £280,000 £280,000 £280,000 £280,000<br />
Dispatch centre staff 1 £20,000 £20,000 £20,000 £20,000 £20,000 £20,000 £20,000 £20,000 £20,000 £20,000<br />
NPV -<br />
Total outgoings -£3,482,107 £369,468 £374,268 £374,268 £374,268 £374,268 £374,268 £374,268 £374,268 £374,268 £374,268<br />
Total NPV<br />
Total income - outgoings £88,482 £13,782 £8,982 £8,982 £8,982 £8,982 £8,982 £8,982 £8,982 £8,982 £8,982<br />
Note: only the years 1 to 10 are shown for layout reasons; the sheet extends to year 25.<br />
48
Transport and Access to Health Care: The Potential of New Information Technology<br />
Final Report<br />
49