


You also want an ePaper? Increase the reach of your titles
YUMPU automatically turns print PDFs into web optimized ePapers that Google loves.
THE 100-BAGGERS OF THE LAST 50 YEARS 57<br />
1996<br />
1997<br />
1998<br />
1999<br />
2000<br />
2001<br />
2002<br />
Sales<br />
Growth (%)<br />
$15.75<br />
$148<br />
838.06%<br />
$609<br />
312.30%<br />
$1,639<br />
189.13%<br />
$2,761<br />
68.45%<br />
$3,122<br />
13.07%<br />
$3,933<br />
25.98%<br />
Operating Income<br />
Operating Income (%)<br />
-6<br />
-38.10%<br />
-32<br />
-21.66%<br />
-109<br />
-17.90%<br />
-605<br />
-36.91%<br />
-863<br />
-31.26%<br />
-412<br />
-13.20%<br />
64<br />
1.63%<br />
Plus: R&D<br />
Adj. EBIT<br />
Adj. Operating Income (%)<br />
2<br />
-4<br />
-25.40%<br />
13<br />
-19<br />
-12.86%<br />
46<br />
-63<br />
-10.34%<br />
159<br />
-446<br />
-27.21%<br />
269<br />
-594<br />
-21.51%<br />
241<br />
-171<br />
-5.46%<br />
215<br />
279<br />
-7.09%<br />
2003<br />
2004<br />
2005<br />
2006<br />
2007<br />
2008<br />
2009<br />
Sales<br />
Growth (%)<br />
$5,264<br />
33.84%<br />
$6,921<br />
31.48%<br />
$8,490<br />
22.87%<br />
$10,711<br />
26.18%<br />
$14,835<br />
38.50%<br />
$19,166<br />
29.19%<br />
$24,509<br />
27.88%<br />
Operating Income<br />
Operating Income (%)<br />
270<br />
5.13%<br />
440<br />
6.36%<br />
432<br />
5.09%<br />
389<br />
3.63%<br />
655<br />
4.42%<br />
842<br />
4.39%<br />
1129<br />
4.61%<br />
Plus: R&D<br />
Adj. EBIT<br />
Adj. Operating Income (%)<br />
257<br />
527<br />
10.01%<br />
263<br />
723<br />
10.45%<br />
451<br />
883<br />
10.40%<br />
662<br />
10.51<br />
9.81%<br />
818<br />
1473<br />
9.93%<br />
1033<br />
1875<br />
9.78%<br />
1240<br />
2369<br />
9.67%<br />
2010<br />
2011<br />
2012<br />
2013<br />
2014<br />
Sales<br />
Growth (%)<br />
$34,384<br />
40.29%<br />
$48,077<br />
39.82%<br />
$61,093<br />
27.07%<br />
$74,452<br />
21.87%<br />
$88,968<br />
19.52%<br />
Operating Income<br />
Operating Income (%)<br />
1406<br />
4.09%<br />
862<br />
1.79%<br />
676<br />
1.11%<br />
745<br />
1.00%<br />
178<br />
0.20%<br />
Plus: R&D<br />
Adj. EBIT<br />
Adj. Operating Income (%)<br />
1734<br />
3140<br />
9.13%<br />
2909<br />
3771<br />
7.81%<br />
4564<br />
5240<br />
8.58%<br />
6585<br />
7310<br />
9.82%<br />
9275<br />
9453<br />
10.62%<br />
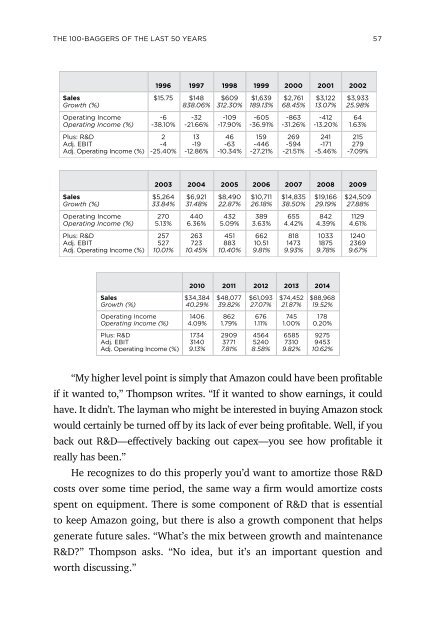
“My higher level point is simply that Amazon could have been profitable<br />
if it wanted to,” Thompson writes. “If it wanted to show earnings, it could<br />
have. It didn’t. The layman who might be interested in buying Amazon stock<br />
would certainly be turned off by its lack of ever being profitable. Well, if you<br />
back out R&D—effectively backing out capex—you see how profitable it<br />
really has been.”<br />
He recognizes to do this properly you’d want to amortize those R&D<br />
costs over some time period, the same way a firm would amortize costs<br />
spent on equipment. There is some component of R&D that is essential<br />
to keep Amazon going, but there is also a growth component that helps<br />
generate future sales. “What’s the mix between growth and maintenance<br />
R&D?” Thompson asks. “No idea, but it’s an important question and<br />
worth discussing.”