Total telecom spending over the last ten years - InfoCom
Total telecom spending over the last ten years - InfoCom
Total telecom spending over the last ten years - InfoCom

You also want an ePaper? Increase the reach of your titles
YUMPU automatically turns print PDFs into web optimized ePapers that Google loves.
T E L E C O M S S T R A T E G I E S & T R E N D S<br />
Strategic analyses inside <strong>the</strong> world of <strong>telecom</strong>s ISSUE: 2007/1 16 FEB. 2007<br />
Reference data for this article are extract-<br />
ed from Teleseeq, <strong>InfoCom</strong>'s market intel-<br />
ligence solution, available online.<br />
Teleseeq provides fundamental market<br />
data for <strong>the</strong> multi-media and <strong>telecom</strong>s<br />
industry in four categories: equipment<br />
markets, service markets, companies’ key<br />
figures and socio-economic data.<br />
For any question regarding <strong>the</strong> con<strong>ten</strong>t of<br />
this article, please do not hesitate to con-<br />
tact Rosa Eslava at eslava@infocom-<br />
de.com (free service available to TS&T<br />
subscribers).<br />
Rotebühlplatz 21, 70178 Stuttgart, Germany<br />
Tel: +49 (0) 711 87 05 10-0<br />
Fax: +49 (0) 711 87 05 10-10<br />
web site: www.infocom-de.com<br />
e-mail: mail@infocom-de.com<br />
With affiliates and partners operating in France,<br />
in <strong>the</strong> Philippines, in <strong>the</strong> UK and in <strong>the</strong> USA.<br />
Publishing Manager: Thomas Franz<br />
Editorial Board: Cristina Bardelli, Michael<br />
Federmann, Solène Figueiredo, Etienne<br />
Grange, Gaby Konzelmann, Abigail Rivadelo<br />
and Katrina Yap<br />
Quotation Permitted — Reproduction<br />
Prohibited<br />
Telecoms Strategies & Trends<br />
ISSN 1464-3480<br />
is a bi-weekly publication available on-line<br />
at € 1355 per annum.<br />
A strategy e-journal published by <strong>InfoCom</strong><br />
<strong>Total</strong> <strong>telecom</strong> <strong>spending</strong> <strong>over</strong> <strong>the</strong><br />
<strong>last</strong> <strong>ten</strong> <strong>years</strong><br />
The present article looks at <strong>telecom</strong> <strong>spending</strong> as a share of GDP and per inhabitant<br />
for a selection of countries <strong>over</strong> <strong>the</strong> <strong>last</strong> <strong>ten</strong> <strong>years</strong>. In a second step it also<br />
analyses <strong>the</strong> breakdown of <strong>telecom</strong> <strong>spending</strong> between <strong>the</strong> various sectors.<br />
Telecom services such as paging, telex or telegraph are not considered as <strong>the</strong>y<br />
have been accounting for a small and declining proportion of <strong>telecom</strong> budgets<br />
<strong>over</strong> <strong>the</strong> <strong>last</strong> <strong>years</strong>. <strong>Total</strong> <strong>telecom</strong> <strong>spending</strong> thus comprises fixed telephony,<br />
mobile telephony, data communications (which includes cable modem and DSL<br />
as well as X.25, ATM, Frame Relay, leased lines and VPNs), CaTV and Internet<br />
access services. In addition, because it is of<strong>ten</strong> very difficult to have a precise<br />
and significant division between residential and business revenues, only total<br />
<strong>spending</strong> will be considered — both business and residential included. The 2005<br />
exchange rate between US dollars and <strong>the</strong> local currencies has been used for all<br />
<strong>years</strong>.<br />
Telecom <strong>spending</strong> as share of GDP<br />
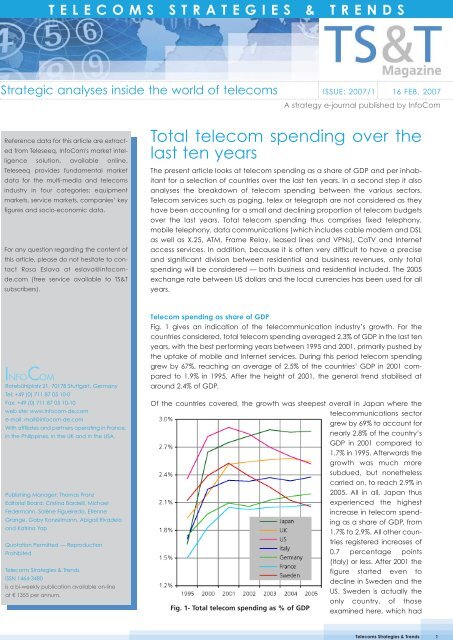
Fig. 1 gives an indication of <strong>the</strong> <strong>telecom</strong>munication industry’s growth. For <strong>the</strong><br />
countries considered, total <strong>telecom</strong> <strong>spending</strong> averaged 2.3% of GDP in <strong>the</strong> <strong>last</strong> <strong>ten</strong><br />
<strong>years</strong>, with <strong>the</strong> best performing <strong>years</strong> between 1995 and 2001, primarily pushed by<br />
<strong>the</strong> uptake of mobile and Internet services. During this period <strong>telecom</strong> <strong>spending</strong><br />
grew by 67%, reaching an average of 2.5% of <strong>the</strong> countries’ GDP in 2001 compared<br />
to 1.9% in 1995. After <strong>the</strong> height of 2001, <strong>the</strong> general trend stabilised at<br />
around 2.4% of GDP.<br />
Of <strong>the</strong> countries c<strong>over</strong>ed, <strong>the</strong> growth was steepest <strong>over</strong>all in Japan where <strong>the</strong><br />
<strong>telecom</strong>munications sector<br />
grew by 69% to account for<br />
nearly 2.8% of <strong>the</strong> country’s<br />
GDP in 2001 compared to<br />
1.7% in 1995. Afterwards <strong>the</strong><br />
growth was much more<br />
subdued, but none<strong>the</strong>less<br />
carried on, to reach 2.9% in<br />
2005. All in all, Japan thus<br />
experienced <strong>the</strong> highest<br />
increase in <strong>telecom</strong> <strong>spending</strong><br />
as a share of GDP, from<br />
1.7% to 2.9%. All o<strong>the</strong>r countries<br />
registered increases of<br />
0.7 percentage points<br />
(Italy) or less. After 2001 <strong>the</strong><br />
figure started even to<br />
decline in Sweden and <strong>the</strong><br />
US. Sweden is actually <strong>the</strong><br />
only country, of those<br />
Fig. 1- <strong>Total</strong> <strong>telecom</strong> <strong>spending</strong> as % of GDP<br />
examined here, which had<br />
Telecoms Strategies & Trends<br />
1
2<br />
a somewhat lower share in 2005 (2.06%) as compared<br />
to 1995 (2.12%). This can be explained by <strong>the</strong> fact that<br />
Sweden was already in 1995 an advanced country in<br />
terms of <strong>telecom</strong>munications usage, as regards fixed<br />
but also mobile and datacom services, with in addition<br />
relatively low prices as <strong>the</strong> market had already been<br />
liberalised.<br />
Telecom <strong>spending</strong> per inhabitant<br />
Of <strong>the</strong> countries selected, monthly <strong>telecom</strong> <strong>spending</strong><br />
in 1995 started at an average of $41 per inhabitant<br />
and grew by 75% to an average of $72 in 2005. Over<br />
<strong>the</strong> <strong>years</strong>, <strong>telecom</strong> <strong>spending</strong> per inhabitant grew at a<br />
compounded rate of 6%, whereby on average <strong>the</strong><br />
growth was much faster between 1995 and 2000 than<br />
between 2000 and 2005. What is also striking on Fig. 2<br />
is that, as Japan and <strong>the</strong> US have a much higher GDP<br />
per inhabitant than <strong>the</strong> rest of <strong>the</strong> countries and, as<br />
seen in Fig. 1, a high share of GDP accounted for by<br />
<strong>telecom</strong> <strong>spending</strong>, <strong>the</strong>y consequently have a much<br />
higher <strong>telecom</strong> <strong>spending</strong> per inhabitant than <strong>the</strong><br />
o<strong>the</strong>r, Western European, countries. Even <strong>the</strong> UK, <strong>the</strong><br />
Western European country with <strong>the</strong> highest <strong>spending</strong>,<br />
has a <strong>spending</strong> 10% lower than Japan in 2005, i.e. $77<br />
compared to $86.<br />
Italy experienced <strong>over</strong> <strong>the</strong> <strong>ten</strong>-year period <strong>the</strong> fastest<br />
growth, 130%, in monthly <strong>telecom</strong> <strong>spending</strong> per inhabitant<br />
<strong>over</strong>all, whereby growth was much stronger<br />
between 1995 and 2000 than afterwards. Italy benefited<br />
in particular from early and very strong growth in<br />
<strong>the</strong> mobile sector, without losing too much on <strong>the</strong> fixed<br />
sector. The UK had <strong>the</strong> second highest <strong>over</strong>all growth,<br />
but unlike in Italy it was nearly as strong between 2000<br />
and 2005 as before. Indeed between 2000 and 2005<br />
<strong>the</strong> UK had by far <strong>the</strong> highest growth of <strong>the</strong> countries<br />
examined here. On <strong>the</strong> o<strong>the</strong>r hand, Germany and<br />
Sweden had <strong>the</strong> slowest growth <strong>over</strong> <strong>the</strong> <strong>ten</strong>-year peri-<br />
Fig. 2- <strong>Total</strong> monthly <strong>telecom</strong> <strong>spending</strong> per inhabitant<br />
in dollars<br />
Telecoms Strategies & Trends • Issue 2007/1 - 16 FEB. 2007 © <strong>InfoCom</strong><br />
od, whereby for Sweden this was mainly due to recent<br />
<strong>years</strong>, whereas Germany experienced relatively low<br />
growth in both periods in part due to heavy price battles.<br />
Sweden is indeed <strong>the</strong> only country with a lower<br />
<strong>spending</strong> per inhabitant in 2005 than in 2001, and not<br />
much higher than in 2000.<br />
Telecom <strong>spending</strong> per sector<br />
Breakdown by sector is presented below for Japan,<br />
<strong>the</strong> US, Germany and Sweden. As a general trend, <strong>the</strong><br />
steady uptake of mobile communications and datacom<br />
and Internet services compensated for <strong>the</strong><br />
decline of expenditure on fixed telephony services.<br />
Aside from <strong>the</strong> introduction of new mobile services<br />
and technologies, increase in competition in <strong>the</strong>se<br />
markets resulted in decreasing prices, which led to <strong>the</strong><br />
decline or stability in average monthly <strong>spending</strong>, in<br />
particular after 2000.<br />
USA<br />
In <strong>the</strong> US (Fig. 3) mobile services <strong>spending</strong> per inhabitant<br />
grew <strong>the</strong> fastest between 1995 and 2005, closely<br />
followed by datacom services. CaTV services<br />
remained stable at around 10-11% while Internet services<br />
also grew strongly, although more moderately<br />
since 2001. In <strong>the</strong> meantime fixed telephony declined,<br />
so that at <strong>the</strong> end of 2005, fixed and mobile services<br />
accounted for nearly an equal share of an inhabitant’s<br />
monthly <strong>telecom</strong> budget. In <strong>the</strong> US, although<br />
fixed line services experienced a declining share, it<br />
was not as drastic and not as early as in o<strong>the</strong>r countries<br />
where mobile telephony and in particular fixed-mobile<br />
substitution became popular earlier. In fact, mobile<br />
telephony did not grow as early and as fast as in o<strong>the</strong>r<br />
countries partly because of non-homogenous mobile<br />
networks and higher pricing. Consequently, of <strong>the</strong><br />
Fig. 3- <strong>Total</strong> monthly <strong>telecom</strong> <strong>spending</strong> per inhabitant<br />
in <strong>the</strong> US (dollars) – breakdown per sector
countries presented, <strong>the</strong> highest <strong>spending</strong> on fixed line<br />
services has been in <strong>the</strong> US. Mobile penetration has<br />
however been increasing in <strong>the</strong> <strong>last</strong> five <strong>years</strong> and<br />
<strong>spending</strong> on mobile services should exceed fixed telephony<br />
for 2006. Of <strong>the</strong> countries observed, <strong>the</strong> US has<br />
also by far <strong>the</strong> highest <strong>spending</strong> (in absolute terms and<br />
as a share of <strong>the</strong> total) for CaTV and Internet.<br />
Japan<br />
In Japan as well mobile services recorded <strong>the</strong><br />
strongest growth, fairly closely followed by datacom<br />
and CaTV (Fig. 4). In particular after 2000 did datacom<br />
and CaTV <strong>spending</strong> increase. Mainly because of<br />
mobile growth, fixed telephony declined, so that 47%<br />
of <strong>the</strong> <strong>spending</strong> was on mobile services compared to<br />
28% for fixed line telephony in 2005. Japan has been<br />
one of <strong>the</strong> early leading nations as regards mobile<br />
telephony, so that fixed telephony decline was<br />
already particular strong between 1995 and 2000. In<br />
2000, Japan average <strong>spending</strong> per inhabitant for<br />
mobile services was indeed <strong>the</strong> highest, with $35, and<br />
more than twice as high as in <strong>the</strong> US. Since <strong>the</strong>n <strong>the</strong><br />
gap has declined but Japan has still by far <strong>the</strong> highest<br />
<strong>spending</strong> on mobile services (in absolute terms and as<br />
a share of <strong>the</strong> total) of <strong>the</strong> countries examined, also<br />
due to <strong>the</strong> fact that mobile data services (Internet, TV,<br />
videos, games etc.) are much more popular <strong>the</strong>re<br />
than in <strong>the</strong> US or Western Europe. Japan has on <strong>the</strong><br />
o<strong>the</strong>r hand <strong>the</strong> lowest <strong>spending</strong> on Internet services.<br />
Germany<br />
In Germany, mobile services and datacom, and to a<br />
lower ex<strong>ten</strong>t Internet services, fuelled <strong>the</strong> growth in<br />
<strong>telecom</strong> <strong>spending</strong>. Mobile services have grown by a<br />
compounded rate of 21% in 10 <strong>years</strong>, while datacom<br />
Fig. 4- <strong>Total</strong> monthly <strong>telecom</strong> <strong>spending</strong> per inhabitant<br />
in Japan (dollars) – Breakdown per sector<br />
grew by 17%. Fixed line <strong>spending</strong> decreased by 4% on<br />
average per year, particularly in <strong>the</strong> <strong>years</strong> between<br />
1995 and 2000. Fixed telephony <strong>spending</strong> decreased<br />
because of competition leading to lower prices as well<br />
as because of fixed-mobile substitution. It is however<br />
only in 2005 that mobile <strong>spending</strong> exceeded for <strong>the</strong><br />
first time fixed telephony. Germany has also <strong>the</strong> highest<br />
share of datacom <strong>spending</strong> of <strong>the</strong> four countries.<br />
Sweden<br />
In Sweden, mobile services grew strongly until 2000,<br />
slowing down afterwards. Indeed, in 2004, as <strong>the</strong> market<br />
was already completely saturated, <strong>the</strong> usage levels<br />
very high and <strong>the</strong> prices decreasing, mobile <strong>spending</strong><br />
per inhabitant actually slightly decreased, before<br />
increasing again a little in 2005. CaTV <strong>spending</strong><br />
increased <strong>the</strong> fastest after mobile services, but is still<br />
<strong>the</strong> lowest of all sectors, albeit not far below Internet<br />
<strong>spending</strong>. Interestingly for a country very much seen as<br />
a leader in terms of mobile telephony, fixed telephony<br />
still accounted for <strong>the</strong> largest share in 2005, 39% compared<br />
to 37% for mobile services. Fixed telephony did<br />
decline <strong>over</strong> <strong>the</strong> period, but not as strongly as in o<strong>the</strong>r<br />
countries, since usage levels for fixed telephony have<br />
always been high in Sweden and since liberalisation<br />
and related price decreases also happened fairly<br />
early on, so that <strong>spending</strong> of fixed telephony was<br />
already fairly low in 1995.<br />
Outlook<br />
A conclusion to draw from <strong>the</strong>se examples is that it is<br />
risky to make forecasts of one <strong>telecom</strong> sector in isolation<br />
of <strong>the</strong> o<strong>the</strong>rs, in particular when <strong>the</strong> different sectors<br />
offer similar services and benefits to po<strong>ten</strong>tial users.<br />
Indeed, from <strong>the</strong> analysis of <strong>the</strong> <strong>last</strong> <strong>ten</strong> <strong>years</strong>, it can be<br />
seen that any sudden and large increase in <strong>telecom</strong><br />
Fig. 5- <strong>Total</strong> monthly <strong>telecom</strong> <strong>spending</strong> per inhabitant<br />
hold in Germany (dollars) – Breakdown per sector<br />
Telecoms Strategies & Trends • Issue 2007/1 - 16 FEB. 2007 © <strong>InfoCom</strong><br />
3
4<br />
Fig. 6- <strong>Total</strong> monthly <strong>telecom</strong> <strong>spending</strong> per inhabitant<br />
in Sweden (dollars) -– Breakdown per sector<br />
<strong>spending</strong> as a share of GDP or per inhabitant simply<br />
did not happen: an extra 1.2 percentage points in <strong>ten</strong><br />
<strong>years</strong> for Italy is <strong>the</strong> maximum observed, or a maximum<br />
of 0.3 percentage point increase in a single year. For<br />
instance, in <strong>the</strong> US, <strong>the</strong> growth of mobile telephony<br />
was also slowed down by <strong>the</strong> o<strong>the</strong>r sectors’ growth<br />
such as <strong>the</strong> initial success of paging. In addition, if new<br />
services do not imply new communications possibilities,<br />
<strong>the</strong> growth for one sector will be mainly fuelled by<br />
<strong>the</strong> loss of <strong>the</strong> o<strong>the</strong>rs.<br />
For instance, mobile telephony also grew to a great<br />
ex<strong>ten</strong>t at <strong>the</strong> expense of fixed telephony, even if some<br />
real usage increase for telephony <strong>over</strong>all also did take<br />
place. This is important when for instance now considering<br />
<strong>the</strong> po<strong>ten</strong>tial of “new” services such as mobile<br />
data or IPTV to name only two. If <strong>the</strong>se services may<br />
indeed lead to higher <strong>telecom</strong> usage and <strong>spending</strong><br />
<strong>over</strong>all, a significant share of <strong>the</strong>ir growth will none<strong>the</strong>less<br />
come from substitution i.e. lower usage for fixed<br />
data services (e.g. lower fixed Internet usage in favour<br />
of mobile Internet) or lower usage of traditional TV services<br />
(terrestrial or via cable or satellite) in favour of<br />
IPTV. In effect consumers have both a limited time and<br />
financial budget and it <strong>the</strong>refore cannot be expected<br />
that <strong>spending</strong> for all <strong>telecom</strong> services and applications<br />
grows at <strong>the</strong> same time, bearing in mind that o<strong>the</strong>r<br />
sectors (tourism, sports etc.) are also competing for <strong>the</strong><br />
same time and budget. Finally, trends towards FMC<br />
and triple or quadruple play should lead to price<br />
reductions <strong>over</strong>all <strong>the</strong>refore putting pressure on <strong>telecom</strong><br />
<strong>spending</strong> <strong>over</strong>all, which should <strong>the</strong>refore<br />
increase only moderately <strong>over</strong> <strong>the</strong> coming <strong>years</strong>.<br />
Quotation Permitted - Reproduction Prohibited
T E L E C O M S S T R A T E G I E S & T R E N D S<br />
Strategic analyses inside <strong>the</strong> world of <strong>telecom</strong>s ISSUE: 2007/2 15 MAY 2007<br />
Reference data for this article are extracted<br />
from Teleseeq, <strong>InfoCom</strong>'s market intelligence<br />
solution, available online.<br />
Teleseeq provides fundamental market<br />
data for <strong>the</strong> multi-media and <strong>telecom</strong>s<br />
industry in four categories: equipment<br />
markets, service markets, companies’ key<br />
figures and socio-economic data.<br />
For any question regarding <strong>the</strong> con<strong>ten</strong>t of<br />
this article, please do not hesitate to contact<br />
Rosa Eslava at eslava@infocomde.com<br />
(free service available to TS&T<br />
subscribers).<br />
Rotebühlplatz 21, 70178 Stuttgart, Germany<br />
Tel: +49 (0) 711 87 05 10-0<br />
Fax: +49 (0) 711 87 05 10-10<br />
web site: www.infocom-de.com<br />
e-mail: mail@infocom-de.com<br />
With affiliates and partners operating in France,<br />
in <strong>the</strong> Philippines, in <strong>the</strong> UK and in <strong>the</strong> USA.<br />
Publishing Manager: Thomas Franz<br />
Editorial Board: Cristina Bardelli, Michael<br />
Federmann, Solène Figueiredo, Etienne<br />
Grange, Gaby Konzelmann, Abigail Rivadelo<br />
and Katrina Yap<br />
Quotation Permitted — Reproduction<br />
Prohibited<br />
Telecoms Strategies & Trends<br />
ISSN 1464-3480<br />
is a bi-weekly publication available on-line<br />
at € 1355 per annum.<br />
Local Loop Unbundling<br />
A strategy e-journal published by <strong>InfoCom</strong><br />
Introduction<br />
This article provides an analysis of local loop unbundling (LLU) in 16 Western<br />
European countries.<br />
In nearly all examined countries, alternative operators use LLU to provide voice<br />
and/or data (Internet access) services to end-users.<br />
LLU basically exists in two forms — full local loop unbundling where <strong>the</strong> alternative<br />
operators obtain <strong>the</strong> exclusive right to use <strong>the</strong> full frequency spectrum available<br />
on <strong>the</strong> copper line and thus <strong>the</strong> ability to provide telephone and/or high-speed<br />
services (xDSL) to end-users. On <strong>the</strong> o<strong>the</strong>r hand, with shared access, <strong>the</strong> alternative<br />
provider can provide high-speed services based on <strong>the</strong> high frequency band<br />
while <strong>the</strong> incumbent in most cases still provides basic telephony services. In this<br />
way, both <strong>the</strong> alternative provider and <strong>the</strong> incumbent have a direct relationship<br />
with <strong>the</strong> same customer.<br />
Switzerland<br />
Ireland<br />
Greece<br />
Belgium<br />
Denmark<br />
Portugal<br />
Austria<br />
Norway<br />
Finland<br />
Sweden<br />
Spain<br />
Ne<strong>the</strong>rlands<br />
UK<br />
Italy<br />
France<br />
Germany<br />
0<br />
0<br />
5<br />
20<br />
7<br />
25<br />
9<br />
50<br />
140<br />
180<br />
72<br />
196<br />
128<br />
200<br />
235<br />
285<br />
317<br />
348<br />
374<br />
520<br />
435<br />
939<br />
811<br />
1 005<br />
192<br />
1 295<br />
1 258<br />
2 034<br />
2 827<br />
3 262<br />
Fig. 1- Number of unbundled local loops in Western<br />
European countries — 2005/2006 (in thousands of lines)<br />
With <strong>the</strong> exception of<br />
Switzerland, where LLU is<br />
a long-discussed topic<br />
but still not implemented,<br />
all examined Western<br />
European countries have<br />
introd uced LLU. The<br />
incumbents have to publish<br />
standard reference<br />
offers under regulated<br />
conditions.<br />
Installed based<br />
Fig. 1 provides a comparison<br />
of <strong>the</strong> installed base<br />
of unbundled local loops<br />
in <strong>the</strong> <strong>years</strong> 2005 and<br />
2006 in <strong>the</strong> examined<br />
countries. End-2006 a<br />
total of 15.8 million lines<br />
hadbeen unbundled (full<br />
and shared) and <strong>the</strong><br />
total number increased<br />
by 56.5% between 2005<br />
and 2006. Since <strong>the</strong> end<br />
of 2002, <strong>the</strong> total number has grown 12-fold. This is one proof of <strong>the</strong> growing competition<br />
in Western European <strong>telecom</strong>munications markets. The largest five<br />
European countries based on population (France, Germany, Italy, Spain and <strong>the</strong><br />
UK) account for <strong>over</strong> 78.5% of <strong>the</strong> total unbundled local loops.<br />
2005<br />
2006<br />
3 919<br />
4 747<br />
0 1 000 2 000 3 000 4 000 5 000<br />
Telecoms Strategies & Trends — Page 1
With 4.75 million unbundled loops Germany still holds<br />
<strong>the</strong> largest share (about 30%) followed by France with<br />
3.92 million (share 25%) and Italy with 2.03 million (13%).<br />
A group of countries follows, lead by <strong>the</strong> UK with 1.30<br />
million (8%), <strong>the</strong> Ne<strong>the</strong>rlands with 1.0 million (6,4%),<br />
Spain with 0.94 million lines (6%) and <strong>the</strong>n <strong>the</strong> three<br />
Scandinavian countries (Sweden, Finland and<br />
Norway).<br />
In terms of growth, <strong>the</strong> UK showed <strong>the</strong> highest yearly<br />
growth rate with +575% followed by Belgium (+432%),<br />
Ireland (+292%) and Greece (+257%). Despite <strong>the</strong>ir<br />
high annual growth rates, countries such as Belgium,<br />
Greece and Ireland still have a comparably low<br />
installed based of LLU lines. Even countries with a comparably<br />
high installed base showed considerable<br />
annual growth rates, e.g. Italy (+62%), Germany (+46%)<br />
and France (+39%). Some Scandinavian countries<br />
showed comparably low growth rates in 2006, for<br />
instance Norway (+22%) or Finland (+10%).<br />
Regarding <strong>the</strong> split between full unbundled and<br />
shared lines <strong>the</strong>re exist differences in <strong>the</strong> examined<br />
countries. In countries, such as Austria, Germany and<br />
Ireland, <strong>the</strong> shares of full unbundled loops on total LLU<br />
vary between 95% and 100%. In contrast, in Sweden<br />
<strong>the</strong> share of shared lines on total LLU accounted for<br />
76% end-2006, which was <strong>the</strong> highest of all countries. In<br />
<strong>the</strong> Ne<strong>the</strong>rlands (60%) and Spain (56%) as well alternative<br />
operators mainly use shared lines. In some countries<br />
(e.g. Greece, Italy, Finland), <strong>the</strong> importance of<br />
shared lines increased during 2006 whereas in several<br />
countries (Belgium, Denmark, <strong>the</strong> Ne<strong>the</strong>rlands, France,<br />
Spain, etc.), full unbundled lines are becoming more<br />
important and <strong>the</strong> share of shared lines on total LLU<br />
decreased in 2006. In particular in France, a migration<br />
from shared to full unbundled loops is visible and more<br />
and more operators switch to full unbundled lines.<br />
LLU unbundling within <strong>the</strong> context of competition<br />
LLU and total connections<br />
Although <strong>the</strong> number of LLU has increased in Western<br />
European countries, <strong>the</strong> incumbents still hold <strong>the</strong><br />
majority of connections in <strong>the</strong>ir respective markets.<br />
The average share of unbundled lines as a percentage<br />
of total connections (POTS and ISDN) accounted<br />
for 7.6% at <strong>the</strong> end of 2006 (5.2% for 2005) in all examined<br />
countries.<br />
As shown in Fig. 2, some countries — Finland (20.1%),<br />
<strong>the</strong> Ne<strong>the</strong>rlands (13.6%), Norway (13.3%) , France<br />
(12.7%), or else Germany (12.4%) — show shares well<br />
above average, partly explained by <strong>the</strong> early introduction<br />
of unbundling and in<strong>ten</strong>sive competition. In<br />
Telecoms Strategies & Trends • Issue 2007/2 — 15 MAY 2007 © <strong>InfoCom</strong> — Page 2<br />
some larger countries, such as <strong>the</strong> UK and Spain, <strong>the</strong><br />
share of LLU on total connections, with 4.1% and 5.4%<br />
respectively, are still below average. In countries such<br />
as Belgium, Greece and Ireland <strong>the</strong> share on total<br />
connections is below 1.5%, i.e. competition based on<br />
LLU is very limited.<br />
The share of LLU on total lines increased in <strong>the</strong> range of<br />
three to four percentage points during in 2006, in particular<br />
in some countries such as Germany (4), Portugal<br />
and <strong>the</strong> UK (3.5) followed by France (3.4) and <strong>the</strong><br />
Ne<strong>the</strong>rlands (3.2), which indicates a growing competition<br />
based on LLU.<br />
Switzerland<br />
0,0%<br />
0,0%<br />
Greece<br />
0,1%<br />
0,5%<br />
Ireland<br />
0,3%<br />
1,1%<br />
Belgium<br />
0,2%<br />
1,2%<br />
UK<br />
0,6%<br />
4,1%<br />
2,5%<br />
Spain<br />
5,4%<br />
Portugal<br />
2,0%<br />
5,4%<br />
Denmark<br />
5,0%<br />
6,7%<br />
Austria<br />
4,2%<br />
6,7%<br />
Italy<br />
5,3%<br />
8,5%<br />
Sweden<br />
6,7%<br />
9,4%<br />
Germany<br />
8,4%<br />
12,4%<br />
France<br />
9,3%<br />
12,7%<br />
Norway<br />
11,1%<br />
13,3%<br />
Ne<strong>the</strong>rlands<br />
10,5%<br />
13,6%<br />
Finland<br />
2005<br />
2006<br />
17,7%<br />
20,1%<br />
0% 5% 10% 15% 20% 25%<br />
Fig. 2- Share of LLU on total connections (POTS and ISDN)<br />
2005 and 2006 (in %)<br />
LLU and broadband Internet access<br />
The following section provides an <strong>over</strong>view of LLU within<br />
<strong>the</strong> context of broadband access markets.<br />
As already described local loop unbundling is one possibility<br />
for alternative operators to provide broadband<br />
services to end-users. In addition to <strong>the</strong> above-mentioned<br />
forms of unbundling, incumbents in many<br />
Western European countries are compelled by regulation<br />
to provide so-called “bitstream access” services to<br />
<strong>the</strong>ir national competitors. Bitstream access is fully<br />
based on <strong>the</strong> incumbents existing infrastructure for <strong>the</strong><br />
provision of broadband services (xDSL), which includes<br />
DSLAM, DSL modems, bandwidths and so on. The<br />
incumbent installs a high-speed access link to <strong>the</strong> customer<br />
premises and makes this access link available to
Ireland<br />
Greece<br />
Norway<br />
Austria<br />
Finland<br />
Portugal<br />
Denmark<br />
Switzerland<br />
Sweden<br />
Belgium<br />
Ne<strong>the</strong>rlands<br />
Spain<br />
Italy<br />
France<br />
UK<br />
Germany<br />
441<br />
162<br />
513<br />
980<br />
1 226<br />
1 145<br />
1 405<br />
1 170<br />
1 422<br />
1 210<br />
1 456<br />
1 410<br />
1 722<br />
1 681<br />
2 064<br />
1 929<br />
2 296<br />
2 085<br />
2 439<br />
4 249<br />
5 248<br />
4 991<br />
6 720<br />
6 707<br />
8 446<br />
9 971<br />
10 177<br />
10 654<br />
12 560<br />
13 213<br />
Fig. 3- Evolution of broadband lines<br />
between 2005 and 2006<br />
15 024<br />
0 2000 4000 6000 8000 10000 12000 14000 16000 18000<br />
third parties, to enable <strong>the</strong>m to provide high-speed<br />
services to customers. In many countries, incumbents<br />
have introduced regulated reference offers for “bit-<br />
Ireland<br />
Greece<br />
Norway<br />
Austria<br />
Finland<br />
Portugal<br />
Denmark<br />
Switzerland<br />
Sweden<br />
Belgium<br />
Ne<strong>the</strong>rlands<br />
Spain<br />
Italy<br />
France<br />
UK<br />
Germany<br />
DSL<br />
Cable<br />
Fibre<br />
2005<br />
2006<br />
0% 20% 40% 60% 80% 100%<br />
Fig. 4- Share of different broadband technologies on<br />
total broadband (DSL, cable, fibre) end of 2006<br />
stream access” to promote competition for broadband<br />
services.<br />
In addition to xDSL, o<strong>the</strong>r broadband technologies<br />
such as cable modem broadband access by CaTV<br />
operators or fibre optic based broadband access by<br />
incumbents and/or alternative operators are available<br />
in some countries.<br />
The total number of broadband connections (xDSL,<br />
cable modem and fibre optic) amounted to 76.2 million<br />
at <strong>the</strong> end of 2006 with an increase of about 30%<br />
between 2005 and 2006. As shown in Fig. 3, Germany<br />
has <strong>the</strong> highest number of broadband connections<br />
with <strong>over</strong> 15 million (19.7% of total of all countries<br />
examined), followed by <strong>the</strong> UK with 13.2 million<br />
(17.3%), France with 12.6 million (16.5%), Italy with 8.4<br />
million (11.1%) and Spain with 6.7 million (8.8%). The<br />
top-5 countries accounted for <strong>over</strong> 73% of <strong>the</strong> total<br />
broadband connections of all examined countries in<br />
2006.<br />
Among <strong>the</strong> larger countries, Germany showed <strong>the</strong><br />
highest yearly growth rate with about 41% in 2006 followed<br />
by Spain (35%), and <strong>the</strong> UK (30%). The two smaller<br />
countries, Greece (+216%) and Ireland (+91%),<br />
showed <strong>the</strong> highest <strong>over</strong>all growth rates in 2006,<br />
although <strong>the</strong>ir share on total broadband connections<br />
is still below 1%.<br />
Fig. 4 provides an <strong>over</strong>view of <strong>the</strong> split of <strong>the</strong> various<br />
broadband technologies used for broadband Internet<br />
access.<br />
DSL is <strong>the</strong> main broadband technology and accounts<br />
for 83.1% of <strong>the</strong> total aggregated broadband connections<br />
in <strong>the</strong> examined countries, followed by cable<br />
modem with a share of 15.3% and fibre optic with 1.6%.<br />
Never<strong>the</strong>less a more detailed analysis shows some differences<br />
between <strong>the</strong> Western European countries. In<br />
a group of countries, such Belgium, Denmark, <strong>the</strong><br />
Ne<strong>the</strong>rlands, Austria, Portugal, Switzerland and<br />
Sweden, DSL technologies account for 60%-70% of<br />
total broadband connections, whereas in Greece,<br />
Germany and Italy, broadband connections based on<br />
xDSL account for 95%-100% of all connections.<br />
Apart from Greece and Italy, where cable modem services<br />
are not available, cable modem is <strong>the</strong> second<br />
broadband technology used in all countries. In particular<br />
in Austria, Belgium, <strong>the</strong> Ne<strong>the</strong>rlands and Portugal,<br />
cable modem accounts for 35%-40% of all connections,<br />
which indicates a comparably stronger technology-based<br />
competition between <strong>telecom</strong> operators<br />
and CaTV operators.<br />
Fibre optic has gained a certain market share on total<br />
broadband connections only in some Scandinavian<br />
countries, e.g. Sweden (14%), Denmark (9%) and<br />
Telecoms Strategies & Trends • Issue 2007/2 — 15 MAY 2007 © <strong>InfoCom</strong> — Page 3
Switzerland 0,0%<br />
0,0%<br />
2005<br />
Belgium<br />
0,5%<br />
2,1%<br />
2006<br />
Ireland<br />
2,2%<br />
4,4%<br />
4,2%<br />
Greece<br />
4,9%<br />
UK<br />
1,9%<br />
9,8%<br />
9,9%<br />
Denmark<br />
10,5%<br />
5,1%<br />
Portugal<br />
11,6%<br />
Austria<br />
9,6%<br />
13,2%<br />
8,7%<br />
Spain<br />
14,0%<br />
Italy<br />
10,4%<br />
15,5%<br />
Ne<strong>the</strong>rlands<br />
19,1%<br />
19,2%<br />
Norway<br />
22,2%<br />
21,9%<br />
Sweden<br />
19,4%<br />
22,6%<br />
23,1%<br />
Finland<br />
24,6%<br />
Germany<br />
23,3%<br />
28,2%<br />
France<br />
28,4%<br />
31,2%<br />
0% 5% 10% 15% 20% 25% 30% 35% 40%<br />
Fig. 5- Share of broadband connections based on<br />
unbundled local loops (in %)<br />
Norway (5%), as well as in Italy (4%). We expect a fur<strong>the</strong>r<br />
increase in <strong>the</strong> next <strong>years</strong> in o<strong>the</strong>r countries, such<br />
as France or <strong>the</strong> Ne<strong>the</strong>rlands, as <strong>telecom</strong> operators<br />
invest in fibre-to-<strong>the</strong>-home/fibre-to-<strong>the</strong>-building infrastructure<br />
to provide services to <strong>the</strong>ir end-users.<br />
Based on <strong>the</strong> previous analysis, <strong>the</strong> following part<br />
describes <strong>the</strong> role of LLU within <strong>the</strong> provision of broadband<br />
(Internet) access services.<br />
Fig. 5 shows <strong>the</strong> share of broadband connections<br />
based on unbundled local loops in 2005 and 2006.<br />
LLU plays an important role in <strong>the</strong> two larger countries,<br />
France and Germany, where 31% and 28% of <strong>the</strong> total<br />
broadband connections where based on LLU. In <strong>the</strong><br />
three Scandinavian countries, Finland, Sweden and<br />
Norway, <strong>the</strong> figure is between 22% and 25%. While <strong>the</strong><br />
average share of all examined countries was 15% end<br />
of 2006, compared to 12% in 2005.<br />
With <strong>the</strong> exception of Switzerland and Norway, <strong>the</strong><br />
share of broadband connections based on LLU<br />
increased in all o<strong>the</strong>r countries. The highest increases<br />
occurred in <strong>the</strong> UK with 8 percentage points, followed<br />
by Portugal (6.5), Spain (5.3), Italy (5.1) and Germany<br />
(4.9). The general increase indicates <strong>the</strong> growing<br />
demand for LLU in <strong>the</strong>se countries and <strong>the</strong>ir growing<br />
importance for <strong>the</strong> provision of broadband services.<br />
Telecoms Strategies & Trends • Issue 2007/2 — 15 MAY 2007 © <strong>InfoCom</strong> — Page 4<br />
Yet <strong>the</strong> success of LLU is also a question of available<br />
alternative wholesale products, which had an impact<br />
on LLU evolution in <strong>the</strong> past. In Germany for instance,<br />
until 2004, LLU was <strong>the</strong> major wholesale product for<br />
alternative <strong>telecom</strong> operators to provide voice and/or<br />
Internet services. Resale offers (including <strong>the</strong> end-user<br />
relationship) for DSL were only introduced in late-2004<br />
and regulated bitstream offers for DSL will only be introduced<br />
in 2007. In comparison, in <strong>the</strong> UK, resale offers<br />
(e.g. for telephony) as well as bitstream offers (for DSL)<br />
have a longer tradition. Although LLU was introduced<br />
back in 2000/2001, alternative operators provided DSL<br />
services mainly based on BT’s o<strong>the</strong>r wholesale products<br />
(bitstream products such as IPStream and<br />
DataStream). For instance broadband connections<br />
based on BT’s bitstream products still account for <strong>over</strong><br />
41% of <strong>the</strong> total broadband connections, although<br />
with a diminishing importance. Regarding <strong>the</strong> provision<br />
of DSL services in some o<strong>the</strong>r larger countries, such<br />
France, Italy, or Spain, bitstream offers where initially<br />
used by alternative operators to provide DSL services.<br />
Today, more and more alternative providers shift from<br />
<strong>the</strong>se bitstream products towards LLU unbundling. In<br />
some o<strong>the</strong>r of <strong>the</strong> examin ed countries, such as<br />
Belgium, Denmark, etc. <strong>the</strong> share of broadband lines<br />
based on bitstream wholesale products of <strong>the</strong> incumbents<br />
remained quite stable in 2006.<br />
The combined share of LLU and bitstream based<br />
broadband connections show <strong>the</strong> highest values for<br />
<strong>the</strong> UK (51%), Germany (50%), followed by France<br />
(47%) as of end 2006. In particular in Germany, <strong>the</strong><br />
combined share has grown by 11 percentage points,<br />
which was <strong>the</strong> highest increase in all countries. This is<br />
an indicator for <strong>the</strong> increasing competition in <strong>the</strong><br />
German broadband access market.<br />
Outlook<br />
The number of unbundled lines is increasing in all<br />
examined countries and expected to fur<strong>the</strong>r increase<br />
during 2007. LLU will remain a very important method<br />
to introduce competition and in particular infrastructure<br />
based competition in <strong>the</strong> <strong>telecom</strong>munication<br />
markets throughout Western Europe.<br />
It is important to find an appropriate and balanced<br />
regulatory approach regarding various wholesale<br />
products used from alternative operators to provide<br />
services to <strong>the</strong>ir end-users. For instance wholesale bitstream<br />
access products are sold on a retail-minus formula<br />
from <strong>the</strong> incumbent to its competitors, in comparison<br />
to LLU services which are based on cost-oriented<br />
prices. All methods should allow sufficient margins<br />
for alternative operators to compete effectively<br />
with incumbents and consequently to promote competition.<br />
Fur<strong>the</strong>rmore, regulation will need to introduce
effective methods and a regulatory framework to<br />
allow easy migration between various wholesale services.<br />
For instance, in countries such as France and <strong>the</strong><br />
UK, migration is underway and operators shift from traditional<br />
bitstream or resale offers to LLU and invest in<br />
LLU infrastructure.<br />
National Regulation Authorities play an important role<br />
in <strong>the</strong> evolution of LLU as <strong>the</strong>y regulate prices for both<br />
wholesale and retail offers of <strong>the</strong> incumbents. In <strong>the</strong><br />
majority of <strong>the</strong> examined countries, prices for fully<br />
unbundled lines and/or shared lines decreased during<br />
2006. This may help alternative operators compete<br />
against <strong>the</strong> incumbents.<br />
As show in Fig. 6, BT for instance had <strong>the</strong> lowest retail<br />
DSL market share (i.e. direct xDSL customers) with 32%<br />
at <strong>the</strong> end of 2006 compared to France (50%)and<br />
Germany (49%). Many DSL offers are based on BT’s<br />
wholesale bitstream access products accounting for<br />
54% of <strong>the</strong> total DSL lines in 2006 (compared to 64%<br />
end of 2006). From a wholesale perspective it must be<br />
stressed that BT generates comparably high revenues<br />
from its wholesale bitstream access products (sold on<br />
a retail-minus formula to its competitors), which are<br />
higher than revenues from LLU services (based on costoriented<br />
prices). Regarding infrastructure-based competition<br />
based on LLU or own infrastructure, which promotes<br />
competition, <strong>the</strong> UK market is still quite protected<br />
compared to Germany. Only in 2006 did <strong>the</strong> share<br />
of LLU on total DSL lines grow to nearly 13% compared<br />
to 3% end-2005. In comparison, <strong>the</strong> share of total xDSL<br />
lines based on LLU in Germany accounts for 29% and<br />
in France for 33%. In Germany, <strong>the</strong> incumbent<br />
Deutsche Telekom lost almost 12% market share based<br />
on direct end-user DSL connections between 2005 and<br />
2006 whereas <strong>the</strong> market share of BT remained quite<br />
stable.<br />
16 000<br />
14 000<br />
12 000<br />
10 000<br />
8 000<br />
6 000<br />
4 000<br />
2 000<br />
0<br />
1 593<br />
2 487<br />
6 324<br />
3 212<br />
4 234<br />
7 068<br />
2 107<br />
2 827<br />
4 457<br />
2 011<br />
3 919<br />
5 920<br />
Fig. 6- Different forms of xDSL service provision — (xDSL lines in 1 000)<br />
As already mentioned earlier in this article operators in<br />
some countries move along <strong>the</strong> value chain from a<br />
traditionally reseller oriented business model (using simple<br />
resale products) towards a more infrastructure<br />
based business model (e.g. in France or <strong>the</strong> UK, see<br />
Fig. 6). In particular operators who reached a critical<br />
mass (in terms of number of customers, etc.) will ra<strong>the</strong>r<br />
chose LLU or <strong>the</strong>ir own infrastructure based business<br />
models to gain more control <strong>over</strong> <strong>the</strong>ir services and<br />
provid e more flexible and attractive products.<br />
Consequently, in some countries with more developed<br />
LLU markets, such as France and Germany, <strong>the</strong> products<br />
of alternative providers vary more from <strong>the</strong> incumbents’<br />
offers, as for instance compared to <strong>the</strong> UK. In<br />
France and Germany alternative providers offer forinstance<br />
higher bandwidths for DSL or more bundled<br />
products (e.g. telephony and broadband) in<strong>ten</strong>sifying<br />
consequently competition.<br />
O<strong>the</strong>rs own infrastructure<br />
O<strong>the</strong>rs (Bitstream, Resale)<br />
O<strong>the</strong>rs (LLU)<br />
Incumbent (Direct customers)<br />
38<br />
4 668<br />
192<br />
2 410<br />
120<br />
5 460<br />
1 295<br />
3 219<br />
GER (2005) GER (2006) F (2005) F (2006) UK (2005) UK (2006)<br />
Quotation Permitted —Reproduction Prohibited —Page 5
T E L E C O M S S T R A T E G I E S & T R E N D S<br />
Strategic analyses inside <strong>the</strong> world of <strong>telecom</strong>s ISSUE: 2007/12 15 AUG. 2007<br />
Reference data for this article are extracted<br />
from Teleseeq, <strong>InfoCom</strong>'s market intelligence<br />
solution, available online.<br />
Teleseeq provides fundamental market<br />
data for <strong>the</strong> multi-media and <strong>telecom</strong>s<br />
industry in four categories: equipment<br />
markets, service markets, companies’ key<br />
figures and socio-economic data.<br />
For any question regarding <strong>the</strong> con<strong>ten</strong>t of<br />
this article, please do not hesitate to contact<br />
Rosa Eslava at eslava@infocomde.com<br />
(free service available to TS&T<br />
subscribers).<br />
Rotebühlplatz 21, 70178 Stuttgart, Germany<br />
Tel: +49 (0) 711 87 05 10-0<br />
Fax: +49 (0) 711 87 05 10-10<br />
web site: www.infocom-de.com<br />
e-mail: mail@infocom-de.com<br />
With affiliates and partners operating in France,<br />
in <strong>the</strong> Philippines, in <strong>the</strong> UK and in <strong>the</strong> USA.<br />
Publishing Manager: Thomas Franz<br />
Editorial Board: Cristina Bardelli, Michael<br />
Federmann, Solène Figueiredo, Etienne<br />
Grange, Gaby Konzelmann, Abigail Rivadelo<br />
and Katrina Yap<br />
Quotation Permitted — Reproduction<br />
Prohibited<br />
Telecoms Strategies & Trends<br />
ISSN 1464-3480<br />
is a bi-weekly publication available on-line<br />
at € 1355 per annum.<br />
A strategy e-journal published by <strong>InfoCom</strong><br />
Wholesale revenues from fixed<br />
line carriers in Eastern Europe<br />
Introduction<br />
This article provides an <strong>over</strong>view of <strong>the</strong> fixed line wholesale market in six Eastern<br />
European countries, namely Croatia, Czech Republic, Hungary, Poland, Slovakia<br />
and Slovenia. Austria will be used as a reference for <strong>the</strong> analysis of <strong>the</strong> wholesale<br />
markets in <strong>the</strong>se countries.<br />
Market context and regulatory situation<br />
Austria has been part of <strong>the</strong> European Union (EU) for <strong>over</strong> <strong>ten</strong> <strong>years</strong> now. Czech<br />
Republic, Hungary, Poland, Slovakia and Slovenia accessed <strong>the</strong> EU in 2004.<br />
Croatia is not part of <strong>the</strong> EU yet, but has been candidate since 2004. The directives<br />
to <strong>the</strong> EU as regards <strong>the</strong> <strong>telecom</strong>munication markets have thus an important<br />
impact on <strong>the</strong> regulation of <strong>the</strong>se markets.<br />
Local Loop Unbundling (LLU), bitstream and Wholesale Line Rental (WLR) access<br />
products represent important drivers to <strong>the</strong> competition in <strong>the</strong> retail markets, and<br />
generally lead to increased choice and innovation, and lower prices for end-users.<br />
• Local Loop Unbundling (LLU): alternative operators can enter <strong>the</strong> market without<br />
building <strong>the</strong>ir own networks in <strong>the</strong> local loop by leasing <strong>the</strong> incumbent’s infrastructure;<br />
full unbundling enables <strong>the</strong>m to offer <strong>the</strong> full range of <strong>telecom</strong>munications<br />
services, whilst shared access allows <strong>the</strong>m to propose high speed services, basic<br />
voice telephony services being still provided by <strong>the</strong> incumbent <strong>over</strong> <strong>the</strong> same<br />
(copper) line;<br />
• Bitstream: alternative operators use high speed access links installed at <strong>the</strong> customers<br />
premises, but do not have any access rights in <strong>the</strong> local loop;<br />
• Wholesale Line Rental (WLR): alternative operators and service providers are<br />
able to offer access and call services to end-users by renting telephone access<br />
lines on wholesale terms.<br />
Austria mandated LLU, bitstream and WLR products between 1999 and 2003. The<br />
countries with <strong>the</strong> most advanced regulatory framework are Hungary and<br />
Slovenia, which introduced LLU and bitstream a little later than Austria, as shown in<br />
Tab. 1. Besides, in Austria and Hungary, <strong>the</strong> incumbents launched recently a naked<br />
DSL offer at wholesale level. Naked DSL enables alternative operators to provide<br />
DSL without PSTN service, i.e. <strong>the</strong> end-users do not need a fixed telephone line to<br />
subscribe DSL service. Naked DSL can be based on shared access or bitstream,<br />
e.g. Austria.<br />
On <strong>the</strong> o<strong>the</strong>r hand, Croatia, Poland and Slovakia really started to implement <strong>the</strong><br />
European directives in 2005. However, <strong>the</strong> Polish regulator has regulated much far<strong>the</strong>r<br />
<strong>the</strong> wholesale markets: it imposed a reference offer for bitstream access in<br />
May 2006 and changed <strong>the</strong> reference offer for LLU in October 2006, in particular<br />
by lowering <strong>the</strong> prices. In November 2006, <strong>the</strong> incumbent activated <strong>the</strong> first broadband<br />
lines based on bitstream but still did not have any agreements for LLU. WLR<br />
is also available, but on a bilateral basis.<br />
Telecoms Strategies & Trends — Page 1
Austria<br />
Croatia<br />
In general, <strong>the</strong> incumbents are trying to use <strong>the</strong>ir dominant<br />
position, which derives from <strong>the</strong>ir former monopolistic<br />
status, at <strong>the</strong>ir advantage, in particular as<br />
regards infrastructure access. In Austria, in 2006, alternative<br />
operators were complaining about too high<br />
monthly rental fees for LLU and reported delays in LLU<br />
lines opening. However, in Eastern European countries,<br />
alternative operators have to <strong>over</strong>come larger obstacles,<br />
since <strong>the</strong> range of regulated access products is<br />
smaller and <strong>the</strong>ir take-up slower. For instance, in<br />
Croatia, <strong>the</strong> ownership of <strong>the</strong> distribution <strong>telecom</strong>munications<br />
network is unclear and as a result, <strong>the</strong> relations<br />
between <strong>the</strong> different players quite <strong>ten</strong>se.<br />
Indeed, <strong>the</strong> incumbent T-HT has a contract concession<br />
for this network with <strong>the</strong> g<strong>over</strong>nment of Croatia, but<br />
officially this should not give T-HT more rights than its<br />
competitors in <strong>the</strong> <strong>telecom</strong> market. Yet, at <strong>the</strong> end of<br />
2006, T-HT cut <strong>the</strong> cables laid by <strong>the</strong> alternative operators<br />
Optima and Metronet in Velika Gorica, claiming<br />
that <strong>the</strong>se companies had acted without following <strong>the</strong><br />
procedure according to <strong>the</strong> law and thus violated T-<br />
HT’s property.<br />
Main competitors<br />
In <strong>the</strong> national wholesale markets, <strong>the</strong> incumbents are<br />
confronted with national and international competitors.<br />
Some international operators, especially<br />
Deutsche Telekom, France Telecom, Telefonica and<br />
Telekom Austria, are investing in Eastern Europe, since<br />
Telecoms Strategies & Trends • Issue 2007/12 — 15 AUG 2007 © <strong>InfoCom</strong> — Page 2<br />
LLU Bitstream access WLR Comments<br />
Since 1999 (full)<br />
and 2001 (shared)<br />
Since end-2005<br />
(full)<br />
Since 2000 Since end-2003 Naked DSL since 2006<br />
Under review No<br />
Czech Republic Since 2003 End-2006 (only IP) No<br />
Hungary Since 2002 Since end-2000 No<br />
Poland Since 2005 Since 2006<br />
Slovakia Since 2005 No No<br />
Slovenia Since 2002 2003 No<br />
Since 2006:<br />
agreement<br />
between TP and<br />
Tele2<br />
Unclear regulation on <strong>the</strong><br />
access to <strong>the</strong> distribution<br />
<strong>telecom</strong>munications network<br />
(DTK)<br />
5 regional incumbents<br />
(Magyar Telekom c<strong>over</strong>s 80%<br />
of <strong>the</strong> territory)<br />
Naked DSL from Magyar<br />
Telekom since March 2007<br />
No LLU lines in Nov. 2006<br />
Worries of <strong>the</strong> EU commission<br />
on <strong>the</strong> independency of <strong>the</strong><br />
national regulator<br />
No LLU agreements at end-06<br />
Worries of <strong>the</strong> EU commission<br />
on <strong>the</strong> independency of <strong>the</strong><br />
national regulator<br />
Concerns of <strong>the</strong> EU regarding<br />
LLU take-up and power<br />
separation<br />
Tab. 1- Regulatory status of major wholesale products at end-2006<br />
<strong>the</strong>se countries have lower fixed, broadband and<br />
mobile penetration rates and consequently higher<br />
growth prospects than in Western Europe. For instance,<br />
Deutsche Telekom is implementing an integrated<br />
approach among Croatia, Hungary and Slovakia,<br />
where <strong>the</strong> group has majority shares in <strong>the</strong> fixed incumbents.<br />
In April 2007, Telekom Austria got <strong>the</strong> green light<br />
from <strong>the</strong> Austrian regulator for <strong>the</strong> acquisition of eTel,<br />
which provides <strong>telecom</strong> services to business customers<br />
and has operations as well as network infrastructure in<br />
Austria, Czech Republic, Hungary, Poland and<br />
Slovakia. With this purchase, Telekom Austria confirms<br />
its strategic orientation in Eastern Europe. O<strong>the</strong>r international<br />
operators are typically BT Global Services, GTS<br />
CE, which focuses especially in Central and Eastern<br />
Europe, and Verizon.<br />
Yet, <strong>the</strong> incumbents also have to cope with infrastructure<br />
providers that are linked to ano<strong>the</strong>r industry. In<br />
Croatia, HEP Telecom and ÖBBTel are subsidiaries of<br />
respectively HEP, <strong>the</strong> Croatian power utility, and ÖBB,<br />
<strong>the</strong> Austrian Federal Railways. In 2006, ÖBBTel<br />
enlarged its data network to Croatia. In Poland,<br />
Telekomunikacja Kolejowa is a spin off of PKP, <strong>the</strong> Polish<br />
National Railways. Although <strong>the</strong> company services first<br />
<strong>the</strong> railway industry, it also provides telephony, Internet<br />
and data services to o<strong>the</strong>r <strong>telecom</strong> operators in<br />
Poland.
600<br />
500<br />
400<br />
300<br />
200<br />
100<br />
0<br />
519<br />
21%<br />
15%<br />
88<br />
25%<br />
342<br />
Fixed line wholesale revenues<br />
In Austria, in <strong>the</strong> fixed line market, wholesale revenues<br />
amount to around 21% of <strong>the</strong> total fixed line retail revenues,<br />
as shown in Fig. 2. The main wholesale revenue<br />
stream comes from fixed line voice services, but <strong>the</strong>y<br />
should represent a decreasing share of <strong>the</strong> total<br />
wholesale revenues: from 66% in 2004 to 60% in 2006 to<br />
50% in 2009. This decrease is mainly due to <strong>the</strong> fixed<br />
mobile substitution and <strong>the</strong> rise of unbundled lines in<br />
<strong>the</strong> Austrian market. Indeed, alternative operators<br />
<strong>ten</strong>d to increasingly use LLU (and mostly full LLU) to<br />
realise <strong>the</strong>ir DSL offers: LLU accounted for 16% of <strong>the</strong><br />
total DSL lines in 2004 and for 23% in 2006 whilst bitstream<br />
accounted for 19% in 2004, but only for 14% in<br />
2006. In 2009, <strong>over</strong> 30% of <strong>the</strong> DSL accesses should be<br />
based on LLU. Ano<strong>the</strong>r trend is <strong>the</strong> rise of IP services.<br />
Indeed, carriers are by and by switching <strong>the</strong>ir backbone<br />
<strong>over</strong> IP. Besides, in <strong>the</strong> near future, VoIP services<br />
should gain in importance, leading to an increase in<br />
demand for VoIP interconnection.<br />
In 2006, total wholesale revenues from fixed line revenues<br />
are <strong>the</strong> highest in Austria (compared to <strong>the</strong><br />
o<strong>the</strong>r countries under scope), yet <strong>the</strong> share of <strong>the</strong>se<br />
revenues on <strong>the</strong> total fixed line retail market is higher in<br />
Czech Republic. As regards <strong>the</strong> o<strong>the</strong>r countries, <strong>the</strong>ir<br />
fixed line wholesale revenues amounted to less than<br />
20% of <strong>the</strong>ir fixed line retail revenues, i.e. <strong>over</strong> 15% in<br />
Slovakia and Slovenia, around 15% in Croatia and<br />
Hungary, and 13% in Poland. These countries differ also<br />
by <strong>the</strong> revenue repartition, as depicted in Fig. 3.<br />
• Croatia, Poland and Slovakia are <strong>the</strong> countries with<br />
<strong>the</strong> highest share of voice revenues, i.e. <strong>over</strong> two thirds<br />
of <strong>the</strong> total fixed line wholesale revenues;<br />
• Czech Republic, Hungary and Slovenia have a sizeable<br />
share of bitstream revenues;<br />
• Hungary has a very high share of bitstream revenues<br />
in comparison to Austria and <strong>the</strong> o<strong>the</strong>r countries;<br />
15%<br />
183<br />
<strong>Total</strong> fixed line wholesale revenues<br />
Ratio on total fixed line retail revenues<br />
Austria Croatia Czech Republic Hungary Poland Slovakia Slovenia<br />
Fig. 2- <strong>Total</strong> fixed line wholesale revenues in million euros and ratio on total fixed line retail revenues by country in 2006<br />
425<br />
13%<br />
19%<br />
91<br />
17%<br />
• Besides, Slovakia has also some revenues from bitstream,<br />
unlike Croatia and Poland, and <strong>the</strong> size of its<br />
fixed line wholesale market (based on relative revenues)<br />
is in between <strong>the</strong> Austrian market and <strong>the</strong><br />
Slovenian market.<br />
In Czech Republic, in 2006, wholesale revenues from<br />
fixed line carriers amounted to 25% of <strong>the</strong> total fixed<br />
line retail revenues. As regards <strong>the</strong> fixed line wholesale<br />
market, data services accounted for 45% of <strong>the</strong> total<br />
revenues, of which 3% came from bitstream services. In<br />
2006, <strong>the</strong>re was a wave of consolidation in <strong>the</strong> Czech<br />
<strong>telecom</strong> market, leading to an increased competition<br />
in <strong>the</strong> wholesale market and a downward pressure on<br />
prices, especially for leased lines and data services.<br />
Yet, <strong>the</strong>re was also an increasing demand for new services,<br />
such as high capacity data services and LLU.<br />
In Slovakia and Slovenia, fixed line wholesale revenues<br />
represented between 17% and 19% of <strong>the</strong> total fixed<br />
line revenues. Wholesale revenues from data services<br />
represented less than 40% of <strong>the</strong> total fixed line wholesale<br />
revenues; yet, <strong>the</strong>y were relatively a little higher in<br />
Slovenia than in Slovakia, especially due to a more<br />
advanced regulatory framework in Slovenia. However,<br />
in both countries, <strong>the</strong>re are some issues regarding <strong>the</strong><br />
practical implementation of some regulated access<br />
products, in particular LLU, as well as <strong>the</strong> independency<br />
of <strong>the</strong> national regulators.<br />
The Hungarian fixed line wholesale market amounted<br />
to 15% of <strong>the</strong> fixed line retail market. The fixed line<br />
wholesale revenues were characterised by ra<strong>the</strong>r high<br />
shares of revenues from data services (50% of <strong>the</strong> total<br />
wholesale revenues), in particular bitstream access<br />
(almost 12%) and IP services. Hungary is indeed a transit<br />
country for many international carriers, since it builds<br />
a bridge between Western and Eastern Europe.<br />
Telecoms Strategies & Trends • Issue 2007/12 — 15 AUG 2007 © <strong>InfoCom</strong> — Page 3<br />
72<br />
30%<br />
25%<br />
20%<br />
15%<br />
10%<br />
5%<br />
0%
Slovenia<br />
Slovakia<br />
Poland<br />
Hungary<br />
Czech Rep.<br />
Croatia<br />
Austria<br />
Fixed voice<br />
Leased line<br />
Bitstream resale<br />
0% 20% 40% 60% 80% 100%<br />
In Croatia and Poland, <strong>the</strong> <strong>telecom</strong> markets are taking<br />
up a little slower, especially due to a quite recent regulation<br />
in <strong>the</strong> wholesale markets. In 2006, <strong>the</strong> total fixed<br />
line wholesale revenues amounted to 13% to 15% of<br />
<strong>the</strong> total fixed line retail revenues. Revenues from<br />
voice services amounted to <strong>over</strong> two thirds of <strong>the</strong> total<br />
wholesale revenues. Bitstream is not implemented in<br />
both countries. However, in Croatia, <strong>the</strong> wholesale revenues<br />
amounted to an increasing share of <strong>the</strong> total<br />
revenues of <strong>the</strong> incumbent thanks to <strong>the</strong> entry of new<br />
fixed and mobile operators in <strong>the</strong> market and <strong>the</strong><br />
development of new services. For instance, in 2006, T-<br />
HT concluded LLU agreements with six operators. The<br />
total national wholesale revenues should increase by<br />
40% between 2006 and 2010, compared to around<br />
20%-30% for Czech Republic, Hungary, Poland,<br />
Slovakia and Slovenia, and 15% for Austria. By 2010,<br />
wholesale revenues should account for 20% of <strong>the</strong><br />
retail revenues in Croatia, surpassing Hungary and<br />
Slovenia.<br />
Outlook<br />
Wholesale revenues from fixed line carriers should continue<br />
to increase <strong>over</strong> <strong>the</strong> next <strong>years</strong>. In Croatia, <strong>the</strong><br />
decision on <strong>the</strong> EU membership, which is due in 2009,<br />
should particularly foster <strong>the</strong> liberalisation of <strong>the</strong> market.<br />
More<strong>over</strong>, as Eastern European <strong>telecom</strong> markets<br />
open, new players should enter, increasing <strong>the</strong><br />
demand for interconnection services or access products.<br />
National authorities will play an important role in<br />
Quotation Permitted — Reproduction Prohibited — Page 4<br />
IP<br />
Fig. 3- <strong>Total</strong> fixed line wholesale revenue repartition<br />
by country in 2006<br />
<strong>the</strong> take-up of <strong>the</strong>se products and on <strong>the</strong> level of competition,<br />
since <strong>the</strong>y can oblige <strong>the</strong> incumbents to<br />
open <strong>the</strong>ir infrastructure or to lower <strong>the</strong>ir prices on<br />
some regulated wholesale products. For instance, by<br />
2010, <strong>the</strong> number of unbundled lines should grow significantly,<br />
provided that <strong>the</strong> fees are reasonable and<br />
<strong>the</strong> delays for opening a line are not “artificially”<br />
leng<strong>the</strong>nd.<br />
Besides, international <strong>telecom</strong> operators such as<br />
Telekom Austria should continue to invest in <strong>the</strong>se<br />
countries. For <strong>the</strong> moment, <strong>the</strong>y apparently keep on<br />
acquiring local companies to expand <strong>the</strong>ir footprint in<br />
<strong>the</strong> region. It will be interesting to see which operators<br />
will succeed on <strong>the</strong> long term in Central and Eastern<br />
Europe.