- Page 1 and 2:
es offisielle StatiStllck
- Page 3 and 4:
Abbreviations in source references
- Page 5 and 6:
Other products from Statistics Noiw
- Page 7 and 8:
List of figures Figure Page Figure
- Page 9 and 10:
Table Page Table Page 78 Deaths by
- Page 11 and 12:
Table Page Table Page 214 Monthly e
- Page 13 and 14:
Table Page Table Page 362 Accrued i
- Page 15 and 16:
417 Table Page Table Page Svalbard
- Page 17 and 18:
Largest islands km2 Hinnøya (Nordl
- Page 19 and 20:
J Ocean areas around Norway 45 GREE
- Page 21 and 22:
Forest and agricultural areas yarda
- Page 23 and 24:
Annual precipitation Vardo The term
- Page 25 and 26:
Communications The map shows roads,
- Page 27 and 28:
General subjects i (cont.) Administ
- Page 29 and 30:
4 - - General subjects 4 Storting e
- Page 31 and 32:
0.1 0.2 0.4 0.4 0.2 General subject
- Page 33 and 34:
696 1353 813 1122 12711 . 4934 955
- Page 35 and 36:
2983 1353 397 247 398 652 . 3703 .
- Page 37 and 38:
General subjects I 3 County The 197
- Page 40 and 41:
. Environment 1 6 Protected areas1.
- Page 42 and 43:
Environment 1 8 Air temperature. Ce
- Page 44 and 45:
20 Name of field Petroleum reserves
- Page 46 and 47:
Environ ment 22 Potential, operatio
- Page 48 and 49:
Environment Main fish stocks. 1 000
- Page 50 and 51:
Environment 28 Emissions to air by
- Page 52 and 53:
I I --- Population IResident popula
- Page 54 and 55:
Population 33 Population, land area
- Page 56 and 57:
PopuIaton 36 Population and area. M
- Page 58 and 59:
Population 36 (cont.). Population a
- Page 60 and 61:
Population 36 (cont.). Population a
- Page 62 and 63:
Population 36 (cont.). Population a
- Page 64 and 65:
Population Age Population by sex, a
- Page 66 and 67:
Population 39 Population by sex and
- Page 68 and 69:
112746 4.5 4 1 Population Families
- Page 70 and 71:
4 5 Population Children O-17 years
- Page 72 and 73:
Population 47 Components of populat
- Page 74 and 75:
Population 49 Births Year Annual av
- Page 76 and 77:
Population 53 Adopted persons Year
- Page 78 and 79:
Population 56 Expectation of life S
- Page 80 and 81:
Population 58 Net migration1. Count
- Page 82 and 83:
Population 61 Immigration and emigr
- Page 84 and 85:
Population 63 Foreign citizens by s
- Page 86 and 87:
PopuJation 65 Foreign born resident
- Page 88 and 89:
Population 30000 25000 20000 15000
- Page 90 and 91:
Population 71 Partnerships contract
- Page 92 and 93:
: Health and social conditions 75 C
- Page 94 and 95:
Health and social conditions 7 Deat
- Page 96 and 97:
Health and social conditions Year1
- Page 98 and 99:
Health and social conditions 84 Dea
- Page 100 and 101:
Health and social conditions Suicid
- Page 102 and 103:
Health and social conditions 92 Not
- Page 104 and 105:
Health and social conditions 96 Rep
- Page 106 and 107:
Health and social conditions 1 00 H
- Page 108 and 109:
I 4 Category of personnel Health an
- Page 110 and 111:
Health and social conditions 1 07 D
- Page 112 and 113:
1 08 Child welfare. Children under
- Page 114 and 115:
Health and social conditions II2 Be
- Page 116 and 117:
11 7 Unemployment benefits. Million
- Page 118 and 119:
122 Health and social conditions Na
- Page 120 and 121:
Health and social conditions 1 25 O
- Page 122 and 123:
Health and social conditions 1 27 O
- Page 124 and 125:
Health and social conditions 1 28 R
- Page 126 and 127:
I 32 Principal offence Health and s
- Page 128 and 129:
I I I JI Education 1 35 Persons 16
- Page 130 and 131:
8135 I 37 Sex and field of Study Ed
- Page 132 and 133:
1 9 Number of pupils/students, by t
- Page 134 and 135:
- teachers Education 141 Kindergart
- Page 136 and 137:
I Education 141 Pupils going from l
- Page 138 and 139:
i jj Students by sex, type of colle
- Page 140 and 141:
Norge. 84296 152 Participants Of wh
- Page 142 and 143:
4 Personal economy and housing cond
- Page 144 and 145:
1 6" Personal economy and housing c
- Page 146 and 147:
162 Income, deduction and tax All -
- Page 148 and 149:
I 65 Personal economy and housing c
- Page 150 and 151:
I 67 Income items Personal economy
- Page 152 and 153:
I 69 Property items Personal econom
- Page 154 and 155:
-".înal economy and housing condit
- Page 156 and 157:
50602 I 75 Personal economy and hou
- Page 158 and 159:
1 80 County Personal economy and ho
- Page 160 and 161:
-. - I p Labour market Q Persons ag
- Page 162 and 163:
Labour market 25 Labour force parti
- Page 164 and 165:
Labour market 1 89 Employed persons
- Page 166 and 167:
1 92 Labour market Commuters1 16 ye
- Page 168 and 169:
Labour market 1 95 Percentage of em
- Page 170 and 171:
Labour market 1 98 Unemployed perso
- Page 172 and 173:
. 120 Labour market 201 Employers a
- Page 174 and 175:
2 O1. Year and quarter Labour marke
- Page 176 and 177:
18360 2 08 Labour market Monthly ea
- Page 178 and 179:
2 1 1 Sex and type of bank Labour m
- Page 180 and 181:
Labour market 214 Monthly earnings
- Page 182:
Labour market 21 6 Monthly earnings
- Page 185 and 186:
Recreational, cultural and sporting
- Page 187 and 188:
Recreational, cultural and sporting
- Page 189 and 190:
Recreational, cultural and sporting
- Page 191 and 192:
Recreational, cultural and sporting
- Page 193 and 194:
Recreational, cultural and sporting
- Page 196 and 197:
J Prices and indices 235 Prices on
- Page 198 and 199:
Prices and indices 239 Retail price
- Page 200 and 201:
Prices and indices 241 Consumer pri
- Page 202 and 203:
2 43 Year (average) and monthTotal
- Page 204 and 205:
Prices and indices 5 Price index of
- Page 206 and 207:
Prices and indices 248 Building cos
- Page 208 and 209:
Prices and indices 251 Index of agr
- Page 210 and 211:
2 54 Prices and indices Annual inde
- Page 212 and 213:
I National economy and external tra
- Page 214 and 215:
National economy and external trade
- Page 216 and 217:
National economy and external trade
- Page 218 and 219:
National economy and external trade
- Page 220 and 221:
National economy and external trade
- Page 222 and 223:
National economy and external trade
- Page 224 and 225:
National economy and external trade
- Page 226 and 227:
274 National economy and external t
- Page 228 and 229:
National economy and external trade
- Page 230 and 231:
277 National economy and external t
- Page 232 and 233:
National economy and external trade
- Page 234 and 235:
National economy and external trade
- Page 236 and 237:
National economy and external trade
- Page 238 and 239:
2 82 National economy and external
- Page 240 and 241:
National economy and external trade
- Page 242 and 243:
i. National economy and external tr
- Page 244 and 245:
288 (cont.). Imports of principal c
- Page 246 and 247:
2058.2 289 (cont.). Exports of prin
- Page 248 and 249:
National economy and external trade
- Page 250 and 251:
National economy and external trade
- Page 252 and 253:
National economy and external trade
- Page 254 and 255:
National economy and external trade
- Page 256 and 257:
National economy and external trade
- Page 258 and 259:
4 Industrial activities 292 Turnove
- Page 260 and 261:
Industrial activities 294 Statistic
- Page 262 and 263:
2 97 Industrial activities Main fig
- Page 264 and 265:
Industrial activities 3 01 All Non-
- Page 266 and 267:
15639 3 03 Industrial activities St
- Page 268 and 269:
3 05 Agriculture, hunting and fores
- Page 270 and 271:
Agriculture, hunting and forestry 3
- Page 272 and 273:
Agriculture, hunting and forestry 3
- Page 274 and 275:
31 5 Holdings by agricultural area.
- Page 276 and 277:
Agriculture, hunting and forestry 3
- Page 278 and 279:
Agriculture, hunting and forestry 3
- Page 280 and 281:
5424 327 Year Number of holdings wi
- Page 282 and 283:
Agriculture, hunting and forestry 3
- Page 284 and 285:
Agriculture, hunting and forestry 3
- Page 286 and 287:
Agriculture, hunting and forestry 3
- Page 288 and 289:
Agriculture, hunting and forestry 3
- Page 290 and 291:
Fishing, sealing and whaling 341 Fi
- Page 292 and 293:
Fishing, sealing and whaling 344 Va
- Page 294 and 295:
Fishing, sealing and whaling 347 Se
- Page 296 and 297:
Fishing, sealing and whaling 351 Re
- Page 298 and 299:
Oil extraction, mining, quarrying a
- Page 300 and 301:
Oil extraction, mining, quarrying a
- Page 302 and 303:
Oil extraction, mining, quarrying a
- Page 304 and 305:
Oil extraction, mining, quarrying a
- Page 306 and 307:
366 Production of principal energy
- Page 308 and 309:
Electricity and gas supply 369 Supp
- Page 310 and 311:
Building and construction statistic
- Page 312 and 313:
3 75 County Building and constructi
- Page 314 and 315:
Building and construction statistic
- Page 316 and 317:
Retail trade 381 InternaI trade by
- Page 318 and 319:
Retail trade 385 Deliveries of petr
- Page 320 and 321:
. 104 Retail trade 388 Statistics o
- Page 322 and 323:
Transport and communication Hotels
- Page 324 and 325:
Transport and communication 392 Exp
- Page 326 and 327:
Transport and communication 394 Dom
- Page 328 and 329:
Transport and communication 396 Nor
- Page 330 and 331:
Transport and communication 4.WJ Ro
- Page 332 and 333:
Transport and communication 403 Cha
- Page 334 and 335:
Transport and communication 406 Uns
- Page 336 and 337:
4 1 0 Accidents, total Drivers of T
- Page 338 and 339:
Transport and communication 41 3 Op
- Page 340 and 341:
Transport and communication Express
- Page 342 and 343:
422 At the end of the year Transpor
- Page 344 and 345:
51 Transport and communication Vess
- Page 346 and 347:
429 Total Transport and communicati
- Page 348 and 349:
Transport and communication 431 Mar
- Page 350 and 351:
Transport and communication Traffic
- Page 352 and 353:
Transport and communication 437 Fre
- Page 354 and 355:
44 1 Transport and communication Mo
- Page 356 and 357:
10 75 Financial intermediation 444
- Page 358 and 359:
446 Financial intermediation Loans1
- Page 360 and 361:
Financial intermediation 448 Public
- Page 362 and 363: Financial intermediation 452 Financ
- Page 364 and 365: Financial intermediation 456 Non-li
- Page 366 and 367: 4049 Real estate and other service
- Page 368 and 369: 463 Industry subclassNo. Real estat
- Page 370 and 371: 21 465 Real estate and other servic
- Page 372 and 373: Financial markets 468 Changes ¡n t
- Page 374 and 375: Financial markets 472 Issues of sha
- Page 376: Financial markets Bankruptcy procee
- Page 379 and 380: 418 Public sector 478 General gover
- Page 381 and 382: Public sector 479 (cont.). Central
- Page 383 and 384: 136995 Public sector 481 General go
- Page 385 and 386: 2439 Public sector 485 Central gove
- Page 387 and 388: Public sector 48 9 Public expenditu
- Page 389 and 390: Public sector 493 Survey of tax ass
- Page 391 and 392: Public sector 495 Distributed taxes
- Page 393 and 394: Public sector 497 County Municipal
- Page 395 and 396: Sva Iba rd 500 Svalbard. Coal minin
- Page 397 and 398: International tables 504 Area, popu
- Page 399 and 400: International tables 504 (cont.). A
- Page 401 and 402: International tables 504 (cont.). A
- Page 403 and 404: International tables 507 Emissions
- Page 405 and 406: 30.6.91 International tables 508 (c
- Page 407 and 408: International tables 508 (cont.). P
- Page 409 and 410: International tables 508 (cont.). P
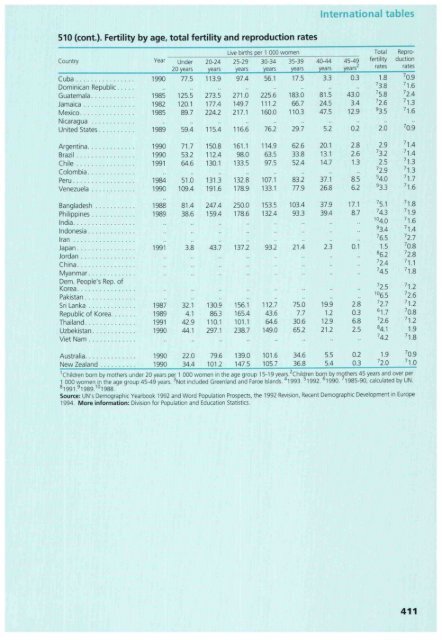
- Page 411: , . International tables L i 51 0 F
- Page 415 and 416: International tab'es 51 2 Consumpti
- Page 417 and 418: International tables 51 4 Employed
- Page 419 and 420: International tables 517 (cont.). R
- Page 421 and 422: International tables 520 Selected c
- Page 423 and 424: International tables 5 Private cons
- Page 425 and 426: International tables 528 Land area,
- Page 427 and 428: International tables 5-,r ...' Live
- Page 429 and 430: International tables 531 Automobile
- Page 431 and 432: International tables J Country The
- Page 433 and 434: International tables J. The merchan
- Page 435 and 436: International tables i I I i 5 3P S
- Page 437 and 438: International tables 543 Social sec
- Page 439 and 440: i I International tables cnr J'$ Ta
- Page 441 and 442: Numbers relate to table number Educ
- Page 443 and 444: Numbers relate to table number Pres
- Page 446 and 447: Measures and weight Length m metre