

doctor
ZArLT
ZArLT

You also want an ePaper? Increase the reach of your titles
YUMPU automatically turns print PDFs into web optimized ePapers that Google loves.
57<br />
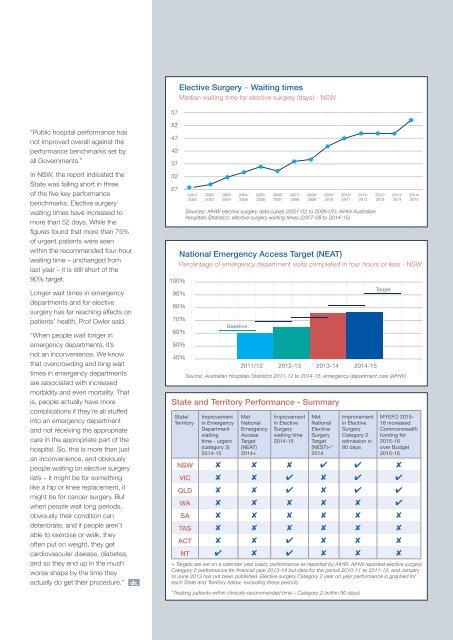
Elective Surgery – Waiting times<br />
Median waiting time for elective surgery (days) - NSW<br />
“Public hospital performance has<br />
not improved overall against the<br />
performance benchmarks set by<br />
all Governments.”<br />
In NSW, the report indicated the<br />
State was falling short in three<br />
of the five key performance<br />
benchmarks. Elective surgery<br />
waiting times have increased to<br />
more than 52 days. While the<br />
figures found that more than 75%<br />
of urgent patients were seen<br />
within the recommended four-hour<br />
waiting time – unchanged from<br />
last year – it is still short of the<br />
90% target.<br />
Longer wait times in emergency<br />
departments and for elective<br />
surgery has far reaching affects on<br />
patients’ health, Prof Owler said.<br />
“When people wait longer in<br />
emergency departments, it’s<br />
not an inconvenience. We know<br />
that overcrowding and long wait<br />
times in emergency departments<br />
are associated with increased<br />
morbidity and even mortality. That<br />
is, people actually have more<br />
complications if they’re all stuffed<br />
into an emergency department<br />
and not receiving the appropriate<br />
care in the appropriate part of the<br />
hospital. So, this is more than just<br />
an inconvenience, and obviously<br />
people waiting on elective surgery<br />
lists – it might be for something<br />
like a hip or knee replacement, it<br />
might be for cancer surgery. But<br />
when people wait long periods,<br />
obviously their condition can<br />
deteriorate, and if people aren’t<br />
able to exercise or walk, they<br />
often put on weight, they get<br />
cardiovascular disease, diabetes,<br />
and so they end up in the much<br />
worse shape by the time they<br />
actually do get their procedure.” dr.<br />
52<br />
47<br />
42<br />
37<br />
32<br />
27<br />
100%<br />
90%<br />
80%<br />
70%<br />
60%<br />
50%<br />
2001/<br />
2002<br />
2002/<br />
2003<br />
2003/<br />
2004<br />
2004/<br />
2005<br />
2005/<br />
2006<br />
2006/<br />
2007<br />
2007/<br />
2008<br />
2008/<br />
2009<br />
2009/<br />
2010<br />
2010/<br />
2011<br />
2011/<br />
2012<br />
Sources: AIHW elective surgery data cubes (2001-02 to 2006-07); AIHW Australian<br />
Hospitals Statistics: elective surgery waiting times (2007-08 to 2014-15)<br />
National Emergency Access Target (NEAT)<br />
Percentage of emergency department visits completed in four hours or less - NSW<br />
Baseline<br />
40%<br />
2011/12 2012-13 2013-14 2014-15<br />
Source: Australian Hospitals Statistics 2011-12 to 2014-15: emergency department care (AIHW)<br />
State and Territory Performance - Summary<br />
State/<br />
Territory<br />
Improvement<br />
in Emergency<br />
Department<br />
waiting<br />
time - urgent<br />
(category 3)<br />
2014-15<br />
Met<br />
National<br />
Emergency<br />
Access<br />
Target<br />
(NEAT)<br />
2014+<br />
Improvement<br />
in Elective<br />
Surgery<br />
waiting time<br />
2014-15<br />
Met<br />
National<br />
Elective<br />
Surgery<br />
Target<br />
(NEST)+*<br />
2014<br />
Improvement<br />
in Elective<br />
Surgery<br />
Category 2<br />
admission in<br />
90 days<br />
2012/<br />
2013<br />
Target<br />
2013/<br />
2014<br />
2014/<br />
2015<br />
MYEFO 2015-<br />
16 increased<br />
Commonwealth<br />
funding for<br />
2015-16<br />
over Budget<br />
2015-16<br />
NSW ✘ ✘ ✘ ✔ ✔ ✘<br />
VIC ✘ ✘ ✔ ✘ ✔ ✔<br />
QLD ✘ ✘ ✔ ✘ ✔ ✔<br />
WA ✘ ✘ ✘ ✘ ✘ ✔<br />
SA ✘ ✘ ✘ ✘ ✘ ✘<br />
TAS ✘ ✘ ✘ ✘ ✘ ✘<br />
ACT ✘ ✘ ✔ ✘ ✘ ✘<br />
NT ✔ ✘ ✔ ✘ ✘ ✘<br />
+ Targets are set on a calendar year basis; performance as reported by AIHW. AIHW reported elective surgery<br />
Category 2 performance for financial year 2013-14 but data for the period 2010-11 to 2011-12, and January<br />
to June 2013 has not been published. Elective surgery Category 2 year on year performance is graphed for<br />
each State and Territory below, excluding these periods.<br />
*Treating patients within clinically recommended time – Category 2 (within 90 days)<br />
amansw.com.au I 11