Operational Plan for the Restoration of Diadromous Fishes to the ...
Operational Plan for the Restoration of Diadromous Fishes to the ...
Operational Plan for the Restoration of Diadromous Fishes to the ...

You also want an ePaper? Increase the reach of your titles
YUMPU automatically turns print PDFs into web optimized ePapers that Google loves.
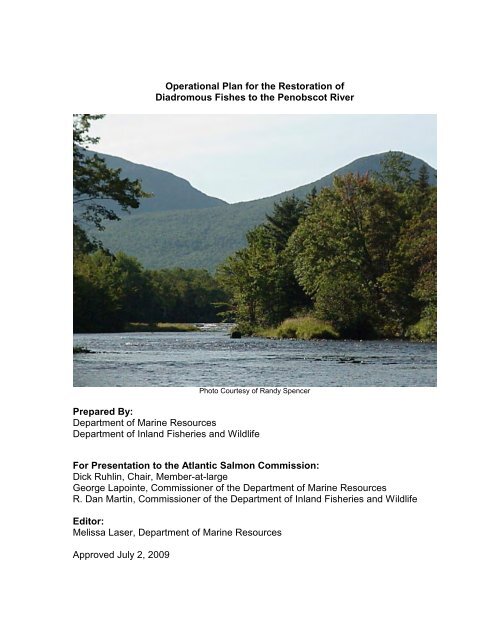
<strong>Operational</strong> <strong>Plan</strong> <strong>for</strong> <strong>the</strong> <strong>Res<strong>to</strong>ration</strong> <strong>of</strong><br />
<strong>Diadromous</strong> <strong>Fishes</strong> <strong>to</strong> <strong>the</strong> Penobscot River<br />
Pho<strong>to</strong> Courtesy <strong>of</strong> Randy Spencer<br />
Prepared By:<br />
Department <strong>of</strong> Marine Resources<br />
Department <strong>of</strong> Inland Fisheries and Wildlife<br />
For Presentation <strong>to</strong> <strong>the</strong> Atlantic Salmon Commission:<br />
Dick Ruhlin, Chair, Member-at-large<br />
George Lapointe, Commissioner <strong>of</strong> <strong>the</strong> Department <strong>of</strong> Marine Resources<br />
R. Dan Martin, Commissioner <strong>of</strong> <strong>the</strong> Department <strong>of</strong> Inland Fisheries and Wildlife<br />
Edi<strong>to</strong>r:<br />
Melissa Laser, Department <strong>of</strong> Marine Resources<br />
Approved July 2, 2009
PRFP Page ii
Table <strong>of</strong> Contents<br />
Introduction ................................................................................................................ 1<br />
Section 1 - Alewife, American eel, American shad, Atlantic salmon, Atlantic<br />
sturgeon, Atlantic <strong>to</strong>mcod, blueback herring, rainbow smelt, sea lamprey, sea-run<br />
brook trout, shortnose sturgeon, and striped bass..................................................... 3<br />
Background ............................................................................................................ 4<br />
Introduction ............................................................................................................ 5<br />
<strong>Operational</strong> Objectives, Measures, and Strategies ................................................ 6<br />
Work <strong>Plan</strong> Table................................................................................................... 15<br />
Work <strong>Plan</strong> Narratives ........................................................................................... 16<br />
References........................................................................................................... 27<br />
Atlantic Salmon .................................................................................................... 28<br />
Introduction .......................................................................................................... 28<br />
Background .......................................................................................................... 28<br />
Strategies <strong>to</strong> Increase Adult Escapement <strong>to</strong> <strong>the</strong> Penobscot Basin....................... 30<br />
<strong>Operational</strong> Objectives ......................................................................................... 30<br />
<strong>Operational</strong> Measures .......................................................................................... 31<br />
Work <strong>Plan</strong> Table................................................................................................... 33<br />
Work <strong>Plan</strong> Narratives ........................................................................................... 35<br />
References........................................................................................................... 46<br />
Section 2 - Passage and Connectivity ..................................................................... 47<br />
Introduction .......................................................................................................... 48<br />
Goal, Objectives, and Strategies.......................................................................... 54<br />
Work <strong>Plan</strong> Table................................................................................................... 59<br />
Work <strong>Plan</strong> Narratives ........................................................................................... 66<br />
References........................................................................................................... 81<br />
Section 3 - Habitat ................................................................................................... 83<br />
Introduction .......................................................................................................... 84<br />
Background .......................................................................................................... 84<br />
Goals, Objectives and Strategies ......................................................................... 85<br />
Work <strong>Plan</strong> Table................................................................................................... 87<br />
Work <strong>Plan</strong> Narratives ........................................................................................... 89<br />
References........................................................................................................... 91<br />
Section 4 - Non-Native species including Nor<strong>the</strong>rn pike .......................................... 93<br />
Introduction .......................................................................................................... 94<br />
Goal, Objectives and Strategies........................................................................... 94<br />
Work <strong>Plan</strong> Table................................................................................................... 96<br />
Work <strong>Plan</strong> Narratives ........................................................................................... 98<br />
PRFP Page iii
Section 5 - Analyze, Syn<strong>the</strong>size, and Communicate Results <strong>to</strong> In<strong>for</strong>m Future<br />
Adaptive Management Actions, Analyses, and Research...................................... 102<br />
Introduction ........................................................................................................ 103<br />
Goal, Objectives and Strategies......................................................................... 103<br />
Work <strong>Plan</strong> Table................................................................................................. 106<br />
Work <strong>Plan</strong> Narratives ......................................................................................... 109<br />
Appendices ............................................................................................................ 115<br />
Appendix A - Role <strong>of</strong> Hatchery Releases or Exogenous S<strong>to</strong>ck Transfers in Alosine<br />
<strong>Res<strong>to</strong>ration</strong> ............................................................................................................ 116<br />
Appendix B - Viability <strong>of</strong> Salmon Sub-Populations by Reach in <strong>the</strong> Penobscot Basin<br />
............................................................................................................................... 130<br />
Appendix C - Penobscot Habitat and Freshwater Juvenile Atlantic Salmon<br />
Production Potential............................................................................................... 141<br />
Appendix D - Adaptive Management Guidance <strong>for</strong> Fisheries Management in <strong>the</strong><br />
Penobscot Basin.................................................................................................... 162<br />
Appendix E - Atlantic Salmon Fisheries Management Options and Strategies...... 171<br />
Appendix F - Atlantic Salmon Strategic Objectives................................................ 178<br />
Appendix G - Habitat Survey and Assessment <strong>Plan</strong> <strong>for</strong> <strong>the</strong> Penobscot Basin....... 187<br />
Appendix H - Developing a Sampling <strong>Plan</strong> <strong>for</strong> <strong>the</strong> Penobscot Basin ..................... 190<br />
Penobscot Watershed Survey Design ................................................................... 195<br />
Appendix I – Downstream Passage Studies <strong>for</strong> Atlantic Salmon ........................... 199<br />
Appendix J – Nor<strong>the</strong>rn Pike Risk Assessment <strong>for</strong> Piscataquis River ..................... 206<br />
Appendix K – Nor<strong>the</strong>rn Pike Movement Barrier Risk Assessment Survey............. 300<br />
Addendum - Response <strong>to</strong> Comments and Suggested changes <strong>to</strong> <strong>the</strong> Draft<br />
<strong>Operational</strong> <strong>Plan</strong> <strong>for</strong> <strong>the</strong> <strong>Res<strong>to</strong>ration</strong> <strong>of</strong> <strong>Diadromous</strong> <strong>Fishes</strong> <strong>to</strong> <strong>the</strong> Penobscot River<br />
7-2-09……………………………………………………………………………………...330<br />
Addendum - Memorandum <strong>of</strong> Understanding Penobscot River Invasive Species and<br />
Barrier Agreement: A Joint Agreement Between <strong>the</strong> Maine Department <strong>of</strong> Inland<br />
Fisheries and Wildlife and <strong>the</strong> Maine Department <strong>of</strong> Marine<br />
Resources………………………………………………………………………………...354<br />
PRFP Page iv
Introduction<br />
The overarching goal <strong>of</strong> <strong>the</strong> <strong>Operational</strong> <strong>Plan</strong> is <strong>to</strong> res<strong>to</strong>re and guide management <strong>of</strong><br />
diadromous fish populations, aquatic resources, and <strong>the</strong> ecosystems on which <strong>the</strong>y<br />
depend, <strong>for</strong> <strong>the</strong>ir intrinsic, ecological, economic, recreational, scientific, and<br />
educational values <strong>for</strong> use by <strong>the</strong> public. The state fisheries agencies, <strong>the</strong> Maine<br />
Department <strong>of</strong> Marine Resources (MDMR) and <strong>the</strong> Maine Department <strong>of</strong> Inland<br />
Fisheries and Wildlife (MDIFW) are committed <strong>to</strong> working <strong>to</strong>ge<strong>the</strong>r and in<br />
cooperation with <strong>the</strong> Penobscot Indian Nation (PIN), <strong>the</strong> U.S. Fish and Wildlife<br />
Service (USFWS), and National Oceanic and Atmospheric Administration’s National<br />
Marine Fisheries Service (NOAA Fisheries), in this ef<strong>for</strong>t. There are also many<br />
stakeholders with an interest in <strong>the</strong> watershed that have led and continue <strong>to</strong> lead<br />
res<strong>to</strong>ration ef<strong>for</strong>ts. Various non-governmental organizations (NGOs) have worked <strong>to</strong><br />
res<strong>to</strong>re diadromous fish populations by succeeding with removal <strong>of</strong> a hydropower<br />
dam in Souadabscook Stream, <strong>the</strong> removal <strong>of</strong> <strong>the</strong> Brownville Dam, and active ef<strong>for</strong>ts<br />
<strong>to</strong> improve fish passage in Blackman Stream, Great Works Stream, and<br />
Sedgeunkedunk Stream. Researchers from <strong>the</strong> University <strong>of</strong> Maine (UM) and o<strong>the</strong>r<br />
institutions have worked cooperatively with state and federal agencies, providing<br />
detailed in<strong>for</strong>mation on multiple fish species and <strong>the</strong> environment throughout <strong>the</strong><br />
basin. The Penobscot River <strong>Res<strong>to</strong>ration</strong> Trust (PRRT or Trust) has worked tirelessly<br />
on <strong>the</strong> Penobscot River <strong>Res<strong>to</strong>ration</strong> Project (PRRP).<br />
The <strong>Operational</strong> <strong>Plan</strong> is intended <strong>to</strong> complement <strong>the</strong> PRRP, which was made<br />
possible by <strong>the</strong> Lower Penobscot River Multiparty Settlement Agreement signed in<br />
June 2004 by PPL Corporation (PPL), state and federal resource agencies, <strong>the</strong> PIN,<br />
and various NGOs 1 . This unprecedented and his<strong>to</strong>ric agreement provides <strong>the</strong><br />
PRRT, a non-pr<strong>of</strong>it organization, <strong>the</strong> option <strong>to</strong> purchase three dams from PPL,<br />
decommission and remove <strong>the</strong> two lowermost dams on <strong>the</strong> main stem <strong>of</strong> <strong>the</strong> river<br />
(Veazie and Great Works), and decommission and pursue construction <strong>of</strong> an<br />
innovative experimental fish bypass around <strong>the</strong> Howland Dam, located upstream on<br />
<strong>the</strong> Piscataquis River.<br />
MDMR and MDIFW completed a Strategic <strong>Plan</strong> <strong>for</strong> <strong>the</strong> <strong>Res<strong>to</strong>ration</strong> <strong>of</strong> <strong>Diadromous</strong><br />
<strong>Fishes</strong> <strong>to</strong> <strong>the</strong> Penobscot River (SMP) in 2007 2 . The plan was reviewed by <strong>the</strong> PIN,<br />
NOAA, USFWS, and o<strong>the</strong>r interested parties. The plan defined four strategic goals:<br />
(1) coordinating fisheries management activities in<strong>to</strong> a cohesive multispecies<br />
management program, (2) providing safe, timely, and effective fish passage<br />
(upstream and downstream), (3) maintaining or improving habitat <strong>for</strong> diadromous<br />
and select resident species, and (4) adopting an adaptive, ecosystem based<br />
management program.<br />
1<br />
American Rivers, Atlantic Salmon Federation, Maine Audubon, Natural Resources Council <strong>of</strong> Maine,<br />
The Nature Conservancy, and Trout Unlimited<br />
2<br />
Available online at http://www.maine.gov/dmr/searunfish/reports/Penobscot<strong>Plan</strong>March2008.pdf<br />
PRFP Page 1
The operational plan details actions <strong>to</strong> accomplish <strong>the</strong> strategic plan objectives,<br />
incorporates multi-species management, and will be revised as needed in<br />
conjunction with barrier removals and improved access <strong>to</strong> habitat. There is an<br />
urgency <strong>to</strong> begin res<strong>to</strong>ration ef<strong>for</strong>ts <strong>for</strong> shad and river herring and <strong>to</strong> increase ef<strong>for</strong>ts<br />
<strong>to</strong> res<strong>to</strong>re Atlantic salmon; <strong>the</strong>re<strong>for</strong>e some actions identified are currently underway.<br />
The 40 <strong>to</strong> 50-year time frame <strong>for</strong> <strong>the</strong> Strategic <strong>Plan</strong>, spanning 2010 through 2050-<br />
2060, has two stages. The first stage will be through <strong>the</strong> completion <strong>of</strong> <strong>the</strong><br />
Penobscot River <strong>Res<strong>to</strong>ration</strong> Project (approximately 2010-2014) and <strong>the</strong> second<br />
stage will be a 35 <strong>to</strong> 45-year period after <strong>the</strong> Project is complete (approximately<br />
2012-2032).<br />
This plan implements <strong>the</strong> long-term vision and is intended <strong>to</strong> provide guidance <strong>to</strong><br />
MDMR and MDIFW on res<strong>to</strong>ration actions <strong>for</strong> multiple species over <strong>the</strong> next 40-50<br />
years through <strong>the</strong> identification <strong>of</strong> shared goals, objectives, and strategies <strong>for</strong><br />
res<strong>to</strong>ration, recovery, and management <strong>of</strong> multiple fish species and ecosystem<br />
processes, using an adaptive management approach. The key ecosystem<br />
processes are hydrology, connectivity, and species assemblages. Understanding<br />
<strong>the</strong>se processes are going <strong>to</strong> require collaborative ef<strong>for</strong>ts with researchers and o<strong>the</strong>r<br />
state and federal agencies. A primary responsibility <strong>of</strong> <strong>the</strong> interagency committee,<br />
as established under <strong>the</strong> Strategic <strong>Plan</strong>, will be <strong>to</strong> address interagency management<br />
issues in areas <strong>of</strong> overlapping jurisdiction. Members <strong>of</strong> <strong>the</strong> Interagency Technical<br />
Committee include, MDMR, MDIFW, PIN, NOAA, USFWS, and <strong>the</strong> Trust. MDMR<br />
and MDIFW will develop annual work plans based on <strong>the</strong> operational plan.<br />
The plan is divided in<strong>to</strong> six sections. The first section represents species specific<br />
management in<strong>for</strong>mation and is broken in<strong>to</strong> two parts: 1) alewife, American eel,<br />
American shad, Atlantic sturgeon, Atlantic <strong>to</strong>mcod, blueback herring, rainbow smelt,<br />
sea lamprey, sea-run brook trout, shortnose sturgeon, and striped bass; and 2)<br />
Atlantic salmon. Section 2 discusses passage and connectivity issues <strong>for</strong> all species<br />
in <strong>the</strong> drainage. Section 3 addresses habitat issues <strong>for</strong> all species in <strong>the</strong> drainage.<br />
Issues pertaining <strong>to</strong> non-natives species are included in Section 4 with a risk<br />
assessment <strong>for</strong> Nor<strong>the</strong>rn pike included in Appendix I. Section 5 focuses on<br />
mechanisms <strong>to</strong> integrate <strong>the</strong> various components including data management and<br />
analysis, through communication, analysis and plan syn<strong>the</strong>sis. Finally, eleven<br />
appendices accompany <strong>the</strong> plan.<br />
PRFP Page 2
Section 1 - Alewife, American eel, American shad, Atlantic salmon, Atlantic<br />
sturgeon, Atlantic <strong>to</strong>mcod, blueback herring, rainbow smelt, sea lamprey, searun<br />
brook trout, shortnose sturgeon, and striped bass<br />
PRFP Page 3
Alewife, American eel, American shad, Atlantic sturgeon, Atlantic <strong>to</strong>mcod,<br />
blueback herring, rainbow smelt, sea lamprey, sea-run brook trout, shortnose<br />
sturgeon, and striped bass<br />
Author: Gail Wippelhauser<br />
Background<br />
As described in <strong>the</strong> Strategic <strong>Plan</strong> <strong>for</strong> <strong>the</strong> <strong>Res<strong>to</strong>ration</strong> <strong>of</strong> <strong>Diadromous</strong> <strong>Fishes</strong> <strong>to</strong> <strong>the</strong><br />
Penobscot River (“Strategic <strong>Plan</strong>” DMR DIFW 2008) <strong>the</strong> Penobscot River basin once<br />
supported large populations <strong>of</strong> diadromous fishes. The his<strong>to</strong>rical abundance <strong>of</strong><br />
<strong>the</strong>se fish will never be known with certainty, because populations had declined long<br />
be<strong>for</strong>e 1867 when Maine’s first Commissioners <strong>of</strong> Fisheries were appointed.<br />
Although in<strong>for</strong>mation about his<strong>to</strong>rical abundance was scarce, <strong>the</strong> Commissioners<br />
described <strong>the</strong> his<strong>to</strong>rical range <strong>of</strong> commercially important species, and this<br />
in<strong>for</strong>mation has been summarized in <strong>the</strong> Strategic <strong>Plan</strong>. Using in<strong>for</strong>mation on <strong>the</strong><br />
his<strong>to</strong>rical range <strong>of</strong> alewife and American shad and current data on habitat<br />
production, DMR developed an order-<strong>of</strong>-magnitude estimate <strong>of</strong> <strong>the</strong> number <strong>of</strong> adult<br />
alewife and shad that could return <strong>to</strong> <strong>the</strong> river each year. 3<br />
This <strong>Operational</strong> <strong>Plan</strong> proposes measures <strong>to</strong> res<strong>to</strong>re native diadromous fishes <strong>to</strong><br />
<strong>the</strong>ir his<strong>to</strong>ric habitat, <strong>to</strong> res<strong>to</strong>re shad and alewife <strong>to</strong> <strong>the</strong>ir estimated his<strong>to</strong>ric<br />
abundance, and <strong>to</strong> significantly increase population abundances <strong>of</strong> <strong>the</strong> o<strong>the</strong>r<br />
diadromous species within a period <strong>of</strong> 40-50 years. The state <strong>of</strong> Maine proposes <strong>to</strong><br />
res<strong>to</strong>re diadromous fish populations on this aggressive schedule in order <strong>to</strong> minimize<br />
<strong>the</strong> risk <strong>of</strong> extirpation <strong>of</strong> extant populations due <strong>to</strong> random events (bycatch) or longterm<br />
environmental change (global warming), <strong>to</strong> provide ecological benefits <strong>to</strong> o<strong>the</strong>r<br />
species in <strong>the</strong> watershed including Atlantic salmon, and <strong>to</strong> provide fishing<br />
opportunities and a local source <strong>of</strong> food <strong>for</strong> people living in <strong>the</strong> watershed.<br />
This part <strong>of</strong> <strong>the</strong> operational plan outlines <strong>the</strong> prioritized objectives and tasks that will<br />
be undertaken <strong>to</strong> implement components <strong>of</strong> <strong>the</strong> Strategic <strong>Plan</strong> relevant <strong>to</strong> alewife<br />
(species-<strong>of</strong>-concern), American eel, American shad, Atlantic sturgeon (species-<strong>of</strong>concern),<br />
Atlantic <strong>to</strong>mcod, blueback herring (species-<strong>of</strong>-concern), rainbow smelt<br />
(species-<strong>of</strong>-concern), sea lamprey, sea-run brook trout, shortnose sturgeon<br />
(endangered species), and striped bass. There are no existing management actions<br />
<strong>for</strong> <strong>the</strong>se species in <strong>the</strong> Penobscot, because <strong>of</strong> <strong>the</strong>ir general inability <strong>to</strong> migrate<br />
beyond <strong>the</strong> Veazie Dam (i.e., <strong>the</strong>y cannot or will not use <strong>the</strong> existing upstream<br />
passage facility), and because <strong>of</strong> past funding and staffing constraints.<br />
3 The methodology <strong>for</strong> developing estimates is described in <strong>the</strong> Strategic <strong>Plan</strong>.<br />
PRFP Page 4
Introduction<br />
Five species (shortnose sturgeon, Atlantic sturgeon, rainbow smelt, Atlantic <strong>to</strong>mcod,<br />
and sea-run brook trout) likely did not migrate beyond <strong>the</strong> set <strong>of</strong> falls where Mil<strong>for</strong>d<br />
Dam is now located, and DMR assumes this site was <strong>the</strong>ir his<strong>to</strong>rical upstream limit 4 .<br />
With two exceptions, little is known about <strong>the</strong> current status <strong>of</strong> <strong>the</strong>se species. In <strong>the</strong><br />
1970s, DMR estimated <strong>the</strong> adult smelt population <strong>to</strong> be two million fish, comprised <strong>of</strong><br />
at least five spawning s<strong>to</strong>cks, and <strong>the</strong> annual catch <strong>to</strong> be 40,000-60,000 pounds<br />
(versus 266,875 or 366,875 pounds in 1887). Fernandez (2008) caught 25 Atlantic<br />
sturgeon and 151 shortnose sturgeon in <strong>the</strong> lower Penobscot (Veazie <strong>to</strong> Bucksport)<br />
between June 2006 and November 2007, and discovered a shortnose sturgeon<br />
overwintering area in Bangor near river km 36.5. His preliminary estimates <strong>of</strong> <strong>the</strong><br />
river-wide shortnose sturgeon population were 1425 (95% CI: 203, 2647) and<br />
1531(95% CI: 885, 5681); no Atlantic sturgeon were recaptured, so a population<br />
estimate was not be made.<br />
Six species his<strong>to</strong>rically migrated varying distances beyond <strong>the</strong> falls at Mil<strong>for</strong>d 4 . The<br />
catadromous American eel was <strong>the</strong> most widely distributed, and traveled in<strong>to</strong> <strong>the</strong><br />
West Branch. Eels were commercially harvested in <strong>the</strong> 1990s as far upriver as<br />
Millinocket, and are still common in <strong>the</strong> watershed (Yoder 2005, NOAA 2008).<br />
Alewife, American shad, and presumably <strong>the</strong> closely related blueback herring<br />
reached <strong>the</strong> mouth <strong>of</strong> Wassataquoik Stream on <strong>the</strong> East Branch, Grand Falls or<br />
Shad Pond on <strong>the</strong> West Branch, and were found in all <strong>the</strong> major tributaries.<br />
Currently, a small number <strong>of</strong> alewife pass <strong>the</strong> Veazie Dam each year, American<br />
shad and blueback herring rarely do, and <strong>the</strong>re is no evidence that <strong>the</strong>se species<br />
regularly migrate beyond <strong>the</strong> Mil<strong>for</strong>d Dam (Yoder 2005, NOAA 2008; DIFW<br />
electr<strong>of</strong>ishing databases). Remnant populations <strong>of</strong> American shad and blueback<br />
herring exist below <strong>the</strong> Veazie Dam (sizes unknown), and alewife runs occur in<br />
Souadabscook Stream (size unknown), and <strong>the</strong> Orland River.<br />
Although <strong>the</strong>re is no in<strong>for</strong>mation on <strong>the</strong>ir his<strong>to</strong>rical distribution, sea lamprey and<br />
striped bass probably migrated above Mil<strong>for</strong>d. Yoder (2005) and NOAA (2008)<br />
found sea lamprey below and above West Enfield. In some years, striped bass are<br />
<strong>of</strong>ten seen in <strong>the</strong> Veazie trap in substantial numbers, but <strong>the</strong>re is no evidence that<br />
<strong>the</strong>y his<strong>to</strong>rically spawned in <strong>the</strong> Penobscot River (as <strong>the</strong>y did in <strong>the</strong> Kennebec) or<br />
that <strong>the</strong>y currently do.<br />
S<strong>to</strong>cking is being proposed <strong>to</strong> res<strong>to</strong>re alewife and American shad above Mil<strong>for</strong>d.<br />
Be<strong>for</strong>e making this decision, DMR considered <strong>the</strong> past success <strong>of</strong> s<strong>to</strong>cking<br />
programs and existing genetic in<strong>for</strong>mation on population differentiation (Appendix A).<br />
Four methods will be used <strong>to</strong> assess <strong>the</strong> res<strong>to</strong>ration <strong>of</strong> alewife, American eel,<br />
American shad, blueback herring, sea lamprey, and striped bass: daily counts at fish<br />
4 Described in <strong>the</strong> Strategic <strong>Plan</strong>.<br />
PRFP Page 5
passages, weekly biological samples taken at Mil<strong>for</strong>d, biweekly beach seine<br />
surveys, and annual boat electr<strong>of</strong>ishing survey. Additional special methods may be<br />
needed <strong>for</strong> <strong>the</strong> remaining species.<br />
<strong>Operational</strong> Objectives, Measures, and Strategies<br />
Throughout this section <strong>of</strong> <strong>the</strong> <strong>Operational</strong> <strong>Plan</strong> <strong>the</strong> first migration season after <strong>the</strong><br />
removal <strong>of</strong> both Great Works Dam and Veazie Dam is termed Yr0. Fur<strong>the</strong>r, selfsustaining<br />
is defined as “A population that exists in sufficient numbers <strong>to</strong> replace<br />
itself through time without supplementation (hatchery or wild caught fish or eggs).”<br />
1.0 Objective: Rebuild <strong>the</strong> shortnose sturgeon population <strong>to</strong> self-sustaining<br />
levels in his<strong>to</strong>rical habitat within 40 years.<br />
1.1 Measure: Beginning in Yr0 <strong>the</strong> shortnose sturgeon population will increase by<br />
30% 5 each generation (14 years) by natural reproduction <strong>of</strong> wild fish.<br />
1.1.1 Strategy: Estimate <strong>the</strong> size <strong>of</strong> <strong>the</strong> existing population by 2012 (or prior <strong>to</strong> Yr0).<br />
1.1.2 Strategy: Identify existing essential habitat by 2012 (or prior <strong>to</strong> Yr0).<br />
1.1.3 Strategy: Obtain genetic analysis by 2012 (or prior <strong>to</strong> Yr0).<br />
1.1.4 Strategy: Identify and quantify sources <strong>of</strong> mortality.<br />
1.1.5 Strategy: Estimate <strong>the</strong> size <strong>of</strong> <strong>the</strong> population at least 20 and 40 years after Yr0.<br />
1.1.6 Strategy: Reassess essential habitat 1-2, 20 and 40 years after Yr0.<br />
2.0 Objective: Rebuild <strong>the</strong> Atlantic sturgeon population <strong>to</strong> self-sustaining<br />
levels in his<strong>to</strong>rical habitat within 40 years.<br />
2.1 Measure: Beginning in Yr0 <strong>the</strong> Atlantic sturgeon population will increase by 30% 6<br />
each generation (20 years) by natural reproduction <strong>of</strong> wild fish.<br />
2.1.1 Strategy: Estimate <strong>the</strong> size <strong>of</strong> <strong>the</strong> existing population by 2012 (or prior <strong>to</strong> Yr0).<br />
2.1.2 Strategy: Identify existing essential habitat by 2012 (or prior <strong>to</strong> Yr0).<br />
2.1.3 Strategy: Obtain genetic analysis by 2012 (or prior <strong>to</strong> Yr0).<br />
2.1.4 Strategy: Identify and quantify sources <strong>of</strong> mortality.<br />
2.1.5 Strategy: Estimate <strong>the</strong> size <strong>of</strong> <strong>the</strong> population at least 20 and 40 years after Yr0.<br />
2.1.6 Strategy: Reassess essential habitat 1-2, 20 and 40 years after Yr0.<br />
5 Based on rate <strong>of</strong> increase in Kennebec River shortnose sturgeon determined from mark-recapture<br />
population estimates made in <strong>the</strong> late-1970s and mid-1990s. During this period <strong>the</strong>re was significant<br />
improvement in water quality, but no change in available habitat. Ongoing telemetry studies indicate<br />
that shortnose sturgeon in <strong>the</strong> Penobscot River may be part <strong>of</strong> <strong>the</strong> Kennebec/Androscoggin<br />
population.<br />
6 CPUE data <strong>for</strong> Atlantic sturgeon in <strong>the</strong> Kennebec River increased by a fac<strong>to</strong>r <strong>of</strong> 10-25 over a 20year<br />
period from 1977 <strong>to</strong> 2000. However, <strong>the</strong> data are limited, and high flows in <strong>the</strong> early years may<br />
have caused low catches and low CPUE. In <strong>the</strong> absence <strong>of</strong> o<strong>the</strong>r data, we have assumed that<br />
Atlantic sturgeon will increase at <strong>the</strong> same rate as shortnose sturgeon.<br />
PRFP Page 6
3.0 Objective: Rebuild <strong>the</strong> rainbow smelt population <strong>to</strong> self-sustaining levels in<br />
his<strong>to</strong>rical habitat within 45 years.<br />
3.1 Measure: In Yr15 (5 generations or 15 years after Yr0) <strong>the</strong> rainbow smelt<br />
population will equal or exceed <strong>the</strong> 1970 level <strong>of</strong> abundance 7 or <strong>the</strong> current<br />
abundance, age structure will not have declined from <strong>the</strong> 1970 level or current level,<br />
and smelt will utilize <strong>the</strong> newly accessible habitat between Veazie and Mil<strong>for</strong>d.<br />
3.1.1 Strategy: Document <strong>the</strong> age structure <strong>of</strong> <strong>the</strong> existing rainbow smelt population<br />
by 2012 (or prior <strong>to</strong> Yr0).<br />
3.1.2 Strategy: Estimate <strong>the</strong> size <strong>of</strong> <strong>the</strong> rainbow smelt population in 2012 (or prior <strong>to</strong><br />
Yr0) if feasible.<br />
3.1.3 Strategy: Estimate <strong>the</strong> size <strong>of</strong> <strong>the</strong> rainbow smelt population and assess its use<br />
<strong>of</strong> habitat between Veazie and Mil<strong>for</strong>d by Yr15.<br />
3.1.4 Strategy: Conduct biweekly beach seine survey <strong>to</strong> assess juvenile fishes.<br />
3.2 Measure: In Yr30 <strong>the</strong> rainbow smelt population will be 25% larger than in Yr15.<br />
3.2.1 Strategy: Estimate <strong>the</strong> size <strong>of</strong> <strong>the</strong> rainbow smelt population in Yr30.<br />
3.3 Measure: In Yr45 <strong>the</strong> rainbow smelt population will be 25% larger than in Yr30.<br />
3.3.1 Strategy: Estimate <strong>the</strong> size <strong>of</strong> <strong>the</strong> rainbow smelt population in Yr45.<br />
4.0 Objective: Rebuild <strong>the</strong> Atlantic <strong>to</strong>mcod population <strong>to</strong> self-sustaining levels<br />
in his<strong>to</strong>rical habitat within 40 years.<br />
4.1 Measure: Each five generations (15 years) after Yr0 <strong>the</strong> Atlantic <strong>to</strong>mcod<br />
population will increase by 10%, and mercury accumulation in body tissue will have<br />
decreased from 2008 levels.<br />
4.1.1 Strategy: Develop and institute a survey <strong>to</strong> assess trends in Atlantic <strong>to</strong>mcod<br />
population and habitat use.<br />
4.1.2 Strategy: Test <strong>to</strong>mcod periodically <strong>for</strong> mercury (see Habitat Section 3).<br />
4.1.3 Strategy: Conduct biweekly beach seine survey <strong>to</strong> assess juvenile fishes.<br />
5.0 Objective: Rebuild sea-run brook trout populations <strong>to</strong> self-sustaining<br />
levels in his<strong>to</strong>ric habitat within 40 years.<br />
5.1 Measure: The current distribution and abundance <strong>of</strong> brook trout populations with<br />
a sea-run component will remain stable or increase by Yr10 (10 years after Yr0).<br />
5.1.1. Identify brook trout populations in <strong>the</strong> Penobscot basin with a sea-run<br />
component by Yr5 (5 years after Yr0).<br />
7 DMR estimated <strong>the</strong> rainbow smelt population in <strong>the</strong> Penobscot River at two million fish, comprised<br />
<strong>of</strong> at least five spawning s<strong>to</strong>cks[0].<br />
PRFP Page 7
6.0 Objective: Res<strong>to</strong>re alewife populations <strong>to</strong> self-sustaining levels in<br />
his<strong>to</strong>rical habitat within 40-48 years.<br />
6.1 Measure: Res<strong>to</strong>re populations <strong>to</strong> 13 Phase 1 his<strong>to</strong>rical lakes (Table 1; Fig. 1) in<br />
16 years (four generations) or less beginning in 2010 or 2011.<br />
6.1.1 Strategy: Assess availability and sufficiency <strong>of</strong> in-basin or nearest out-<strong>of</strong>-basin<br />
sources <strong>of</strong> approximately 97,500 broods<strong>to</strong>ck by 2010 or 2011.<br />
6.1.2 Strategy: Meet with lake associations prior <strong>to</strong> s<strong>to</strong>cking new habitat.<br />
6.1.3 Strategy: S<strong>to</strong>ck approximately six adult alewives per surface acre (97,500<br />
<strong>to</strong>tal) in Phase 1 lakes annually from 2010 (2011) <strong>to</strong> 2026 (2027) or until annual<br />
return rates <strong>to</strong> each lake are at least 35 adult per acre <strong>for</strong> four successive years,<br />
which equals annual adult returns at Mil<strong>for</strong>d <strong>of</strong> at least 532,000 fish.<br />
6.1.4 Strategy: Moni<strong>to</strong>r adult alewife returns by annual counts at Mil<strong>for</strong>d, West<br />
Enfield, Pumpkin Hill, and Howland 8 , and conduct weekly biological sampling at<br />
Mil<strong>for</strong>d.<br />
6.1.5 Strategy: Assess and improve if needed upstream and downstream passage at<br />
barriers (see Passage and Connectivity 16.1, 17.0, 18.0 and Non-native species<br />
23.0 <strong>for</strong> timetables).<br />
6.1.6 Strategy: Conduct biweekly beach seine survey <strong>to</strong> assess juvenile fishes.<br />
6.1.7. Strategy: Conduct annual boat electr<strong>of</strong>ishing survey <strong>to</strong> assess changes in<br />
community structure.<br />
6.2 Measure: Res<strong>to</strong>re populations <strong>to</strong> 18-22 his<strong>to</strong>rical lakes (Table 1; Fig. 1)<br />
approximately every 16 years after annual return rates <strong>to</strong> each Phase1 lake is at<br />
least 35 adult per acre <strong>for</strong> four successive years.<br />
6.2.1 Strategy: Use computer model (e.g., USFWS barrier model) <strong>to</strong> prioritize<br />
remaining lakes <strong>to</strong> be s<strong>to</strong>cked by lake size, trophic status, number <strong>of</strong> downstream<br />
hydropower and nonhydropower dams, potential natural barriers, and distance <strong>to</strong> <strong>the</strong><br />
ocean or <strong>to</strong> Mil<strong>for</strong>d Dam 9 .<br />
6.2.2 Strategy: S<strong>to</strong>ck approximately six adult alewives per surface acre in remaining<br />
ponds using fish captured at Mil<strong>for</strong>d.<br />
8 Special techniques such as video moni<strong>to</strong>ring may be needed at Howland.<br />
9 These are potential fac<strong>to</strong>rs <strong>to</strong> be considered, and are not listed in order <strong>of</strong> priority.<br />
PRFP Page 8
Table 1. List <strong>of</strong> lakes above Veazie Dam believed <strong>to</strong> his<strong>to</strong>rically have had alewife<br />
runs (some Phase 3 lakes may be above natural barriers). Total hydro reflects <strong>the</strong><br />
number <strong>of</strong> hydropower dams downstream <strong>of</strong> <strong>the</strong> waterbody after <strong>the</strong> removal <strong>of</strong><br />
Veazie and Great Works and decommissioning <strong>of</strong> Howland.<br />
Surface<br />
Total Total<br />
River/ Stream Waterbody MIDAS Phase acres S<strong>to</strong>cking hydro nonhydro<br />
Blackman Chemo Pond 4278 1 1,146 6,876 0 2<br />
Pushaw Pushaw Lake 80 1 5,056 30,336 1 1<br />
Pushaw Little Pushaw Pond 2156 1 411 2,466 1 1<br />
Pushaw Mud Pond 2278 1 366 2,195 1 0<br />
Pushaw Boyd Lake 2158 1 1,005 6,030 1 1<br />
Passadumkeag Saponac Pond 4722 1 922 5,532 2 0<br />
Passadumkeag Madagascal Pond 2254 1 790 4,740 2 0<br />
Sebois Endless Lake 942 1 1,499 8,994 1 0<br />
Sebois Cedar Lake 2004 1 685 4,110 1 0<br />
Sebois East Branch Lake 2130 1 1,122 6,732 1 0<br />
Mattamiscontis Mattamiscontis Lake 2140 1 1,025 6,150 2 3<br />
Mattamiscontis Little Mattamiscontis Lake 2138 1 275 1,650 2 2<br />
Mattamiscontis South Branch Lake 2144 1 2,035 12,210 2 2<br />
Blackman Parks Pond 4272 2 124 744 0 3<br />
Blackman Davis Pond 4276 2 417 2,502 0 3<br />
Passadumkeag Eskutassis Pond 2250 2 876 5,256 2 2<br />
Passadumkeag Number Three Pond 9635 2 659 3,954 2 0<br />
Pleasant Ebeemee Lake 914 2 940 5,640 1 1<br />
Pleasant Upper Ebeemee Lake 966 2 196 1,176 1 1<br />
Pleasant Silver Lake 922 2 305 1,830 1 1<br />
Piscataquis Harlow Pond 2 595 3,570 3 3<br />
Penobscot Mattanawcook Pond 2226 2 832 4,992 2 2<br />
Penobscot Crooked Pond 2220 2 220 1,320 2 3<br />
Penobscot Folsom Pond 2222 2 282 1,692 2 3<br />
Cambolasse Snag Pond 2228 2 160 960 2 2<br />
Cambolasse Center Pond 2218 2 192 1,152 2 2<br />
Cambolasse Cambolasse Pond 2214 2 211 1,266 2 3<br />
Cambolasse Long Pond 2216 2 153 918 2 4<br />
Cambolasse Egg Pond 2216 2 128 768 2 4<br />
Cambolasse Caribou Pond 2216 2 544 3,264 2 4<br />
Mattakeunk Silver/Mattakeunk Lake 2242 2 570 3,417 2 3<br />
Molunkus Molunkus Lake 3038 2 1,050 6,300 2 0<br />
Molunkus Plunkett Pond 3056 2 435 2,610 2 0<br />
Molunkus Flinn Pond 3036 2 269 1,614 2 0<br />
Wy<strong>to</strong>pitlock Wy<strong>to</strong>pitlock Lake 1702 2 1,152 6,912 2 0<br />
WBr. Mattawankeag Matt'keag/ Up Matt'keag Lk 1686 2 3,330 19,980 2 0<br />
WBr. Mattawankeag Rockabema Lake 3636 2 339 2,034 2 2<br />
EBr. Mattawamkeag Skitacook Lake 2 435 2,610 2 0<br />
Baskahegan Upper Hot Brook Lake 1076 2 912 5,472 2 0<br />
Baskahegan Lower Hot Brook Lake 1072 2 713 4,278 2 0<br />
Baskahegan Crooked Brook Flowage 1082 2 1,645 9,870 2 1<br />
Baskahegan Baskhegan Lake 1078 2 6,944 41,664 2 1<br />
Mattaseunk Mattaseunk Lake 3040 2 576 3,456 2 0<br />
Salmon Salmon Stream Lake 3046 2 659 3,954 3 0<br />
PRFP Page 9
Table 1 (continued). List <strong>of</strong> lakes above Veazie Dam believed <strong>to</strong> his<strong>to</strong>rically have<br />
had alewife runs (some Phase 3 lakes may be above natural barriers). Total hydro<br />
reflects <strong>the</strong> number <strong>of</strong> hydropower dams downstream <strong>of</strong> <strong>the</strong> waterbody after <strong>the</strong><br />
removal <strong>of</strong> Veazie and Great Works and decommissioning <strong>of</strong> Howland.<br />
Surface<br />
Total Total<br />
River/ Stream Waterbody MIDAS Phase acres S<strong>to</strong>cking hydro nonhydro<br />
Passadumkeag Cold Stream Pond 2146 3 3,628 21,768 1 1<br />
Passadumkeag Up Cold Stream Pond 2232 3 186 1,116 1 2<br />
Passadumkeag Nica<strong>to</strong>us Lake 4766 3 5,165 30,990 2 1<br />
Passadumkeag West Lake 503 3 1,344 8,064 2 1<br />
Passadumkeag Duck Lake 4746 3 256 1,536 2 1<br />
Passadumkeag Gassabias Lake 4782 3 896 5,376 2 1<br />
Sebois Seboeis Lake 954 3 4,201 25,206 1 1<br />
Schoodic Schoodic Lake 956 3 7,168 43,008 1 1<br />
Sebec Sebec Lake 848 3 6,803 40,818 2 1<br />
Kingsbury Piper Pond 298 3 420 2,520 4 0<br />
Penobscot Upper Pond 2230 3 506 3,036 2 4<br />
EBr. Mattawamkeag Pleasant Lake 1728 3 1,832 10,992 2 0<br />
PRFP Page 10
Figure 1. Alewife Phase 1 habitat (green) and o<strong>the</strong>r his<strong>to</strong>rical habitat (orange). Red<br />
circles are hydropower dams. Blue circles are presumed nonhydropower dams that<br />
require site visits <strong>for</strong> confirmation.<br />
PRFP Page 11
7.0 Objective: Rebuild <strong>the</strong> American shad population <strong>to</strong> self-sustaining levels<br />
in his<strong>to</strong>rical habitat within 50 years.<br />
7.1 Measure: Beginning in 2010 or 2011, res<strong>to</strong>re approximately 633,300 American<br />
shad (Table 2) in 41-50 years by s<strong>to</strong>cking 12 million hatchery-reared fry annually <strong>for</strong><br />
41-45 years above Mil<strong>for</strong>d Dam, Howland Dam, and/or West Enfield Dam.<br />
7.1.1 Strategy: Identify potential sources <strong>of</strong> broods<strong>to</strong>ck that could provide <strong>the</strong> 1000-<br />
1200 adults needed <strong>to</strong> produce 12 million fry.<br />
7.1.3 Strategy: Double capacity <strong>of</strong> Waldoboro shad hatchery.<br />
7.1.2 Strategy: Use in-basin shad as hatchery broods<strong>to</strong>ck as soon as possible.<br />
7.1.4 Strategy: Develop an assessment plan per ASMFC pro<strong>to</strong>cols <strong>for</strong> evaluating <strong>the</strong><br />
effectiveness <strong>of</strong> <strong>the</strong> hatchery s<strong>to</strong>cking program and compared <strong>to</strong> .<br />
7.1.5 Strategy: Moni<strong>to</strong>r adult shad returns by annual counts at Mil<strong>for</strong>d, West Enfield,<br />
and Howland 10 bypass and weekly biological sampling at Mil<strong>for</strong>d.<br />
7.1.6 Strategy: Assess and improve if needed upstream and downstream passage at<br />
barriers (see Passage and Connectivity objectives 16.1, 17.0, 18.0 and Non-native<br />
species objective 23.0 <strong>for</strong> timetables).<br />
7.1.7 Strategy: Conduct bi-weekly beach seine survey <strong>to</strong> assess juvenile fishes.<br />
7.1.8 Strategy: Conduct annual boat electr<strong>of</strong>ishing survey <strong>to</strong> assess changes in<br />
community structure.<br />
7.1.9 Strategy: Cease fry s<strong>to</strong>cking when at least 633,300 adult shad are passed at<br />
Mil<strong>for</strong>d <strong>for</strong> five years.<br />
7.2 Measure: Res<strong>to</strong>re remaining reaches by allowing returning adults <strong>to</strong> pass<br />
upstream and reproduce naturally (if passage is effective) or truck fish returning<br />
adults upstream and allow <strong>to</strong> reproduce naturally.<br />
10 Special techniques such as video moni<strong>to</strong>ring may be needed at Howland.<br />
PRFP Page 12
Table 2. River habitat that his<strong>to</strong>rically had shad, grouped by <strong>the</strong> number <strong>of</strong> post<br />
PRRT downstream hydropower dams. A plus (e.g. 2+) in <strong>the</strong> hydro dams column<br />
indicates that shad must utilize <strong>the</strong> Howland bypass in addition <strong>to</strong> passing <strong>the</strong><br />
indicated number <strong>of</strong> hydropower dams.<br />
River reach<br />
Group<br />
production<br />
Production <strong>of</strong><br />
adult shad %<br />
Post PRRT<br />
hydro dams<br />
Group 0<br />
Bangor Dam <strong>to</strong> Veazie Dam 22,344 1.4 0<br />
Veazie Dam <strong>to</strong> Great Works Dam 69,737 4.5 0<br />
Great Works Dam <strong>to</strong> Mil<strong>for</strong>d Dam 14,339 0.9 0<br />
106,420<br />
Group 1<br />
Mil<strong>for</strong>d Dam <strong>to</strong> West Enfield Dam 400,560 25.7 1<br />
Passadunkeag mouth <strong>to</strong> Lowell Dam 26,285 1.7 1<br />
Howland Dam <strong>to</strong> Dover-Foxcr<strong>of</strong>t Lower Dam 153,461 9.8 1+<br />
Pleasant mainstem and East Branch 37,769 2.4 1+<br />
Pleasant West Branch 15,257 1.0 1+<br />
633,331<br />
Group 2<br />
West Enfield Dam <strong>to</strong> Mattaceunk Dam 333,196 21.4 2<br />
Mattawamkeag mouth <strong>to</strong> Mattawamkeag Lake 205,744 13.2 2<br />
Lowell Dam <strong>to</strong> Saponic Pond 12,746 0.8 2<br />
D-F Lower <strong>to</strong> D-F Upper Dam 1,053 0.1 2+<br />
552,739<br />
Group 3<br />
Mattaseunk Dam <strong>to</strong> Wassataquoik Stream 204,336 13.1 3<br />
Dover-Foxcr<strong>of</strong>t Upper Dam <strong>to</strong> Guil<strong>for</strong>d Dam 22,591 1.4 3+<br />
226,927<br />
Group 4<br />
Mattaseunk Dam <strong>to</strong> Shad Pond 25,773 1.7 4<br />
Guil<strong>for</strong>d Dam <strong>to</strong> Monson Junction 14,922 1.0 4+<br />
40,695<br />
Total 1,560,111 1,560,111<br />
PRFP Page 13
8.0 Objective: Rebuild <strong>the</strong> blueback herring population <strong>to</strong> self-sustaining<br />
levels in his<strong>to</strong>rical habitat within 40 years.<br />
8.1.Measure: Every four generations (16 years) after Yr0 <strong>the</strong> blueback herring<br />
population above Mil<strong>for</strong>d will increase by 25% by natural reproduction <strong>of</strong> wild fish.<br />
8.1.1 Strategy: Moni<strong>to</strong>r adult alewife returns by annual counts at Mil<strong>for</strong>d, West<br />
Enfield, and Pumpkin Hill fishways and Howland bypass, and weekly biological<br />
sampling at Mil<strong>for</strong>d.<br />
8.1.2 Strategy: Assess and improve if needed upstream and downstream passage at<br />
barriers (see Passage and Connectivity objectives 16.1, 17.0, 18.0 and Non-native<br />
species objective 23.0 <strong>for</strong> timetables).<br />
8.1.3 Strategy: Conduct bi-weekly beach seine survey <strong>to</strong> assess juvenile fishes.<br />
8.1.4 Strategy: Conduct annual boat electr<strong>of</strong>ishing survey <strong>to</strong> assess changes in<br />
community structure.<br />
8.1.5 Strategy: Truck a portion <strong>of</strong> blueback herring from Mil<strong>for</strong>d and release above<br />
Howland and West Enfield.<br />
9. 0 Objective: Rebuild <strong>the</strong> catadromous American eel population in his<strong>to</strong>rical<br />
habitat within 40 years.<br />
9.1. Measure: Five years after Yr0 <strong>the</strong> number <strong>of</strong> American eel recruits <strong>to</strong> <strong>the</strong> Mil<strong>for</strong>d<br />
headpond will increase by a fac<strong>to</strong>r <strong>of</strong> 10, and <strong>the</strong> relative abundance <strong>of</strong> American eel<br />
between Veazie and Mil<strong>for</strong>d will increase by a fac<strong>to</strong>r or 10.<br />
9.1.1 Strategy: Obtain daily counts <strong>of</strong> eel passage at Mil<strong>for</strong>d and weekly biological<br />
in<strong>for</strong>mation (length and weight).<br />
9.1.2. Strategy: Assess and improve if needed upstream and downstream passage<br />
at barriers.<br />
9.1.3 Strategy: Use annual boat electr<strong>of</strong>ishing survey <strong>to</strong> determine relative<br />
abundance and biomass <strong>of</strong> American eel in <strong>the</strong> river.<br />
10.0 Objective: Rebuild <strong>the</strong> sea lamprey population <strong>to</strong> self-sustaining levels in<br />
his<strong>to</strong>rical habitat within 40.<br />
10.1 Measure: Five years after Yr0 <strong>the</strong> number <strong>of</strong> sea lamprey migrating above <strong>the</strong><br />
Mil<strong>for</strong>d headpond will increase by a fac<strong>to</strong>r <strong>of</strong> 10.<br />
10.1.1 Strategy: Obtain daily counts <strong>of</strong> sea lamprey at Mil<strong>for</strong>d and weekly biological<br />
in<strong>for</strong>mation (length and weight).<br />
10.1.2 Strategy: Assess and improve if needed upstream and downstream passage<br />
at barriers (see Passage and Connectivity objectives 16.1, 17.0, 18.0 and Nonnative<br />
species objective 23.0 <strong>for</strong> timetables).<br />
11.0 Objective: Provide access <strong>for</strong> striped bass <strong>to</strong> his<strong>to</strong>rical habitat in <strong>the</strong><br />
Penobscot River within 40 years.<br />
11.1 Measure: Create a recreational striped bass fishery above Mil<strong>for</strong>d in Yr1.<br />
11.1.1 Strategy: Obtain daily counts <strong>of</strong> striped bass at Mil<strong>for</strong>d and weekly biological<br />
in<strong>for</strong>mation (length and weight).<br />
PRFP Page 14
Work <strong>Plan</strong> Table<br />
The budget includes funding <strong>for</strong> one full-time Scientist and four 26-week<br />
Conservation Aides <strong>to</strong> res<strong>to</strong>re 11 species <strong>of</strong> diadromous fish <strong>to</strong> <strong>the</strong> Penobscot. The<br />
Scientist will schedule, supervise, and participate in all work related <strong>to</strong> <strong>the</strong><br />
res<strong>to</strong>ration <strong>for</strong> <strong>the</strong>se species. Tasks include counts <strong>of</strong> upstream diadromous<br />
migrants at Mil<strong>for</strong>d from May 1 – July 15, alewife s<strong>to</strong>cking between May 1 and June<br />
15, obtaining shad broods<strong>to</strong>ck and s<strong>to</strong>cking fry from June 1 – July 31, and weekly<br />
beach seine survey from July 15 – September 30. Budget is estimated <strong>for</strong> 2010-<br />
2014.<br />
No. Action Timeline Responsibility Budget<br />
0.0 One full-time scientist, one full-time Specialist,<br />
four 26-week Conservation Aides<br />
2010-2014 DMR $882,362<br />
1.1.1 - 1.1.3; Estimate size <strong>of</strong> shortnose and Atlantic sturgeon 2007-2009 UM (ongoing)<br />
2.1.1 - 2.1.3 populations and identify critical habitat<br />
1.1.6; 2.1.6 Reassess sturgeon habitat 1-2 years after 2010-2012 PRRT/UM<br />
removal <strong>of</strong> Great Works and Howland<br />
(ongoing)<br />
3.1.1 Determine current rainbow smelt age structure 2011 DMR $15,600<br />
3.1.4, 4.1.3,<br />
6.1.6, 7.1.7,<br />
8.1.3<br />
Conduct beach seine survey <strong>for</strong> juvenile fish 2010-2014 DMR (staff in 0.0;<br />
equipment this<br />
line)<br />
6.1.1 Assess sources <strong>of</strong> alewife broods<strong>to</strong>ck 2009-2010 DMR $0<br />
6.1.2 S<strong>to</strong>ck alewives in phase 1 lakes 2010-2014 DMR (staff in 0.0;<br />
3 trucks/tank this<br />
line)<br />
$244,800<br />
6.1.7; 7.1.8; Conduct annual boat electr<strong>of</strong>ishing survey 2010-2014 PRRT/UM<br />
8.1.4; 9.1.3<br />
(ongoing)<br />
7.1.2 Hatchery expansion 2010 DMR $590,000<br />
7.1 Produce 12M fry 2010-2014 DMR $1,061,827.16<br />
7.1 S<strong>to</strong>ck 12 M fry 2010-2014 DMR (staff in 0.0;<br />
equipment in<br />
6.1.2)<br />
8.1.3 Develop hatchery assessment plan 2009 DMR $0<br />
6.1.4; 7.1.3;<br />
8.1.4; 9.1.1;<br />
10.1.1; 11.1.1;<br />
12.1.1<br />
Moni<strong>to</strong>r returns <strong>of</strong> all species at Mil<strong>for</strong>d 2010-2014 DMR (staff in 0.0)<br />
$2,795,089<br />
PRFP Page 15<br />
$500
Work <strong>Plan</strong> Narratives<br />
1.1.1-1.1.3 and 2.1.1-2.1.2 Estimate <strong>the</strong> size <strong>of</strong> <strong>the</strong> shortnose sturgeon and<br />
Atlantic sturgeon populations, identify <strong>the</strong>ir essential habitat, and complete a<br />
genetic analysis.<br />
This work was initiated by <strong>the</strong> University <strong>of</strong> Maine in 2007, and is expected <strong>to</strong> be<br />
completed in 2010. The ongoing study uses acoustic telemetry, mark-recapture<br />
techniques, DIDSON sonar, and microsatellite DNA analysis <strong>to</strong> accomplish its<br />
objectives. The study is funded by a 4-year NOAA Section 6 grant <strong>to</strong> DMR.<br />
1.1.5 and 2.1.5 Estimate <strong>the</strong> size <strong>of</strong> <strong>the</strong> shortnose sturgeon and Atlantic<br />
sturgeon populations 20 and 40 years after Yr0.<br />
Population estimates should be made at least twice <strong>for</strong> both species after Veazie<br />
and Great Works dams are removed. Assuming that both species will be studied at<br />
<strong>the</strong> same time, <strong>the</strong> longer generation time <strong>of</strong> Atlantic sturgeon should drive <strong>the</strong><br />
timing <strong>of</strong> <strong>the</strong> work. The shortnose sturgeon population, which overwinters in <strong>the</strong><br />
Penobscot, could be assessed on a shorter cycle (14, 28, 42 years) if current studies<br />
using sonar (DIDSON) prove <strong>to</strong> be effective.<br />
1.1.6 and 2.1.6 Reassess essential habitat 1-2 year, 20 and 40 years after Yr0.<br />
Conduct a follow-up telemetry study 1-2 years after <strong>the</strong> removal <strong>of</strong> Veazie and Great<br />
Works dams are removed <strong>to</strong> determine whe<strong>the</strong>r sturgeon are utilizing <strong>the</strong> newly<br />
accessible habitat. Studies <strong>of</strong> habitat use should be made at least twice <strong>for</strong> both<br />
species after Veazie and Great Works dams are removed. Assuming that both<br />
species will be studied at <strong>the</strong> same time, <strong>the</strong> longer generation time <strong>of</strong> Atlantic<br />
sturgeon should drive <strong>the</strong> timing <strong>of</strong> <strong>the</strong> work.<br />
3.1.1 Document <strong>the</strong> age structure <strong>of</strong> <strong>the</strong> existing rainbow smelt population by<br />
2012 (or prior <strong>to</strong> Yr0).<br />
The current age structure should be documented. Declines in rainbow smelt<br />
populations in Massachusetts appear <strong>to</strong> co-occur with decreases in age at first<br />
spawning.<br />
3.1.2 Estimate <strong>the</strong> size <strong>of</strong> <strong>the</strong> rainbow smelt population in 2012(or prior <strong>to</strong> Yr0)<br />
if feasible.<br />
The most recent population estimate was developed from a mark-recapture study<br />
conducted nearly 40 years ago in conjunction with <strong>the</strong> commercial fishery. That<br />
fishery no longer exists, so a similar study would require a large amount <strong>of</strong> fishing<br />
ef<strong>for</strong>t. The existing or proposed assessment studies (rotary screw traps, beach<br />
seine survey, boat electr<strong>of</strong>ishing) may not be useful <strong>for</strong> rainbow smelt. Newer<br />
techniques (e.g. hydroacoustics) or a combination <strong>of</strong> techniques might be more<br />
efficient, but <strong>the</strong> methodology would have <strong>to</strong> be developed.<br />
PRFP Page 16
3.1.3, 3.2.1, and 3.3.1 Estimate <strong>the</strong> size <strong>of</strong> <strong>the</strong> rainbow smelt population and<br />
assess its use <strong>of</strong> habitat between Veazie and Mil<strong>for</strong>d by Yr15; estimate <strong>the</strong> size<br />
<strong>of</strong> <strong>the</strong> population in Yr30 and Yr45.<br />
The size <strong>of</strong> <strong>the</strong> rainbow smelt population and its use <strong>of</strong> <strong>the</strong> habitat above Veazie<br />
should be determined approximately 15 years after <strong>the</strong> two lowermost dams are<br />
removed. Additional populations estimates should be made at 15 year intervals.<br />
New technology may be available in <strong>the</strong> future <strong>to</strong> make this assessment easier <strong>to</strong><br />
accomplish.<br />
3.1.4, 4.1.3, 6.1.6, 7.1.6, and 8.1.3 Conduct biweekly juvenile fish survey.<br />
This would complement <strong>the</strong> surveys that have been occurring in <strong>the</strong> lower Kennebec<br />
and Androscoggin rivers since 1979 and <strong>the</strong> upper Kennebec since <strong>the</strong> removal <strong>of</strong><br />
Edwards Dam. The biweekly beach seine survey provides in<strong>for</strong>mation on multiple<br />
species, and is an ASMFC requirement <strong>for</strong> assessing juvenile alosines and striped<br />
bass on rivers undergoing res<strong>to</strong>ration.<br />
4.1.1 Develop and institute a survey <strong>to</strong> assess trends in <strong>the</strong> Atlantic <strong>to</strong>mcod<br />
population and habitat use.<br />
The current distribution and abundance <strong>of</strong> <strong>the</strong> <strong>to</strong>mcod population is not known, and<br />
<strong>the</strong> existing or proposed assessment studies (rotary screw traps, beach seine<br />
survey, boat electr<strong>of</strong>ishing) may not capture this species. Newer techniques (e.g.<br />
hydroacoustics) or a combination <strong>of</strong> techniques might be more efficient, but <strong>the</strong><br />
methodology would have <strong>to</strong> be developed.<br />
4.1.2 Test <strong>to</strong>mcod periodically <strong>for</strong> mercury.<br />
Atlantic <strong>to</strong>mcod were used <strong>to</strong> determine <strong>the</strong> biological impact <strong>of</strong> mercury released<br />
from <strong>the</strong> HoltraChem site in Orring<strong>to</strong>n. Mercury levels in <strong>to</strong>mcod tissue decreased<br />
downstream from site. Additional testing should occur after remediation is<br />
completed.<br />
4.1.3 Biweekly beach seine survey-see 3.1.4<br />
5.1.1 Identify sea-run brook trout populations in <strong>the</strong> Penobscot basin.<br />
At a minimum, populations <strong>of</strong> brook trout that have a sea-run component should be<br />
identified.<br />
PRFP Page 17
6.1 Res<strong>to</strong>re alewife populations <strong>to</strong> Phase 1 his<strong>to</strong>rical lakes in 16 years or less<br />
beginning in 2010 or 2011.<br />
Alewife runs in lakes located above <strong>the</strong> Veazie Dam are considered extirpated,<br />
because <strong>of</strong> <strong>the</strong> presence <strong>of</strong> lake outlet dams 11 without fish passage, and ineffective<br />
passage <strong>for</strong> this species at Veazie and Great Works dams. DMR proposes <strong>to</strong><br />
res<strong>to</strong>re <strong>the</strong>se runs by s<strong>to</strong>cking six adults per surface acre, which has proven <strong>to</strong> be<br />
successful at many o<strong>the</strong>r locations in <strong>the</strong> state. Thirteen Phase 1 lakes have been<br />
selected initially <strong>for</strong> s<strong>to</strong>cking because <strong>the</strong>y 1) are close <strong>to</strong> sources <strong>of</strong> broods<strong>to</strong>ck so<br />
travel is minimized, 2) have <strong>the</strong> smallest number <strong>of</strong> downstream hydropower dams<br />
so adult and juvenile mortality is reduced, 3) are blocked by <strong>the</strong> smallest number <strong>of</strong><br />
nonhydropower dams so cost <strong>of</strong> improving upstream passage is minimized, 4) will<br />
allow testing <strong>of</strong> upstream and downstream passage efficiency at Mil<strong>for</strong>d, West<br />
Enfield, Howland, and Lowell Tannery within five years, and 5) will generate large<br />
runs that can be captured at Mil<strong>for</strong>d and serve as broods<strong>to</strong>ck <strong>for</strong> res<strong>to</strong>ring <strong>the</strong><br />
remaining lakes. Chemo Pond, which is below Mil<strong>for</strong>d, is also on <strong>the</strong> list <strong>for</strong> s<strong>to</strong>cking<br />
because fish passage will be completed in 2009, prior <strong>to</strong> dam removals.<br />
6.1.1 Assess availability and sufficiency <strong>of</strong> in-basin or nearest out-<strong>of</strong>-basin<br />
sources <strong>of</strong> broods<strong>to</strong>ck.<br />
Approximately 97,500 adult alewife will need <strong>to</strong> be s<strong>to</strong>cked annually in Phase 1<br />
lakes until returns are considered <strong>to</strong> be self-sustaining. The source <strong>of</strong> fish that will<br />
be used <strong>to</strong> s<strong>to</strong>ck <strong>the</strong>se lakes has not yet been determined (Table 3) . DMR, NOAA,<br />
and USFWS will assess potential sources <strong>of</strong> broods<strong>to</strong>ck based on <strong>the</strong> following<br />
criteria: 1) geographical proximity <strong>to</strong> his<strong>to</strong>ric habitat; 2) ability <strong>to</strong> provide 97,500<br />
adult alewife annually <strong>for</strong> up <strong>to</strong> 16 years without harm <strong>to</strong> <strong>the</strong> donor population; 3)<br />
facility <strong>for</strong> capturing, holding, and sorting broods<strong>to</strong>ck; 4) availability <strong>of</strong> staff and<br />
equipment <strong>to</strong> transport and s<strong>to</strong>ck fish; and 5) costs and/or conflicts associated with<br />
existing resource users. With regard <strong>to</strong> geographical proximity, priority will be<br />
placed on using in-basin broods<strong>to</strong>ck; o<strong>the</strong>r sources will be considered following <strong>the</strong><br />
“next-nearest-neighbor” concept. A single, large donor s<strong>to</strong>ck capable <strong>of</strong> providing<br />
97,500 fish without impacting its long-term viability is preferred <strong>for</strong> logistical reasons.<br />
A facility where broods<strong>to</strong>ck can be safely captured, sorted, and held <strong>for</strong> short periods<br />
<strong>of</strong> time will be necessary, and it will need <strong>to</strong> be operational no later than May 1,<br />
2011. DMR currently does not have available staff and equipment that can be<br />
dedicated <strong>to</strong> alewife s<strong>to</strong>cking in <strong>the</strong> Penobscot drainage. However, biologists<br />
dedicated <strong>to</strong> <strong>the</strong> Kennebec and Androscoggin res<strong>to</strong>ration projects regularly s<strong>to</strong>ck<br />
alewife from <strong>the</strong>se watersheds in<strong>to</strong> out-<strong>of</strong>-basin habitat; with a modest amount <strong>of</strong><br />
additional funding, alewife from <strong>the</strong> Kennebec and/or Androscoggin rivers could be<br />
used <strong>to</strong> s<strong>to</strong>ck Phase 1 lakes in <strong>the</strong> Penobscot. If <strong>the</strong> agency assessment <strong>of</strong> sources<br />
<strong>of</strong> broods<strong>to</strong>ck results in selection <strong>of</strong> a run that is commercially harvested, <strong>the</strong><br />
municipality with rights <strong>to</strong> <strong>the</strong> run should be reimbursed <strong>for</strong> lost revenue.<br />
Continued analysis <strong>of</strong> <strong>the</strong> availability and feasibility <strong>of</strong> sources <strong>of</strong> broods<strong>to</strong>ck will be<br />
conducted by DMR (Wippelhauser, Gray, Zink), NOAA (Saunders, Bernier), and<br />
11 Nonhydropower dams.<br />
PRFP Page 18
USFWS (Seavey). Analysis may include in<strong>for</strong>mation on fish abundance and cost <strong>of</strong><br />
obtaining additional abundance in<strong>for</strong>mation; existence <strong>of</strong> current trapping facilities;<br />
and estimates <strong>of</strong> cost, timetable, and environmental impacts <strong>of</strong> alternative trapping<br />
facilities. The analysis will be completed by August 31, 2009.<br />
Table 3. Potential in-basin and out-<strong>of</strong>-basin sources <strong>of</strong> alewife broods<strong>to</strong>ck.<br />
Location Run size Collection facilities/issues<br />
Veazie trap 2335 fish in 2009 Existing salmon trap; limited<br />
access during high flows; no<br />
existing shoreside facilities<br />
<strong>for</strong> handling 97,500 fish<br />
Souadabscook Unknown, sustainable<br />
harvest less than 97,500<br />
Orland Unknown, harvest less than<br />
97,500 in 7 <strong>of</strong> last 10 years<br />
Union 515,600 in 2008; harvest<br />
less than 97,500 in 3 <strong>of</strong> last<br />
10 years<br />
Kennebec<br />
(Lockwood)<br />
Androscoggin<br />
(Brunswick)<br />
Conflict with salmon<br />
broods<strong>to</strong>ck collection<br />
No existing trap or shoreside<br />
collection facility.<br />
Existing tidal trap <strong>for</strong><br />
commercial harvest.<br />
Competition with lobstermen<br />
<strong>for</strong> bait.<br />
Existing trap and shoreside<br />
facilities <strong>for</strong> commercial<br />
harvest and headpond<br />
s<strong>to</strong>cking.<br />
Competition with lobstermen<br />
<strong>for</strong> bait<br />
131,201 fish in 2008 Existing trap and shoreside<br />
facilities <strong>for</strong> handling 97,500<br />
fish.<br />
92,359 fish in 2008 Existing trap and shoreside<br />
facilities <strong>for</strong> handling 97,500<br />
fish.<br />
6.1.2 Meet with lake associations prior <strong>to</strong> s<strong>to</strong>cking new habitat.<br />
DMR must obtain a permit from DIFW <strong>to</strong> s<strong>to</strong>ck inland waters with alewife. DMR will<br />
meet with lake associations and Town <strong>of</strong>ficials at least one year prior <strong>to</strong> address<br />
concerns.<br />
6.1.3 S<strong>to</strong>ck approximately six adult alewives per acre in Phase 1 lakes<br />
annually from 2010(2011) <strong>to</strong> 2026(2027) or until annual return rates are<br />
equivalent <strong>to</strong> at least 35 adult per surface acre <strong>for</strong> four successive years.<br />
PRFP Page 19
DMR has res<strong>to</strong>red alewife runs throughout <strong>the</strong> State by s<strong>to</strong>cking six adults per<br />
surface acre <strong>for</strong> at least one generation (four years). DMR considers runs <strong>to</strong> be selfsustaining<br />
when 35 adults per surface acre return <strong>to</strong> <strong>the</strong> spawning area annually,<br />
and estimates that s<strong>to</strong>cking may have <strong>to</strong> continue <strong>for</strong> as many as four generations<br />
(16 years) <strong>to</strong> achieve that level <strong>of</strong> returns. Approximately 65 tankloads (1100 gallon<br />
tank) <strong>of</strong> fish will be needed <strong>to</strong> s<strong>to</strong>ck Phase 1 lakes (Table 4).<br />
Table 4. Number <strong>of</strong> fish <strong>to</strong> be s<strong>to</strong>cked in Phase 1 lakes.<br />
Phase 1 lakes <strong>for</strong><br />
res<strong>to</strong>ration<br />
Number <strong>of</strong><br />
tankloads<br />
Actual<br />
s<strong>to</strong>cking<br />
Estimated<br />
production<br />
Chemo Pond 5 7,500 269,310<br />
Pushaw Lake 20 30,000 1,188,160<br />
Boyd Lake 4 6,000 236,175<br />
Little Pushaw Pond 2 3,000 96,585<br />
Mud Pond 1 1,500 85,972<br />
Endless Lake 6 9,000 352,265<br />
Cedar Lake 3 4,500 160,975<br />
East Branch Lake 4 6,000 263,677<br />
Saponac Pond 4 6,000 216,670<br />
Madagascal Pond 3 4,500 185,650<br />
South Branch Lake 8 12,000 478,225<br />
Mattamiscontis Lake 4 6,000 240,875<br />
Little Mattamiscontis Lake 1 1,500 64,625<br />
Total 65 97,500 3,839,164<br />
6.1.4 Moni<strong>to</strong>r adult alewife returns by annual counts at Mil<strong>for</strong>d, West Enfield,<br />
Pumpkin Hill, and Howland and biological samples at Mil<strong>for</strong>d.<br />
Counts at each <strong>of</strong> <strong>the</strong> 12 Phase 1 lakes above Mil<strong>for</strong>d <strong>to</strong> determine whe<strong>the</strong>r <strong>the</strong> run<br />
is self-sustaining is not feasible. Moni<strong>to</strong>ring annual adult returns at Mil<strong>for</strong>d and each<br />
<strong>of</strong> <strong>the</strong> four subdrainages being s<strong>to</strong>cked (Pushaw, Passadumkeag, Piscataquis,<br />
mainstem above West Enfield) should be sufficient. Runs in Phase 1 lakes would be<br />
considered self-sustaining when annual adult returns are approximately 532,000 at<br />
Mil<strong>for</strong>d; 116,700 at West Enfield; 60,000 at Pumpkin Hill; and 115,700 at Howland or<br />
239,300 in<strong>to</strong> Pushaw Stream. In addition, <strong>the</strong> presence <strong>of</strong> juveniles or juvenile<br />
emigration should be confirmed at each lake.<br />
Enumerating adult returns at <strong>the</strong>se fishways will allow DMR <strong>to</strong> assess <strong>the</strong> status <strong>of</strong><br />
<strong>the</strong> res<strong>to</strong>ration, <strong>the</strong> timing <strong>of</strong> migrations, and passage effectiveness.<br />
6.1.6 Biweekly beach seine survey-see 3.1.4<br />
6.1.7. and 7.1.7 and 8.1.4 and 9.1.2 Conduct annual boat electr<strong>of</strong>ishing survey<br />
<strong>to</strong> assess changes in community structure.<br />
PRFP Page 20
A boat electr<strong>of</strong>ishing survey (Yoder 2004) showed that Kennebec River between<br />
Augusta and Waterville/Winslow, which was res<strong>to</strong>red <strong>to</strong> free-running state by <strong>the</strong><br />
removal <strong>of</strong> Edwards Dam, was significantly more productive than <strong>the</strong> upstream<br />
impoundments. Because no sampling was conducted when Edwards Dam was in<br />
place, it is not possible <strong>to</strong> attribute <strong>the</strong> increased productivity <strong>to</strong> dam removal and<br />
river res<strong>to</strong>ration. The longer timetable <strong>of</strong> <strong>the</strong> Penobscot Project has allowed similar<br />
electr<strong>of</strong>ishing surveys <strong>to</strong> be conducted prior <strong>to</strong> <strong>the</strong> removal <strong>of</strong> Veazie and Great<br />
Works dams (Yoder 2005; NOAA 2008). These surveys will <strong>for</strong>m <strong>the</strong> baseline <strong>for</strong> an<br />
annual survey <strong>to</strong> assess changes in <strong>the</strong> relative abundance and composition <strong>of</strong> <strong>the</strong><br />
fish community.<br />
6.1.8 Use computer model <strong>to</strong> prioritize remaining lakes <strong>to</strong> be s<strong>to</strong>cked.<br />
DMR has prioritized <strong>the</strong> lakes in<strong>to</strong> three phases. Within <strong>the</strong>se phases, lakes will be<br />
prioritized by lake size, trophic status, distance from <strong>the</strong> ocean, number <strong>of</strong><br />
downstream hydropower dams, number <strong>of</strong> downstream nonhydropower dams, and<br />
feasibility 12 . The USFWS barrier model may be appropriate <strong>for</strong> this analysis. The<br />
barrier model has <strong>the</strong> advantage <strong>of</strong> incorporating <strong>the</strong> most recent barrier surveys as<br />
<strong>the</strong>y are completed.<br />
6.2.1 Res<strong>to</strong>re populations <strong>to</strong> 18-22 his<strong>to</strong>rical lakes 3 approximately every 16<br />
years by s<strong>to</strong>cking six adult alewives per acre in remaining ponds using fish<br />
captured at Mil<strong>for</strong>d.<br />
When returns <strong>to</strong> Phase 1 lakes are greater than 35 adults per acre, <strong>the</strong> excess fish<br />
can be used as broods<strong>to</strong>ck <strong>to</strong> res<strong>to</strong>re runs <strong>to</strong> remaining his<strong>to</strong>rical habitat. Adult<br />
alewives will be captured at Mil<strong>for</strong>d fishlift and trucked <strong>to</strong> upstream habitat.<br />
7.1 Res<strong>to</strong>re approximately 633,300 American shad in 41-50 years by s<strong>to</strong>cking<br />
12 million fry annually <strong>for</strong> 41-45 years above Mil<strong>for</strong>d Dam, Howland Dam,<br />
and/or West Enfield Dam.<br />
American shad are extirpated above Veazie, because passage on <strong>the</strong> mainstem<br />
dams was not available <strong>for</strong> 130 years and <strong>the</strong> current fishway, installed in 1970, is<br />
ineffective at passing <strong>the</strong>m. The size <strong>of</strong> <strong>the</strong> remnant shad population that inhabits<br />
<strong>the</strong> waters below Veazie Dam is unknown, although DMR has estimated it <strong>to</strong> be<br />
about 1000 adults, similar <strong>to</strong> <strong>the</strong> size <strong>of</strong> remnant populations on <strong>the</strong> Saco River<br />
(ME), Susquehanna River (PA, MD, NY), James River (VA), and St. John River<br />
(Canada). To date, no state or federal agencies or academic institutions have<br />
conducted or proposed <strong>to</strong> conduct a mark-recapture study that would be needed <strong>to</strong><br />
obtain a population estimate.<br />
12 These are potential fac<strong>to</strong>rs <strong>to</strong> be considered, and are not listed in order <strong>of</strong> priority.<br />
PRFP Page 21
During <strong>the</strong> development <strong>of</strong> <strong>the</strong> <strong>Operational</strong> <strong>Plan</strong>, DMR considered <strong>the</strong> likely success<br />
<strong>of</strong> passive (natural recolonization) versus active (s<strong>to</strong>cking) shad res<strong>to</strong>ration. In<br />
practice <strong>the</strong>re are no examples <strong>of</strong> American shad populations in large rivers that<br />
have been res<strong>to</strong>red or are being res<strong>to</strong>red solely by natural recolonization.<br />
<strong>Res<strong>to</strong>ration</strong> programs in Maine, New Hampshire, Massachusetts, Rhode Island,<br />
Virginia, Maryland and Pennsylvania have relied on s<strong>to</strong>cking adults, juveniles, or fry<br />
<strong>to</strong> increase <strong>the</strong> abundance <strong>of</strong> shad. However, <strong>the</strong>re are two examples in Maine<br />
where natural recolonization has resulted in a static shad population. On <strong>the</strong> Saco<br />
River where adult shad have simply been passed upriver <strong>the</strong> average run size <strong>for</strong> 16<br />
years is 1435 fish. On <strong>the</strong> Narraguagus River, counts <strong>of</strong> adult shad passing <strong>the</strong><br />
single nonhydropower dam in each <strong>of</strong> three years (1987, 1989, 2007) have never<br />
exceeded 200 fish.<br />
DMR developed two models <strong>to</strong> explore scenarios that were likely <strong>to</strong> achieve shad<br />
res<strong>to</strong>ration <strong>to</strong> estimated his<strong>to</strong>rical abundance in <strong>the</strong> 40-50 year time frame <strong>of</strong> this<br />
<strong>Operational</strong> <strong>Plan</strong> (8-10 shad generations). These models are simple, because <strong>the</strong>re<br />
is a paucity <strong>of</strong> demographic data <strong>for</strong> shad populations in Maine as well as <strong>for</strong> shad<br />
populations along <strong>the</strong> Atlantic coast.<br />
The first model explored <strong>the</strong> possibility <strong>of</strong> achieving <strong>the</strong> res<strong>to</strong>ration objective by<br />
natural recolonization; it uses a range <strong>of</strong> starting population sizes and intrinsic rates<br />
<strong>of</strong> increase from one generation <strong>to</strong> <strong>the</strong> next (Table 5). The model indicates that<br />
achieving Measure 7.1 (633,300 adult shad returns in 41-50 years) by natural<br />
recolonization would require ei<strong>the</strong>r a very high rate <strong>of</strong> increase <strong>for</strong> a prolonged<br />
period or a very large starting population. For example, this target could be reached<br />
with a starting population <strong>of</strong> 2500-5000 fish that on average doubled in abundance<br />
every five years. This level <strong>of</strong> reproduction might be expected in bacteria, but not in<br />
shad. If <strong>the</strong> rate <strong>of</strong> reproduction is reduced <strong>to</strong> 1.5 or 1.25, <strong>the</strong> size <strong>of</strong> <strong>the</strong> starting<br />
population would have <strong>to</strong> be 40,000 <strong>to</strong> 135,000 fish. DMR is not aware <strong>of</strong> shad<br />
populations in Maine or elsewhere that consistently achieve <strong>the</strong>se levels <strong>of</strong><br />
reproduction nor <strong>of</strong> remnant populations on <strong>the</strong> east coast that have been greater<br />
than about 1000 fish. DMR has concluded that reliance on natural recolonization is<br />
not a valid management strategy.<br />
PRFP Page 22
Table 5. Results <strong>of</strong> natural recolonization model.<br />
Generational expansion rate = 2 Generational expansion rate = 1.5<br />
Year Population 1 Population 2 Population 4 Year Population 1 Population 2 Population 3 Population 4<br />
1 1,000 2,500 5,000 1 1,000 2,500 5,000 40,000<br />
6 2,000 5,000 10,000 6 1,500 3,750 7,500 60,000<br />
11 4,000 10,000 20,000 11 2,250 5,625 11,250 90,000<br />
16 8,000 20,000 40,000 16 3,375 8,438 16,875 135,000<br />
21 16,000 40,000 80,000 21 5,063 12,656 25,313 202,500<br />
26 32,000 80,000 160,000 26 7,594 18,984 37,969 303,750<br />
31 64,000 160,000 320,000 31 11,391 28,477 56,953 455,625<br />
36 128,000 320,000 640,000 36 17,086 42,715 85,430 683,438<br />
41 256,000 640,000 1,280,000 41 25,629 64,072 128,145 1,025,156<br />
46 512,000 1,280,000 2,560,000 46 38,443 96,108 192,217 1,537,734<br />
51 1,024,000 2,560,000 51 57,665 144,163 288,325 2,306,602<br />
56 2,048,000 56 86,498 216,244 432,488 3,459,902<br />
Generational expansion rate = 1.25 Generational expansion rate = 1.16<br />
Year Population 1 Population 2 Population 3 Year Population 1 Population 2 Population 3 Population 4<br />
1 1,000 2,500 135,000 1 1,000 2,500 135,000 225,000<br />
6 1,250 3,125 168,750 6 1,163 2,907 156,977 261,628<br />
11 1,563 3,906 210,938 11 1,352 3,380 182,531 304,218<br />
16 1,953 4,883 263,672 16 1,572 3,930 212,245 353,742<br />
21 2,441 6,104 329,590 21 1,828 4,570 246,797 411,328<br />
26 3,052 7,629 411,987 26 2,126 5,314 286,973 478,289<br />
31 3,815 9,537 514,984 31 2,472 6,179 333,690 556,150<br />
36 4,768 11,921 643,730 36 2,874 7,185 388,012 646,686<br />
41 5,960 14,901 804,663 41 3,342 8,355 451,176 751,960<br />
46 7,451 18,626 1,005,828 46 3,886 9,715 524,623 874,372<br />
51 9,313 23,283 1,257,285 51 4,519 11,297 610,027 1,016,712<br />
56 11,642 29,104 1,571,607 56 5,254 13,136 709,334 1,182,223<br />
Measure 7.1: 633,300 adult shad returns in 35-40 years<br />
DMR next modeled res<strong>to</strong>ration at two fry s<strong>to</strong>cking levels (Table 6). The model<br />
assumes one adult return <strong>for</strong> each 318 hatchery fry released and 100 adult returns<br />
<strong>for</strong> each 86 spawning adults (intrinsic rate <strong>of</strong> increase from one generation <strong>to</strong> <strong>the</strong><br />
next = 1.16) based on data presented in <strong>Res<strong>to</strong>ration</strong> <strong>of</strong> American Shad <strong>to</strong> <strong>the</strong><br />
Susquehanna River: Annual Progress Report 2000. The model indicates that 12<br />
million fry would need <strong>to</strong> be s<strong>to</strong>cked annually <strong>for</strong> 41-45 years <strong>to</strong> achieve a population<br />
<strong>of</strong> 633,300 adults in 41-50 years.<br />
PRFP Page 23
Table 6. Results <strong>of</strong> model showing adult returns from A) s<strong>to</strong>cking 6 million fry<br />
annually and B) s<strong>to</strong>cking 12 million fry annually.<br />
A.<br />
Fry s<strong>to</strong>cking years<br />
Return Total annual Y1-5 Y6-10 Y11-15 Y16-20 Y21-25 Y26-30 Y31-35 Y36-40 Y41-45 Y46-51<br />
years adult returns 6,000,000 6,000,000 6,000,000 6,000,000 6,000,000 6,000,000 6,000,000 6,000,000 6,000,000 6,000,000<br />
Y6-10 18,868 18,868<br />
Y11-15 40,807 21,939 18,868<br />
Y16-20 66,318 25,511 21,939 18,868<br />
Y21-25 95,982 29,664 25,511 21,939 18,868<br />
Y26-30 130,475 34,493 29,664 25,511 21,939 18,868<br />
Y31-35 170,583 40,108 34,493 29,664 25,511 21,939 18,868<br />
Y36-40 217,221 46,637 40,108 34,493 29,664 25,511 21,939 18,868<br />
Y41-45 271,450 54,229 46,637 40,108 34,493 29,664 25,511 21,939 18,868<br />
Y46-50 334,508 63,057 54,229 46,637 40,108 34,493 29,664 25,511 21,939 18,868<br />
Y51-55 407,830 73,323 63,057 54,229 46,637 40,108 34,493 29,664 25,511 21,939 18,868<br />
Y56-60 474,221 85,259 73,323 63,057 54,229 46,637 40,108 34,493 29,664 25,511 21,939<br />
Y61-65 551,420 99,138 85,259 73,323 63,057 54,229 46,637 40,108 34,493 29,664 25,511<br />
Y66 641,186 115,277 99,138 85,259 73,323 63,057 54,229 46,637 40,108 34,493 29,664<br />
B.<br />
Fry s<strong>to</strong>cking years<br />
Return Total annual Y1-5 Y6-10 Y11-15 Y16-20 Y21-25 Y26-30 Y31-35 Y36-40 Y41-45 Y46-51<br />
years adult returns 12,000,000 12,000,000 12,000,000 12,000,000 12,000,000 12,000,000 12,000,000 12,000,000 12,000,000<br />
Y6-10 37,736 37,736<br />
Y11-15 81,615 43,879 37,736<br />
Y16-20 132,637 51,022 43,879 37,736<br />
Y21-25 191,965 59,328 51,022 43,879 37,736<br />
Y26-30 260,950 68,986 59,328 51,022 43,879 37,736<br />
Y31-35 341,167 80,216 68,986 59,328 51,022 43,879 37,736<br />
Y36-40 434,441 93,275 80,216 68,986 59,328 51,022 43,879 37,736<br />
Y41-45 542,900 108,459 93,275 80,216 68,986 59,328 51,022 43,879 37,736<br />
Y46-50 669,015 126,115 108,459 93,275 80,216 68,986 59,328 51,022 43,879 37,736<br />
We are proposing <strong>to</strong> s<strong>to</strong>ck shad in<strong>to</strong> habitat above Mil<strong>for</strong>d, West Enfield, and<br />
Howland as soon as possible <strong>to</strong> allow testing <strong>of</strong> upstream and downstream passage<br />
efficiency at Mil<strong>for</strong>d, West Enfield, and Howland, and Lowell Tannery within five<br />
years <strong>of</strong> s<strong>to</strong>cking. American shad are proving <strong>to</strong> be one <strong>of</strong> <strong>the</strong> most difficult<br />
anadromous species <strong>to</strong> successful pass at technical fishways, and an early<br />
determination <strong>of</strong> passage efficiency at Mil<strong>for</strong>d and Howland is critical <strong>to</strong> shad<br />
res<strong>to</strong>ration on this river. If adult shad use <strong>the</strong> state-<strong>of</strong>-<strong>the</strong>-art fishlift that will<br />
constructed at Mil<strong>for</strong>d, <strong>the</strong>y can be serve as broods<strong>to</strong>ck <strong>for</strong> <strong>the</strong> hatchery and/or can<br />
be passed upstream <strong>to</strong> spawn naturally.<br />
7.1.1 Identify potential sources <strong>of</strong> American shad broods<strong>to</strong>ck (500-600 adults<br />
<strong>to</strong> produce 6M fry or 1000-1200 adults <strong>for</strong> 12M fry).<br />
The privately owned Waldoboro Shad Hatchery, which has provided fry <strong>for</strong> <strong>the</strong><br />
Kennebec River <strong>Res<strong>to</strong>ration</strong> Project, was modeled after <strong>the</strong> Pennsylvania Fish and<br />
Boat Commission Hatchery that has successfully supplied shad <strong>for</strong> <strong>the</strong><br />
Susquehanna River res<strong>to</strong>ration. The Waldoboro Hatchery currently requires 500-<br />
600 adult shad broods<strong>to</strong>ck <strong>to</strong> produce up <strong>to</strong> 6 million fry. At <strong>the</strong> start <strong>of</strong> <strong>the</strong> season,<br />
DMR trucks several hundred adult broods<strong>to</strong>ck <strong>to</strong> <strong>the</strong> hatchery. The fish are allowed<br />
<strong>to</strong> spawn naturally in large indoor circular tanks; no hormones are used in this<br />
process. DMR trucks additional fish <strong>to</strong> <strong>the</strong> hatchery, which are added <strong>to</strong> <strong>the</strong><br />
spawning tanks <strong>to</strong> compensate <strong>for</strong> spawning mortality or <strong>to</strong> replace spent fish.<br />
Fertilized eggs are collected, allowed <strong>to</strong> hatch, and transferred <strong>to</strong> fry tanks. Fry are<br />
fed, marked with OTC, and released in<strong>to</strong> <strong>the</strong> river when <strong>the</strong>y are approximately 21days<br />
old.<br />
PRFP Page 24
Because adult shad mortality increases with increasing temperature and distance<br />
that fish must be trucked, only sources <strong>of</strong> broods<strong>to</strong>ck within a 5-6 hour drive were<br />
considered. Potential sources <strong>of</strong> sufficient broods<strong>to</strong>ck in <strong>the</strong> Gulf <strong>of</strong> Maine are<br />
limited (Table 7). A remnant population exists in <strong>the</strong> lower Penobscot, but DMR<br />
estimates this population <strong>to</strong> be 1000 fish at most. In addition, capturing <strong>the</strong>se fish<br />
<strong>for</strong> broods<strong>to</strong>ck be<strong>for</strong>e <strong>the</strong> removal <strong>of</strong> Veazie and Great Works dams would be nearly<br />
impossible. Runs in <strong>the</strong> o<strong>the</strong>r Maine rivers are ei<strong>the</strong>r <strong>to</strong>o small, are undergoing<br />
res<strong>to</strong>ration, or cannot be easily captured. The nearest source 13 <strong>of</strong> 1000-1200 adults<br />
within <strong>the</strong> Gulf <strong>of</strong> Maine is <strong>the</strong> Merrimack River (Table 7). This quantity <strong>of</strong><br />
broods<strong>to</strong>ck is also available from <strong>the</strong> Connecticut River, located outside <strong>the</strong> Gulf <strong>of</strong><br />
Maine.<br />
During <strong>the</strong> development <strong>of</strong> this operational plan, we reviewed <strong>the</strong> best available<br />
in<strong>for</strong>mation regarding <strong>the</strong> genetic structuring <strong>of</strong> shad populations on <strong>the</strong> east coast in<br />
order <strong>to</strong> assess <strong>the</strong> potential impacts <strong>of</strong> using out-<strong>of</strong>-basin shad broods<strong>to</strong>ck <strong>for</strong> <strong>the</strong><br />
Penobscot River res<strong>to</strong>ration. This analysis is presented in Appendix A.<br />
Table 7. Nearest potential sources <strong>of</strong> American shad broods<strong>to</strong>ck.<br />
River system Distance Status <strong>of</strong> run<br />
Penobscot 0 mi Size unknown, not easily captured<br />
Kennebec/Androscoggin 58 mi Size unknown, ongoing res<strong>to</strong>ration, not easily<br />
captured<br />
Narraguagus 72 mi 100 adults in 2008<br />
Saco 93 mi ~1200 adults, ongoing res<strong>to</strong>ration, capture at<br />
fishlift<br />
Merrimack 125 mi ~29,000 in 2008, ongoing res<strong>to</strong>ration, capture<br />
at fishlift<br />
St. John 179 mi Less than 1000 in 28 <strong>of</strong> 29 years from 1974-<br />
2002<br />
7.1.2. Double capacity <strong>of</strong> Waldoboro American shad hatchery.<br />
The Waldoboro Shad Hatchery currently can produce up <strong>to</strong> 6 million fry per year. It<br />
would have <strong>to</strong> be expanded <strong>to</strong> produce 12 million fry per year, which could be<br />
accomplished in less than one year if funding becomes available.<br />
7.1.3 Develop an assessment plan <strong>for</strong> evaluating <strong>the</strong> effectiveness <strong>of</strong> <strong>the</strong><br />
American shad hatchery s<strong>to</strong>cking program (per ASMFC pro<strong>to</strong>cols).<br />
Amendment 1 <strong>to</strong> <strong>the</strong> Interstate Fishery Management <strong>Plan</strong> <strong>for</strong> Shad and River<br />
Herring requires that states with a hatchery program must submit proposals <strong>for</strong><br />
evaluation and provide in<strong>for</strong>mation in <strong>the</strong> annual report <strong>of</strong> <strong>the</strong> hatchery contribution<br />
(percent wild versus hatchery fish <strong>for</strong> juveniles and adults). Most programs mark<br />
hatchery fry with OTC, which shows as a fluorescent ring on <strong>the</strong> o<strong>to</strong>lith. Samples <strong>of</strong><br />
emigrating juveniles and returning adults are sacrificed and <strong>the</strong>ir o<strong>to</strong>liths are<br />
13 Distance measured from river mouth <strong>to</strong> river mouth.<br />
PRFP Page 25
examined <strong>for</strong> <strong>the</strong> OTC mark. An assessment plan will be developed and submitted<br />
<strong>to</strong> <strong>the</strong> Atlantic States Marine Fisheries Commission prior <strong>to</strong> s<strong>to</strong>cking.<br />
7.1.4 Moni<strong>to</strong>r adult returns by annual counts-see 6.1.4<br />
7.1.6 Biweekly beach seine survey-see 3.1.4<br />
7.1.7 Conduct annual boat electr<strong>of</strong>ishing survey-see 6.1.7<br />
8.1. Every four generations (16 years) after Yr0 <strong>the</strong> blueback herring<br />
population above Mil<strong>for</strong>d will increase by 25% by natural reproduction <strong>of</strong> wild<br />
fish.<br />
Blueback herring above <strong>the</strong> Veazie Dam are considered extirpated, because <strong>of</strong> <strong>the</strong><br />
ineffective passage <strong>for</strong> this species at Veazie and Great Works dams. DMR<br />
proposes <strong>to</strong> res<strong>to</strong>re <strong>the</strong>se runs by natural reproduction. Blueback herring spawn in<br />
rivers like American shad, but appear <strong>to</strong> have a high intrinsic rate <strong>of</strong> reproduction like<br />
alewife. Blueback herring were not actively managed on <strong>the</strong> Kennebec River, that is<br />
no s<strong>to</strong>cking occurred, but wild fish have been documented spawning at numerous<br />
locations in <strong>the</strong> newly accessible reach above Augusta. Blueback herring that are<br />
captured at Mil<strong>for</strong>d will ei<strong>the</strong>r be passed upstream or trucked <strong>to</strong> habitat above a<br />
mainstem dam and released so passage effectiveness can be tested.<br />
8.1.1 Moni<strong>to</strong>r adult returns by annual counts-see 6.1.4<br />
8.1.3 Biweekly beach seine survey-see 3.1.4<br />
8.1.4 Conduct annual boat electr<strong>of</strong>ishing survey-see 6.1.7<br />
8.1.5 Truck a portion <strong>of</strong> blueback herring from Mil<strong>for</strong>d and release above<br />
Howland and West Enfield.<br />
Trucking a portion <strong>of</strong> adults upstream will allow assessment <strong>of</strong> passage efficiency at<br />
<strong>the</strong> mainstem dams <strong>for</strong> blueback herring.<br />
9.1.1 Moni<strong>to</strong>r eel recruitment by daily counts at Mil<strong>for</strong>d and weekly biological<br />
in<strong>for</strong>mation (length and weight).<br />
9.1.3 Conduct annual boat electr<strong>of</strong>ishing survey-see 6.1.7<br />
Determine if apparent decline in abundance <strong>of</strong> young-<strong>of</strong>-year between Bangor Dam<br />
and Veazie Dam continues after dam removals.<br />
10.1.1 Moni<strong>to</strong>r adult returns by annual counts-see 6.1.4<br />
PRFP Page 26
11.0 Rebuild <strong>the</strong> striped bass population in his<strong>to</strong>rical habitat within 40 years.<br />
There is no evidence that striped bass his<strong>to</strong>rically spawned in <strong>the</strong> Penobscot River<br />
as <strong>the</strong>y did in <strong>the</strong> Kennebec, nor is <strong>the</strong>re evidence that <strong>the</strong>y currently spawn in <strong>the</strong><br />
Penobscot. It is likely that striped bass arriving in <strong>the</strong> Penobscot are fish from<br />
sou<strong>the</strong>rn spawning populations on a summer feeding migration.<br />
References<br />
Fernandez, S.J. 2008. Population demography, distribution, and movement patterns<br />
<strong>of</strong> Atlantic and shortnose sturgeons in <strong>the</strong> Penobscot River estuary, Maine. M.S.<br />
Thesis. University <strong>of</strong> Maine, Orono, ME. 100 pp.<br />
NOAA Fisheries. 2008. Penobscot River fish assemblage survey interim report.<br />
Woods, Hole MA and Orono, ME. Prepared by Kleinschmidt Associates. 84 pp.<br />
Yoder, C.O., B.H. Kulik, and J.M. Audet. 2004. Maine rivers fish assemblage<br />
assessment: Interim Report. Kennebec River: 2002 and 2003, Androscoggin River:<br />
2003, Sebasticook River 2003. Midwest Biodiversity Institute Center <strong>for</strong> Applied<br />
Bioassessment & Biocriteria, Columbus, OH 43221; Kleinschmidt Associates,<br />
Pittsfield, ME 04967. 205 pp.<br />
Yoder, C.O., B.H. Kulik, and J.M. Audet. 2005. Maine rivers fish assemblage<br />
assessment: Interim Report II. Penobscot River and tributaries: 2004. Midwest<br />
Biodiversity Institute Center <strong>for</strong> Applied Bioassessment & Biocriteria, Columbus, OH<br />
43221; Kleinschmidt Associates, Pittsfield, ME 04967. 94pp.<br />
PRFP Page 27
Atlantic Salmon<br />
Authors: Oliver Cox, Norm Dubé, Greg Mackey, and Randy Spencer<br />
Introduction<br />
Recovery <strong>of</strong> self-sustaining populations <strong>of</strong> Atlantic salmon is central <strong>to</strong> <strong>the</strong> mission <strong>of</strong><br />
MDMR, federal agencies, PIN, and o<strong>the</strong>r partners. Natural spawning is fundamental<br />
<strong>to</strong> recovery, genetic viability, and long-term persistence <strong>of</strong> self-sustaining<br />
populations. The emphasis <strong>for</strong> this operational plan is <strong>to</strong> increase natural spawning<br />
and wild recruitment. However, wild Atlantic salmon populations that are only<br />
supported by natural spawning (e.g. Ducktrap River, Cove Brook, Souadabscook<br />
Stream) continue <strong>to</strong> falter. Pending improvement in marine survival rates and<br />
freshwater production, hatchery supplementation will continue <strong>to</strong> play a vital role in<br />
an integrated management approach. Thus, this plan also emphasizes strategies <strong>to</strong><br />
improve <strong>the</strong> quality and survival <strong>of</strong> hatchery products. In <strong>the</strong> Penobscot River, low<br />
numbers <strong>of</strong> returning adult Atlantic salmon combined with ineffective upstream<br />
dispersal contribute <strong>to</strong> chronic under utilization <strong>of</strong> available spawning habitat. Most<br />
Penobscot broods<strong>to</strong>ck originated as hatchery origin s<strong>to</strong>cked smolts, and most <strong>of</strong><br />
those smolts (99.2% ± 0.4 SE, 2001-2007 mean) had at least one hatchery origin<br />
parent. Maintaining <strong>the</strong> fitness <strong>of</strong> hatchery broods<strong>to</strong>ck is a high priority. Increasing<br />
returns <strong>of</strong> wild origin broods<strong>to</strong>ck (through increased natural spawning and wild smolt<br />
escapement) will reduce <strong>the</strong> potential <strong>for</strong> multiple successive generations <strong>of</strong><br />
hatchery influence and contribute <strong>to</strong> broods<strong>to</strong>ck fitness.<br />
This operational plan will build on <strong>the</strong> suite <strong>of</strong> existing management actions and<br />
recent program reviews (e.g. NRC 2004, Fay et al. 2006, and SEI 2007)<br />
incorporated in <strong>the</strong> Strategic Management <strong>Plan</strong> (SMP). Management actions with<br />
potential <strong>for</strong> rapid and tangible population level responses are identified. Population<br />
effects may be quantitative or qualitative (e.g. genetic) but actions with <strong>the</strong> potential<br />
<strong>to</strong> produce both are given a higher priority. Populations are most sensitive <strong>to</strong><br />
manipulation <strong>of</strong> advanced life stages (adults and smolts) and <strong>the</strong>se actions are also<br />
given high priority. Effective adult escapement (<strong>the</strong> number that spawn successfully)<br />
is driven by <strong>the</strong> <strong>to</strong>tal number <strong>of</strong> returns, <strong>the</strong> proportion extracted <strong>for</strong> hatchery<br />
broods<strong>to</strong>ck, and <strong>the</strong> per<strong>for</strong>mance <strong>of</strong> spawners in <strong>the</strong> river. Spawning per<strong>for</strong>mance is<br />
influenced by habitat quality, habitat accessibility, and spawner fitness. The number<br />
<strong>of</strong> adult returns is driven by smolt escapement and survival. Smolt escapement is a<br />
function <strong>of</strong> <strong>to</strong>tal production less migra<strong>to</strong>ry losses, which in turn is influenced by<br />
environmental conditions (e.g. dams, preda<strong>to</strong>r abundance) and by smolt quality.<br />
Proposed actions <strong>to</strong> increase freshwater production, survival, and reproductive<br />
success are presented <strong>for</strong> both wild and hatchery fish.<br />
Background<br />
There is little in<strong>for</strong>mation on <strong>the</strong> his<strong>to</strong>ric population structure <strong>of</strong> Atlantic salmon in <strong>the</strong><br />
Penobscot basin and currently <strong>the</strong> Penobscot basin is managed as a panmictic<br />
PRFP Page 28
meta-population. Based on watershed geography and estimates <strong>of</strong> habitat quantity,<br />
coupled with <strong>the</strong>ories <strong>of</strong> Atlantic salmon homing and straying, it is reasonable <strong>to</strong><br />
assume that sub-populations existed in <strong>the</strong> Penobscot basin. The Penobscot River<br />
basin consists <strong>of</strong> at least six sub-drainages upstream <strong>of</strong>, and four downstream <strong>of</strong> <strong>the</strong><br />
Veazie Dam. The potential <strong>for</strong> environmentally driven adaptations conveying fitness<br />
unique <strong>to</strong> sub-drainage has not been assessed in <strong>the</strong> Penobscot. However,<br />
research elsewhere provides growing support <strong>for</strong> <strong>the</strong> concept <strong>of</strong> heritable withinbasin<br />
adaptation in smolt run timing and o<strong>the</strong>r fitness related characteristics.<br />
Assessing <strong>the</strong> potential <strong>for</strong> <strong>the</strong> existence or creation <strong>of</strong> locally adapted subpopulations<br />
and predicting <strong>the</strong>ir viability would assist in developing long term<br />
management strategies.<br />
Where production potentials are equal, reaches with <strong>the</strong> fewest dams impeding<br />
upstream and/or downstream migration will be more likely <strong>to</strong> produce self-sustaining<br />
Atlantic salmon populations. Optimizing reach specific smolt recruitment will require<br />
an appropriate balance between dam related losses and production potential<br />
(amount and quality <strong>of</strong> available habitat). Quantitative data (e.g. habitat productivity,<br />
downstream mortality) necessary <strong>to</strong> in<strong>for</strong>m those decisions are limited, but still<br />
provide insight. Available data were used <strong>to</strong> model both productive potential and <strong>the</strong><br />
potential effects <strong>of</strong> dam related mortality on population viability (Appendix B).<br />
Juvenile Atlantic salmon rearing habitat in <strong>the</strong> Penobscot basin was estimated using<br />
both field survey data and data from a GIS-based Atlantic salmon habitat model<br />
developed by USFWS and NOAA (Wright et al. 2008). Habitat data were<br />
aggregated at several spatial scales within <strong>the</strong> basin, including Dam Reach,<br />
Management Reach, and HUC 10. The data used are available as an ARCMap<br />
geo-database. The goals <strong>of</strong> <strong>the</strong> modeling were <strong>to</strong> 1) provide <strong>the</strong> best available<br />
in<strong>for</strong>mation on Atlantic salmon rearing habitat in <strong>the</strong> Penobscot basin, 2) provide an<br />
estimate <strong>of</strong> <strong>the</strong> relative potential <strong>for</strong> large parr production in <strong>the</strong> basin, and 3) identify<br />
reaches with <strong>the</strong> highest parr production potential (Appendix B). The production<br />
model combined with <strong>the</strong> Atlantic salmon population viability by reach model<br />
(Appendix C) helps identify data gaps requiring focused research and facilitate<br />
management decisions.<br />
Adaptive management is a structured decision process that will be used <strong>to</strong> govern<br />
implementation and modification <strong>of</strong> <strong>the</strong> operational plan. Its utility is <strong>to</strong> ensure that<br />
management decisions and actions are modified, discontinued, or perpetuated<br />
based on cause and effect relationships. Adaptive management relies on<br />
establishing management plans based on a priori hypo<strong>the</strong>ses (predicted results),<br />
assessment plans <strong>to</strong> collect data necessary <strong>to</strong> evaluate a management strategy, and<br />
a feedback mechanism <strong>to</strong> in<strong>for</strong>m and improve management as results are obtained.<br />
The guidance document <strong>for</strong> Adaptive Management in <strong>the</strong> Basin is located in<br />
Appendix D.<br />
Atlantic salmon enhancement strategies that can be used in <strong>the</strong> Penobscot River <strong>to</strong><br />
augment in-river production and adult returns include (Appendix E):<br />
1. Egg planting<br />
PRFP Page 29
2. Streamside incubation<br />
3. Fry s<strong>to</strong>cking<br />
4. Parr s<strong>to</strong>cking (graded pre-smolts, ambient fall parr)<br />
5. Smolt s<strong>to</strong>cking<br />
6. Trap and truck sea-run adults <strong>to</strong> ensure access <strong>to</strong> quality habitat<br />
7. Captive-reared adult s<strong>to</strong>cking<br />
8. Rejuvenated kelt s<strong>to</strong>cking<br />
9. No s<strong>to</strong>cking - natural reproduction only<br />
Fry, parr, and smolt s<strong>to</strong>cking are <strong>the</strong> standard enhancement practices in <strong>the</strong><br />
Penobscot watershed. The contribution <strong>of</strong> hatchery smolt s<strong>to</strong>cking <strong>to</strong> adult returns is<br />
well documented but <strong>the</strong> relative effectiveness <strong>of</strong> o<strong>the</strong>r enhancement methods is<br />
poorly characterized. Research <strong>to</strong> address <strong>the</strong>se data gaps is prioritized and will<br />
focus on fry, parr, (and smolt) s<strong>to</strong>cking treatments and assessments. Trap and truck<br />
(adult translocations) will also be investigated as a means <strong>of</strong> increasing <strong>the</strong> effective<br />
spawning escapement <strong>of</strong> returning adults. Evaluations <strong>of</strong> streamside incubation,<br />
egg planting and captive-reared adult releases are currently in progress in o<strong>the</strong>r<br />
Maine rivers. Some or all <strong>of</strong> <strong>the</strong>se enhancement techniques may have future<br />
application in <strong>the</strong> Penobscot program.<br />
Strategies <strong>to</strong> Increase Adult Escapement <strong>to</strong> <strong>the</strong> Penobscot Basin<br />
Increasing spawning escapement <strong>to</strong> upstream reaches is a prerequisite <strong>for</strong> recovery<br />
<strong>of</strong> salmon populations in <strong>the</strong> Penobscot River. Currently adult Atlantic salmon<br />
escapement is limited by several critical fac<strong>to</strong>rs:<br />
1. Low number <strong>of</strong> returning adults from all sources (natural spawning and<br />
s<strong>to</strong>cked smolt, fry, and parr).<br />
2. Six hundred and fifty sea-run adults are removed annually <strong>to</strong> meet hatchery<br />
broods<strong>to</strong>ck needs <strong>for</strong> <strong>the</strong> fry, parr, and smolt s<strong>to</strong>cking programs.<br />
3. Upstream fish passage facilities are not 100% effective and impede adult<br />
escapement upstream. Level <strong>of</strong> impact is dependent on <strong>the</strong> number <strong>of</strong> dams<br />
ascended, fish passage facility effectiveness, and environmental conditions.<br />
<strong>Operational</strong> Objectives<br />
The objectives presented here provide a link between <strong>the</strong> objectives in <strong>the</strong> SMP and<br />
<strong>the</strong> tasks within <strong>the</strong> operational plan. Most <strong>of</strong> <strong>the</strong> tasks within <strong>the</strong> operational plan<br />
relate <strong>to</strong> strategic objectives 4 (achieve self-sustaining smolt <strong>to</strong> adult return rates)<br />
and 5 (achieve interim juvenile life stage-specific measures) (Appendix F). Both <strong>of</strong><br />
those objectives are derived from strategic objective 2 (Increase natural spawning).<br />
Each task within <strong>the</strong> operational plan has been associated with one operational<br />
objective, but may be related <strong>to</strong> o<strong>the</strong>rs. Inherent with each objective is <strong>the</strong> need <strong>to</strong><br />
assess our management actions and report our findings. Appropriate operational<br />
measures will be associated with each strategy <strong>to</strong> evaluate <strong>the</strong> action and in<strong>for</strong>m <strong>the</strong><br />
adaptive management process.<br />
PRFP Page 30
Objective 12: Increase wild/natural spawning<br />
• 12.1 Strategy- Define <strong>the</strong> best use (disposition) <strong>of</strong> Atlantic salmon adult<br />
returns based on origin, age, run timing, and s<strong>to</strong>cking needs.<br />
• 12.2 Strategy- Reduce Broods<strong>to</strong>ck requirement by collection<br />
alternative life stages (parr or smolts) and rear <strong>to</strong> adults <strong>to</strong> supplement<br />
sea-run broods<strong>to</strong>ck requirements and or adult escapement<br />
• 12.3 Strategy- Reduce Broods<strong>to</strong>ck requirement by spawning additional<br />
life stages (precocious parr)<br />
• 12.4 Strategy- Rejuvenate kelts <strong>to</strong> augment hatchery broods<strong>to</strong>ck and<br />
spawning escapement<br />
• 12.5 Strategy- Improve fish passage <strong>to</strong> effectively increase adult<br />
spawners upstream<br />
• 12.6 Strategy- Adult Atlantic salmon translocation <strong>to</strong> increase and<br />
aggregate spawning escapement in<strong>to</strong> quality habitat<br />
Objective 13: Increase juvenile survival<br />
• 13.1 Strategy- Increase <strong>the</strong> quality <strong>of</strong> hatchery products (e.g., genetic,<br />
physical, physiological, behavioral) through improved rearing practices,<br />
conditioning, and broods<strong>to</strong>ck fitness<br />
• 13.2 Strategy- Improve s<strong>to</strong>cking methods (where, when and how) <strong>to</strong><br />
increase survival <strong>of</strong> <strong>the</strong> hatchery product<br />
• 13.3 Strategy- Assess environmental conditions that maximize survival<br />
<strong>of</strong> hatchery products<br />
• 13.4 Strategy- Improve habitat quality and complexity (e.g., physical,<br />
chemical, ecological) <strong>to</strong> maximize salmon production (See Section 3<br />
and Appendix G)<br />
• 13.5 Strategy- Increase connectivity <strong>to</strong> quality habitat <strong>to</strong> maximize<br />
salmon production (See Section 2)<br />
Objective 14: Increase smolt <strong>to</strong> adult survival<br />
• 14.1 Strategy- Circumvent marine mortality by captive-rearing wild<br />
smolts <strong>to</strong> maturity (e.g. sea-cage rearing) and release pre-spawning in<br />
<strong>to</strong> superior habitat<br />
• 14.2 Strategy- S<strong>to</strong>ck smolts in locations and at times that maximizes<br />
returns rate<br />
• 14.3 Strategy- Improve downstream passage efficiency <strong>for</strong> smolts<br />
Objective 15: Increase <strong>the</strong> number <strong>of</strong> hatchery Atlantic salmon s<strong>to</strong>cked<br />
• 15.1 Strategy- Increase or reallocate hatchery production <strong>to</strong> increase<br />
<strong>the</strong> production <strong>of</strong> high returning products (i.e., more smolts)<br />
<strong>Operational</strong> Measures<br />
The operational measures listed below will be used <strong>to</strong> evaluate <strong>the</strong> success <strong>of</strong><br />
individual tasks through life stage-specific measures. Interim life-stage measures<br />
PRFP Page 31
provide timely feedback and evaluation <strong>of</strong> management actions. Assessment <strong>of</strong><br />
each measure should use appropriate data collected using standard methods.<br />
• Egg Deposition: On average, ≥ 240 egg deposition per 100 m 2 stream<br />
habitat<br />
• Fry Production: On average, ≥ 19 fry per 100 m 2 stream habitat (240<br />
eggs/unit*0.08)<br />
• Parr Production: On average, ≥ 6 parr per 100 m 2 stream habitat (240<br />
eggs/unit*0.025), ≥ estimates from cumulative drainage area<br />
regression model, or ≥ known production<br />
• Smolt Production: On average, ≥ 3 smolts per unit (240<br />
eggs/unit*0.0125), ≥ estimates from parr regression, or ≥ known smolt<br />
production<br />
• Freshwater Survival: Egg <strong>to</strong> smolt survival <strong>of</strong> ≥ 1.25% (fry <strong>to</strong> smolt<br />
survival <strong>of</strong> ≥ 15.8%)<br />
• Relative Survival or Production:<br />
o Compare hatchery verses wild survival, population densities<br />
and/or smolt production<br />
o Compare survival or production <strong>to</strong> previous MDMR data <strong>for</strong><br />
relative measures <strong>of</strong> success<br />
PRFP Page 32
Work <strong>Plan</strong> Table<br />
The budget includes funding <strong>for</strong> five full-time Biologists, two full time Biology<br />
Specialists, two seasonal Conservation Aides and six seasonal contract workers.<br />
Budget is estimated <strong>for</strong> 2010-2014.<br />
No. Action Timeline Responsibility Budget<br />
12.0.1 Write Semi-annual NOAA Reports May & Nov. MDMR $83,520<br />
12.0.2<br />
Hold annual Penobscot Atlantic salmon<br />
assessment workshop <strong>to</strong> integrate and<br />
analyze s<strong>to</strong>cking, habitat, telemetry,<br />
passage, and population data January MDMR $60,840<br />
12.0.3 Write Annual Penobscot Report January MDMR<br />
MDMR,<br />
$40,560<br />
Develop Broods<strong>to</strong>ck Management <strong>Plan</strong><br />
USFWS,<br />
12.1.1 (BSMP)<br />
Evaluate <strong>the</strong> best use (disposition) <strong>of</strong><br />
Feb-10 NOAA $16,544<br />
returning wild and hatchery origin Atlantic<br />
MDMR,<br />
salmon captured at <strong>the</strong> Veazie Dam fishway<br />
USFWS,<br />
12.1.2 trap Feb-10 NOAA $2,068<br />
12.1.3<br />
12.1.4<br />
Update and revise Penobscot adult Atlantic<br />
salmon collection pro<strong>to</strong>col Feb-10 MDMR $1,908<br />
Operate <strong>the</strong> adult Atlantic salmon collection<br />
facility according <strong>to</strong> standard operation<br />
procedures (SOP) Annual MDMR $440,192<br />
12.1.5<br />
Develop and implement a standardized redd<br />
count sampling scheme Apr-10 MDMR $16,544<br />
12.1.6 Moni<strong>to</strong>r reaches <strong>for</strong> natural re-colonization May-09 MDMR $18,100<br />
12.1.7<br />
12.1.8<br />
12.2.1<br />
12.3.1<br />
12.4.1<br />
12.5.1<br />
12.6.1<br />
Moni<strong>to</strong>r 2008 redds <strong>to</strong> evaluate spawning<br />
success (YOY)<br />
Investigate recruitment from natural<br />
spawning relative <strong>to</strong> o<strong>the</strong>r enhancement<br />
Aug-09 MDMR $6,752<br />
strategies Jan-11 MDMR $45,792<br />
Supplement sea-run broods<strong>to</strong>ck needs with<br />
alternative broods<strong>to</strong>ck sources (parr, smolts)<br />
with <strong>the</strong> goal <strong>of</strong> increasing sea-run adult<br />
escapement (e.g. alternative broods<strong>to</strong>ck<br />
sources, reviewing production needs,<br />
evaluation hatchery production potential) Feb-10<br />
Review methods and ideas <strong>for</strong> using<br />
precocious parr in addition <strong>to</strong> adults as<br />
broods<strong>to</strong>ck Feb-10<br />
MDMR,<br />
USFWS,<br />
NOAA $2,068<br />
MDMR,<br />
USFWS,<br />
NOAA $2,068<br />
Review <strong>the</strong> potential <strong>to</strong> rejuvenate kelts, and<br />
identify possible uses (e.g. broods<strong>to</strong>ck,<br />
spawning escapement) Jan-12 MDMR $1,908<br />
Collaborate with PPL, PRRT, and federal<br />
agencies <strong>to</strong> assess <strong>the</strong> Mil<strong>for</strong>d fish lift 2011-2014 MDMR et al. $5,724<br />
Proposal <strong>to</strong> investigate natural spawning<br />
per<strong>for</strong>mance <strong>of</strong> translocated adult salmon Apr-09 MDMR $15,264<br />
PRFP Page 33
13.1.1<br />
13.1.2<br />
13.2.1<br />
13.2.2<br />
13.2.4<br />
13.2.5<br />
13.2.6<br />
Literature review evaluating causes and<br />
remedies <strong>for</strong> poor per<strong>for</strong>mance <strong>of</strong> hatchery<br />
fry relative <strong>to</strong> wild fry Jan-10 MDMR $1,908<br />
Literature review evaluating causes and<br />
remedies <strong>for</strong> poor per<strong>for</strong>mance <strong>of</strong> hatchery<br />
smolts relative <strong>to</strong> wild smolts May-09 MDMR $3,816<br />
Develop an integrated s<strong>to</strong>ck enhancement<br />
program <strong>to</strong> optimize adult Atlantic salmon<br />
returns Feb-10 MDMR $16,544<br />
Develop and implement an integrated<br />
assessment plan Apr-10 MDMR $82,720<br />
Develop and implement a standardized<br />
juvenile assessment scheme Apr-10 MDMR $82,720<br />
Proposal <strong>to</strong> expand MDMR egg planting<br />
research in<strong>to</strong> <strong>the</strong> Penobscot Jan-10 MDMR $3,816<br />
Develop a fry s<strong>to</strong>cking adaptive management<br />
plan Feb-10 MDMR $7,632<br />
13.2.7<br />
Review and assess causes and remedies <strong>for</strong><br />
poor natural recruitment Dec-10 MDMR $3,816<br />
13.2.8 Report: Juvenile production from fry s<strong>to</strong>cking Dec-10 MDMR $3,816<br />
13.2.9<br />
13.2.10<br />
13.2.11<br />
13.2.12<br />
13.2.13<br />
13.2.14<br />
13.2.15<br />
S<strong>to</strong>ck fry and assess according <strong>to</strong> existing<br />
management practices Apr-09 MDMR $168,800<br />
S<strong>to</strong>ck fry according <strong>to</strong> fry s<strong>to</strong>cking adaptive<br />
management plan<br />
Evaluate alternative fry s<strong>to</strong>cking<br />
strategies/locations <strong>to</strong> increase smolt<br />
2010 -2014 MDMR $675,200<br />
production Jan-11 MDMR $45,792<br />
Develop a parr s<strong>to</strong>cking adaptive<br />
management plan Feb-10 MDMR $7,632<br />
Literature review evaluating causes and<br />
remedies <strong>for</strong> poor per<strong>for</strong>mance <strong>of</strong> hatchery<br />
parr relative <strong>to</strong> wild parr Jan-10 MDMR $3,816<br />
S<strong>to</strong>ck parr and assess according <strong>to</strong> existing<br />
management practices Sep-09 MDMR $84,400<br />
S<strong>to</strong>ck parr according <strong>to</strong> parr s<strong>to</strong>cking<br />
adaptive management plan 2010 -2014 MDMR $337,600<br />
13.2.16<br />
Report current s<strong>to</strong>cking practices (fry, parr,<br />
smolts, adults), documenting decisions <strong>for</strong><br />
annual allocations <strong>for</strong> each life stage Apr-09 MDMR $19,080<br />
13.2.17 Assess hatchery product marking scheme<br />
Review and develop habitat based<br />
productivity estimates, integrating fry and<br />
parr per<strong>for</strong>mance, habitat data, and water<br />
Jul-09 MDMR/NOAA $2,068<br />
13.3.1 quality Feb-10 MDMR $16,544<br />
14.1.1<br />
Evaluate smolt s<strong>to</strong>cking strategies <strong>to</strong><br />
minimize smolt mortality Apr-09 USFWS/MDMR $3,816<br />
PRFP Page 34
14.1.2<br />
14.1.3<br />
14.2.1<br />
14.2.2<br />
14.2.3<br />
14.3.1<br />
14.3.2<br />
15.1.1<br />
Proposal <strong>to</strong> evaluate environmental<br />
conditioning <strong>of</strong> smolts (e.g. freshwater smolt<br />
ponds and sea-cages) <strong>to</strong> improve survival<br />
during transition <strong>to</strong> <strong>the</strong> marine environment Dec-09 USFWS/MDMR $2,068<br />
Proposal <strong>to</strong> capture and captive rear in seacages<br />
wild and/or naturally-reared Penobscot<br />
smolts <strong>for</strong> release as sexually mature adults<br />
in selected river reaches Dec-09 MDMR $4,136<br />
Develop a smolt s<strong>to</strong>cking adaptive<br />
management plan Feb-10 MDMR $7,632<br />
S<strong>to</strong>ck smolts and assess according <strong>to</strong><br />
existing management practices May-09 MDMR $84,400<br />
S<strong>to</strong>ck smolts according <strong>to</strong> smolt s<strong>to</strong>cking<br />
adaptive management plan 2010 -2014 MDMR $337,600<br />
Proposal <strong>to</strong> evaluate downstream smolt<br />
passage efficiency in <strong>the</strong> Piscataquis River Jan-10 MDMR $1,908<br />
Discuss with PRRT <strong>the</strong> possibility <strong>of</strong> testing<br />
downstream passage measures (e.g.<br />
manipulate operating regimes) at PRRT<br />
owned dams prior <strong>to</strong> dam removal Apr-10<br />
MDMR &<br />
PRRT $1,908<br />
Assess feasibility <strong>of</strong> increasing or reallocating<br />
hatchery smolt production <strong>to</strong> produce more<br />
adult returns Feb-10 MDMR $1,908<br />
Work <strong>Plan</strong> Narratives<br />
12.0.1 Write Semi-annual NOAA Reports<br />
A variety <strong>of</strong> tasks included in this plan are funded by NOAA under elements <strong>of</strong> a<br />
cooperative agreement <strong>for</strong> Atlantic Salmon Freshwater Assessments and Research<br />
<strong>of</strong> Mutual Interest <strong>to</strong> Maine Department <strong>of</strong> Marine Resources Bureau <strong>of</strong> Sea Run<br />
Fisheries and Habitat. In June and November, a report on NOAA funded work<br />
completed in <strong>the</strong> previous six months must be submitted <strong>to</strong> <strong>the</strong> project <strong>of</strong>ficer. The<br />
primary tasks that are common <strong>to</strong> <strong>the</strong> cooperative agreement and this <strong>Plan</strong> are:<br />
collecting and analyzing data on <strong>the</strong> biological characteristics (e.g. age, size, origin,<br />
condition) <strong>of</strong> adult salmon captured and enumerating all species trapped at <strong>the</strong><br />
Veazie Dam, collecting and transporting Atlantic salmon broods<strong>to</strong>ck <strong>to</strong> Craig Brook<br />
National Fish Hatchery, assessing alternative s<strong>to</strong>cking strategies <strong>for</strong> Atlantic salmon,<br />
estimating age, origin, and numbers <strong>of</strong> juveniles and smolt produced at sites within<br />
<strong>the</strong> drainage, surveying <strong>for</strong> spawning activity, and acquiring temperature, water<br />
quality, and physical habitat data.<br />
12.0.2 Hold annual Penobscot Atlantic salmon assessment workshop <strong>to</strong><br />
integrate and analyze s<strong>to</strong>cking, habitat, telemetry, passage, and population<br />
data<br />
Hold an annual assessment workshop <strong>for</strong> <strong>the</strong> Penobscot River. The focus will be on<br />
developing assessments and analyses that will provide useful feedback <strong>to</strong> <strong>the</strong><br />
PRFP Page 35
adaptive management structure. Results will be assessed in terms <strong>of</strong> relevant shortterm<br />
measures, and more importantly, in terms <strong>of</strong> <strong>the</strong> overarching plan objectives<br />
and measurable demographic rates. Initially, <strong>the</strong>se meetings will focus more heavily<br />
on developing assessments and analyses, while per<strong>for</strong>ming <strong>the</strong> analyses and<br />
deriving management recommendations will be <strong>the</strong> primary focus. The group will<br />
produce documents annually describing <strong>the</strong>ir work and meet with managers <strong>to</strong><br />
in<strong>for</strong>m <strong>the</strong> adaptive management process. The core team will consist <strong>of</strong> <strong>the</strong> BSRFH<br />
Biologist working on <strong>the</strong> Penobscot. O<strong>the</strong>r participants that <strong>the</strong> team believes can<br />
assist in and improve <strong>the</strong>ir work will be invited. The idea is <strong>for</strong> <strong>the</strong> team <strong>to</strong> function<br />
efficiently as a streamlined workgroup. Broader participation should be achieved<br />
with in<strong>for</strong>mational meetings and documents.<br />
12.0.3 Write Annual Penobscot Report<br />
An annual report will be produced that summarizes MDMR activities in <strong>the</strong><br />
Penobscot drainage. The report is part <strong>of</strong> our ef<strong>for</strong>ts <strong>to</strong> document our management<br />
and research activity, report results, and document management actions based on<br />
those results.<br />
12.1.1 Develop Broods<strong>to</strong>ck Management <strong>Plan</strong><br />
Develop criteria and <strong>for</strong> disposition <strong>of</strong> adult Atlantic salmon trapped at <strong>the</strong> Veazie<br />
Dam fishway trap and subsequently <strong>the</strong> Mil<strong>for</strong>d Fish lift once operational. The<br />
Broods<strong>to</strong>ck management plan (BSMP) requires an expanded section on Penobscot<br />
broods<strong>to</strong>ck management. This task will be carried out by <strong>the</strong> Genetic Diversity<br />
Action Team (GDAT). The plan should cover all aspects <strong>of</strong> <strong>the</strong> Penobscot<br />
broods<strong>to</strong>ck, including but not limited <strong>to</strong> alternate sources (life stages) <strong>of</strong> broods<strong>to</strong>ck,<br />
target numbers, proportion <strong>of</strong> hatchery and wild fish in <strong>the</strong> broods<strong>to</strong>ck, best use and<br />
management <strong>of</strong> <strong>the</strong> F2 line, effective population size issues, and domestication<br />
issues. This task is currently in <strong>the</strong> list <strong>of</strong> tasks under <strong>the</strong> GDAT.<br />
12.1.2 Evaluate <strong>the</strong> best use (disposition) <strong>of</strong> returning wild and hatchery origin<br />
Atlantic salmon captured at <strong>the</strong> Veazie Dam fishway trap<br />
Naturally spawning wild Atlantic salmon are <strong>the</strong> most important step <strong>to</strong>ward res<strong>to</strong>ring<br />
Atlantic salmon <strong>to</strong> <strong>the</strong> Penobscot River. However, <strong>the</strong> low numbers <strong>of</strong> fish and low<br />
survivals, coupled with <strong>the</strong> desire <strong>to</strong> minimize divergence <strong>of</strong> conservation hatchery<br />
and wild fish complicate <strong>the</strong> use <strong>of</strong> wild adults. Any strategy developed under this<br />
task will need <strong>to</strong> be fully compatible with <strong>the</strong> Broods<strong>to</strong>ck Management <strong>Plan</strong> and will<br />
need <strong>to</strong> be vetted through <strong>the</strong> GDAT. Assemble a small team <strong>to</strong> review in<strong>for</strong>mation<br />
and develop ideas.<br />
12.1.3 Update and revise Penobscot adult Atlantic salmon collection pro<strong>to</strong>col<br />
Adult Atlantic salmon collection pro<strong>to</strong>cols will need <strong>to</strong> be updated <strong>to</strong> reflect changes<br />
in <strong>the</strong> BSMP and <strong>the</strong> collection facility at Mil<strong>for</strong>d. The pro<strong>to</strong>col will be adapted and<br />
updated from current pro<strong>to</strong>cols used at <strong>the</strong> Veazie Dam fishway trap and o<strong>the</strong>r lifts<br />
in <strong>the</strong> State. Safeguards that are in place <strong>to</strong> protect Atlantic salmon should not<br />
change. We anticipate that procedures related <strong>to</strong> <strong>the</strong> operation <strong>of</strong> <strong>the</strong> new lift and<br />
<strong>the</strong> logistics <strong>of</strong> <strong>the</strong> location will change.<br />
PRFP Page 36
12.1.4 Operate <strong>the</strong> adult Atlantic salmon collection facility according <strong>to</strong><br />
standard operation procedures (SOP)<br />
MDMR is currently managing <strong>the</strong> Veazie Dam adult trap according <strong>to</strong> current adult<br />
salmon trap pro<strong>to</strong>cols. The trap is operated annually from May 1 st <strong>to</strong> Oc<strong>to</strong>ber 31st.<br />
Operations will follow <strong>the</strong> most current SOP. The SOP is expected <strong>to</strong> change based<br />
on recommendations in <strong>the</strong> BSMP as well as a change in <strong>the</strong> collection location<br />
(Tasks 12.1.1).<br />
12.1.5 Develop and implement a standardized redd count sampling scheme<br />
Assessment <strong>of</strong> adult returns, movement, and reproductive success requires an<br />
unbiased and spatially representative sample (see Appendix H, Task 13.2.2).<br />
Sampling should consider <strong>for</strong> trend and status analysis. In addition, sampling should<br />
allow <strong>for</strong> greater ef<strong>for</strong>t depending on <strong>the</strong> assessment needs <strong>of</strong> biologists and<br />
managers. Finally, sampling must be flexible <strong>to</strong> allow un-sampled sites <strong>to</strong> be<br />
accounted <strong>for</strong>, and <strong>to</strong> add sites as needed. Collecting redd data under an integrated<br />
probabilistic sampling plan with standardized pro<strong>to</strong>cols should increase statistical<br />
power, focus sampling ef<strong>for</strong>ts, and allow analysis at various spatial and temporal<br />
scales. The redd sampling plan <strong>for</strong> <strong>the</strong> Penobscot will be <strong>the</strong> core <strong>for</strong> a larger statewide<br />
sampling plan. The sample plan will also include procedures <strong>for</strong> repeated<br />
counts and timing <strong>of</strong> counts. The sample will be spatially balanced and will<br />
accommodate varying sampling ef<strong>for</strong>t and needs across space. When appropriate,<br />
field methods <strong>for</strong> research projects should con<strong>for</strong>m <strong>to</strong> this standardized sampling<br />
scheme.<br />
12.1.6 Moni<strong>to</strong>r reaches <strong>for</strong> natural re-colonization<br />
Moni<strong>to</strong>r reaches <strong>for</strong> natural re-colonization (areas with no active s<strong>to</strong>ck enhancement)<br />
by juvenile assessment and redd surveys on an annual basis. Ideally, vacant habitat<br />
will at some point become inhabited by fish due <strong>to</strong> natural recruitment (straying).<br />
Since stray rates are generally low <strong>for</strong> salmon (~1%) and <strong>the</strong> current population size<br />
is small, straying <strong>to</strong> colonize a new area is unlikely. However, this strategy should<br />
be employed <strong>for</strong> two reasons: First, populations started by naturally colonization may<br />
be more likely <strong>to</strong> succeed than by s<strong>to</strong>cking and second, leaving some quality habitat<br />
vacant <strong>for</strong> natural recruitment provides a source <strong>of</strong> comparison <strong>for</strong> passive<br />
management areas. Moni<strong>to</strong>r <strong>the</strong>se reaches by juvenile assessment and redd<br />
surveys on an annual basis.<br />
12.1.7 Moni<strong>to</strong>r 2008 redds <strong>to</strong> evaluate spawning success (YOY)<br />
Develop a plan <strong>to</strong> assess natural reproduction by 2008 spawners <strong>for</strong> relative<br />
abundance and spatial distribution be<strong>for</strong>e sampling season. Consider alternative<br />
sampling (e.g. snorkeling) if early sampling is desired. State <strong>the</strong> objectives <strong>of</strong> <strong>the</strong><br />
sampling and consider in<strong>for</strong>mation that will be needed <strong>for</strong> adaptive management.<br />
Target reaches known <strong>to</strong> have had spawning or adult escapement in 2008 should be<br />
sampled. Also, sampling throughout <strong>the</strong> basin, with focus on areas that are not<br />
s<strong>to</strong>cked with fry will help <strong>to</strong> describe <strong>the</strong> spatial distribution <strong>of</strong> reproduction.<br />
Assessment <strong>of</strong> natural reproduction is pivotal <strong>to</strong> understanding progress <strong>to</strong>wards<br />
PRFP Page 37
es<strong>to</strong>ration, and <strong>to</strong> effectively adjust management <strong>to</strong> optimize chances <strong>for</strong><br />
res<strong>to</strong>ration.<br />
12.1.8 Investigate recruitment from natural spawning relative <strong>to</strong> o<strong>the</strong>r<br />
enhancement strategies<br />
Fry s<strong>to</strong>cking has generated high density juvenile salmon populations in some areas,<br />
but <strong>the</strong> net difference in production from fry s<strong>to</strong>cking versus natural spawning is<br />
unknown. Options <strong>for</strong> optimal enhancement strategy <strong>for</strong> Maine Rivers can not be<br />
determined without <strong>the</strong>se data. Natural spawning encompasses several life his<strong>to</strong>ry<br />
components that are absent in <strong>the</strong> hatchery program (mate choice, spawning<br />
behavior, emergence, etc) and is <strong>the</strong> ultimate goal <strong>of</strong> res<strong>to</strong>ration.<br />
12.2.1 Reducing sea-run broods<strong>to</strong>ck needs with a goal <strong>of</strong> increasing sea-run<br />
adult escapement (e.g. alternative broods<strong>to</strong>ck sources, reviewing production<br />
needs, evaluation hatchery production potential)<br />
This will require <strong>for</strong>ming a team that will ei<strong>the</strong>r be <strong>the</strong> same team that handles<br />
12.1.2, or works very closely with that team. The team will develop and review,<br />
under a risk-benefit framework, various approaches <strong>to</strong> achieve this task. The work<br />
must also be fully compatible with <strong>the</strong> BSMP and <strong>to</strong> achieve this task <strong>the</strong> GDAT will<br />
need <strong>to</strong> be closely involved. GDAT and Conservation Hatchery Action Team<br />
(CHAT) will also review and make final recommendations.<br />
12.3.1 Review methods and ideas <strong>for</strong> using precocious parr in addition <strong>to</strong><br />
adults as broods<strong>to</strong>ck<br />
This task will be covered under 12.1.2 with consultation with <strong>the</strong> CHAT, field, and<br />
hatchery staff. Fur<strong>the</strong>r development will be required <strong>to</strong> make <strong>the</strong> concepts<br />
operational if and when additional life stages are <strong>to</strong> be used.<br />
12.4.1 Review <strong>the</strong> potential <strong>to</strong> rejuvenate kelts, and identify possible uses (e.g.<br />
broods<strong>to</strong>ck, spawning escapement)<br />
This will require <strong>for</strong>ming a team that will ei<strong>the</strong>r be <strong>the</strong> same team that handles tasks<br />
12.1.2 and 12.2.1, or works very closely with those team(s). The team will develop<br />
and review <strong>the</strong>, cost-benefit <strong>of</strong> various approaches <strong>to</strong> achieve this task. The work<br />
must also be fully compatible with <strong>the</strong> BSMP and <strong>to</strong> achieve this task <strong>the</strong> GDAT will<br />
need <strong>to</strong> be closely involved. GDAT and CHAT will also review and make final<br />
recommendations.<br />
12.5.1 Collaborate with PPL, PRRT, and Federal Agencies <strong>to</strong> assess <strong>the</strong> Mil<strong>for</strong>d<br />
fish lift<br />
The capability <strong>of</strong> <strong>the</strong> proposed Mil<strong>for</strong>d fish lift <strong>to</strong> provide safe, timely, and effective<br />
upstream fish passage <strong>for</strong> Atlantic salmon and o<strong>the</strong>r diadromous fish species must<br />
be confirmed. Once <strong>the</strong> lift is operational, MDMR will work with PPL, federal<br />
agencies, and <strong>the</strong> PRRT <strong>to</strong> evaluate <strong>the</strong> lift <strong>for</strong> passage effectiveness <strong>for</strong> adult<br />
salmon. It is our hope that MDMR will be able <strong>to</strong> use <strong>the</strong> Veazie Dam fishway trap<br />
as a collection point <strong>to</strong> mark and tag Atlantic salmon during <strong>the</strong> first year <strong>of</strong> <strong>the</strong> lift’s<br />
evaluation (prior <strong>to</strong> removal <strong>of</strong> <strong>the</strong> Veazie Dam).<br />
PRFP Page 38
12.6.1 Proposal <strong>to</strong> investigate natural spawning per<strong>for</strong>mance <strong>of</strong> translocated<br />
adult salmon<br />
Natural spawning is fundamental <strong>to</strong> res<strong>to</strong>ring self-sustaining populations, and few<br />
management actions in <strong>the</strong> Penobscot promote natural spawning. Escapement <strong>to</strong><br />
headwater spawning habitat is compromised by upstream passage deficiencies and<br />
o<strong>the</strong>r fac<strong>to</strong>rs (e.g. imprinting). The reproductive success <strong>of</strong> adult sea-run salmon<br />
transported directly in<strong>to</strong> spawning habitat will be assessed. The effectiveness <strong>of</strong><br />
natural spawning relative <strong>to</strong> o<strong>the</strong>r enhancement techniques (e.g. fry s<strong>to</strong>cking) will be<br />
assessed (Task 12.1.8).<br />
13.1.1 Literature review evaluating causes and remedies <strong>for</strong> poor per<strong>for</strong>mance<br />
<strong>of</strong> hatchery fry relative <strong>to</strong> wild fry<br />
Survival <strong>of</strong> hatchery reared juveniles is low relative <strong>to</strong> naturally reared fish. Although<br />
<strong>the</strong> mechanism <strong>for</strong> post release mortality is <strong>of</strong>ten not well described, physical and<br />
behavioral deficiencies in hatchery fish that may contribute <strong>to</strong> poor survival are well<br />
documented. Emerging techniques in <strong>the</strong> science <strong>of</strong> reintroduction biology (e.g.,<br />
environmental conditioning, life-skills training) <strong>of</strong>fer high potential <strong>for</strong> improved<br />
per<strong>for</strong>mance, <strong>of</strong>ten at minimal cost. Increasing per<strong>for</strong>mance <strong>of</strong> s<strong>to</strong>cked fish may be<br />
more cost effective than increasing production <strong>of</strong> s<strong>to</strong>cked fish as a mechanism <strong>for</strong><br />
increasing adult returns. These techniques will be examined <strong>for</strong> applicability <strong>to</strong> <strong>the</strong><br />
Maine salmon program.<br />
13.1.2 Literature review evaluating causes and remedies <strong>for</strong> poor per<strong>for</strong>mance<br />
<strong>of</strong> hatchery smolts relative <strong>to</strong> wild smolts<br />
Survival <strong>of</strong> hatchery-reared juveniles is low relative <strong>to</strong> naturally reared fish. Although<br />
<strong>the</strong> mechanism <strong>for</strong> post release mortality is <strong>of</strong>ten not well described, physical and<br />
behavioral deficiencies in hatchery fish which may contribute <strong>to</strong> poor survival are<br />
well documented. Techniques in <strong>the</strong> science <strong>of</strong> reintroduction biology (e.g.<br />
environmental conditioning, life-skills training, s<strong>to</strong>cking at night) have <strong>the</strong> potential <strong>to</strong><br />
improve hatchery-reared smolt per<strong>for</strong>mance. Increasing per<strong>for</strong>mance <strong>of</strong> s<strong>to</strong>cked fish<br />
may be more cost effective than increasing production <strong>of</strong> s<strong>to</strong>cked fish as a<br />
mechanism <strong>for</strong> increasing adult returns. These techniques will be examined <strong>for</strong><br />
applicability <strong>to</strong> <strong>the</strong> Maine salmon program.<br />
13.2.1 Develop an integrated s<strong>to</strong>ck enhancement program <strong>to</strong> optimize adult<br />
Atlantic salmon returns<br />
The objective is <strong>to</strong> consider when, where, and how each life stage is s<strong>to</strong>cked in<br />
order <strong>to</strong> maximize <strong>the</strong>ir accumulative contributions <strong>to</strong> adult returns and evaluate <strong>the</strong><br />
efficacy <strong>of</strong> s<strong>to</strong>cking. It is critical that we are able <strong>to</strong> evaluate <strong>the</strong> contributions <strong>of</strong><br />
each hatchery product <strong>to</strong> juvenile production and adult returns. This will require a<br />
s<strong>to</strong>cking program that allows <strong>for</strong> <strong>the</strong> evaluation <strong>of</strong> individual s<strong>to</strong>cking strategies<br />
(Appendix D fry, GLNFH parr, adults, smolts). Future allocations <strong>of</strong> hatchery-reared<br />
products should consider current data; modeled population viability (Appendix B),<br />
potential productivity (Appendix C and Task 13.3.3), logistical constraints, and<br />
s<strong>to</strong>cking <strong>of</strong> o<strong>the</strong>r salmon life stages (Task 13.2.2). The plan should review existing<br />
PRFP Page 39
strategies, and integrate and complement o<strong>the</strong>r enhancement strategy comparisons<br />
(i.e. Dennys River fry entirely point s<strong>to</strong>cked; Kennebec’s River primary strategy is<br />
egg planting; Narraguagus River hatchery-reared smolts but no parr; Sheepscot and<br />
Narraguagus Rivers 0+ hatchery-reared parr). This integrated s<strong>to</strong>cking plan will be<br />
developed concurrently with <strong>the</strong> adaptive management and assessment plans.<br />
13.2.2 Develop and implement an integrated assessment plan<br />
Atlantic salmon population assessment may include capturing emerging alevin, 0+<br />
and older stream resident juveniles, emigrating smolts, and immigrating adults. Less<br />
invasive counts may be made by observing juveniles and adults during snorkel<br />
surveying, adults on video or using PIT or ultrasonic tag technology, and locating<br />
redds in spawning habitat. Each assessment method provides different in<strong>for</strong>mation,<br />
which can be integrated <strong>to</strong> estimate vital rates (e.g. survival, growth, movement) <strong>for</strong><br />
individuals or cohorts and/or compare relative abundance among sites, subwatersheds,<br />
and years. Sampling populations in natural systems requires an<br />
unbiased and spatially distributed sampling approach that balances data collections<br />
<strong>for</strong> temporal population trends and status, and evaluating management actions<br />
(Appendix H). The plan will rely primarily on Catch-Per-Unit-Ef<strong>for</strong>t (CPUE)<br />
electr<strong>of</strong>ishing pro<strong>to</strong>col <strong>for</strong> stream resident juveniles. An approach integrating CPUE<br />
with <strong>the</strong> few long term salmon population assessment sites allows sampling more<br />
sites in sub-drainages and provides a broad index <strong>of</strong> population abundance and<br />
distribution. The assessment plan will rely on interim life stage measures, but must<br />
ultimately integrate <strong>the</strong> results <strong>to</strong> estimate population growth parameters or lifetime<br />
reproductive success. Sampling methodology will be standardized <strong>to</strong> assist in<br />
comparisons between/within sub-drainages. All targeted research projects will<br />
include rigorous experimental designs developed through <strong>the</strong> proposal process and<br />
peer review (e.g. CHAT).<br />
13.2.3 Develop and implement a standardized juvenile assessment scheme<br />
Assessment <strong>of</strong> juvenile population status and trends requires an unbiased and<br />
representative sample (see Appendix H, Task 13.2.2). Sampling should consider <strong>for</strong><br />
trend and status analysis. In addition, sampling should allow <strong>for</strong> greater ef<strong>for</strong>t<br />
depending on <strong>the</strong> assessment needs <strong>of</strong> biologists and managers. Finally, sampling<br />
must be flexible <strong>to</strong> allow un-sampled sites <strong>to</strong> be accounted <strong>for</strong>, and <strong>to</strong> add sites as<br />
needed. Collecting data under an integrated probabilistic sampling plan with<br />
standardized pro<strong>to</strong>cols should increase statistical power, focus sampling ef<strong>for</strong>ts, and<br />
allow analysis at various spatial and temporal scales. The sampling plan <strong>for</strong> <strong>the</strong><br />
Penobscot will be <strong>the</strong> core <strong>for</strong> a larger state-wide sampling plan. The sampling plan<br />
could include both removal population estimates and CPUE methods, should be<br />
spatially balanced and accommodate varying sampling ef<strong>for</strong>t across space. When<br />
appropriate, field methods <strong>for</strong> research projects should con<strong>for</strong>m <strong>to</strong> this standardized<br />
sampling scheme.<br />
13.2.4 Proposal <strong>to</strong> expand MDMR egg planting research in<strong>to</strong> <strong>the</strong> Penobscot<br />
Egg planting provides one <strong>of</strong> <strong>the</strong> two most naturalistic approaches <strong>for</strong> introducing<br />
juvenile fish (along with adult s<strong>to</strong>cking) <strong>to</strong> <strong>the</strong> environment. It also af<strong>for</strong>ds managers<br />
PRFP Page 40
<strong>the</strong> ability <strong>to</strong> target specific areas <strong>to</strong> introduce fish. Establishing an egg planting<br />
project that integrates with work already underway would allow a comparison<br />
between sea-run source eggs and eggs from captive reared adults (Penobscot F2).<br />
13.2.5 Develop a fry s<strong>to</strong>cking adaptive management plan<br />
The goal <strong>of</strong> <strong>the</strong> plan is <strong>to</strong> maximize <strong>the</strong> number <strong>of</strong> smolts reaching Penobscot Bay<br />
from fry s<strong>to</strong>cking (Appendix E). Adaptive management <strong>for</strong>ces managers <strong>to</strong> clearly<br />
identify goals and assumptions, state management strategy, design moni<strong>to</strong>ring, and<br />
recognize <strong>the</strong> links between expected outcome(s) and management changes. Fry<br />
have been s<strong>to</strong>cked in <strong>the</strong> watershed since 1990 and resulted in high parr and smolt<br />
densities in some areas; however, adult returns and natural spawning from naturally<br />
reared salmon remain low. In addition <strong>to</strong> allocation decisions (i.e. location, density,<br />
method), <strong>the</strong> quality <strong>of</strong> <strong>the</strong> fry and <strong>the</strong> characteristics and conditions <strong>of</strong> <strong>the</strong> habitat<br />
also affects survival. Past decisions <strong>for</strong> <strong>the</strong> annual allocations <strong>of</strong> fry among and<br />
within sub-basins need <strong>to</strong> be documented (Task 13.2.2) and combined with data on<br />
river conditions (e.g., flow, temperature) and fry quality (e.g., development index<br />
(DI), relative size number/lb) <strong>to</strong> develop feedback <strong>to</strong> <strong>the</strong> hatchery on product survival<br />
(Task 13.2.7). Current practices will be reviewed and s<strong>to</strong>cking strategies developed<br />
based on analysis <strong>of</strong> past experiences and use <strong>of</strong> models <strong>to</strong> aid in <strong>the</strong> selection <strong>of</strong><br />
suitable habitats <strong>to</strong> s<strong>to</strong>ck with appropriate life stages. Allocations are currently<br />
based on biotic, abiotic, logistics, and observed results. Population viability and<br />
habitat productions models (Appendix B and C) may assist in identifying habitats<br />
that have suitable characteristics <strong>for</strong> salmon.<br />
13.2.6 Review and assess causes and remedies <strong>for</strong> poor natural recruitment<br />
In <strong>the</strong> Penobscot drainage, natural recruitment is limited, in part, because <strong>the</strong><br />
numbers <strong>of</strong> wild spawners are adult returns is limited in part by inadequate <strong>to</strong> foster<br />
robust juvenile populations. It is <strong>the</strong>re<strong>for</strong>e important <strong>to</strong> understand possible causes<br />
and work <strong>to</strong> remedy <strong>the</strong>m. Increased adult escapement alone will not remedy poor<br />
juvenile recruitment if <strong>the</strong> habitat is compromised and limiting.<br />
13.2.7 Report: Juvenile production from fry s<strong>to</strong>cking<br />
Fry s<strong>to</strong>cking has been an integral management <strong>to</strong>ol <strong>for</strong> conserving Atlantic salmon<br />
since 1990. To date <strong>the</strong>re has been no review <strong>of</strong> <strong>the</strong> practice and its contributions <strong>to</strong><br />
adult returns. An assessment <strong>of</strong> past practices (recent allocations and distribution<br />
procedures) and <strong>the</strong> relative contributions <strong>of</strong> this enhancement strategy <strong>to</strong> juvenile<br />
populations, smolt production, and it contributions <strong>to</strong> adult returns in is needed.<br />
13.2.8 S<strong>to</strong>ck fry and assess according <strong>to</strong> existing management practices<br />
MDMR is currently reviewing s<strong>to</strong>cking and population assessment practices <strong>to</strong> gain<br />
better in<strong>for</strong>mation <strong>for</strong> adaptive management. Prior <strong>to</strong> <strong>the</strong> development <strong>of</strong> <strong>the</strong><br />
integrated s<strong>to</strong>ck enhancement program, biologists will continue s<strong>to</strong>ck fry according<br />
<strong>to</strong> existing practices.<br />
13.2.9 S<strong>to</strong>ck fry according <strong>to</strong> fry s<strong>to</strong>cking adaptive management plan<br />
PRFP Page 41
This task is implementing <strong>the</strong> integrated enhancement plan (Task 13.2.1) and <strong>the</strong> fry<br />
s<strong>to</strong>cking adaptive management plan (Task 13.2.5). Carefully documenting s<strong>to</strong>cking<br />
methods, environmental conditions, and product characteristics (e.g. s<strong>to</strong>cking<br />
density, release type, temperature flow, DI etc.) during s<strong>to</strong>cking is required <strong>to</strong> allow<br />
feedback <strong>to</strong> <strong>the</strong> adaptive management <strong>of</strong> fry.<br />
13.2.10 Evaluate alternative fry s<strong>to</strong>cking strategies/locations <strong>to</strong> increase smolt<br />
production<br />
Since s<strong>to</strong>cking hatchery fry became one <strong>of</strong> <strong>the</strong> contemporary res<strong>to</strong>ration strategies<br />
<strong>for</strong> <strong>the</strong> Maine salmon program, <strong>the</strong> approach has been <strong>to</strong> scatter fry in <strong>the</strong> mainstem<br />
<strong>of</strong> major tributaries <strong>to</strong> <strong>the</strong> Penobscot (e.g. Piscataquis, East Branch). While scatter<br />
s<strong>to</strong>cking is more labor intensive than point s<strong>to</strong>cking, it was adopted <strong>to</strong> reduce<br />
intraspecific competition. This strategy has produced high juvenile densities in some<br />
but not all <strong>of</strong> <strong>the</strong> areas currently s<strong>to</strong>cked. By maintaining past strategies in some<br />
reaches, alternative strategies <strong>to</strong> increase juvenile production (parr and smolts)<br />
using can be tested using a Be<strong>for</strong>e-After/Control-Impact (BACI) design. Alternative<br />
strategies <strong>to</strong> test include, but may not be limited <strong>to</strong>: allocating a portion <strong>of</strong> fry s<strong>to</strong>cked<br />
in mainstem reaches <strong>to</strong> smaller sized streams; s<strong>to</strong>cking vacant tributaries (not being<br />
moni<strong>to</strong>ring <strong>for</strong> natural re-colonization) in <strong>the</strong> lower sub watersheds where population<br />
viability may be higher than in headwaters above dams; and varying fry s<strong>to</strong>cking<br />
densities annually at locations, <strong>to</strong> mimic natural spawning variability (e.g. high fall<br />
water levels – more spawning likely <strong>to</strong> occur in tributaries and far<strong>the</strong>r upstream). To<br />
ensure effective assessment (Task 13.2.2), strategies will be segregated<br />
geographically.<br />
13.2.11 Develop a parr s<strong>to</strong>cking adaptive management plan<br />
The goal <strong>of</strong> <strong>the</strong> plan is <strong>to</strong> maximum <strong>the</strong> number <strong>of</strong> smolt reaching Penobscot Bay<br />
from s<strong>to</strong>cking parr (Appendix E). Parr are currently <strong>the</strong> by-product <strong>of</strong> <strong>the</strong><br />
accelerated one-year smolt program at GLNFH. Past decisions <strong>for</strong> <strong>the</strong> annual<br />
allocations <strong>of</strong> GLNFH parr needs <strong>to</strong> be documented (Task 13.2.7). Future<br />
allocations need <strong>to</strong> considered: location relative <strong>to</strong> past experience and modeled<br />
population viability (Appendix B), potential productivity (Appendix C and Task<br />
13.3.3), and s<strong>to</strong>cking <strong>of</strong> o<strong>the</strong>r salmon life stages. The potential <strong>to</strong> s<strong>to</strong>ck 0+ parr<br />
reared at ambient water temperatures also needs <strong>to</strong> be evaluated. Integrating smolt,<br />
parr, and fry s<strong>to</strong>cking includes s<strong>to</strong>cking parr in waters where fry per<strong>for</strong>m poorly (e.g.<br />
wider rivers, high levels <strong>of</strong> preda<strong>to</strong>rs/competi<strong>to</strong>rs) or where insufficient fry numbers<br />
are available <strong>to</strong> s<strong>to</strong>ck, and segregating parr from smolt s<strong>to</strong>cking. The plan should<br />
allocate parr in<strong>to</strong> reaches with sufficient quality habitat <strong>for</strong> <strong>the</strong> typical number <strong>of</strong> parr<br />
produced by GLNFH <strong>to</strong> survive <strong>for</strong> 8 <strong>to</strong> 32 months in <strong>the</strong> fresh water environment.<br />
Resulting parr densities will depend in part on <strong>the</strong> size or physiological state <strong>of</strong> <strong>the</strong><br />
fish when s<strong>to</strong>cked. Current data on <strong>the</strong> proportion <strong>of</strong> <strong>the</strong> s<strong>to</strong>cked parr that smolt <strong>the</strong><br />
following spring (P8) suggests that most GLNFH parr emigrate after only one winter<br />
in <strong>the</strong> wild. In contrast, a large proportion <strong>of</strong> 0+ parr reared on ambient water at<br />
CBNFH spend two winters in freshwater (P20). The plan needs <strong>to</strong> anticipate<br />
changes in s<strong>to</strong>cking strategy as more is learned about how size at s<strong>to</strong>cking affects<br />
<strong>the</strong> proportion <strong>of</strong> smolts emigrating <strong>the</strong> spring after s<strong>to</strong>cking and as adult returns<br />
PRFP Page 42
occur. Assessment is likely <strong>to</strong> include a mix <strong>of</strong> moni<strong>to</strong>ring <strong>for</strong> stream resident<br />
juveniles, emigrating smolt, and documenting spawning activity. Reproductive<br />
success relative <strong>to</strong> o<strong>the</strong>r s<strong>to</strong>cked life his<strong>to</strong>ry stages and wild fish will also need <strong>to</strong> be<br />
assessed, and should be coupled with return rate <strong>to</strong> in<strong>for</strong>m management decisions.<br />
13.2.12 Literature review evaluating causes and remedies <strong>for</strong> poor<br />
per<strong>for</strong>mance <strong>of</strong> hatchery parr relative <strong>to</strong> wild parr<br />
The current parr program <strong>for</strong> <strong>the</strong> Penobscot is a by-product <strong>of</strong> <strong>the</strong> smolt program.<br />
However, s<strong>to</strong>cking 300K fall parr has <strong>the</strong> potential <strong>for</strong> large contributions <strong>to</strong> adult<br />
returns. What can be done <strong>to</strong> increase <strong>the</strong>ir survival? Is <strong>the</strong>re differential marine<br />
survival <strong>for</strong> parr that spend one winter in fresh water versus two winters? What<br />
fac<strong>to</strong>rs influence overwinter survival, smoltification and marine survival?<br />
13.2.13 S<strong>to</strong>ck parr and assess according <strong>to</strong> existing management practices<br />
MDMR is currently refining s<strong>to</strong>cking practices and population assessment practices<br />
<strong>to</strong> gain better in<strong>for</strong>mation <strong>for</strong> adaptive management. Prior <strong>to</strong> this transition, parr<br />
s<strong>to</strong>cking and assessment will continue according <strong>to</strong> current standard operating<br />
procedures (Appendix E). The s<strong>to</strong>cking plan <strong>for</strong> 2009 will follow <strong>the</strong> same s<strong>to</strong>cking<br />
regimes as 2008 (1/3 Piscataquis, 1/3 Pleasant, 1/6 below Howland, 1/6 below<br />
Great Works). For 2008, approximately 330,000 parr were s<strong>to</strong>cked. All parr s<strong>to</strong>cked<br />
in <strong>the</strong> Pleasant drainage (~130,000) received a left ventral and adipose fin clip. In<br />
2009, <strong>the</strong>y will receive a left ventral clip.<br />
13.2.14 S<strong>to</strong>ck parr according <strong>to</strong> parr s<strong>to</strong>cking adaptive management plan<br />
This task is implementing <strong>the</strong> integrated enhancement plan (Task 13.2.1) and <strong>the</strong><br />
parr s<strong>to</strong>cking adaptive management plan (Task 13.2.11).<br />
13.2.15 Report current s<strong>to</strong>cking practices (fry, parr, smolts, adults),<br />
documenting decisions <strong>for</strong> annual allocations <strong>for</strong> each life stage<br />
Fry, parr, and smolt s<strong>to</strong>cking are <strong>the</strong> standard s<strong>to</strong>ck enhancement practices use in<br />
<strong>the</strong> Penobscot watershed. The contribution <strong>of</strong> hatchery smolt s<strong>to</strong>cking <strong>to</strong> adult<br />
returns is well documented but <strong>the</strong> relative effectiveness <strong>of</strong> o<strong>the</strong>r enhancement<br />
methods is poorly characterized. Reporting on current decision making practices<br />
and documenting recent changes will provide <strong>the</strong> foundation <strong>for</strong> <strong>the</strong> adaptive<br />
management plan (Appendix D) and <strong>the</strong> integrated enhancement program (Task<br />
13.2.1).<br />
13.2.16 Assess hatchery product marking scheme<br />
In an ef<strong>for</strong>t <strong>to</strong> evaluate return rates <strong>for</strong> all hatchery products being s<strong>to</strong>cked in <strong>the</strong><br />
Penobscot, <strong>the</strong> existing marking scheme needs <strong>to</strong> be assessed. Currently, <strong>the</strong> adult<br />
return rates <strong>for</strong> unmarked smolts are overestimated due <strong>to</strong> misidentification <strong>of</strong> adult<br />
returns from unmarked parr. It is difficult <strong>to</strong> distinguish returns from unmarked parr<br />
that emigrate after one winter from unmarked smolts that emigrate <strong>the</strong> same spring.<br />
Any marking scheme will need <strong>to</strong> fit in<strong>to</strong> <strong>the</strong> broader context <strong>of</strong> MDMR’s integrated<br />
assessment plan.<br />
PRFP Page 43
13.3.1 Review and develop habitat based productivity estimates, integrating<br />
fry and parr per<strong>for</strong>mance, habitat data, and water quality<br />
The seven sub-watersheds identified in <strong>the</strong> plan differ in accessibility <strong>to</strong> salmon<br />
(passage and connectivity), resident and introduced fish communities,<br />
geomorphology (thus interspersion and complexity <strong>of</strong> salmon habitat), hydrologic<br />
regime, <strong>the</strong>rmal regime, underlying aquifers and bedrock, land use patterns, and<br />
base flow and s<strong>to</strong>rm flow water chemistry. These fac<strong>to</strong>rs and o<strong>the</strong>rs (e.g. stream<br />
depth and width, N:P ratio, alkalinity, conductivity, temperature, pH) affect habitat<br />
suitability <strong>for</strong> Atlantic salmon. The ability <strong>of</strong> <strong>the</strong>se fac<strong>to</strong>rs <strong>to</strong> predict juvenile habitat<br />
suitability and provide insight <strong>for</strong> management decisions will be assessed using<br />
existing in<strong>for</strong>mation<br />
14.1.1 Evaluate smolt s<strong>to</strong>cking strategies <strong>to</strong> minimize smolt mortality<br />
S<strong>to</strong>cking smolts directly in<strong>to</strong> headwater spawning habitat would improve imprinting<br />
<strong>to</strong> that habitat, but would subject smolts <strong>to</strong> higher (35-37%) cumulative dam-related<br />
mortality relative <strong>to</strong> downriver releases and reduce <strong>the</strong> number <strong>of</strong> adult returns. Net<br />
spawning escapement <strong>to</strong> headwater habitat is fur<strong>the</strong>r reduced (42-57%) due <strong>to</strong><br />
upstream passage inefficiencies. An integrated approach <strong>to</strong> smolt s<strong>to</strong>cking and<br />
adult translocation may increase net spawning escapement <strong>to</strong> headwater habitat by<br />
77-94% with no change in s<strong>to</strong>cking numbers or marine survival.<br />
14.1.2 Proposal <strong>to</strong> evaluate environmental conditioning <strong>of</strong> smolts (freshwater<br />
smolt ponds and sea-cages) <strong>to</strong> improve survival during transition <strong>to</strong> <strong>the</strong><br />
marine environment<br />
High mortality <strong>of</strong> Penobscot smolts occurs during transition <strong>to</strong> <strong>the</strong> marine<br />
environment (~50% mortality, NOAA Fisheries, unpublished data), and seems higher<br />
<strong>for</strong> hatchery-reared than wild smolts. Increases in marine survival have been<br />
demonstrated elsewhere by acclimating hatchery-reared smolts <strong>to</strong> <strong>the</strong> marine<br />
environment in sea-cages prior <strong>to</strong> release. Staging smolts in <strong>the</strong> West Enfield smolt<br />
ponds prior <strong>to</strong> sea-cage acclimation may enhance imprinting <strong>to</strong> <strong>the</strong> Penobscot River<br />
and improve adult return rates.<br />
14.1.3 Proposal <strong>to</strong> capture and captive rear in sea-cages wild and/or naturallyreared<br />
Penobscot smolts <strong>for</strong> release as sexually mature adults in selected<br />
river reaches<br />
This proposal investigates a strategy <strong>for</strong> circumventing in-river and ocean mortality<br />
by rearing wild and/or naturally-reared smolts in sea-cages <strong>to</strong> adults and releasing<br />
<strong>the</strong>m in selected river reaches <strong>to</strong> spawn. The outcome has <strong>the</strong> potential <strong>to</strong> increase<br />
adult escapement and increase spawning effectiveness, two strategies that have<br />
been identified in our strategic plan.<br />
14.2.1 Develop a smolt s<strong>to</strong>cking adaptive management plan<br />
The goal is <strong>to</strong> balance <strong>the</strong> number <strong>of</strong> smolts reaching Penobscot Bay (Appendix E)<br />
with <strong>the</strong>ir motivation <strong>to</strong> ascend <strong>the</strong> river <strong>to</strong> suitable spawning habitat as returning<br />
adults. In addition, smolt s<strong>to</strong>cking will need <strong>to</strong> be responsive <strong>to</strong> broods<strong>to</strong>ck<br />
requirements as outlined in <strong>the</strong> BSMP. Past decisions <strong>for</strong> <strong>the</strong> annual allocations <strong>of</strong><br />
PRFP Page 44
smolts needs <strong>to</strong> be documented (Task 13.2.7). Future allocations need <strong>to</strong> consider:<br />
1) homing <strong>to</strong> suitable habitat, 2) survival due <strong>to</strong> migration through dams (Appendix<br />
H), 3) seasonal timing, 4) physiological timing, 5) s<strong>to</strong>cking <strong>of</strong> o<strong>the</strong>r salmon life<br />
stages, and 6) broods<strong>to</strong>ck targets. Rearing and release strategies (e.g. smolt<br />
ponds) that have <strong>the</strong> potential <strong>to</strong> improve smolt “quality” and survival need <strong>to</strong> be<br />
evaluated and tested. The return rate <strong>of</strong> marked smolts is <strong>the</strong> primary method <strong>for</strong><br />
assessing <strong>the</strong> effectiveness <strong>of</strong> management actions. Reproductive success relative<br />
<strong>to</strong> o<strong>the</strong>r s<strong>to</strong>cked life his<strong>to</strong>ry stages and wild fish will also need <strong>to</strong> be assessed, and<br />
should be coupled with return rate <strong>to</strong> in<strong>for</strong>m management decisions.<br />
14.2.2 S<strong>to</strong>ck smolts and assess according <strong>to</strong> existing management practices<br />
MDMR is currently refining s<strong>to</strong>cking and assessment practices <strong>to</strong> improve adaptive<br />
management. Prior <strong>to</strong> <strong>the</strong>se transitions, smolt s<strong>to</strong>cking and assessment will<br />
continue according <strong>to</strong> current standard operating procedures (Appendix E). The<br />
s<strong>to</strong>cking plan <strong>for</strong> 2009 will follow <strong>the</strong> same s<strong>to</strong>cking regimes as 2007 and 2008.<br />
~ 175,000 tagged PN s<strong>to</strong>cked above <strong>the</strong> Veazie Dam (Morin Fuel)<br />
~ 200,000 PN s<strong>to</strong>cked in <strong>the</strong> Pleasant River (Milo)<br />
~ 200,000 PN s<strong>to</strong>cked at Passadumkeag boat launch (mainstem Penobscot)<br />
~ 25,000 PN s<strong>to</strong>cked in<strong>to</strong> West Enfield smolt ponds<br />
14.2.3 S<strong>to</strong>ck smolts according <strong>to</strong> smolt s<strong>to</strong>cking adaptive management plan<br />
Once <strong>the</strong> s<strong>to</strong>cking adaptive management plan (Task 14.2.1) has been developed,<br />
smolt will be s<strong>to</strong>cked accordingly.<br />
14.3.1 Proposal <strong>to</strong> evaluate downstream smolt passage efficiency in <strong>the</strong><br />
Piscataquis River<br />
The Upper Piscataquis River contains over 3,000 units <strong>of</strong> <strong>the</strong> most productive<br />
Atlantic salmon habitat in <strong>the</strong> Penobscot watershed. Safe downstream passage <strong>for</strong><br />
migrating smolts is essential <strong>for</strong> res<strong>to</strong>ration <strong>of</strong> this critical habitat, but downstream<br />
passage efficiency data are lacking <strong>for</strong> Piscataquis River dams (except Howland<br />
Dam which is scheduled <strong>to</strong> be bypassed as part <strong>of</strong> <strong>the</strong> PRRP). Downstream<br />
passage efficiency data are required <strong>to</strong> confirm adequate downstream passage, or<br />
<strong>to</strong> identify and correct deficiencies at <strong>the</strong> Guil<strong>for</strong>d Industries, Moosehead<br />
Manufacturing, and Browns Mill dams.<br />
14.3.2 Collaborate with PRRT <strong>to</strong> test downstream passage measures (e.g.<br />
manipulate operating regimes) at PRRT owned dams prior <strong>to</strong> dam removal<br />
MDMR would like <strong>to</strong> capitalize on a unique opportunity <strong>to</strong> investigate operating<br />
regimes at hydro-electric dams <strong>to</strong> enhance downstream fish passage efficiency.<br />
Modifications <strong>to</strong> operating regimes with potential <strong>to</strong> improve downstream passage<br />
efficiency will be identified and tested. Techniques that prove effective will be<br />
applied at hydro-power facilities that are not scheduled <strong>for</strong> removal <strong>to</strong> improve<br />
downstream passage and survival <strong>of</strong> migrating salmon.<br />
15.1.1 Assess feasibility <strong>of</strong> increasing or reallocating hatchery smolt<br />
production <strong>to</strong> produce more adult returns<br />
PRFP Page 45
One strategy <strong>to</strong> increase adult returns is <strong>to</strong> increase <strong>the</strong> numbers <strong>of</strong> smolt being<br />
s<strong>to</strong>cked. Smolts have <strong>the</strong> highest adult return rates <strong>for</strong> any hatchery product<br />
currently being produced. It stands <strong>to</strong> reason that if you convert fry <strong>to</strong> smolt you can<br />
increase adult returns without <strong>the</strong> need <strong>for</strong> additional broods<strong>to</strong>ck. While this sounds<br />
simple, it would require a reorganization <strong>of</strong> hatchery operations and additional<br />
capital.<br />
References<br />
DMR (Dept. Marine Resources) and IFW (Dept. Inland Fish and Wildlife). 2008.<br />
Strategic <strong>Plan</strong> <strong>for</strong> <strong>the</strong> <strong>Res<strong>to</strong>ration</strong> <strong>of</strong> <strong>Diadromous</strong> <strong>Fishes</strong> <strong>to</strong> <strong>the</strong> Penobscot River.<br />
Fay, C., M. Bar<strong>to</strong>n, S. Craig, A. Hecht, J. Pruden, R. Saunders, T. Sheehan, and<br />
J.Trial. 2006. Status review <strong>for</strong> anadromous Atlantic salmon (Salmo salar) in <strong>the</strong><br />
United States. Report <strong>to</strong> <strong>the</strong> National Marine Fisheries Service and <strong>the</strong> U.S. Fish<br />
and Wildlife Service. 294 pp.<br />
NRC (National Research Council), USA. 2004. Atlantic salmon in Maine: A<br />
challenge in conservation and ecosystem management. Final report from <strong>the</strong><br />
committee on Atlantic salmon in Maine. National Academy Press, Washing<strong>to</strong>n,<br />
DC. 62 pp.<br />
SEI (Sustainable Ecosystem Institute). 2007. Review <strong>of</strong> Atlantic salmon hatchery<br />
pro<strong>to</strong>cols, production, and product assessment. Sustainable Ecosystem Institute,<br />
Portland OR. 91 pp.<br />
Wright J., J Sweka, A. Abbott, and T Trinko. 2008. GIS-based Atlantic salmon<br />
habitat model, draft, Appendix C. In Biological valuation <strong>of</strong> Atlantic salmon<br />
habitat within <strong>the</strong> Gulf <strong>of</strong> Maine distinct population segment. National Marine<br />
Fisheries Service, Gloucester, MA.<br />
PRFP Page 46
Section 2 - Passage and Connectivity<br />
PRFP Page 47
Authors: Norm Dubé and Gail Wippelhauser<br />
Introduction<br />
The National Research Council (NRC 2004) listed dams as a major threat <strong>to</strong> Atlantic<br />
salmon populations since dams prevent or impede upstream and downstream fish<br />
migrations and alter or destroy habitat. The Strategic <strong>Plan</strong> <strong>for</strong> <strong>the</strong> <strong>Res<strong>to</strong>ration</strong> <strong>of</strong><br />
<strong>Diadromous</strong> <strong>Fishes</strong> <strong>to</strong> <strong>the</strong> Penobscot River also listed dams as a major contribu<strong>to</strong>r<br />
<strong>to</strong> <strong>the</strong> decline <strong>of</strong> many fish species in <strong>the</strong> Penobscot River.<br />
Whereas effects <strong>of</strong> structures such as dams upon diadromous fish species are fairly<br />
evident, <strong>the</strong>re are o<strong>the</strong>r structures that may appear innocuous <strong>to</strong> diadromous fish at<br />
first glance but may not be in <strong>the</strong> long term. Road crossings may seasonally be an<br />
impediment <strong>to</strong> instream fish movements or prevent movement al<strong>to</strong>ge<strong>the</strong>r. For<br />
example, hanging culverts may prevent juvenile salmon from reaching summer<br />
refugia and bridges whose abutments are narrower than <strong>the</strong> stream width <strong>for</strong>m a<br />
pinch point causing hydraulic barriers <strong>to</strong> <strong>the</strong> upstream movements <strong>of</strong> weaker<br />
swimming diadromous species such as smelt. In order <strong>to</strong> obtain recovery <strong>of</strong> <strong>the</strong><br />
target diadromous fish species in <strong>the</strong> Penobscot River, affects upon inriver<br />
migrations and movements by <strong>the</strong> various life stages <strong>of</strong> a <strong>the</strong> target species needs<br />
<strong>to</strong> be as benign as possible.<br />
There are 14 hydroelectric projects located on <strong>the</strong> mainstem Penobscot River and its<br />
major tributaries (Table 8). Of <strong>the</strong>se, nine hydro projects have been issued licenses<br />
by <strong>the</strong> Federal Energy Regula<strong>to</strong>ry Commission (FERC) and five smaller projects<br />
have been issued license exemptions. In addition, one project never completed<br />
installation <strong>of</strong> generating equipment and was never granted a license or exemption<br />
(Guil<strong>for</strong>d); one dam (Matagamon) was deemed non-jurisdictional by FERC because<br />
<strong>of</strong> <strong>the</strong> lack <strong>of</strong> headwater benefits <strong>to</strong> downstream hydro generation; and one project<br />
surrendered its license exemption (West Winterport) in anticipation <strong>of</strong> project<br />
removal.<br />
There are several avenues available <strong>to</strong> improve or correct passage problems. The<br />
most obvious remedy is removal <strong>of</strong> <strong>the</strong> impediment but this strategy is best suited <strong>to</strong><br />
small barriers at this time. However, removal <strong>of</strong> <strong>the</strong> first (Veazie) and second (Great<br />
Works) dams on <strong>the</strong> lower mainstem Penobscot River and installation <strong>of</strong> an<br />
innovative natural bypass around <strong>the</strong> first dam (Howland) on <strong>the</strong> lower Piscataquis<br />
River as part <strong>of</strong> <strong>the</strong> unprecedented Penobscot River <strong>Res<strong>to</strong>ration</strong> Project has <strong>the</strong><br />
potential <strong>to</strong> radically decrease upstream and downstream passage effects on<br />
migrating fish.<br />
One strategy allowing fish <strong>to</strong> migrate around hydro projects is <strong>to</strong> install upstream and<br />
downstream fish passage facilities. All <strong>the</strong> major dams in <strong>the</strong> Penobscot River<br />
drainage (exclusive <strong>of</strong> <strong>the</strong> West Branch, Penobscot River) currently have upstream<br />
fish passage facilities (Table 9). Most <strong>of</strong> <strong>the</strong> upstream fish passage facilities were<br />
constructed in <strong>the</strong> 1960s and early 1970s as part <strong>of</strong> <strong>the</strong> early res<strong>to</strong>ration program <strong>for</strong><br />
PRFP Page 48
Atlantic salmon. Two dams on <strong>the</strong> Stillwater Branch (Orono, Stillwater) do not have<br />
upstream fish passage facilities but upstream passage could be installed at a later<br />
date pending studies <strong>of</strong> fish attraction <strong>to</strong> <strong>the</strong> Orono project tailrace. Two small hydro<br />
projects on <strong>the</strong> Sebec River do not have upstream fish passage facilities primarily<br />
Table 8. FERC licensed or exempted hydroelectric projects and associated dams, Penobscot River<br />
(exclusive <strong>of</strong> <strong>the</strong> West Branch, Penobscot River).<br />
Dates <strong>of</strong> License/Exemption<br />
Project (FERC No.) Water 1<br />
Capacity L, E 2<br />
Issuance Termination Amendment<br />
Veazie (2403) PN 8.4 MW L 04/20/1998 04/01/2038 04/28/2005<br />
Great Works (2312) PN 7.73 MW L 04/01/1962 03/31/2002 3<br />
12/28/1981<br />
Mil<strong>for</strong>d (2354) PN 6.4 MW 4<br />
L 04/20/1998 04/01/2038 04/18/2005<br />
West Enfield (2600) PN 13 MW L 06/26/1984 5 05/31/2024 07/15/1986;<br />
01/23/1989;<br />
06/04/1997;<br />
04/18/2005<br />
Mattaceunk (2520) PN 19.2 MW L 09/30/1988 08/31/2018 02/09/1990<br />
Orono (2710) STW 2.33 MW L 12/08/2005 6 11/30/2045<br />
Stillwater (2712) STW 1.95 MW L 04/20/1998 7 04/01/2038 04/28/2005<br />
Howland (2721) PQ 1.86 MW L 09/21/1980 09/30/2000 8<br />
Brown’s Mill (5613) PQ 0.55 MW E 9<br />
08/03/1982 -<br />
Moosehead (5912) PQ 0.3 MW E 06/02/1982 -<br />
Guil<strong>for</strong>d (8316) 10<br />
PQ - - - -<br />
Milo (5647) SR 0.6 MW E 02/23/1982 -<br />
Sebec (7253) SR 0.49 MW E 09/26/1983 - 08/03/2006<br />
Lowell Tannery (4202) PD 0.95 MW L 10/31/1980 09/30/2023<br />
Matagamon (UL01-02) 11<br />
EBPN - - - -<br />
Frank<strong>for</strong>t (6618) MS 0.55MW E 09/20/1982 - 03/23/1995<br />
West Winterport MS 0.15 MW E 06/25/1982 06/28/2002 12<br />
04/25/1994;<br />
03/25/1996<br />
1<br />
PN = Penobscot River; STW = Stillwater Branch; PQ = Piscataquis River; SR = Sebec River; PD = Passadumkeag<br />
River; EBPN = East Branch, Penobscot River; MS = Marsh Stream<br />
2 L = License, E = Exemption<br />
3 Project has been operating on an annual license<br />
4 Licensee proposes <strong>to</strong> increase <strong>to</strong>tal capacity <strong>to</strong> 8.0 MW<br />
5 Original license issued February 3, 1970 with effective date <strong>of</strong> January 1, 1938 and termination date <strong>of</strong> December 31,<br />
1987<br />
6<br />
Original license issued November 10, 1977 with effective date <strong>of</strong> July 1, 1950 and termination date <strong>of</strong> December 31,<br />
1993; FERC order dated September 25, 1985 accelerated license expiration <strong>to</strong> date <strong>of</strong> order; project has operated on<br />
an annual license since license expiration; project operation terminated in 1996 when wooden pens<strong>to</strong>cks failed;<br />
redeveloped project began generation in early 2009<br />
7<br />
Original license issued in 1978 with effective date <strong>of</strong> April 1, 1962 and termination date <strong>of</strong> December 31, 1993; project<br />
operated on annual license until issuance <strong>of</strong> new license<br />
8<br />
Original license issued September 21, 1980 with an effective date <strong>of</strong> April 1, 1960 and termination date September 30,<br />
2000; project has been operating on an annual license<br />
9<br />
License exemptions have no expiration date<br />
10<br />
Preliminary permit application filed August 2, 1984 but project was never completed<br />
11<br />
FERC order issued March 8, 2001 stating Grand Lake Matagamon is non-jurisdictional due <strong>to</strong> lack <strong>of</strong> benefits <strong>to</strong><br />
downstream generation<br />
12 FERC approved license exemption surrender by order dated June 28, 2002<br />
PRFP Page 49
ecause <strong>the</strong>re is little habitat <strong>of</strong> value <strong>for</strong> Atlantic salmon in <strong>the</strong> river. As <strong>the</strong><br />
res<strong>to</strong>ration <strong>of</strong> diadromous fish species o<strong>the</strong>r than <strong>for</strong> Atlantic salmon progresses,<br />
upstream passage facilities may need <strong>to</strong> be constructed at <strong>the</strong>se projects <strong>to</strong> provide<br />
passage in<strong>to</strong> suitable habitat. Finally, <strong>the</strong> West Winterport Dam does have a Denil<br />
fishway but it is currently inoperable due <strong>to</strong> wide fluctuations in headpond levels that<br />
have occurred since <strong>the</strong> project’s license exemption was surrendered and <strong>the</strong><br />
project no longer generates hydro power. It should be noted that <strong>the</strong> project’s owner<br />
is currently seeking <strong>to</strong> have <strong>the</strong> dam removed allowing <strong>the</strong> river reach affected by<br />
<strong>the</strong> dam <strong>to</strong> return <strong>to</strong> natural conditions.<br />
Table 9. Upstream and downstream fish passage facilities, Penobscot River (exclusive <strong>of</strong> <strong>the</strong> West<br />
Branch, Penobscot River).<br />
Upstream Passage Downstream Passage<br />
Project Yes (Yr. Built) No Yes (Yr. Built) No<br />
Veazie X (1970) 1 X 5<br />
Great Works X (1968) 2<br />
X 5<br />
Mil<strong>for</strong>d X (1968) 2 X 5<br />
West Enfield X (1988) 1<br />
X (1988) 6<br />
Mattaceunk X (1939) 3<br />
Orono X X (2009) 6<br />
Stillwater X X 5<br />
Howland X (1965) 2 X 5<br />
Brown’s Mill X (1973) 2 X 5<br />
Moosehead X (1973) 2 X<br />
Guil<strong>for</strong>d X 1972) 2 X<br />
Milo X X<br />
Sebec X X<br />
Lowell Tannery X (1985) 2 X (1985) 6<br />
Matagamon X (1942) 4<br />
Frank<strong>for</strong>t X (1982) 2 X<br />
West Winterport X X<br />
1 Vertical slot fishway<br />
2 Denil fishway<br />
3 Pool and weir fishway<br />
4 Submerged orifice fishway<br />
5 Hydro projects retr<strong>of</strong>itted with downstream passage facilities including guidance structures, fish behavior<br />
technologies, and project operational measures<br />
6 Dedicated downstream passage facilities constructed when hydro project was redeveloped<br />
Four <strong>of</strong> <strong>the</strong> mainstem hydro projects have been retr<strong>of</strong>itted with downstream fish<br />
passage facilities that consist <strong>of</strong> guidance structures, fish behavior technologies,<br />
and/or project operational measures used singly or in combination <strong>to</strong> guide fish<br />
around <strong>the</strong> projects (Table 9). The West Enfield Project has a dedicated<br />
downstream fish passage system that was specifically constructed at <strong>the</strong> time <strong>the</strong><br />
project was redeveloped <strong>to</strong> pass diadromous fish around <strong>the</strong> project.<br />
PRFP Page 50<br />
X 5<br />
X
On <strong>the</strong> tributaries, <strong>the</strong> downstream fish passage system at Lowell Tannery was<br />
installed at <strong>the</strong> time when <strong>the</strong> project was constructed. The downstream passage<br />
system at <strong>the</strong> Stillwater Project was a retr<strong>of</strong>it and facilities at <strong>the</strong> redeveloped Orono<br />
Project will be installed during spring 2009. On <strong>the</strong> Piscataquis River, <strong>the</strong> Brown’s<br />
Mill and Howland projects have retr<strong>of</strong>itted downstream passage facilities. The<br />
remaining hydro projects do not have downstream passage facilities.<br />
A license from FERC is required <strong>to</strong> construct, operate, and maintain a non-federal<br />
hydroelectric project (see FERC 2004 <strong>for</strong> specific requirements). License terms are<br />
granted <strong>for</strong> a period <strong>of</strong> 30 – 50 years with FERC granting 30-year license terms <strong>for</strong><br />
projects that propose little or no redevelopment, new construction, new capacity, or<br />
enhancement; 40-year terms <strong>for</strong> projects that propose moderate redevelopment,<br />
new construction, new capacity, or enhancement; and 50-year terms <strong>for</strong> projects that<br />
propose extensive redevelopment, new construction, new capacity, or enhancement.<br />
FERC typically attaches conditions (articles) <strong>to</strong> a license <strong>for</strong> <strong>the</strong> duration <strong>of</strong> <strong>the</strong><br />
license term. For example, FERC may attach an article requiring <strong>the</strong> licensee <strong>to</strong><br />
install, operate, and maintain fish passage facilities when deemed necessary by<br />
natural resource agencies.<br />
FERC may issue an exemption from licensing under certain circumstances (FERC<br />
2004). Small hydroelectric projects <strong>of</strong> 5 MW or less are eligible <strong>for</strong> a 5MW<br />
exemption. Exemptions are subject only <strong>to</strong> conditions attached <strong>to</strong> <strong>the</strong> exemption<br />
and exemptions do not expire.<br />
Unless <strong>the</strong>re are specific conditions attached <strong>to</strong> a license or exemption, it could<br />
prove burdensome <strong>to</strong> require hydro dam owners/opera<strong>to</strong>rs <strong>to</strong> install and operate<br />
upstream and downstream fish passage facilities. Some, but not all, FERC licenses<br />
contain a reopener clause allowing agencies <strong>the</strong> opportunity <strong>to</strong> reopen a license<br />
be<strong>for</strong>e license expiration providing an avenue <strong>for</strong> agencies <strong>to</strong> seek <strong>the</strong> installation,<br />
operation, and maintenance <strong>of</strong> fish passage facilities.<br />
A settlement agreement between various parties, <strong>the</strong> Lower Penobscot River<br />
Multiparty Settlement Agreement (MPA), contains several triggers, provisions, and<br />
schedules <strong>for</strong> installation and operation <strong>of</strong> fish passage facilities depending on<br />
specific courses <strong>of</strong> action as <strong>the</strong> Penobscot River <strong>Res<strong>to</strong>ration</strong> Project moves<br />
<strong>for</strong>ward.<br />
Upstream and downstream passage <strong>of</strong> Atlantic salmon at selected hydro projects<br />
has been studied over <strong>the</strong> past 20 years (Appendix I). Some studies have been<br />
specific deliverables <strong>of</strong> FERC license articles following installation <strong>of</strong> fish passage<br />
facilities (e.g. downstream passage at West Enfield) while o<strong>the</strong>r studies have been<br />
undertaken <strong>to</strong> obtain general knowledge <strong>of</strong> inriver movements <strong>for</strong> Atlantic salmon.<br />
The University <strong>of</strong> Maine and o<strong>the</strong>rs have also studied Atlantic salmon movements<br />
within <strong>the</strong> river system. Passage <strong>for</strong> o<strong>the</strong>r anadromous fish species has not been<br />
studied at all. There have been a few studies undertaken at selected hydro projects<br />
following installation <strong>of</strong> passage facilities <strong>for</strong> <strong>the</strong> catadromous eel.<br />
PRFP Page 51
The basic approach <strong>to</strong> understanding passage and connectivity issues in <strong>the</strong><br />
Penobscot River with respect <strong>to</strong> fish passage facilities (Objectives 16, 17, and 18)<br />
will be <strong>to</strong> review <strong>the</strong> FERC licenses, FERC license exemptions, <strong>the</strong> various studies<br />
undertaken in <strong>the</strong> Penobscot River, and in<strong>for</strong>mation on recent advances in fish<br />
passage technology. Once this in<strong>for</strong>mation has been scrutinized, study plans will be<br />
developed and implemented <strong>to</strong> fill in knowledge gaps and develop recommendations<br />
<strong>for</strong> additional passage studies and/or facilities as needed.<br />
Fish passage efficiency and fish passage effectiveness are terms frequently used<br />
interchangeably <strong>to</strong> describe <strong>the</strong> adequacy <strong>of</strong> fish passage facilities at hydro projects.<br />
Fish passage engineers typically regard <strong>the</strong> two as follows (Ben Rizzo, USFWS,<br />
pers. comm.): 1) Fish passage efficiency is a quantitative assessment <strong>of</strong> <strong>the</strong><br />
adequacy <strong>of</strong> a specific fish passage facility at a project. Passage efficiency studies<br />
typically require telemetry studies and results are expressed as a percentage <strong>of</strong> <strong>the</strong><br />
number <strong>of</strong> tagged fish recorded as passing <strong>the</strong> device being evaluated divided by<br />
<strong>the</strong> number <strong>of</strong> tagged fish detected and available <strong>to</strong> be passed in <strong>the</strong> immediate<br />
vicinity <strong>of</strong> <strong>the</strong> device; and 2) Passage effectiveness can be a qualitative or<br />
quantitative assessment and is a description <strong>of</strong> <strong>the</strong> relative success <strong>of</strong> fish passage<br />
at a project or a specific passage facility. For example, a hydro project could have a<br />
spillway and powerhouse tailrace channel side by side but have only a powerhouse<br />
fishway. The powerhouse fishway could have a high "passage efficiency" (passes a<br />
high number <strong>of</strong> fish present in <strong>the</strong> powerhouse tailrace), yet <strong>the</strong> project could have a<br />
low upstream "passage effectiveness" due <strong>to</strong> many fish being attracted <strong>to</strong> and<br />
becoming delayed and/or stranded in <strong>the</strong> spillway reach.<br />
Outlets at lake and pond outlets can be problematic <strong>for</strong> <strong>the</strong> emigration <strong>of</strong> clupeids<br />
and American eel if <strong>the</strong>re is not sufficient spill at <strong>the</strong> time <strong>of</strong> downstream movement.<br />
Part <strong>of</strong> Objective 18 will be <strong>to</strong> understand conditions at lake outlets at critical<br />
passage times, <strong>to</strong> develop recommendations, and institute facilities or measures as<br />
needed <strong>for</strong> alleviating impediments.<br />
Objective 19 includes periodic inspection <strong>of</strong> fish passage facilities <strong>to</strong> ensure that<br />
passage effectiveness is maintained. If a site continues <strong>to</strong> be problematic, <strong>the</strong>n<br />
consultation with <strong>the</strong> dam owner <strong>to</strong> improve <strong>the</strong> passage success would follow. At<br />
an especially problematic site, partnering with <strong>the</strong> dam owner <strong>to</strong> install a passage<br />
facility may become a necessity <strong>to</strong> meet target res<strong>to</strong>ration goals. This latter scenario<br />
may be difficult <strong>to</strong> pursue depending upon FERC license/license exemption<br />
conditions.<br />
Objective 20 seeks pathways <strong>to</strong> remedy smaller scale passage and/or connectivity<br />
impediments. Subtle instream connectivity conditions can be easily overlooked.<br />
Road-stream crossings can prove <strong>to</strong> be impassable at certain flows and at certain<br />
times <strong>of</strong> <strong>the</strong> year preventing instream movements <strong>of</strong> fish. For example, a culvert not<br />
properly embedded in<strong>to</strong> <strong>the</strong> stream may not have sufficient flow in it <strong>to</strong> allow juvenile<br />
salmon access <strong>to</strong> cool water during critical summer periods. Likewise, beaver dams<br />
PRFP Page 52
can prevent <strong>the</strong> successful downstream movement <strong>of</strong> juvenile clupeids in late<br />
summer prior <strong>to</strong> early fall rains.<br />
There have been several initiatives in <strong>the</strong> Penobscot River watershed <strong>for</strong> surveying<br />
and cataloging small barriers and road-stream crossings. The USFWS was <strong>the</strong> lead<br />
agency in surveying <strong>the</strong> Kenduskeag Stream and Piscataquis River subwatershed<br />
(USFWS 2004a, 2004b). The Maine Forest Service surveyed small barriers and<br />
road-stream crossings in <strong>the</strong> lower Penobscot River from Orson Island in <strong>the</strong><br />
mainstem Penobscot downstream <strong>to</strong> Fort Point in <strong>the</strong> Penobscot River estuary in<br />
2007 (MFS 2008) and <strong>the</strong> mid-Penobscot River tributaries (Piscataquis and<br />
Passadumkeag rivers) in 2008. Ef<strong>for</strong>ts <strong>to</strong> survey <strong>the</strong> remainder <strong>of</strong> <strong>the</strong> Penobscot<br />
River watershed is <strong>to</strong> continue as part <strong>of</strong> Objective 20.<br />
Municipalities, <strong>to</strong>wns, and private landowners need <strong>to</strong> adopt policies and design<br />
guides <strong>to</strong> implement proper road construction and repair. The Maine Department <strong>of</strong><br />
Transportation (MDOT) has developed <strong>the</strong> Waterway and Wildlife Crossing Policy<br />
and Design Guide <strong>to</strong> direct transportation planning, design, and construction while<br />
protecting aquatic and surface water resources (MDOT 2008). O<strong>the</strong>r valuable<br />
resource documents <strong>for</strong> <strong>the</strong> design, placement, construction and permitting <strong>of</strong> roads.<br />
<strong>for</strong> <strong>the</strong> repair and maintenance <strong>of</strong> existing roads, <strong>for</strong> proper best management<br />
practices <strong>for</strong> <strong>the</strong> logging industry and small woodlot owners, and <strong>for</strong> assessment <strong>of</strong><br />
fish passage needs include BMP Guidelines <strong>for</strong> Roads in Atlantic Salmon<br />
Watersheds (Project SHARE 2004), Best Management Practices <strong>for</strong> Forestry:<br />
Protecting Maine’s Water Quality (Maine Forest Service 2004), Maine Road-Stream<br />
Crossing Survey Manual (Abbott 2008), Design <strong>for</strong> Fish Passage at Roadway-<br />
Stream Crossings (Hotchkiss and Frei (2007),and Stream Simulation: An Ecological<br />
Approach <strong>to</strong> Providing Passage <strong>for</strong> Aquatic Organisms at Road-Stream Crossings<br />
(USDA Forest Service 2008)<br />
There have been numerous introductions (legal and illegal) <strong>of</strong> non-native fish<br />
species in <strong>the</strong> Penobscot River watershed with <strong>the</strong> most recent illegal introduction<br />
being nor<strong>the</strong>rn pike in Pushaw Lake. Objective 21 employs several strategies <strong>to</strong><br />
prevent fur<strong>the</strong>r range expansion <strong>of</strong> non-native fish species. One approach <strong>to</strong><br />
accomplish this goal includes <strong>the</strong> removal <strong>of</strong> undesirable fish species at fishway<br />
traps operated by MDMR. In order <strong>to</strong> achieve this strategy, a Memorandum <strong>of</strong><br />
Understanding between <strong>the</strong> fisheries agencies needs <strong>to</strong> be completed so both<br />
agencies have a clear understanding <strong>of</strong> which species are <strong>to</strong> be removed from <strong>the</strong><br />
river. Pro<strong>to</strong>cols <strong>for</strong> removing undesirable fish species also need <strong>to</strong> be developed <strong>to</strong><br />
ensure proper procedures are followed once <strong>the</strong> MOU is executed.<br />
Risk assessments <strong>for</strong> determining <strong>the</strong> potential <strong>for</strong> range expansion on non-native<br />
fish species are be undertaken <strong>to</strong> in<strong>for</strong>m <strong>the</strong> managers on how best <strong>to</strong> prevent <strong>the</strong><br />
spread <strong>of</strong> invasive fish. Currently, <strong>the</strong>re is a risk assessment group evaluating <strong>the</strong><br />
potential impacts <strong>of</strong> <strong>the</strong> spread on nor<strong>the</strong>rn pike in<strong>to</strong> <strong>the</strong> mid and upper Penobscot<br />
River watershed. Recommendations <strong>of</strong> risk assessments could lead <strong>to</strong> structural<br />
PRFP Page 53
alteration <strong>of</strong> fish passage facilities or modification <strong>of</strong> <strong>the</strong>ir operation in some manner<br />
<strong>to</strong> prevent <strong>the</strong> upstream movement <strong>of</strong> undesirable species.<br />
Goal, Objectives, and Strategies<br />
Goal: Provide safe, timely, and effective upstream and downstream passage<br />
<strong>for</strong> diadromous fishes at barriers that restrict access between <strong>the</strong>ir his<strong>to</strong>rical<br />
habitats in <strong>the</strong> Penobscot basin.<br />
16.0 Objective: Increase upstream and downstream fish passage effectiveness<br />
at fish passage facilities at mainstem dams 14 within 10 years <strong>to</strong> ensure<br />
conservation spawning escapement <strong>of</strong> target res<strong>to</strong>ration species and <strong>to</strong><br />
ensure maximum emigration <strong>of</strong> target res<strong>to</strong>ration species life stages 15 from<br />
freshwater habitats <strong>to</strong> <strong>the</strong> ocean.<br />
16.1 Measure: Improve upstream and downstream fish passage<br />
effectiveness at mainstem dams <strong>for</strong> juvenile and adult Atlantic salmon,<br />
alewife, American shad, and blueback herring within eight years.<br />
16.1.1 Strategy: Review FERC licenses and MPA<br />
16.1.2 Strategy: Review existing studies and in<strong>for</strong>mation<br />
16.1.3 Strategy: Develop/conduct assessment studies <strong>to</strong> determine<br />
fish passage effectiveness and develop recommendations <strong>for</strong><br />
fish passage improvements<br />
16.1.4 Strategy: Undertake fish passage improvements<br />
16.1.5 Strategy: Assess fish passage improvements<br />
16.2 Measure: Improve upstream and downstream fish passage<br />
effectiveness at mainstem dams <strong>for</strong> juvenile and adult American eel<br />
within 10 years <strong>of</strong> <strong>the</strong> removal <strong>of</strong> <strong>the</strong> Veazie and Great Works dams.<br />
16.2.1 Strategy: Review FERC licenses and MPA<br />
16.2.2 Strategy: Review existing studies and in<strong>for</strong>mation<br />
16.2.3 Strategy: Develop/conduct assessment studies <strong>to</strong> determine<br />
fish passage effectiveness and develop recommendations <strong>for</strong><br />
fish passage improvements<br />
16.2.4 Strategy: Undertake fish passage improvements<br />
16.2.5 Strategy: Assess fish passage improvements<br />
17.0 Objective: Increase upstream and downstream fish passage effectiveness<br />
at fish passage facilities at tributary dams 16 within 40 years <strong>to</strong> ensure<br />
conservation spawning escapement <strong>of</strong> target res<strong>to</strong>ration species and <strong>to</strong><br />
14<br />
Includes <strong>the</strong> Mil<strong>for</strong>d, West Enfield, and Mattaceunk dams on <strong>the</strong> mainstem Penobscot River and <strong>the</strong> Stillwater<br />
and Orono dams on <strong>the</strong> Stillwater Branch.<br />
15<br />
For example, Atlantic salmon smolts and kelts; juvenile and adult clupeids.<br />
16<br />
Howland, Browns Mill, Moosehead Manufacturing, Guil<strong>for</strong>d, Lowell Tannery, and Frank<strong>for</strong>t dams<br />
PRFP Page 54
ensure maximum emigration <strong>of</strong> target res<strong>to</strong>ration species life stages from<br />
freshwater habitats <strong>to</strong> <strong>the</strong> ocean.<br />
17.1 Measure: Improve upstream and downstream fish passage<br />
effectiveness at tributary dams <strong>for</strong> juvenile and adult Atlantic salmon<br />
within 10 years.<br />
17.1.1 Strategy: Review FERC licenses/exemptions and MPA<br />
17.1.2 Strategy: Review need/process <strong>to</strong> install/improve fish passage<br />
facilities at FERC non-jurisdictional dams<br />
17.1.3 Strategy: Review existing studies and in<strong>for</strong>mation<br />
17.1.4 Strategy: Develop/conduct assessment studies <strong>to</strong> determine<br />
fish passage effectiveness and develop recommendations <strong>for</strong><br />
fish passage improvements<br />
17.1.5 Strategy: Undertake fish passage improvements<br />
17.1.6 Strategy: Assess fish passage improvements<br />
17.2 Measure: Improve upstream and downstream fish passage<br />
effectiveness at <strong>the</strong> Howland and Lowell Tannery dams <strong>for</strong> juvenile<br />
and adult alewife within five years <strong>of</strong> s<strong>to</strong>cking Phase 1 lakes located<br />
above <strong>the</strong>se dams.<br />
17.2.1 Strategy: Review FERC licenses and MPA<br />
17.2.2 Strategy: Develop/conduct assessment studies <strong>to</strong> determine<br />
fish passage effectiveness and develop recommendations <strong>for</strong><br />
fish passage improvements<br />
17.2.3 Strategy: Undertake fish passage improvements<br />
17.2.4 Strategy: Assess fish passage improvements<br />
17.3 Measure: Improve upstream and downstream fish passage<br />
effectiveness at Howland <strong>for</strong> juvenile and adult American shad and<br />
blueback herring within six years <strong>of</strong> s<strong>to</strong>cking Group 1 habitat located<br />
above Howland.<br />
17.3.1 Strategy: Review FERC license and MPA<br />
17.3.2 Strategy: Develop/conduct assessment studies <strong>to</strong> determine<br />
fish passage effectiveness and develop recommendations <strong>for</strong><br />
fish passage improvements<br />
17.3.3 Strategy: Undertake fish passage improvements<br />
17.3.4 Strategy: Assess fish passage improvements<br />
17.4 Measure: Improve upstream and downstream fish passage<br />
effectiveness <strong>for</strong> juvenile and adult alewife, American shad, and<br />
blueback herring at remaining tributary dams within 40 years.<br />
17.4.1 Strategy: Review FERC licenses/exemptions<br />
17.4.2 Strategy: Review need/process <strong>to</strong> install/improve fish passage<br />
facilities at FERC non-jurisdictional dams<br />
PRFP Page 55
17.4.3 Strategy: Develop/conduct assessment studies <strong>to</strong> determine<br />
fish passage effectiveness and develop recommendations <strong>for</strong><br />
fish passage improvements<br />
17.4.4 Strategy: Undertake fish passage improvements<br />
17.4.5 Strategy: Assess fish passage improvements<br />
17.5 Measure: Improve upstream and downstream fish passage<br />
effectiveness <strong>for</strong> juvenile and adult American eel at Howland within 10<br />
years<br />
17.5.1 Strategy: Review FERC license and MPA<br />
17.5.2 Strategy: Review existing studies and in<strong>for</strong>mation<br />
17.5.3 Strategy: Develop/conduct assessment studies <strong>to</strong> determine<br />
fish passage effectiveness and develop recommendations <strong>for</strong><br />
fish passage improvements<br />
17.5.4 Strategy: Undertake fish passage improvements<br />
17.5.5 Strategy: Assess fish passage improvements<br />
17.6 Measure: Improve upstream and downstream fish passage<br />
effectiveness <strong>for</strong> juvenile and adult American eel at remaining tributary<br />
dams within 30 years.<br />
17.6.1 Strategy: Review FERC license exemptions<br />
17.6.2 Strategy: Review need/process <strong>to</strong> install/improve fish passage<br />
facilities at FERC non-jurisdictional dams<br />
17.6.3 Strategy: Review existing studies and in<strong>for</strong>mation<br />
17.6.4 Strategy: Use annual boat electr<strong>of</strong>ishing survey results <strong>to</strong><br />
determine fish passage requirements and installation timeline at<br />
remaining tributary dams<br />
17.6.5 Strategy: Develop/conduct assessment studies <strong>to</strong> determine<br />
fish passage effectiveness and develop recommendations <strong>for</strong><br />
fish passage improvements<br />
17.6.6 Strategy: Undertake fish passage improvements<br />
17.6.7 Strategy: Assess fish passage improvements<br />
18.0 Objective: Increase upstream and downstream fish passage effectiveness<br />
at FERC non-jurisdictional dams within 20 years and lake and pond outlets<br />
within 50 years <strong>to</strong> ensure conservation spawning escapement <strong>of</strong> target<br />
res<strong>to</strong>ration species and <strong>to</strong> ensure maximum emigration <strong>of</strong> target res<strong>to</strong>ration<br />
species life stages from freshwater habitats <strong>to</strong> <strong>the</strong> ocean.<br />
18.1 Measure: Improve upstream and downstream fish passage<br />
effectiveness <strong>for</strong> Atlantic salmon at Grand Lake Matagamon within 20<br />
years.<br />
18.1.1 Strategy: Review need/process <strong>to</strong> install/improve fish passage<br />
facilities at Grand Lake Matagamon Dam<br />
PRFP Page 56
18.1.2 Strategy: Develop/conduct assessment studies <strong>to</strong> determine<br />
fish passage effectiveness and develop recommendations <strong>for</strong><br />
fish passage improvements<br />
18.1.3 Strategy: Undertake fish passage improvements<br />
18.1.4 Strategy: Assess fish passage improvements<br />
18.2 Measure: Improve upstream and downstream fish passage<br />
effectiveness <strong>for</strong> alewife and American eels at lake and pond outlets<br />
within 50 years.<br />
18.2.1 Strategy: Review need/process <strong>to</strong> install/improve fish passage<br />
facilities at lake and pond outlets<br />
18.2.2 Strategy: Develop/conduct assessment studies <strong>to</strong> determine<br />
fish passage effectiveness and develop recommendations <strong>for</strong><br />
fish passage improvements<br />
18.2.3 Strategy: Undertake fish passage improvements<br />
18.2.4 Strategy: Assess fish passage improvements<br />
19.0 Objective: Ensure proper operation <strong>of</strong> upstream and downstream fish<br />
passage facilities throughout <strong>the</strong> fish passage season (annually).<br />
19.1 Measure: Annually moni<strong>to</strong>r upstream and downstream fish passage<br />
facilities operation <strong>to</strong> ensure <strong>the</strong> facilities are per<strong>for</strong>ming effectively.<br />
19.1.1 Strategy: Establish upstream and downstream fish passage<br />
facility operating pro<strong>to</strong>cols<br />
19.1.2 Strategy: Periodically inspect fish passage facilities during <strong>the</strong><br />
fish passage season<br />
19.1.3 Strategy: Consult with owners <strong>of</strong> fish passage facilities<br />
regarding fish passage issues<br />
19.1.4 Strategy: Consult and/or partner with owners <strong>of</strong> fish passage<br />
facilities <strong>to</strong> improve effectiveness <strong>of</strong> fish passage facilities<br />
and/or fish passage measures.<br />
19.1.5 Strategy: Consult and/or partner with dam owners <strong>to</strong> install fish<br />
passage facilities at problematic passage sites.<br />
19.1.6 Strategy: Develop fish handling and trap operating pro<strong>to</strong>cols <strong>for</strong><br />
<strong>the</strong> Mil<strong>for</strong>d Dam fish lift<br />
20.0 Objective: Increase stream connectivity at non-hydro dams, small barriers,<br />
culverts, hydraulic and physiological blocks, etc. within 50 years <strong>to</strong> ensure<br />
conservation spawning escapement and maximum emigration <strong>of</strong> target<br />
res<strong>to</strong>ration species life stages, and <strong>to</strong> promote unimpeded instream<br />
movements <strong>of</strong> target res<strong>to</strong>ration species life stages.<br />
20.1 Measure: Ensure that stream connectivity limitations are prevented or<br />
remediated.<br />
PRFP Page 57
20.1.1 Strategy: Moni<strong>to</strong>r stream connectivity <strong>to</strong> ensure effective<br />
upstream and downstream fish passage and instream<br />
movements.<br />
20.1.2 Strategy: Consult with <strong>the</strong> Maine Department <strong>of</strong> Transportation<br />
(MDOT), cities and <strong>to</strong>wns, and private landowners <strong>to</strong> ensure<br />
implementation <strong>of</strong> MDOT’s Waterway and Wildlife Crossing<br />
Policy and Design Guide at road crossings slated <strong>for</strong><br />
replacement.<br />
20.1.3 Strategy: Identify road crossings and small barriers and<br />
prioritize passage needs by site and species.<br />
20.1.4 Strategy: Obtain funding <strong>to</strong> replace or remove problematic road<br />
crossing structures and remove critical barriers<br />
20.1.5 Strategy: Coordinate with o<strong>the</strong>r state and federal agencies and<br />
NGOs <strong>to</strong> use a standard pro<strong>to</strong>col and tracking database<br />
20.1.6 Strategy: Encourage creation and funding <strong>of</strong> a Barrier Removal<br />
Program in <strong>the</strong> State <strong>of</strong> Maine.<br />
20.1.7 Strategy: Collaborate with resource agencies, lake associations,<br />
NGOs, etc. <strong>to</strong> resolve fish passage issues.<br />
20.1.8 Strategy: Research and implement alternative methods <strong>for</strong><br />
habitat access.<br />
20.1.9 Strategy: Undertake with o<strong>the</strong>r resource agencies risk<br />
assessments <strong>of</strong> range expansion <strong>for</strong> undesirable fish species<br />
20.2 Measure: Improve stream connectivity limitations <strong>for</strong> juvenile and adult<br />
Atlantic salmon within 10 years.<br />
20.2.1 Strategy: Complete ongoing Penobscot watershed road<br />
crossing and small barrier survey<br />
20.2.2 Strategy: Determine stream connectivity limitations <strong>for</strong> juvenile<br />
and adult Atlantic salmon<br />
20.2.3 Strategy: Undertake stream connectivity improvements <strong>for</strong><br />
Atlantic salmon<br />
20.3 Measure: Improve stream connectivity limitations <strong>for</strong> juvenile and adult<br />
alewife and American eel within 50 years<br />
20.3.1 Strategy: Determine stream connectivity limitations juvenile and<br />
adult alewife and American eel<br />
20.3.2 Strategy: Undertake stream connectivity improvements <strong>for</strong><br />
alewife and American eel<br />
21.0 Objective: Restrict upstream passage <strong>of</strong> undesirable fish species at fish<br />
passage facilities.<br />
21.1 Measure: Develop agreements with resource agencies and fish<br />
passage facility opera<strong>to</strong>rs <strong>to</strong> remove or prevent upstream movements<br />
<strong>of</strong> non-native and undesirable fish species at fish passage facilities<br />
within three years.<br />
PRFP Page 58
21.1.1 Strategy: Develop a Memorandum <strong>of</strong> Understanding (MOU)<br />
with <strong>the</strong> Maine Department <strong>of</strong> Inland Fisheries and Wildlife<br />
(MDIFW) <strong>for</strong> selectively removing non-native and undesirable<br />
fish species at <strong>the</strong> Veazie fishway trap and o<strong>the</strong>r fish passage<br />
facility trapping locations (e.g. Mattaceunk Dam) prior <strong>to</strong> <strong>the</strong><br />
removal <strong>of</strong> Veazie and Great Works dams and installation <strong>of</strong> <strong>the</strong><br />
Howland bypass.<br />
21.1.2 Strategy: Develop a Memorandum <strong>of</strong> Understanding (MOU)<br />
with <strong>the</strong> Maine Department <strong>of</strong> Inland Fisheries and Wildlife<br />
(MDIFW) <strong>for</strong> selectively removing non-native and undesirable<br />
fish species at <strong>the</strong> Mil<strong>for</strong>d fish lift fish sorting facility (post Veazie<br />
and Great Works dam removal)<br />
21.1.3 Strategy: Establish list, pro<strong>to</strong>cols, and measures <strong>for</strong> removing or<br />
allowing passage <strong>of</strong> non-native and undesirable fish species at<br />
fishway trapping locations<br />
21.1.4 Strategy: Undertake with o<strong>the</strong>r resource agencies risk<br />
assessments <strong>of</strong> range expansion <strong>for</strong> undesirable fish species<br />
21.1.5 Strategy: Develop Memorandum <strong>of</strong> Understandings with<br />
resource agencies and fish passage facility opera<strong>to</strong>rs <strong>to</strong> prevent<br />
upstream movements <strong>of</strong> non-native/undesirable fish species at<br />
fish passage facilities<br />
21.2 Measure: Modify fish passage facilities <strong>to</strong> prevent upstream movement<br />
<strong>of</strong> undesirable fish species<br />
21.2.1 Strategy: Assess with o<strong>the</strong>r resource agencies physical and/or<br />
temporal modifications <strong>to</strong> fish passage facility operations that<br />
may selectively restrict passage <strong>of</strong> undesirable fish species prior<br />
<strong>to</strong> <strong>the</strong> removal <strong>of</strong> Veazie and Great Works and installation <strong>of</strong> <strong>the</strong><br />
Howland bypass.<br />
21.2.2 Strategy: Obtain funding <strong>to</strong> structurally modify fish passage<br />
facilities<br />
Work <strong>Plan</strong> Table<br />
The budget includes funding <strong>for</strong> two full-time Biologists, two full time Biology<br />
Specialists and two seasonal Conservation Aides. Budget is estimated <strong>for</strong> 2010-<br />
2014.<br />
No. Action Timeline Responsibility Budget<br />
16.1.1<br />
16.1.2<br />
Review FERC licenses and Lower<br />
Penobscot River Multiparty<br />
Settlement Agreement (MPA) <strong>for</strong><br />
specific fish passage deliverables April-10 MDMR $7,710<br />
Review existing fish passage studies<br />
and migration/ movement studies <strong>for</strong><br />
adult and juvenile Atlantic salmon April-10 MDMR $7,710<br />
PRFP Page 59
16.1.3<br />
16.1.4<br />
16.1.5<br />
16.2.1<br />
16.2.2<br />
16.2.3<br />
16.2.4<br />
16.2.5<br />
17.1.1<br />
17.1.2<br />
17.1.3<br />
17.1.4<br />
17.1.5<br />
Develop assessment study plans,<br />
conduct fish passage efficiency<br />
studies, and develop<br />
recommendations <strong>for</strong> fish passage<br />
improvements Dec. 2018<br />
Complete fish passage<br />
improvements based on passage<br />
efficiency studies Dec. 2020<br />
MDMR, USFWS,<br />
NOAA, Hydro<br />
Opera<strong>to</strong>rs $185,040<br />
Hydro Opera<strong>to</strong>rs,<br />
USFWS, NOAA,<br />
MDMR $15,420<br />
Assess fish passage facility<br />
MDMR, USFWS,<br />
NOAA, Hydro<br />
improvements<br />
Review FERC licenses and Lower<br />
Penobscot River Multiparty<br />
Dec. 2023 Opera<strong>to</strong>rs $185,040<br />
Settlement Agreement <strong>for</strong> specific<br />
Included in<br />
fish passage deliverables<br />
Review existing fish passage studies<br />
<strong>for</strong> juvenile and adult American eel<br />
undertaken within <strong>the</strong> Penobscot<br />
April-10 MDMR<br />
16.1.1<br />
River watershed<br />
Develop assessment study plans,<br />
April-10 MDMR $1,950<br />
conduct fish passage efficiency<br />
studies, and develop<br />
MDMR, USFWS,<br />
recommendations <strong>for</strong> fish passage<br />
NOAA, Hydro<br />
improvements<br />
April-22 Opera<strong>to</strong>rs $92,520<br />
Complete fish passage facility<br />
improvements based on passage<br />
efficiency studies Dec. 2024<br />
Assess fish passage facility<br />
improvements Dec. 2027<br />
Review FERC licenses, FERC<br />
license exemptions, and Lower<br />
Penobscot River Multiparty<br />
Settlement Agreement <strong>for</strong> specific<br />
fish passage deliverables April-10 MDMR<br />
Hydro Opera<strong>to</strong>rs,<br />
USFWS, NOAA,<br />
MDMR $15,420<br />
MDMR, USFWS,<br />
NOAA, Hydro<br />
Opera<strong>to</strong>rs $92,520<br />
Included in<br />
16.1.1<br />
Review need and process <strong>to</strong><br />
increase upstream and downstream<br />
fish passage efficiency at FERC nonjurisdictional<br />
dams located on<br />
tributaries April-10 MDMR $1,950<br />
Review existing fish passage studies<br />
and migration/ movement studies <strong>for</strong><br />
adult and juvenile Atlantic salmon April-10 MDMR<br />
Develop assessment study plans,<br />
conduct fish passage efficiency<br />
studies, and develop<br />
recommendations <strong>for</strong> fish passage<br />
improvements December-20<br />
Complete fish passage<br />
improvements based on passage<br />
efficiency studies Dec. 2022<br />
Included in<br />
16.1.2<br />
MDMR, USFWS,<br />
NOAA, Hydro<br />
Opera<strong>to</strong>rs, Dam<br />
Owners $185,040<br />
Hydro Opera<strong>to</strong>rs,<br />
Dam Owners,<br />
USFWS, NOAA,<br />
MDMR $15,420<br />
PRFP Page 60
17.1.6<br />
17.2.1<br />
17.2.2<br />
17.2.3<br />
17.2.4<br />
17.3.1<br />
17.3.2<br />
17.3.3<br />
17.3.4<br />
17.4.1<br />
17.4.2<br />
Assess fish passage facility<br />
MDMR, USFWS,<br />
NOAA, Hydro<br />
Opera<strong>to</strong>rs, Dam<br />
improvements<br />
Review FERC licenses and Lower<br />
Penobscot River Multiparty<br />
Settlement Agreement (MPA) <strong>for</strong><br />
Dec. 2025 Owners $185,040<br />
specific fish passage deliverables at<br />
Included in<br />
Howland and Lowell Tannery<br />
Develop assessment study plans,<br />
conduct fish passage efficiency<br />
April-10 MDMR<br />
16.1.1<br />
studies, and develop<br />
MDMR, USFWS,<br />
recommendations <strong>for</strong> fish passage<br />
NOAA, Hydro<br />
improvements at Howland and<br />
Opera<strong>to</strong>rs, Dam<br />
Lowell Tannery December-20 Owners $46,260<br />
Complete fish passage<br />
improvements based on passage<br />
efficiency studies at Howland and<br />
Lowell Tannery Dec. 2022<br />
Assess fish passage facility<br />
improvements at Howland and<br />
Lowell Tannery Dec. 2025<br />
Review FERC license and Lower<br />
Penobscot River Multiparty<br />
Settlement Agreement (MPA) <strong>for</strong><br />
specific fish passage deliverables at<br />
Howland April-10 MDMR<br />
Develop assessment study plans,<br />
conduct fish passage efficiency<br />
studies, and develop<br />
recommendations <strong>for</strong> fish passage<br />
improvements December-20<br />
Complete fish passage<br />
improvements based on passage<br />
efficiency studies December-22<br />
Hydro Opera<strong>to</strong>rs,<br />
Dam Owners,<br />
USFWS, NOAA,<br />
MDMR $7,710<br />
MDMR, USFWS,<br />
NOAA, Hydro<br />
Opera<strong>to</strong>rs, Dam<br />
Owners $46,260<br />
Included in<br />
16.1.1<br />
MDMR, USFWS,<br />
NOAA, Hydro<br />
Opera<strong>to</strong>r, Dam<br />
Owner $7,710<br />
Hydro Opera<strong>to</strong>r,<br />
Dam Owner,<br />
USFWS, NOAA,<br />
MDMR $3,855<br />
Assess fish passage facility<br />
MDMR, USFWS,<br />
NOAA, Hydro<br />
Opera<strong>to</strong>r, Dam<br />
improvements<br />
Review FERC licenses and FERC<br />
license exemptions <strong>for</strong> specific fish<br />
December-25 Owner $7,710<br />
passage deliverables at remaining<br />
Included in<br />
tributary dams<br />
Review need and process <strong>to</strong><br />
increase upstream and downstream<br />
April-10 MDMR<br />
16.1.1<br />
fish passage efficiency at FERC non-<br />
Included in<br />
jurisdictional dams April-10 MDMR<br />
17.1.2<br />
PRFP Page 61
17.4.3<br />
17.4.4<br />
17.4.5<br />
17.5.1<br />
17.5.2<br />
17.5.3<br />
17.5.4<br />
17.5.5<br />
17.6.1<br />
17.6.2<br />
17.6.3<br />
17.6.4<br />
Develop assessment study plans,<br />
conduct fish passage efficiency<br />
studies, and develop<br />
recommendations <strong>for</strong> fish passage<br />
improvements at remaining tributary<br />
dams December-45<br />
Complete fish passage<br />
improvements based on passage<br />
efficiency studies December-47<br />
MDMR, USFWS,<br />
NOAA, Hydro<br />
Opera<strong>to</strong>rs, Dam<br />
Owners $185,040<br />
Hydro Opera<strong>to</strong>rs,<br />
Dam Owners,<br />
USFWS, NOAA,<br />
MDMR $15,420<br />
Assess fish passage facility<br />
MDMR, USFWS,<br />
NOAA, Hydro<br />
Opera<strong>to</strong>r, Dam<br />
improvements<br />
Review FERC license and Lower<br />
Penobscot River Multiparty<br />
Settlement Agreement (MPA) <strong>for</strong><br />
December-50 Owner $185,040<br />
specific fish passage deliverables at<br />
Included in<br />
Howland<br />
Review existing fish passage studies<br />
<strong>for</strong> juvenile and adult American eel<br />
April-10 MDMR<br />
16.1.1<br />
undertaken within <strong>the</strong> Penobscot<br />
Included in<br />
River watershed<br />
Develop assessment study plans,<br />
April-10 MDMR<br />
16.2.2<br />
conduct fish passage efficiency<br />
MDMR, USFWS,<br />
studies, and develop<br />
NOAA, Hydro<br />
recommendations <strong>for</strong> fish passage<br />
Opera<strong>to</strong>r, Dam<br />
improvements at Howland December-15 Owner $7,710<br />
Complete fish passage<br />
improvements based on passage<br />
efficiency studies December-17<br />
Hydro Opera<strong>to</strong>r,<br />
Dam Owner,<br />
USFWS, NOAA,<br />
MDMR $3,855<br />
Assess fish passage facility<br />
MDMR, USFWS,<br />
NOAA, Hydro<br />
Opera<strong>to</strong>r, Dam<br />
improvements<br />
Review FERC licenses and FERC<br />
license exemptions <strong>for</strong> specific fish<br />
December-20 Owner $7,710<br />
passage deliverables at remaining<br />
Included in<br />
tributary dams<br />
Review need and process <strong>to</strong><br />
increase upstream and downstream<br />
April-10 MDMR<br />
16.1.1<br />
fish passage efficiency at FERC non-<br />
Included in<br />
jurisdictional dams<br />
Review existing fish passage studies<br />
<strong>for</strong> juvenile and adult American eel<br />
April-10 MDMR<br />
17.1.2<br />
undertaken within <strong>the</strong> Penobscot<br />
Included in<br />
River watershed April-10 MDMR<br />
16.2.2<br />
Utilize annual boat electr<strong>of</strong>ishing<br />
surveys <strong>to</strong> determine requirement<br />
and assessment timeline <strong>for</strong> fish<br />
passage facilities at remaining Annually<br />
MDMR, MDIFW,<br />
USFWS, NOAA $2,500,000<br />
PRFP Page 62
17.6.5<br />
17.6.6<br />
17.6.7<br />
18.1.1<br />
18.1.2<br />
18.1.3<br />
18.1.4<br />
18.2.1<br />
18.2.2<br />
18.2.3<br />
18.2.4<br />
tributary dams<br />
Develop assessment study plans,<br />
conduct fish passage efficiency<br />
studies, and develop<br />
recommendations <strong>for</strong> fish passage<br />
improvements at remaining tributary<br />
dams December-35<br />
Complete fish passage<br />
improvements based on passage<br />
efficiency studies December-37<br />
MDMR, USFWS,<br />
NOAA, Hydro<br />
Opera<strong>to</strong>r, Dam<br />
Owner $92,520<br />
Hydro Opera<strong>to</strong>rs,<br />
Dam Owners,<br />
USFWS, NOAA,<br />
MDMR $15,420<br />
Assess fish passage facility<br />
MDMR, USFWS,<br />
NOAA, Hydro<br />
Opera<strong>to</strong>r, Dam<br />
improvements<br />
Review need and process <strong>to</strong><br />
increase upstream and downstream<br />
fish passage efficiency at FERC non-<br />
December-40 Owner $92,520<br />
jurisdictional dams at lake and pond<br />
Included in<br />
outlets<br />
Develop assessment study plans,<br />
conduct fish passage efficiency<br />
studies, and develop<br />
April-10 MDMR<br />
17.1.2<br />
recommendations <strong>for</strong> upstream and<br />
MDMR, USFWS,<br />
downstream fish passage at <strong>the</strong><br />
NOAA, Dam<br />
Grand Lake Matagamon Dam December-25 Owner $15,420<br />
Complete fish passage<br />
improvements based on passage<br />
efficiency studies December-27<br />
Assess fish passage facility<br />
improvements at Grand Lake<br />
Matagamon December-30<br />
Review need and process <strong>to</strong><br />
increase upstream and downstream<br />
fish passage efficiency at lake and<br />
pond outlets April-10 MDMR<br />
Develop assessment study plans,<br />
conduct fish passage efficiency<br />
studies, and develop<br />
recommendations <strong>for</strong> upstream and<br />
downstream fish passage at lake and<br />
pond outlets December-55<br />
Complete fish passage<br />
improvements based on passage<br />
efficiency studies December-57<br />
Assess fish passage facility<br />
improvements at lake and pond<br />
outlets December-60<br />
Dam Owner,<br />
USFWS, NOAA<br />
MDMR $7,710<br />
MDMR, USFWS,<br />
NOAA, Dam<br />
Owner $15,420<br />
Included in<br />
17.1.2<br />
MDMR, USFWS,<br />
NOAA, Dam<br />
Owners $92,520<br />
Dam Owners,<br />
USFWS, NOAA,<br />
MDMR $30,840<br />
MDMR, USFWS,<br />
NOAA, Dam<br />
Owners $92,520<br />
PRFP Page 63
19.1.1<br />
19.1.2<br />
19.1.3<br />
19.1.4<br />
19.1.5<br />
19.1.6<br />
20.1.1<br />
20.1.2<br />
20.1.3<br />
20.1.4<br />
20.1.5<br />
Review need <strong>to</strong> establish upstream<br />
and downstream fish passage facility<br />
operating pro<strong>to</strong>cols <strong>to</strong> ensure proper<br />
operation <strong>of</strong> upstream and<br />
downstream fish passage facilities April-10 MDMR $3,855<br />
Periodically inspect upstream and<br />
downstream fish passage facilities <strong>to</strong><br />
ensure proper operation<br />
Consult with owners <strong>of</strong> fish passage<br />
facilities regarding fish passage<br />
issues As needed<br />
Consult and/or partner with owners<br />
<strong>of</strong> fish passage facilities <strong>to</strong> improve<br />
effectiveness <strong>of</strong> fish passage<br />
facilities and/or fish passage<br />
measures As needed<br />
Consult and/or partner with dam<br />
owners <strong>to</strong> install fish passage<br />
facilities at problematic passage sites As needed<br />
Develop fish handling and trap<br />
operating pro<strong>to</strong>cols <strong>for</strong> <strong>the</strong> Mil<strong>for</strong>d<br />
Dam fish lift April-10<br />
Moni<strong>to</strong>r stream connectivity <strong>to</strong><br />
ensure effective upstream and<br />
downstream fish passage and<br />
instream movements Annually<br />
Ensure implementation <strong>of</strong> <strong>the</strong> Maine<br />
Department <strong>of</strong> Transportation’s<br />
Waterway and Wildlife Crossing<br />
Policy and Design Guide<br />
Weekly during<br />
migration window MDMR, MDIFW $925,060<br />
Interagency<br />
Meetings<br />
Identify road crossings and small<br />
barriers and prioritize passage needs<br />
by site and fish species December-14<br />
Obtain funding <strong>to</strong> replace or remove<br />
problematic road crossing structures<br />
and <strong>to</strong> remove critical barriers Annually<br />
Coordinate with o<strong>the</strong>r state and<br />
federal agencies and NGOs <strong>to</strong> use a<br />
standard pro<strong>to</strong>col and tracking<br />
database Annually<br />
MDMR, MDIFW,<br />
USFWS, NOAA,<br />
Hydro Opera<strong>to</strong>rs,<br />
Dam Owners $115,630<br />
MDMR, MDIFW,<br />
USFWS, NOAA,<br />
Hydro Opera<strong>to</strong>r,<br />
Dam Owner $115,630<br />
MDMR, MDIFW,<br />
USFWS, NOAA,<br />
Hydro Opera<strong>to</strong>r,<br />
Dam Owner $115,630<br />
MDMR, MDIFW,<br />
USFWS, NOAA,<br />
PPL $15,420<br />
MDMR, MDIFW,<br />
MDEP, LURC,<br />
MFS, MDOT,<br />
USFWS, NOAA $115,630<br />
MDMR, MDOT,<br />
Cities, Towns,<br />
Land Owners $115,630<br />
MDMR, MFS,<br />
MDOT, MDIFW,<br />
USFWS, NOAA,<br />
Barrier Owners,<br />
Land Owners $115,630<br />
MDMR, MFS,<br />
MDOT, USFWS,<br />
NOAA, Barrier<br />
Owners, Land<br />
Owners $231,260<br />
MDMR, MFS,<br />
MDOT, SPO,<br />
MDIFW, MDEP,<br />
LURC, USFWS,<br />
NOAA $96,360<br />
PRFP Page 64
20.1.6<br />
20.1.7<br />
20.1.8<br />
20.1.9<br />
20.2.1<br />
20.2.2<br />
20.2.3<br />
20.3.1<br />
20.3.2<br />
21.1.1<br />
Encourage creation and funding <strong>of</strong> a<br />
barrier removal program in <strong>the</strong> State<br />
<strong>of</strong> Maine April-11<br />
Collaborate with regula<strong>to</strong>ry and<br />
resource agencies, lake<br />
associations, NGOs, etc. <strong>to</strong> resolve<br />
fish passage issues Annually<br />
Research and implement alternative<br />
methods <strong>for</strong> habitat access Annually<br />
Undertake with o<strong>the</strong>r resource<br />
agencies risk assessments <strong>of</strong> range<br />
expansion <strong>for</strong> non-native/undesirable<br />
fish species due <strong>to</strong> increased stream<br />
connectivity As needed<br />
Complete ongoing ef<strong>for</strong>ts <strong>to</strong><br />
catalogue Penobscot River<br />
watershed road crossings and small<br />
barriers December-14<br />
Determine stream connectivity<br />
limitations <strong>for</strong> juvenile and adult<br />
Atlantic salmon April-12<br />
Undertake stream connectivity<br />
improvements <strong>for</strong> Atlantic salmon December-20<br />
Determine stream connectivity<br />
limitations <strong>for</strong> juvenile and adult<br />
alewife and American eel April-35<br />
Undertake stream connectivity<br />
improvements <strong>for</strong> juvenile and adult<br />
alewife and American eel December-60<br />
Develop a Memorandum <strong>of</strong><br />
Understanding (MOU) with MDIFW<br />
<strong>for</strong> selectively removing nonnative/undesirable<br />
fish species at<br />
fishway passage trapping locations<br />
prior <strong>to</strong> removal <strong>of</strong> <strong>the</strong> Veazie and<br />
Great Works dams April-10<br />
MDMR, MFS,<br />
MDOT, SPO,<br />
MDIFW, MDEP,<br />
LURC, USFWS,<br />
NOAA $15,420<br />
MDMR, MFS,<br />
MDOT, MDIFW,<br />
MDEP, LURC,<br />
USFWS, NOAA,<br />
Barrier Owners,<br />
Land Owners,<br />
NGOs $96,360<br />
MDMR, MDIFW,<br />
USFWS, NOAA<br />
Barrier Owners,<br />
Land Owners,<br />
NGOs $48,180<br />
MDMR, MDIFW,<br />
USFWS, NOAA<br />
See Task<br />
23.1.2 and<br />
23.1.3<br />
MDMR, MDIFW,<br />
MFS, MDOT,<br />
USFWS, NOAA,<br />
Barrier Owners,<br />
Land Owners $15,420<br />
MDMR, USFWS,<br />
NOAA $15,420<br />
Barrier Owners,<br />
Land Owners,<br />
MDMR, MDOT,<br />
USFWS, NOAA $61,680<br />
MDMR, MDOT,<br />
USFWS, NOAA,<br />
Barrier Owners,<br />
Land Owners $15,420<br />
MDMR, MDOT,<br />
USFWS, NOAA,<br />
Barrier Owners,<br />
Land Owners $30,840<br />
MDMR, MDIFW.<br />
USFWS, NOAA $15,420<br />
PRFP Page 65
21.1.2<br />
21.1.3<br />
21.1.4<br />
21.1.5<br />
21.2.1<br />
21.2.2<br />
Develop a Memorandum <strong>of</strong><br />
Understanding (MOU) with MDIFW<br />
<strong>for</strong> selectively removing nonnative/undesirable<br />
fish species at <strong>the</strong><br />
Mil<strong>for</strong>d fish lift sorting facility April-11<br />
Establish list <strong>of</strong> nonnative/undesirable<br />
fish species and<br />
pro<strong>to</strong>cols <strong>for</strong> removing or allowing<br />
passage at fish passage facility<br />
trapping locations April-10<br />
Undertake with o<strong>the</strong>r resource<br />
agencies risk assessments <strong>of</strong> range<br />
expansion <strong>for</strong> non-native/undesirable<br />
fish species at fish passage facilities As needed<br />
Develop Memorandum <strong>of</strong><br />
Understandings with resource<br />
agencies and fish passage facility<br />
opera<strong>to</strong>rs <strong>to</strong> prevent upstream<br />
movements <strong>of</strong> nonnative/undesirable<br />
fish species at fish<br />
passage facilities As needed<br />
Assess with o<strong>the</strong>r resource agencies<br />
<strong>the</strong> need <strong>for</strong> physical and/or temporal<br />
modifications <strong>to</strong> fish passage<br />
facilities As needed<br />
Obtain funding <strong>to</strong> trap or<br />
seasonally/permanently modify fish<br />
passage facilities <strong>to</strong> prevent<br />
upstream movement <strong>of</strong> nonnative/undesirable<br />
fish species As needed<br />
Work <strong>Plan</strong> Narratives<br />
MDMR, MDIFW.<br />
USFWS, NOAA $15,420<br />
MDMR, MDIFW.<br />
USFWS, NOAA $15,420<br />
MDMR, MDIFW,<br />
USFWS, NOAA<br />
See Task<br />
23.1.2 and<br />
23.1.3<br />
MDMR, MDIFW,<br />
USFWS, NOAA,<br />
Hydro Opera<strong>to</strong>rs,<br />
Dam Owners $61,680<br />
MDMR, MDIFW,<br />
USFWS, NOAA,<br />
Hydro Opera<strong>to</strong>rs,<br />
Dam Owners<br />
Tasks<br />
23.1.1.1,<br />
23.1.1.3 and<br />
23.1.1.3<br />
MDMR, MDIFW,<br />
USFWS, NOAA,<br />
Hydro Opera<strong>to</strong>rs,<br />
Dam Owners $30,840<br />
16.1.1 Review FERC Licenses and Lower Penobscot River Multiparty<br />
Settlement Agreement (MPA) <strong>for</strong> Specific Fish Passage Deliverables <strong>for</strong><br />
Atlantic Salmon, Alewife, American Shad, and Blueback Herring<br />
Hydro licenses issued <strong>for</strong> <strong>the</strong> mainstem Penobscot River dams need review <strong>to</strong><br />
determine what articles, if any, were included by FERC that address fish passage.<br />
Similarly, <strong>the</strong> Lower Penobscot River Multiparty Settlement Agreement (MPA)<br />
contains specific language on fish passage provisions that could affect timelines<br />
listed in <strong>the</strong> work plan. Additionally, <strong>the</strong> MPA spells out specific fish passage<br />
strategies depending on whe<strong>the</strong>r <strong>the</strong> Veazie and Great Works dams are removed<br />
and <strong>the</strong> Howland Dam is bypassed as well as <strong>to</strong> which entity would be responsible<br />
<strong>for</strong> funding, installing, and operating <strong>the</strong> fish passage facilities.<br />
16.1.2 Review Existing Fish Passage Studies and Migration/Movement Studies<br />
Undertaken within <strong>the</strong> Penobscot River Watershed<br />
PRFP Page 66
Over <strong>the</strong> past 20 years, <strong>the</strong>re have been several studies undertaken by hydro dam<br />
opera<strong>to</strong>rs, University <strong>of</strong> Maine graduate students, <strong>the</strong> Maine Atlantic Salmon<br />
Commission, and o<strong>the</strong>rs attempting <strong>to</strong> determine <strong>the</strong> efficiency <strong>of</strong> fish passage<br />
facilities <strong>for</strong> juvenile and adult Atlantic salmon and <strong>to</strong> understand inriver movements<br />
<strong>of</strong> adult and juvenile Atlantic salmon. Passage at mainstem dams and inriver<br />
movements/migrations <strong>for</strong> o<strong>the</strong>r anadromous fish species have not been studied in<br />
<strong>the</strong> Penobscot River. There is a need <strong>to</strong> syn<strong>the</strong>size <strong>the</strong> Atlantic salmon in<strong>for</strong>mation<br />
<strong>to</strong> provide <strong>for</strong> baseline conditions and <strong>to</strong> in<strong>for</strong>m future passage studies <strong>for</strong> Atlantic<br />
salmon.<br />
16.1.3 Develop Assessment Study <strong>Plan</strong>s, Conduct Fish Passage Efficiency<br />
Studies, and Develop Recommendations <strong>for</strong> Fish Passage Improvements <strong>for</strong><br />
Juvenile and Adult Atlantic Salmon, Alewife, American Shad, and Blueback<br />
Herring at Mainstem Dams<br />
Not all existing fish passage facilities and/or operational measures (e.g. cycling<br />
turbines, opening sluice gates, temporary shutdown <strong>of</strong> generation) have been<br />
assessed <strong>for</strong> <strong>the</strong> passage <strong>of</strong> juvenile and adult Atlantic salmon and none <strong>of</strong> <strong>the</strong><br />
existing fish passage facilities have been assessed <strong>for</strong> <strong>the</strong> passage <strong>of</strong> juvenile and<br />
adult alewife, American shad, and blueback herring. Studies <strong>of</strong> existing fish<br />
passage facilities will need <strong>to</strong> be undertaken <strong>to</strong> fur<strong>the</strong>r understand bottlenecks<br />
and/or poor per<strong>for</strong>mance <strong>of</strong> fish passage facilities <strong>to</strong> make <strong>the</strong>m more effective in<br />
successfully passing Atlantic salmon adults, smolts, and kelts and juvenile and adult<br />
alewife, American shad, and blueback herring around mainstem hydro projects. Any<br />
newly constructed fish passage facilities will need <strong>to</strong> undergo rigorous testing <strong>to</strong><br />
ensure <strong>the</strong>y function properly and are effective in passing <strong>the</strong> target res<strong>to</strong>ration fish<br />
species. All studies should be undertaken over <strong>the</strong> course <strong>of</strong> a minimum <strong>of</strong> three<br />
field seasons.<br />
16.1.4 Complete Fish Passage Improvements Based on Passage Efficiency<br />
Studies<br />
Once fish passage efficiency studies are complete, redesign <strong>of</strong> existing facilities,<br />
operational changes <strong>to</strong> <strong>the</strong> existing facilities, and/or installation <strong>of</strong> additional fish<br />
passage facilities are <strong>to</strong> be undertaken.<br />
16.1.5 Assess Fish Passage Improvements <strong>for</strong> Juvenile and Adult Atlantic<br />
Salmon, Alewife, American Shad, and Blueback Herring at Mainstem Dams<br />
A minimum <strong>of</strong> three field seasons are needed <strong>to</strong> verify that <strong>the</strong> improvements allow<br />
<strong>the</strong> fish passage facilities <strong>to</strong> meet efficiency goals <strong>for</strong> passage <strong>of</strong> adult and juvenile<br />
Atlantic salmon, alewife, American shad, and blueback herring.<br />
16.2.1 Review FERC Licenses and Lower Penobscot River Multiparty<br />
Settlement Agreement (MPA) <strong>for</strong> Specific Fish Passage Deliverables <strong>for</strong><br />
American Eel<br />
Hydro licenses issued <strong>for</strong> <strong>the</strong> mainstem Penobscot River dams need review <strong>to</strong><br />
determine what articles, if any, were included by FERC that address fish passage.<br />
Similarly, <strong>the</strong> Lower Penobscot River Multiparty Settlement Agreement (MPA)<br />
PRFP Page 67
contains specific language on fish passage provisions that could affect timelines<br />
listed in <strong>the</strong> work plan. Additionally, <strong>the</strong> MSA spells out specific fish passage<br />
strategies depending on whe<strong>the</strong>r <strong>the</strong> Veazie and Great Works dams are removed<br />
and <strong>the</strong> Howland Dam is bypassed as well as <strong>to</strong> which entity would be responsible<br />
<strong>for</strong> funding, installing, and operating <strong>the</strong> fish passage facilities.<br />
16.2.2 Review Existing Fish Passage Studies <strong>for</strong> Juvenile and Adult American<br />
Eel Undertaken within <strong>the</strong> Penobscot River Watershed<br />
Over <strong>the</strong> past few years, <strong>the</strong>re have been several studies undertaken by hydro dam<br />
opera<strong>to</strong>rs attempting <strong>to</strong> determine <strong>the</strong> efficiency <strong>of</strong> fish passage facilities <strong>for</strong> juvenile<br />
and adult American eel. There is a need <strong>to</strong> syn<strong>the</strong>size this in<strong>for</strong>mation <strong>to</strong> provide <strong>for</strong><br />
baseline conditions and <strong>to</strong> in<strong>for</strong>m future passage studies <strong>for</strong> American eel.<br />
16.2.3 Develop Assessment Study <strong>Plan</strong>s, Conduct Fish Passage Efficiency<br />
Studies, and Develop Recommendations <strong>for</strong> Fish Passage Improvements <strong>for</strong><br />
Juvenile and Adult American Eel at Mainstem Dams<br />
Upstream fish passage facilities have recently been installed at some mainstem<br />
dams specifically targeting American eel. Likewise, downstream passage facilities<br />
have been constructed at some but not all <strong>of</strong> <strong>the</strong> mainstem dams. Once <strong>the</strong> review<br />
outlined in 16.2.2 is complete, studies <strong>of</strong> existing fish passage facilities will need <strong>to</strong><br />
be undertaken <strong>to</strong> fur<strong>the</strong>r understand bottlenecks and/or poor per<strong>for</strong>mance <strong>of</strong> fish<br />
passage facilities <strong>to</strong> make <strong>the</strong>m more effective in successfully passing juvenile and<br />
adult American eel around hydro projects. Any newly constructed fish passage<br />
facilities will need <strong>to</strong> undergo rigorous testing <strong>to</strong> ensure <strong>the</strong>y function properly and<br />
are effective in passing American eel. All studies should be undertaken over <strong>the</strong><br />
course <strong>of</strong> a minimum <strong>of</strong> three field seasons after <strong>the</strong> Veazie and Great Works dams<br />
are removed<br />
16.2.4 Complete Fish Passage Improvements Based on Passage Efficiency<br />
Studies<br />
Once fish passage efficiency studies are complete, redesign <strong>of</strong> existing facilities,<br />
operational changes <strong>to</strong> <strong>the</strong> existing facilities, and/or installation <strong>of</strong> additional fish<br />
passage facilities are <strong>to</strong> be undertaken.<br />
16.2.5 Assess Fish Passage Improvements <strong>for</strong> Juvenile and Adult American<br />
Eel at Mainstem Dams<br />
A minimum <strong>of</strong> three field seasons are needed <strong>to</strong> verify that <strong>the</strong> improvements allow<br />
<strong>the</strong> fish passage facilities <strong>to</strong> meet efficiency goals <strong>for</strong> passage <strong>of</strong> adult and juvenile<br />
American eel.<br />
17.1.1 Review FERC Licenses, FERC License Exemptions, and Lower<br />
Penobscot River Multiparty Settlement Agreement (MPA) <strong>for</strong> Specific Fish<br />
Passage Deliverables <strong>for</strong> Juvenile and Adult Atlantic Salmon at Tributary<br />
Dams<br />
Hydro licenses and license exemptions issued <strong>for</strong> dams located on Penobscot River<br />
tributaries need review <strong>to</strong> determine what articles, if any, were included by FERC<br />
PRFP Page 68
that address fish passage. Similarly, <strong>the</strong> MPA contains specific language on fish<br />
passage provisions that could affect timelines listed in <strong>the</strong> work plan. Additionally,<br />
<strong>the</strong> MPA spells out specific fish passage strategies depending on whe<strong>the</strong>r <strong>the</strong><br />
Veazie and Great Works dams are removed and <strong>the</strong> Howland Dam is bypassed as<br />
well as <strong>to</strong> which entity would be responsible <strong>for</strong> funding, installing, and operating <strong>the</strong><br />
fish passage facilities.<br />
17.1.2 Review Need and Process <strong>to</strong> Increase Upstream and Downstream Fish<br />
Passage Efficiency at FERC Non-Jurisdictional Dams Located on Tributaries<br />
<strong>for</strong> Juvenile and Adult Atlantic Salmon<br />
There is at least one FERC non-jurisdictional dam on Penobscot River tributaries,<br />
<strong>the</strong> Guil<strong>for</strong>d Dam located on <strong>the</strong> Piscataquis River, which is critical <strong>for</strong> passage <strong>of</strong><br />
target res<strong>to</strong>ration fish species. How fish passage improvements are addressed at<br />
this dam needs <strong>to</strong> be explored <strong>to</strong> develop options and approaches <strong>to</strong> ensure fish<br />
passage facilities meet established goals.<br />
17.1.3 Review Existing Fish Passage Studies and Migration/Movement<br />
Undertaken within <strong>the</strong> Penobscot River Watershed <strong>for</strong> Juvenile and Adult<br />
Atlantic Salmon<br />
Over <strong>the</strong> past 20 years, <strong>the</strong>re have been several studies undertaken by hydro dam<br />
opera<strong>to</strong>rs, University <strong>of</strong> Maine graduate students, <strong>the</strong> Maine Atlantic Salmon<br />
Commission, and o<strong>the</strong>rs attempting <strong>to</strong> determine <strong>the</strong> efficiency <strong>of</strong> fish passage<br />
facilities <strong>for</strong> juvenile and adult Atlantic salmon and <strong>to</strong> understand inriver movements<br />
<strong>of</strong> adult and juvenile Atlantic salmon. Passage at tributary dams and inriver<br />
movements/migrations <strong>for</strong> o<strong>the</strong>r anadromous fish species have not been studied in<br />
Penobscot River tributaries. There is a need <strong>to</strong> syn<strong>the</strong>size <strong>the</strong> Atlantic salmon<br />
in<strong>for</strong>mation <strong>to</strong> provide <strong>for</strong> baseline conditions and <strong>to</strong> in<strong>for</strong>m future passage studies<br />
<strong>for</strong> Atlantic salmon.<br />
17.1.4 Develop Assessment Study <strong>Plan</strong>s, Conduct Fish Passage Efficiency<br />
Studies, and Develop Recommendations <strong>for</strong> Fish Passage Improvements <strong>for</strong><br />
Juvenile and Adult Atlantic Salmon<br />
Not all existing fish passage facilities and/or operational measures (e.g. cycling<br />
turbines, opening sluice gates, temporary shutdown <strong>of</strong> generation) have been<br />
assessed <strong>for</strong> <strong>the</strong> passage <strong>of</strong> juvenile and adult Atlantic salmon. Studies <strong>of</strong> existing<br />
fish passage facilities will need <strong>to</strong> be undertaken <strong>to</strong> fur<strong>the</strong>r understand bottlenecks<br />
and/or poor per<strong>for</strong>mance <strong>of</strong> existing fish passage facilities <strong>to</strong> make <strong>the</strong>m more<br />
effective in successfully passing Atlantic salmon adults, smolts, and kelts around<br />
tributary hydro projects and non-hydro dams. Any newly constructed fish passage<br />
facilities, including <strong>the</strong> Howland nature-like bypass, will need <strong>to</strong> undergo rigorous<br />
testing <strong>to</strong> ensure <strong>the</strong>y function properly and are effective in passing <strong>the</strong> target<br />
res<strong>to</strong>ration fish species. All studies should be undertaken over <strong>the</strong> course <strong>of</strong> a<br />
minimum <strong>of</strong> three field seasons<br />
17.1.5 Complete Fish Passage Improvements Based on Passage Efficiency<br />
Studies<br />
PRFP Page 69
Once fish passage efficiency studies are complete, redesign <strong>of</strong> existing facilities,<br />
operational changes <strong>to</strong> <strong>the</strong> existing facilities, and/or installation <strong>of</strong> additional fish<br />
passage facilities are <strong>to</strong> be undertaken.<br />
17.1.6 Assess Fish Passage Improvements <strong>for</strong> Juvenile and Adult Atlantic<br />
Salmon at Tributary Dams<br />
A minimum <strong>of</strong> three field seasons are needed <strong>to</strong> verify that <strong>the</strong> improvements allow<br />
<strong>the</strong> fish passage facilities <strong>to</strong> meet efficiency goals <strong>for</strong> passage <strong>of</strong> adult and juvenile<br />
Atlantic salmon.<br />
17.2.1 Review FERC Licenses and Lower Penobscot River Multiparty<br />
Settlement Agreement (MPA) <strong>for</strong> Specific Fish Passage Deliverables at<br />
Howland and Lowell Tannery <strong>for</strong> Juvenile and Adult Alewife<br />
Hydro licenses issued <strong>for</strong> <strong>the</strong> Howland and Lowell Tannery dams located on<br />
Penobscot River tributaries need review <strong>to</strong> determine what articles, if any, were<br />
included by FERC that address fish passage. Similarly, <strong>the</strong> MPA contains specific<br />
language on fish passage provisions that could affect timelines listed in <strong>the</strong> work<br />
plan. Additionally, <strong>the</strong> MPA spells out specific fish passage strategies depending on<br />
whe<strong>the</strong>r <strong>the</strong> Veazie and Great Works dams are removed and <strong>the</strong> Howland Dam is<br />
bypassed as well as <strong>to</strong> which entity would be responsible <strong>for</strong> funding, installing, and<br />
operating <strong>the</strong> fish passage facilities.<br />
17.2.2 Develop Assessment Study <strong>Plan</strong>s, Conduct Fish Passage Efficiency<br />
Studies, and Develop Recommendations <strong>for</strong> Fish Passage Improvements <strong>for</strong><br />
Juvenile and Adult Alewife<br />
The Howland and Lowell Tannery fish passage facilities, installed in 1965 (Howland)<br />
and 1985 (Lowell Tannery), have not been assessed <strong>for</strong> <strong>the</strong> passage <strong>of</strong> juvenile and<br />
adult alewife since <strong>the</strong>y were primarily constructed <strong>for</strong> passage <strong>of</strong> Atlantic salmon.<br />
Studies <strong>of</strong> <strong>the</strong> existing upstream and downstream fish passage facilities and/or<br />
operational measures (e.g. cycling turbines, opening sluice gates, temporary<br />
shutdown <strong>of</strong> generation) need <strong>to</strong> be undertaken <strong>to</strong> ensure <strong>the</strong> existing passage<br />
facilities function properly and are effective in passing alewife. Any newly<br />
constructed fish passage facilities (e.g. Howland bypass) will need <strong>to</strong> undergo<br />
rigorous testing <strong>to</strong> ensure <strong>the</strong>y function properly and are effective in passing alewife.<br />
All studies should be undertaken over <strong>the</strong> course <strong>of</strong> a minimum <strong>of</strong> three field<br />
seasons after Phase 1 lakes located above <strong>the</strong> Howland and Lowell Tannery dams<br />
are s<strong>to</strong>cked.<br />
17.2.3 Complete Fish Passage Improvements Based on Passage Efficiency<br />
Studies<br />
Once fish passage efficiency studies are complete, redesign <strong>of</strong> existing facilities at<br />
Lowell Tannery and Howland including <strong>the</strong> bypass, operational changes <strong>to</strong> <strong>the</strong><br />
existing facilities or bypass, and/or installation <strong>of</strong> additional fish passage facilities at<br />
<strong>the</strong> Howland and Lowell Tannery dams are <strong>to</strong> be undertaken.<br />
PRFP Page 70
17.2.4 Assess Fish Passage Improvements <strong>for</strong> Juvenile and Adult Alewife at<br />
Howland and Lowell Tannery<br />
A minimum <strong>of</strong> three field seasons are needed <strong>to</strong> verify that <strong>the</strong> improvements at<br />
Howland and Lowell Tannery allow <strong>the</strong> fish passage facilities <strong>to</strong> meet efficiency<br />
goals <strong>for</strong> passage <strong>of</strong> juvenile and adult alewife.<br />
17.3.1 Review <strong>the</strong> FERC License and Lower Penobscot River Multiparty<br />
Settlement Agreement (MPA) <strong>for</strong> Specific Fish Passage Deliverables at<br />
Howland <strong>for</strong> Juvenile and Adult American Shad and Blueback Herring<br />
The hydro license <strong>for</strong> <strong>the</strong> Howland Project needs review <strong>to</strong> determine what articles, if<br />
any, were included by FERC that address fish passage. Similarly, <strong>the</strong> MPA contains<br />
specific language on fish passage provisions that could affect timelines listed in <strong>the</strong><br />
work plan. Additionally, <strong>the</strong> MPA spells out specific fish passage strategies<br />
depending on whe<strong>the</strong>r <strong>the</strong> Veazie and Great Works dams are removed and <strong>the</strong><br />
Howland Dam is bypassed as well as <strong>to</strong> which entity would be responsible <strong>for</strong><br />
funding, installing, and operating <strong>the</strong> fish passage facilities.<br />
17.3.2 Develop Assessment Study <strong>Plan</strong>s, Conduct Fish Passage Efficiency<br />
Studies, and Develop Recommendations <strong>for</strong> Fish Passage Improvements <strong>for</strong><br />
Juvenile and Adult American Shad and Blueback Herring<br />
The Howland fish passage facility, installed in 1965, has not been assessed <strong>for</strong> <strong>the</strong><br />
passage <strong>of</strong> juvenile and adult American shad and blueback herring since it was<br />
primarily constructed <strong>for</strong> passage <strong>of</strong> Atlantic salmon. Studies <strong>of</strong> <strong>the</strong> existing<br />
upstream and downstream fish passage facilities and/or operational measures (e.g.<br />
cycling turbines, opening sluice gates, temporary shutdown <strong>of</strong> generation) need <strong>to</strong><br />
be undertaken <strong>to</strong> ensure <strong>the</strong> existing passage facilities function properly and are<br />
effective in passing American shad and blueback herring. Any newly constructed<br />
fish passage facilities (e.g. Howland bypass) will need <strong>to</strong> undergo rigorous testing <strong>to</strong><br />
ensure <strong>the</strong>y function properly and are effective in passing American shad and<br />
blueback herring. All studies should be undertaken over <strong>the</strong> course <strong>of</strong> a minimum <strong>of</strong><br />
three field seasons after Phase 1 habitat located above <strong>the</strong> Howland Dam is<br />
s<strong>to</strong>cked.<br />
17.3.3 Complete Fish Passage Improvements Based on Passage Efficiency<br />
Studies<br />
Once fish passage efficiency studies are complete, redesign <strong>of</strong> existing facilities or<br />
bypass, operational changes <strong>to</strong> <strong>the</strong> existing facilities or bypass, and/or installation <strong>of</strong><br />
additional fish passage facilities at <strong>the</strong> Howland Dam are <strong>to</strong> be undertaken.<br />
17.3.4 Assess Fish Passage Improvements <strong>for</strong> Juvenile and Adult American<br />
Shad and Blueback Herring at Howland<br />
A minimum <strong>of</strong> three field seasons are needed <strong>to</strong> verify that <strong>the</strong> improvements at<br />
Howland allow <strong>the</strong> fish passage facilities <strong>to</strong> meet efficiency goals <strong>for</strong> passage <strong>of</strong><br />
juvenile and adult American shad and blueback herring.<br />
PRFP Page 71
17.4.1 Review FERC Licenses and FERC License Exemptions <strong>for</strong> Specific Fish<br />
Passage Deliverables <strong>for</strong> Juvenile and Adult Alewife, American Shad, and<br />
Blueback Herring at Remaining Tributary Dams<br />
Hydro licenses and license exemptions issued <strong>for</strong> dams located on Penobscot River<br />
tributaries need review <strong>to</strong> determine what articles, if any, were included by FERC<br />
that address fish passage.<br />
17.4.2 Review Need and Process <strong>to</strong> Increase Upstream and Downstream Fish<br />
Passage Efficiency at FERC Non-Jurisdictional Dams Located on Tributaries<br />
<strong>for</strong> Juvenile and Adult Alewife, American Shad, and Blueback Herring<br />
There is at least one FERC non-jurisdictional dam on Penobscot River tributaries,<br />
<strong>the</strong> Guil<strong>for</strong>d Dam located on <strong>the</strong> Piscataquis River, which is critical <strong>for</strong> passage <strong>of</strong><br />
target res<strong>to</strong>ration fish species. How fish passage improvements are addressed<br />
needs <strong>to</strong> be explored <strong>to</strong> develop options and approaches <strong>to</strong> ensure fish passage<br />
facilities meet established goals.<br />
17.4.3 Develop Assessment Study <strong>Plan</strong>s, Conduct Fish Passage Efficiency<br />
Studies, and Develop Recommendations <strong>for</strong> Fish Passage Improvements <strong>for</strong><br />
Juvenile and Adult Alewife, American Shad, and Blueback Herring at<br />
Remaining Tributary Dams within 40 Years<br />
None <strong>of</strong> <strong>the</strong> existing upstream fish passage facilities on tributary dams have been<br />
assessed <strong>for</strong> <strong>the</strong> passage <strong>of</strong> juvenile and adult alewife, American shad, and<br />
blueback herring. Downstream fish passage facilities have been constructed at<br />
some but not all <strong>of</strong> <strong>the</strong> tributary dams and downstream passage operational<br />
measures (e.g. cycling turbines, opening sluice gates, temporary shutdown <strong>of</strong><br />
generation) may be used <strong>to</strong> pass fish downstream <strong>of</strong> a hydro project. Studies <strong>of</strong><br />
existing fish passage facilities will need <strong>to</strong> be undertaken <strong>to</strong> fur<strong>the</strong>r understand<br />
bottlenecks and/or poor per<strong>for</strong>mance <strong>of</strong> existing fish passage facilities <strong>to</strong> make <strong>the</strong>m<br />
more effective in successfully passing juvenile and adult alewife, American shad,<br />
and blueback herring around tributary hydro projects and non-hydro dams. Any<br />
newly constructed fish passage facilities will need <strong>to</strong> undergo rigorous testing <strong>to</strong><br />
ensure <strong>the</strong>y function properly and are effective in passing <strong>the</strong> target res<strong>to</strong>ration fish<br />
species. All studies should be undertaken over <strong>the</strong> course <strong>of</strong> a minimum <strong>of</strong> three<br />
field seasons following s<strong>to</strong>cking <strong>of</strong> habitat located upstream <strong>of</strong> <strong>the</strong> dams.<br />
17.4.4 Complete Fish Passage Improvements Based on Passage Efficiency<br />
Studies<br />
Once fish passage efficiency studies are complete, redesign <strong>of</strong> existing facilities,<br />
operational changes <strong>to</strong> <strong>the</strong> existing facilities, and/or installation <strong>of</strong> additional fish<br />
passage facilities at <strong>the</strong> remaining tributary dams are <strong>to</strong> be undertaken.<br />
17.4.5 Assess Fish Passage Improvements <strong>for</strong> Juvenile and Adult Alewife,<br />
American Shad, and Blueback Herring at Remaining Tributary Dams<br />
A minimum <strong>of</strong> three field seasons are needed <strong>to</strong> verify that <strong>the</strong> improvements at <strong>the</strong><br />
remaining tributary dams allow <strong>the</strong> fish passage facilities <strong>to</strong> meet efficiency goals <strong>for</strong><br />
passage <strong>of</strong> juvenile and adult alewife, American shad, and blueback herring.<br />
PRFP Page 72
17.5.1 Review <strong>the</strong> FERC License and Lower Penobscot River Multiparty<br />
Settlement Agreement (MPA) <strong>for</strong> Specific Fish Passage Deliverables at<br />
Howland <strong>for</strong> Juvenile and Adult American Eel<br />
The hydro license issued <strong>for</strong> <strong>the</strong> Howland Project needs review <strong>to</strong> determine what<br />
articles, if any, were included by FERC that address fish passage. Similarly, <strong>the</strong><br />
MPA contains specific language on fish passage provisions that could affect<br />
timelines listed in <strong>the</strong> work plan. Additionally, <strong>the</strong> MPA spells out specific fish<br />
passage strategies depending on whe<strong>the</strong>r <strong>the</strong> Veazie and Great Works dams are<br />
removed and <strong>the</strong> Howland Dam is bypassed as well as <strong>to</strong> which entity would be<br />
responsible <strong>for</strong> funding, installing, and operating <strong>the</strong> fish passage facilities.<br />
17.5.2 Review Existing Fish Passage Studies <strong>for</strong> Juvenile and Adult American<br />
Eel Undertaken within <strong>the</strong> Penobscot River Watershed<br />
Over <strong>the</strong> past few years, <strong>the</strong>re have been several studies undertaken by hydro dam<br />
opera<strong>to</strong>rs attempting <strong>to</strong> determine <strong>the</strong> efficiency <strong>of</strong> fish passage facilities <strong>for</strong> adult<br />
and juvenile American eel. There is a need <strong>to</strong> syn<strong>the</strong>size this in<strong>for</strong>mation <strong>to</strong> provide<br />
<strong>for</strong> baseline conditions and <strong>to</strong> in<strong>for</strong>m future studies and management decisions.<br />
17.5.3 Develop Assessment Study <strong>Plan</strong>s, Conduct Fish Passage Efficiency<br />
Studies, and Develop Recommendations <strong>for</strong> Fish Passage Improvements at<br />
Howland within 10 years<br />
Once <strong>the</strong> review outlined in 17.5.2 is complete, studies <strong>of</strong> any newly constructed fish<br />
passage facilities and Howland bypass will need <strong>to</strong> undergo rigorous testing <strong>to</strong><br />
ensure <strong>the</strong>y function properly and are effective in passing <strong>the</strong> target res<strong>to</strong>ration fish<br />
species. All studies should be undertaken over <strong>the</strong> course <strong>of</strong> a minimum <strong>of</strong> three<br />
field seasons within 10 years.<br />
17.5.4 Complete Fish Passage Improvements at Howland Based on Passage<br />
Efficiency Studies<br />
Once fish passage efficiency studies are complete, redesign <strong>of</strong> existing facilities or<br />
bypass, operational changes <strong>to</strong> existing facilities or bypass, and/or installation <strong>of</strong><br />
additional fish passage facilities at <strong>the</strong> Howland Dam are <strong>to</strong> be undertaken.<br />
17.5.5 Assess Fish Passage Improvements <strong>for</strong> American Eel at Howland<br />
A minimum <strong>of</strong> three field seasons are needed <strong>to</strong> verify that <strong>the</strong> improvements allow<br />
<strong>the</strong> fish passage facilities <strong>to</strong> meet efficiency goals <strong>for</strong> passage <strong>of</strong> juvenile and adult<br />
American eel.<br />
17.6.1 Review FERC Licenses and FERC License Exemptions <strong>for</strong> Specific Fish<br />
Passage Deliverables at Remaining Tributary Dams <strong>for</strong> Juvenile and Adult<br />
American Eel<br />
Hydro licenses and license exemptions issued <strong>for</strong> dams located on Penobscot River<br />
tributaries need review <strong>to</strong> determine what articles, if any, were included by FERC<br />
that address fish passage.<br />
PRFP Page 73
17.6.2 Review Need and Process <strong>to</strong> Increase Upstream and Downstream Fish<br />
Passage Efficiency at FERC Non-Jurisdictional Dams Located on Tributaries<br />
<strong>for</strong> Juvenile and Adult American Eel<br />
There is at least one FERC non-jurisdictional dam on Penobscot River tributaries,<br />
<strong>the</strong> Guil<strong>for</strong>d Dam located on <strong>the</strong> Piscataquis River, which is critical <strong>for</strong> passage <strong>of</strong><br />
target res<strong>to</strong>ration fish species. How fish passage improvements are addressed<br />
needs <strong>to</strong> be explored <strong>to</strong> develop options and approaches <strong>to</strong> ensure fish passage<br />
facilities meet established goals.<br />
17.6.3 Review Existing Fish Passage Studies <strong>for</strong> Juvenile and Adult American<br />
Eel Undertaken within <strong>the</strong> Penobscot River Watershed<br />
Over <strong>the</strong> past few years, <strong>the</strong>re have been several studies undertaken by hydro dam<br />
opera<strong>to</strong>rs attempting <strong>to</strong> determine <strong>the</strong> efficiency <strong>of</strong> fish passage facilities <strong>for</strong> adult<br />
and juvenile American eel. There is a need <strong>to</strong> syn<strong>the</strong>size this in<strong>for</strong>mation <strong>to</strong> provide<br />
<strong>for</strong> baseline conditions and <strong>to</strong> in<strong>for</strong>m future studies and management decisions.<br />
17.6.4 Utilize Annual Boat Electr<strong>of</strong>ishing Surveys <strong>to</strong> Determine Requirement<br />
and Assessment Timeline <strong>for</strong> Fish Passage Facilities at Remaining Tributary<br />
Dams<br />
Boat electr<strong>of</strong>ishing surveys will be undertaken annually <strong>to</strong> establish <strong>the</strong> need <strong>for</strong> fish<br />
passage facility installation and <strong>to</strong> determine <strong>the</strong> assessment timeline <strong>of</strong> existing<br />
passage facilities at tributary dams.<br />
17.6.5 Develop Assessment Study <strong>Plan</strong>s, Conduct Fish Passage Efficiency<br />
Studies, and Develop Recommendations <strong>for</strong> Fish Passage Improvements at<br />
Remaining Tributary Dams within 30 years<br />
Once <strong>the</strong> review outlined in 17.6.3 and survey results outlined in 17.6.4 are<br />
complete, studies <strong>of</strong> existing fish passage facilities and <strong>for</strong> installation <strong>of</strong> new fish<br />
passage facilities at remaining dams will need <strong>to</strong> be undertaken. Any newly<br />
constructed fish passage facilities will need <strong>to</strong> undergo rigorous testing <strong>to</strong> ensure<br />
<strong>the</strong>y function properly and are effective in passing <strong>the</strong> target res<strong>to</strong>ration fish species.<br />
All studies should be undertaken over <strong>the</strong> course <strong>of</strong> a minimum <strong>of</strong> three field<br />
seasons within 30 years.<br />
17.6.6 Complete Fish Passage Improvements at Remaining Tributary Dams<br />
Based on Passage Efficiency Studies<br />
Once fish passage efficiency studies are complete, redesign <strong>of</strong> existing facilities,<br />
operational changes <strong>to</strong> existing facilities, and/or installation <strong>of</strong> additional fish<br />
passage facilities at <strong>the</strong> remaining tributary dams are <strong>to</strong> be undertaken.<br />
17.6.7 Assess Fish Passage Improvements at Remaining Tributary Dams<br />
A minimum <strong>of</strong> three field seasons are needed <strong>to</strong> verify that <strong>the</strong> improvements allow<br />
<strong>the</strong> fish passage facilities <strong>to</strong> meet efficiency goals <strong>for</strong> passage <strong>of</strong> juvenile and adult<br />
American eel.<br />
PRFP Page 74
18.1.1 Review Need and Process <strong>to</strong> Increase Upstream and Downstream Fish<br />
Passage Efficiency at FERC Non-Jurisdictional Dams at Lake and Pond<br />
Outlets<br />
Dams at outlets <strong>to</strong> larger lakes (e.g. Grand Lake Matagamon, Schoodic Lake) within<br />
<strong>the</strong> Penobscot drainage have been deemed non-jurisdictional by FERC because <strong>of</strong><br />
limited benefits <strong>to</strong> downstream hydro generation. How fish passage improvements<br />
are addressed at <strong>the</strong>se locations needs <strong>to</strong> be explored <strong>to</strong> develop options and<br />
approaches <strong>to</strong> ensure fish passage facilities or measures meet established goals.<br />
18.1.2 Develop Assessment Study <strong>Plan</strong>s, Conduct Fish Passage Efficiency<br />
Studies, and Develop Recommendations <strong>for</strong> Upstream and Downstream Fish<br />
Passage <strong>for</strong> Juvenile and Adult Atlantic Salmon at <strong>the</strong> Grand Lake Matagamon<br />
Dam within 20 Years<br />
The existing upstream fish passage facility at Grand Lake Matagamon Dam was<br />
installed in 1942 with <strong>the</strong> primary target fish species being resident species.<br />
However, <strong>the</strong> existing fishway allows <strong>for</strong> passage <strong>of</strong> adult Atlantic salmon in<strong>to</strong> <strong>the</strong><br />
lake <strong>to</strong> access habitat in <strong>the</strong> upper East Branch, Penobscot River, including Webster<br />
Stream. Passage efficiency at this site has never been determined. There are no<br />
downstream passage facilities at <strong>the</strong> dam but gates are operated seasonally <strong>to</strong><br />
regulate flows <strong>to</strong> <strong>the</strong> East Branch, Penobscot River. There is a need <strong>to</strong> understand<br />
<strong>the</strong> effectiveness <strong>of</strong> <strong>the</strong> upstream fish passage facility and if downstream passage is<br />
effective under <strong>the</strong> current water flow management regime <strong>to</strong> determine if upgrades<br />
are needed <strong>to</strong> make <strong>the</strong> fish passage facility and measures more effective in<br />
successfully passing juvenile and adult Atlantic salmon at <strong>the</strong> dam. All studies<br />
should be undertaken over <strong>the</strong> course <strong>of</strong> a minimum <strong>of</strong> three field seasons <strong>to</strong> ensure<br />
upstream and downstream passage effectiveness.<br />
18.1.3 Complete Fish Passage Improvements Based on Passage Efficiency<br />
Studies<br />
Once fish passage efficiency studies are complete, redesign <strong>of</strong> existing facilities,<br />
operational changes <strong>to</strong> existing facilities, and/or installation <strong>of</strong> additional fish<br />
passage facilities at <strong>the</strong> Grand Lake Matagamon Dam are <strong>to</strong> be undertaken.<br />
18.1.4 Assess Fish Passage Improvements <strong>for</strong> Juvenile and Adult Atlantic<br />
Salmon at <strong>the</strong> Grand Lake Matagamon Dam<br />
A minimum <strong>of</strong> three field seasons are needed <strong>to</strong> verify that <strong>the</strong> improvements allow<br />
<strong>the</strong> fish passage facilities/measures <strong>to</strong> meet efficiency goals <strong>for</strong> passage <strong>of</strong> juvenile<br />
and adult Atlantic salmon.<br />
18.2.1 Review Need and Process <strong>to</strong> Increase Upstream and Downstream Fish<br />
Passage Efficiency <strong>for</strong> Juvenile and Adult Alewife and American Eel at Lake<br />
and Pond Outlets<br />
Numerous lakes and ponds in <strong>the</strong> Penobscot River watershed have outlet dams,<br />
which may or may not have fish passage facilities. How fish passage improvements<br />
are addressed at <strong>the</strong>se locations needs <strong>to</strong> be explored <strong>to</strong> develop options and<br />
approaches <strong>to</strong> ensure fish passage facilities or measures meet established goals.<br />
PRFP Page 75
18.2.2 Develop Assessment Study <strong>Plan</strong>s, Conduct Fish Passage Efficiency<br />
Studies, and Develop Recommendations <strong>for</strong> Upstream and Downstream Fish<br />
Passage Improvements <strong>for</strong> Juvenile and Adult Alewife and American Eel at<br />
Lake and Pond Outlets within 50 Years<br />
Lake and pond outlet dams may inhibit passage <strong>of</strong> adult alewife and juvenile eel in<strong>to</strong><br />
lakes or ponds and low outflows at outlets during <strong>the</strong> emigration <strong>of</strong> juvenile and<br />
spent adult alewives and maturing eels may impede <strong>the</strong> timely downstream passage<br />
<strong>of</strong> alewives and eels. Studies are needed <strong>to</strong> understand what facilities or measures<br />
may be needed <strong>to</strong> meet fish passage efficiency goals and ensure passage <strong>of</strong><br />
juvenile and adult alewife and American eel in<strong>to</strong> and out <strong>of</strong> lakes and ponds.<br />
18.2.3 Complete Fish Passage Improvements Based on Passage Efficiency<br />
Studies<br />
Once fish passage efficiency studies are complete, installation <strong>of</strong> passage facilities,<br />
operational changes <strong>to</strong> existing passage facilities, and/or installation <strong>of</strong> additional<br />
fish passage facilities at lake and pond outlets are <strong>to</strong> be undertaken<br />
18.2.4. Assess Fish Passage Facility Improvements <strong>for</strong> Juvenile and Adult<br />
Alewife and American Eel at Lake and Pond Outlets<br />
A minimum <strong>of</strong> three field seasons are needed <strong>to</strong> verify that <strong>the</strong> improvements allow<br />
<strong>the</strong> fish passage facilities/measures <strong>to</strong> meet efficiency goals <strong>for</strong> passage <strong>of</strong> adult<br />
and juvenile alewife and American eel.<br />
19.1.1 Review Need <strong>to</strong> Establish Upstream and Downstream Fish Passage<br />
Facility Operating Pro<strong>to</strong>cols <strong>to</strong> Ensure Proper Operation <strong>of</strong> Upstream and<br />
Downstream Fish Passage Facilities<br />
There is a need <strong>to</strong> moni<strong>to</strong>r <strong>the</strong> operation <strong>of</strong> upstream and downstream fish passage<br />
facilities <strong>to</strong> ensure proper operation <strong>of</strong> <strong>the</strong> facilities during <strong>the</strong> migration season <strong>of</strong><br />
<strong>the</strong> target res<strong>to</strong>ration species. In some instances, particularly at hydro projects<br />
which have FERC license exemptions, operating pro<strong>to</strong>cols may not be included in<br />
articles within <strong>the</strong> FERC license or license exemption. There is a need <strong>to</strong> establish<br />
fish migration windows <strong>for</strong> <strong>the</strong> target res<strong>to</strong>ration species so that all fish passage<br />
facilities are operated during <strong>the</strong> same time frames.<br />
19.1.2 Periodically Inspect Upstream and Downstream Fish Passage Facilities<br />
<strong>to</strong> Ensure Facilities are Effective in Passing Target <strong>Res<strong>to</strong>ration</strong> Species<br />
Weekly inspections <strong>of</strong> fish passage facilities need <strong>to</strong> be undertaken <strong>to</strong> ensure proper<br />
and timely operation <strong>of</strong> <strong>the</strong> facilities.<br />
19.1.3 Consult with Owners <strong>of</strong> Fish Passage Facilities Regarding Fish Passage<br />
Issues<br />
Periodic maintenance at dams, ill-timed water releases, poor maintenance <strong>of</strong> fish<br />
passages facilities, etc. can result in poor fish passage. Consultation with dam<br />
owners prior <strong>to</strong> circumstances that cause less effective fish passage is necessary <strong>to</strong><br />
prevent situations where access <strong>to</strong> spawning and rearing habitat is compromised.<br />
PRFP Page 76
19.1.4 Consult and/or Partner with Owners <strong>of</strong> Fish Passage Facilities <strong>to</strong><br />
Improve Effectiveness <strong>of</strong> Fish Passage Facilities and/or Fish Passage<br />
Measures<br />
Fish passage facilities may be constructed as “state-<strong>of</strong>-<strong>the</strong>-art” yet may fall short <strong>of</strong><br />
meeting fish passage efficiency goals. Similarly, measures may be instituted but<br />
could be ill-timed <strong>to</strong> benefit target res<strong>to</strong>ration species. Consultation and/or <strong>for</strong>ming<br />
partnerships with owners <strong>of</strong> fish passage facilities <strong>to</strong> improve <strong>the</strong> effectiveness <strong>of</strong><br />
facilities and/or measures may be needed <strong>to</strong> meet fish passage targets.<br />
19.1.5 Consult and/or Partner with Dam Owners <strong>to</strong> Install Fish Passage<br />
Facilities at Problematic Passage Sites<br />
Dam owners may have constructed fish passage facilities that comply with fish<br />
passage articles within FERC license or license exemptions. However, some<br />
facilities may per<strong>for</strong>m poorly. In o<strong>the</strong>r situations, fish passage facilities have yet <strong>to</strong><br />
be installed. Depending on <strong>the</strong> dam (hydro, non-hydro), state or federal regula<strong>to</strong>ry<br />
agencies may have authority <strong>to</strong> prescribe or request that fish passage facilities be<br />
installed and operated. USFWS and NOAA have prescriptive authority under<br />
Section 18 <strong>of</strong> <strong>the</strong> Federal Power Act <strong>to</strong> prescribe installation and operation <strong>of</strong> fish<br />
passage facilities at FERC jurisdictional dams. DMR and IFW have statu<strong>to</strong>ry<br />
authority <strong>to</strong> request installation <strong>of</strong> fish passage facilities at FERC non-jurisdictional<br />
dams. Consultation and/or <strong>for</strong>ming partnerships with dam owners may be<br />
necessary <strong>to</strong> ensure passage <strong>of</strong> target res<strong>to</strong>ration species at problematic sites.<br />
19.1.6 Develop Fish Handling and Trap Operating Pro<strong>to</strong>cols <strong>for</strong> <strong>the</strong> Mil<strong>for</strong>d<br />
Dam Fish Lift<br />
A new fish lift will be constructed at <strong>the</strong> Mil<strong>for</strong>d Dam in <strong>the</strong> next two or three years as<br />
part <strong>of</strong> <strong>the</strong> Penobscot River <strong>Res<strong>to</strong>ration</strong> Project. MDDMR will be <strong>the</strong> primary agency<br />
involved with <strong>the</strong> operation <strong>of</strong> <strong>the</strong> lift. Atlantic salmon brood s<strong>to</strong>ck will be collected at<br />
this facility and clupeids will be sorted <strong>for</strong> release in<strong>to</strong> <strong>the</strong> Mil<strong>for</strong>d headpond and/or<br />
transported <strong>to</strong> targeted river reaches or lakes and ponds. There is a need <strong>to</strong><br />
develop pro<strong>to</strong>cols <strong>for</strong> fish handling, sorting, and operating <strong>the</strong> trap.<br />
20.1.1 Moni<strong>to</strong>r Stream Connectivity <strong>to</strong> Ensure Effective Upstream and<br />
Downstream Fish Passage and Instream Movements<br />
Stream connectivity is crucial <strong>for</strong> target res<strong>to</strong>ration species <strong>to</strong> access spawning and<br />
rearing habitat and <strong>to</strong> access <strong>the</strong> ocean. Stream connectivity is also critical <strong>for</strong><br />
stream dwelling juvenile life stages <strong>to</strong> access food and refuge. Establishing a<br />
system <strong>for</strong> moni<strong>to</strong>ring stream connectivity will ensure unimpeded access <strong>to</strong> various<br />
habitats within <strong>the</strong> Penobscot River watershed.<br />
20.1.2 Ensure Implementation <strong>of</strong> <strong>the</strong> Maine Department <strong>of</strong> Transportation’s<br />
Waterway and Wildlife Crossing Policy and Design Guide<br />
Numerous state and federal regula<strong>to</strong>ry and resource agencies collaborated with<br />
MDOT in developing <strong>the</strong> policy and design guide. While <strong>the</strong> document guides<br />
development <strong>of</strong> effective ways <strong>to</strong> build, repair, and maintain <strong>the</strong> transportation<br />
PRFP Page 77
infrastructure, it does so by protecting important aquatic, wildlife, and surface water<br />
resources. The document was developed <strong>for</strong> planners, engineers, and designers<br />
working on MDOT projects. There are numerous municipalities, <strong>to</strong>wns, and private<br />
landowners within <strong>the</strong> Penobscot River watershed that are unaware <strong>of</strong> <strong>the</strong> policy and<br />
design guide or have not adopted <strong>the</strong> guide in <strong>the</strong>ir planning, construction, and<br />
repair <strong>of</strong> road projects. There is a need <strong>for</strong> municipalities, <strong>to</strong>wns, and private<br />
landowners <strong>to</strong> adopt <strong>the</strong> guide <strong>to</strong> direct <strong>the</strong>ir road construction and repair projects.<br />
Development <strong>of</strong> an education program, perhaps with <strong>the</strong> aid <strong>of</strong> MDOT, <strong>to</strong> get <strong>the</strong><br />
municipalities, <strong>to</strong>wns, and private landowners on board is needed.<br />
20.1.3 Identify Road Crossings and Small Barriers and Prioritize Passage<br />
Needs by Site and Fish Species<br />
An outcome <strong>of</strong> this task is <strong>to</strong> develop a prioritized list <strong>of</strong> specific road crossings and<br />
barriers that are crucial <strong>for</strong> passage <strong>of</strong> target res<strong>to</strong>ration species. The list will serve<br />
<strong>to</strong> identify road crossings and barriers targeted <strong>for</strong> removal or replacement.<br />
20.1.4 Obtain Funding <strong>to</strong> Replace or Remove Problematic Road Crossing<br />
Structures and <strong>to</strong> Remove Critical Barriers<br />
Culverts, pipes, pipe arch bridges, or boxes <strong>of</strong> any type or size can impede<br />
movements <strong>of</strong> target res<strong>to</strong>ration species if improperly sized and/or installed. A<br />
program <strong>to</strong> remove or upgrade road crossing structures <strong>to</strong> alleviate passage<br />
bottlenecks needs <strong>to</strong> be instituted. Similarly, small barriers can impede access <strong>to</strong><br />
spawning and nursery habitats and/or refugia. Once problematic road crossings and<br />
small barriers have been identified and prioritized (Task 20.1.3), funding will be<br />
needed <strong>to</strong> remove critical barriers and/or replace road crossings that impede<br />
res<strong>to</strong>ration <strong>of</strong> target species.<br />
20.1.5 Coordinate with O<strong>the</strong>r State and Federal Agencies and NGOs <strong>to</strong> use a<br />
Standard Pro<strong>to</strong>col and Tracking Database<br />
The State <strong>of</strong> Maine is convening a state coordinating meeting in April 2009 <strong>to</strong> initiate<br />
interagency coordination <strong>for</strong> res<strong>to</strong>ring stream connectivity. The purpose <strong>of</strong> <strong>the</strong><br />
meeting is <strong>to</strong> broadly define a goal <strong>for</strong> res<strong>to</strong>ring stream connectivity and scope <strong>the</strong><br />
feasibility <strong>of</strong> moving <strong>for</strong>ward with a dedicated interagency ef<strong>for</strong>t. The vision is <strong>to</strong><br />
have a coordinated prioritization, tracking and survey ef<strong>for</strong>t between state and<br />
federal agencies.<br />
20.1.6 Encourage Creation and Funding <strong>of</strong> a Barrier Removal Program in <strong>the</strong><br />
State <strong>of</strong> Maine<br />
An extension <strong>of</strong> task 20.1.5 is <strong>to</strong> create and fund a barrier removal program that will<br />
address priority barriers in a coordinated way.<br />
20.1.7 Collaborate with Regula<strong>to</strong>ry and Resource Agencies, Lake<br />
Associations, NGOs, etc. <strong>to</strong> Resolve Fish Passage Issues<br />
Fish passage at both dams and road crossings is a collaborative process, and some<br />
projects are more complex than o<strong>the</strong>rs. In order <strong>to</strong> accomplish alewife res<strong>to</strong>ration<br />
PRFP Page 78
goals, DMR will need <strong>to</strong> work with lake associations and o<strong>the</strong>r NGOs in order <strong>to</strong><br />
obtain a permit from IFW.<br />
20.1.8 Research and Implement Alternative Methods <strong>for</strong> Habitat Access<br />
MDMR will work with MDIFW, USFWS, NOAA Barrier Owners, Land Owners and<br />
NGOs <strong>to</strong> seek innovative methods <strong>to</strong> improve connectivity <strong>to</strong> habitat.<br />
20.1.9 Undertake with O<strong>the</strong>r Resource Agencies Risk Assessments <strong>of</strong> Range<br />
Expansion <strong>for</strong> Non-Native/Undesirable Fish Species<br />
Improving stream connectivity can lead <strong>to</strong> increased opportunities <strong>for</strong> range<br />
expansion <strong>of</strong> non-native/undesirable fish species whereas lack <strong>of</strong> stream<br />
connectivity can be detrimental <strong>to</strong> res<strong>to</strong>ration <strong>of</strong> target species if specific life stages<br />
are unable <strong>to</strong> reach critical habitat at crucial times. This task is a placeholder within<br />
<strong>the</strong> Passage and Connectivity section. See Section 4 “Non-Native Species Including<br />
Nor<strong>the</strong>rn Pike”, Tasks 23.1.2 and 23.1.3 <strong>for</strong> specific deliverables.<br />
20.2.1 Complete Ongoing Ef<strong>for</strong>ts <strong>to</strong> Catalogue Penobscot River Watershed<br />
Road Crossings and Small Barriers<br />
There have been several ef<strong>for</strong>ts over <strong>the</strong> past few years <strong>to</strong> survey and catalogue<br />
road-stream crossings and small barriers in <strong>the</strong> Penobscot River basin. The<br />
Kenduskeag Stream and <strong>the</strong> Piscataquis River watersheds have been surveyed by<br />
<strong>the</strong> USFWS and sections <strong>of</strong> <strong>the</strong> lower and mid-Penobscot River have been surveyed<br />
by a team led by <strong>the</strong> Maine Forest Service. Completion <strong>of</strong> this task will serve <strong>to</strong><br />
identify where resources may be needed <strong>to</strong> correct stream connectivity problems.<br />
20.2.2 Determine Stream Connectivity Limitations <strong>for</strong> Juvenile and Adult<br />
Atlantic Salmon within 10 years<br />
Freedom <strong>of</strong> movement <strong>to</strong> and from <strong>the</strong> ocean as well as within <strong>the</strong> fresh water<br />
environment is necessary <strong>for</strong> Atlantic salmon <strong>to</strong> complete its life his<strong>to</strong>ry. It is critical<br />
<strong>for</strong> smolts <strong>to</strong> reach <strong>the</strong> ocean and <strong>for</strong> adult Atlantic salmon <strong>to</strong> access spawning and<br />
rearing habitat and <strong>for</strong> kelts <strong>to</strong> migrate <strong>to</strong> <strong>the</strong> ocean and <strong>to</strong> return <strong>to</strong> spawning<br />
grounds as repeat spawners. It is also critical <strong>for</strong> juvenile salmon <strong>to</strong> have access <strong>to</strong><br />
cool water during intervals <strong>of</strong> warm water temperatures and <strong>to</strong> shelter from frazil ice<br />
during winter.<br />
Once Task 20.2.1 is completed, connectivity limitations can be identified and<br />
prioritized.<br />
20.2.3 Undertake Stream Connectivity Improvements <strong>for</strong> Juvenile and Adult<br />
Atlantic Salmon<br />
Once Tasks 20.1.3, 20.1.4, 20.2.1, and 20.2.2 are completed, resources can be<br />
allocated and stream connectivity problems <strong>for</strong> juvenile and adult Atlantic salmon<br />
remediated.<br />
20.3.1 Determine Stream Connectivity Limitations <strong>for</strong> Juvenile and Adult<br />
Alewife and American Eel within 50 years<br />
PRFP Page 79
Results <strong>of</strong> Tasks 20.1.3 and 20.2.2 should provide <strong>the</strong> bulk <strong>of</strong> necessary in<strong>for</strong>mation<br />
<strong>to</strong> identify and prioritize stream connectivity limitations <strong>for</strong> alewife and American eel.<br />
20.3.2 Undertake Stream Connectivity Improvements <strong>for</strong> Juvenile and Adult<br />
Alewife and American Eel<br />
Once tasks 20.1.3, 20.1.4, 20.2.1, 20.2.2, and 20.3.1 are completed, resources can<br />
be allocated and stream connectivity problems <strong>for</strong> juvenile and adult alewife and<br />
American eel remediated.<br />
21.1.1 Develop a Memorandum <strong>of</strong> Understanding (MOU) with MDIFW <strong>for</strong><br />
Selectively Removing Non-Native/Undesirable Fish Species at Fishway<br />
Passage Trapping Locations Prior <strong>to</strong> Removal <strong>of</strong> <strong>the</strong> Veazie and Great Works<br />
Dams<br />
An MOU between MDIFW and MDMR is needed <strong>to</strong> identify which non-native and<br />
undesirable fish species are <strong>to</strong> be removed from <strong>the</strong> Penobscot River at <strong>the</strong> Veazie<br />
and Mattaceunk fishway traps. If traps are installed at o<strong>the</strong>r fishways, <strong>the</strong>n MOUs<br />
need <strong>to</strong> be developed <strong>for</strong> <strong>the</strong>se trappings locations.<br />
21.1.2 Develop a Memorandum <strong>of</strong> Understanding (MOU) with MDIFW <strong>for</strong><br />
Selectively Removing Non-Native/Undesirable Fish Species at <strong>the</strong> Mil<strong>for</strong>d Fish<br />
Lift Sorting Facility (Post Veazie and Great Works Dam Removals)<br />
An MOU between MDIFW and MDMR is needed <strong>to</strong> identify which non-native and<br />
undesirable fish species are <strong>to</strong> be removed from <strong>the</strong> Penobscot River at <strong>the</strong> Mil<strong>for</strong>d<br />
fish lift sorting facility after <strong>the</strong> Veazie and Great Works dams are removed.<br />
Specifics will be outlined in <strong>the</strong> Mil<strong>for</strong>d Fish Lift Operating Pro<strong>to</strong>cols developed in<br />
Task 19.1.6.<br />
21.1.3 Establish List <strong>of</strong> Non-Native/Undesirable Fish Species and Pro<strong>to</strong>cols <strong>for</strong><br />
Removing or Allowing Passage at Fish Passage Facility Trapping Locations<br />
Non-native and undesirable fish species can be trapped at fishway traps as part <strong>of</strong><br />
fish enumeration and brood s<strong>to</strong>ck collection operations. To prevent unintentional<br />
range expansion <strong>of</strong> non-native and undesirable fish species located downstream <strong>of</strong><br />
fishway traps but not upstream, a list <strong>of</strong> fish species <strong>to</strong> be removed and pro<strong>to</strong>cols <strong>for</strong><br />
removal will be established. For non-native and undesirable fish species already<br />
present upstream <strong>of</strong> trapping locations, pro<strong>to</strong>cols <strong>for</strong> removing or allowing passage<br />
will be established.<br />
21.1.4 Undertake with O<strong>the</strong>r Resource Agencies Risk Assessments <strong>of</strong> Range<br />
Expansion <strong>for</strong> Non-Native/Undesirable Fish Species<br />
Installing and/or operating fish passage facilities without appropriate controls can<br />
increase range expansion <strong>of</strong> non-native/undesirable fish species. This task is a<br />
placeholder within <strong>the</strong> Passage and Connectivity section. See Section 4 “Non-<br />
Native Species Including Nor<strong>the</strong>rn Pike”, Tasks 23.1.2 and 23.1.3 <strong>for</strong> specific<br />
deliverables.<br />
PRFP Page 80
21.1.5 Develop Memorandum <strong>of</strong> Understandings with Resource Agencies and<br />
Fish Passage Facility Opera<strong>to</strong>rs <strong>to</strong> Prevent Upstream Movements <strong>of</strong> Non-<br />
Native/Undesirable Fish Species<br />
Once Tasks 21.1.3 and 21.1.4 are complete, agreements with resource agencies<br />
and fish passage facility opera<strong>to</strong>rs will be instituted at fish passage facilities where<br />
traps are currently being operated.<br />
21.2.1 Assess with O<strong>the</strong>r Resource Agencies <strong>the</strong> Need <strong>for</strong> Physical and/or<br />
Temporal Modifications <strong>to</strong> Fish Passage Facilities<br />
Structural modifications <strong>to</strong> existing fish passage facilities and/or temporal operation<br />
can lessen <strong>the</strong> opportunity <strong>for</strong> range expansion <strong>of</strong> non-native/undesirable fish<br />
species. However, modifications and/or temporal operation can impact movements<br />
<strong>of</strong> target res<strong>to</strong>ration species. This task is a placeholder within <strong>the</strong> Passage and<br />
Connectivity section. See Section 4 “Non-Native Species Including Nor<strong>the</strong>rn Pike”,<br />
Tasks 23.1.1.1, 23.1.1.3 and 23.1.1.3 <strong>for</strong> specific deliverables.<br />
21.2.2 Obtain Funding <strong>to</strong> Trap or Seasonally/Permanently Modify Fish Passage<br />
Facilities <strong>to</strong> Prevent Upstream Movement <strong>of</strong> Non-Native/Undesirable Fish<br />
Species<br />
Once risks assessments and <strong>the</strong> need <strong>for</strong> physical and/or temporal modifications <strong>to</strong><br />
fish passage facilities are completed (Tasks 21.1.4 and 21.2.1), it may be necessary<br />
<strong>to</strong> seasonally modify or trap fish passage facilities <strong>to</strong> prevent upstream movements<br />
<strong>of</strong> non-native/undesirable fish species. At o<strong>the</strong>r fish passage facilities, it may be<br />
necessary <strong>to</strong> permanently modify <strong>the</strong>m <strong>to</strong> prevent upstream movements <strong>of</strong> nonnative/undesirable<br />
fish species. Specific mechanisms <strong>to</strong> fund modifications or traps<br />
will be identified should modifications or trapping <strong>of</strong> fish passage facilities be<br />
deemed necessary.<br />
References<br />
Abbott, A. 2008. Maine Road-Stream Crossing Survey Manual. Gulf <strong>of</strong> Maine<br />
Coastal Program. U. S. Fish and Wildlife Service. Falmouth, Maine. 27 pp.<br />
FERC (Federal Energy Regula<strong>to</strong>ry Commission). 2004. Handbook <strong>for</strong> hydroelectric<br />
project licensing and 5 MW exemptions from licensing. Federal Energy<br />
Regula<strong>to</strong>ry Commission, Washing<strong>to</strong>n, D.C.<br />
Hotchkiss, R. H. and C. M. Frei. 2007. Design <strong>for</strong> Fish Passage at Roadway-Stream<br />
Crossings: Syn<strong>the</strong>sis Report. Office <strong>of</strong> Infrastructure Research and<br />
Development. Turner-Fairbank Highway Research Center. Federal Highway<br />
Administration. McLean, VA.<br />
MDOT (Maine Department <strong>of</strong> Transportation). 2008. Waterway and wildlife crossing<br />
policy and design guide. Third edition. Maine Department <strong>of</strong> Transportation,<br />
Augusta, ME. 122 pp.<br />
PRFP Page 81
MFS (Maine Forest Service). 2008. 2007 Lower Penobscot River stream barrier<br />
surveys. In partnership with <strong>the</strong> U. S. Fish and Wildlife Service Gulf <strong>of</strong> Maine<br />
Coastal Program. Maine Forest Service, Augusta, ME<br />
MFS (Maine Forest Service). 2004. Best Management Practices <strong>for</strong> Forestry:<br />
Protecting Maine’s Water Quality. Maine Forest Service, Augusta, ME. 92 pp.<br />
NRC (National Research Council). 2004. Atlantic salmon in Maine. National<br />
Academy Press. Washing<strong>to</strong>n, D.C. 275 pp.<br />
Project SHARE. 2004. BMP Guidelines <strong>for</strong> Roads in Atlantic Salmon Watersheds.<br />
<strong>Res<strong>to</strong>ration</strong> Working Group, Cherryfield, Maine, by Kleinschmidt Associates,<br />
Pittsfield, Maine.<br />
Stream-Simulation Group, USDA Forest Service. 2008. Stream Simulation: An<br />
Ecological Approach <strong>to</strong> Providing Passage <strong>for</strong> Aquatic Organisms at Road-<br />
Stream Crossings. U.S. Department <strong>of</strong> Agriculture, Forest Service, San Dimas<br />
Technology and Development Center. San Dimas, CA.<br />
USFWS (U.S. Fish and Wildlife Service). 2004a. Atlas <strong>of</strong> surveyed road crossings in<br />
<strong>the</strong> Kenduskeag Stream subdrainage. USFWS, East Orland, ME<br />
USFWS (U.S. Fish and Wildlife Service). 2004b. Surveyed road crossings and dams<br />
in <strong>the</strong> Piscataquis River drainage. USFWS, East Orland, ME<br />
PRFP Page 82
Section 3 - Habitat<br />
PRFP Page 83
Authors: Greg Mackey, Gail Wippelhauser and Melissa Laser<br />
Introduction<br />
Habitat is defined as an ecological or environmental area that is inhabited by a<br />
particular species; it is <strong>the</strong> natural environment in which an organism lives, or <strong>the</strong><br />
physical environment that surrounds a species. For <strong>the</strong> purposes <strong>of</strong> this operational<br />
plan we consider characteristics <strong>of</strong> <strong>the</strong> water (e.g. quantity, velocity, temperature,<br />
dissolved and suspended inorganic or organic material) and <strong>the</strong> physical structure <strong>of</strong><br />
<strong>the</strong> basin (e.g. width, depth, substrate type, substrate complexity, gradient) as<br />
important components <strong>of</strong> fish habitat <strong>to</strong> be protected or res<strong>to</strong>red.<br />
The Strategic <strong>Plan</strong> identified man-made barriers that prevented access <strong>to</strong> spawning<br />
habitat as <strong>the</strong> major reason <strong>for</strong> <strong>the</strong> decline <strong>of</strong> diadromous fish populations in <strong>the</strong><br />
Penobscot River. These barriers also have secondary impacts, because <strong>the</strong>y alter<br />
<strong>the</strong> movement <strong>of</strong> water, sediment, and organic material through <strong>the</strong> watershed.<br />
Goals and objectives related <strong>to</strong> barriers are presented under Passage and<br />
Connectivity.<br />
The Strategic <strong>Plan</strong> identified impaired water quality on <strong>the</strong> mainstem as an important<br />
habitat issue, and species that spend most <strong>of</strong> <strong>the</strong>ir time in this area are at particular<br />
risk. For example, a large coal tar deposit is adjacent <strong>to</strong> a shortnose sturgeon<br />
overwintering area in Bangor, and mercury from <strong>the</strong> HoltraChem site in Orring<strong>to</strong>n<br />
has bioaccumulated in <strong>to</strong>mcod. These pollutants may have less <strong>of</strong> an impact on life<br />
stages or species that spend less time in <strong>the</strong> lower river, <strong>for</strong> example, juvenile shad<br />
that feed on plank<strong>to</strong>n <strong>for</strong> a few months or salmon smolts that emigrate in a few<br />
weeks. In contrast, water quality in tributaries where Atlantic salmon spawn may be<br />
more impacted by past and present <strong>for</strong>estry practices. Although water quality has<br />
been identified as an important issue, <strong>the</strong> Maine Department <strong>of</strong> Environmental<br />
Protection (MDEP) has statu<strong>to</strong>ry authority <strong>for</strong> maintaining or improving <strong>the</strong> quality <strong>of</strong><br />
Maine’s surface waters.<br />
Background<br />
In time, a basin-wide watershed assessment will be conducted focusing on<br />
watershed processes (adapted from Roni et al. 2002).<br />
Watershed process Examples <strong>of</strong> assessment methods<br />
Sediment supply and erosion<br />
• Inven<strong>to</strong>ry sediment sources and calculate<br />
sediment budgets<br />
• Inven<strong>to</strong>ry roads <strong>for</strong> landslide hazard; list<br />
sites requiring res<strong>to</strong>ration work<br />
PRFP Page 84
Hydrology<br />
Riparian and organic inputs<br />
Nutrients<br />
Light and heat inputs<br />
• Map surface erosion hazards (road<br />
surfaces and soils)<br />
• Inven<strong>to</strong>ry areas where boulders have been<br />
removed from streams<br />
• Assess changes in hydrologic regime due <strong>to</strong><br />
increased impervious surface areas<br />
• Assess changes in peak flows resulting from<br />
rain-on-snow and extension <strong>of</strong> drainage<br />
networks by road ditches<br />
• Assess connectivity <strong>of</strong> wetlands, sloughs, and<br />
stream channels<br />
• Map riparian <strong>for</strong>est conditions <strong>to</strong> locate areas<br />
<strong>of</strong> low woody debris availability<br />
• Assess his<strong>to</strong>rical riparian vegetation including<br />
land use and fire his<strong>to</strong>ry <strong>to</strong> understand<br />
changes in woody debris and organic matter<br />
inputs<br />
• Assess inorganic nutrient inputs based on<br />
geologic mapping<br />
• Assess current and his<strong>to</strong>rical diadromous fish<br />
escapement <strong>to</strong> examine changes in marinederived<br />
nutrients<br />
• Assess current and his<strong>to</strong>rical shading <strong>to</strong><br />
estimate changes in stream temperature<br />
• Assess dams and o<strong>the</strong>r structures <strong>for</strong> changes<br />
in stream temperatures.<br />
The general approach is <strong>to</strong> review data from previously surveyed river reaches and<br />
use GIS technology <strong>to</strong> identify, map, and assess critical habitat <strong>for</strong> each species, <strong>to</strong><br />
prioritize actions that will protect unimpaired habitat or res<strong>to</strong>re impaired habitats, and<br />
<strong>to</strong> carry out <strong>the</strong>se actions within 40 years. Habitat res<strong>to</strong>ration and protection<br />
priorities are based on <strong>the</strong> Strategic <strong>Plan</strong> and Roni et al. (2002). Higher priority<br />
actions achieve <strong>the</strong> fastest response, are long-lasting, have a high probability <strong>of</strong><br />
success, and impact <strong>the</strong> greatest number <strong>of</strong> species.<br />
Goals, Objectives and Strategies<br />
Goal: Res<strong>to</strong>re and maintain a healthy aquatic ecosystem that conserves native<br />
biodiversity, manages or prevents <strong>the</strong> invasion <strong>of</strong> non-native aquatic species,<br />
increases <strong>the</strong> natural recruitment <strong>of</strong> fish, and improves aquatic habitat.<br />
PRFP Page 85
22.0 Objective: Protect or res<strong>to</strong>re critical habitat <strong>for</strong> diadromous fish (spawning,<br />
nursery, feeding, overwintering) within 40 years.<br />
Measure: Complete 50% <strong>of</strong> necessary habitat identification, mapping, and<br />
assessment in all subwatersheds in five years, 75% in 15 years, and 100% in 25<br />
years.<br />
• Measure: Develop multi-species habitat protection and res<strong>to</strong>ration plan in five<br />
years with a focus on key sub-drainages or river reaches targeted <strong>for</strong> earliest<br />
res<strong>to</strong>ration.<br />
• Measure: Complete 10% <strong>of</strong> res<strong>to</strong>ration projects in 10 years, 20% in 20 years,<br />
50% in 30 years, 70% in 40 years, and 100% in 50 years. 17<br />
• Measure: Improve current method <strong>of</strong> environmental review (hydropower review,<br />
DOT projects, MNPDES permits within 5 years.<br />
22.1 Strategy: Expand USFWS barrier model by adding existing layers<br />
(habitat his<strong>to</strong>rically and currently used by each species, water quality<br />
classifications, point source discharges, non-native species) within two<br />
years.<br />
22.2 Strategy: Develop GIS model(s) <strong>to</strong> predict <strong>the</strong> location and amount <strong>of</strong><br />
Atlantic salmon habitat in <strong>the</strong> watershed within 3 years and verify model(s)<br />
with existing on-<strong>the</strong>- ground surveys.<br />
22.3 Strategy: Conduct expanded DMR “Big River” physical habitat surveys<br />
on stratified random sample <strong>of</strong> habitat types within five years <strong>to</strong> provide data<br />
<strong>to</strong> verify <strong>the</strong> salmon GIS model(s).<br />
22.4 Strategy: Maintain or expand water temperature measurements in<br />
salmon habitat over <strong>the</strong> next five years, but incorporate in<strong>to</strong> a unified plan <strong>for</strong><br />
<strong>the</strong> basin.<br />
22.5 Strategy: For 11 o<strong>the</strong>r species conduct studies (e.g. telemetry) or<br />
survey (e.g. visual or audi<strong>to</strong>ry) <strong>to</strong> identify spawning, nursery, feeding, and<br />
overwintering habitat as appropriate, and incorporate in<strong>to</strong> USFWS barrier<br />
model within five years.<br />
22.6 Strategy: Prioritize res<strong>to</strong>ration projects <strong>for</strong> each species per Roni et al.<br />
(2002):<br />
a. Protect unimpaired habitat.<br />
b. Reconnect isolated habitats.<br />
c. Improve/remove roads that alter hydrology, sediment, organic<br />
material.<br />
d. Increase nutrients <strong>to</strong> salmon waters if levels are low.<br />
e. Res<strong>to</strong>re riparian processes (shade, sediment s<strong>to</strong>rage, water<br />
s<strong>to</strong>rage, bank stabilization, stream complexity).<br />
f. Res<strong>to</strong>re instream habitat (woody debris, boulders).<br />
22.7 Strategy: Revisit <strong>the</strong> water management plan <strong>for</strong> <strong>the</strong> one major water<br />
control structure in <strong>the</strong> drainage Grand Lake Matagamon<br />
a. Determine how <strong>the</strong> existing plan affects habitat availability,<br />
geomorphic and hydrologic functions in <strong>the</strong> East Branch.<br />
17 See Passage and connectivity <strong>for</strong> schedule <strong>for</strong> barrier projects.<br />
PRFP Page 86
22.8 Strategy: Undertake an IFIM <strong>to</strong> pinpoint seasonally habitat protective flows<br />
22.9 Strategy: In priority areas, remove or repair roads that impair watershed<br />
processes.<br />
22.10 Strategy: In priority areas, increase productivity <strong>of</strong> salmon habitat by res<strong>to</strong>ring<br />
diadromous fish (assuming habitat is suitable <strong>for</strong> o<strong>the</strong>r diadromous species).<br />
22.11 Strategy: In priority areas, res<strong>to</strong>re riparian processes.<br />
22.12 Strategy: In priority areas, increase stream complexity in low large wood<br />
areas or known boulder removal areas. Increase stream complexity in 20 % <strong>of</strong> 1<br />
sub-basin’s streams 2-7 m in width in 10 years, 20 % <strong>of</strong> ano<strong>the</strong>r sub-basin’s<br />
streams 2-7 m in width in 20 years, and 20 % <strong>of</strong> a third sub-basin’s streams 2-7<br />
m in width in 10 years.<br />
22.13 Strategy: Use <strong>the</strong> PITS model <strong>to</strong> help set res<strong>to</strong>ration goals and <strong>to</strong> help identify<br />
and prioritize res<strong>to</strong>ration opportunities<br />
Work <strong>Plan</strong> Table<br />
The budget includes funding <strong>for</strong> two full-time Biologists, two full time Biology<br />
Specialists and two seasonal Conservation Aides. Budget is estimated <strong>for</strong> 2010-<br />
2014.<br />
No. Action Timeline Responsibility Budget<br />
22.1 Expand USFWS barrier model <strong>to</strong><br />
include o<strong>the</strong>r species and variables<br />
(<strong>to</strong> serve as model <strong>for</strong> prioritization)<br />
22.1.1 Assemble and assess water quality<br />
data <strong>to</strong> determine potential<br />
productivity <strong>of</strong> lacustrine and<br />
riverine habitat <strong>for</strong> diadromous<br />
fishes.<br />
22.2 Develop GIS models <strong>for</strong> predicting<br />
salmon habitat<br />
22.2.1 Use GIS model(s) <strong>to</strong> predict <strong>the</strong><br />
location and amount <strong>of</strong> Atlantic<br />
salmon habitat.<br />
22.3 Conduct DMR BSRFH “Big<br />
River”Field survey<br />
22.3.1 Use "Big River" field data from <strong>to</strong><br />
validate model output.<br />
22.3.2 Define sampling frame <strong>for</strong> Big<br />
River surveys based on stream<br />
types, size, gradient, geographic<br />
location.<br />
22.4 Maintain or expand temperature<br />
moni<strong>to</strong>ring<br />
22.4 Use available temperature data <strong>to</strong><br />
evaluate potential interactions <strong>of</strong><br />
Atlantic salmon with non-native<br />
invasive species<br />
2009 USFWS $0<br />
2010 DMR/DEP $0<br />
2009 USFWS/NOAA $0<br />
2009 USFWS/NOAA $0<br />
2010-2012 DMR $120,000<br />
2010-2012 DMR $6,204<br />
2010-2012 DMR $6,204<br />
Annual DMR $25,000<br />
Annual DMR $0<br />
PRFP Page 87
22.4 Use additional in<strong>for</strong>mation and<br />
data <strong>to</strong> indicate habitat quality<br />
(temperature, gradients, drainage<br />
area etc.).<br />
22.4 and<br />
22.5<br />
Review or acquire baseline water<br />
chemistry data in all critical<br />
habitats.<br />
22.5 Condcut studies <strong>for</strong> o<strong>the</strong>r species<br />
<strong>to</strong> identify habitat<br />
22.6 Develop method <strong>to</strong> assess key<br />
qualitative habitat features<br />
(embeddedness, substrate type,<br />
large wood, etc.) and<br />
systematically address <strong>the</strong>se<br />
ideas.<br />
22.6 Establish team <strong>to</strong> develop<br />
watershed assessment plan<br />
2010 DMR $0<br />
2011 DMR $0<br />
2009-2014 DMR $250,000<br />
2009-2014 DMR $250,000<br />
2010 DMR and partners $0<br />
22.6 Develop habitat<br />
protection/res<strong>to</strong>ration plan<br />
2011+ DMR and partners $25,000<br />
22.6 Conduct a basin-wide watershed<br />
assessment per Roni et al.( 2002).<br />
2009-2014 DMR $250,000<br />
22.6.1 Examine <strong>the</strong> fac<strong>to</strong>rs limiting<br />
Atlantic salmon juvenile production<br />
at Katahdin Iron Works area on <strong>the</strong><br />
Pleasant River.<br />
2010 DMR $0<br />
22.7 Revisit <strong>the</strong> water management plan<br />
<strong>for</strong> <strong>the</strong> one major water<br />
control structure in <strong>the</strong> drainage<br />
$0<br />
Grand Lake Matagamon 2010 DMR/DEP<br />
22.8 Undertake an IFIM <strong>to</strong><br />
pinpoint seasonally habitat<br />
protective flows<br />
2010 DMR $0<br />
22.9 Remove or repair roads that impair Annaul<br />
watershed processes<br />
DMR/DOT/MFS $1,000,000<br />
22.10 Support studies <strong>of</strong> MDN inputs <strong>to</strong><br />
<strong>the</strong> basin (see Issue 7)<br />
Annual DMR/NOAA $0<br />
22.11 Identify areas <strong>for</strong> riparian <strong>for</strong>est<br />
improvement and pursue<br />
improvements.<br />
22.11 and<br />
22.12<br />
Complete res<strong>to</strong>ration/protection<br />
projects<br />
22.12 Increase complexity by adding<br />
large wood or boulders<br />
22.12.1 Predict LWD loadings in o<strong>the</strong>r<br />
streams using an LWD loading<br />
model based on <strong>for</strong>est stand data,<br />
environmental variables, and<br />
s<strong>to</strong>chastic events.<br />
22.13 Use PITS model <strong>to</strong> set res<strong>to</strong>ration<br />
goals<br />
Annual DMF/IFW/MFS $25,000<br />
Annual DMR/NGOs $2,500,000<br />
Annual DMR/IFW/MFS $500,000<br />
2010 DMR/USFS/MFS $45,000<br />
2010 NOAA $0<br />
PRFP Page 88
Work <strong>Plan</strong> Narratives<br />
22.1 Expand USFWS barrier model by adding existing layers.<br />
22.2 Develop GIS model(s) <strong>to</strong> predict <strong>the</strong> location and amount <strong>of</strong> Atlantic<br />
salmon habitat in <strong>the</strong> watershed within 3 years.<br />
In smaller watersheds, salmon habitat typically has been mapped and identified by<br />
foot or boat survey or on-<strong>the</strong>-water surveys. This approach is not practical <strong>for</strong> <strong>the</strong><br />
Penobscot watershed, which is <strong>the</strong> largest in Maine. The development <strong>of</strong> GIS<br />
model(s) <strong>to</strong> predict <strong>the</strong> location and amount <strong>of</strong> Atlantic salmon habitat will provide<br />
more in<strong>for</strong>mation faster (with estimates <strong>of</strong> precision) at lower cost than surveys <strong>of</strong><br />
<strong>the</strong> entire watershed. Model out puts will be verified with existing data.<br />
22.3 Conduct expanded DMR “Big River” physical habitat surveys <strong>to</strong> provide<br />
data <strong>to</strong> verify <strong>the</strong> salmon GIS model(s).<br />
Field surveys <strong>of</strong> habitat should continue <strong>to</strong> use <strong>the</strong> DMR BSRFH “Big River” habitat<br />
survey method and focus on waters <strong>of</strong> importance <strong>to</strong> salmon management, but also<br />
focus on surveying a diversity <strong>of</strong> stream types (size, gradient, geographic location).<br />
Expand <strong>the</strong> survey <strong>to</strong> include observation on large wood, connectivity,<br />
embeddedness, substrate type, etc. This will help managers understand <strong>the</strong> scope<br />
and frequency <strong>of</strong> habitat across various stream types. Such surveys will also help <strong>to</strong><br />
validate modeling ef<strong>for</strong>ts, providing more and faster habitat in<strong>for</strong>mation with<br />
estimates <strong>of</strong> precision at lower cost. A sampling plan <strong>for</strong> habitat survey will be<br />
established by biologists familiar with <strong>the</strong> basin and with <strong>the</strong> GIS habitat model.<br />
Such a survey may include stream reaches randomly chosen <strong>for</strong> a defined sampling<br />
frame. On an annual basis, a portion <strong>of</strong> each summer will be allotted <strong>to</strong> habitat<br />
survey, with balance between habitat assessment and survey.<br />
22.4 Maintain or expand water temperature measurements in salmon habitat.<br />
Water temperature moni<strong>to</strong>ring in <strong>the</strong> Penobscot basin falls within a larger state-wide<br />
water temperature moni<strong>to</strong>ring plan <strong>for</strong> Atlantic salmon waters. Recently, DMR<br />
BSRFH has been scaling back <strong>the</strong> number <strong>of</strong> temperature loggers deployed<br />
annually, and is concentrating on moni<strong>to</strong>ring key index sites and using additional<br />
loggers <strong>to</strong> rotate among sites <strong>for</strong> interest. This correlates water temperatures at new<br />
sites <strong>to</strong> <strong>the</strong> index site(s) and allows a prediction model <strong>to</strong> be constructed. Water<br />
temperature should continue <strong>to</strong> be recorded at index sites, while additional loggers<br />
shall be deployed at sites <strong>of</strong> interest. New sites may be chosen using a GTRS<br />
method. This will provide unbiased water temperature in<strong>for</strong>mation <strong>for</strong> <strong>the</strong> basin.<br />
The amount <strong>of</strong> ef<strong>for</strong>t <strong>to</strong> put in<strong>to</strong> water temperature moni<strong>to</strong>ring should be kept at or<br />
below current levels, unless a well-defined study is put <strong>for</strong>th. More ef<strong>for</strong>t should be<br />
put in<strong>to</strong> analysis and interpretation <strong>of</strong> water temperature data. Notably, a stream<br />
classification system should be finalized and put in<strong>to</strong> general use statewide.<br />
22.5 For o<strong>the</strong>r species conduct studies (e.g. telemetry, hydroacoustics) or<br />
survey (e.g. visual or audi<strong>to</strong>ry) <strong>to</strong> identify spawning, nursery, feeding, and<br />
overwintering habitat as appropriate.<br />
PRFP Page 89
Identifying and mapping important habitat <strong>for</strong> o<strong>the</strong>r diadromous species can be<br />
accomplished in a variety <strong>of</strong> ways. Acoustic telemetry is currently being used <strong>to</strong><br />
locate habitat used by shortnose and Atlantic sturgeon. American shad and<br />
blueback herring typically spawn in a few distinct areas that can be located by visual<br />
or audi<strong>to</strong>ry surveys conducted in a few days. Sea lamprey redds also can be<br />
located visually. Hydroacoustic techniques may be appropriate <strong>for</strong> rainbow smelt.<br />
Alewife spawning and nursery habitat can be assumed <strong>to</strong> be an entire lake.<br />
22.6 Prioritize res<strong>to</strong>ration projects <strong>for</strong> each species per Roni et al. (2002)<br />
Each species habitat will be examined and prioritized in order <strong>to</strong>: protect unimpaired<br />
habitat, reconnect isolated habitats, improve/remove roads that alter hydrology,<br />
sediment, organic material, increase nutrients <strong>to</strong> salmon waters if levels are low,<br />
res<strong>to</strong>re riparian processes (shade, sediment s<strong>to</strong>rage, water s<strong>to</strong>rage, bank<br />
stabilization, stream complexity) and res<strong>to</strong>re instream habitat (woody debris,<br />
boulders). The habitat objectives, measurables and tasks will require an in depth<br />
planning process <strong>to</strong> make <strong>the</strong>m operational. Assemble small team with members<br />
with watershed knowledge and watershed assessment and res<strong>to</strong>ration expertise. To<br />
conduct a watershed assessment, NGO watershed groups will be required in<br />
addition <strong>to</strong> government agencies. Formation <strong>of</strong> effective watershed NGO(s) is a<br />
prerequisite <strong>to</strong> a watershed assessment.<br />
22.7 Revisit <strong>the</strong> water management plan <strong>for</strong> <strong>the</strong> one major water<br />
control structure in <strong>the</strong> drainage Grand Lake Matagamon<br />
Determine how <strong>the</strong> existing plan affects habitat availability, geomorphic and<br />
hydrologic functions in <strong>the</strong> East Branch.<br />
22.8 Undertake an IFIM <strong>to</strong> pinpoint seasonally habitat protective flows<br />
22.9 In priority areas, remove or repair roads that impair watershed processes.<br />
Based on 22.1 and 22.6, problematic roads and road crossing will be addressed.<br />
22.10 In priority areas, increase productivity <strong>of</strong> salmon habitat by res<strong>to</strong>ring<br />
diadromous fish (assuming habitat is suitable <strong>for</strong> o<strong>the</strong>r diadromous species).<br />
This strategy ties in<strong>to</strong> Section 1 <strong>of</strong> <strong>the</strong> plan.<br />
22.11 In priority areas, res<strong>to</strong>re riparian processes.<br />
Riparian processes are closely linked <strong>to</strong> habitat complexity and water quality and are<br />
an element <strong>of</strong> lateral and vertical connectivity. Based on <strong>the</strong> land use his<strong>to</strong>ry and<br />
<strong>for</strong>est growth models, riparian <strong>for</strong>ests will be res<strong>to</strong>red. DMR will work closely with<br />
<strong>the</strong> Maine Forest Service on this strategy.<br />
22.12 In priority areas, increase stream complexity in low large wood areas or<br />
known boulder removal areas. Increase stream complexity in 20 % <strong>of</strong> 1 subbasin’s<br />
streams 2-7 m in width in 10 years, 20 % <strong>of</strong> ano<strong>the</strong>r sub-basin’s<br />
streams 2-7 m in width in 20 years, and 20 % <strong>of</strong> a third sub-basin’s streams 2-7<br />
m in width in 10 years.<br />
PRFP Page 90
Recent surveys in coastal Maine rivers have revealed that large woody debris (LWD)<br />
is at extremely low levels. A study is underway <strong>to</strong> test <strong>the</strong> effectiveness <strong>of</strong> adding<br />
LWD <strong>to</strong> salmon habitat. However, no surveys have been done in <strong>the</strong> Penobscot<br />
basin, nor in more inland Maine rivers. The Penobscot basin contains a wider array<br />
<strong>of</strong> land use activities, <strong>for</strong>est types, and landscape features than does <strong>the</strong> coastal<br />
area where previous surveys were done. There<strong>for</strong>e, per<strong>for</strong>ming LWD surveys<br />
across reaches with different stream sizes, <strong>for</strong>est stands, <strong>to</strong>pography, and land use<br />
his<strong>to</strong>ry would help link LWD loading <strong>to</strong> <strong>the</strong>se variables. Assuming a link is revealed,<br />
we can use this in<strong>for</strong>mation <strong>to</strong> predict LWSD loadings in o<strong>the</strong>r streams. One avenue<br />
that may aid in this is using an LWD loading model based on <strong>for</strong>est stand data,<br />
environmental variables, and s<strong>to</strong>chastic events. Field surveys will help validate <strong>the</strong><br />
model and allow broader inferences <strong>to</strong> be made.<br />
23.13 Use <strong>the</strong> PITS model <strong>to</strong> help set res<strong>to</strong>ration goals and <strong>to</strong> help identify<br />
and prioritize res<strong>to</strong>ration opportunities<br />
The Penobscot River <strong>Res<strong>to</strong>ration</strong> Project (PRRP) is a multimillion dollar endeavor<br />
that aims <strong>to</strong> res<strong>to</strong>re self-sustaining populations <strong>of</strong> native sea-run fish through <strong>the</strong><br />
removal <strong>of</strong> two mainstem dams and improved fish passage at numerous o<strong>the</strong>r dams<br />
on <strong>the</strong> Penobscot River. While many diadromous species will benefit from <strong>the</strong><br />
PRRP directly, o<strong>the</strong>r species such as endangered Atlantic salmon (Salmo salar),<br />
alewife (Alosa psuedoharengus), and American shad (Alosa sapidissima) may<br />
require additional habitat improvements (barrier removal, fishways, etc.) or s<strong>to</strong>cking.<br />
Thus, additional active res<strong>to</strong>ration measures may be required <strong>to</strong> realize <strong>the</strong> full<br />
potential <strong>of</strong> <strong>the</strong> PRRP. Due <strong>to</strong> <strong>the</strong> high pr<strong>of</strong>ile and high cost <strong>of</strong> <strong>the</strong> project as well as<br />
numerous state, federal and non-governmental organizations involved, <strong>the</strong>re is a<br />
need <strong>to</strong> prioritize res<strong>to</strong>ration ef<strong>for</strong>ts in <strong>the</strong> basin <strong>to</strong> increase <strong>the</strong> probability <strong>for</strong> project<br />
success. To help facilitate this goal, we have created an ecologically-based GIS <strong>to</strong>ol<br />
<strong>to</strong> help set res<strong>to</strong>ration goals and <strong>to</strong> help identify and prioritize res<strong>to</strong>ration<br />
opportunities (s<strong>to</strong>cking options, barrier removal, and fishway improvements). Initial<br />
data inputs <strong>for</strong> <strong>the</strong> model include spawning habitat <strong>for</strong> a shortened list <strong>of</strong> focal<br />
species, a habitat weighting variable, and passage barriers (location and passage<br />
state). The outputs <strong>of</strong> <strong>the</strong> model are ecologically-based targets <strong>for</strong> focal species and<br />
prioritized lists <strong>of</strong> res<strong>to</strong>ration projects based on <strong>the</strong>ir biological merits, ra<strong>the</strong>r than<br />
being selected as opportunities arise. These outputs will help ensure that<br />
res<strong>to</strong>ration ef<strong>for</strong>ts and money are targeted appropriately and that achievable goals<br />
are set.<br />
References<br />
Abbott, A. 2008. Maine Road-Stream Crossing Survey Manual. Gulf <strong>of</strong> Maine<br />
Coastal Program. U. S. Fish and Wildlife Service. Falmouth, Maine. 27 pp.<br />
Hotchkiss, R. H. and C. M. Frei. 2007. Design <strong>for</strong> Fish Passage at Roadway-Stream<br />
Crossings: Syn<strong>the</strong>sis Report. Office <strong>of</strong> Infrastructure Research and<br />
Development. Turner-Fairbank Highway Research Center. Federal Highway<br />
Administration. McLean, VA.<br />
PRFP Page 91
Roni, P., T. J. Beechie, R. E. Bilby, F. E. Leonetti, M. M. Pollock, and G. R. Pess.<br />
2002. A Review <strong>of</strong> Stream <strong>Res<strong>to</strong>ration</strong> Techniques and a Hierarchical Strategy<br />
<strong>for</strong> Prioritizing <strong>Res<strong>to</strong>ration</strong> in Pacific Northwest Watersheds. North American<br />
Journal <strong>of</strong> Fisheries Management 22:1–20.<br />
Stream-Simulation Group, USDA Forest Service. 2008. Stream Simulation: An<br />
Ecological Approach <strong>to</strong> Providing Passage <strong>for</strong> Aquatic Organisms at Road-<br />
Stream Crossings. U.S. Department <strong>of</strong> Agriculture, Forest Service, San Dimas<br />
Technology and Development Center. San Dimas, CA.<br />
PRFP Page 92
Section 4 - Non-Native species including Nor<strong>the</strong>rn pike<br />
PRFP Page 93
Authors: Authors: Melissa Laser (edi<strong>to</strong>r), Fred Seavey (USFWS), Richard Dill (MDIFW), Merry Gallagher (MDIFW), Tim<br />
Obrey (MDIFW), Jeff Reardon (Penobscot Trust), Rory Saunders (NOAA), Tara Trinko (NOAA), Joan Trial (MDMR),<br />
Peter Ruksznis (MDMR)<br />
Introduction<br />
Lack <strong>of</strong> access <strong>to</strong> habitat has been a major contribu<strong>to</strong>r <strong>to</strong> <strong>the</strong> decline <strong>of</strong> many<br />
species in <strong>the</strong> basin. This presents an enormous challenge <strong>for</strong> <strong>the</strong> resource<br />
agencies and o<strong>the</strong>r conservation interests who are actively involved in fish<br />
res<strong>to</strong>ration ef<strong>for</strong>ts, given that dams and o<strong>the</strong>r barriers such as culverts have greatly<br />
reduced <strong>the</strong> amount and accessibility <strong>of</strong> spawning and rearing habitat that once was<br />
available. These barriers also serve <strong>to</strong> restrict <strong>the</strong> natural dispersal <strong>of</strong> non-native<br />
fishes.<br />
The intentional introduction <strong>of</strong> smallmouth bass in<strong>to</strong> <strong>the</strong> watershed in <strong>the</strong> late 1860s<br />
led <strong>to</strong> its expansion throughout <strong>the</strong> watershed such that virtually every accessible,<br />
suitable habitat reach, including dozens <strong>of</strong> tributary lakes and ponds, has now been<br />
colonized and it is managed by MDIFW as a sport fish. Brown trout, an exotic<br />
species native <strong>to</strong> Europe, is s<strong>to</strong>cked by MDIFW <strong>for</strong> recreational fishing. Chain<br />
pickerel, managed by MDIFW as sport fish, were introduced in<strong>to</strong> Maine waters in <strong>the</strong><br />
1800s and have been spread legally and illegally throughout <strong>the</strong> basin. Landlocked<br />
salmon and white perch are native <strong>to</strong> <strong>the</strong> Penobscot basin, but <strong>the</strong>ir range has been<br />
artificially expanded. Numerous o<strong>the</strong>r non-native fish species have since been<br />
introduced (some intentional, some illegal, some accidental) over more recent<br />
decades, which has exacerbated <strong>the</strong> problems associated with changes in<br />
community assemblages and food web interactions. Since 1983, black crappie,<br />
green sunfish, largemouth bass, white catfish, central mudminnow and nor<strong>the</strong>rn pike<br />
have been illegally introduced in<strong>to</strong> <strong>the</strong> Penobscot basin.<br />
Goal, Objectives and Strategies<br />
Goal: Res<strong>to</strong>re and maintain a healthy aquatic ecosystem that conserves native<br />
biodiversity and manages or prevents <strong>the</strong> invasion <strong>of</strong> non-native aquatic species<br />
Objective 23: Restrict upstream passage <strong>of</strong> non-native species where risks are <strong>the</strong><br />
greatest.<br />
Measure: Identified areas <strong>of</strong> concern<br />
24.1. Strategy: Per<strong>for</strong>m risk assessments <strong>for</strong> non-native species prior <strong>to</strong><br />
changes at fishways.<br />
23.1.1 Task: Implement <strong>the</strong> management actions from <strong>the</strong> Piscataquis River<br />
Nor<strong>the</strong>rn Pike Risk assessment (see Appendix J)<br />
23.1.1.1 Third party survey <strong>of</strong> potential connections and a development<br />
<strong>of</strong> solutions between West Branch and <strong>the</strong> Pleasant (Immediate<br />
need Appendix K) - $15,000<br />
23.1.1.1.1.1 Ebeemee and <strong>the</strong> West Branch - 2009<br />
PRFP Page 94
23.1.1.1.1.2 East Branch Pond, which flows north and south <strong>to</strong><br />
Nollesemic Lake <strong>to</strong> Shad Pond <strong>to</strong> <strong>the</strong> West Branch<br />
Penobscot below two impassable dams – 2009<br />
23.1.1.2 Maintain current blockages <strong>for</strong> pike in Sebec upper and lower<br />
until phase 1 <strong>of</strong> alewife res<strong>to</strong>ration is complete and group 1<br />
American shad res<strong>to</strong>ration is complete - 2009<br />
-Develop an MOU <strong>to</strong> re-visit in 2014<br />
23.1.1.3 Investigate and maintain current blockages <strong>for</strong> pike in Schoodic<br />
lower until phase 1 <strong>of</strong> alewife res<strong>to</strong>ration is complete and group<br />
1 American shad res<strong>to</strong>ration is complete - 2009<br />
-Develop an MOU <strong>to</strong> revisit in 2014<br />
23.1.1.4 Create velocity or jump barriers <strong>for</strong> pike while allowing Atlantic<br />
salmon <strong>to</strong> pass in D-F upper and lower and Guil<strong>for</strong>d lower until<br />
phase 1 <strong>of</strong> alewife res<strong>to</strong>ration is complete and group 1<br />
American shad res<strong>to</strong>ration is complete - 2009<br />
-Develop an MOU <strong>to</strong> revisit in 2014<br />
23.1.1.5 Continue removal ef<strong>for</strong>ts at Pushaw - MDIFW cost one time<br />
$30,000 plus annual salary 2009<br />
23.1.1.6 E-fish around <strong>the</strong> known spawning areas <strong>to</strong> look <strong>for</strong> nursery<br />
areas - 2009<br />
23.1.1.7 Review current fishing regulations and develop<br />
recommendations <strong>for</strong> changes - 2009<br />
23.1.1.8 Review current education ef<strong>for</strong>ts and develop recommendations<br />
<strong>for</strong> changes – 2009<br />
23.1.1.9 Conduct a study <strong>of</strong> Pushaw Stream and Mud pond <strong>to</strong> look <strong>for</strong><br />
juvenile pike<br />
23.1.1.10 Conduct habitat surveys <strong>of</strong> <strong>the</strong> Penobscot mainstem from<br />
Mil<strong>for</strong>d <strong>to</strong> Howland <strong>to</strong> determine <strong>the</strong> spatial distribution, quantity<br />
and quality <strong>of</strong> habitat patches necessary <strong>for</strong> upstream pike<br />
dispersal.<br />
23.1.1.11 Maintain public education ef<strong>for</strong>ts highlighting <strong>the</strong> permanent<br />
repercussions and costs associated with illegal fish s<strong>to</strong>cking<br />
events – 2009<br />
23.1.1.12 Task: Design and implement a stratified random survey <strong>for</strong> nonnatives<br />
in <strong>the</strong> drainage – 2011<br />
23.1.1.13 LIDAR <strong>for</strong> <strong>the</strong> Penobscot drainage <strong>to</strong> get gradient data – 2010<br />
23.1.1.14 If feasible, install barriers between <strong>the</strong> Pleasant River and <strong>the</strong><br />
West Branch Penobscot River - 2010<br />
23.1.2 Task: Conduct a risk assessment <strong>for</strong> nor<strong>the</strong>rn pike in <strong>the</strong> rest <strong>of</strong> <strong>the</strong><br />
drainage – 2010<br />
23.1.3 Task: Identify <strong>the</strong> need <strong>for</strong> risk assessments <strong>for</strong> o<strong>the</strong>r non-native<br />
species <strong>of</strong> concern – 2010<br />
23.2 Strategy: Work with interagency technical committee, lake associations<br />
and o<strong>the</strong>r NGOs <strong>to</strong> resolve passage issues.<br />
PRFP Page 95
23.2.1 Task: Hold an annual meeting between MDIFW and MDMR about<br />
limiting s<strong>to</strong>cking <strong>of</strong> non-natives throughout <strong>the</strong> drainage – annual<br />
Objective 24: Minimize <strong>the</strong> ecological impact <strong>of</strong> non-native fishes.<br />
Measures: Maintain or reduce areas where non-native fishes are present.<br />
No future s<strong>to</strong>cking <strong>of</strong> non-native fishes.<br />
24.1. Strategy: Assess <strong>the</strong> species-specific distribution and potential ecological<br />
threats <strong>of</strong> non-native fish species within <strong>the</strong> Penobscot basin.<br />
24.1.1. Task: Classify species-specific threats based on scientific literature <strong>to</strong><br />
prioritize risk.<br />
24.1.2. Task: Conduct assessments where <strong>the</strong> literature fails <strong>to</strong> provide<br />
in<strong>for</strong>mation.<br />
24.1.3. Task: Document dispersal following smallmouth bass introductions<br />
24.1.4. Task: Document dispersal following <strong>the</strong> illegal introduction <strong>of</strong> white perch<br />
in Moosehead Lake, Spencer Bay<br />
24.1.5. Task: Work cooperatively with University <strong>of</strong> Maine on smallmouth bass<br />
removal projects<br />
24.1.6. Task: Design a study in a small reach <strong>to</strong> investigate <strong>the</strong> impacts <strong>of</strong> nonnative<br />
species removal on s<strong>to</strong>cked Atlantic salmon fry survival<br />
Objective 25: Minimize <strong>the</strong> occurrence and negative effects <strong>of</strong> invasive plants,<br />
invertebrates, and pathogens.<br />
Measures: Maintain or reduce areas where non-native species are present.<br />
25.1. Strategy: Work with MDEP <strong>to</strong> reduce <strong>the</strong> spread <strong>of</strong> invasive species.<br />
25.1.1.Task: Conduct an annual meeting with MDEP <strong>to</strong> keep up <strong>to</strong> date with<br />
issues in <strong>the</strong> drainage – Annual<br />
25.2. Strategy: Maintain bio-security program <strong>for</strong> fisheries sampling equipment<br />
25.2.1.Task: Coordinate interagency disinfection/bio-security pro<strong>to</strong>cols - 2009<br />
Work <strong>Plan</strong> Table<br />
The budget includes funding <strong>for</strong> two full-time Biologists, two full time Biology<br />
Specialists and four seasonal Conservation Aides. Budget is estimated <strong>for</strong> 2010-<br />
2014.<br />
No. Action Timeline Responsibility Budget<br />
Third party survey <strong>of</strong> potential<br />
connections and a development <strong>of</strong><br />
solutions between <strong>the</strong> West Branch<br />
23.1.1.1 Penobscot River and <strong>the</strong> Pleasant River 2009 DMR/IFW $15,000<br />
Maintain current blockages <strong>for</strong> pike in<br />
Sebec upper and lower until phase 1 <strong>of</strong><br />
alewife res<strong>to</strong>ration is complete and group<br />
23.1.1.2 1 American shad res<strong>to</strong>ration is complete 2009-2014 DMR/IFW $0<br />
PRFP Page 96
Investigate and maintain current<br />
blockages <strong>for</strong> pike in Schoodic lower until<br />
phase 1 <strong>of</strong> alewife res<strong>to</strong>ration is complete<br />
and group 1 American shad res<strong>to</strong>ration is<br />
23.1.1.3 complete.<br />
Create velocity or jump barriers <strong>for</strong> pike<br />
while allowing Atlantic salmon <strong>to</strong> pass in<br />
D-F upper and lower and Guil<strong>for</strong>d lower<br />
until phase 1 <strong>of</strong> alewife res<strong>to</strong>ration is<br />
complete and group 1 American shad<br />
2009 -2014 DMR/IFW $50,000<br />
23.1.1.4 res<strong>to</strong>ration is complete 2009 -2014 DMR/IFW $50,000<br />
23.1.1.5 Continue removal ef<strong>for</strong>ts at Pushaw Annual IFW $150,000<br />
E-fish around <strong>the</strong> known spawning areas<br />
23.1.1.6 <strong>to</strong> look <strong>for</strong> nursery areas. Annual IFW $25,000<br />
Review current fishing regulations and<br />
23.1.1.7 develop recommendations <strong>for</strong> changes. 2009-2010 DMR/IFW $0<br />
Review current education ef<strong>for</strong>ts and<br />
23.1.1.8 develop recommendations <strong>for</strong> changes.<br />
Maintain public education ef<strong>for</strong>ts<br />
highlighting <strong>the</strong> permanent repercussions<br />
and costs associated with illegal fish<br />
2009-2010 DMR/IFW $10,000<br />
23.1.1.9 s<strong>to</strong>cking events. Annual DMR/IFW $75,000<br />
Conduct a study <strong>of</strong> Pushaw Stream and<br />
23.1.1.10 Mud pond <strong>to</strong> look <strong>for</strong> juvenile pike<br />
Conduct habitat surveys <strong>of</strong> <strong>the</strong><br />
Penobscot mainstem from Mil<strong>for</strong>d <strong>to</strong><br />
Howland <strong>to</strong> determine <strong>the</strong> spatial<br />
distribution, quantity and quality <strong>of</strong><br />
habitat patches necessary <strong>for</strong> upstream<br />
2009-2011 DMR/IFW $30,000<br />
23.1.1.11 pike dispersal.<br />
Design and implement a stratified<br />
random survey <strong>for</strong> non-natives in <strong>the</strong><br />
2009-2011 DMR/IFW $30,000<br />
23.1.1.12 drainage Annual DMR/IFW $25,000<br />
LIDAR survey <strong>for</strong> gradient <strong>to</strong> get better<br />
data on potential movement <strong>of</strong> pike and<br />
23.1.1.13 location <strong>of</strong> additional natural barriers. 2010 DMR/IFW $0<br />
Conduct a risk assessment <strong>for</strong> Nor<strong>the</strong>rn<br />
23.1.3 pike in <strong>the</strong> rest <strong>of</strong> <strong>the</strong> drainage 2010 Pike Workgroup $0<br />
Identify <strong>the</strong> need <strong>for</strong> risk assessments <strong>for</strong><br />
23.1.3 o<strong>the</strong>r non-native species <strong>of</strong> concern 2010 ITC $0<br />
Hold an annual meeting between IFW<br />
and DMR about limiting s<strong>to</strong>cking <strong>of</strong> non-<br />
23.2.1 natives throughout <strong>the</strong> drainage Annual IFW/DMR $0<br />
Classify species-specific threats based<br />
24.1.1 on scientific literature <strong>to</strong> prioritize risk. 2011 Pike Workgroup $0<br />
Conduct assessments where <strong>the</strong><br />
24.1.2 literature fails <strong>to</strong> provide in<strong>for</strong>mation. 2011 ITC $0<br />
Document dispersal following smallmouth<br />
24.1.3 bass introductions by 2013 ITC $0<br />
PRFP Page 97
Document dispersal following <strong>the</strong> illegal<br />
introduction <strong>of</strong> white perch in Moosehead<br />
24.1.4 Lake, Spencer Bay by 2012 ITC $0<br />
Work cooperatively with U Maine on<br />
24.1.5 smallmouth bass removal projects<br />
Design a study in a small reach <strong>to</strong><br />
investigate <strong>the</strong> impacts <strong>of</strong> non-native<br />
species removal on s<strong>to</strong>cked Atlantic<br />
Ongoing DMR/IFW $50,000<br />
24.1.6 salmon fry survival<br />
Conduct an annual meeting with DEP <strong>to</strong><br />
keep up <strong>to</strong> date with issues in <strong>the</strong><br />
2010 DMR $10,000<br />
25.1.1 drainage Annual DMR/ITC Chair $2,000<br />
Coordinate and implement interagency<br />
25.2.1 disinfection/bio-security pro<strong>to</strong>cols Annual ITC $6,000<br />
Work <strong>Plan</strong> Narratives<br />
23.1.1. Implement <strong>the</strong> management actions from <strong>the</strong> Piscataquis River<br />
Nor<strong>the</strong>rn Pike Risk assessment (see Appendix J)<br />
The risk assessment documents <strong>the</strong> timeline <strong>of</strong> events relating <strong>to</strong> <strong>the</strong> documentation<br />
<strong>of</strong> pike and <strong>the</strong> PRRP, <strong>the</strong> ecological risk <strong>of</strong> pike on native species, patterns <strong>of</strong><br />
natural dispersal and human introductions, and focus areas <strong>for</strong> action. It concludes<br />
with management actions <strong>to</strong> reduce <strong>the</strong> impact <strong>of</strong> pike above <strong>the</strong> Howland bypass.<br />
23.1.1.1 and 23.1.1.14 Third party survey <strong>of</strong> potential connections and a<br />
development <strong>of</strong> solutions between <strong>the</strong> West Branch Penobscot River and <strong>the</strong><br />
Pleasant River (see Appendix K)<br />
Two connections between <strong>the</strong> Piscataquis and <strong>the</strong> West Branch Penobscot were<br />
identified as concerns: 1) East Branch Lake has a north and south outlet where <strong>the</strong><br />
North flows in<strong>to</strong> <strong>the</strong> West Branch Penobscot and 2) a large wetland complex<br />
separates Ebeemee Lake, Sanborn Pond and Upper Jo-Mary Lake. These need <strong>to</strong><br />
be surveyed and if feasible, install barriers between <strong>the</strong> Pleasant River and <strong>the</strong> West<br />
Branch Penobscot River.<br />
23.1.1.2 Maintain current blockages <strong>for</strong> pike in Sebec upper and lower until<br />
phase 1 <strong>of</strong> alewife res<strong>to</strong>ration is complete and group 1 American shad<br />
res<strong>to</strong>ration is complete<br />
The Sebec and Milo projects are both FERC-regulated, but were issued exemptions<br />
from licensing back in <strong>the</strong> 1980's. At <strong>the</strong> time, no conditions <strong>for</strong> fish passage were<br />
provided by <strong>the</strong> agencies, and are not included in <strong>the</strong> FERC orders <strong>for</strong> <strong>the</strong> projects,<br />
as is <strong>the</strong> case with most o<strong>the</strong>r more-recently issued exemptions (or licenses). At this<br />
time it is suggested that <strong>the</strong>se barriers remain in place until alewife and shad<br />
res<strong>to</strong>ration begin actively in this sub-watershed.<br />
23.1.1.3 Investigate and maintain current blockages <strong>for</strong> pike in Schoodic lower<br />
until phase 1 <strong>of</strong> alewife res<strong>to</strong>ration is complete and group 1 American shad<br />
res<strong>to</strong>ration is complete<br />
PRFP Page 98
The dam at Schoodic Lake has a 6’ dam with three gates – but at high water it may<br />
be passable. The dam should be assessed <strong>for</strong> passage and potentially altered <strong>to</strong><br />
limit passage until alewife and shad res<strong>to</strong>ration begin actively in this sub-watershed.<br />
23.1.1.4 Create velocity or jump barriers <strong>for</strong> pike while allowing Atlantic<br />
salmon <strong>to</strong> pass in D-F upper and lower and Guil<strong>for</strong>d lower until phase 1 <strong>of</strong><br />
alewife res<strong>to</strong>ration is complete and group 1 American shad res<strong>to</strong>ration is<br />
complete<br />
Three main stem dams, Brown's Mill (Dover-Foxcr<strong>of</strong>t Lower), Moosehead<br />
Manufacturing (Dover-Foxcr<strong>of</strong>t Upper), and Guil<strong>for</strong>d (Interface), exist. All three have<br />
vertical slot fishways. Only Brown’s Mill has both upstream and downstream<br />
passage, although all three have upstream passage. The two dams in Dover-<br />
Foxcr<strong>of</strong>t are hydro-electric facilities. At this time it is suggested that <strong>the</strong>se fishways<br />
be altered with a jump barrier that still passes Atlantic salmon until alewife and shad<br />
res<strong>to</strong>ration begin actively in this sub-watershed.<br />
23.1.1.5 and 23.1.1.6 and 23.1.1.10 Continue ef<strong>for</strong>ts in Pushaw drainage.<br />
This ef<strong>for</strong>t is ongoing. Spring removal ef<strong>for</strong>ts have been conducted <strong>for</strong> three years<br />
(2006-08) with some success. Night gill netting in <strong>the</strong> Pushaw Stream <strong>to</strong> target<br />
spawning pike was attempted in 2008, but unsuccessful. One day <strong>of</strong> gill netting was<br />
attempted in summer <strong>of</strong> 2006 in <strong>the</strong> deep hole around Mag's ledge, with zero pike<br />
captured. Fall trap netting and boat electr<strong>of</strong>ishing was conducted in 2005 and 2008<br />
in an attempt <strong>to</strong> capture pike <strong>for</strong> radio tagging --- unsuccessful. E-fish around <strong>the</strong><br />
known spawning areas <strong>to</strong> look <strong>for</strong> nursery areas. Conduct a study <strong>of</strong> Pushaw Stream<br />
and Mud Pond <strong>to</strong> look <strong>for</strong> juvenile pike<br />
23.1.1.7 Review current fishing regulations and develop recommendations <strong>for</strong><br />
changes.<br />
IFW continues <strong>to</strong> explore all management practices that may negatively impact <strong>the</strong><br />
pike population at Pushaw. This includes no management <strong>of</strong> pike that would benefit<br />
or promote a sport fishery <strong>for</strong> pike in <strong>the</strong> watershed. This ef<strong>for</strong>t should expand <strong>to</strong> <strong>the</strong><br />
drainage as a whole.<br />
23.1.1.8 and 23.1.1.9 Review current education ef<strong>for</strong>ts and develop<br />
recommendations <strong>for</strong> changes.<br />
In winter 2006, signs were placed around Pushaw Lake and Mud Pond at public<br />
access points. Signs were also placed at local bait and tackle shops. In<br />
spring/summer 2006 signs were placed at boat launches along <strong>the</strong> Penobscot and<br />
Stillwater River advising anglers <strong>to</strong> be on <strong>the</strong> lookout <strong>for</strong> pike. These signs have<br />
produced some reportings, but follow up has resulted in no confirmation. In 2009<br />
signs will once again be placed (or replaced) Pushaw Lake, Mud Pond, Little<br />
Pushaw Lake, Pushaw Stream and at boat launches along <strong>the</strong> Penobscot and<br />
Stillwater River asking anglers <strong>to</strong> keep all pike if <strong>the</strong>y catch <strong>the</strong>m and <strong>to</strong> notify MIFW.<br />
Biological staff from both agencies have given presentations about <strong>the</strong> Pushaw Lake<br />
pike removal ef<strong>for</strong>ts, risks <strong>of</strong> illegal introductions, and <strong>the</strong> risk <strong>of</strong> pike <strong>to</strong> <strong>the</strong> upper<br />
Penobscot watershed <strong>to</strong> numerous local NGO's / grass roots organizations. Maintain<br />
PRFP Page 99
public education ef<strong>for</strong>ts highlighting <strong>the</strong> permanent repercussions and costs<br />
associated with illegal fish s<strong>to</strong>cking events.<br />
23.1.1.11 Conduct habitat surveys <strong>of</strong> <strong>the</strong> Penobscot mainstem from Mil<strong>for</strong>d <strong>to</strong><br />
Howland <strong>to</strong> determine <strong>the</strong> spatial distribution, quantity and quality <strong>of</strong> habitat<br />
patches necessary <strong>for</strong> upstream pike dispersal.<br />
23.1.1.12 Design and implement a stratified random survey <strong>for</strong> non-natives in<br />
<strong>the</strong> drainage<br />
Sampling natural systems <strong>for</strong> management requires unbiased and spatially<br />
distributed sampling, with samples spaced relatively evenly in space. Sampling<br />
must balance trend and status data collection goals. In addition, sampling should<br />
allow <strong>for</strong> greater emphasis (sampling) ef<strong>for</strong>t within certain areas depending on needs<br />
<strong>of</strong> biologists and managers. Finally, sampling must be flexible <strong>to</strong> allow un-sampled<br />
sites <strong>to</strong> be accounted <strong>for</strong>, and <strong>to</strong> add sites as needed. This requires a probability<br />
sampling approach. Without probability sampling we cannot understand how<br />
samples represent <strong>the</strong> “real world’ and are likely <strong>to</strong> collect biased data that may<br />
result in incorrect conclusions and in<strong>for</strong>m poor management decisions. Clearly, this<br />
is vital <strong>for</strong> effective adaptive management. Fur<strong>the</strong>rmore, collecting data under a<br />
unified probability sampling plan with standardized pro<strong>to</strong>cols will greatly increase<br />
statistical power <strong>for</strong> <strong>the</strong> same level <strong>of</strong> sampling ef<strong>for</strong>t, allowing biologists <strong>to</strong> more<br />
powerfully analyze large spatial and temporal trends and status. Finally, <strong>the</strong><br />
sampling plan <strong>for</strong> <strong>the</strong> Penobscot should be integrated with a larger state-wide<br />
sampling plan <strong>to</strong> increase statistical power and optimize <strong>the</strong> value <strong>of</strong> limited<br />
sampling capacity.<br />
23.1.1.13 LIDAR survey <strong>for</strong> gradient <strong>to</strong> get better data on potential movement<br />
<strong>of</strong> pike and location <strong>of</strong> additional natural barriers.<br />
23.1.2 Conduct a risk assessment <strong>for</strong> Nor<strong>the</strong>rn pike in <strong>the</strong> rest <strong>of</strong> <strong>the</strong> drainage<br />
Replicate <strong>the</strong> process that was undertaken on <strong>the</strong> Piscataquis drainage, particularly<br />
in <strong>the</strong> area above West Enfield.<br />
23.1.3 and 24.1.1 and 24.1.2 Identify <strong>the</strong> need <strong>for</strong> risk assessments <strong>for</strong> o<strong>the</strong>r<br />
non-native species <strong>of</strong> concern<br />
Since 1983, black crappie, green sunfish, largemouth bass, central mudminnow,<br />
white catfish and nor<strong>the</strong>rn pike have been illegally introduced in<strong>to</strong> <strong>the</strong> Penobscot<br />
basin. Classify species-specific threats based on scientific literature <strong>to</strong> prioritize risk<br />
and conduct assessments where <strong>the</strong> literature fails <strong>to</strong> provide in<strong>for</strong>mation.<br />
23.2.1 Hold an annual meeting between IFW and DMR about limiting s<strong>to</strong>cking<br />
<strong>of</strong> non-natives throughout <strong>the</strong> drainage<br />
24.1.3 and 24.1.4 Document dispersal following smallmouth bass<br />
introductions and following <strong>the</strong> illegal introduction <strong>of</strong> white perch in<br />
Moosehead Lake, Spencer Bay<br />
PRFP Page 100
Work with IFW regional biologists <strong>to</strong> document small mouth bass and white perch <strong>to</strong><br />
better understand human and natural dispersal.<br />
24.1.5 and 24.1.6 Smallmouth bass removal projects<br />
DMR will work cooperatively with U Maine on removal projects and will design a<br />
study in a small reach <strong>to</strong> investigate <strong>the</strong> impacts <strong>of</strong> non-native species removal on<br />
s<strong>to</strong>cked Atlantic salmon fry survival.<br />
25.1.1 Conduct an annual meeting with DEP <strong>to</strong> keep up <strong>to</strong> date with issues in<br />
<strong>the</strong> drainage<br />
Ei<strong>the</strong>r meet with DEP separately or actively participate in <strong>the</strong> Invasive Species Task<br />
Force.<br />
25.2.1 Coordinate and implement interagency disinfection/bio-security<br />
pro<strong>to</strong>cols<br />
PRFP Page 101
Section 5 - Analyze, Syn<strong>the</strong>size, and Communicate Results <strong>to</strong> In<strong>for</strong>m Future<br />
Adaptive Management Actions, Analyses, and Research<br />
PRFP Page 102
Authors: Joan Trial and Melissa Laser<br />
Introduction<br />
The plan’s overarching goal <strong>for</strong> <strong>the</strong> river is <strong>to</strong> res<strong>to</strong>re and guide <strong>the</strong> management <strong>of</strong><br />
diadromous fish populations, aquatic resources and <strong>the</strong> ecosystems on which <strong>the</strong>y<br />
depend, <strong>for</strong> <strong>the</strong>ir intrinsic, ecological, economic, recreational, scientific, and<br />
educational values <strong>for</strong> use by <strong>the</strong> public. MDMR and MDIFW are <strong>the</strong> State agencies<br />
responsible <strong>for</strong> developing and carrying out <strong>the</strong> plan and <strong>the</strong> Maine Atlantic Salmon<br />
Commission has policy authority <strong>for</strong> Atlantic salmon. In addition, <strong>the</strong> Departments<br />
are working with <strong>the</strong> PIN, USFWS, NOAA Fisheries, who have federal trust<br />
responsibly <strong>for</strong> species included in <strong>the</strong> plan. The Departments are also working with<br />
<strong>the</strong> PRRT, PPL, researchers, o<strong>the</strong>r state and federal agencies and o<strong>the</strong>r<br />
stakeholders with an interest in <strong>the</strong> basin. The plan recognizes that res<strong>to</strong>ring<br />
ecosystem processes and integrated multi-species fish management will increase<br />
potential success, and that working cooperatively with o<strong>the</strong>r State and Federal<br />
agencies, researchers and stakeholders are essential <strong>to</strong> <strong>the</strong> success <strong>of</strong> this ef<strong>for</strong>t.<br />
Fisheries management on <strong>the</strong> Penobscot River must also be integrated with regional<br />
and international management <strong>of</strong> diadromous species.<br />
The state plan presents a long-term vision and is intended <strong>to</strong> provide guidance <strong>to</strong> an<br />
interagency technical committee on res<strong>to</strong>ration actions <strong>for</strong> multiple species over <strong>the</strong><br />
next 25 years through <strong>the</strong> identification <strong>of</strong> shared goals, objectives and strategies <strong>for</strong><br />
res<strong>to</strong>ration, recovery, and management <strong>of</strong> multiple fish species and ecosystem<br />
processes, using an adaptive management approach. The key ecosystem<br />
processes are hydrology, connectivity, species assemblages, food web interactions,<br />
energy flow, and mineral cycles. Understanding <strong>the</strong>se processes are going <strong>to</strong><br />
require collaborative ef<strong>for</strong>ts with researchers and o<strong>the</strong>r state and federal agencies.<br />
Goal, Objectives and Strategies<br />
Goal: Coordinate fisheries management and res<strong>to</strong>ration activities among state and<br />
federal fisheries agencies, PIN, and stakeholders and syn<strong>the</strong>size in<strong>for</strong>mation.<br />
Objective 26: Cooperative management <strong>of</strong> <strong>the</strong> watershed that integrates ecosystem<br />
function and single species management.<br />
MEASURES<br />
o Number <strong>of</strong> Interagency meetings held annually<br />
o Frequency <strong>of</strong> updates <strong>to</strong> an Inven<strong>to</strong>ry <strong>of</strong> adaptive management systems<br />
o Frequency <strong>of</strong> updates <strong>to</strong> an Inven<strong>to</strong>ry <strong>of</strong> common standardized data collection<br />
methods<br />
o Frequency <strong>of</strong> updates <strong>to</strong> criterion list <strong>to</strong> guide cooperative management<br />
26.1. Task: Convene two interagency technical committee meetings annually <strong>to</strong><br />
coordinate diadromous fish species research- annual<br />
PRFP Page 103
26.2. Task: Assemble adaptive management systems <strong>for</strong> active management <strong>of</strong><br />
single species – by 2010<br />
26.3. Task: Identify shared in<strong>for</strong>mation among adaptive management plans – by<br />
2010<br />
26.4. Task: Coordinate data collection and sharing among agencies - annual<br />
a. Standardize methods -by 2011<br />
26.5. Task: Identify potential interactions among species being managed - by 2012<br />
26.6. Task: Develop criteria that guide cooperative management where significant<br />
management conflicts are anticipated or identified – by 2012<br />
26.7. Task: Develop plans <strong>to</strong> discontinue s<strong>to</strong>cking <strong>for</strong> all species with transfers or<br />
hatchery supplementation – by 2015<br />
Objective 27: Formalize a procedure <strong>to</strong> in<strong>for</strong>m and consult stakeholders regarding<br />
existing or proposed management activities.<br />
MEASURES<br />
o Number <strong>of</strong> meetings with Lake Associations, angler groups, <strong>to</strong>wns<br />
o Number and frequency <strong>of</strong> consultation meetings with FPL<br />
o Date <strong>of</strong> annual stakeholder meeting, number <strong>of</strong> attendees, agenda,<br />
discussion notes<br />
o Number and level <strong>of</strong> engagement <strong>for</strong> stakeholder groups<br />
o Number <strong>of</strong> communications among groups exchanging in<strong>for</strong>mation related <strong>to</strong><br />
management actions in <strong>the</strong> plan<br />
27.1 Task: Develop an outreach strategy that incorporates <strong>the</strong> tasks that follow<br />
and identifies additional ways <strong>to</strong> educate <strong>the</strong> general public on <strong>the</strong> benefits and<br />
importance <strong>of</strong> alewife res<strong>to</strong>ration.<br />
27.2 Task: Hold interagency meetings with Phase 1 lake associations, angler<br />
groups, or <strong>to</strong>wns – 2009<br />
27.3 Task: Develop consistent message about res<strong>to</strong>ration plans with Trust, PIN,<br />
Services and State - 2009<br />
27.4 Task: Develop a mechanism <strong>to</strong> unify fisheries management in<strong>for</strong>mation <strong>for</strong><br />
stakeholders – by 2010<br />
27.5 Task: Consult annually with PPL and o<strong>the</strong>r dam owners on passage issues at<br />
<strong>the</strong>ir facilities – annual<br />
27.6 Task: Hold an interagency technical committee public meeting each year <strong>to</strong><br />
present: – annual<br />
• program results and progress,<br />
• discuss potential management responses,<br />
• review proposed activities <strong>for</strong> <strong>the</strong> ensuing year<br />
27.7 Task: Develop new and enhance existing partnerships with stakeholders,<br />
which maximize resources available <strong>for</strong> achieving program objectives – annual<br />
27.8 Task: Continue <strong>to</strong> encourage communication and in<strong>for</strong>mation exchange with<br />
those agencies, regula<strong>to</strong>ry bodies, and organizations having related<br />
jurisdictional interests and responsibilities – annual<br />
PRFP Page 104
Objective 28: Support regional and international ef<strong>for</strong>ts relating <strong>to</strong> diadromous fish<br />
management and research.<br />
MEASURES<br />
o Number <strong>of</strong> regional management and assessment meetings attended by<br />
administra<strong>to</strong>rs and scientists<br />
o Number <strong>of</strong> international management and assessment meetings attended by<br />
administrative and scientists<br />
o Participation in setting regional and international research priorities<br />
o Funds or collaborative support expended <strong>for</strong> ongoing research at regional and<br />
international levels<br />
o Participation in meetings and products <strong>of</strong> Atlantic salmon Action Teams<br />
o Support and participation in UMaine and o<strong>the</strong>r universities/colleges research<br />
o Support and collaborative participant letters sent with research proposals<br />
28.1 Task: Participate in regional fisheries management and assessment ef<strong>for</strong>ts at<br />
both administrative and scientific levels – annual<br />
a. Atlantic Coastal Fish Habitat Partnership,<br />
b. New England Joint Venture,<br />
c. Atlantic States Marine Fisheries Commission,<br />
d. US Atlantic Salmon Assessment Committee,<br />
e. Eastern Brook Trout Joint Venture,<br />
f. New England Fish Administra<strong>to</strong>rs,<br />
g. New England Atlantic Salmon Coalition,<br />
28.2 Task: Participate in international management and assessment ef<strong>for</strong>ts such<br />
as <strong>the</strong> North Atlantic Salmon Conservation Organization and <strong>the</strong> International<br />
Council <strong>for</strong> <strong>the</strong> Exploration <strong>of</strong> <strong>the</strong> Seas – annual<br />
28.3 Task: Develop research priorities at regional and international levels – based<br />
on cycle <strong>of</strong> various organizations<br />
28.4 Task: Support ongoing research at regional and international levels – annual<br />
28.5 Task: Work closely with <strong>the</strong> Atlantic salmon Action Teams – annual<br />
Objective 29: Develop a better understanding <strong>of</strong> <strong>the</strong> human dimension <strong>of</strong> fisheries<br />
management through collaborating with partners.<br />
MEASURES<br />
o Support and participation in UMaine and o<strong>the</strong>r universities/colleges research<br />
(economics, human dimensions, land use)<br />
o Support and collaborative participant letters sent with research proposals<br />
(economics, human dimensions, land use)<br />
o Number <strong>of</strong> changes in regula<strong>to</strong>ry and management policies facilitated<br />
o Collaborative relationships with groups documenting land use in <strong>the</strong><br />
watershed<br />
o Number <strong>of</strong> communications among groups exchanging in<strong>for</strong>mation related <strong>to</strong><br />
management actions in <strong>the</strong> plan (economics, human dimensions, land use)<br />
29.1 Task: Work with academic institutions <strong>to</strong> study <strong>the</strong> economic impacts <strong>of</strong><br />
res<strong>to</strong>ration <strong>of</strong> diadromous fish – annual<br />
PRFP Page 105
29.2 Task: Examine appropriate case studies and fisheries research, particularly<br />
with emphasis on <strong>the</strong> human dimension that can provide guidance <strong>for</strong><br />
ecosystem-based management – annual<br />
29.3 Task: Work <strong>to</strong> understand community interest in <strong>the</strong> river – annual<br />
29.4 Task: Moni<strong>to</strong>r and evaluate socio-cultural and economic interactions that<br />
contribute <strong>to</strong> and that occur as a result <strong>of</strong> ecosystem based fisheries<br />
management – annual<br />
29.5 Task: Improve communication among government groups – annual<br />
29.6 Task: Improve regula<strong>to</strong>ry and management policies – annual<br />
29.7 Task: Develop a strategy <strong>to</strong> document land use changes in <strong>the</strong> Penobscot<br />
River – by 2012<br />
Objective 30: Work with University and o<strong>the</strong>r researchers <strong>to</strong> develop a better<br />
understanding <strong>of</strong> ecosystem processes in <strong>the</strong> Penobscot and <strong>the</strong>ir importance in <strong>the</strong><br />
res<strong>to</strong>ration <strong>of</strong> diadromous fishes (hydrology, connectivity, species assemblages,<br />
food web interactions, energy flow, and mineral cycles).<br />
MEASURES<br />
o Participation in <strong>Diadromous</strong> Species <strong>Res<strong>to</strong>ration</strong> Research Network meetings<br />
(planning, science)<br />
o Support and participation in UMaine and o<strong>the</strong>r universities/colleges research<br />
(ecosystem processes, climate change)<br />
o Support and collaborative participant letters sent with research proposals<br />
(ecosystem processes, climate change)<br />
30.1 Task: Participate in <strong>the</strong> <strong>Diadromous</strong> Species <strong>Res<strong>to</strong>ration</strong> Research Network –<br />
Life <strong>of</strong> Project<br />
30.2 Task: Examine levels <strong>of</strong> marine derived and terrestrially derived nutrients, and<br />
macroinvertabrate and fish communities – annual<br />
30.3 Task: Examine role <strong>of</strong> climate change in altering ecosystem function and<br />
diadromous fish species population dynamics – annual<br />
30.4 Task: Participate in <strong>the</strong> Penobscot River Science Steering Committee<br />
30.5 Task: Examine <strong>the</strong> role <strong>of</strong> connectivity among main stems and tributaries and<br />
habitat types (rapids, flat waters, runs, riffles, pools), on productivity – annual<br />
Work <strong>Plan</strong> Table<br />
The budget includes funding <strong>for</strong> three full-time Biologists and two full time Biology<br />
Specialists. Budget is estimated <strong>for</strong> 2010-2014.<br />
No. Action Timeline Responsibility Budget<br />
Convene two interagency technical<br />
committee (ITC) meetings annually <strong>to</strong><br />
26.1 manage diadromous fish species<br />
Annual DMR / ITC Chair<br />
Assemble adaptive management<br />
systems <strong>for</strong> active management <strong>of</strong> single<br />
26.2 species<br />
by 2010 ITC<br />
Identify shared in<strong>for</strong>mation among<br />
26.3 adaptive management plans.<br />
by 2010 ITC<br />
$87,000<br />
PRFP Page 106<br />
$0<br />
$0
Coordinate data collection and sharing<br />
26.4 among agencies<br />
Identify potential interactions among<br />
26.5 species being managed<br />
Develop criteria that guide cooperative<br />
management where significant<br />
management conflicts are anticipated or<br />
26.6 identified<br />
Develop plans <strong>to</strong> discontinue s<strong>to</strong>cking<br />
<strong>for</strong> all species with transfers or hatchery<br />
26.7 supplementation<br />
Hold interagency meetings with Phase 1<br />
lake associations, angler groups, or<br />
27.1 <strong>to</strong>wns<br />
Develop consistent message about<br />
res<strong>to</strong>ration with Trust, PIN, Services and<br />
27.2 State<br />
Develop a mechanism <strong>to</strong> unify fisheries<br />
management in<strong>for</strong>mation <strong>for</strong><br />
27.3 stakeholders<br />
Consult annually with PPL and o<strong>the</strong>r dam<br />
owners on passage issues at <strong>the</strong>ir<br />
27.4 facilities.<br />
Hold an interagency technical committee<br />
27.5 public meeting each year.<br />
Develop new and enhance existing<br />
partnerships with stakeholders, which<br />
maximize resources available <strong>for</strong><br />
27.6 achieving program objectives.<br />
Continue <strong>to</strong> encourage communication<br />
and in<strong>for</strong>mation exchange with those<br />
agencies, regula<strong>to</strong>ry bodies, and<br />
organizations having related jurisdictional<br />
interests and responsibilities.<br />
27.7<br />
Participate in regional fisheries<br />
management and assessment ef<strong>for</strong>ts at<br />
28.1 both administrative and scientific levels.<br />
a. Atlantic Coastal Fish Habitat<br />
28.1 Partnership,<br />
Annual ITC<br />
by 2012 ITC<br />
by 2012 ITC<br />
by 2015 DMR Bio III's<br />
2009 DMR / ITC Chair<br />
by 2010 DMR / ITC Chair<br />
by 2010 DMR / ITC Chair<br />
Annual DMR / ITC Chair<br />
Annual DMR / ITC Chair<br />
Annual ITC<br />
Annual ITC<br />
Annual DMR, IF&W<br />
Annual DMR<br />
$87,000<br />
$104,400<br />
$104,700<br />
$218,000<br />
PRFP Page 107<br />
$0<br />
$35,000<br />
$52,400<br />
$87,500<br />
$44,000<br />
$87,500<br />
$44,000<br />
0<br />
$44,000<br />
28.1 b. New England Joint Venture, Annual IF&W $44,000<br />
c. Atlantic States Marine Fisheries Annual DMR<br />
28.1 Commission,<br />
$44,000<br />
d. US Atlantic Salmon Assessment Annual DMR<br />
28.1 Committee,<br />
$89,500<br />
28.1 e. Eastern Brook Trout Joint Venture, Annual IF&W $44,000<br />
28.1 f. New England Fish Administra<strong>to</strong>rs, Annual DMR IF&W $44,000<br />
g. New England Atlantic Salmon Annual DMR<br />
28.1 Coalition,<br />
$44,000
Participate in international management<br />
and assessment ef<strong>for</strong>ts such as <strong>the</strong><br />
North Atlantic Salmon Conservation<br />
Organization and <strong>the</strong> International<br />
Council <strong>for</strong> <strong>the</strong> Exploration <strong>of</strong> <strong>the</strong> Seas.<br />
28.2<br />
Develop research priorities at regional<br />
and international levels.<br />
Annual DMR<br />
based<br />
organization<br />
DMR IF&W<br />
$73,500<br />
28.3<br />
$0<br />
Support ongoing research at regional Annual DMR IF&W<br />
28.4 and international levels.<br />
$44,000<br />
Work closely with <strong>the</strong> Atlantic salmon Annual DMR IF&W<br />
28.5 Action Teams.<br />
$131,000<br />
Work with academic institutions <strong>to</strong> study<br />
<strong>the</strong> economic impacts <strong>of</strong> res<strong>to</strong>ration <strong>of</strong><br />
Annual DMR SPO<br />
29.1 diadromous fish.<br />
$44,000<br />
Examine appropriate case studies and<br />
fisheries research, particularly with<br />
emphasis on <strong>the</strong> human dimension that<br />
can provide guidance <strong>for</strong> ecosystem-<br />
Annual DMR SPO<br />
29.2 based management.<br />
$44,000<br />
Work <strong>to</strong> understand community interest Annual DMR SPO<br />
29.3 in <strong>the</strong> river.<br />
$44,000<br />
Moni<strong>to</strong>r and evaluate socio-cultural and<br />
economic interactions that contribute <strong>to</strong><br />
and that occur as a result <strong>of</strong> ecosystem<br />
Annual DMR SPO<br />
29.4<br />
based fisheries management.<br />
$44,000<br />
Improve communication among Annual DMR<br />
29.5 government groups.<br />
$44,000<br />
Improve regula<strong>to</strong>ry and management Annual DMR<br />
29.6 policies.<br />
$44,000<br />
Develop a strategy <strong>to</strong> document land use by 2012 DMR SPO OGIS<br />
29.7 changes in <strong>the</strong> Penobscot River.<br />
$52,500<br />
Participate in <strong>the</strong> <strong>Diadromous</strong> Species 2008-2013 DMR<br />
30.1 <strong>Res<strong>to</strong>ration</strong> Research Network<br />
$87,500<br />
Examine levels <strong>of</strong> marine derived and<br />
terrestrially derived nutrients, and<br />
Annual DMR USGS<br />
30.2 macroinvertabrate and fish communities.<br />
$44,000<br />
Examine role <strong>of</strong> climate change in<br />
altering ecosystem function and<br />
diadromous fish species population<br />
Annual DMR USGS<br />
30.3 dynamics.<br />
$44,000<br />
Participate in <strong>the</strong> Penobscot River Life <strong>of</strong> Group DMR<br />
30.4 Science Steering Committee<br />
Examine <strong>the</strong> role <strong>of</strong> connectivity among<br />
main stems and tributaries and habitat<br />
types (rapids, flat waters, runs, riffles,<br />
$87,500<br />
30.5 pools), on productivity Annual DMR MFS DOT $87,500<br />
PRFP Page 108
Work <strong>Plan</strong> Narratives<br />
26.1. Convene two interagency technical committee meetings annually <strong>to</strong><br />
manage diadromous fish species<br />
The State fisheries agencies, <strong>the</strong> Department <strong>of</strong> Marine Resources (MMDMR) and<br />
<strong>the</strong> Department <strong>of</strong> Inland Fisheries and Wildlife (MDIFW) are committed <strong>to</strong> working<br />
<strong>to</strong>ge<strong>the</strong>r and in cooperation with <strong>the</strong> Penobscot Indian Nation (PIN), <strong>the</strong> US Fish and<br />
Wildlife Service (USFWS), and National Oceanic and Atmospheric Administration<br />
National Marine Fisheries Service (NOAA Fisheries), and various NGOs in this<br />
ef<strong>for</strong>t. A primary responsibility <strong>of</strong> <strong>the</strong> interagency committee will be <strong>to</strong> address interagency<br />
management issues in areas <strong>of</strong> overlapping jurisdiction.<br />
26.2. Assemble adaptive management systems <strong>for</strong> active management <strong>of</strong><br />
single species.<br />
As agencies and groups develop adaptive management systems <strong>for</strong> species or<br />
species groups, <strong>the</strong>se will be compiled by <strong>the</strong> Interagency Technical Committee.<br />
26.3. Identify shared in<strong>for</strong>mation among adaptive management plans<br />
As plans are compiled, <strong>the</strong> data needed <strong>to</strong> manage <strong>the</strong> individual species and<br />
species groups will be listed, and common in<strong>for</strong>mation required <strong>for</strong> management can<br />
be identified. For example, stream electr<strong>of</strong>ishing survey, habitat survey, riverine<br />
temperature and water quality data are likely <strong>to</strong> be required <strong>for</strong> Atlantic salmon and<br />
freshwater species management.<br />
26.4. Coordinate data collection and sharing among agencies, Standardize<br />
methods.<br />
An integrated sampling plan and common data structure <strong>for</strong> shared data will result in<br />
increased sampling and efficient data collection. Where similar habitat and<br />
population assessment techniques are used in adaptive management <strong>of</strong> several<br />
species or species groups, standard methods will increase sample coverage <strong>for</strong> all<br />
agencies.<br />
26.5. Identify potential interactions among species being managed<br />
At least 86 species <strong>of</strong> fish inhabit <strong>the</strong> Penobscot River basin (Baum 1983). Thirtyfive<br />
are found in marine or estuarine waters, 33 occur in freshwater, five species<br />
<strong>to</strong>lerate a range <strong>of</strong> salinities, and 12 are diadromous species that migrate between<br />
marine and freshwater habitats. All <strong>of</strong> <strong>the</strong> fishes are native <strong>to</strong> Maine with <strong>the</strong><br />
exception <strong>of</strong> eight freshwater species. Since 1983, black crappie, green sunfish,<br />
largemouth bass, and nor<strong>the</strong>rn pike have been illegally introduced in<strong>to</strong> <strong>the</strong><br />
Penobscot basin. Brown trout, an exotic species native <strong>to</strong> Europe, is s<strong>to</strong>cked by<br />
MDIFW <strong>for</strong> recreational fishing. Chain pickerel and smallmouth bass, managed by<br />
MDIFW as sportfish, were introduced in<strong>to</strong> Maine waters in <strong>the</strong> 1800s and have been<br />
spread legally and illegally throughout <strong>the</strong> basin. Landlocked salmon and white<br />
perch are native <strong>to</strong> <strong>the</strong> Penobscot basin, but <strong>the</strong>ir range has been artificially<br />
PRFP Page 109
expanded. This management plan focuses on <strong>the</strong> res<strong>to</strong>ration <strong>of</strong> native diadromous<br />
fishes, which are all currently at less than 1% <strong>of</strong> his<strong>to</strong>ric levels.<br />
26.6. Develop criteria that guide cooperative management where significant<br />
management conflicts are anticipated or identified<br />
Develop a mechanism <strong>to</strong> coordinate management activities among state fisheries<br />
agencies and stakeholders in order <strong>to</strong> identify and resolve conflicts over fisheries<br />
res<strong>to</strong>ration and management and develop criteria <strong>to</strong> resolve management conflicts<br />
that strike an appropriate balance in fish community structure compatible with<br />
individual agency objectives.<br />
26.7. Develop plans <strong>to</strong> discontinue s<strong>to</strong>cking <strong>for</strong> all species with transfers or<br />
hatchery supplementation<br />
The ultimate goal is <strong>to</strong> have self-sustaining populations and <strong>the</strong>re<strong>for</strong>e a plan will be<br />
developed <strong>to</strong> lessen and s<strong>to</strong>p transfers or hatchery supplementation <strong>of</strong> all species<br />
over time.<br />
27.1. Hold interagency meetings with Phase 1 lake associations, angler<br />
groups, or <strong>to</strong>wns<br />
In order <strong>to</strong> accomplish alewife res<strong>to</strong>ration goals, MDMR will need <strong>to</strong> work with lake<br />
associations and o<strong>the</strong>r NGOs in order <strong>to</strong> obtain a permit from IFW.<br />
27.2 Develop consistent message about res<strong>to</strong>ration plans with Trust, PIN,<br />
Services and State<br />
The role <strong>of</strong> stakeholders in <strong>the</strong> communities is <strong>to</strong> in<strong>for</strong>m state representatives and<br />
administrative <strong>of</strong>ficials <strong>of</strong> fish res<strong>to</strong>ration benefits and issues, <strong>to</strong> educate <strong>the</strong> public<br />
about <strong>the</strong> need <strong>to</strong> res<strong>to</strong>re habitat, <strong>the</strong> challenges associated with res<strong>to</strong>ring fisheries<br />
and <strong>the</strong> broad scope <strong>of</strong> fish res<strong>to</strong>ration activities and <strong>to</strong> encourage citizens <strong>to</strong> in<strong>for</strong>m<br />
<strong>the</strong>ir Local, State and Federal representatives <strong>of</strong> <strong>the</strong>ir support <strong>for</strong> fisheries<br />
res<strong>to</strong>ration. It is <strong>the</strong>re<strong>for</strong>e imperative that <strong>the</strong> major interested parties have <strong>the</strong><br />
same message about <strong>the</strong> ef<strong>for</strong>ts in <strong>the</strong> Penobscot drainage.<br />
27.3 Develop a mechanism <strong>to</strong> unify fisheries management in<strong>for</strong>mation <strong>for</strong><br />
stakeholders<br />
Fisheries management in<strong>for</strong>mation is spread throughout agency and regional<br />
reports. A compilation <strong>of</strong> <strong>the</strong>se reports and summaries will provide easier public<br />
access <strong>to</strong> management decisions and <strong>the</strong> data supporting <strong>the</strong>m <strong>for</strong> <strong>the</strong> Penobscot<br />
River.<br />
27.4 Consult annually with PPL and o<strong>the</strong>r dam owners on passage issues at<br />
<strong>the</strong>ir facilities<br />
MDMR will meet with PPL and o<strong>the</strong>r dam owners <strong>to</strong> keep an open dialogue going on<br />
passage issues in <strong>the</strong> drainage.<br />
PRFP Page 110
27.5 Hold an interagency technical committee public meeting each year <strong>to</strong><br />
present: program results and progress, discuss potential management<br />
responses, review proposed activities <strong>for</strong> <strong>the</strong> ensuing year<br />
In order <strong>to</strong> in<strong>for</strong>m stakeholders <strong>of</strong> <strong>the</strong> progress <strong>to</strong>wards goals <strong>for</strong> <strong>the</strong> watershed and<br />
<strong>to</strong> update interested parties on <strong>the</strong> activities <strong>of</strong> MDMR, IFW and o<strong>the</strong>rs working in<br />
<strong>the</strong> watershed, <strong>the</strong> ITC will host an annual meeting <strong>to</strong> keep a dialogue going with<br />
stakeholders. This is envisioned <strong>to</strong> have both a technical presentation component<br />
and a feedback session.<br />
27.6. Develop new and enhance existing partnerships with stakeholders,<br />
which maximize resources available <strong>for</strong> achieving program objectives<br />
There are multiple stakeholders in <strong>the</strong> drainage. Many are traditional watershed<br />
groups that are currently involved <strong>to</strong> some extent in res<strong>to</strong>ration. MDMR will work <strong>to</strong><br />
enhance <strong>the</strong>se partnerships when possible. There are o<strong>the</strong>r non-traditional groups<br />
that MDMR will work <strong>to</strong>wards including <strong>the</strong> process in order <strong>to</strong> achieve <strong>the</strong> desired<br />
results.<br />
27.7. Continue <strong>to</strong> encourage communication and in<strong>for</strong>mation exchange with<br />
those agencies, regula<strong>to</strong>ry bodies, and organizations having related<br />
jurisdictional interests and responsibilities<br />
Closely tied <strong>to</strong> tasks 29.5 and 29.6 <strong>to</strong> improve communication among government<br />
groups and improve regula<strong>to</strong>ry and management policies.<br />
28.1. Participate in regional fisheries management and assessment ef<strong>for</strong>ts at<br />
both administrative and scientific levels<br />
The State <strong>of</strong> Maine participates in several inter-jurisdictional ef<strong>for</strong>ts including <strong>the</strong><br />
Atlantic Coastal Fish Habitat Partnership, <strong>the</strong> New England Joint Venture, <strong>the</strong><br />
Atlantic States Marine Fisheries Commission, <strong>the</strong> US Atlantic Salmon Assessment<br />
Committee, <strong>the</strong> Eastern Brook Trout Joint Venture, <strong>the</strong> New England Fish<br />
Administra<strong>to</strong>rs, and <strong>the</strong> New England Atlantic Salmon Coalition.<br />
28.2. Participate in international management and assessment ef<strong>for</strong>ts such as<br />
<strong>the</strong> North Atlantic Salmon Conservation Organization and <strong>the</strong> International<br />
Council <strong>for</strong> <strong>the</strong> Exploration <strong>of</strong> <strong>the</strong> Seas.<br />
The U.S. became a charter member <strong>of</strong> <strong>the</strong> NASCO in 1984. NASCO is charged with<br />
<strong>the</strong> international management <strong>of</strong> Atlantic salmon s<strong>to</strong>cks on <strong>the</strong> high seas. Three<br />
Commissioners <strong>for</strong> <strong>the</strong> U.S. are appointed by <strong>the</strong> President and work under <strong>the</strong><br />
auspices <strong>of</strong> <strong>the</strong> U.S. State Department. One <strong>of</strong> <strong>the</strong> Commissioners is from Maine.<br />
The International Council <strong>for</strong> <strong>the</strong> Exploration <strong>of</strong> <strong>the</strong> Seas (ICES), <strong>the</strong> <strong>of</strong>ficial research<br />
arm <strong>of</strong> NASCO, convenes a Working Group on North Atlantic Salmon which is<br />
responsible <strong>for</strong> providing scientific advice <strong>to</strong> be used by NASCO members as a<br />
basis <strong>for</strong> <strong>for</strong>mulating biologically sound management recommendations <strong>for</strong> <strong>the</strong><br />
conservation <strong>of</strong> North Atlantic salmon s<strong>to</strong>cks. The Working Group on North Atlantic<br />
Salmon, which is composed <strong>of</strong> representatives <strong>of</strong> member countries, including one<br />
Maine biologist and as many as three from <strong>the</strong> US, is responsible <strong>for</strong> <strong>the</strong> collecting<br />
and analyzing scientific data on salmon.<br />
PRFP Page 111
28.3. Develop research priorities at regional and international levels<br />
Same as 28.1 and 28.2<br />
28.4. Support ongoing research at regional and international levels<br />
Same as 28.1 and 28.2<br />
28.5. Work closely with <strong>the</strong> Atlantic salmon Action Teams<br />
Action Teams are <strong>the</strong> key component <strong>of</strong> <strong>the</strong> new Atlantic Salmon Recovery<br />
Framework. Activities (research and management actions) are identified and<br />
evaluated at <strong>the</strong> Action Team level. Each Action Team is charged with identifying<br />
<strong>the</strong> highest priority research and management actions that could be undertaken <strong>to</strong><br />
fur<strong>the</strong>r <strong>the</strong> recovery <strong>of</strong> <strong>the</strong> Gulf <strong>of</strong> Maine Distinct Population Segment <strong>of</strong> Atlantic<br />
salmon. Existing and new activities should be included in <strong>the</strong> list <strong>of</strong> activities and<br />
both compared against <strong>the</strong> same set <strong>of</strong> criteria. Each Action Team will use <strong>the</strong><br />
same set <strong>of</strong> criteria <strong>to</strong> evaluate <strong>the</strong> conservation benefit <strong>of</strong> proposed activities. This<br />
will facilitate comparisons within Action Teams as well as across Action Teams.<br />
29.1. Work with academic institutions <strong>to</strong> study <strong>the</strong> economic impacts <strong>of</strong><br />
res<strong>to</strong>ration <strong>of</strong> diadromous fish<br />
For thousands <strong>of</strong> years, diadromous fishes migrated through much <strong>of</strong> <strong>the</strong> basin,<br />
providing a connection between <strong>the</strong> Gulf <strong>of</strong> Maine and inland terrestrial and aquatic<br />
ecosystems. For thousands <strong>of</strong> years, Native American’s living along <strong>the</strong> river and its<br />
tributaries have sought <strong>the</strong> migra<strong>to</strong>ry fish <strong>of</strong> <strong>the</strong> Penobscot River, as did <strong>the</strong><br />
European explorers and settlers. Commercial harvest <strong>of</strong> <strong>the</strong> Penobscot River's<br />
migra<strong>to</strong>ry fish species began soon after <strong>the</strong> settlement <strong>of</strong> Bangor and Bucksport in<br />
<strong>the</strong>1760s. There is a need <strong>to</strong> understand what a res<strong>to</strong>red population would mean <strong>to</strong><br />
<strong>the</strong> economy <strong>of</strong> <strong>the</strong> region.<br />
29.2. Examine appropriate case studies and fisheries research, particularly<br />
with emphasis on <strong>the</strong> human dimension that can provide guidance <strong>for</strong><br />
ecosystem-based management<br />
Res<strong>to</strong>ring ecosystem processes and integrated multi-species fish management will<br />
increase potential success, and that working cooperatively with o<strong>the</strong>r State and<br />
Federal agencies, researchers and stakeholders are essential <strong>to</strong> <strong>the</strong> success <strong>of</strong> this<br />
ef<strong>for</strong>t.<br />
29.3. Work <strong>to</strong> understand community interest in <strong>the</strong> river<br />
There are many stakeholders with an interest in <strong>the</strong> watershed that have led and<br />
continue <strong>to</strong> lead res<strong>to</strong>ration ef<strong>for</strong>ts. Various non-governmental organizations<br />
(NGOs) have worked <strong>to</strong> res<strong>to</strong>re alewives by succeeding with three barriers removals<br />
in Souadabscook Stream, <strong>the</strong> removal <strong>of</strong> <strong>the</strong> Brownville Dam and active ef<strong>for</strong>ts <strong>to</strong><br />
improve fish passage in Blackman Stream and Sedgeunkedunk Stream.<br />
Researchers from <strong>the</strong> University <strong>of</strong> Maine (UM) and o<strong>the</strong>r institutions have worked<br />
cooperatively with state and federal agencies, providing needed in<strong>for</strong>mation on<br />
multiple fish species and <strong>the</strong> environment throughout <strong>the</strong> basin. The Penobscot<br />
PRFP Page 112
River <strong>Res<strong>to</strong>ration</strong> Trust (PRRT or Trust) has worked tirelessly on <strong>the</strong> Penobscot<br />
River <strong>Res<strong>to</strong>ration</strong> Project (PRRP).<br />
29.4. Moni<strong>to</strong>r and evaluate socio-cultural and economic interactions that<br />
contribute <strong>to</strong> and that occur as a result <strong>of</strong> ecosystem based fisheries<br />
management<br />
The socio-economic processes <strong>of</strong> res<strong>to</strong>ration have not traditionally been researched<br />
or addressed fully although a recent ef<strong>for</strong>t was attempted <strong>to</strong> assess <strong>the</strong>se processes<br />
in regard <strong>to</strong> Atlantic salmon. A <strong>to</strong>p priority is <strong>to</strong> attempt <strong>to</strong> re-engage <strong>the</strong> public in<br />
<strong>the</strong> recovery ef<strong>for</strong>ts in <strong>the</strong> basin, because apathy is a threat <strong>to</strong> recovery. The<br />
awareness, cooperation and participation <strong>of</strong> stakeholders, landowners, NGOs, public<br />
agencies, municipalities, and <strong>the</strong> general public are essential <strong>for</strong> res<strong>to</strong>ration.<br />
Programs targeted at re-connecting people <strong>to</strong> <strong>the</strong> fish through a better<br />
understanding <strong>of</strong> <strong>the</strong> life his<strong>to</strong>ry, habitat needs, economics, and importance <strong>to</strong> <strong>the</strong><br />
people <strong>of</strong> Maine as well as <strong>the</strong> goals and objectives <strong>of</strong> recovery are crucial.<br />
29.5 and 29.6 Improve communication among government groups and<br />
improve regula<strong>to</strong>ry and management policies<br />
The Interagency Technical Committee (task 26.1) is one mechanism <strong>to</strong> improve<br />
communication amongst <strong>the</strong> fisheries agencies. There is a need <strong>to</strong> increase<br />
communication with <strong>the</strong> o<strong>the</strong>r natural resources agencies such as <strong>the</strong> Departments<br />
<strong>of</strong> Transportation, Conservation, Environmental Protection and <strong>the</strong> State <strong>Plan</strong>ning<br />
Office. Task 20.1.5 is a mechanism <strong>to</strong> increase communication about connectivity<br />
and passage issues.<br />
29.7. Develop a strategy <strong>to</strong> document land use changes in <strong>the</strong> Penobscot<br />
River<br />
Connecting land use changes <strong>to</strong> potential changes in habitat quality within <strong>the</strong> river<br />
system and understanding how those changes affect aquatic resources is important.<br />
30.1. Participate in <strong>the</strong> <strong>Diadromous</strong> Species <strong>Res<strong>to</strong>ration</strong> Research Network<br />
DSRRN, a collaborative ef<strong>for</strong>t <strong>to</strong> catalyze science, resource management, and<br />
outreach, in 2008 kick <strong>of</strong>f a five year, NSF-funded networking ef<strong>for</strong>t focused on <strong>the</strong><br />
study <strong>of</strong> questions fundamental <strong>to</strong> diadromous fish ecology and res<strong>to</strong>ration. The<br />
strength <strong>of</strong> this project is its integration with <strong>the</strong> Penobscot River <strong>Res<strong>to</strong>ration</strong> Project<br />
(Maine), <strong>the</strong> most ambitious res<strong>to</strong>ration ef<strong>for</strong>t ever proposed <strong>for</strong> a watershed <strong>of</strong> this<br />
size. The Penobscot River <strong>Res<strong>to</strong>ration</strong> Project has <strong>the</strong> potential <strong>to</strong> res<strong>to</strong>re a diverse<br />
community <strong>of</strong> fishes with important commercial and recreational value. A project <strong>of</strong><br />
this size has numerous stakeholders, including local <strong>to</strong>wns and cities, non-pr<strong>of</strong>it<br />
organizations, an Indian tribe, state and federal agencies and academics. A critical<br />
objective <strong>of</strong> <strong>the</strong> Network is <strong>to</strong> facilitate and encourage constructive interactions<br />
between local, regional and international diadromous fish scientists and <strong>the</strong> local<br />
stakeholders with <strong>the</strong> ultimate goal <strong>of</strong> promoting state-<strong>of</strong>-<strong>the</strong>-art scientific<br />
approaches <strong>to</strong> multiple species res<strong>to</strong>ration on a watershed scale. The DSRRN will<br />
conduct a series <strong>of</strong> science meetings, workshops and local networking <strong>to</strong><br />
accomplish <strong>the</strong>se goals, and invite <strong>the</strong> participation <strong>of</strong> any member <strong>of</strong> <strong>the</strong> ecological<br />
PRFP Page 113
community interested in <strong>the</strong> res<strong>to</strong>ration <strong>of</strong> diadromous fishes in <strong>the</strong> context <strong>of</strong> river<br />
and watershed res<strong>to</strong>ration.<br />
30.2. Examine levels <strong>of</strong> marine derived and terrestrially derived nutrients, and<br />
macroinvertabrate and fish communities.<br />
In riverine ecosystems, <strong>the</strong>re is a need <strong>to</strong> examine <strong>the</strong> interactions among abiotic<br />
and biotic components throughout <strong>the</strong> entire basin. The aim is <strong>to</strong> eliminate or<br />
mitigate <strong>the</strong> causes <strong>of</strong> degraded ecological processes. A whole system view is<br />
required, however, because <strong>of</strong> <strong>the</strong> complexity <strong>of</strong> interactions between <strong>the</strong> upland<br />
and <strong>the</strong> aquatic environment, as well interactions between species.<br />
30.3. Examine role <strong>of</strong> climate change in altering ecosystem function and<br />
diadromous fish species population dynamics<br />
There is a need <strong>to</strong> assess how <strong>the</strong> river has changed over time. Ecosystem<br />
components that changed with European settlement <strong>of</strong> <strong>the</strong> Penobscot basin include:<br />
<strong>the</strong> fish community (introduced non-native species, lost diadromous species),<br />
aquatic mammals (otter, beaver), preda<strong>to</strong>r-prey complexes (fish, birds, and<br />
mammals) in physical habitat, hydrology, and riparian vegetation. Fur<strong>the</strong>r, <strong>the</strong> role <strong>of</strong><br />
climate change in altering ecosystem function and <strong>the</strong> decline <strong>of</strong> Atlantic salmon<br />
need <strong>to</strong> be explored, as well as <strong>the</strong> potential benefit <strong>to</strong> o<strong>the</strong>r species such as striped<br />
bass.<br />
30.4. Participate in <strong>the</strong> Penobscot River Science Steering Committee<br />
The Penobscot River Science Steering Committee was organized by <strong>the</strong> University<br />
<strong>of</strong> Maine’s Mitchell Center and Penobscot River <strong>Res<strong>to</strong>ration</strong> Trust <strong>to</strong> organize and<br />
oversee scientific research and moni<strong>to</strong>ring related <strong>to</strong> <strong>the</strong> res<strong>to</strong>ration project.<br />
Members <strong>of</strong> <strong>the</strong> fisheries subcommittee include representatives from <strong>the</strong> Maine<br />
Department <strong>of</strong> Marine Resources, Maine Department <strong>of</strong> Environmental Protection,<br />
Maine Department <strong>of</strong> Inland Fisheries and Wildlife, University <strong>of</strong> Maine, U.S. Fish<br />
and Wildlife Service, and NOAA’s National Marine Fisheries Service.<br />
30.5. Examine <strong>the</strong> role <strong>of</strong> connectivity among main stems and tributaries and<br />
habitat types (rapids, flat waters, runs, riffles, pools), on productivity<br />
The recovery <strong>of</strong> <strong>the</strong> Penobscot River <strong>for</strong> all species needs <strong>to</strong> be approached<br />
holistically. A fur<strong>the</strong>r understanding <strong>the</strong> ecosystem and <strong>the</strong> role <strong>of</strong> connectivity<br />
among main stems and tributaries and habitat types (rapids, flat waters, runs, riffles,<br />
pools), <strong>of</strong> marine derived and terrestrially derived nutrients, and <strong>of</strong> <strong>the</strong><br />
macroinvertabrate and fish communities is needed.<br />
PRFP Page 114
Appendices<br />
Appendix A - Role <strong>of</strong> Hatchery Releases or Exogenous S<strong>to</strong>ck Transfers in Alosine<br />
<strong>Res<strong>to</strong>ration</strong><br />
Appendix B - Viability <strong>of</strong> Salmon Sub-Populations by Reach in <strong>the</strong> Penobscot Basin<br />
Appendix C - Penobscot Habitat and Freshwater Juvenile Atlantic Salmon<br />
Production Potential<br />
Appendix D - Adaptive Management Guidance <strong>for</strong> Fisheries Management in <strong>the</strong><br />
Penobscot Basin<br />
Appendix E - Atlantic Salmon Fisheries Management Options and Strategies<br />
Appendix F - Atlantic Salmon Strategic Objectives<br />
Appendix G - Habitat Survey and Assessment <strong>Plan</strong> <strong>for</strong> <strong>the</strong> Penobscot Basin<br />
Appendix H - Developing a Sampling <strong>Plan</strong> <strong>for</strong> <strong>the</strong> Penobscot Basin<br />
Appendix I – Downstream Passage Studies <strong>for</strong> Atlantic Salmon<br />
Appendix J – Nor<strong>the</strong>rn Pike Risk Assessment<br />
Appendix K – Nor<strong>the</strong>rn Pike Movement Barrier Risk Assessment Survey<br />
PRFP Page 115
Appendix A - Role <strong>of</strong> Hatchery Releases or Exogenous S<strong>to</strong>ck Transfers in<br />
Alosine <strong>Res<strong>to</strong>ration</strong><br />
Authors: Fred Seavey (USFWS) and Gail Wippelhauser (MDMR)<br />
1. Introduction<br />
The State <strong>of</strong> Maine has identified a goal <strong>of</strong> rebuilding American shad, blueback<br />
herring and alewife (collectively referred here as alosines) populations <strong>to</strong> <strong>the</strong><br />
Penobscot River (MDMR and MDIFW 2008). Here we consider whe<strong>the</strong>r <strong>the</strong><br />
Penobscot River alosine res<strong>to</strong>ration should occur by natural recovery; by<br />
supplementation using adult fish transfers and/or s<strong>to</strong>cking <strong>of</strong> hatchery-reared<br />
juveniles; and whe<strong>the</strong>r supplementation should use lower river s<strong>to</strong>cks or exogenous<br />
s<strong>to</strong>cks. Fish transfers 18 and hatchery supplementation with fry or fingerlings 19 using<br />
in-basin or out-<strong>of</strong>-basin (exogenous) sources <strong>of</strong> broods<strong>to</strong>ck are common res<strong>to</strong>ration<br />
practices in Maine and elsewhere. These res<strong>to</strong>ration methods are proposed <strong>for</strong> <strong>the</strong><br />
Penobscot River where alosines have been extirpated from a large portion <strong>of</strong> <strong>the</strong><br />
watershed or where remnant populations are currently believed <strong>to</strong> exist in small<br />
numbers in <strong>the</strong> lower river (<strong>the</strong> first dam is just upstream <strong>of</strong> <strong>the</strong> head-<strong>of</strong>-tide) and its<br />
tributaries.<br />
No alosine genetic investigations are currently available <strong>for</strong> <strong>the</strong> Penobscot River or<br />
potential Maine donor rivers <strong>to</strong> assist us in understanding how Maine’s alosine<br />
populations may (or may not) be structured, but two studies are ei<strong>the</strong>r currently<br />
underway or planned in <strong>the</strong> near future. One focuses on American shad genetics<br />
along <strong>the</strong> Atlantic Coast (P. Benson, personal communication, December 3, 2008)<br />
and <strong>the</strong> o<strong>the</strong>r addresses alewife genetics in Maine (T. Willis, personal<br />
communication, December 2, 2008). The results from <strong>the</strong>se studies will be<br />
considered once it is peer-reviewed and becomes available<br />
This review makes a judgment as <strong>to</strong> <strong>the</strong> likelihood that Penobscot River alosine<br />
populations may have a population structure by reviewing <strong>the</strong> literature addressing<br />
alosine population structure, describing <strong>the</strong> current management experience, and<br />
discussing <strong>the</strong> implications <strong>of</strong> each. It also provides an approach <strong>for</strong> <strong>the</strong> use <strong>of</strong><br />
exogenous s<strong>to</strong>ck transfer or hatchery supplementation <strong>for</strong> res<strong>to</strong>ring extirpated<br />
Penobscot River alosine s<strong>to</strong>cks based on this in<strong>for</strong>mation.<br />
18<br />
The movement, transfer and placement <strong>of</strong> gravid adults from a self-sustaining population <strong>to</strong> an area<br />
with an extirpated or depressed population.<br />
19<br />
The collection <strong>of</strong> eggs from gravid adults that are <strong>the</strong>n fertilized, reared and released <strong>to</strong> res<strong>to</strong>re an<br />
extirpated populations or supplement a depressed population.<br />
PRFP Page 116
Population Structure<br />
The ‘concept’ <strong>of</strong> what is meant by a population or s<strong>to</strong>ck is not a settled question,<br />
even though it is central <strong>to</strong> <strong>the</strong> fields <strong>of</strong> ecology, evolutionary biology and<br />
conservation biology, and no single approach has been developed <strong>to</strong> describe what<br />
a population represents (Waples and Gaggiotti 2006). There<strong>for</strong>e, much judgment<br />
needs <strong>to</strong> be applied <strong>to</strong> decide whe<strong>the</strong>r and how <strong>to</strong> manage populations. This<br />
decision is sometimes clear when a population is ei<strong>the</strong>r entirely isolated or panmixic.<br />
Most <strong>of</strong>ten <strong>the</strong> situation is intermediate between <strong>the</strong>se two extremes, resulting in a<br />
continuum <strong>of</strong> population differentiation (Waples 2006). This is <strong>the</strong> case with many<br />
marine fish species that are widespread, highly migra<strong>to</strong>ry, and have a relatively high<br />
gene flow (Waples 1998). We approach <strong>the</strong> question <strong>of</strong> population structure by<br />
summarizing known investigations that were meant <strong>to</strong> ei<strong>the</strong>r define or identify<br />
specific alosine s<strong>to</strong>cks, by reviewing existing management experience, and by<br />
making a judgment on how <strong>to</strong> approach Penobscot River s<strong>to</strong>ck res<strong>to</strong>ration <strong>for</strong> each<br />
species.<br />
Management S<strong>to</strong>ck Definition<br />
The management <strong>of</strong> alosines in Maine must comply with <strong>the</strong> Atlantic States Marine<br />
Fisheries Commission’s (ASMFC) Amendment 1 <strong>to</strong> <strong>the</strong> Interstate Fishery<br />
Management <strong>Plan</strong> <strong>for</strong> Shad and River Herring (“<strong>Plan</strong>”, ASMFS 1999). The <strong>Plan</strong>’s<br />
management unit is defined as all migra<strong>to</strong>ry American shad, hickory shad, and river<br />
herring (alewife and blueback herring) s<strong>to</strong>cks <strong>of</strong> <strong>the</strong> east coast <strong>of</strong> <strong>the</strong> United States.<br />
In <strong>the</strong> American shad s<strong>to</strong>ck assessment report, ASMFC (2007a) defined s<strong>to</strong>ck as “a<br />
part <strong>of</strong> a fish population with a particular migration pattern, specific spawning<br />
grounds, and subject <strong>to</strong> a distinct fishery.” In <strong>the</strong> river herring s<strong>to</strong>ck assessment<br />
report, ASMFC (1990) defined s<strong>to</strong>cks <strong>for</strong> alewife as <strong>the</strong> river <strong>of</strong> origin. The<br />
management definition <strong>for</strong> a s<strong>to</strong>ck is discussed below <strong>for</strong> each species in <strong>the</strong><br />
summary.<br />
2. Alewife<br />
Meristic/Morphology or Genetic Investigations<br />
Morphology and meristic characteristics are sometimes useful in segregating groups<br />
and describing phenotypic expressions (Waples 1991). Messieh (1977) examined<br />
<strong>the</strong> population structure <strong>of</strong> river herring (primarily alewife) in <strong>the</strong> Saint John River,<br />
New Brunswick. He found <strong>the</strong> morphology and meristic characteristics identified<br />
differences in various populations but also showed a high degree <strong>of</strong> overlap. The<br />
most significant separation was from those populations that were geographically<br />
distant. Messieh surmised that river herring were probably not as specific as<br />
American shad in homing <strong>to</strong> tributaries because <strong>of</strong> <strong>the</strong> significant overlap in river<br />
herring morphology and meristics.<br />
PRFP Page 117
Genetic studies focused on alewife differentiation using mtDNA and microsatellite<br />
data and <strong>of</strong>ten compared anadromous and landlocked <strong>for</strong>ms. This section focuses<br />
on <strong>the</strong> results <strong>for</strong> <strong>the</strong> anadromous <strong>for</strong>m. Palkovac et al. (2008) found seven<br />
anadromous populations in <strong>the</strong> Connecticut River were generally weakly<br />
differentiated from each o<strong>the</strong>r using mtDNA and microsatellite data (mean FST=0.038<br />
and 0.012, respectively) and that gene flow (Nm=3.11) did not appear <strong>to</strong> be restricted<br />
at <strong>the</strong> geographic scale <strong>of</strong> <strong>the</strong> study (80 km between <strong>the</strong> most distant population).<br />
Chilakamarri (2005) used microsatellite data <strong>to</strong> examine two populations <strong>of</strong><br />
anadromous alewife in Connecticut separated by about 40 km. She found a<br />
moderate level <strong>of</strong> differentiation between <strong>the</strong> two populations (pairwise FST=0.058).<br />
Using microsatellite data, Bentzen and Paterson (2005) compared <strong>the</strong> two<br />
anadromous alewife populations in <strong>the</strong> Saint Croix River with populations in <strong>the</strong><br />
LaHave and Gaspereau Rivers. Anadromous populations were generally weakly<br />
differentiated from each o<strong>the</strong>r within Saint Croix River (pairwise FST=0.008), weakly<br />
<strong>to</strong> moderately differentiated between <strong>the</strong> Saint Croix and <strong>the</strong> LaHave and<br />
Gaspereau River populations (pairwise FST ranged between 0.014 and 0.044), and<br />
moderately differentiated between <strong>the</strong> LaHave and Gaspereau Rivers (FST =0.050)<br />
This result is notable since <strong>the</strong> Saint Croix River was separated from <strong>the</strong> o<strong>the</strong>r rivers<br />
by hundreds <strong>of</strong> kilometers. Bentzen (personal communication, December 3, 2008)<br />
noted that <strong>the</strong> data indicate that alewife populations are genetically differentiated but<br />
that <strong>the</strong> pattern and magnitude needed <strong>to</strong> be determined through additional study.<br />
Several genetic studies show that introduced landlocked alewife populations are<br />
very greatly differentiated from anadromous populations, suggests that <strong>the</strong><br />
introductions may have occurred in recent times, and demonstrate a certain amount<br />
<strong>of</strong> resilience <strong>of</strong> alewife life his<strong>to</strong>ry through <strong>the</strong>se successful introductions. Bentzen<br />
and Paterson (2006) concluded that <strong>the</strong> landlocked alewives in <strong>the</strong> St. Croix<br />
watershed did not arise from <strong>the</strong> sampled anadromous population but ra<strong>the</strong>r a<br />
separate introduction. Palkovac et al. (2008) suggested that landlocked populations<br />
from seven Connecticut lakes diverged from a common anadromous ances<strong>to</strong>r no<br />
longer than 5,000 years ago and as recently as 300 years ago. Ihssen and Martin<br />
(1992) concluded that <strong>the</strong> Great Lake population <strong>of</strong> alewife is a recent invader that<br />
likely originated <strong>for</strong>m <strong>the</strong> Hudson-Mohawk Rivers via <strong>the</strong> Erie Canal and <strong>the</strong> New<br />
York Finger Lakes. These accounts are notable in that <strong>the</strong>y suggest that <strong>the</strong><br />
successful invasions may be recent (within <strong>the</strong> period <strong>of</strong> European settlement).<br />
Numerous o<strong>the</strong>r alewife introductions have also been documented in lakes and<br />
ponds <strong>of</strong> <strong>the</strong> New England and Mid-Atlantic states (Hendricks 2003).<br />
Management Experience<br />
The ASMFC is revising its management plan <strong>for</strong> alewife based upon closure <strong>of</strong> river<br />
herring fisheries by many Atlantic coastal states and observed declines in<br />
abundances (ASMFS 2008a, ASMFS 2007a). The plan recognizes that fish<br />
transfers may be necessary <strong>to</strong> reestablish populations that have been extirpated<br />
from <strong>the</strong>ir habitat due <strong>to</strong> dams or o<strong>the</strong>r fac<strong>to</strong>rs. Fish transfers and hatchery<br />
PRFP Page 118
supplementation have been highly successful in re-establishing extirpated<br />
populations <strong>of</strong> alewife and are currently used by many states.<br />
Since <strong>the</strong> mid-1970s <strong>the</strong> State <strong>of</strong> Maine has successfully res<strong>to</strong>red alewife runs <strong>to</strong><br />
more than 30 ponds in <strong>the</strong> Royal River, Androscoggin River, Kennebec River,<br />
Presumpscot River, and <strong>the</strong> mid-coast region from Cape Elizabeth <strong>to</strong> Mt. Desert<br />
Island by sequential, exogenous s<strong>to</strong>ck transfers (Damariscotta fish <strong>to</strong> <strong>the</strong> Royal,<br />
Royal fish <strong>to</strong> <strong>the</strong> Androscoggin, Androscoggin fish <strong>to</strong> <strong>the</strong> Kennebec, Androscoggin<br />
and Kennebec fish <strong>to</strong> <strong>the</strong> mid-coast). The exogenous alewives have flourished in<br />
non-natal ponds that varied in size, depth, trophic status, resident fish community,<br />
distance from <strong>the</strong> ocean, and elevation.<br />
The best studied alewife res<strong>to</strong>ration is in <strong>the</strong> Kennebec River watershed. The lack<br />
<strong>of</strong> fish passage at <strong>the</strong> first dam (Edwards) <strong>for</strong> almost 150 years had caused <strong>the</strong><br />
extirpation <strong>of</strong> alewives from all upstream lakes and ponds. <strong>Res<strong>to</strong>ration</strong> began in<br />
1985 when DMR s<strong>to</strong>cked 3567 alewives from <strong>the</strong> Androscoggin River in<strong>to</strong> a single<br />
lake above Edwards Dam. S<strong>to</strong>cking was expanded <strong>to</strong> six additional Kennebec lakes<br />
as <strong>the</strong> Androscoggin run increased, and more adult broods<strong>to</strong>ck became available.<br />
Exogenous s<strong>to</strong>cking from <strong>the</strong> Androscoggin was terminated in 1993, because <strong>the</strong><br />
number <strong>of</strong> alewife returns <strong>to</strong> Edwards Dam was sufficiently large <strong>to</strong> serve as<br />
broods<strong>to</strong>ck. Between 1993 and 1999, nine lakes above Edwards Dam and 14<br />
additional in-basin and out-<strong>of</strong>-basin lakes were s<strong>to</strong>cked with Kennebec alewife.<br />
After <strong>the</strong> removal <strong>of</strong> Edwards Dam in 1999, returning alewives were able <strong>to</strong> migrate<br />
17 additional miles upstream. Because alewives still had no access <strong>to</strong> spawning<br />
habitat, DMR continued random s<strong>to</strong>cking <strong>of</strong> adults in<strong>to</strong> upstream lakes (i.e., adults<br />
not necessarily trucked <strong>to</strong> natal waters). In 2006, DMR ceased s<strong>to</strong>cking five <strong>of</strong> <strong>the</strong><br />
nine upstream lakes, because fish passage installation had made <strong>the</strong>m accessible.<br />
Interim passage at Fort Halifax (fish pump) did not allow all returning alewives <strong>to</strong> be<br />
passed, so <strong>the</strong> <strong>to</strong>tal run size could not be determined. However, 500,000 <strong>to</strong> 600,000<br />
fish were counted (combined passing and harvest) at Fort Halifax in multiple years<br />
since 2002, and <strong>the</strong> run is estimated <strong>to</strong> be greater than a million fish.<br />
Summary<br />
Based on existing in<strong>for</strong>mation, four s<strong>to</strong>cks occur in <strong>the</strong> Penobscot River (above<br />
Veazie, Silver Lake, Souadabscook Stream and Orland River). The ASMFS has<br />
defined s<strong>to</strong>cks <strong>for</strong> alewife as <strong>the</strong> river <strong>of</strong> origin, however <strong>the</strong> state typically manages<br />
alewife based on <strong>the</strong> lake or pond <strong>of</strong> origin because <strong>of</strong> its life his<strong>to</strong>ry. The<br />
management definition <strong>of</strong> a s<strong>to</strong>ck lends support <strong>for</strong> homing <strong>of</strong> alewife <strong>to</strong> natal rivers.<br />
Although not extensive, <strong>the</strong> literature available on s<strong>to</strong>ck identification based on ei<strong>the</strong>r<br />
meristic/morphology or genetic investigations indicates weak <strong>to</strong> moderate<br />
differentiation that may (or may not) be based on geographic distance. The results<br />
are consistent with homing <strong>to</strong> natal rivers but with a stray rate that appears <strong>to</strong> be<br />
large enough <strong>to</strong> provide effective genetic interchange between populations (<strong>the</strong><br />
range <strong>of</strong> <strong>the</strong> FST values reported was 0.008 <strong>to</strong> 0.058 which would correspond with<br />
PRFP Page 119
etween 4 and 41 genetically effective migrants per generation using <strong>the</strong><br />
approximation <strong>of</strong> FST ≈ 1/(1 + 4mNe) described in Waples (1998)).<br />
The use <strong>of</strong> this in<strong>for</strong>mation <strong>for</strong> management purposes is not simple since <strong>the</strong>re is a<br />
lack <strong>of</strong> consensus in <strong>the</strong> genetic literature as <strong>to</strong> <strong>the</strong> biological interpretation <strong>of</strong><br />
relatively low levels <strong>of</strong> genetic differentiation. Delimiting <strong>the</strong> boundaries <strong>of</strong> s<strong>to</strong>ck<br />
structure is a complex matter and approaches <strong>to</strong> define s<strong>to</strong>cks in cases <strong>of</strong> low<br />
differentiation are still under development (Waples and Gaggiotti 2006). The use <strong>of</strong><br />
microsatellites and <strong>the</strong> assumptions used in <strong>the</strong> interpretation (no selection, no<br />
migration, randomly mating populations, temporal data) and <strong>the</strong> need <strong>for</strong> random<br />
samples are susceptible <strong>to</strong> error which becomes more significant <strong>for</strong> low FST values<br />
typical <strong>for</strong> marine species and within <strong>the</strong> range <strong>of</strong> those reported <strong>for</strong> alewife (Waples<br />
1998; Balloux and Lugon-Moulin 2002). In an evaluation <strong>of</strong> current methods used<br />
<strong>for</strong> s<strong>to</strong>ck definition, Waples and Gaggiotti (2006) showed that even widely accepted<br />
clustering <strong>to</strong>ols may not accurately assign populations in less than ideal sampling<br />
conditions. The results <strong>of</strong> <strong>the</strong> existing investigations provides support <strong>for</strong> additional<br />
studies using genetic methods in Maine, yet <strong>the</strong>y should not be relied upon solely <strong>to</strong><br />
make management decisions in cases <strong>of</strong> low differentiation.<br />
Management experience in Maine and elsewhere supports <strong>the</strong> use <strong>of</strong> exogenous<br />
transfer <strong>of</strong> fish <strong>to</strong> res<strong>to</strong>re extirpated runs. A large number <strong>of</strong> extirpated alewife runs<br />
have been re-established in Maine over <strong>the</strong> last three decades and appear <strong>to</strong> be<br />
self-sustaining. Long-term moni<strong>to</strong>ring <strong>of</strong> large res<strong>to</strong>ration projects (Androscoggin<br />
and Kennebec Rivers) have demonstrated <strong>the</strong> success <strong>of</strong> using exogenous s<strong>to</strong>cks <strong>to</strong><br />
initiate runs that can <strong>the</strong>n be used as <strong>the</strong> source <strong>for</strong> fur<strong>the</strong>r res<strong>to</strong>ration ef<strong>for</strong>ts in <strong>the</strong><br />
watershed. There are also numerous successful accidental or intentional alewife<br />
introductions in lakes and in contemporary times (several examples are included in<br />
<strong>the</strong> genetic literature). These introductions coupled with <strong>the</strong> management<br />
experience <strong>of</strong> using exogenous transfer <strong>of</strong> fish <strong>to</strong> res<strong>to</strong>re runs suggest a somewhat<br />
resilient life his<strong>to</strong>ry.<br />
The recent ASMFC planning process also recognizes that fish transfers may be<br />
necessary <strong>to</strong> reestablish populations that have been extirpated from <strong>the</strong>ir habitat due<br />
<strong>to</strong> dams or o<strong>the</strong>r fac<strong>to</strong>rs (ASMFS 2008a, ASMFS 2007a). One <strong>of</strong> <strong>the</strong> plan’s<br />
management recommendations is an alosine s<strong>to</strong>cking program, including<br />
reintroduction <strong>to</strong> <strong>the</strong> his<strong>to</strong>ric spawning areas, expansion <strong>of</strong> existing s<strong>to</strong>ck res<strong>to</strong>ration<br />
programs, and initiation <strong>of</strong> new strategies <strong>to</strong> enhance depressed s<strong>to</strong>cks. Limburg et<br />
al. (2007) peer reviewed <strong>the</strong> ASFMC American shad s<strong>to</strong>ck assessment (ASFMS<br />
2007a) did not raise fish transfers or hatchery supplementation as an issue,<br />
negatively or positively, even though <strong>the</strong>se methods were identified as a significant<br />
component <strong>of</strong> res<strong>to</strong>ration by many states. The use <strong>of</strong> exogenous fish transfers <strong>for</strong><br />
alewife is a well accepted method <strong>of</strong> res<strong>to</strong>ration by ASMFS and member states and<br />
<strong>the</strong> risk <strong>of</strong> <strong>the</strong>se methods have not be identified as a significant management<br />
concern.<br />
PRFP Page 120
3. Blueback Herring<br />
Meristic/Morphology or Genetic Investigations<br />
No literature was available that focused on s<strong>to</strong>ck identification <strong>for</strong> blueback herring<br />
based on morphology and/or meristic characteristics. Bentzen and Paterson (2005)<br />
compared a blueback herring population from <strong>the</strong> LaHave River with anadromous<br />
and non-anadromous alewife populations in <strong>the</strong> Saint Croix, LaHave and Gaspereau<br />
Rivers. As expected (a different species), <strong>the</strong> blueback herring were found <strong>to</strong> be<br />
very greatly differentiated (pairwise FST ranged between 0.37 <strong>to</strong> 0.52) from <strong>the</strong><br />
alewife populations. No inferences can be drawn from this study regarding blueback<br />
herring population structure since it was limited <strong>to</strong> one river.<br />
Management Experience<br />
Maine has not initiated any sustained program <strong>to</strong> transfer or culture blueback herring<br />
so blueback herring res<strong>to</strong>ration is completed through natural recovery or incidentally<br />
through alewife transfers. Fish transfers and culture have also not been widely used<br />
<strong>for</strong> blueback herring along <strong>the</strong> Atlantic Coast. The U.S. Fish and Wildlife Service in<br />
cooperation with <strong>the</strong> New Hampshire Fish and Game and Massachusetts Division <strong>of</strong><br />
Fish and Wildlife initiated a pilot study between 2000 and 2004 that transferred small<br />
numbers (from 47 <strong>to</strong> 1,307 fish) <strong>of</strong> gravid blueback herring from <strong>the</strong> Connecticut<br />
River/Chicopee River <strong>to</strong> <strong>the</strong> Ashuelot (NH) and Westfield (MA) Rivers (J. Rowan,<br />
personal communication, January 12, 2009). The program was suspended in 2005<br />
be<strong>for</strong>e it could be fully evaluated because <strong>of</strong> <strong>the</strong> regional decline in <strong>the</strong> blueback and<br />
<strong>the</strong> difficulty in capturing <strong>the</strong> fish. The U.S. Fish and Wildlife Service’s Harrison Lake<br />
National Fish Hatchery has developed culture method <strong>for</strong> blueback herring and is<br />
currently evaluating <strong>the</strong> use <strong>of</strong> hatchery fry <strong>to</strong> res<strong>to</strong>re an extirpated run at Kimages<br />
Creek (VA) (M. Odom, personal communication, January 13, 2009). They have<br />
release between 200,000 and 1,000,000 fry each year since 2005 and will be<br />
evaluating <strong>the</strong> pilot project in 2009.<br />
Summary<br />
No specific in<strong>for</strong>mation is known about <strong>the</strong> s<strong>to</strong>ck structure, size, or spawning<br />
locations <strong>of</strong> blueback herring in <strong>the</strong> Penobscot River or tributaries except that a<br />
remnant population exists. The ASMFS has defined s<strong>to</strong>cks <strong>for</strong> blueback herring as<br />
<strong>the</strong> river <strong>of</strong> origin and no literature is available on s<strong>to</strong>ck identification based on ei<strong>the</strong>r<br />
meristic/morphology or genetic investigations that would refine this s<strong>to</strong>ck definition.<br />
Maine and o<strong>the</strong>r states along <strong>the</strong> Atlantic Coast have not initiated any sustained<br />
program <strong>to</strong> transfer or culture blueback herring so blueback herring res<strong>to</strong>ration is<br />
completed through natural recovery or incidentally through alewife transfers.<br />
Hatchery culture and s<strong>to</strong>ck transfer methods <strong>for</strong> blueback herring have been<br />
developed but have not been fully evaluated <strong>for</strong> res<strong>to</strong>ration purposes.<br />
PRFP Page 121
4. American Shad<br />
Management S<strong>to</strong>ck Structure<br />
A peer review <strong>of</strong> <strong>the</strong> ASMFS s<strong>to</strong>ck assessment <strong>for</strong> shad (Limburg et al. 2007)<br />
confirmed <strong>the</strong> use <strong>of</strong> individual river s<strong>to</strong>cks as <strong>the</strong> management unit and also<br />
suggested <strong>the</strong> use <strong>of</strong> assessment approaches using regional models that reflect life<br />
his<strong>to</strong>ry differences in <strong>the</strong> s<strong>to</strong>cks (sou<strong>the</strong>rn, Mid-Atlantic and North Atlantic). The<br />
State <strong>of</strong> Maine currently manages shad s<strong>to</strong>cks based on <strong>the</strong> river <strong>of</strong> origin. No<br />
specific in<strong>for</strong>mation is known about <strong>the</strong> s<strong>to</strong>ck structure, size, or spawning locations<br />
<strong>of</strong> shad in <strong>the</strong> Penobscot River or tributaries except that a remnant population exists.<br />
Anecdotal in<strong>for</strong>mation suggest that <strong>the</strong> remnant population is small because <strong>of</strong> <strong>the</strong><br />
low frequency and number <strong>of</strong> shad documented in <strong>the</strong> Veazie Project fishway, <strong>the</strong><br />
low frequency collected during past surveys, and <strong>the</strong> estimated starting populations<br />
in o<strong>the</strong>r river systems.<br />
Meristic/Morphology or Genetic Investigations<br />
Earlier work on American shad included <strong>the</strong> analysis <strong>of</strong> o<strong>to</strong>liths (Williams 1985) and<br />
meristic and morphometric characteristic (Melvin 1984) <strong>to</strong> assign shad from a mixeds<strong>to</strong>ck<br />
summer fishery <strong>to</strong> one <strong>of</strong> three broad regions (Canadian Atlantic, mid-US<br />
Atlantic, and south-US Atlantic). Later work by Melvin et al. (1992) examined<br />
morphology and meristic characteristics <strong>for</strong> American shad from fourteen rivers<br />
between Florida and Quebec. They were able <strong>to</strong> discern a south <strong>to</strong> north separation<br />
within four broad regions (Florida <strong>to</strong> Cape Lookout; Cape Lookout <strong>to</strong> Cape Cod; Bay<br />
<strong>of</strong> Fundy; and Gulf <strong>of</strong> Saint Lawrence). The separation between adjacent regions<br />
was less apparent than between regions more geographically distant. They were<br />
able <strong>to</strong> correctly classify individuals from a mixed-s<strong>to</strong>ck <strong>to</strong> each region with a 79 and<br />
89 percent correct classification.<br />
Genetic investigations <strong>to</strong> discriminate populations <strong>of</strong> American shad based on<br />
morphology, protein electrophoresis, and analysis <strong>of</strong> mi<strong>to</strong>chondrial DNA (mtDNA)<br />
and nuclear DNA microsatellite variation have found shad populations <strong>to</strong> be only<br />
weakly <strong>to</strong> moderately differentiated and subject <strong>to</strong> substantial amounts <strong>of</strong> gene flow<br />
(Nolan et al. 2003).<br />
Four studies that used restriction endonuclease (RE) analysis <strong>of</strong> mi<strong>to</strong>chondrial DNA<br />
(mtDNA) found that differences among 23 east coast shad populations occurred<br />
primarily as variations in <strong>the</strong> frequencies <strong>of</strong> common and shared mtDNA haplotypes<br />
(Bentzen et al. 1989; Nolan et al. 1991; Epifanio et al. 1995), and haplotype<br />
frequencies generally were temporally stable (Brown et al. 1996). Because no<br />
single or group <strong>of</strong> haplotypes completely discriminated river s<strong>to</strong>cks or regional<br />
complexes, only 28 percent <strong>of</strong> individual fish could be correctly reallocated <strong>to</strong> <strong>the</strong>ir<br />
river <strong>of</strong> origin (Epifanio et al. 1995). Surprisingly, a major life his<strong>to</strong>ry variation<br />
(semelparity in populations south <strong>of</strong> Chesapeake Bay and iteroparity <strong>to</strong> <strong>the</strong> north)<br />
was not revealed by <strong>the</strong> mtDNA analysis. In a study <strong>of</strong> three anadromous fish<br />
PRFP Page 122
populations, Waldman et al. (1996) use mtDNA <strong>to</strong> examine population structure <strong>of</strong><br />
shad from <strong>the</strong> Connecticut, Hudson and Delaware Rivers. They found that <strong>the</strong><br />
populations from <strong>the</strong>se rivers were extremely diverse showing no significant<br />
heterogeneity in <strong>the</strong> mtDNA frequencies. They surmised that gene flow among<br />
neighboring American shad populations are <strong>to</strong>o great <strong>to</strong> allow differentiation.<br />
Results were similar in studies using microsatellite DNA. Julian and Bartron (2008)<br />
used mtDNA and microsatellite data <strong>to</strong> examine American shad population structure<br />
on <strong>the</strong> Susquehanna, Delaware and Hudson Rivers. They determined that <strong>the</strong> shad<br />
populations in <strong>the</strong>se three rivers were not significantly differentiated from each o<strong>the</strong>r<br />
because <strong>of</strong> <strong>the</strong> lack <strong>of</strong> numerous distinct haplotypes in <strong>the</strong> mtDNA and lack <strong>of</strong><br />
differentiation in <strong>the</strong> microsatellite data (pairwise FST between 0.001 and 0.0026).<br />
However, <strong>the</strong> lack <strong>of</strong> significant population differences observed in <strong>the</strong> three rivers<br />
was not unexpected given <strong>the</strong> high levels <strong>of</strong> exogenous s<strong>to</strong>ck transfer. Waters et al.<br />
(2000) found that both mtDNA and microsatellite DNA were able <strong>to</strong> distinguish subtle<br />
differences <strong>for</strong> <strong>the</strong> Atlantic coast <strong>for</strong> populations <strong>of</strong> American shad from <strong>the</strong> James,<br />
Pamunkey and Hudson Rivers (FST ≈ 0.01 <strong>for</strong> certain loci and FST=0.0063 <strong>for</strong> all loci).<br />
Straying among <strong>the</strong>se rivers (3.9 <strong>to</strong> 71.2 breeders per generation, depending on<br />
calculation method) was sufficient <strong>to</strong> permit only marginal population differentiation.<br />
These results may be conservative given that weak differentiation was detected with<br />
a low number <strong>of</strong> markers (5 microsatellite loci).<br />
Unpublished results from Bentzen (personal communication, December 3, 2008) <strong>for</strong><br />
shad populations in rivers <strong>of</strong> <strong>the</strong> Bay <strong>of</strong> Fundy have shown moderate <strong>to</strong> great<br />
differentiation (FST values up <strong>to</strong> 0.07, or corrected <strong>for</strong> <strong>the</strong> high heterozygosity up <strong>to</strong><br />
0.24). Based on this data, he believes that genetically effective straying in shad<br />
must be very low.<br />
Waters et al. (2000) also compared an introduced, non-native shad population from<br />
<strong>the</strong> Columbia River (OR, WA) <strong>to</strong> <strong>the</strong> Hudson River s<strong>to</strong>ck, its source population.<br />
Their study found that <strong>the</strong> Columbia River population was highly differentiated from<br />
<strong>the</strong> Atlantic Coast populations. Shad is a recent invader <strong>to</strong> <strong>the</strong> Columbia River,<br />
introduced in <strong>the</strong> late 19 th century. Rottiers et al. (1992) noted significant differences<br />
in <strong>the</strong> growth and behavior and temperature and salinity <strong>to</strong>lerance <strong>of</strong> juvenile shad<br />
from <strong>the</strong> Columbia and Delaware Rivers. The Columbia River fish grew significantly<br />
faster, attained a greater final weight, and had lower mortalities at all <strong>the</strong> test<br />
salinities and temperatures than <strong>the</strong> Delaware River fish. This example suggests<br />
that changes <strong>to</strong> <strong>the</strong> shad population structure may occur relatively soon (within 20<br />
generations) after an introduction.<br />
Management Experience<br />
A number <strong>of</strong> states currently use or have used exogenous fish transfers and/or<br />
hatchery supplementation <strong>to</strong> res<strong>to</strong>re American shad (ASMFC 1999; ASMFC 2007a;<br />
Hendricks 2003). This management practice is well established and is incorporated<br />
in <strong>the</strong> ASMFC definition <strong>for</strong> res<strong>to</strong>ration (ASMFC 2007a). In <strong>the</strong> New England states,<br />
PRFP Page 123
Maine, New Hampshire, Massachusetts and Rhode Island have used fish transfers<br />
or hatchery supplementation <strong>for</strong> shad with most fish originating from <strong>the</strong> Merrimack<br />
or Connecticut Rivers. In <strong>the</strong> Mid-Atlantic states, shad res<strong>to</strong>ration has primarily<br />
focused in <strong>the</strong> Susquehanna River and <strong>the</strong> tributaries <strong>to</strong> <strong>the</strong> Chesapeake Bay, which<br />
include both fish transfers and hatchery supplementation through federal and state<br />
programs in New York, Pennsylvania, Maryland, and Virginia. Delaware, Hudson<br />
and Connecticut River shad s<strong>to</strong>cks were used in <strong>the</strong> Susquehanna River res<strong>to</strong>ration<br />
ef<strong>for</strong>ts. New Jersey also has conducted a s<strong>to</strong>cking program in <strong>the</strong> Raritan River.<br />
The South Atlantic states do not have alosine res<strong>to</strong>ration programs that involve fish<br />
transfers or hatchery supplementation except <strong>for</strong> North Carolina, which has s<strong>to</strong>cked<br />
shad in<strong>to</strong> <strong>the</strong> Roanoke River. The most recent account <strong>of</strong> <strong>the</strong>se activities is included<br />
in ASMFC (2008b) and documents <strong>the</strong> hatchery supplementation <strong>of</strong> over 22 million<br />
shad in seven states and 12 rivers.<br />
Shad are known <strong>to</strong> be present in 9 rivers in Maine, however active res<strong>to</strong>ration is<br />
occurring only in <strong>the</strong> Saco, Androscoggin and Kennebec Rivers (Lary 1999; ASMFC<br />
2007a <strong>for</strong> a full account on <strong>the</strong> status <strong>of</strong> shad in Maine). A multi-government<br />
strategic plan was developed <strong>for</strong> shad res<strong>to</strong>ration on <strong>the</strong> Penobscot River in 2001,<br />
however few measures were ever implemented from <strong>the</strong> plan because <strong>of</strong> <strong>the</strong> lack <strong>of</strong><br />
resources except <strong>for</strong> <strong>the</strong> group’s work in initiating <strong>the</strong> multiparty settlement<br />
agreement <strong>to</strong> improve fish passage (FWS et al. 2001). <strong>Res<strong>to</strong>ration</strong> is currently<br />
achieved through natural recovery in <strong>the</strong> Saco River and Narraguagus River.<br />
<strong>Res<strong>to</strong>ration</strong> in <strong>the</strong> Kennebec and Androscoggin includes fish transfers and/or<br />
hatchery supplementation. These res<strong>to</strong>ration ef<strong>for</strong>ts were initiated in <strong>the</strong> mid-1980s<br />
and primarily use exogenous s<strong>to</strong>cks from <strong>the</strong> Connecticut and Merrimack, although<br />
<strong>the</strong> Cathance and Narraguagus River s<strong>to</strong>cks were also used on a very limited basis.<br />
In <strong>the</strong> Androscoggin River a <strong>to</strong>tal <strong>of</strong> 5,374 and 2,234 adult fish have been transferred<br />
since 1985 from <strong>the</strong> Connecticut and Merrimack Rivers, respectively. Hatchery<br />
supplementation has occurred since 1999 with a <strong>to</strong>tal <strong>of</strong> 4.8 million larvae released<br />
<strong>of</strong> a primarily Merrimack River origin. In <strong>the</strong> Kennebec River a <strong>to</strong>tal <strong>of</strong> 7,420 adult<br />
fish have been transferred from <strong>the</strong> Connecticut River since 1988. Hatchery<br />
supplementation has occurred since 1992 with a <strong>to</strong>tal <strong>of</strong> 30 million larvae released<br />
primarily Merrimack River.<br />
The primary management challenge when res<strong>to</strong>ring shad through fish transfers<br />
and/or hatchery supplementation is obtaining fish from donor sources. The sources<br />
<strong>of</strong> broods<strong>to</strong>ck <strong>for</strong> Maine are limited because <strong>of</strong> <strong>the</strong> low population size in most Maine<br />
Rivers; difficulty in collecting fish at fishways because <strong>the</strong>y are poorly functioning<br />
(Brunswick Project fishway) or <strong>the</strong>y have recently been constructed (Ben<strong>to</strong>n Falls<br />
and Lockwood Projects); and/or that <strong>the</strong> shad numbers are used as management<br />
triggers <strong>to</strong> construct future upstream fishways so <strong>the</strong>re is a reluctance <strong>to</strong> use those<br />
s<strong>to</strong>cks <strong>for</strong> supplementation (Kennebec River). Donor sources currently available <strong>to</strong><br />
Maine that are <strong>of</strong> sufficient population size are runs in <strong>the</strong> Merrimack and<br />
Connecticut Rivers.<br />
PRFP Page 124
Summary<br />
No specific in<strong>for</strong>mation is known about <strong>the</strong> s<strong>to</strong>ck structure, size, or spawning<br />
locations <strong>of</strong> American shad in <strong>the</strong> Penobscot River or tributaries except that a<br />
remnant population exists. The ASMFS has defined shad s<strong>to</strong>cks based on <strong>the</strong> river<br />
<strong>of</strong> origin and this is consistent with <strong>the</strong> State <strong>of</strong> Maine’s management definition. The<br />
management definition <strong>of</strong> a s<strong>to</strong>ck reflects <strong>the</strong> harvest approach and lends support<br />
<strong>for</strong> homing <strong>of</strong> shad <strong>to</strong> natal rivers.<br />
The published literature available on s<strong>to</strong>ck identification based ei<strong>the</strong>r on<br />
meristic/morphology or genetic investigations indicates weak <strong>to</strong> weakly moderate<br />
differentiation. As with alewife, <strong>the</strong>se results are consistent with homing <strong>to</strong> natal<br />
rivers but with a stray rate that appears <strong>to</strong> be large enough <strong>to</strong> provide effective<br />
genetic interchange between populations (<strong>the</strong> range <strong>of</strong> <strong>the</strong> FST values reported was<br />
0.001 <strong>to</strong> 0.006 which would correspond with between 41 and 250 genetically<br />
effective migrants per generation using <strong>the</strong> approximation <strong>of</strong> FST ≈ 1/(1 + 4mNe)<br />
described in Waples (1998)). These results have <strong>to</strong> be interpreted very careful given<br />
<strong>the</strong> extensive use <strong>of</strong> exogenous fish transfers and/or hatchery supplementation <strong>of</strong><br />
shad in <strong>the</strong> Mid-Atlantic and New England states. Unpublished data from Bentzen<br />
appears <strong>to</strong> indicate greater differentiation <strong>of</strong> shad populations in <strong>the</strong> Bay <strong>of</strong> Fundy<br />
and <strong>the</strong> potential that shad gene flow is much lower (a maximum <strong>of</strong> 3 genetically<br />
effective migrants per generation) than reported in <strong>the</strong> published literature.<br />
We choose <strong>to</strong> consider all <strong>of</strong> <strong>the</strong> available sources <strong>to</strong> understand how shad<br />
populations may (or may not) be structured. There are a number <strong>of</strong> genetic<br />
investigations prior <strong>to</strong> <strong>the</strong> development <strong>of</strong> methods using microsatellites and <strong>the</strong>re<br />
appears <strong>to</strong> be a general expectation that <strong>the</strong> newer techniques will provide a<br />
dramatically higher resolution <strong>of</strong> s<strong>to</strong>ck structure. This may not be true in all cases<br />
and Waples (1998) cautions against drawing this general conclusion because <strong>the</strong><br />
biological process (migration and genetic drift) should similarly act upon all markers.<br />
As discussed in <strong>the</strong> alewife section (see above), <strong>the</strong> interpretation <strong>of</strong> <strong>the</strong> genetic<br />
in<strong>for</strong>mation <strong>for</strong> management purposes are not straight <strong>for</strong>ward especially in cases <strong>of</strong><br />
weak differentiation. This interpretation is fur<strong>the</strong>r confounded by <strong>the</strong> lack<br />
concordance <strong>of</strong> <strong>the</strong> existing published literature with preliminary results from<br />
Bentzen. More genetic investigations are necessary <strong>to</strong> better understand <strong>the</strong><br />
population structure in Maine, however <strong>the</strong>y should not be relied upon solely <strong>to</strong><br />
make management decisions in cases <strong>of</strong> low differentiation.<br />
Management experience in Maine and elsewhere supports <strong>the</strong> use <strong>of</strong> exogenous<br />
transfer <strong>of</strong> fish and hatchery supplementation <strong>to</strong> res<strong>to</strong>re extirpated runs. These<br />
management methods are widespread through most <strong>of</strong> <strong>the</strong> states with shad<br />
res<strong>to</strong>ration programs along <strong>the</strong> Atlantic Coast. Shad populations have been reestablished<br />
using <strong>the</strong>se methods <strong>to</strong>ge<strong>the</strong>r with improved fish passage and habitat<br />
conditions (Merrimack, Pawcatuck, Connecticut and Susquehanna Rivers). O<strong>the</strong>r<br />
states have identified <strong>the</strong> importance <strong>of</strong> hatchery supplementation in sustaining<br />
PRFP Page 125
depressed populations (ASFMC 2007a; Hendricks 2003). There has been little<br />
comprehensive evaluation <strong>of</strong> <strong>the</strong> hatchery programs with marked fish except <strong>for</strong> <strong>the</strong><br />
well-funded programs, such as <strong>the</strong> Susquehanna River, however <strong>the</strong> general<br />
consensus is that <strong>the</strong>se programs are beneficial and are a useful <strong>to</strong>ol as part <strong>of</strong> a<br />
comprehensive res<strong>to</strong>ration program (Hendricks 2003).<br />
The recent ASMFC planning process also recognizes that fish transfers may be<br />
necessary <strong>to</strong> reestablish populations that have been extirpated from <strong>the</strong>ir habitat due<br />
<strong>to</strong> dams or o<strong>the</strong>r fac<strong>to</strong>rs (ASMFS 2008a, ASMFS 2007a). One <strong>of</strong> <strong>the</strong> plan’s<br />
management recommendations is an alosine s<strong>to</strong>cking program, including<br />
reintroduction <strong>to</strong> <strong>the</strong> his<strong>to</strong>ric spawning areas, expansion <strong>of</strong> existing s<strong>to</strong>ck res<strong>to</strong>ration<br />
programs, and initiation <strong>of</strong> new strategies <strong>to</strong> enhance depressed s<strong>to</strong>cks. Limburg et<br />
al. (2007) peer reviewed <strong>the</strong> ASFMC American shad s<strong>to</strong>ck assessment (ASFMS<br />
2007a) did not raise fish transfers or hatchery supplementation as an issue,<br />
negatively or positively, even though <strong>the</strong>se methods were identified as a significant<br />
component <strong>of</strong> res<strong>to</strong>ration by many states. The use <strong>of</strong> exogenous fish transfers <strong>for</strong><br />
shad is a well accepted method <strong>of</strong> res<strong>to</strong>ration by ASMFS and <strong>the</strong> member states,<br />
and <strong>the</strong> risk <strong>of</strong> <strong>the</strong>se methods has not been indentified as a significant issue in <strong>the</strong><br />
planning documents.<br />
PRFP Page 126
References<br />
Anderson, M.G., Vickery, B., Gorman, M., Grat<strong>to</strong>n, L., Morrison, M., Maillet, J.,<br />
Olivero, A., Ferree, C., Morse, D., Kehm, G., Rosalska, K., Khanna, S., and S.<br />
Bernstein. 2006. The Nor<strong>the</strong>rn Appalachian / Acadian Ecoregion: Ecoregional<br />
Assessment, Conservation Status and Resource CD. The Nature Conservancy,<br />
Eastern Conservation Science and The Nature Conservancy <strong>of</strong> Canada: Atlantic and<br />
Quebec regions.<br />
Atlantic State Marine Fisheries Commission (ASMFS). 1990. S<strong>to</strong>ck Assessment <strong>of</strong><br />
River Herring from Selected Coastal Rivers. Special Report No. 19. Washing<strong>to</strong>n<br />
D.C.<br />
Atlantic State Marine Fisheries Commission (ASMFS). 1999. Amendment 1 <strong>to</strong> <strong>the</strong><br />
Intestate Fishery Management <strong>Plan</strong> <strong>for</strong> Shad & River Herring. Fisheries<br />
Management Report No. 35. Washing<strong>to</strong>n D.C.<br />
Atlantic State Marine Fisheries Commission (ASMFS). 2007a. American Shad S<strong>to</strong>ck<br />
Assessment Report <strong>for</strong> Peer Review. Vol. I. S<strong>to</strong>ck Assessment Report No. 07-01<br />
(Supplement). Washing<strong>to</strong>n D.C.<br />
Atlantic State Marine Fisheries Commission (ASMFS). 2008a. Draft Amendment 2 <strong>to</strong><br />
<strong>the</strong> Instate Fisher Management <strong>Plan</strong> <strong>for</strong> Shad and River Herring. Washing<strong>to</strong>n D.C.<br />
Atlantic State Marine Fisheries Commission (ASMFS). 2008b. Review <strong>of</strong> <strong>the</strong><br />
Atlantic States Marine Fisheries Commission Fishery Management <strong>Plan</strong> <strong>for</strong> Shad<br />
and River Herring (Alosa spp.) – 2007. Washing<strong>to</strong>n D.C.<br />
Balloux, F. and N. Lugon-Moulin. 2002. The estimation <strong>of</strong> population differentiation<br />
with microsatellite markers. Molecular Ecoogy. 11: 155-165.<br />
Bentzen, P, G. G .Brown, and W. C. Leggett. 1989. Mi<strong>to</strong>chondrial DNA<br />
polymorphism, population structure, and life his<strong>to</strong>ry variation in American shad<br />
(Alosa sapidissima). Canadian Journal <strong>of</strong> Fisheries and Aquatic Sciences. 46 (8):<br />
1446-1454.<br />
Bentzen and Patterson. 2005. Genetic Analyses <strong>of</strong> Freshwater and Anadromous<br />
Alewife (Alosa pseudoharengus) Populations from <strong>the</strong> St. Croix River, Maine/New<br />
Brunswick. Final Report <strong>to</strong> Maine River. Hallowell, Maine.<br />
Brown, B. L, J. M. Epifanio, P. E. Smouse, and C. J. Kobak. 1996. Temporal<br />
stability <strong>of</strong> mtDNA haplotype frequencies in American shad s<strong>to</strong>cks: To pool or not <strong>to</strong><br />
pool across years? Canadian Journal <strong>of</strong> Fisheries and Aquatic Sciences. 53(10):<br />
2274-2283.<br />
PRFP Page 127
Chilakamarri, S. R. , 2005. Genetic differtiation in alewife populations using<br />
microsatellite loci. M.S. Thesis. Worcester Polytechnic Institute. 72 pp.<br />
Epifanio, J. M., P. E. Smouse, C. J. Kobak, and B. L. Brown. 1995. Mi<strong>to</strong>chondrial<br />
DNA divergence among populations <strong>of</strong> American shad (Alosa sapidissima): How<br />
much variation is enough <strong>for</strong> mixed-s<strong>to</strong>ck analysis? Canadian Journal <strong>of</strong> Fisheries<br />
and Aquatic Sciences. 52(8): 1688-1702.<br />
Hendricks, M. L. 2003. Culture and transplant <strong>of</strong> Alosines in North America. In<br />
Biodiversity, Status and Conservation <strong>of</strong> <strong>the</strong> World’s Shads. American Fisheries<br />
Society Symposium 35: 303-312.<br />
Higgins, J. V., M. T. Bryer, M. L. Khoury and T. W. Fitzhugh. 2005. A freshwater<br />
classification approach <strong>for</strong> biodiversity conservation planning. Conservation Biology.<br />
19(2): 432-445.<br />
Ihssen, P. E., G. W. Martin, and D. W. Rodger. 1992. Allozyme variation <strong>of</strong> Great<br />
Lakes alewife, Alosa pseudoharengus: genetic differentiation and affinities <strong>of</strong> a<br />
recent invader. Canadian Journal <strong>of</strong> Fisheries and Aquatic Sciences. 49: 1770-<br />
1799.<br />
Julian and Bartron. 2008. Genetic assessment <strong>of</strong> Sesquehanna River shad. In<br />
<strong>Res<strong>to</strong>ration</strong> <strong>of</strong> American Shad <strong>to</strong> <strong>the</strong> Sesquehanna River – Annual Progress Report<br />
2006. Susquehanna River Anadromous Fish <strong>Res<strong>to</strong>ration</strong> Cooperative. Lamar,<br />
Pennsylvania.<br />
Lary, S.L. 1999. State <strong>of</strong> Maine Recovery <strong>Plan</strong> <strong>for</strong> American Shad (Alosa<br />
sapidissima) and River Herring (A. pseudoharengus and A. aestivalis). Maine<br />
Department <strong>of</strong> Marine Resources. Augusta, Maine.<br />
Limburg K., J. Gibson, W. Pine, T. Quinn and N. J. Sands. 2007. Terms <strong>of</strong><br />
Reference and Advisory Report <strong>to</strong> <strong>the</strong> American Shad S<strong>to</strong>ck Assessment Peer<br />
Review. Atlantic States Marine Fisheries Commission. S<strong>to</strong>ck Assessment Report<br />
No. 07-01. Washing<strong>to</strong>n D.C. 31 pp.<br />
Maine Department <strong>of</strong> Marine Resources (MDMR) and Maine Department <strong>of</strong> Inland<br />
Fisheries and Wildlife (MDIFW). 2008. Strategic <strong>Plan</strong> <strong>for</strong> <strong>the</strong> <strong>Res<strong>to</strong>ration</strong> <strong>of</strong><br />
<strong>Diadromous</strong> Fish <strong>to</strong> <strong>the</strong> Penobscot River. Augusta, Maine. 108 pp.<br />
Messieh, S. N. 1977. Population structure and biology <strong>of</strong> alewives (Alosa<br />
pseudoharengus) and blueback herring (A. aestivalis) in <strong>the</strong> Saint John River, New<br />
Brunswick. Environ. Biol. Fish. 2(3): 195-210<br />
Melvin, G. D. 1984. The usefulness <strong>of</strong> meristic and morphometric characters in<br />
discriminating populations <strong>of</strong> American shad (Alosa sapidissima) inhabiting<br />
PRFP Page 128
Cumberland Basin, New Brunswick. Ph. D. Dissertation. University <strong>of</strong> New<br />
Brunswick.<br />
Melvin, G.D., M. J. Dadswell, and J. A. McKenzie. 1992. Usefulness <strong>of</strong> meristic and<br />
morphometric characters in discriminating populations <strong>of</strong> American shad (Alosa<br />
sapidissima (Osteichthyes: Clupeidae) inhabiting a marine environment. Canadian<br />
Journal <strong>of</strong> Fisheries and Aquatic Sciences. 49(2): 266-280.<br />
Nolan, K, J., Grossfield, and I Wirgin. 1991. Discrimination among Atlantic coast<br />
populations <strong>of</strong> American shad (Alosa sapidissima) using mi<strong>to</strong>chondrial DNA.<br />
Canadian Journal <strong>of</strong> Fisheries and Aquatic Sciences. 48(9):1724-1734.<br />
Nolan, K. A., J. R. Waldman, and I. Wirgin. 1993. Intraspecific and interspecific<br />
molecular differentiation <strong>of</strong> American shad and Alabama shad: A syn<strong>the</strong>sis. In<br />
Biodiversity, Status and Conservation <strong>of</strong> <strong>the</strong> World’s Shads. American Fisheries<br />
Society Symposium 35: 295-302.<br />
Palkova et al. 2008. Independent evolutionary origins <strong>of</strong> landlocked alewife<br />
populations and rapid parallel evolution <strong>of</strong> phenotypic traits. Molecular Ecology. 17:<br />
582-597.<br />
Rottiers, R. M., L. A. Redell, H.E. Booke, and J. Amaral. 1992. Difference in s<strong>to</strong>cks<br />
<strong>of</strong> American shad from <strong>the</strong> Columbia and Delaware Rivers. Transactions <strong>of</strong><br />
American Fisheries Society. 121: 132-136.<br />
U.S Fish and Wildlife Service (FWS), Penobscot Indian Nation, Maine Deparment <strong>of</strong><br />
Marine Resources, and Maine Department <strong>of</strong> Inland Fisheries and Wildlife. 2001. A<br />
Strategic <strong>Plan</strong> <strong>to</strong> Res<strong>to</strong>re American Shad (Alosa sapidissima) <strong>to</strong> <strong>the</strong> Penobscot<br />
River, Maine. Augusta, Maine.<br />
Waldman et al. 1996. Genetic differentiation <strong>of</strong> three key anadromous fish<br />
populations <strong>of</strong> <strong>the</strong> Hudson River. Estuaries. 19(4): 759-768<br />
Waples, R. S. 1998. Separating <strong>the</strong> wheat from <strong>the</strong> chaff: patterns <strong>of</strong> genetic<br />
differentiation in high gene flow species. American Genetic Association Symposium.<br />
89: 438-450.<br />
Waples, R. S. and O. Gaggiotti. 2006. What is a population? An empirical<br />
evaluation <strong>of</strong> some genetic methods <strong>for</strong> identifying <strong>the</strong> number <strong>of</strong> gene pools and<br />
<strong>the</strong>ir degree <strong>of</strong> connectivity. Molecular Ecology. 15: 1419-1439.<br />
Waters, J. M,. J. M. Epifanio, T. Gunter, and B. L. Brown. 2000. Homing behavior<br />
facilitates subtle genetic differentiation among river populations <strong>of</strong> Alosa<br />
sapidissima: microsatellites and mtDNA. Journal <strong>of</strong> Fish Biology. 56(3): 622-636.<br />
Williams. 1985. Use <strong>of</strong> o<strong>to</strong>liths <strong>for</strong> s<strong>to</strong>ck differentiation <strong>of</strong> American shad (Alosa<br />
sapidissima). M.S. Thesis. Acadia University, Canada. 56 pp.<br />
PRFP Page 129
Appendix B - Viability <strong>of</strong> Salmon Sub-Populations by Reach in <strong>the</strong> Penobscot<br />
Basin<br />
Author: Greg Mackey<br />
The Penobscot River basin consists <strong>of</strong> at least six sub-drainages upstream <strong>of</strong>, and<br />
four downstream <strong>of</strong> Veazie Dam, where at least that number <strong>of</strong> sub-populations <strong>of</strong><br />
Atlantic salmon may occur. However, <strong>the</strong>re is little in<strong>for</strong>mation on <strong>the</strong> his<strong>to</strong>ric<br />
population structure in <strong>the</strong> Penobscot basin and currently <strong>the</strong> Penobscot basin is<br />
managed as a panmictic meta-population. However, based on geography and<br />
estimates <strong>of</strong> habitat quantity, coupled with <strong>the</strong>ory <strong>of</strong> salmon homing and straying, it<br />
is reasonable <strong>to</strong> assume that sub-populations existed in <strong>the</strong> Penobscot and <strong>to</strong> plan<br />
<strong>to</strong> manage <strong>for</strong> res<strong>to</strong>ration <strong>of</strong> such sub-populations. These sub-populations would be<br />
reproductively isolated, but with levels <strong>of</strong> straying that would allow gene flow and<br />
provide demographic stability. Defining likely sub-populations and predicting <strong>the</strong>ir<br />
viability will assist in developing management strategies and allocating limited<br />
resources.<br />
Currently, <strong>the</strong> greatest potential influences on salmon population structure in <strong>the</strong><br />
Penobscot basin are <strong>the</strong> large dams (primarily hydroelectric). Their locations relative<br />
<strong>to</strong> major sub-drainages and <strong>the</strong> spatial distribution and quantity <strong>of</strong> salmon habitat<br />
define <strong>the</strong> geography <strong>of</strong> <strong>the</strong> basin <strong>for</strong> Atlantic salmon and o<strong>the</strong>r diadromous species.<br />
The two life stages <strong>of</strong> salmon that are most affected by dams are emigrating smolts<br />
and immigrating adults. Each dam has differing fish passage efficiencies <strong>for</strong> adults<br />
and mortality rates <strong>for</strong> smolts that depend in part on environmental conditions. For<br />
<strong>the</strong> purposes <strong>of</strong> this discussion, <strong>the</strong> inability <strong>to</strong> reach natal spawning areas<br />
(cumulative passage efficiencies) is treated as mortality.<br />
Although marine survival plays a pivotal role in salmon population dynamics, <strong>the</strong><br />
freshwater environment must be able <strong>to</strong> compensate during low marine survival<br />
phases. McElhany et al. (2000) describe <strong>the</strong> role <strong>the</strong> freshwater environment must<br />
play <strong>to</strong> ensure viable salmon populations: “A viable salmonid population should<br />
exhibit sufficient productivity during freshwater life his<strong>to</strong>ry stages <strong>to</strong> maintain its<br />
abundance at or above viable thresholds—even during poor ocean conditions. A<br />
population’s productivity should allow it both <strong>to</strong> exploit available habitat and exhibit a<br />
compensa<strong>to</strong>ry response at low population sizes. When spawner abundance is below<br />
<strong>the</strong> long-term mean, <strong>the</strong>re should be a corresponding increase in per capita smolt<br />
production, even though such an increase may not suffice <strong>to</strong> <strong>of</strong>fset declines in<br />
marine survival.” Understanding <strong>the</strong> freshwater productivity potential in <strong>the</strong><br />
Penobscot basin will be essential <strong>to</strong> res<strong>to</strong>ring salmon.<br />
We used a population matrix model, prior modeling results <strong>for</strong> <strong>the</strong> Penobscot<br />
(ASAL), locations <strong>of</strong> major dams, and related fish passage estimates, and spatial<br />
distribution <strong>of</strong> habitat <strong>to</strong> predict <strong>the</strong> viability <strong>of</strong> Atlantic salmon sub-populations in <strong>the</strong><br />
Penobscot basin. We divided <strong>the</strong> Penobscot basin in<strong>to</strong> reaches defined by dams<br />
and major sub-drainages (Table 1).<br />
PRFP Page 130
Table 1. Sub-drainage and reaches in <strong>the</strong> Penobscot Basin defined by dams.<br />
Upstream Downstream Upstream Downstream Length<br />
Stream SubDrainage Dam Reach Extent<br />
Extent km km<br />
(km)<br />
Lower<br />
Veazie <strong>to</strong><br />
Mainstem Penobscot Verona Island Veazie Verona Island 48 0 48<br />
Lower<br />
Mil<strong>for</strong>d <strong>to</strong><br />
Mainstem Penobscot Veazie Great Works Veazie 60 48 12<br />
Lower<br />
Mil<strong>for</strong>d <strong>to</strong><br />
Mainstem Penobscot Veazie Mil<strong>for</strong>d Great Works 62 60 2<br />
Mid<br />
West Enfield West<br />
Mainstem Penobscot <strong>to</strong> Mil<strong>for</strong>d Enfield/Howland Mil<strong>for</strong>d 101 62 39<br />
Mid<br />
Weldon <strong>to</strong><br />
Mainstem Penobscot West Enfield Weldon West Enfield 149 101 48<br />
Mid<br />
Medway <strong>to</strong><br />
Mainstem Penobscot Weldon Medway Weldon 161 149 12<br />
Lower<br />
Gilman Falls<br />
Stillwater Penobscot <strong>to</strong> Stillwater Orono Veazie<br />
Orono<br />
(confluence<br />
54 48 6<br />
Lower<br />
Gilman Falls<br />
with<br />
Stillwater Penobscot <strong>to</strong> Stillwater Stillwater mainstem 58 54 4<br />
Lower<br />
Gilman Falls<br />
Stillwater Penobscot <strong>to</strong> Stillwater Gilman Falls<br />
Browns' Mill<br />
Stillwater 64 58 6<br />
Browns' Mill (Dover Foxcr<strong>of</strong>t<br />
Piscataquis Piscataquis <strong>to</strong> Howland Lower) Howland 165 100 65<br />
Moosehead Moosehead Browns' Mill<br />
Manufacturing Manufacturing (Dover<br />
<strong>to</strong> Browns' (Dover Foxcr<strong>of</strong>t Foxcr<strong>of</strong>t<br />
Piscataquis Piscataquis Mill<br />
Upper)<br />
Lower)<br />
Moosehead<br />
Manufacturing<br />
166 165 1<br />
Guil<strong>for</strong>d <strong>to</strong><br />
(Dover<br />
Moosehead<br />
Foxcr<strong>of</strong>t<br />
Piscataquis Piscataquis Manufacturing<br />
Guil<strong>for</strong>d <strong>to</strong><br />
Guil<strong>for</strong>d<br />
Upper) 180 166 14<br />
Piscataquis Piscataquis Headwaters Headwaters Guil<strong>for</strong>d<br />
Confluence<br />
225 180 45<br />
Browns' Mill<br />
with<br />
Pleasant Piscataquis <strong>to</strong> Howland Headwaters Piscataquis<br />
Confluence<br />
213 132 81<br />
Headwaters<br />
with<br />
East Branch East Branch <strong>to</strong> Weldon Headwaters Mainstem<br />
Confluence<br />
238 160 78<br />
Weldon <strong>to</strong><br />
with<br />
Mattawamkeag Mattawamkeag West Enfield Headwaters Mainstem 275 142 133<br />
Mil<strong>for</strong>d <strong>to</strong><br />
Confluence<br />
Lower<br />
Lowell<br />
with<br />
Passadumkeag Penobscot Tannery<br />
Lowell<br />
Lowell Tannery Mainstem 114 93 21<br />
Lower<br />
Tannery <strong>to</strong><br />
Lowell<br />
Passadumkeag Penobscot Grand Falls Grand Falls Tannery<br />
Confluence<br />
135 114 21<br />
Lower<br />
Veazie <strong>to</strong><br />
with<br />
Kenduskeag Penobscot Verona Island Headwaters Mainstem<br />
Confluence<br />
98 40 58<br />
Lower<br />
Veazie <strong>to</strong><br />
with<br />
Souadabscook Penobscot Verona Island Headwaters Mainstem<br />
Confluence<br />
66 32 34<br />
Lower<br />
Veazie <strong>to</strong><br />
with<br />
Cove<br />
Penobscot Verona Island Headwaters Mainstem<br />
Confluence<br />
34 26 8<br />
Lower<br />
Veazie <strong>to</strong><br />
with<br />
Marsh<br />
Penobscot Verona Island Headwaters Mainstem 52 14 38<br />
River km measured <strong>for</strong> Verona Island (km 0)<br />
The portion <strong>of</strong> <strong>the</strong> basin upstream <strong>of</strong> Veazie is upstream <strong>of</strong> marine influence, while<br />
sub-drainages downstream <strong>of</strong> Veazie are influenced by tides and salt water. We<br />
PRFP Page 131
used Kenduskeag Stream as an example <strong>of</strong> a management reach downstream <strong>of</strong> all<br />
dams. To model <strong>the</strong> effects <strong>of</strong> dams on salmon population viability we developed<br />
management reaches that aggregate some <strong>of</strong> <strong>the</strong> finer-scale reaches described<br />
above (Table 2). For each management reach we tallied <strong>the</strong> number <strong>of</strong> dams a<br />
smolt or adult would have <strong>to</strong> pass, and <strong>the</strong>n used fish passage efficiencies and<br />
mortality data <strong>to</strong> estimate <strong>the</strong> cumulative effects <strong>of</strong> <strong>the</strong> dams on <strong>the</strong> population<br />
dynamics.<br />
Dam passage input data were derived from numerous sources:<br />
Holbrook, 2007, assessed survival <strong>of</strong> smolts and smolt movement using ultrasonic<br />
telemetry. Survival rates <strong>for</strong> mainstem dams were estimated. Both hatchery and<br />
wild smolts were used in <strong>the</strong> study that provides <strong>the</strong> most recent and comprehensive<br />
estimates <strong>of</strong> smolt survival at dams in <strong>the</strong> Penobscot. The study integrated survival<br />
fac<strong>to</strong>rs surrounding dams including effects <strong>of</strong> <strong>the</strong> dam itself, plus variables such as<br />
transit times through reservoirs and increased opportunity <strong>of</strong> predation.<br />
The ASAL model was used <strong>to</strong> estimate smolt survival at Mattaceunk Dam. Direct<br />
estimates <strong>of</strong> smolt survival at this dam were not available. This result was presented<br />
in a review <strong>of</strong> downstream fish passage in <strong>the</strong> Annual Report <strong>of</strong> <strong>the</strong> U.S. Atlantic<br />
Salmon Assessment Committee Report No. 17 – 2004 Activities. This review<br />
contained numerous FERC reports on fish passage and ASAL modeling results;<br />
however, most <strong>of</strong> this work was superseded by Holbrook, 2007.<br />
Adult Atlantic salmon upstream passage efficiencies were obtained from Fay, C., M.<br />
Bartron, S. Craig, A. Hecht, J. Pruden, R. Saunders, T. Sheehan, and J. Trial.<br />
2006. Status Review <strong>for</strong> Anadromous Atlantic Salmon (Salmo salar) in <strong>the</strong> United<br />
States. Report <strong>to</strong> <strong>the</strong> National Marine Fisheries Service and U.S. Fish and Wildlife<br />
Service. 294 pages. See this document <strong>for</strong> primary sources.<br />
Additional adult upstream passage efficiencies were derived from Beland and<br />
Gorsky, 2004 in Atlantic Salmon Freshwater Assessments and Research Semi-<br />
Annual Project Report NOAA Grant NA17FL1157 Covering <strong>the</strong> period November 1,<br />
2003 – April 30, 2004, Appendix A. Additional data from Gorsky, 2005, (Site Fidelity<br />
and <strong>the</strong> Influence <strong>of</strong> Environmental Variables on Migra<strong>to</strong>ry Movements <strong>of</strong> Adult<br />
Atlantic Salmon (Salmo salar L.) in <strong>the</strong> Penobscot River Basin, Maine Master’s<br />
Thesis. University <strong>of</strong> Maine. 2005) was also used <strong>to</strong> augment <strong>the</strong> passage<br />
efficiencies.<br />
Where multiple estimates existed, we used <strong>the</strong> high and low estimates as <strong>the</strong> range,<br />
and used <strong>the</strong> mean <strong>of</strong> <strong>the</strong>se two values as <strong>the</strong> deterministic value. When both a<br />
range and mean passage efficiency or survival were given, we used <strong>the</strong> data as<br />
presented (Table 3). Although <strong>the</strong> data presented here represent a large body <strong>of</strong><br />
work, <strong>the</strong>re are still important gaps in <strong>the</strong> data <strong>for</strong> Atlantic salmon passage. The<br />
more recent PIT tag telemetry studies on adults and smolts tend <strong>to</strong> integrate<br />
variables surrounding dams. This can make it difficult <strong>to</strong> interpret <strong>the</strong> effect <strong>of</strong> a dam<br />
PRFP Page 132
itself verses mortality that may occur in spite <strong>of</strong> a dam <strong>for</strong> a given river segment. We<br />
tried <strong>to</strong> use values that likely represent dam effects, avoiding estimates with<br />
confounding fac<strong>to</strong>rs such as suitable habitat between dams ei<strong>the</strong>r in <strong>the</strong> mainstem<br />
or in tributaries. For those dams where no salmon passage data were available we<br />
choose passage efficiency based on best pr<strong>of</strong>essional judgment. However, studies<br />
<strong>to</strong> quantify efficiencies will improve managers’ ability <strong>to</strong> guide recovery.<br />
Table 2. Management reaches and dams that affect sub-populations in those<br />
reaches: be<strong>for</strong>e and after <strong>the</strong> Penobscot dam removal and bypass project.<br />
Be<strong>for</strong>e Dam Removal<br />
Lower<br />
Penobscot Kenduskeag Mattawamkeag Passadumkeag<br />
Piscataquis<br />
Lower<br />
Piscataquis<br />
Upper East Branch<br />
Veazie Veazie -- Veazie Veazie Veazie Veazie<br />
Great<br />
Works<br />
Great Works<br />
-- Great Works Great Works Great Works Great Works<br />
Mil<strong>for</strong>d Mil<strong>for</strong>d -- Mil<strong>for</strong>d Mil<strong>for</strong>d Mil<strong>for</strong>d Mil<strong>for</strong>d<br />
Orono Orono -- Orono Orono Orono Orono<br />
Stillwater Stillwater -- Stillwater Stillwater Stillwater Stillwater<br />
Gilman<br />
Falls<br />
Gilman Falls<br />
-- Gilman Falls Gilman Falls Gilman Falls Gilman Falls<br />
--<br />
West Enfield<br />
-- West Enfield<br />
Lowell<br />
Tannery Dam<br />
Howland Howland<br />
--<br />
-- -- -- --<br />
Brown's Mill<br />
(D-F Lower)<br />
Moosehead<br />
--<br />
-- -- -- --<br />
Manufacturing<br />
(D-F Upper)<br />
-- -- -- -- -- Guil<strong>for</strong>d<br />
After Dam Removal<br />
Lower<br />
Penobscot Kenduskeag Mattawamkeag Passadumkeag<br />
Piscataquis<br />
Lower<br />
Piscataquis<br />
Upper East Branch<br />
Mil<strong>for</strong>d Mil<strong>for</strong>d -- Mil<strong>for</strong>d Mil<strong>for</strong>d Mil<strong>for</strong>d Mil<strong>for</strong>d<br />
Orono Orono -- Orono Orono Orono Orono<br />
Stillwater Stillwater -- Stillwater Stillwater Stillwater Stillwater<br />
Gilman Falls Gilman Falls -- Gilman Falls Gilman Falls Gilman Falls Gilman Falls<br />
--<br />
West Enfield<br />
-- West Enfield<br />
Lowell<br />
Tannery Dam<br />
--<br />
Brown's Mill<br />
(D-F Lower)<br />
Moosehead<br />
--<br />
-- -- -- --<br />
Manufacturing<br />
(D-F Upper)<br />
-- -- -- -- -- Guil<strong>for</strong>d<br />
Table 3. Smolt and adult Atlantic salmon dam passage survival estimates<br />
Dam TribToBranch km<br />
km<br />
from<br />
Veazie<br />
Smolt Survival<br />
Proportion<br />
Smolts<br />
Using** low mean high source<br />
Veazie Penobscot-mainstem 48 0 1.00 0.96 0.98 1.00 Holbrook, 2007<br />
Great Works Penobscot-mainstem 60 12 0.89 0.91 0.96 1.00 Holbrook, 2007<br />
Mil<strong>for</strong>d Penobscot-mainstem 63 15 0.89 0.75 0.88 1.00 Holbrook, 2007<br />
Orono Penobscot-Stillwater 0.11 0.96 0.98 1.00 Holbrook, 2007*<br />
PRFP Page 133
Stillwater Penobscot-Stillwater 0.11 0.96 0.98 1.00 Holbrook, 2007*<br />
Gilman Falls Penobscot-Stillwater 0.11 0.96 0.98 1.00 Holbrook, 2007*<br />
Howland Piscataquis 100 52 1.00 0.71 0.84 0.96 Holbrook, 2007<br />
West Enfield Penobscot-mainstem 102 54 1.00 0.80 0.85 0.89 Holbrook, 2007<br />
Weldon<br />
(Mattaceunk) Penobscot-mainstem 150 102 1.00 0.90 0.90 0.90 ASAL Model<br />
Brown's Mill<br />
(D-F Lower) Piscataquis 166 118 1.00 0.91 0.96 1.00 median***<br />
Moosehead<br />
Manufacturing<br />
(D-F Upper) Piscataquis 167 119 1.00 0.91 0.96 1.00 median***<br />
Guil<strong>for</strong>d Piscataquis 180 132 1.00 0.91 0.96 1.00 median***<br />
Milo Sebec 1.00 0.91 0.96 1.00 median***<br />
Sebec Sebec 1.00 0.91 0.96 1.00 median***<br />
Pumpkin Hill Passadumkeag 115 67 1.00 0.91 0.96 1.00 median***<br />
Frank<strong>for</strong>t Marsh 1.00 0.91 0.96 1.00 median***<br />
Foss Mill Marsh 1.00 0.91 0.96 1.00 median***<br />
West<br />
Winterport Marsh 1.00 0.91 0.96 1.00 median***<br />
Dam TribToBranch km<br />
Adult Survival<br />
km<br />
from<br />
Veazie low mean high source<br />
Veazie Penobscot-mainstem 48 0 0.44 0.68 0.89 Status Review<br />
Great Works Penobscot-mainstem 60 12 0.38 0.81 0.95 Status Review<br />
Mil<strong>for</strong>d Penobscot-mainstem 63 15 0.86 0.90 1.00 Status Review<br />
Orono Penobscot-Stillwater 0.84 0.89 0.94 median***<br />
Stillwater Penobscot-Stillwater 0.84 0.89 0.94 median***<br />
Gilman Falls Penobscot-Stillwater 0.84 0.89 0.94 median***<br />
Beland and<br />
Howland Piscataquis 100 52 0.84 0.89 0.93 Gorsky, 2004<br />
Beland and<br />
West Enfield<br />
Weldon<br />
Penobscot-mainstem 102 54 0.84 0.89 0.94 Gorsky, 2004<br />
(Mattaceunk)<br />
Brown's Mill<br />
Penobscot-mainstem 150 102 0.84 0.89 0.94 median*<br />
(D-F Lower)<br />
Moosehead<br />
Manufacturing<br />
Piscataquis 166 118 0.84 0.89 0.94 median***<br />
(D-F Upper) Piscataquis 167 119 0.84 0.89 0.94 median***<br />
Guil<strong>for</strong>d Piscataquis 180 132 0.84 0.89 0.94 median***<br />
Milo Sebec 0.84 0.89 0.94 median***<br />
Sebec Sebec 0.84 0.89 0.94 median***<br />
Pumpkin Hill Passadumkeag 115 67 0.84 0.89 0.94 median***<br />
Frank<strong>for</strong>t Marsh 0.84 0.89 0.94 median***<br />
Foss Mill Marsh 0.84 0.89 0.94 median*<br />
West<br />
Winterport Marsh 0.84 0.89 0.94 median***<br />
*Stillwater survival was estimated <strong>for</strong> all three dams collectively by Holbrook due <strong>to</strong> low sample sizes. There<strong>for</strong>e, <strong>the</strong><br />
survivals given <strong>for</strong> each dam are actually <strong>the</strong> collective survival. I can adjust <strong>to</strong> get <strong>the</strong> survival proportion partitions <strong>to</strong><br />
sum <strong>to</strong> <strong>the</strong> collective survival.<br />
**The proportion using <strong>the</strong> Stillwater Branch verses mainstem. This is <strong>the</strong> average value <strong>of</strong> <strong>the</strong> 2005 and 2006 overall<br />
mean usage from Holbrook, 2007.<br />
***No data. Median value <strong>of</strong> o<strong>the</strong>r dams used.<br />
PRFP Page 134
We estimated cumulative dam mortalities <strong>for</strong> each migra<strong>to</strong>ry route <strong>for</strong> both smolts<br />
and adults. For smolts we used data from Holbrook (2007) that estimated <strong>the</strong><br />
proportion <strong>of</strong> smolts choosing <strong>to</strong> migrate down <strong>the</strong> mainstem Penobscot as opposed<br />
<strong>to</strong> using <strong>the</strong> Stillwater Branch. We <strong>the</strong>n used <strong>the</strong>se cumulative mortalities <strong>to</strong><br />
calculate life stage specific monthly survivals and applied this additional monthly<br />
mortality <strong>to</strong> life stage specific monthly mortalities. These survivals were <strong>the</strong>n used<br />
as parameters in a population matrix model (Robertson 2005, Sweka 2008) that<br />
estimated <strong>the</strong> population growth rate (lambda) as well as projected population size.<br />
We <strong>the</strong>n compared <strong>the</strong>se results <strong>to</strong> a reach without dam-related mortality. We did<br />
not consider amount or productivity <strong>of</strong> rearing habitat in <strong>the</strong> reaches, although we<br />
present data from Rago (1986) that do. The purpose <strong>of</strong> this exercise was <strong>to</strong><br />
evaluate <strong>the</strong> effect <strong>of</strong> dams on <strong>the</strong> population dynamics <strong>of</strong> <strong>the</strong> sub-populations. We<br />
also ran scenarios under optimistic marine survival conditions, where marine survival<br />
was set in <strong>the</strong> model <strong>to</strong> obtain a stable population (lambda = 1), and <strong>the</strong>n damrelated<br />
mortality was inflicted on <strong>the</strong> population. This allowed us <strong>to</strong> estimate <strong>the</strong><br />
affects <strong>of</strong> <strong>the</strong> dams under ocean conditions that should o<strong>the</strong>rwise allow viable subpopulations.<br />
The cumulative effect <strong>of</strong> dam mortality varied across management reaches in <strong>the</strong><br />
Penobscot basin be<strong>for</strong>e and after <strong>the</strong> Penobscot Project dam removal and bypass<br />
(referred <strong>to</strong> as “dam removal” from here on) (Figure 1). We assumed that <strong>the</strong><br />
Howland bypass will be as effective as dam removal, and set dam related mortality<br />
<strong>to</strong> zero <strong>for</strong> this site after dam removal. Kenduskeag Stream represents a reference<br />
state with no dams, while <strong>the</strong> o<strong>the</strong>r reaches have varying numbers <strong>of</strong> dams,<br />
increasing with upstream distance. Note that some reaches improve more than<br />
o<strong>the</strong>rs with dam removal, particularly <strong>the</strong> Lower and Upper Piscataquis. However,<br />
all values <strong>of</strong> lambda are well below one, indicating that all sub-populations are not<br />
viable under current ocean survival conditions.<br />
PRFP Page 135
Subdrainage<br />
0.73<br />
0.72<br />
0.71<br />
0.70<br />
0.69<br />
0.68<br />
0.67<br />
0.66<br />
0.65<br />
0.64<br />
0.63<br />
Current and Future Lambda Values <strong>for</strong> Penobscot<br />
Subdrainages<br />
Kenduskeag<br />
Lower Penobscot & Passadumkeag<br />
Piscataquis Lower<br />
Piscataquis Upper<br />
Lambda<br />
East Branch Mattawamkeag<br />
Lambda_Current<br />
Lambda_Future<br />
East Branch<br />
Figure 1. Changes in lambda due <strong>to</strong> cumulative dam effects on survival <strong>of</strong> smolts<br />
and returning adults. X-axis depicts different management reaches in <strong>the</strong> basin. Yaxis<br />
is lambda, <strong>the</strong> population growth rate.<br />
Improving ocean survival improves <strong>to</strong> <strong>the</strong> point where populations in free-flowing<br />
rivers are self-sustaining (Lambda = 1) with s<strong>to</strong>cking held at current levels was<br />
modeled next (Figure 2). This scenario assumes that all s<strong>to</strong>cking occurs in <strong>the</strong><br />
specified reach; <strong>the</strong>re<strong>for</strong>e, each reach has an equal chance <strong>of</strong> response. Habitat<br />
limitations are not considered. “Removed” data indicate after dam removal and<br />
“Current” data indicate current conditions with <strong>the</strong> dams in place. The West Enfield<br />
line includes returns <strong>to</strong> <strong>the</strong> Penobscot upstream <strong>to</strong> Weldon and <strong>the</strong> Mattawamkeag.<br />
The Piscataquis Lower predictions are <strong>for</strong> <strong>the</strong> Piscataquis between Howland and<br />
Dover-Foxcr<strong>of</strong>t, while <strong>the</strong> Upper Piscataquis predictions include <strong>the</strong> effects <strong>of</strong> <strong>the</strong><br />
additional three dams upstream <strong>of</strong> Howland after dam removal. The sub-population<br />
<strong>of</strong> <strong>the</strong> Lower Piscataquis has <strong>the</strong> strongest predicted response <strong>to</strong> dam removal,<br />
while West Enfield and Upper Piscataquis populations will likely have only modest<br />
changes because <strong>the</strong>re remains at least one dam on <strong>the</strong>ir migra<strong>to</strong>ry route. In spite <strong>of</strong><br />
dam removal, all reaches in <strong>the</strong> Penobscot basin that still have at least one dam<br />
show markedly lower population size than a free-flowing river.<br />
PRFP Page 136
Female Returns<br />
16000<br />
14000<br />
12000<br />
10000<br />
8000<br />
6000<br />
4000<br />
2000<br />
0<br />
Set Lambda = 1 under Base Conditions with Current<br />
S<strong>to</strong>cking Levels: Female Returns<br />
Returns No Dams<br />
West Enfield (current<br />
conditions)<br />
West Enfield (dams<br />
removed)<br />
Piscataquis Low er<br />
(current conditions)<br />
Piscataquis Low er<br />
(dams removed)<br />
Piscataquis Upper (dams<br />
removed)<br />
0 10 20 30 40 50 60<br />
Year<br />
Figure 2. Number <strong>of</strong> female returns by year under ocean survival scenario that<br />
produces stable populations in a free-flowing river. Be<strong>for</strong>e and after dam removal<br />
scenarios are modeled <strong>for</strong> key management reaches. S<strong>to</strong>cking held constant <strong>for</strong> all<br />
reaches.<br />
Given <strong>the</strong> results <strong>of</strong> modeling dam mortality, managers need <strong>to</strong> be able <strong>to</strong> decide if<br />
<strong>the</strong> productivity <strong>of</strong> a given reach can compensate <strong>for</strong> dam-related mortality and<br />
maintain a viable sub-population. To illustrate this, we used electr<strong>of</strong>ishing juvenile<br />
population assessments from 2001-2007 <strong>for</strong> various reaches (Table 4). To estimate<br />
<strong>the</strong> required freshwater production needed <strong>to</strong> produce a viable population we set<br />
lambda equal <strong>to</strong> 1 <strong>for</strong> a free-flowing river by adjusting marine survival (optimistic<br />
ocean conditions). We <strong>the</strong>n reduced smolt and adult survivals according <strong>to</strong> <strong>the</strong> dam<br />
survival input data <strong>for</strong> each management reach. This reduced lambda <strong>for</strong> a given<br />
reach. We <strong>the</strong>n adjusted survival <strong>of</strong> fry s<strong>to</strong>cked at 100/unit <strong>to</strong> parr stage that made<br />
lambda equal <strong>to</strong> 1. We used <strong>the</strong>se survival increases <strong>to</strong> adjust <strong>the</strong> number <strong>of</strong> parr<br />
needed <strong>to</strong> overcome <strong>the</strong> dam-related mortality <strong>for</strong> each reach and compared this <strong>to</strong><br />
our recent electr<strong>of</strong>ishing data (Table 5). The electr<strong>of</strong>ishing data are not a random<br />
sample <strong>of</strong> <strong>the</strong> basin, so any conclusions drawn from this may be spurious. However,<br />
<strong>for</strong> illustration purposes, increases in parr populations required <strong>for</strong> viable subpopulations<br />
under optimistic ocean survivals range <strong>for</strong> approximately 2 times in <strong>the</strong><br />
PRFP Page 137
Upper Piscataquis <strong>to</strong> 30 times in <strong>the</strong> upper Penobscot. Fur<strong>the</strong>rmore, <strong>the</strong> required<br />
parr density is well within <strong>the</strong> observed range <strong>of</strong> densities <strong>for</strong> some reaches, and<br />
<strong>the</strong>re<strong>for</strong>e may be obtainable. Clearly, variation in freshwater productivity can play an<br />
important role in assessing a reach’s potential <strong>to</strong> sustain a sub-population.<br />
However, this identifies a critical data gap. We need a spatially explicit random<br />
sampling scheme <strong>for</strong> juvenile salmon populations in <strong>the</strong> Penobscot basin <strong>to</strong><br />
ascertain relative differences in productivity among <strong>the</strong> major management subdrainages.<br />
Fur<strong>the</strong>rmore, sampling needs <strong>to</strong> be sufficient <strong>to</strong> capture <strong>the</strong> variability <strong>of</strong><br />
juvenile abundances within and among reaches.<br />
Table 4. Large parr densities estimated <strong>for</strong> sites within <strong>the</strong> Penobscot basin from<br />
2001 <strong>to</strong> 2007.<br />
Below<br />
Lower Upper Lower Upper East<br />
Veazie Penobscot Penobscot Piscataquis Piscataquis Branch<br />
n 184 4 19 20 34 27<br />
Density<br />
Mean<br />
0.87 0.00 0.61 1.79 8.35 1.90<br />
Density<br />
Range<br />
0.00-11.38 0.00-0.00 0.00-3.08 0.00-11.04 0.00-33.73 0.00-5.74<br />
Density sd 2.02 0.00 0.93 2.74 8.15 1.75<br />
Electr<strong>of</strong>ishing data 2001-2007. Estimated removal density data also reported.<br />
Table 5. Theoretical Increases in Freshwater Survival and Parr Densities Required<br />
<strong>to</strong> Compensate <strong>for</strong> <strong>the</strong> Effects <strong>of</strong> Dams after <strong>the</strong> Penobscot Project Dam Removals:<br />
Lambda set <strong>to</strong> 1 by increasing marine survival in un-dammed scenario.<br />
Ratio<br />
increase<br />
needed<br />
relative <strong>to</strong><br />
undammed<br />
river<br />
Required<br />
parr density<br />
Observed<br />
mean<br />
density<br />
Observed<br />
range<br />
Increase<br />
(multiplier)<br />
needed <strong>for</strong><br />
replacemen<br />
t<br />
Below<br />
Veazie<br />
Lower<br />
Penobscot<br />
Upper<br />
Penobscot<br />
Lower<br />
Piscataquis<br />
Upper<br />
Piscataquis<br />
East<br />
Branch<br />
1 1.29 1.71 1.29 1.57 2.02<br />
10.89 14.08 18.66 14.08 17.08 22.01<br />
0.87 0.00 0.61 1.79 8.35 1.90<br />
0.00-<br />
11.38<br />
0.00-0.00 0.00-3.08 0.00-11.04 0.00-33.73 0.00-5.74<br />
12.52 na 30.59 7.87 2.05 11.58<br />
Rago (1986) modeled population segment viability in <strong>the</strong> Penobscot basin using <strong>the</strong><br />
ASAL model. Mortality <strong>of</strong> both adults and smolts increased with <strong>the</strong> number <strong>of</strong> dams<br />
PRFP Page 138
that must be passed. Fur<strong>the</strong>rmore, he expressed population segment viability in<br />
half-lives, and showed that population viability was affected by <strong>the</strong> number <strong>of</strong> dams,<br />
with <strong>the</strong> Upper Piscataquis (Guil<strong>for</strong>d) having <strong>the</strong> shortest half-life <strong>of</strong> 6.52 years and<br />
<strong>the</strong> segments with no dams or few dams (Mouth <strong>to</strong> Great Works) was self-sustaining<br />
(presented as 100 years). The population half-life estimates take in<strong>to</strong> account<br />
population segment size and smolt production potential. Some parameters such as<br />
angling mortality have changed since 1986, and we now have updated dam survival<br />
data <strong>for</strong> some dams. Never<strong>the</strong>less, <strong>the</strong> findings from 1986 are consistent with our<br />
results.<br />
Population Segment<br />
Figure 3. Survival <strong>of</strong> smolts (downstream) and adults (upstream) <strong>for</strong> population<br />
segments defined by dams in <strong>the</strong> Penobscot Basin. Adapted from Rago (1986).<br />
Population Segment<br />
O<strong>the</strong>r Tribs<br />
Tribs: Mattaceunk<br />
Tribs: West Enfield<br />
Pleasant<br />
East Branch<br />
Mattawamkeag<br />
Guil<strong>for</strong>d<br />
Upper DF<br />
Lower DF<br />
Howland<br />
West Enfield<br />
Mil<strong>for</strong>d<br />
Great Works<br />
Veazie<br />
Mouth<br />
0.94112<br />
0.94112<br />
0.95452<br />
0.95452<br />
0.94537<br />
0.95569<br />
0.95569<br />
0.97589<br />
0.96906<br />
0.96906<br />
0.96906<br />
0.97589<br />
0.98208<br />
0.9925<br />
0.9 0.92 0.94 0.96 0.98 1 1.02<br />
0.00<br />
6.52<br />
Downstream Survival <strong>of</strong> Smolts<br />
11.73<br />
10.93<br />
8.11<br />
18.12<br />
16.39<br />
17.86<br />
15.85<br />
18.10<br />
39.82<br />
39.74<br />
1<br />
100.00<br />
100.00<br />
100.00<br />
0.00 20.00 40.00 60.00 80.00 100.00 120.00<br />
Expected Half-life (years)<br />
O<strong>the</strong>r Tribs<br />
Tribs: Mattaceunk<br />
Tribs: West Enfield<br />
Pleasant<br />
East Branch<br />
Mattawamkeag<br />
Upper DF<br />
Lower DF<br />
West Enfield<br />
Great Works<br />
Figure 4. Population segment half-lives in years <strong>for</strong> Penobscot basin Atlantic<br />
salmon with marine survival rate <strong>of</strong> 0.025. Adapted from Rago (1986).<br />
PRFP Page 139<br />
Population Segment<br />
Guil<strong>for</strong>d<br />
Howland<br />
Mil<strong>for</strong>d<br />
Veazie<br />
Mouth<br />
0.55785<br />
0.65908<br />
0.65908<br />
0.60636<br />
0.71639<br />
0.71639<br />
0.71639<br />
0.65908<br />
0.77869<br />
0.71639<br />
0.71639<br />
0.77869<br />
0.8464<br />
0.92<br />
0 0.2 0.4 0.6 0.8 1 1.2<br />
Upstream Survivial <strong>of</strong> Adults<br />
1
CONCLUSIONS<br />
Reaches where salmon must pass numerous dams are less likely <strong>to</strong> result in viable<br />
sub-populations. Management ef<strong>for</strong>ts should concentrate on reaches with fewer<br />
dams, balancing survival with production potential (amount and quality <strong>of</strong> available<br />
habitat). Where production potentials are equal, reaches with <strong>the</strong> fewest dams will<br />
be more likely <strong>to</strong> produce self-sustaining populations. To make <strong>the</strong>se balancing<br />
decisions managers need estimates <strong>of</strong> freshwater production potential <strong>for</strong> all<br />
management reaches. They also need better fish passage efficiency and dam<br />
mortality estimates that will allow <strong>the</strong>m <strong>to</strong> 1) improve fish passage, or 2) manage<br />
populations in <strong>the</strong> face <strong>of</strong> fish passage losses.<br />
PRFP Page 140
Appendix C - Penobscot Habitat and Freshwater Juvenile Atlantic Salmon<br />
Production Potential<br />
Author: Greg Mackey<br />
We estimated juvenile Atlantic salmon rearing habitat in <strong>the</strong> Penobscot basin using<br />
both field survey data and data from a GIS-based habitat model (GIS-Based Atlantic<br />
Salmon Habitat Model, Draft, 2008, Appendix C, Critical Habitat). Habitat data were<br />
aggregated at several spatial scales within <strong>the</strong> basin, including Dam Reach,<br />
Management Reach, and HUC 10. The data used in this work are available as an<br />
ARCMap geodatabase. The goals <strong>of</strong> this work were <strong>to</strong> 1) provide <strong>the</strong> best available<br />
in<strong>for</strong>mation on Atlantic salmon rearing habitat in <strong>the</strong> Penobscot basin, 2) provide an<br />
estimate <strong>of</strong> <strong>the</strong> relative potential <strong>for</strong> large parr production in <strong>the</strong> basin, and 3) Identify<br />
reaches with <strong>the</strong> highest parr production potential.<br />
Dam Reaches are defined as areas <strong>of</strong> <strong>the</strong> basin that are affected by a common<br />
collection <strong>of</strong> dams; <strong>the</strong>re<strong>for</strong>e, fish in <strong>the</strong>se reaches experience <strong>the</strong> same dam-related<br />
passage and mortality rates (Figure 1). Management Reaches attempt <strong>to</strong> organize<br />
<strong>the</strong> basin in<strong>to</strong> reaches that could be managed independently (Figure 2). This<br />
provides finer scale in<strong>for</strong>mation <strong>to</strong> managers that may be more useful <strong>for</strong> some<br />
management actions. The HUC system can also be used <strong>to</strong> aggregate data at any<br />
HUC level. Management actions may be described by <strong>the</strong>se reaches, but also, finer<br />
scale management may be per<strong>for</strong>med at <strong>the</strong> stream level. In any case, <strong>the</strong> location<br />
<strong>of</strong> management actions within <strong>the</strong> geographic hierarchy will be known.<br />
Figure 1. Dam Reaches <strong>of</strong> <strong>the</strong> Penobscot Basin<br />
West Branch and<br />
Webster Brook-<br />
Inaccessible<br />
Brown's Mill <strong>to</strong> Howland<br />
Headwaters <strong>to</strong> Guil<strong>for</strong>d<br />
Guil<strong>for</strong>d <strong>to</strong> Moosehead Manufacturing<br />
Veazie <strong>to</strong> Verona Island<br />
Headwaters <strong>to</strong> Weldon<br />
!(<br />
!(<br />
Figure 2. Management Reaches <strong>of</strong> <strong>the</strong> Penobscot Basin<br />
!( !(<br />
!( !(<br />
!(<br />
!(<br />
!( !(<br />
PRFP Page 141<br />
!(<br />
!(<br />
Mil<strong>for</strong>d <strong>to</strong> Veazie<br />
Medway <strong>to</strong> Weldon<br />
Weldon <strong>to</strong> West Enfield<br />
Gilman <strong>to</strong> West Lowell Tannery<br />
West Enfield <strong>to</strong> Mil<strong>for</strong>d<br />
Gilman <strong>to</strong> Stillwater
West Branch-<br />
Inaccessible<br />
Pleasant River<br />
Seboeis Stream<br />
Sebec River<br />
Piscataquis Upper<br />
Guil<strong>for</strong>d <strong>to</strong> Moosehead<br />
Manufacturing<br />
Nesowadnehunk-<br />
His<strong>to</strong>rically Inaccessible<br />
Piscataquis Lower<br />
Pushaw and Dead<br />
Pushaw Stream<br />
Kenduskeag<br />
Stillwater Gilman <strong>to</strong> Orono<br />
Penobscot Mil<strong>for</strong>d <strong>to</strong> Veazie<br />
Souadabscook<br />
!(<br />
Penobscot Below Veazie<br />
Sedgeunkedunk Stream<br />
Wassataquoik Stream<br />
Webster Brook-<br />
His<strong>to</strong>rically Inaccessible<br />
!(<br />
Marsh<br />
Silver Lake<br />
We used <strong>the</strong> quantile regression model <strong>to</strong> estimate <strong>the</strong> upper echelon <strong>of</strong> parr<br />
production potential based on <strong>the</strong> independent variable watershed area (Parr<br />
Density = [10^(1.0809-0.0006*km^2)] – 1) (Figure 3). Watershed area integrates<br />
many variables such as stream size, gradient, water temperature, and biological<br />
community composition. It is at <strong>the</strong> 90 th quantile where watershed area clearly<br />
functions as a limiting fac<strong>to</strong>r. This model uses <strong>the</strong> 90 th quantile <strong>to</strong> predict parr<br />
population size- that is, it predicts parr numbers based on what is observed at <strong>the</strong><br />
90 th quantile <strong>of</strong> streams in Maine. There<strong>for</strong>e, <strong>the</strong> realized parr production will usually<br />
be lower than predicted, but <strong>the</strong>se data provide <strong>the</strong> upper threshold <strong>of</strong> parr<br />
production <strong>for</strong> a given watershed area. Finally, <strong>the</strong>se data provide a reference <strong>to</strong><br />
assess actual parr production, enabling managers <strong>to</strong> compare production <strong>to</strong><br />
expectations based on <strong>the</strong> upper 90 % <strong>of</strong> streams in Maine.<br />
Figure 3. Quantile regression models (90 th and 75 th Quantiles) <strong>of</strong> Atlantic salmon<br />
parr densities verses watershed size <strong>for</strong> Maine rivers<br />
PRFP Page 142<br />
!( !(<br />
!( !(<br />
!(<br />
!(<br />
!( !(<br />
East Branch<br />
!(<br />
Seboeis River<br />
!(<br />
Toddy Pond<br />
West Branch Mattawamkeag River<br />
Long Pond<br />
Ea<strong>to</strong>n Brook<br />
Felts Brook<br />
Hoyt Brook<br />
Hemlock Stream<br />
Baskahegan Stream<br />
Mattawamkeag<br />
Passadumkeag<br />
Olamon Stream<br />
Birch Stream<br />
Sunkhaze Stream<br />
Great Works Stream<br />
Chemo Pond<br />
Alamoosook Lake<br />
East Branch Mattawamkeag River<br />
Medway <strong>to</strong> Weldon<br />
Wy<strong>to</strong>pitlock Stream<br />
Molunkus Stream<br />
Penobscot West Enfield <strong>to</strong> Mil<strong>for</strong>d
Parr density (no. / 100 m 2 )<br />
45<br />
40<br />
35<br />
30<br />
25<br />
20<br />
15<br />
10<br />
5<br />
0<br />
0 200 400 600 800 1,000 1,200 1,400 1,600<br />
The GIS-based habitat model used slope, cumulative drainage area and<br />
physiographic province <strong>to</strong> predict Atlantic salmon rearing habitat throughout Maine.<br />
Stream widths were estimated using regional hydraulic curves <strong>for</strong> Maine rivers. We<br />
used <strong>the</strong> Penobscot basin portion <strong>of</strong> this dataset. We <strong>the</strong>n compared reaches that<br />
were surveyed using field methods <strong>to</strong> <strong>the</strong> model predictions. This revealed 1) <strong>the</strong><br />
model is conservative, habitat was ei<strong>the</strong>r predicted at or below <strong>the</strong> levels observed<br />
in <strong>the</strong> field (Figure 4), and 2) errors in predicting stream width accounted <strong>for</strong> about<br />
75% <strong>of</strong> <strong>the</strong> variability in <strong>the</strong> difference between field observations and model<br />
predictions (Figure 5).<br />
Figure 4. Field verses modeled habitat data with perfect prediction reference line<br />
(one <strong>to</strong> one).<br />
Model Habitat Units<br />
16000<br />
14000<br />
12000<br />
10000<br />
8000<br />
6000<br />
4000<br />
2000<br />
Field verses Modeled Habitat Data- Penobscot Basin<br />
Field <strong>to</strong> Model<br />
One <strong>to</strong> One<br />
Cumulative drainage area (sq km)<br />
Linear (Field <strong>to</strong> Model)<br />
0<br />
0 2000 4000 6000 8000 10000 12000 14000 16000<br />
Field Survey Habitat Units<br />
Aroos<strong>to</strong>ok Dennys<br />
East Machias Kennebec<br />
Machias Narraguagus<br />
Pleasant Penobscot<br />
Saco Sheepscot<br />
75th Quantile 90th Quantile<br />
PRFP Page 143
Figure 5. Effect <strong>of</strong> stream width prediction error on estimation errors <strong>of</strong> predicted<br />
habitat.<br />
Proportional Difference in Habitat ((Field-<br />
Model/Field))<br />
Proportional Difference in Width verses Proportional<br />
Differences in Habitat<br />
R 2 = 0.7537<br />
0<br />
-3 -2.5 -2 -1.5 -1 -0.5 0 0.5 1 1.5<br />
-0.5<br />
Table 1 presents <strong>the</strong> best current in<strong>for</strong>mation on <strong>the</strong> amount <strong>of</strong> habitat in <strong>the</strong><br />
Penobscot basin based on both <strong>the</strong> GIS model and contemporary field surveys.<br />
Field survey data covered only a small portion <strong>of</strong> <strong>the</strong> basin; <strong>the</strong>re<strong>for</strong>e, we used <strong>the</strong><br />
model data output as <strong>the</strong> primary source, and replaced modeled data with survey<br />
data in reaches where field survey data were available. This resulted in a data set<br />
comprised <strong>of</strong> modeled and observed data. The data are aggregated at <strong>the</strong> Dam,<br />
Management, and HUC 10 levels. O<strong>the</strong>r aggregations are possible using <strong>the</strong><br />
geodatabase.<br />
Table 1. Penobscot Basin Atlantic Salmon Habitat Data: GIS-Model Results and<br />
Field Survey Combined<br />
Habitat in units (100 m^2)<br />
Model<br />
(surveyed<br />
Management<br />
reaches<br />
Total<br />
Dam Reach Reach HUC 10 NAME<br />
subtracted) Survey Habitat<br />
Headwaters<br />
East Branch Penobscot<br />
<strong>to</strong> Weldon East Branch River (2) 5173 6967 12140<br />
Headwaters<br />
East Branch Penobscot<br />
<strong>to</strong> Weldon<br />
Headwaters<br />
East Branch River (3) 8244 8244<br />
<strong>to</strong> Weldon<br />
Headwaters<br />
East Branch Grand Lake Matagamon 5740 5740<br />
<strong>to</strong> Weldon Seboeis River Seboeis River 6108 7442 13550<br />
Headwaters Wassataquoik East Branch Penobscot<br />
<strong>to</strong> Weldon Stream<br />
River (3) 4537 4855 9393<br />
Total Habitat 29802 19264 49067<br />
Weldon <strong>to</strong><br />
West Mattawamkeag Mattawamkeag River (1) 2115 2480 4595<br />
PRFP Page 144<br />
1.5<br />
1<br />
0.5<br />
-1<br />
-1.5<br />
-2<br />
-2.5<br />
Proportional Difference in Width ((Field-Model/Field))<br />
-3
Enfield<br />
Weldon <strong>to</strong><br />
West<br />
Enfield Mattawamkeag Mattawamkeag River (2) 3960 2122 6083<br />
Weldon <strong>to</strong><br />
West<br />
Enfield Mattawamkeag Mattawamkeag River (3) 2286 5133 7419<br />
Weldon <strong>to</strong><br />
West<br />
Enfield Mattawamkeag<br />
Weldon <strong>to</strong><br />
West<br />
Enfield<br />
Weldon <strong>to</strong><br />
West<br />
Enfield<br />
Weldon <strong>to</strong><br />
West<br />
West Branch<br />
Mattawamkeag<br />
River<br />
East Branch<br />
Mattawamkeag<br />
River<br />
Enfield Mattawamkeag<br />
Weldon <strong>to</strong><br />
West<br />
Enfield Mattawamkeag<br />
Weldon <strong>to</strong><br />
West<br />
Enfield<br />
Headwaters<br />
<strong>to</strong> Guil<strong>for</strong>d<br />
Guil<strong>for</strong>d <strong>to</strong><br />
Moosehead<br />
Manufacturi<br />
ng<br />
West Branch<br />
Mattawamkeag River 639 639<br />
West Branch<br />
Mattawamkeag River 9184 2174 11359<br />
East Branch<br />
Mattawamkeag River 3660 1059 4719<br />
Penobscot River (1) at<br />
Mattawamkeag 9045 9045<br />
Penobscot River (2) at<br />
West Enfield 6970 6970<br />
Molunkus<br />
Stream Molunkus Stream 4517 4517<br />
Total Habitat 42377 12968 55345<br />
Piscataquis<br />
Upper Piscataquis River (1) 15550 3287 18836<br />
Guil<strong>for</strong>d <strong>to</strong><br />
Moosehead<br />
Manufacturing Piscataquis River (3) 1286 1204 2490<br />
Brown's Mill Piscataquis<br />
<strong>to</strong> Howland Lower Piscataquis River (3) 2260 1862 4122<br />
Brown's Mill Piscataquis<br />
<strong>to</strong> Howland<br />
Brown's Mill<br />
Lower Piscataquis River (4) 3556 14815 18371<br />
<strong>to</strong> Howland<br />
Brown's Mill<br />
Pleasant River Pleasant River 19656 4298 23954<br />
<strong>to</strong> Howland<br />
Brown's Mill<br />
Sebec River Sebec River 15648 15648<br />
<strong>to</strong> Howland Seboeis Stream Seboeis Stream 5516 5516<br />
Total Habitat 46636 20975 67611<br />
Weldon <strong>to</strong><br />
West<br />
Enfield<br />
Weldon <strong>to</strong><br />
West<br />
Enfield<br />
Wy<strong>to</strong>pitlock<br />
Stream Mattawamkeag River (2) 833 833<br />
Baskahegan<br />
Stream Baskahegan Stream 3789 3789<br />
Total Habitat 4621 4621<br />
PRFP Page 145
Gilman <strong>to</strong><br />
West Lowell<br />
Tannery Passadumkeag Passadumkeag River 7950 7950<br />
Gilman <strong>to</strong><br />
Stillwater Pushaw Stream Pushaw Stream 5447 5447<br />
Medway <strong>to</strong><br />
Weldon<br />
West<br />
Enfield <strong>to</strong><br />
Mil<strong>for</strong>d<br />
Medway <strong>to</strong><br />
Weldon<br />
Penobscot West<br />
Enfield <strong>to</strong> Mil<strong>for</strong>d<br />
Penobscot River (1) at<br />
Mattawamkeag 1391 1391<br />
Penobscot River (3) at<br />
Orson Island 4866 4866<br />
West<br />
Enfield <strong>to</strong><br />
Mil<strong>for</strong>d Birch Stream Birch Stream 1078 1078<br />
West<br />
Enfield <strong>to</strong><br />
Mil<strong>for</strong>d Birch Stream Sunkhaze Stream 582 582<br />
West<br />
Enfield <strong>to</strong><br />
Mil<strong>for</strong>d Hemlock Stream<br />
West<br />
Enfield <strong>to</strong><br />
Mil<strong>for</strong>d Hoyt Brook<br />
Penobscot River (3) at<br />
Orson Island 447 447<br />
Penobscot River (3) at<br />
Orson Island 275 275<br />
West<br />
Enfield <strong>to</strong><br />
Mil<strong>for</strong>d Olamon Stream Olamon Stream 1424 1424<br />
West<br />
Enfield <strong>to</strong><br />
Mil<strong>for</strong>d<br />
Sunkhaze<br />
Stream Sunkhaze Stream 1453 1453<br />
Total Habitat 10126 10126<br />
The relationship between stream width and distribution <strong>of</strong> both habitat and parr<br />
production potential is presented in figure 7. Parr production potential is highest in<br />
streams less than 12 m wide, with streams in <strong>the</strong> 4-6 m size class producing more<br />
parr than o<strong>the</strong>r stream class. Parr production in streams over 100 m wide (3665<br />
km^2 drainage area) were <strong>for</strong>ced <strong>to</strong> zero in 45 <strong>of</strong> 52,049 stream segments because<br />
<strong>the</strong>se streams exceeded <strong>the</strong> range <strong>of</strong> <strong>the</strong> model and produced negative parr<br />
estimates. This strongly suggests that s<strong>to</strong>cking fry in streams 4 <strong>to</strong> 12 m wide will<br />
produce <strong>the</strong> most parr. Complete habitat amounts by stream width and basin<br />
geography are presented in Table 2.<br />
PRFP Page 146
Habitat (units)<br />
Parr Production<br />
Habitat (units)<br />
Parr Production<br />
Figure 7. Atlantic salmon habitat and parr production by stream width in <strong>the</strong><br />
Penobscot basin (gray dashes indicate no observations)<br />
16,000<br />
14,000<br />
12,000<br />
10,000<br />
8,000<br />
6,000<br />
4,000<br />
2,000<br />
0<br />
Habitat: Headw aters <strong>to</strong> Guil<strong>for</strong>d<br />
0-2<br />
6-8<br />
12-14<br />
18-20<br />
24-26<br />
30-32<br />
36-38<br />
42-44<br />
48-50<br />
75,000<br />
60,000<br />
45,000<br />
30,000<br />
15,000<br />
0<br />
Parr Production: Headw aters <strong>to</strong> Guil<strong>for</strong>d<br />
0-2<br />
6-8<br />
12-14<br />
18-20<br />
24-26<br />
30-32<br />
16,000<br />
14,000<br />
12,000<br />
10,000<br />
8,000<br />
6,000<br />
4,000<br />
2,000<br />
0<br />
75,000<br />
60,000<br />
45,000<br />
30,000<br />
15,000<br />
0<br />
36-38<br />
Stream Width (m)<br />
Habitat: Mattaw amkeag River<br />
42-44<br />
Parr Production: Mattaw amkeag River<br />
Stream Width (m)<br />
48-50<br />
Habitat (units)<br />
Parr Production<br />
Habitat (units)<br />
Parr Production<br />
16,000<br />
14,000<br />
12,000<br />
10,000<br />
8,000<br />
6,000<br />
4,000<br />
2,000<br />
0<br />
Habitat: Brow n's Mill <strong>to</strong> How land<br />
0-2<br />
6-8<br />
12-14<br />
18-20<br />
24-26<br />
30-32<br />
75,000<br />
60,000<br />
45,000<br />
30,000<br />
15,000<br />
0<br />
PRFP Page 147<br />
36-38<br />
42-44<br />
Parr Production: Brow n's Mill <strong>to</strong> How land<br />
0-2<br />
6-8<br />
12-14<br />
18-20<br />
24-26<br />
30-32<br />
36-38<br />
42-44<br />
48-50<br />
16,000<br />
14,000<br />
12,000<br />
10,000<br />
8,000<br />
6,000<br />
4,000<br />
2,000<br />
0<br />
75,000<br />
60,000<br />
45,000<br />
30,000<br />
15,000<br />
0<br />
Stream Width (m)<br />
Habitat: West Branch Mattaw amkeag River<br />
48-50<br />
Parr Production: West Branch Mattaw amkeag<br />
Stream Width (m)<br />
Habitat (units)<br />
Parr Production<br />
Habitat (units)<br />
Parr Production<br />
16,000<br />
14,000<br />
12,000<br />
10,000<br />
8,000<br />
6,000<br />
4,000<br />
0-2<br />
6-8<br />
12-14<br />
18-20<br />
24-26<br />
30-32<br />
2,000<br />
0<br />
75,000<br />
60,000<br />
45,000<br />
30,000<br />
0-2<br />
6-8<br />
12-14<br />
18-20<br />
24-26<br />
30-32<br />
15,000<br />
0<br />
16,000<br />
14,000<br />
12,000<br />
10,000<br />
8,000<br />
6,000<br />
4,000<br />
2,000<br />
0<br />
75,000<br />
60,000<br />
45,000<br />
Habitat: Pleasant River<br />
36-38<br />
Parr Production: Pleasant River<br />
36-38<br />
Stream Width (m)<br />
42-44<br />
42-44<br />
Habitat: East Branch Mattaw amkeag River<br />
0-2<br />
6-8<br />
12-14<br />
18-20<br />
24-26<br />
30-32<br />
36-38<br />
0-2<br />
42-44<br />
6-8<br />
48-50<br />
12-14<br />
18-20<br />
24-26<br />
30-32<br />
0-2<br />
36-38<br />
6-8<br />
42-44<br />
12-14<br />
48-50<br />
18-20<br />
24-26<br />
30-32<br />
36-38<br />
0-2<br />
42-44<br />
6-8<br />
48-50<br />
12-14<br />
18-20<br />
24-26<br />
30-32<br />
0-2<br />
36-38<br />
6-8<br />
42-44<br />
12-14<br />
48-50<br />
18-20<br />
24-26<br />
30-32<br />
36-38<br />
0-2<br />
42-44<br />
6-8<br />
48-50<br />
12-14<br />
18-20<br />
24-26<br />
30-32<br />
36-38<br />
42-44<br />
48-50<br />
30,000<br />
15,000<br />
0<br />
48-50<br />
48-50<br />
Parr Production: East Branch Mattaw amkeag<br />
Stream Width (m)
Habitat (units)<br />
Parr Production<br />
16,000<br />
14,000<br />
12,000<br />
10,000<br />
8,000<br />
6,000<br />
4,000<br />
2,000<br />
0<br />
75,000<br />
60,000<br />
45,000<br />
30,000<br />
15,000<br />
0<br />
16,000<br />
14,000<br />
12,000<br />
10,000<br />
8,000<br />
6,000<br />
4,000<br />
2,000<br />
0<br />
Habitat: East Branch<br />
Parr Production: East Branch<br />
Stream Width (m)<br />
Habitat: Souadabscook<br />
0-2<br />
6-8<br />
12-14<br />
18-20<br />
24-26<br />
30-32<br />
36-38<br />
0-2<br />
42-44<br />
6-8<br />
48-50<br />
12-14<br />
18-20<br />
24-26<br />
30-32<br />
36-38<br />
42-44<br />
48-50<br />
0-2<br />
6-8<br />
12-14<br />
18-20<br />
24-26<br />
30-32<br />
36-38<br />
42-44<br />
48-50<br />
Habitat (units)<br />
Parr Production<br />
75,000<br />
60,000<br />
45,000<br />
30,000<br />
15,000<br />
0<br />
Parr Production: Souadabscook<br />
Stream Width (m)<br />
Habitat (units)<br />
Parr Production<br />
16,000<br />
14,000<br />
12,000<br />
10,000<br />
8,000<br />
6,000<br />
4,000<br />
2,000<br />
0<br />
75,000<br />
60,000<br />
45,000<br />
30,000<br />
15,000<br />
Habitat (units)<br />
Parr Production<br />
0<br />
16,000<br />
14,000<br />
12,000<br />
10,000<br />
8,000<br />
6,000<br />
4,000<br />
2,000<br />
Habitat: Wassataquoik Stream<br />
Parr Production: Wassataquoik Stream<br />
0<br />
75,000<br />
60,000<br />
45,000<br />
30,000<br />
15,000<br />
0<br />
0-2<br />
6-8<br />
12-14<br />
18-20<br />
24-26<br />
30-32<br />
36-38<br />
0-2<br />
42-44<br />
6-8<br />
48-50<br />
12-14<br />
18-20<br />
24-26<br />
30-32<br />
0-2<br />
36-38<br />
6-8<br />
42-44<br />
12-14<br />
48-50<br />
18-20<br />
24-26<br />
30-32<br />
36-38<br />
0-2<br />
42-44<br />
6-8<br />
48-50<br />
12-14<br />
18-20<br />
24-26<br />
30-32<br />
0-2<br />
36-38<br />
6-8<br />
42-44<br />
12-14<br />
48-50<br />
18-20<br />
24-26<br />
30-32<br />
36-38<br />
0-2<br />
42-44<br />
6-8<br />
48-50<br />
12-14<br />
18-20<br />
24-26<br />
30-32<br />
36-38<br />
42-44<br />
48-50<br />
Stream Width (m)<br />
Habitat: Kenduskeag<br />
0-2<br />
6-8<br />
12-14<br />
18-20<br />
24-26<br />
30-32<br />
36-38<br />
42-44<br />
48-50<br />
Parr Production: Kenduskeag<br />
Stream Width (m)<br />
Habitat: Sebois River<br />
We queried stream width in <strong>the</strong> Penobscot basin <strong>to</strong> illustrate <strong>the</strong> stream segments <strong>to</strong><br />
s<strong>to</strong>ck that will optimize parr production (figure 8). Concentrating fry s<strong>to</strong>cking in<br />
stream 4 <strong>to</strong> 12 m in width should yield greater numbers <strong>of</strong> parr than s<strong>to</strong>cking o<strong>the</strong>r<br />
size streams. This exercise resulted in 57,095 units <strong>of</strong> optimal fry s<strong>to</strong>ck habitat<br />
(segments >50% rearing habitat), or <strong>the</strong> requirement <strong>of</strong> over 5 million fry <strong>to</strong> seed <strong>the</strong><br />
habitat at 100 fry/unit. In addition, <strong>the</strong>re were ano<strong>the</strong>r 22,961 units in segments with<br />
less than 50 % habitat, <strong>for</strong> a <strong>to</strong>tal <strong>of</strong> 80,056 units. With <strong>the</strong> Penobscot fry production<br />
currently around one million, management decisions will be required as <strong>to</strong> where <strong>to</strong><br />
s<strong>to</strong>ck fry. More detailed optimizations could be carried out <strong>to</strong> address specific<br />
management concerns. In addition, juvenile population assessment data may reveal<br />
stream reaches larger than 12 m in width that outper<strong>for</strong>m expectations and should<br />
be considered <strong>for</strong> s<strong>to</strong>cking. However, this should be done so based on data, and<br />
lacking such in<strong>for</strong>mation, using <strong>the</strong> 4 <strong>to</strong> 12 m width recommendation is a sound first<br />
step.<br />
PRFP Page 148<br />
Habitat (units)<br />
Parr Production<br />
16,000<br />
14,000<br />
12,000<br />
10,000<br />
8,000<br />
6,000<br />
4,000<br />
2,000<br />
0<br />
75,000<br />
60,000<br />
45,000<br />
30,000<br />
15,000<br />
Habitat (units)<br />
Parr Production<br />
0<br />
16,000<br />
14,000<br />
12,000<br />
10,000<br />
8,000<br />
6,000<br />
4,000<br />
2,000<br />
0<br />
75,000<br />
60,000<br />
45,000<br />
30,000<br />
15,000<br />
0<br />
Parr Production: Sebois River<br />
Stream Width (m)<br />
Habitat: Passadumkeag<br />
Parr Production: Passadumkeag<br />
0-2<br />
6-8<br />
12-14<br />
18-20<br />
24-26<br />
30-32<br />
36-38<br />
0-2<br />
42-44<br />
6-8<br />
48-50<br />
12-14<br />
18-20<br />
24-26<br />
30-32<br />
36-38<br />
42-44<br />
48-50<br />
Stream Width (m)
Figure 8. Optimal parr production s<strong>to</strong>cking segments in <strong>the</strong> Penobscot basin<br />
Red=~50-100 % rearing, Orange = ~0-50 % rearing<br />
West Branch and<br />
Webster Brook-<br />
Inaccessible<br />
Brown's Mill <strong>to</strong> Howland<br />
Headwaters <strong>to</strong> Guil<strong>for</strong>d<br />
Guil<strong>for</strong>d <strong>to</strong> Moosehead Manufacturing<br />
Veazie <strong>to</strong> Verona Island<br />
Headwaters <strong>to</strong> Weldon<br />
!(<br />
!(<br />
S<strong>to</strong>cking various life stages should be tailored <strong>to</strong> this in<strong>for</strong>mation. Egg and fry<br />
s<strong>to</strong>cking are most likely <strong>to</strong> benefit from smaller stream (width
Table 2. Penobscot basin Atlantic salmon habitat (GIS-model) and predicted 90 th quantile large parr production<br />
Subwatershed Dam Reach Management Reach<br />
PRFP Page 150<br />
Width<br />
Class (m) Rearing Units<br />
Large Parr<br />
Production<br />
Piscataquis Headwaters <strong>to</strong> Guil<strong>for</strong>d Piscataquis Upper 0 <strong>to</strong> 2 1,384 15,269<br />
Piscataquis Headwaters <strong>to</strong> Guil<strong>for</strong>d Piscataquis Upper 2 <strong>to</strong> 4 5,681 62,438<br />
Piscataquis Headwaters <strong>to</strong> Guil<strong>for</strong>d Piscataquis Upper 4 <strong>to</strong> 6 996 10,833<br />
Piscataquis Headwaters <strong>to</strong> Guil<strong>for</strong>d Piscataquis Upper 6 <strong>to</strong> 8 676 7,226<br />
Piscataquis Headwaters <strong>to</strong> Guil<strong>for</strong>d Piscataquis Upper 8 <strong>to</strong> 10 520 5,463<br />
Piscataquis Headwaters <strong>to</strong> Guil<strong>for</strong>d Piscataquis Upper 10 <strong>to</strong> 12 1,609 16,454<br />
Piscataquis Headwaters <strong>to</strong> Guil<strong>for</strong>d Piscataquis Upper 12 <strong>to</strong> 14 896 8,880<br />
Piscataquis Headwaters <strong>to</strong> Guil<strong>for</strong>d Piscataquis Upper 14 <strong>to</strong> 16 857 8,221<br />
Piscataquis Headwaters <strong>to</strong> Guil<strong>for</strong>d Piscataquis Upper 16 <strong>to</strong> 18 649 6,063<br />
Piscataquis Headwaters <strong>to</strong> Guil<strong>for</strong>d Piscataquis Upper 20 <strong>to</strong> 22 1,614 13,608<br />
Piscataquis Headwaters <strong>to</strong> Guil<strong>for</strong>d Piscataquis Upper 22 <strong>to</strong> 24 518 4,036<br />
Piscataquis Headwaters <strong>to</strong> Guil<strong>for</strong>d Piscataquis Upper 24 <strong>to</strong> 26 250 1,914<br />
Piscataquis Headwaters <strong>to</strong> Guil<strong>for</strong>d Piscataquis Upper 26 <strong>to</strong> 28 606 4,196<br />
Piscataquis Headwaters <strong>to</strong> Guil<strong>for</strong>d Piscataquis Upper 28 <strong>to</strong> 30 580 3,772<br />
Piscataquis Headwaters <strong>to</strong> Guil<strong>for</strong>d Piscataquis Upper 30 <strong>to</strong> 32 1,525 9,615<br />
Piscataquis Headwaters <strong>to</strong> Guil<strong>for</strong>d Piscataquis Upper 40 <strong>to</strong> 42 554 2,151<br />
Headwaters <strong>to</strong> Guil<strong>for</strong>d Total 18,914 180,139<br />
Piscataquis Upper Total 18,914 180,139<br />
Piscataquis Guil<strong>for</strong>d <strong>to</strong> Moosehead Manufacturing Guil<strong>for</strong>d <strong>to</strong> Moosehead Manufacturing 0 <strong>to</strong> 2 294 3,245<br />
Piscataquis Guil<strong>for</strong>d <strong>to</strong> Moosehead Manufacturing Guil<strong>for</strong>d <strong>to</strong> Moosehead Manufacturing 2 <strong>to</strong> 4 435 4,788<br />
Piscataquis Guil<strong>for</strong>d <strong>to</strong> Moosehead Manufacturing Guil<strong>for</strong>d <strong>to</strong> Moosehead Manufacturing 4 <strong>to</strong> 6 212 2,301<br />
Piscataquis Guil<strong>for</strong>d <strong>to</strong> Moosehead Manufacturing Guil<strong>for</strong>d <strong>to</strong> Moosehead Manufacturing 6 <strong>to</strong> 8 196 2,106<br />
Piscataquis Guil<strong>for</strong>d <strong>to</strong> Moosehead Manufacturing Guil<strong>for</strong>d <strong>to</strong> Moosehead Manufacturing 8 <strong>to</strong> 10 56 588<br />
Piscataquis Guil<strong>for</strong>d <strong>to</strong> Moosehead Manufacturing Guil<strong>for</strong>d <strong>to</strong> Moosehead Manufacturing 12 <strong>to</strong> 14 79 789<br />
Piscataquis Guil<strong>for</strong>d <strong>to</strong> Moosehead Manufacturing Guil<strong>for</strong>d <strong>to</strong> Moosehead Manufacturing 14 <strong>to</strong> 16 13 131<br />
Piscataquis Guil<strong>for</strong>d <strong>to</strong> Moosehead Manufacturing Guil<strong>for</strong>d <strong>to</strong> Moosehead Manufacturing 42 <strong>to</strong> 44 71 264<br />
Piscataquis Guil<strong>for</strong>d <strong>to</strong> Moosehead Manufacturing Guil<strong>for</strong>d <strong>to</strong> Moosehead Manufacturing 44 <strong>to</strong> 46 627 1,993<br />
Piscataquis Guil<strong>for</strong>d <strong>to</strong> Moosehead Manufacturing Guil<strong>for</strong>d <strong>to</strong> Moosehead Manufacturing 48 <strong>to</strong> 50 676 1,738<br />
Guil<strong>for</strong>d <strong>to</strong> Moosehead Manufacturing Total 2,660 17,943<br />
Guil<strong>for</strong>d <strong>to</strong> Moosehead Manufacturing Total 2,660 17,943<br />
Piscataquis Brown's Mill <strong>to</strong> Howland Piscataquis Lower 0 <strong>to</strong> 2 377 4,157<br />
Piscataquis Brown's Mill <strong>to</strong> Howland Piscataquis Lower 2 <strong>to</strong> 4 2,254 24,770<br />
Piscataquis Brown's Mill <strong>to</strong> Howland Piscataquis Lower 4 <strong>to</strong> 6 1,080 11,732<br />
Piscataquis Brown's Mill <strong>to</strong> Howland Piscataquis Lower 6 <strong>to</strong> 8 438 4,699<br />
Piscataquis Brown's Mill <strong>to</strong> Howland Piscataquis Lower 8 <strong>to</strong> 10 499 5,227
Subwatershed Dam Reach Management Reach<br />
PRFP Page 151<br />
Width<br />
Class (m) Rearing Units<br />
Large Parr<br />
Production<br />
Piscataquis Brown's Mill <strong>to</strong> Howland Piscataquis Lower 12 <strong>to</strong> 14 141 1,396<br />
Piscataquis Brown's Mill <strong>to</strong> Howland Piscataquis Lower 14 <strong>to</strong> 16 622 5,981<br />
Piscataquis Brown's Mill <strong>to</strong> Howland Piscataquis Lower 16 <strong>to</strong> 18 136 1,267<br />
Piscataquis Brown's Mill <strong>to</strong> Howland Piscataquis Lower 48 <strong>to</strong> 50 1,375 3,566<br />
Piscataquis Brown's Mill <strong>to</strong> Howland Piscataquis Lower 50 <strong>to</strong> 300 9,625 6,423<br />
Piscataquis Lower Total 16,549 69,218<br />
Piscataquis Brown's Mill <strong>to</strong> Howland Pleasant River 0 <strong>to</strong> 2 811 8,941<br />
Piscataquis Brown's Mill <strong>to</strong> Howland Pleasant River 2 <strong>to</strong> 4 6,427 70,663<br />
Piscataquis Brown's Mill <strong>to</strong> Howland Pleasant River 4 <strong>to</strong> 6 1,831 19,889<br />
Piscataquis Brown's Mill <strong>to</strong> Howland Pleasant River 6 <strong>to</strong> 8 2,055 21,921<br />
Piscataquis Brown's Mill <strong>to</strong> Howland Pleasant River 8 <strong>to</strong> 10 435 4,591<br />
Piscataquis Brown's Mill <strong>to</strong> Howland Pleasant River 10 <strong>to</strong> 12 980 10,049<br />
Piscataquis Brown's Mill <strong>to</strong> Howland Pleasant River 12 <strong>to</strong> 14 1,299 12,998<br />
Piscataquis Brown's Mill <strong>to</strong> Howland Pleasant River 14 <strong>to</strong> 16 608 5,836<br />
Piscataquis Brown's Mill <strong>to</strong> Howland Pleasant River 16 <strong>to</strong> 18 1,180 10,869<br />
Piscataquis Brown's Mill <strong>to</strong> Howland Pleasant River 18 <strong>to</strong> 20 966 8,501<br />
Piscataquis Brown's Mill <strong>to</strong> Howland Pleasant River 20 <strong>to</strong> 22 931 7,882<br />
Piscataquis Brown's Mill <strong>to</strong> Howland Pleasant River 22 <strong>to</strong> 24 478 3,858<br />
Piscataquis Brown's Mill <strong>to</strong> Howland Pleasant River 24 <strong>to</strong> 26 103 759<br />
Piscataquis Brown's Mill <strong>to</strong> Howland Pleasant River 26 <strong>to</strong> 28 1,737 12,454<br />
Piscataquis Brown's Mill <strong>to</strong> Howland Pleasant River 30 <strong>to</strong> 32 386 2,458<br />
Piscataquis Brown's Mill <strong>to</strong> Howland Pleasant River 32 <strong>to</strong> 34 286 1,695<br />
Piscataquis Brown's Mill <strong>to</strong> Howland Pleasant River 46 <strong>to</strong> 48 776 2,212<br />
Pleasant River Total 21,288 205,576<br />
Piscataquis Brown's Mill <strong>to</strong> Howland Sebec River 0 <strong>to</strong> 2 1,207 13,313<br />
Piscataquis Brown's Mill <strong>to</strong> Howland Sebec River 2 <strong>to</strong> 4 4,011 44,097<br />
Piscataquis Brown's Mill <strong>to</strong> Howland Sebec River 4 <strong>to</strong> 6 1,902 20,685<br />
Piscataquis Brown's Mill <strong>to</strong> Howland Sebec River 6 <strong>to</strong> 8 1,309 14,055<br />
Piscataquis Brown's Mill <strong>to</strong> Howland Sebec River 8 <strong>to</strong> 10 750 7,849<br />
Piscataquis Brown's Mill <strong>to</strong> Howland Sebec River 10 <strong>to</strong> 12 556 5,656<br />
Piscataquis Brown's Mill <strong>to</strong> Howland Sebec River 12 <strong>to</strong> 14 331 3,313<br />
Piscataquis Brown's Mill <strong>to</strong> Howland Sebec River 14 <strong>to</strong> 16 418 3,987<br />
Piscataquis Brown's Mill <strong>to</strong> Howland Sebec River 16 <strong>to</strong> 18 444 4,133<br />
Piscataquis Brown's Mill <strong>to</strong> Howland Sebec River 18 <strong>to</strong> 20 949 8,424<br />
Piscataquis Brown's Mill <strong>to</strong> Howland Sebec River 20 <strong>to</strong> 22 611 5,213<br />
Piscataquis Brown's Mill <strong>to</strong> Howland Sebec River 22 <strong>to</strong> 24 345 2,752
Subwatershed Dam Reach Management Reach<br />
PRFP Page 152<br />
Width<br />
Class (m) Rearing Units<br />
Large Parr<br />
Production<br />
Piscataquis Brown's Mill <strong>to</strong> Howland Sebec River 24 <strong>to</strong> 26 934 7,183<br />
Piscataquis Brown's Mill <strong>to</strong> Howland Sebec River 30 <strong>to</strong> 32 465 2,861<br />
Piscataquis Brown's Mill <strong>to</strong> Howland Sebec River 46 <strong>to</strong> 48 444 1,202<br />
Piscataquis Brown's Mill <strong>to</strong> Howland Sebec River 48 <strong>to</strong> 50 971 2,379<br />
Sebec River Total 15,648 147,102<br />
Piscataquis Brown's Mill <strong>to</strong> Howland Seboeis Stream 0 <strong>to</strong> 2 74 815<br />
Piscataquis Brown's Mill <strong>to</strong> Howland Seboeis Stream 2 <strong>to</strong> 4 1,420 15,590<br />
Piscataquis Brown's Mill <strong>to</strong> Howland Seboeis Stream 4 <strong>to</strong> 6 557 6,054<br />
Piscataquis Brown's Mill <strong>to</strong> Howland Seboeis Stream 6 <strong>to</strong> 8 305 3,270<br />
Piscataquis Brown's Mill <strong>to</strong> Howland Seboeis Stream 8 <strong>to</strong> 10 84 880<br />
Piscataquis Brown's Mill <strong>to</strong> Howland Seboeis Stream 10 <strong>to</strong> 12 71 725<br />
Piscataquis Brown's Mill <strong>to</strong> Howland Seboeis Stream 14 <strong>to</strong> 16 447 4,255<br />
Piscataquis Brown's Mill <strong>to</strong> Howland Seboeis Stream 16 <strong>to</strong> 18 131 1,221<br />
Piscataquis Brown's Mill <strong>to</strong> Howland Seboeis Stream 20 <strong>to</strong> 22 47 393<br />
Piscataquis Brown's Mill <strong>to</strong> Howland Seboeis Stream 22 <strong>to</strong> 24 267 2,109<br />
Piscataquis Brown's Mill <strong>to</strong> Howland Seboeis Stream 24 <strong>to</strong> 26 1,069 8,144<br />
Piscataquis Brown's Mill <strong>to</strong> Howland Seboeis Stream 26 <strong>to</strong> 28 33 234<br />
Piscataquis Brown's Mill <strong>to</strong> Howland Seboeis Stream 32 <strong>to</strong> 34 197 1,105<br />
Piscataquis Brown's Mill <strong>to</strong> Howland Seboeis Stream 34 <strong>to</strong> 36 816 4,493<br />
Seboeis Stream Total 5,516 49,288<br />
Brown's Mill <strong>to</strong> Howland Total 59,001 471,184<br />
Piscataquis Total 80,574 669,266<br />
East Branch Headwaters <strong>to</strong> Weldon East Branch 0 <strong>to</strong> 2 83 911<br />
East Branch Headwaters <strong>to</strong> Weldon East Branch 2 <strong>to</strong> 4 5,844 64,275<br />
East Branch Headwaters <strong>to</strong> Weldon East Branch 4 <strong>to</strong> 6 3,051 33,157<br />
East Branch Headwaters <strong>to</strong> Weldon East Branch 6 <strong>to</strong> 8 1,587 16,968<br />
East Branch Headwaters <strong>to</strong> Weldon East Branch 8 <strong>to</strong> 10 337 3,531<br />
East Branch Headwaters <strong>to</strong> Weldon East Branch 10 <strong>to</strong> 12 795 8,141<br />
East Branch Headwaters <strong>to</strong> Weldon East Branch 12 <strong>to</strong> 14 729 7,266<br />
East Branch Headwaters <strong>to</strong> Weldon East Branch 14 <strong>to</strong> 16 320 3,104<br />
East Branch Headwaters <strong>to</strong> Weldon East Branch 16 <strong>to</strong> 18 552 5,061<br />
East Branch Headwaters <strong>to</strong> Weldon East Branch 18 <strong>to</strong> 20 257 2,269<br />
East Branch Headwaters <strong>to</strong> Weldon East Branch 50 <strong>to</strong> 300 8,686 2,442<br />
East Branch Total 22,242 147,125
Subwatershed Dam Reach Management Reach<br />
PRFP Page 153<br />
Width<br />
Class (m) Rearing Units<br />
Large Parr<br />
Production<br />
East Branch Headwaters <strong>to</strong> Weldon Seboeis River 0 <strong>to</strong> 2 18 200<br />
East Branch Headwaters <strong>to</strong> Weldon Seboeis River 2 <strong>to</strong> 4 2,679 29,462<br />
East Branch Headwaters <strong>to</strong> Weldon Seboeis River 4 <strong>to</strong> 6 456 4,944<br />
East Branch Headwaters <strong>to</strong> Weldon Seboeis River 6 <strong>to</strong> 8 335 3,590<br />
East Branch Headwaters <strong>to</strong> Weldon Seboeis River 8 <strong>to</strong> 10 506 5,327<br />
East Branch Headwaters <strong>to</strong> Weldon Seboeis River 10 <strong>to</strong> 12 87 902<br />
East Branch Headwaters <strong>to</strong> Weldon Seboeis River 12 <strong>to</strong> 14 299 2,952<br />
East Branch Headwaters <strong>to</strong> Weldon Seboeis River 14 <strong>to</strong> 16 454 4,399<br />
East Branch Headwaters <strong>to</strong> Weldon Seboeis River 16 <strong>to</strong> 18 70 635<br />
East Branch Headwaters <strong>to</strong> Weldon Seboeis River 18 <strong>to</strong> 20 448 3,883<br />
East Branch Headwaters <strong>to</strong> Weldon Seboeis River 26 <strong>to</strong> 28 814 5,798<br />
East Branch Headwaters <strong>to</strong> Weldon Seboeis River 34 <strong>to</strong> 36 405 2,218<br />
East Branch Headwaters <strong>to</strong> Weldon Seboeis River 38 <strong>to</strong> 40 395 1,664<br />
East Branch Headwaters <strong>to</strong> Weldon Seboeis River 40 <strong>to</strong> 42 482 1,961<br />
Seboeis River Total 7,448 67,935<br />
East Branch Headwaters <strong>to</strong> Weldon Wassataquoik Stream 0 <strong>to</strong> 2 38 420<br />
East Branch Headwaters <strong>to</strong> Weldon Wassataquoik Stream 2 <strong>to</strong> 4 2,672 29,395<br />
East Branch Headwaters <strong>to</strong> Weldon Wassataquoik Stream 4 <strong>to</strong> 6 388 4,234<br />
East Branch Headwaters <strong>to</strong> Weldon Wassataquoik Stream 6 <strong>to</strong> 8 341 3,633<br />
East Branch Headwaters <strong>to</strong> Weldon Wassataquoik Stream 8 <strong>to</strong> 10 377 3,962<br />
East Branch Headwaters <strong>to</strong> Weldon Wassataquoik Stream 10 <strong>to</strong> 12 255 2,622<br />
East Branch Headwaters <strong>to</strong> Weldon Wassataquoik Stream 12 <strong>to</strong> 14 83 822<br />
East Branch Headwaters <strong>to</strong> Weldon Wassataquoik Stream 14 <strong>to</strong> 16 496 4,679<br />
East Branch Headwaters <strong>to</strong> Weldon Wassataquoik Stream 26 <strong>to</strong> 28 1,140 8,000<br />
Wassataquoik Stream Total 5,790 57,767<br />
Headwaters <strong>to</strong> Weldon Total 35,480 272,827<br />
East Branch Total 35,480 272,827<br />
Mattawamkeag Weldon <strong>to</strong> West Enfield Baskahegan Stream 0 <strong>to</strong> 2 112 1,228<br />
Mattawamkeag Weldon <strong>to</strong> West Enfield Baskahegan Stream 2 <strong>to</strong> 4 1,645 18,085<br />
Mattawamkeag Weldon <strong>to</strong> West Enfield Baskahegan Stream 4 <strong>to</strong> 6 244 2,646<br />
Mattawamkeag Weldon <strong>to</strong> West Enfield Baskahegan Stream 6 <strong>to</strong> 8 89 954<br />
Mattawamkeag Weldon <strong>to</strong> West Enfield Baskahegan Stream 8 <strong>to</strong> 10 148 1,562<br />
Mattawamkeag Weldon <strong>to</strong> West Enfield Baskahegan Stream 12 <strong>to</strong> 14 9 93<br />
Mattawamkeag Weldon <strong>to</strong> West Enfield Baskahegan Stream 14 <strong>to</strong> 16 38 360<br />
Mattawamkeag Weldon <strong>to</strong> West Enfield Baskahegan Stream 20 <strong>to</strong> 22 188 1,551
Subwatershed Dam Reach Management Reach<br />
PRFP Page 154<br />
Width<br />
Class (m) Rearing Units<br />
Large Parr<br />
Production<br />
Mattawamkeag Weldon <strong>to</strong> West Enfield Baskahegan Stream 30 <strong>to</strong> 32 75 460<br />
Mattawamkeag Weldon <strong>to</strong> West Enfield Baskahegan Stream 34 <strong>to</strong> 36 471 2,440<br />
Mattawamkeag Weldon <strong>to</strong> West Enfield Baskahegan Stream 40 <strong>to</strong> 42 771 3,227<br />
Baskahegan Stream Total 3,789 32,606<br />
Mattawamkeag Weldon <strong>to</strong> West Enfield East Branch Mattawamkeag River 0 <strong>to</strong> 2 40 442<br />
Mattawamkeag Weldon <strong>to</strong> West Enfield East Branch Mattawamkeag River 2 <strong>to</strong> 4 2,026 22,271<br />
Mattawamkeag Weldon <strong>to</strong> West Enfield East Branch Mattawamkeag River 4 <strong>to</strong> 6 445 4,843<br />
Mattawamkeag Weldon <strong>to</strong> West Enfield East Branch Mattawamkeag River 6 <strong>to</strong> 8 427 4,563<br />
Mattawamkeag Weldon <strong>to</strong> West Enfield East Branch Mattawamkeag River 8 <strong>to</strong> 10 345 3,620<br />
Mattawamkeag Weldon <strong>to</strong> West Enfield East Branch Mattawamkeag River 14 <strong>to</strong> 16 135 1,300<br />
Mattawamkeag Weldon <strong>to</strong> West Enfield East Branch Mattawamkeag River 22 <strong>to</strong> 24 103 832<br />
Mattawamkeag Weldon <strong>to</strong> West Enfield East Branch Mattawamkeag River 24 <strong>to</strong> 26 62 483<br />
Mattawamkeag Weldon <strong>to</strong> West Enfield East Branch Mattawamkeag River 28 <strong>to</strong> 30 95 654<br />
Mattawamkeag Weldon <strong>to</strong> West Enfield East Branch Mattawamkeag River 32 <strong>to</strong> 34 294 1,672<br />
East Branch Mattawamkeag River Total 3,973 40,680<br />
Mattawamkeag Weldon <strong>to</strong> West Enfield Mattawamkeag 0 <strong>to</strong> 2 340 3,751<br />
Mattawamkeag Weldon <strong>to</strong> West Enfield Mattawamkeag 2 <strong>to</strong> 4 6,692 73,572<br />
Mattawamkeag Weldon <strong>to</strong> West Enfield Mattawamkeag 4 <strong>to</strong> 6 2,976 32,347<br />
Mattawamkeag Weldon <strong>to</strong> West Enfield Mattawamkeag 6 <strong>to</strong> 8 1,964 21,016<br />
Mattawamkeag Weldon <strong>to</strong> West Enfield Mattawamkeag 8 <strong>to</strong> 10 2,073 21,795<br />
Mattawamkeag Weldon <strong>to</strong> West Enfield Mattawamkeag 10 <strong>to</strong> 12 1,000 10,233<br />
Mattawamkeag Weldon <strong>to</strong> West Enfield Mattawamkeag 12 <strong>to</strong> 14 620 6,194<br />
Mattawamkeag Weldon <strong>to</strong> West Enfield Mattawamkeag 14 <strong>to</strong> 16 445 4,274<br />
Mattawamkeag Weldon <strong>to</strong> West Enfield Mattawamkeag 16 <strong>to</strong> 18 882 8,101<br />
Mattawamkeag Weldon <strong>to</strong> West Enfield Mattawamkeag 20 <strong>to</strong> 22 39 327<br />
Mattawamkeag Weldon <strong>to</strong> West Enfield Mattawamkeag 22 <strong>to</strong> 24 611 4,960<br />
Mattawamkeag Weldon <strong>to</strong> West Enfield Mattawamkeag 40 <strong>to</strong> 42 122 511<br />
Mattawamkeag Weldon <strong>to</strong> West Enfield Mattawamkeag 50 <strong>to</strong> 300 15,410 0<br />
Mattawamkeag Total 33,176 187,081<br />
Mattawamkeag Weldon <strong>to</strong> West Enfield Molunkus Stream 2 <strong>to</strong> 4 2,531 27,840<br />
Mattawamkeag Weldon <strong>to</strong> West Enfield Molunkus Stream 4 <strong>to</strong> 6 445 4,831<br />
Mattawamkeag Weldon <strong>to</strong> West Enfield Molunkus Stream 6 <strong>to</strong> 8 118 1,269<br />
Mattawamkeag Weldon <strong>to</strong> West Enfield Molunkus Stream 8 <strong>to</strong> 10 134 1,415<br />
Mattawamkeag Weldon <strong>to</strong> West Enfield Molunkus Stream 10 <strong>to</strong> 12 10 105
Subwatershed Dam Reach Management Reach<br />
PRFP Page 155<br />
Width<br />
Class (m) Rearing Units<br />
Large Parr<br />
Production<br />
Mattawamkeag Weldon <strong>to</strong> West Enfield Molunkus Stream 12 <strong>to</strong> 14 95 945<br />
Mattawamkeag Weldon <strong>to</strong> West Enfield Molunkus Stream 18 <strong>to</strong> 20 543 4,797<br />
Mattawamkeag Weldon <strong>to</strong> West Enfield Molunkus Stream 24 <strong>to</strong> 26 58 432<br />
Mattawamkeag Weldon <strong>to</strong> West Enfield Molunkus Stream 28 <strong>to</strong> 30 293 2,002<br />
Mattawamkeag Weldon <strong>to</strong> West Enfield Molunkus Stream 32 <strong>to</strong> 34 289 1,693<br />
Molunkus Stream Total 4,517 45,329<br />
Mattawamkeag Weldon <strong>to</strong> West Enfield West Branch Mattawamkeag River 0 <strong>to</strong> 2 67 738<br />
Mattawamkeag Weldon <strong>to</strong> West Enfield West Branch Mattawamkeag River 2 <strong>to</strong> 4 3,715 40,848<br />
Mattawamkeag Weldon <strong>to</strong> West Enfield West Branch Mattawamkeag River 4 <strong>to</strong> 6 1,479 16,063<br />
Mattawamkeag Weldon <strong>to</strong> West Enfield West Branch Mattawamkeag River 6 <strong>to</strong> 8 892 9,527<br />
Mattawamkeag Weldon <strong>to</strong> West Enfield West Branch Mattawamkeag River 8 <strong>to</strong> 10 1,155 12,075<br />
Mattawamkeag Weldon <strong>to</strong> West Enfield West Branch Mattawamkeag River 10 <strong>to</strong> 12 618 6,346<br />
Mattawamkeag Weldon <strong>to</strong> West Enfield West Branch Mattawamkeag River 12 <strong>to</strong> 14 600 5,967<br />
Mattawamkeag Weldon <strong>to</strong> West Enfield West Branch Mattawamkeag River 14 <strong>to</strong> 16 43 418<br />
Mattawamkeag Weldon <strong>to</strong> West Enfield West Branch Mattawamkeag River 16 <strong>to</strong> 18 136 1,255<br />
Mattawamkeag Weldon <strong>to</strong> West Enfield West Branch Mattawamkeag River 18 <strong>to</strong> 20 105 949<br />
Mattawamkeag Weldon <strong>to</strong> West Enfield West Branch Mattawamkeag River 20 <strong>to</strong> 22 253 2,086<br />
Mattawamkeag Weldon <strong>to</strong> West Enfield West Branch Mattawamkeag River 22 <strong>to</strong> 24 66 543<br />
Mattawamkeag Weldon <strong>to</strong> West Enfield West Branch Mattawamkeag River 24 <strong>to</strong> 26 81 596<br />
Mattawamkeag Weldon <strong>to</strong> West Enfield West Branch Mattawamkeag River 46 <strong>to</strong> 48 698 1,913<br />
Mattawamkeag Weldon <strong>to</strong> West Enfield West Branch Mattawamkeag River 50 <strong>to</strong> 300 742 1,649<br />
West Branch Mattawamkeag River Total 10,651 100,973<br />
Mattawamkeag Weldon <strong>to</strong> West Enfield Wy<strong>to</strong>pitlock Stream 2 <strong>to</strong> 4 490 5,384<br />
Mattawamkeag Weldon <strong>to</strong> West Enfield Wy<strong>to</strong>pitlock Stream 4 <strong>to</strong> 6 180 1,948<br />
Mattawamkeag Weldon <strong>to</strong> West Enfield Wy<strong>to</strong>pitlock Stream 12 <strong>to</strong> 14 152 1,531<br />
Mattawamkeag Weldon <strong>to</strong> West Enfield Wy<strong>to</strong>pitlock Stream 16 <strong>to</strong> 18 10 97<br />
Wy<strong>to</strong>pitlock Stream Total 833 8,960<br />
Weldon <strong>to</strong> West Enfield Total 56,938 415,629<br />
Mattawamkeag Total 56,938 415,629<br />
Lower Penobscot Medway <strong>to</strong> Weldon Medway <strong>to</strong> Weldon 0 <strong>to</strong> 2 26 292<br />
Lower Penobscot Medway <strong>to</strong> Weldon Medway <strong>to</strong> Weldon 2 <strong>to</strong> 4 855 9,397<br />
Lower Penobscot Medway <strong>to</strong> Weldon Medway <strong>to</strong> Weldon 4 <strong>to</strong> 6 317 3,439<br />
Lower Penobscot Medway <strong>to</strong> Weldon Medway <strong>to</strong> Weldon 6 <strong>to</strong> 8 33 352<br />
Lower Penobscot Medway <strong>to</strong> Weldon Medway <strong>to</strong> Weldon 8 <strong>to</strong> 10 14 146
Subwatershed Dam Reach Management Reach<br />
PRFP Page 156<br />
Width<br />
Class (m) Rearing Units<br />
Large Parr<br />
Production<br />
Lower Penobscot Medway <strong>to</strong> Weldon Medway <strong>to</strong> Weldon 10 <strong>to</strong> 12 57 575<br />
Lower Penobscot Medway <strong>to</strong> Weldon Medway <strong>to</strong> Weldon 14 <strong>to</strong> 16 10 98<br />
Lower Penobscot Medway <strong>to</strong> Weldon Medway <strong>to</strong> Weldon 18 <strong>to</strong> 20 79 708<br />
Medway <strong>to</strong> Weldon Total 1,391 15,007<br />
Medway <strong>to</strong> Weldon Total 1,391 15,007<br />
Lower Penobscot West Enfield <strong>to</strong> Mil<strong>for</strong>d Birch Stream 0 <strong>to</strong> 2 52 578<br />
Lower Penobscot West Enfield <strong>to</strong> Mil<strong>for</strong>d Birch Stream 2 <strong>to</strong> 4 443 4,873<br />
Lower Penobscot West Enfield <strong>to</strong> Mil<strong>for</strong>d Birch Stream 4 <strong>to</strong> 6 219 2,379<br />
Lower Penobscot West Enfield <strong>to</strong> Mil<strong>for</strong>d Birch Stream 6 <strong>to</strong> 8 348 3,713<br />
Lower Penobscot West Enfield <strong>to</strong> Mil<strong>for</strong>d Birch Stream 8 <strong>to</strong> 10 38 398<br />
Lower Penobscot West Enfield <strong>to</strong> Mil<strong>for</strong>d Birch Stream 10 <strong>to</strong> 12 298 3,033<br />
Lower Penobscot West Enfield <strong>to</strong> Mil<strong>for</strong>d Birch Stream 14 <strong>to</strong> 16 64 616<br />
Lower Penobscot West Enfield <strong>to</strong> Mil<strong>for</strong>d Birch Stream 16 <strong>to</strong> 18 52 484<br />
Lower Penobscot West Enfield <strong>to</strong> Mil<strong>for</strong>d Birch Stream 18 <strong>to</strong> 20 147 1,304<br />
Birch Stream Total 1,660 17,378<br />
Lower Penobscot West Enfield <strong>to</strong> Mil<strong>for</strong>d Hemlock Stream 0 <strong>to</strong> 2 112 1,236<br />
Lower Penobscot West Enfield <strong>to</strong> Mil<strong>for</strong>d Hemlock Stream 2 <strong>to</strong> 4 107 1,176<br />
Lower Penobscot West Enfield <strong>to</strong> Mil<strong>for</strong>d Hemlock Stream 4 <strong>to</strong> 6 13 137<br />
Lower Penobscot West Enfield <strong>to</strong> Mil<strong>for</strong>d Hemlock Stream 6 <strong>to</strong> 8 98 1,040<br />
Lower Penobscot West Enfield <strong>to</strong> Mil<strong>for</strong>d Hemlock Stream 10 <strong>to</strong> 12 117 1,210<br />
Hemlock Stream Total 447 4,799<br />
Lower Penobscot West Enfield <strong>to</strong> Mil<strong>for</strong>d Hoyt Brook 2 <strong>to</strong> 4 212 2,328<br />
Lower Penobscot West Enfield <strong>to</strong> Mil<strong>for</strong>d Hoyt Brook 8 <strong>to</strong> 10 63 660<br />
Hoyt Brook Total 275 2,988<br />
Lower Penobscot West Enfield <strong>to</strong> Mil<strong>for</strong>d Olamon Stream 0 <strong>to</strong> 2 15 168<br />
Lower Penobscot West Enfield <strong>to</strong> Mil<strong>for</strong>d Olamon Stream 2 <strong>to</strong> 4 476 5,221<br />
Lower Penobscot West Enfield <strong>to</strong> Mil<strong>for</strong>d Olamon Stream 4 <strong>to</strong> 6 166 1,809<br />
Lower Penobscot West Enfield <strong>to</strong> Mil<strong>for</strong>d Olamon Stream 6 <strong>to</strong> 8 84 897<br />
Lower Penobscot West Enfield <strong>to</strong> Mil<strong>for</strong>d Olamon Stream 12 <strong>to</strong> 14 397 3,957<br />
Lower Penobscot West Enfield <strong>to</strong> Mil<strong>for</strong>d Olamon Stream 14 <strong>to</strong> 16 198 1,885<br />
Lower Penobscot West Enfield <strong>to</strong> Mil<strong>for</strong>d Olamon Stream 18 <strong>to</strong> 20 88 790<br />
Olamon Stream Total 1,424 14,727
Subwatershed Dam Reach Management Reach<br />
PRFP Page 157<br />
Width<br />
Class (m) Rearing Units<br />
Large Parr<br />
Production<br />
Lower Penobscot West Enfield <strong>to</strong> Mil<strong>for</strong>d Penobscot West Enfield <strong>to</strong> Mil<strong>for</strong>d 0 <strong>to</strong> 2 46 508<br />
Lower Penobscot West Enfield <strong>to</strong> Mil<strong>for</strong>d Penobscot West Enfield <strong>to</strong> Mil<strong>for</strong>d 2 <strong>to</strong> 4 247 2,718<br />
Lower Penobscot West Enfield <strong>to</strong> Mil<strong>for</strong>d Penobscot West Enfield <strong>to</strong> Mil<strong>for</strong>d 4 <strong>to</strong> 6 100 1,090<br />
Lower Penobscot West Enfield <strong>to</strong> Mil<strong>for</strong>d Penobscot West Enfield <strong>to</strong> Mil<strong>for</strong>d 6 <strong>to</strong> 8 93 998<br />
Lower Penobscot West Enfield <strong>to</strong> Mil<strong>for</strong>d Penobscot West Enfield <strong>to</strong> Mil<strong>for</strong>d 18 <strong>to</strong> 20 10 89<br />
Lower Penobscot West Enfield <strong>to</strong> Mil<strong>for</strong>d Penobscot West Enfield <strong>to</strong> Mil<strong>for</strong>d 24 <strong>to</strong> 26 300 2,334<br />
Lower Penobscot West Enfield <strong>to</strong> Mil<strong>for</strong>d Penobscot West Enfield <strong>to</strong> Mil<strong>for</strong>d 50 <strong>to</strong> 300 4,070 388<br />
Penobscot West Enfield <strong>to</strong> Mil<strong>for</strong>d Total 4,866 8,125<br />
Lower Penobscot West Enfield <strong>to</strong> Mil<strong>for</strong>d Sunkhaze Stream 0 <strong>to</strong> 2 15 170<br />
Lower Penobscot West Enfield <strong>to</strong> Mil<strong>for</strong>d Sunkhaze Stream 2 <strong>to</strong> 4 527 5,783<br />
Lower Penobscot West Enfield <strong>to</strong> Mil<strong>for</strong>d Sunkhaze Stream 4 <strong>to</strong> 6 222 2,408<br />
Lower Penobscot West Enfield <strong>to</strong> Mil<strong>for</strong>d Sunkhaze Stream 6 <strong>to</strong> 8 192 2,061<br />
Lower Penobscot West Enfield <strong>to</strong> Mil<strong>for</strong>d Sunkhaze Stream 8 <strong>to</strong> 10 325 3,403<br />
Lower Penobscot West Enfield <strong>to</strong> Mil<strong>for</strong>d Sunkhaze Stream 10 <strong>to</strong> 12 128 1,296<br />
Lower Penobscot West Enfield <strong>to</strong> Mil<strong>for</strong>d Sunkhaze Stream 12 <strong>to</strong> 14 43 433<br />
Sunkhaze Stream Total 1,453 15,554<br />
West Enfield <strong>to</strong> Mil<strong>for</strong>d Total 10,126 63,571<br />
Lower Penobscot Mil<strong>for</strong>d <strong>to</strong> Veazie Chemo Pond 2 <strong>to</strong> 4 402 4,417<br />
Lower Penobscot Mil<strong>for</strong>d <strong>to</strong> Veazie Chemo Pond 4 <strong>to</strong> 6 25 267<br />
Lower Penobscot Mil<strong>for</strong>d <strong>to</strong> Veazie Chemo Pond 6 <strong>to</strong> 8 143 1,540<br />
Lower Penobscot Mil<strong>for</strong>d <strong>to</strong> Veazie Chemo Pond 8 <strong>to</strong> 10 105 1,097<br />
Lower Penobscot Mil<strong>for</strong>d <strong>to</strong> Veazie Chemo Pond 10 <strong>to</strong> 12 16 162<br />
Chemo Pond Total 691 7,483<br />
Lower Penobscot Mil<strong>for</strong>d <strong>to</strong> Veazie Great Works Stream 0 <strong>to</strong> 2 12 131<br />
Lower Penobscot Mil<strong>for</strong>d <strong>to</strong> Veazie Great Works Stream 2 <strong>to</strong> 4 504 5,536<br />
Lower Penobscot Mil<strong>for</strong>d <strong>to</strong> Veazie Great Works Stream 4 <strong>to</strong> 6 179 1,954<br />
Lower Penobscot Mil<strong>for</strong>d <strong>to</strong> Veazie Great Works Stream 8 <strong>to</strong> 10 147 1,533<br />
Lower Penobscot Mil<strong>for</strong>d <strong>to</strong> Veazie Great Works Stream 10 <strong>to</strong> 12 88 904<br />
Lower Penobscot Mil<strong>for</strong>d <strong>to</strong> Veazie Great Works Stream 16 <strong>to</strong> 18 21 189<br />
Great Works Stream Total 951 10,247<br />
Lower Penobscot Mil<strong>for</strong>d <strong>to</strong> Veazie Penobscot Mil<strong>for</strong>d <strong>to</strong> Veazie 0 <strong>to</strong> 2 2 24<br />
Lower Penobscot Mil<strong>for</strong>d <strong>to</strong> Veazie Penobscot Mil<strong>for</strong>d <strong>to</strong> Veazie 2 <strong>to</strong> 4 111 1,216<br />
Lower Penobscot Mil<strong>for</strong>d <strong>to</strong> Veazie Penobscot Mil<strong>for</strong>d <strong>to</strong> Veazie 4 <strong>to</strong> 6 120 1,312
Subwatershed Dam Reach Management Reach<br />
PRFP Page 158<br />
Width<br />
Class (m) Rearing Units<br />
Large Parr<br />
Production<br />
Lower Penobscot Mil<strong>for</strong>d <strong>to</strong> Veazie Penobscot Mil<strong>for</strong>d <strong>to</strong> Veazie 16 <strong>to</strong> 18 24 224<br />
Lower Penobscot Mil<strong>for</strong>d <strong>to</strong> Veazie Penobscot Mil<strong>for</strong>d <strong>to</strong> Veazie 50 <strong>to</strong> 300 9,822 0<br />
Penobscot Mil<strong>for</strong>d <strong>to</strong> Veazie Total 10,080 2,776<br />
Lower Penobscot Mil<strong>for</strong>d <strong>to</strong> Veazie Stillwater Gilman <strong>to</strong> Orono 2 <strong>to</strong> 4 35 381<br />
Lower Penobscot Mil<strong>for</strong>d <strong>to</strong> Veazie Stillwater Gilman <strong>to</strong> Orono 40 <strong>to</strong> 42 1,646 6,764<br />
Stillwater Gilman <strong>to</strong> Orono Total 1,681 7,145<br />
Mil<strong>for</strong>d <strong>to</strong> Veazie Total 13,402 27,651<br />
Lower Penobscot Gilman <strong>to</strong> Stillwater Pushaw Stream 0 <strong>to</strong> 2 455 5,014<br />
Lower Penobscot Gilman <strong>to</strong> Stillwater Pushaw Stream 2 <strong>to</strong> 4 1,627 17,883<br />
Lower Penobscot Gilman <strong>to</strong> Stillwater Pushaw Stream 4 <strong>to</strong> 6 755 8,193<br />
Lower Penobscot Gilman <strong>to</strong> Stillwater Pushaw Stream 6 <strong>to</strong> 8 645 6,899<br />
Lower Penobscot Gilman <strong>to</strong> Stillwater Pushaw Stream 8 <strong>to</strong> 10 137 1,442<br />
Lower Penobscot Gilman <strong>to</strong> Stillwater Pushaw Stream 10 <strong>to</strong> 12 737 7,547<br />
Lower Penobscot Gilman <strong>to</strong> Stillwater Pushaw Stream 12 <strong>to</strong> 14 78 770<br />
Lower Penobscot Gilman <strong>to</strong> Stillwater Pushaw Stream 14 <strong>to</strong> 16 391 3,757<br />
Lower Penobscot Gilman <strong>to</strong> Stillwater Pushaw Stream 16 <strong>to</strong> 18 166 1,551<br />
Lower Penobscot Gilman <strong>to</strong> Stillwater Pushaw Stream 20 <strong>to</strong> 22 77 640<br />
Lower Penobscot Gilman <strong>to</strong> Stillwater Pushaw Stream 24 <strong>to</strong> 26 261 1,969<br />
Lower Penobscot Gilman <strong>to</strong> Stillwater Pushaw Stream 26 <strong>to</strong> 28 118 818<br />
Pushaw Stream Total 5,447 56,483<br />
Gilman <strong>to</strong> Stillwater Total 5,447 56,483<br />
Lower Penobscot Gilman <strong>to</strong> West Lowell Tannery Passadumkeag 0 <strong>to</strong> 2 203 2,252<br />
Lower Penobscot Gilman <strong>to</strong> West Lowell Tannery Passadumkeag 2 <strong>to</strong> 4 2,338 25,704<br />
Lower Penobscot Gilman <strong>to</strong> West Lowell Tannery Passadumkeag 4 <strong>to</strong> 6 796 8,653<br />
Lower Penobscot Gilman <strong>to</strong> West Lowell Tannery Passadumkeag 6 <strong>to</strong> 8 512 5,490<br />
Lower Penobscot Gilman <strong>to</strong> West Lowell Tannery Passadumkeag 8 <strong>to</strong> 10 169 1,769<br />
Lower Penobscot Gilman <strong>to</strong> West Lowell Tannery Passadumkeag 10 <strong>to</strong> 12 88 903<br />
Lower Penobscot Gilman <strong>to</strong> West Lowell Tannery Passadumkeag 12 <strong>to</strong> 14 193 1,910<br />
Lower Penobscot Gilman <strong>to</strong> West Lowell Tannery Passadumkeag 14 <strong>to</strong> 16 331 3,156<br />
Lower Penobscot Gilman <strong>to</strong> West Lowell Tannery Passadumkeag 16 <strong>to</strong> 18 127 1,167<br />
Lower Penobscot Gilman <strong>to</strong> West Lowell Tannery Passadumkeag 20 <strong>to</strong> 22 494 4,204<br />
Lower Penobscot Gilman <strong>to</strong> West Lowell Tannery Passadumkeag 22 <strong>to</strong> 24 143 1,142<br />
Lower Penobscot Gilman <strong>to</strong> West Lowell Tannery Passadumkeag 34 <strong>to</strong> 36 296 1,505<br />
Lower Penobscot Gilman <strong>to</strong> West Lowell Tannery Passadumkeag 36 <strong>to</strong> 38 825 3,963
Subwatershed Dam Reach Management Reach<br />
PRFP Page 159<br />
Width<br />
Class (m) Rearing Units<br />
Large Parr<br />
Production<br />
Lower Penobscot Gilman <strong>to</strong> West Lowell Tannery Passadumkeag 42 <strong>to</strong> 44 700 2,482<br />
Lower Penobscot Gilman <strong>to</strong> West Lowell Tannery Passadumkeag 44 <strong>to</strong> 46 734 2,320<br />
Passadumkeag Total 7,950 66,620<br />
Gilman <strong>to</strong> West Lowell Tannery Total 7,950 66,620<br />
Lower Penobscot Veazie <strong>to</strong> Verona Island Alamoosook Lake 0 <strong>to</strong> 2 97 1,071<br />
Lower Penobscot Veazie <strong>to</strong> Verona Island Alamoosook Lake 2 <strong>to</strong> 4 365 4,001<br />
Lower Penobscot Veazie <strong>to</strong> Verona Island Alamoosook Lake 4 <strong>to</strong> 6 114 1,234<br />
Lower Penobscot Veazie <strong>to</strong> Verona Island Alamoosook Lake 6 <strong>to</strong> 8 61 660<br />
Lower Penobscot Veazie <strong>to</strong> Verona Island Alamoosook Lake 8 <strong>to</strong> 10 15 163<br />
Lower Penobscot Veazie <strong>to</strong> Verona Island Alamoosook Lake 12 <strong>to</strong> 14 158 1,576<br />
Lower Penobscot Veazie <strong>to</strong> Verona Island Alamoosook Lake 14 <strong>to</strong> 16 37 346<br />
Alamoosook Lake Total 848 9,051<br />
Lower Penobscot Veazie <strong>to</strong> Verona Island Ea<strong>to</strong>n Brook 2 <strong>to</strong> 4 39 422<br />
Lower Penobscot Veazie <strong>to</strong> Verona Island Ea<strong>to</strong>n Brook 6 <strong>to</strong> 8 85 918<br />
Lower Penobscot Veazie <strong>to</strong> Verona Island Ea<strong>to</strong>n Brook 8 <strong>to</strong> 10 46 481<br />
Lower Penobscot Veazie <strong>to</strong> Verona Island Ea<strong>to</strong>n Brook 10 <strong>to</strong> 12 107 1,097<br />
Ea<strong>to</strong>n Brook Total 276 2,918<br />
Lower Penobscot Veazie <strong>to</strong> Verona Island Felts Brook 2 <strong>to</strong> 4 40 445<br />
Lower Penobscot Veazie <strong>to</strong> Verona Island Felts Brook 4 <strong>to</strong> 6 30 321<br />
Lower Penobscot Veazie <strong>to</strong> Verona Island Felts Brook 6 <strong>to</strong> 8 139 1,478<br />
Felts Brook Total 209 2,244<br />
Lower Penobscot Veazie <strong>to</strong> Verona Island Kenduskeag 0 <strong>to</strong> 2 260 2,874<br />
Lower Penobscot Veazie <strong>to</strong> Verona Island Kenduskeag 2 <strong>to</strong> 4 2,003 22,020<br />
Lower Penobscot Veazie <strong>to</strong> Verona Island Kenduskeag 4 <strong>to</strong> 6 564 6,130<br />
Lower Penobscot Veazie <strong>to</strong> Verona Island Kenduskeag 6 <strong>to</strong> 8 512 5,486<br />
Lower Penobscot Veazie <strong>to</strong> Verona Island Kenduskeag 8 <strong>to</strong> 10 196 2,073<br />
Lower Penobscot Veazie <strong>to</strong> Verona Island Kenduskeag 10 <strong>to</strong> 12 263 2,687<br />
Lower Penobscot Veazie <strong>to</strong> Verona Island Kenduskeag 12 <strong>to</strong> 14 300 2,995<br />
Lower Penobscot Veazie <strong>to</strong> Verona Island Kenduskeag 14 <strong>to</strong> 16 83 786<br />
Lower Penobscot Veazie <strong>to</strong> Verona Island Kenduskeag 20 <strong>to</strong> 22 49 417<br />
Lower Penobscot Veazie <strong>to</strong> Verona Island Kenduskeag 22 <strong>to</strong> 24 106 827<br />
Lower Penobscot Veazie <strong>to</strong> Verona Island Kenduskeag 26 <strong>to</strong> 28 499 3,542<br />
Lower Penobscot Veazie <strong>to</strong> Verona Island Kenduskeag 28 <strong>to</strong> 30 167 1,145
Subwatershed Dam Reach Management Reach<br />
PRFP Page 160<br />
Width<br />
Class (m) Rearing Units<br />
Large Parr<br />
Production<br />
Lower Penobscot Veazie <strong>to</strong> Verona Island Kenduskeag 30 <strong>to</strong> 32 120 766<br />
Lower Penobscot Veazie <strong>to</strong> Verona Island Kenduskeag 32 <strong>to</strong> 34 252 1,469<br />
Lower Penobscot Veazie <strong>to</strong> Verona Island Kenduskeag 34 <strong>to</strong> 36 1,432 7,685<br />
Kenduskeag Total 6,805 60,902<br />
Lower Penobscot Veazie <strong>to</strong> Verona Island Long Pond 0 <strong>to</strong> 2 98 1,077<br />
Lower Penobscot Veazie <strong>to</strong> Verona Island Long Pond 2 <strong>to</strong> 4 465 5,108<br />
Lower Penobscot Veazie <strong>to</strong> Verona Island Long Pond 4 <strong>to</strong> 6 120 1,298<br />
Lower Penobscot Veazie <strong>to</strong> Verona Island Long Pond 6 <strong>to</strong> 8 58 625<br />
Lower Penobscot Veazie <strong>to</strong> Verona Island Long Pond 8 <strong>to</strong> 10 30 311<br />
Lower Penobscot Veazie <strong>to</strong> Verona Island Long Pond 12 <strong>to</strong> 14 66 651<br />
Long Pond Total 836 9,070<br />
Lower Penobscot Veazie <strong>to</strong> Verona Island Marsh 0 <strong>to</strong> 2 98 1,077<br />
Lower Penobscot Veazie <strong>to</strong> Verona Island Marsh 2 <strong>to</strong> 4 1,380 15,167<br />
Lower Penobscot Veazie <strong>to</strong> Verona Island Marsh 4 <strong>to</strong> 6 1,017 11,085<br />
Lower Penobscot Veazie <strong>to</strong> Verona Island Marsh 6 <strong>to</strong> 8 511 5,455<br />
Lower Penobscot Veazie <strong>to</strong> Verona Island Marsh 8 <strong>to</strong> 10 103 1,083<br />
Lower Penobscot Veazie <strong>to</strong> Verona Island Marsh 10 <strong>to</strong> 12 508 5,175<br />
Lower Penobscot Veazie <strong>to</strong> Verona Island Marsh 12 <strong>to</strong> 14 133 1,334<br />
Lower Penobscot Veazie <strong>to</strong> Verona Island Marsh 14 <strong>to</strong> 16 225 2,161<br />
Lower Penobscot Veazie <strong>to</strong> Verona Island Marsh 16 <strong>to</strong> 18 599 5,620<br />
Lower Penobscot Veazie <strong>to</strong> Verona Island Marsh 24 <strong>to</strong> 26 182 1,367<br />
Lower Penobscot Veazie <strong>to</strong> Verona Island Marsh 28 <strong>to</strong> 30 826 5,594<br />
Lower Penobscot Veazie <strong>to</strong> Verona Island Marsh 30 <strong>to</strong> 32 435 2,786<br />
Marsh Total 6,018 57,904<br />
Lower Penobscot Veazie <strong>to</strong> Verona Island Penobscot Below Veazie 0 <strong>to</strong> 2 37 413<br />
Lower Penobscot Veazie <strong>to</strong> Verona Island Penobscot Below Veazie 2 <strong>to</strong> 4 751 8,253<br />
Lower Penobscot Veazie <strong>to</strong> Verona Island Penobscot Below Veazie 4 <strong>to</strong> 6 333 3,634<br />
Lower Penobscot Veazie <strong>to</strong> Verona Island Penobscot Below Veazie 6 <strong>to</strong> 8 494 5,283<br />
Lower Penobscot Veazie <strong>to</strong> Verona Island Penobscot Below Veazie 10 <strong>to</strong> 12 12 118<br />
Lower Penobscot Veazie <strong>to</strong> Verona Island Penobscot Below Veazie 24 <strong>to</strong> 26 231 1,703<br />
Penobscot Below Veazie Total 1,859 19,404<br />
Lower Penobscot Veazie <strong>to</strong> Verona Island Sedgeunkedunk Stream 2 <strong>to</strong> 4 101 1,113<br />
Lower Penobscot Veazie <strong>to</strong> Verona Island Sedgeunkedunk Stream 4 <strong>to</strong> 6 21 234
Subwatershed Dam Reach Management Reach<br />
PRFP Page 161<br />
Width<br />
Class (m) Rearing Units<br />
Large Parr<br />
Production<br />
Lower Penobscot Veazie <strong>to</strong> Verona Island Sedgeunkedunk Stream 8 <strong>to</strong> 10 10 108<br />
Lower Penobscot Veazie <strong>to</strong> Verona Island Sedgeunkedunk Stream 10 <strong>to</strong> 12 210 2,143<br />
Sedgeunkedunk Stream Total 343 3,598<br />
Lower Penobscot Veazie <strong>to</strong> Verona Island Silver Lake 0 <strong>to</strong> 2 24 269<br />
Lower Penobscot Veazie <strong>to</strong> Verona Island Silver Lake 2 <strong>to</strong> 4 187 2,059<br />
Lower Penobscot Veazie <strong>to</strong> Verona Island Silver Lake 4 <strong>to</strong> 6 200 2,169<br />
Lower Penobscot Veazie <strong>to</strong> Verona Island Silver Lake 6 <strong>to</strong> 8 99 1,062<br />
Lower Penobscot Veazie <strong>to</strong> Verona Island Silver Lake 8 <strong>to</strong> 10 26 273<br />
Silver Lake Total 536 5,832<br />
Lower Penobscot Veazie <strong>to</strong> Verona Island Souadabscook 0 <strong>to</strong> 2 14 148<br />
Lower Penobscot Veazie <strong>to</strong> Verona Island Souadabscook 2 <strong>to</strong> 4 1,193 13,099<br />
Lower Penobscot Veazie <strong>to</strong> Verona Island Souadabscook 4 <strong>to</strong> 6 773 8,393<br />
Lower Penobscot Veazie <strong>to</strong> Verona Island Souadabscook 6 <strong>to</strong> 8 308 3,292<br />
Lower Penobscot Veazie <strong>to</strong> Verona Island Souadabscook 8 <strong>to</strong> 10 573 6,020<br />
Lower Penobscot Veazie <strong>to</strong> Verona Island Souadabscook 10 <strong>to</strong> 12 489 4,994<br />
Lower Penobscot Veazie <strong>to</strong> Verona Island Souadabscook 12 <strong>to</strong> 14 280 2,798<br />
Lower Penobscot Veazie <strong>to</strong> Verona Island Souadabscook 22 <strong>to</strong> 24 221 1,792<br />
Lower Penobscot Veazie <strong>to</strong> Verona Island Souadabscook 30 <strong>to</strong> 32 39 245<br />
Lower Penobscot Veazie <strong>to</strong> Verona Island Souadabscook 32 <strong>to</strong> 34 264 1,480<br />
Lower Penobscot Veazie <strong>to</strong> Verona Island Souadabscook 34 <strong>to</strong> 36 1,417 7,280<br />
Souadabscook Total 5,571 49,541<br />
Lower Penobscot Veazie <strong>to</strong> Verona Island Toddy Pond 0 <strong>to</strong> 2 59 651<br />
Lower Penobscot Veazie <strong>to</strong> Verona Island Toddy Pond 2 <strong>to</strong> 4 152 1,677<br />
Lower Penobscot Veazie <strong>to</strong> Verona Island Toddy Pond 4 <strong>to</strong> 6 103 1,121<br />
Lower Penobscot Veazie <strong>to</strong> Verona Island Toddy Pond 12 <strong>to</strong> 14 3 26<br />
Toddy Pond Total 317 3,475<br />
Veazie <strong>to</strong> Verona Island Total 23,617 223,939<br />
Lower Penobscot Total 61,932 453,271<br />
Grand Total 234,924 1,810,993
Appendix D - Adaptive Management Guidance <strong>for</strong> Fisheries Management in<br />
<strong>the</strong> Penobscot Basin<br />
Authors: Greg Mackey and Joan Trial<br />
Adaptive management is a strategy that employs <strong>the</strong> scientific method <strong>to</strong> continually<br />
assess and refine management. Adaptive management relies on establishing<br />
management plans based on a priori hypo<strong>the</strong>ses (predicted results), assessment<br />
plans <strong>to</strong> collect data necessary <strong>to</strong> evaluate a management strategy, and a feedback<br />
mechanism <strong>to</strong> in<strong>for</strong>m and improve management as results are obtained. Adaptive<br />
management is central <strong>to</strong> Atlantic salmon recovery and should be employed with all<br />
fish management activities in <strong>the</strong> Penobscot basin. The limiting steps in<br />
successfully using adaptive management are collecting sufficient data, analyzing<br />
and interpreting results, and using <strong>the</strong> results <strong>to</strong> improve management on a regular<br />
basis. Knowledge <strong>of</strong> <strong>the</strong>se limitations should help managers prepare strategies <strong>to</strong><br />
successfully employ adaptive management, and also <strong>to</strong> explicitly identify<br />
management actions where adaptive management will not be successfully used<br />
because <strong>of</strong> operational or budgetary constraints.<br />
Managers will need <strong>to</strong> create adaptive management programs <strong>for</strong> each management<br />
action. Although adaptive management follows well defined steps, <strong>the</strong> particulars <strong>of</strong><br />
<strong>the</strong> process are project dependent and generally cannot be elucidated be<strong>for</strong>ehand.<br />
However, some fishery management actions, such as s<strong>to</strong>cking, can be generalized<br />
<strong>to</strong> an adaptive management approach, and this general approach can <strong>the</strong>n easily be<br />
altered <strong>to</strong> suit needs (Table 1).<br />
The general adaptive management process focuses on defining goals and<br />
assumptions, and stating management strategy, expected outcome(s), and how<br />
assessment will be per<strong>for</strong>med. This <strong>for</strong>ces managers <strong>to</strong> clearly identify <strong>the</strong>se<br />
elements be<strong>for</strong>e work is begun. This approach is easily transferrable <strong>to</strong> s<strong>to</strong>cking<br />
(Table 2), or o<strong>the</strong>r management actions.<br />
Table 1. A general adaptive management approach adapted from S. Craw<strong>for</strong>d, S.<br />
Matchett, and K. Reid, 2005. “Decision Analysis/Adaptive Management (DAAM) <strong>for</strong> Great<br />
PRFP Page 162
lakes fisheries: a general review and proposal.” 2005. Draft Discussion paper at IAGLR (International<br />
Association <strong>for</strong> Great Lakes Research), University <strong>of</strong> Michigan, Ann Arbor, Michigan, USA.<br />
1. Define <strong>the</strong><br />
problem<br />
2. Identify<br />
manageme<br />
a. Identify core values related management objectives, including risk<br />
aversion levels<br />
b. Identify fundamental management objectives (ecological, learning,<br />
social)<br />
c. Identify key indica<strong>to</strong>rs or per<strong>for</strong>mance criteria<br />
d. Identify key uncertainties (uncertain states <strong>of</strong> nature)<br />
e. Develop qualitative or quantitative hypo<strong>the</strong>ses <strong>for</strong> key uncertainties<br />
f. Assign prior probabilities <strong>for</strong> hypo<strong>the</strong>ses<br />
a. Identify management alternatives<br />
b. Predict (calculate) <strong>the</strong> outcomes <strong>for</strong> <strong>the</strong> alternatives<br />
nt options<br />
3. Select a. Select an alternative or select competing hypo<strong>the</strong>ses explaining a key<br />
manageme uncertainty<br />
nt option b. State <strong>the</strong> “value <strong>of</strong> learning” expectation <strong>for</strong> this alternative<br />
4. Design<br />
manageme<br />
nt plan<br />
5. Design<br />
moni<strong>to</strong>ring<br />
plan<br />
6. Implement<br />
manageme<br />
a. Design implementation plan <strong>for</strong> selected alternative Or <strong>to</strong> test<br />
competing hypo<strong>the</strong>ses<br />
a. Specify logistics, ef<strong>for</strong>t, and documentation <strong>for</strong> moni<strong>to</strong>ring plan<br />
b. State <strong>the</strong> accuracy, precision, and power analyses<br />
c. Establish data management (data standards, training, QA/QC)<br />
d. Design data analyses (graphs, tables, statistical)<br />
a. Follow <strong>the</strong> implementation plan <strong>for</strong> chosen alternative<br />
b. Report implementation deviations<br />
nt plan<br />
7. Moni<strong>to</strong>r a. Follow moni<strong>to</strong>ring plan<br />
manageme b. Document and report deviations from moni<strong>to</strong>ring plan<br />
nt plan c. Report if moni<strong>to</strong>ring plan objective was achieved<br />
8. Evaluate<br />
results<br />
9. Refine <strong>the</strong><br />
problem<br />
a. Compare predicted verses observed results<br />
b. Report significance <strong>of</strong> difference<br />
c. Assign updated (posterior) probabilities <strong>to</strong> hypo<strong>the</strong>ses<br />
d. Report how uncertainty has been reduced (what has been learned).<br />
a. Re-Identify fundamental management objectives (ecological, learning,<br />
social)<br />
b. Re-Identify key indica<strong>to</strong>rs or per<strong>for</strong>mance criteria<br />
c. Re-Identify key uncertainties (uncertain states <strong>of</strong> nature)<br />
d. Re-Develop qualitative or quantitative hypo<strong>the</strong>ses <strong>for</strong> key<br />
uncertainties in s<strong>to</strong>cking<br />
e. Re-Assign prior probabilities <strong>for</strong> hypo<strong>the</strong>ses<br />
10. Iterate a. Return <strong>to</strong> #2 and repeat process<br />
PRFP Page 163
Table 2. A generalized adaptive management approach <strong>to</strong> s<strong>to</strong>cking wild captured or<br />
hatchery fish.<br />
1. Define goal(s) a. Identify goal(s) <strong>for</strong> this s<strong>to</strong>cking ef<strong>for</strong>t<br />
2. Identify life his<strong>to</strong>ry<br />
stage, density etc.<br />
3. Design s<strong>to</strong>cking<br />
plan<br />
4. Design moni<strong>to</strong>ring<br />
plan<br />
a. Identify <strong>the</strong> s<strong>to</strong>cking alternative (life his<strong>to</strong>ry stage,<br />
density, specialized rearing etc.) that is believed will be <strong>the</strong><br />
most effective in achieving <strong>the</strong> goal(s)<br />
b. Predict (calculate) outcomes <strong>for</strong> each alternative<br />
c. State assumptions (identify sources <strong>of</strong> uncertainty) <strong>for</strong><br />
<strong>the</strong>se calculations<br />
d. Choose <strong>the</strong> desired s<strong>to</strong>cking alternative<br />
e. State <strong>the</strong> value <strong>of</strong> learning <strong>for</strong> this choice<br />
a. Calculate <strong>the</strong> number <strong>of</strong> fish required <strong>to</strong> achieve desired<br />
densities.<br />
b. Identify when, where, and how <strong>the</strong> fish will be s<strong>to</strong>cked<br />
a. Specify how moni<strong>to</strong>ring is <strong>to</strong> be done<br />
b. Specify expected ability <strong>to</strong> detect success or failure<br />
c. Establish data management procedures<br />
d. Design data analyses<br />
a. S<strong>to</strong>ck fish according <strong>to</strong> plan.<br />
5. Implement<br />
s<strong>to</strong>cking plan b. Document deviations from plan<br />
6. Implement<br />
a. Follow moni<strong>to</strong>ring plan<br />
moni<strong>to</strong>ring plan b. Document deviations from plan<br />
7. Evaluate results a. Follow data analyses design <strong>to</strong> compare predicted<br />
verses observed results.<br />
b. Report how uncertainty has been reduced<br />
8. Refine s<strong>to</strong>cking a. Return <strong>to</strong> #2 and reevaluate. Alter one variable in <strong>the</strong><br />
approach<br />
s<strong>to</strong>cking plan (return <strong>to</strong> #2 and repeat process).<br />
9. Iterate Repeat this process until s<strong>to</strong>cking goal has been achieved<br />
An adaptive management process <strong>for</strong>ces managers <strong>to</strong> state <strong>the</strong> goal (hypo<strong>the</strong>sis) <strong>of</strong><br />
<strong>the</strong> action and <strong>to</strong> predict possible outcomes. Stating outcomes <strong>the</strong>n allows<br />
managers <strong>to</strong> design adjustments <strong>to</strong> <strong>the</strong> action in advance based on potential<br />
outcomes. This exercise is useful <strong>for</strong> three reasons: 1) it provides an objective<br />
statement <strong>of</strong> future management adjustments, 2) it helps define <strong>the</strong> complexity <strong>of</strong> <strong>the</strong><br />
management issue- some outcomes may be so complicated that <strong>the</strong> adaptive<br />
management plan should be re-evaluated, and 3) it allows realistic evaluation <strong>of</strong><br />
management options in advance <strong>of</strong> beginning work.<br />
Potential adaptive management frameworks <strong>for</strong> fry, smolt, and adult s<strong>to</strong>cking<br />
Fry Adaptive Management<br />
For illustration, assume <strong>the</strong> goal <strong>of</strong> Atlantic salmon fry s<strong>to</strong>cking is a given density <strong>of</strong><br />
two age classes <strong>of</strong> juveniles with preferred average sizes (i.e. parr = density: 10-<br />
12/unit and mean <strong>for</strong>k length <strong>of</strong> 115 mm at age 1+; YOY = density 15-30/unit <strong>for</strong>k<br />
length 90 mm). There are 15 possible outcomes <strong>of</strong> fry s<strong>to</strong>cking a reach stated<br />
(Table 3). Some <strong>of</strong> <strong>the</strong> outcomes feedback directly <strong>to</strong> <strong>the</strong> s<strong>to</strong>cking actions with<br />
PRFP Page 164
ecommended adjustments. While o<strong>the</strong>r outcomes specify alternative strategies<br />
such as s<strong>to</strong>cking ano<strong>the</strong>r life stage, evaluating habitat, or re-assessing initial goals.<br />
More specific adjustments are possible, such as specifying an algorithm <strong>to</strong> adjust fry<br />
s<strong>to</strong>cking numbers based on density and size <strong>of</strong> parr.<br />
Table 3. Draft reach specific adaptive management system <strong>for</strong> s<strong>to</strong>cking juvenile<br />
Atlantic salmon produced at CBNFH.<br />
Large Pa rr YOY Actions<br />
Abundance Size<br />
D istribution<br />
Abundance Size<br />
Distribution<br />
Fry<br />
S<strong>to</strong>cking<br />
rate<br />
Obs < OK and Obs < <strong>the</strong>n Increase<br />
S<strong>to</strong>cking<br />
options<br />
Obs < Sm all and Obs < Sm all <strong>the</strong>n Con sider Parr Evalu ate<br />
habitat<br />
Obs < Sm all and Obs < OK or Large <strong>the</strong>n Increa se Fry Evalu ate<br />
habitat<br />
Obs < La rge and Obs < <strong>the</strong>n Increase<br />
Obs =or > OK and Obs < <strong>the</strong>n N o change<br />
Obs =or > Sm all and Obs < Sm all <strong>the</strong>n Con sider Parr Evalu ate<br />
habitat<br />
Obs =or > Sm all and Obs < OK or Large <strong>the</strong>n Increa se Fry Evalu ate<br />
habitat<br />
Obs =or > La rge and Obs < <strong>the</strong>n Increase Evalu ate<br />
Goals<br />
Obs =or > OK and Obs =or > <strong>the</strong>n N o change<br />
Obs =or > Sm all and Obs =or > <strong>the</strong>n R educe<br />
Obs =or > La rge and Obs =or > <strong>the</strong>n Increase Evalu ate<br />
Goals<br />
Obs < OK and Obs =or > <strong>the</strong>n Increase<br />
Obs < Sm all and Obs =or > Sm all <strong>the</strong>n Decrease Fry Evalu ate<br />
habitat<br />
Obs < Sm all and Obs =or > OK or Large <strong>the</strong>n Increa se Fry Evalu ate<br />
habitat<br />
Obs < La rge and Obs =or > <strong>the</strong>n Increase Evalu ate<br />
Goals<br />
Smolt Adaptive Management<br />
The measureable goals <strong>of</strong> <strong>the</strong> smolt s<strong>to</strong>cking program are:<br />
1. Maximize smolt <strong>to</strong> adult return rates<br />
2. Imprint smolts <strong>to</strong> reaches with spawning and rearing habitat<br />
3. Maximize lifetime fitness (reproductive success in wild)<br />
PRFP Page 165<br />
O<strong>the</strong>r
Table 4. Data sources, parameters, data links, and adaptive management actions<br />
based on assessments<br />
Databas<br />
e Source<br />
S<strong>to</strong>cking<br />
AdultTrap<br />
SmoltTra<br />
p<br />
AdultTrap<br />
Redd<br />
In<strong>for</strong>mat<br />
ion<br />
Numbers<br />
,Location<br />
, Marks<br />
Number,<br />
FW and<br />
Sea Age,<br />
Origin,<br />
Mark<br />
Number,<br />
Origin,<br />
FW Age,<br />
Mark<br />
In river -<br />
In year<br />
(Weldon<br />
and<br />
Veazie)<br />
Distributi<br />
on <strong>of</strong><br />
Hatchery<br />
Cohort Calculations<br />
yr = Cohort<br />
year<br />
1SW = yr-1<br />
cohort 2SW =<br />
yr-2 cohort<br />
S1 = yr cohort<br />
H1W1 = yr-<br />
1cohort<br />
1SW = yr-1<br />
cohort 2SW =<br />
yr-2 cohort<br />
Sea age and<br />
mark specific<br />
return rates<br />
FW age and<br />
mark<br />
proportional<br />
Links <strong>to</strong><br />
s<strong>to</strong>cking<br />
Location,<br />
River<br />
Conditions,<br />
Timing<br />
Location,<br />
River<br />
Conditions,<br />
Timing<br />
Escapement,<br />
mark & sea<br />
age specific<br />
recapture rates Location<br />
redds NA Location<br />
Adaptive<br />
Management Action<br />
Change location if<br />
return rates lower than<br />
o<strong>the</strong>r sites over range<br />
<strong>of</strong> river conditions<br />
Change location if<br />
captures<br />
disproportionate <strong>to</strong><br />
s<strong>to</strong>cking proportions<br />
over range <strong>of</strong> river<br />
conditions<br />
Change location if fish<br />
released <strong>to</strong> river are<br />
not immigrating in<strong>to</strong><br />
spawning habitat<br />
Change location if fish<br />
released <strong>to</strong> river are<br />
not immigrating in<strong>to</strong><br />
spawning habitat<br />
Table 5. Adaptive management actions based on location-specific assessment <strong>of</strong><br />
smolt s<strong>to</strong>cking.<br />
S<strong>to</strong>cking Location has ____ than o<strong>the</strong>r s<strong>to</strong>cking locations<br />
Smolt<br />
captures<br />
Return<br />
rates<br />
In-Year In-<br />
River<br />
Recapture<br />
Rates at VZ Assessment Options<br />
Broods<strong>to</strong>ck, change<br />
location<br />
> or = > > Imprinted <strong>to</strong> lower river<br />
> or = > = Effective escapement Check <strong>for</strong> spawning<br />
> or = > < Effective escapement Check <strong>for</strong> spawning<br />
Imprinted <strong>to</strong> lower Broods<strong>to</strong>ck, change<br />
> or = = > River<br />
location<br />
> or = = = Effective escapement Check <strong>for</strong> spawning<br />
> or = = < Effective escapement Check <strong>for</strong> spawning<br />
Evaluate Water Quality,<br />
Differential ocean smolt physiology, scale<br />
> or = < > survival<br />
loss at site<br />
Evaluate Water Quality,<br />
Differential ocean smolt physiology, scale<br />
> or = < = survival<br />
loss at site<br />
Evaluate Water Quality,<br />
Differential ocean smolt physiology, scale<br />
> or = < < survival<br />
loss at site<br />
Evaluate Habitat, Passage,<br />
Differential river Water Quality, scale loss at<br />
< < < or = or > survival<br />
site<br />
PRFP Page 166
Major flexibility constraints <strong>of</strong> <strong>the</strong> smolt s<strong>to</strong>cking cycle (Figure 1) are hatchery rearing<br />
requirements and smolt transportation. Changes <strong>to</strong> some aspect <strong>of</strong> smolt rearing<br />
may need <strong>to</strong> be vetted a year or more in advance. O<strong>the</strong>r aspects <strong>of</strong> smolt<br />
April<br />
S<strong>to</strong>cking<br />
USFWS<br />
Field<br />
S<strong>to</strong>cking<br />
Trip <strong>Plan</strong> &<br />
Hatchery<br />
Coordination<br />
Revise S<strong>to</strong>cking<br />
<strong>Plan</strong><br />
USFWS<br />
Hatchery<br />
June<br />
Smolt Trap<br />
S<strong>to</strong>cking<br />
Log<br />
S<strong>to</strong>cking<br />
<strong>Plan</strong><br />
Available<br />
Smolts<br />
SmoltTrap<br />
Revise Marking <strong>Plan</strong><br />
January<br />
AdultTrap<br />
s<strong>to</strong>cking, such as shifting a s<strong>to</strong>cking location can usually be done with short notice.<br />
However, under adaptive management, all substantive decisions should be planned,<br />
following <strong>the</strong> process outline in <strong>the</strong> adaptive management section <strong>of</strong> this plan.<br />
Marking is <strong>the</strong> primary means <strong>of</strong> assessing management changes. Smolts marks are<br />
coordinated by an interagency Marking Group. All marking needs must be vetted<br />
through this group <strong>to</strong> ensure unique and compatible marking.<br />
Figure 1. Atlantic salmon smolt s<strong>to</strong>cking cycle.<br />
Adaptive Management Adult S<strong>to</strong>cking or Transport<br />
November<br />
1. There are many potential variables that can influence <strong>the</strong> success <strong>of</strong> naturally<br />
spawning adults. Fur<strong>the</strong>r, fish that have been reared and released under<br />
artificial circumstances carry ano<strong>the</strong>r set <strong>of</strong> fac<strong>to</strong>rs that will affect <strong>the</strong><br />
outcome.<br />
2. Projects should attempt <strong>to</strong> control <strong>for</strong> some extraneous fac<strong>to</strong>rs.<br />
PRFP Page 167<br />
July<br />
Adult Trap<br />
Cohort Age, Origin,<br />
& Mark Analyses<br />
Review<br />
Previous<br />
Years<br />
S<strong>to</strong>cking &<br />
Marking <strong>Plan</strong>s<br />
December<br />
Place<br />
Hatchery<br />
Order<br />
Oc<strong>to</strong>ber
3. Results (hypo<strong>the</strong>ses) with linked management options should be stated a<br />
priori, and assessments should be designed <strong>to</strong> address <strong>the</strong>se.<br />
4. Adaptive management should occur at <strong>the</strong> project and program scales. That<br />
is, how successful was <strong>the</strong> project, and how does this level <strong>of</strong> success fit in<br />
with <strong>the</strong> overall program?<br />
5. Assessment <strong>of</strong> results and subsequent management actions should<br />
emphasize potential <strong>to</strong> res<strong>to</strong>re naturally reproducing populations.<br />
Table 6. Adaptive management actions related <strong>to</strong> actions that increase adult<br />
escapement, based on expected YOY and parr abundances and size<br />
distributions and two redds/female.<br />
YOY Parr<br />
Result Abundance Size Abundance Size Action<br />
Low redd <strong>to</strong><br />
female ratio<br />
< = < =<br />
Assess adult rearing methods.<br />
Assess origin <strong>of</strong> fish. Increase<br />
s<strong>to</strong>cking numbers<br />
Low redd <strong>to</strong><br />
female ratio<br />
= = = =<br />
Assess field methods<br />
No project changes<br />
Low redd <strong>to</strong><br />
female ratio<br />
> = > =<br />
Assess field methods<br />
No project changes<br />
Low redd <strong>to</strong><br />
female ratio<br />
> < > <<br />
Assess field methods<br />
Density dependence? Reduce<br />
s<strong>to</strong>cking numbers<br />
OK redd <strong>to</strong><br />
female ratio<br />
< = < =<br />
Assess adult rearing methods.<br />
Assess origin <strong>of</strong> fish.<br />
OK redd <strong>to</strong><br />
female ratio<br />
= = = = No project changes<br />
OK redd <strong>to</strong><br />
female ratio<br />
> = > =<br />
Assess field methods<br />
No project changes<br />
OK redd <strong>to</strong><br />
female ratio<br />
> < > <<br />
Assess field methods<br />
Density dependence? Reduce<br />
s<strong>to</strong>cking numbers<br />
High redd <strong>to</strong><br />
female ratio<br />
< = < =<br />
Assess adult rearing methods.<br />
Assess origin <strong>of</strong> fish.<br />
High redd <strong>to</strong><br />
female ratio<br />
= = = = No project changes<br />
High redd <strong>to</strong><br />
female ratio<br />
> = > = No project changes<br />
High redd <strong>to</strong><br />
female ratio<br />
> < > <<br />
Assess field methods<br />
Density dependence? Reduce<br />
s<strong>to</strong>cking numbers<br />
PRFP Page 168
Table 6. Continued.<br />
YOY Parr<br />
Result Abundance Size Abundance Size Action<br />
Assess adult rearing methods.<br />
Low spatial<br />
dispersal<br />
< = < =<br />
Assess origin <strong>of</strong> fish. Consider<br />
more s<strong>to</strong>cking locations.<br />
Change s<strong>to</strong>cking timing.<br />
Assess adult rearing methods.<br />
Low spatial<br />
dispersal<br />
= = = =<br />
Assess origin <strong>of</strong> fish. Consider<br />
more s<strong>to</strong>cking locations.<br />
Change s<strong>to</strong>cking timing.<br />
Assess adult rearing methods.<br />
Low spatial<br />
dispersal<br />
> = > =<br />
Assess origin <strong>of</strong> fish. Consider<br />
more s<strong>to</strong>cking locations.<br />
Change s<strong>to</strong>cking timing.<br />
Assess adult rearing methods.<br />
Low spatial<br />
dispersal<br />
> < > <<br />
Assess origin <strong>of</strong> fish. Consider<br />
more s<strong>to</strong>cking locations.<br />
Change s<strong>to</strong>cking timing.<br />
Expected<br />
dispersal<br />
< = < =<br />
Assess adult rearing methods.<br />
Assess origin <strong>of</strong> fish.<br />
Expected<br />
dispersal<br />
= = = = No Change<br />
Expected<br />
dispersal<br />
> = > = No Change<br />
Expected<br />
dispersal<br />
> < > <<br />
Density dependence? Reduce<br />
s<strong>to</strong>cking numbers<br />
Assess adult rearing methods.<br />
High spatial<br />
dispersal<br />
< = < =<br />
Assess origin <strong>of</strong> fish. Change<br />
s<strong>to</strong>cking timing. Revise<br />
expectations<br />
Assess adult rearing methods.<br />
High spatial<br />
dispersal<br />
= = = =<br />
Assess origin <strong>of</strong> fish. Change<br />
s<strong>to</strong>cking timing. Revise<br />
expectations<br />
High spatial<br />
dispersal<br />
> = > =<br />
Assess adult rearing methods.<br />
Assess origin <strong>of</strong> fish. Revise<br />
expectations<br />
PRFP Page 169
Given juvenile abundances at <strong>the</strong> YOY or parr stages, do progeny <strong>of</strong> naturally<br />
spawning adults fail <strong>to</strong> meet, or exceed o<strong>the</strong>r s<strong>to</strong>cking strategies? Can adjustments<br />
be made <strong>to</strong> enhance this, or does <strong>the</strong>re appear <strong>to</strong> be no advantage? Do <strong>the</strong>se fish<br />
return at a higher rate as adults? Do <strong>the</strong>se fish have a higher lifetime reproductive<br />
success?<br />
Projects should detail hypo<strong>the</strong>ses (alternative outcomes) based on <strong>the</strong> design <strong>of</strong> <strong>the</strong><br />
project. Ideally, a table <strong>of</strong> adaptive management outcomes and actions can be<br />
created <strong>for</strong> each project. Fur<strong>the</strong>rmore, assessment personnel should draw on<br />
adaptive management scenarios from o<strong>the</strong>r sources in this document, as suitable.<br />
For example, <strong>the</strong> fry s<strong>to</strong>cking adaptive management outcomes may be suitable <strong>for</strong><br />
later life stages under <strong>the</strong> adult escapement section.<br />
PRFP Page 170
Appendix E - Atlantic Salmon Fisheries Management Options and Strategies<br />
Author: Oliver Cox<br />
This section lays out <strong>the</strong> fisheries management options <strong>for</strong> Atlantic salmon and<br />
presents an overarching structure in which <strong>to</strong> implement <strong>the</strong>se strategies. There are<br />
eight major categories <strong>of</strong> fisheries enhancement that we use with Atlantic salmon:<br />
1. Egg planting or streamside incubation<br />
2. Fry s<strong>to</strong>cking<br />
3. Parr s<strong>to</strong>cking (fall parr, 0+ from GLNFH or CBNFH)<br />
4. Smolt s<strong>to</strong>cking<br />
5. Trap and truck sea-run adults<br />
6. Artificially reared adult s<strong>to</strong>cking<br />
7. Rejuvenated kelt adult s<strong>to</strong>cking<br />
8. Natural reproduction- no s<strong>to</strong>cking<br />
Most <strong>of</strong> <strong>the</strong>se are used at some level, or have been in <strong>the</strong> past. Some <strong>of</strong> <strong>the</strong>se<br />
methods are standard management practice, such as fry and smolt s<strong>to</strong>cking, while<br />
o<strong>the</strong>rs are experimental such as egg planting and adult s<strong>to</strong>cking. However, under<br />
an adaptive management framework, all management methods should be evaluated<br />
using <strong>the</strong> scientific method. The major difference between management options is<br />
scale and assessment intensity.<br />
At this point, we do not fully understand <strong>the</strong> potential <strong>of</strong> any <strong>of</strong> <strong>the</strong>se methods <strong>to</strong><br />
recover Atlantic salmon populations. We do understand <strong>the</strong> potential <strong>of</strong> many <strong>of</strong><br />
<strong>the</strong>se methods within certain bounds, but not <strong>to</strong> <strong>the</strong> level <strong>of</strong> lifetime fitness and<br />
population recovery. There<strong>for</strong>e, all methods should be considered and tested<br />
against one ano<strong>the</strong>r. Management decisions about methods on which <strong>to</strong> focus<br />
should rely on existing program specific data specific and <strong>the</strong> scientific literature. At<br />
<strong>the</strong> moment, egg planting, rejuvenating kelts <strong>for</strong> s<strong>to</strong>cking and s<strong>to</strong>cking artificially<br />
reared adults are not used in <strong>the</strong> Penobscot basin. Adult s<strong>to</strong>cking is being used in<br />
<strong>the</strong> Sheepscot River, Sandy River, Machias watershed, East Machias watershed,<br />
and Hobart Steam. Intensive work on streamside incubation and egg planting is<br />
also underway in <strong>the</strong> Sandy and Sheepscot. However, this work has not tested searun<br />
eggs. Such eggs are available in <strong>the</strong> Penobscot, and this present an opportunity<br />
<strong>to</strong> add important in<strong>for</strong>mation about egg source/quality <strong>to</strong> <strong>the</strong> work already underway.<br />
Structure <strong>of</strong> Atlantic Salmon Fisheries Management Actions<br />
Fisheries management takes place in two dimensions: space and time. We initially<br />
consider space, <strong>the</strong>n time:<br />
1. Use management actions in discrete areas <strong>of</strong> <strong>the</strong> Penobscot basin. This will<br />
enhance assessment and provide a more explicit result if a strategy proves<br />
successful. Keeping management actions separated in space can also<br />
maintain independence among actions. Areas <strong>of</strong> <strong>the</strong> basin should be<br />
PRFP Page 171
identified a priori <strong>for</strong> all potential management actions, regardless if <strong>the</strong>y are<br />
currently being used. Create a GIS layer <strong>to</strong> s<strong>to</strong>re and display this structure.<br />
2. Consider temporal isolation or spacing <strong>of</strong> management actions and use <strong>to</strong><br />
achieve a structure that will provide clear assessment opportunity and avoid<br />
confounding fac<strong>to</strong>rs.<br />
3. Establish specific strategies within a management action. For example, fry<br />
may be s<strong>to</strong>cked at certain densities, DIs, by point s<strong>to</strong>cking, or stratified by<br />
stream/habitat characteristics. Each strategy will have testable hypo<strong>the</strong>ses.<br />
This is <strong>the</strong> time <strong>to</strong> make adjustments, ranging from small changes <strong>to</strong><br />
completely new ideas.<br />
4. Establish assessment plans <strong>for</strong> each management strategy. Clearly state <strong>the</strong><br />
measure(s) that will be used <strong>to</strong> test efficacy.<br />
Egg <strong>Plan</strong>ting and Streamside Incubation<br />
Eggs may be planted in a variety <strong>of</strong> ways at ei<strong>the</strong>r <strong>the</strong> green or eyed stage. Green<br />
egg planting would occur in <strong>the</strong> fall during spawning time. Eyed egg planting would<br />
occur in <strong>the</strong> winter, typically January or February. Eggs may be planted in<br />
naturalistic artificial redds, in a variety <strong>of</strong> instream incubation units, or in streamside<br />
rearing units. The efficacy <strong>of</strong> <strong>the</strong>se approaches is being evaluated elsewhere at this<br />
time.<br />
Egg planting af<strong>for</strong>ds a nearly complete natural rearing his<strong>to</strong>ry <strong>for</strong> <strong>the</strong> juvenile fish,<br />
with <strong>the</strong> streamside tanks likely having <strong>the</strong> largest domestication influence. The fish<br />
incubate under ambient stream water conditions, should emerge in synchrony with<br />
<strong>the</strong>ir wild counterparts, and enter <strong>the</strong> stream environment in essentially <strong>the</strong> same<br />
manner as wild fish.<br />
Egg planting provides one <strong>of</strong> <strong>the</strong> two most naturalistic approaches <strong>for</strong> introducing<br />
juvenile fish (along with adult s<strong>to</strong>cking) <strong>to</strong> <strong>the</strong> environment. It also af<strong>for</strong>ds managers<br />
<strong>the</strong> ability <strong>to</strong> target areas <strong>to</strong> introduce specific numbers <strong>of</strong> eggs <strong>to</strong> be introduced.<br />
However, egg <strong>to</strong> fry survival is more variable than in <strong>the</strong> hatchery, and planting eggs<br />
is labor intensive. Egg planting is probably most appropriate <strong>for</strong> streams with quality<br />
juvenile rearing habitat. It may be less effective in areas where rearing habitat is<br />
less appropriate <strong>for</strong> fry. <strong>Plan</strong>ting eggs also is contingent on stream conditions, high<br />
water and ice cover.<br />
Fry S<strong>to</strong>cking<br />
The existing fry s<strong>to</strong>cking practices are based on previous work by MASC, PIN, and<br />
sou<strong>the</strong>rn New England Atlantic salmon program biologists. The objectives are <strong>to</strong> 1)<br />
populate high quality habitat that would most likely not be populated through<br />
spawning escapement <strong>to</strong> maximize smolt production; 2) buffer habitat where Atlantic<br />
salmon spawned naturally; 3) optimize <strong>the</strong> s<strong>to</strong>cking <strong>of</strong> river reaches that can<br />
PRFP Page 172
easonably be accessed; and 4) minimize fishery management conflicts with<br />
MDIFW. Fry may be s<strong>to</strong>cked in ei<strong>the</strong>r a fed or unfed state. Unfed fry <strong>of</strong>fer <strong>the</strong><br />
advantages <strong>of</strong> not requiring financial and staff resources <strong>for</strong> feeding, and limit<br />
hatchery discharge. Fed fry are s<strong>to</strong>cked already feeding, assuring managers that<br />
<strong>the</strong> fish have made <strong>the</strong> transition <strong>to</strong> exogenous feeding. Fry are s<strong>to</strong>cked in May and<br />
June. The optimal water temperatures, time <strong>of</strong> year, flows, and o<strong>the</strong>r environmental<br />
variables that influence <strong>the</strong> success <strong>of</strong> fry s<strong>to</strong>cking are not well unders<strong>to</strong>od.<br />
Fry represent <strong>the</strong> life stage <strong>of</strong> free-swimming fish that have <strong>the</strong> least domesticating<br />
selection pressure. Fry live virtually <strong>the</strong>ir entire free-swimming lives under natural<br />
conditions, and so survivors should <strong>the</strong>oretically have greater fitness than fish<br />
s<strong>to</strong>cked at later juvenile stages. Managers can target specific fry densities <strong>for</strong><br />
specific reaches <strong>of</strong> stream. Managers can also choose <strong>to</strong> carefully distribute <strong>the</strong> fish<br />
at even densities, or <strong>to</strong> s<strong>to</strong>ck <strong>the</strong>m in larger groups (point s<strong>to</strong>cking), and allow <strong>the</strong><br />
fish <strong>to</strong> disperse. Point s<strong>to</strong>cking reduces handling <strong>of</strong> <strong>the</strong> fish and may <strong>of</strong>fer some<br />
advantage in preda<strong>to</strong>r swamping and natural recruitment <strong>to</strong> areas <strong>of</strong> <strong>the</strong> stream,<br />
while more incremental s<strong>to</strong>cking <strong>of</strong>fers <strong>the</strong> advantage <strong>of</strong> placing fish in appropriate<br />
habitat at desired densities.<br />
Fry suffer high mortality once <strong>the</strong>y enter <strong>the</strong> river, although <strong>the</strong> sources <strong>of</strong> this<br />
mortality are not clear. Never<strong>the</strong>less, <strong>the</strong>y undergo a strong period <strong>of</strong> natural<br />
selection. Although fry s<strong>to</strong>cking can introduce large numbers <strong>of</strong> fish, it does not<br />
necessarily translate in<strong>to</strong> robust parr and smolt populations. Fry s<strong>to</strong>cking is most<br />
appropriate <strong>for</strong> streams with quality juvenile rearing habitat. It may be less effective<br />
in areas where habitat is less appropriate <strong>for</strong> fry.<br />
Parr S<strong>to</strong>cking<br />
The current parr program on <strong>the</strong> Penobscot is a result <strong>of</strong> Green Lake National Fish<br />
Hatchery needing <strong>to</strong> reduce salmon densities as fish become crowded in <strong>the</strong> pools.<br />
Parr (0+) have been s<strong>to</strong>cked in lieu <strong>of</strong> fry s<strong>to</strong>cking in an ef<strong>for</strong>t <strong>to</strong> circumvent high<br />
rates <strong>of</strong> early mortality suffered by fry. Parr s<strong>to</strong>cking may also be effective in areas<br />
where fry s<strong>to</strong>cking is less effective, ei<strong>the</strong>r due <strong>to</strong> mortality or emigration. Parr are<br />
reared <strong>for</strong> a longer time than fry in <strong>the</strong> hatchery, and thus are prone <strong>to</strong> greater risk <strong>of</strong><br />
domesticating selection and negative effects <strong>of</strong> hatchery rearing on behavior. The<br />
optimal time <strong>to</strong> s<strong>to</strong>ck parr is unclear; however, s<strong>to</strong>cking has typically occurred in<br />
September when water conditions have cooled somewhat, but <strong>the</strong>re is still time <strong>for</strong><br />
<strong>the</strong> fish <strong>to</strong> acclimate be<strong>for</strong>e winter. S<strong>to</strong>cking rates should target desired parr<br />
population densities, adjusted <strong>for</strong> post-s<strong>to</strong>cking survival and interactions with<br />
resident fish. Parr s<strong>to</strong>cking require greater hatchery resources and creates greater<br />
hatchery discharge. It also may limit hatchery rearing space <strong>for</strong> o<strong>the</strong>r life his<strong>to</strong>ry<br />
stages.<br />
Parr s<strong>to</strong>cking is likely <strong>to</strong> be more prone <strong>to</strong> negative interactions with resident fish.<br />
While fry can be s<strong>to</strong>cked <strong>to</strong> avoid areas <strong>of</strong> natural reproduction, resident parr are<br />
PRFP Page 173
distributed throughout <strong>the</strong> river and s<strong>to</strong>cked parr will likely be introduced in areas<br />
with resident fish. There<strong>for</strong>e, managers must question if <strong>the</strong>y are achieving a net<br />
gain <strong>of</strong> fish without <strong>the</strong> loss <strong>of</strong> <strong>the</strong> more desirable resident fish. Fur<strong>the</strong>rmore, <strong>the</strong><br />
need <strong>to</strong> s<strong>to</strong>ck parr may be indicative <strong>of</strong> a habitat problem that limits <strong>the</strong> use <strong>of</strong> fry. If<br />
this is <strong>the</strong> case, <strong>the</strong>n res<strong>to</strong>ration via parr s<strong>to</strong>cking is likely <strong>to</strong> fail because <strong>the</strong> habitat<br />
cannot support all life his<strong>to</strong>ry stages <strong>of</strong> salmon.<br />
Parr s<strong>to</strong>cking is most appropriate <strong>for</strong> reaches <strong>of</strong> stream that are not well suited <strong>for</strong><br />
fry. In addition, parr s<strong>to</strong>cking may prove <strong>to</strong> be an effective approach in place <strong>of</strong> fry<br />
s<strong>to</strong>cking. At this point, <strong>the</strong> efficacy <strong>of</strong> parr s<strong>to</strong>cking is unclear, as are <strong>the</strong> risks <strong>to</strong> <strong>the</strong><br />
resident population.<br />
Smolt S<strong>to</strong>cking<br />
Smolt s<strong>to</strong>cking circumvents pre-migra<strong>to</strong>ry natural mortality, and is <strong>the</strong> most likely<br />
s<strong>to</strong>cking method <strong>to</strong> produce <strong>the</strong> most adult returns. However, smolt s<strong>to</strong>cking has<br />
several detractions. It requires substantial rearing space, produces more discharge,<br />
and requires more resources at hatcheries.<br />
Hatchery smolts do not survive as well at sea as wild fish, and <strong>the</strong>re<strong>for</strong>e smolt<br />
s<strong>to</strong>cked fish must overcome this lower survival with greater numbers. Many fac<strong>to</strong>rs<br />
may affect <strong>the</strong> survival <strong>of</strong> hatchery smolts: size, growth rate, physiological readiness,<br />
coloration, and behavior. Hatchery smolts have not reared in <strong>the</strong>ir “natal” stream,<br />
and have been shown <strong>to</strong> have higher rates <strong>of</strong> straying than wild fish. They also may<br />
not be as effective homing <strong>to</strong> quality spawning areas within <strong>the</strong>ir natal stream. They<br />
lack rearing experience under natural conditions, and this may interfere with <strong>the</strong>ir<br />
ability <strong>to</strong> reproduce. Smolt s<strong>to</strong>cking avoids <strong>the</strong> resident fish interaction issues faced<br />
with parr s<strong>to</strong>cking. Some research has shown that adults derived from hatchery<br />
smolts tend <strong>to</strong> have lower reproductive success than <strong>the</strong>ir wild counterparts. If this<br />
is true in our program, <strong>the</strong>n hatchery smolts would need <strong>to</strong> overcome both lower<br />
ocean survival and lower reproductive success by returning more fish on a per<br />
capita basis <strong>to</strong> achieve a given level <strong>of</strong> natural reproduction by adult escapement <strong>to</strong><br />
<strong>the</strong> rivers.<br />
Smolt s<strong>to</strong>cking is most appropriate when returning adults is paramount. However,<br />
managers need <strong>to</strong> consider <strong>the</strong> trade<strong>of</strong>f between adults derived from hatchery<br />
smolts verses naturally reared smolts. Smolt s<strong>to</strong>cking tends <strong>to</strong> be an immediate way<br />
<strong>to</strong> increase adult returns, but is arguably not an effective way <strong>to</strong> res<strong>to</strong>re a population,<br />
as evidenced by <strong>the</strong> vast numbers <strong>of</strong> smolts <strong>of</strong> various salmon species s<strong>to</strong>cked and<br />
<strong>the</strong> continuing decline in <strong>the</strong> populations <strong>the</strong>y are intended <strong>to</strong> support. The numbers<br />
<strong>of</strong> smolts <strong>to</strong> s<strong>to</strong>ck should be calculated based on <strong>the</strong> desired number <strong>of</strong> adult<br />
returns, but is <strong>of</strong>ten limited by rearing space. When o<strong>the</strong>r methods <strong>of</strong> s<strong>to</strong>cking fail,<br />
particularly fry s<strong>to</strong>cking, managers <strong>of</strong>ten turn <strong>to</strong> smolt s<strong>to</strong>cking. However, this failure<br />
is likely <strong>the</strong> result <strong>of</strong> habitat deficiencies that limit survival through a complete life<br />
his<strong>to</strong>ry cycle. There<strong>for</strong>e, smolt s<strong>to</strong>cking may merely bypass a habitat problem, but if<br />
this is <strong>the</strong> case, will not be effective in recovering <strong>the</strong> population.<br />
PRFP Page 174
Approximately 600,000 smolts are s<strong>to</strong>cked in <strong>the</strong> Penobscot basin annually,<br />
accounting <strong>for</strong> 90% or more <strong>of</strong> <strong>the</strong> adult Atlantic returns. Major fac<strong>to</strong>rs that affect<br />
where and when <strong>to</strong> s<strong>to</strong>ck smolts are: 1) homing <strong>to</strong> suitable habitat, 2) survival due <strong>to</strong><br />
migration through dams, 3) seasonal timing, and, 4) physiological timing. Additional<br />
consideration should be given <strong>to</strong> smolt “quality”. Alternative rearing and release<br />
strategies may improve survival.<br />
Currently, smolts are s<strong>to</strong>cked at a number <strong>of</strong> fixed locations. These have been<br />
adjusted over time, with <strong>the</strong> most recent adjustments based on relative return rates<br />
among s<strong>to</strong>cking locations. The adaptive management decision based on <strong>the</strong>se<br />
findings was <strong>to</strong> shift smolts from <strong>the</strong> lowest return rate location <strong>to</strong> a higher return rate<br />
location.<br />
Major constraints on system flexibility are hatchery rearing requirements and smolt<br />
transportation. Changes <strong>to</strong> some aspect <strong>of</strong> smolt rearing may need <strong>to</strong> be vetted a<br />
year or more in advance. O<strong>the</strong>r aspects <strong>of</strong> smolt s<strong>to</strong>cking, such as shifting a<br />
s<strong>to</strong>cking location can usually be done with short notice. However, under adaptive<br />
management, all substantive decisions should be planned, following <strong>the</strong> process<br />
outline in <strong>the</strong> adaptive management section <strong>of</strong> this plan. Marking is <strong>the</strong> primary<br />
means <strong>of</strong> assessing management changes. Smolts marks are coordinated by an<br />
interagency Marking Group. All marking needs must be vetted through this group <strong>to</strong><br />
ensure unique and compatible marking.<br />
Up until 2006, <strong>the</strong>re was no single reference s<strong>to</strong>cking location that could be used <strong>to</strong><br />
track temporal changes in return rates. Whole cohort return rates are <strong>the</strong> only long<br />
term data, and <strong>of</strong>fer not options <strong>to</strong> compare alternative s<strong>to</strong>cking strategies. In 2006,<br />
<strong>the</strong> decision was made by TAC <strong>to</strong> establish a long-term baseline return rate site.<br />
From 2006 <strong>to</strong> present, 175,000 marked smolts have been s<strong>to</strong>cked at Morin Fuel in<br />
Bradley. This was <strong>the</strong> location selected <strong>to</strong> use as <strong>the</strong> baseline location prior <strong>to</strong> any<br />
dam removals. The smolts s<strong>to</strong>cked in Bradley have carried three different VIE<br />
marks and were s<strong>to</strong>cked on several dates with equal numbers <strong>of</strong> all three marks.<br />
This marking strategy provides an estimate <strong>of</strong> return rate <strong>for</strong> each cohort with a<br />
variance. The baseline site will change <strong>to</strong> a location above Mil<strong>for</strong>d in anticipation <strong>of</strong><br />
<strong>the</strong> Mil<strong>for</strong>d fish lift coming online and Veazie being removed. This plan results in a<br />
long-term baseline return rate site above Mil<strong>for</strong>d.<br />
The s<strong>to</strong>cking plan <strong>for</strong> 2007 and 2008 was:<br />
~ 175,000 tagged PN s<strong>to</strong>cked in Veazie pond (Morin Fuel)<br />
~ 200,000 PN s<strong>to</strong>cked in <strong>the</strong> Pleasant River (Milo)<br />
~ 200,000 PN s<strong>to</strong>cked at near West Enfield smolt ponds or Passadumkeag boat<br />
launch<br />
~ 25,000 PN s<strong>to</strong>cked in<strong>to</strong> West Enfield smolt ponds<br />
PRFP Page 175
Fish are distributed between ICES Standard Weeks 15 and 19 (9 April <strong>to</strong> May 13)<br />
ensuring that each location is s<strong>to</strong>cked throughout <strong>the</strong> time period (not all <strong>the</strong> smolts<br />
at any one location are s<strong>to</strong>cked on one date).<br />
This plan will continue through 2009, but should be reviewed and revised based on<br />
redd distributions, returns <strong>to</strong> Weldon, and o<strong>the</strong>r data on distribution <strong>of</strong> adults<br />
throughout <strong>the</strong> drainage.<br />
Adult S<strong>to</strong>cking or Transport<br />
S<strong>to</strong>cking sexually mature adults bridges <strong>the</strong> gap between <strong>the</strong> most highly<br />
domesticated life his<strong>to</strong>ry stage s<strong>to</strong>cked (adult) and <strong>the</strong> most natural life his<strong>to</strong>ry stage<br />
introduced in<strong>to</strong> <strong>the</strong> stream (naturally spawned eggs). Domestically reared adults<br />
undergo <strong>the</strong> most extensive domestication selection <strong>of</strong> all life his<strong>to</strong>ry stages.<br />
There<strong>for</strong>e, <strong>the</strong>y typically per<strong>for</strong>m poorly in natural reproduction compared <strong>to</strong> wild<br />
adults. However, despite this shortcoming, <strong>the</strong>y may be a valuable <strong>to</strong>ol in<br />
res<strong>to</strong>ration because <strong>the</strong>y <strong>of</strong>fer one <strong>of</strong> <strong>the</strong> most naturalistic pathways <strong>to</strong> populate <strong>the</strong><br />
rivers with juvenile salmon. In particular, s<strong>to</strong>cked adult fish must undergo <strong>the</strong> same<br />
natural and sexual selection regimes that wild fish do once in <strong>the</strong> river at spawning<br />
time. This is absent in o<strong>the</strong>r s<strong>to</strong>cking strategies. Their progeny are <strong>the</strong> result <strong>of</strong><br />
natural spawning where reproductive behavior, nest site selection, mate selection,<br />
spawning time, and nest construction have all survived <strong>the</strong> test <strong>of</strong> natural and sexual<br />
selection. Potential drawbacks <strong>of</strong> adult s<strong>to</strong>cking include: 1) managers <strong>of</strong>ten have<br />
limited control over where <strong>the</strong> fish spawn, 2) spawning timing is <strong>of</strong>ten asynchronous<br />
with natural conditions (late spawning), 3) s<strong>to</strong>cked fish may introduce excessive<br />
competition with wild fish <strong>for</strong> spawning locations or mates, 4) s<strong>to</strong>cked fish may<br />
superimpose redds on wild redds, 5) rearing adult fish requires substantial hatchery<br />
spaces and resources and may increase hatchery discharge.<br />
The effectiveness <strong>of</strong> adult s<strong>to</strong>cking is still in question. Recent attempts <strong>to</strong> s<strong>to</strong>ck<br />
adults in Maine have generally shown poor results, but with more recent positive<br />
results. Assessment is still underway, but CBNFH reared adults seem <strong>to</strong> be able <strong>to</strong><br />
produce juvenile densities similar <strong>to</strong> fry s<strong>to</strong>cking, and <strong>the</strong>ir progeny may have higher<br />
fitness than fry s<strong>to</strong>cked fish. Adult s<strong>to</strong>cking may be used <strong>to</strong> bypass high mortality at<br />
any life his<strong>to</strong>ry stage (particularly smolt <strong>to</strong> adult), but alternatively, it is perhaps <strong>the</strong><br />
method that requires habitat be considered most carefully because <strong>the</strong> entire life<br />
his<strong>to</strong>ry <strong>of</strong> <strong>the</strong> salmon is represented with this approach. The early life his<strong>to</strong>ry<br />
experience <strong>of</strong> s<strong>to</strong>cked adults may be important in <strong>the</strong> reproductive success, as are<br />
rearing <strong>the</strong> fish <strong>to</strong> naturalistic size, and s<strong>to</strong>cking <strong>the</strong>m at advantageous times <strong>of</strong> year.<br />
The best time <strong>to</strong> s<strong>to</strong>ck adult fish is unclear, but arguments can be made <strong>to</strong> introduce<br />
<strong>the</strong>m as early in <strong>the</strong> fall as possible, or in spring/early summer.<br />
The current res<strong>to</strong>ration program routinely produces adult fish that are excess <strong>to</strong><br />
hatchery needs. However, <strong>the</strong> need <strong>for</strong> <strong>the</strong>se fish in <strong>the</strong> hatchery is <strong>of</strong>ten not<br />
established until early fall. Thus, s<strong>to</strong>cking time may be constrained by hatchery<br />
PRFP Page 176
operations. Adult fish reared specifically <strong>for</strong> adult s<strong>to</strong>cking should be s<strong>to</strong>cked at a<br />
time <strong>of</strong> year thought optimal <strong>for</strong> <strong>the</strong>ir success. This will likely need <strong>to</strong> be tested<br />
because we do not know <strong>the</strong> best time <strong>of</strong> year <strong>to</strong> s<strong>to</strong>ck <strong>the</strong>se fish. Fur<strong>the</strong>rmore,<br />
adult fish intended <strong>to</strong> be s<strong>to</strong>cked in <strong>the</strong> rivers, whe<strong>the</strong>r reared solely <strong>for</strong> that purpose<br />
or as a byproduct <strong>of</strong> o<strong>the</strong>r res<strong>to</strong>ration approaches, should be reared <strong>to</strong> optimize<br />
natural reproductive success. There<strong>for</strong>e, <strong>the</strong>y should be within <strong>the</strong> natural size<br />
range <strong>of</strong> <strong>the</strong> fish, be physiologically in synchrony with <strong>the</strong> natural environment, and<br />
reared under conditions that allow juveniles <strong>to</strong> establish terri<strong>to</strong>ries. Adult fish may<br />
move substantial distances and managers must ei<strong>the</strong>r restrict <strong>the</strong>ir movements or be<br />
prepared <strong>for</strong> <strong>the</strong> fish <strong>to</strong> leave <strong>the</strong> reaches where <strong>the</strong>y were s<strong>to</strong>cked and reproduce<br />
elsewhere.<br />
PRFP Page 177
Appendix F - Atlantic Salmon Strategic Objectives<br />
Goals and Objectives <strong>for</strong> Atlantic Salmon <strong>Res<strong>to</strong>ration</strong> in <strong>the</strong> Penobscot River<br />
Basin<br />
Author: Greg Mackey<br />
Introduction<br />
Goals and measurable objectives will be critical in translating policy in<strong>to</strong> action and<br />
applying science <strong>to</strong> <strong>the</strong> recovery <strong>of</strong> Atlantic salmon in <strong>the</strong> Penobscot basin. Setting<br />
measureable, quantifiable objectives presents a difficult challenge <strong>for</strong> managers due<br />
<strong>to</strong> <strong>the</strong> uncertainty inherent in ecological systems, but <strong>of</strong>fers <strong>the</strong> ability <strong>to</strong> design<br />
programs and actions <strong>to</strong> meet goals, and <strong>to</strong> continually assess progress <strong>to</strong>wards<br />
those goals (Tear et al. 2005). Here we present <strong>the</strong> overarching goal <strong>for</strong> salmon in<br />
<strong>the</strong> Penobscot and a set <strong>of</strong> measureable objectives. Also included are <strong>the</strong><br />
measures that will be used <strong>to</strong> assess progress <strong>to</strong>wards meeting an objective, as well<br />
as some <strong>of</strong> <strong>the</strong> potential strategies. Several sources <strong>of</strong> uncertainty exist that are<br />
beyond <strong>the</strong> control <strong>of</strong> biologists, and <strong>the</strong>re<strong>for</strong>e could affect outcomes despite best<br />
ef<strong>for</strong>ts. Notably, marine survival is a major driver <strong>of</strong> Atlantic salmon populations and<br />
it is unlikely that humans can affect this in <strong>the</strong> short-term. Numerous dams exist in<br />
<strong>the</strong> basin affect both up and downstream passage. Although <strong>the</strong>se are under<br />
human control, <strong>for</strong>ces beyond biological management will influence decisions<br />
regarding dams that affect fish passage. The freshwater habitat has been greatly<br />
altered since European contact. The extent <strong>to</strong> which <strong>the</strong> freshwater habitat may<br />
need improvement is unclear, but should extensive habitat improvements be<br />
required, financial and logistical constraints may hamper res<strong>to</strong>ration. Finally, how<br />
climate change will affect <strong>the</strong> system is unknown.<br />
Strategies and actions within those strategies will be developed <strong>for</strong> <strong>the</strong> operational<br />
plan and implemented under <strong>the</strong>se objectives. Hereafter, adaptive management <strong>of</strong><br />
<strong>the</strong> Penobscot will focus on actions and assessments that move <strong>the</strong> res<strong>to</strong>ration<br />
process closer <strong>to</strong> <strong>the</strong> objectives, and <strong>the</strong>re<strong>for</strong>e <strong>the</strong> goal. Strategies or actions that<br />
do not show relevance <strong>to</strong> or progress <strong>to</strong>wards an objective should be adjusted or<br />
eliminated in favor o<strong>the</strong>r approaches. Strategies or actions that do show success<br />
should be used more widely. Proper assessment will be vital <strong>to</strong> <strong>the</strong> success <strong>of</strong> this<br />
objective-driven approach. We will develop a series <strong>of</strong> annual assessments <strong>to</strong> track<br />
overall progress. Fur<strong>the</strong>r, on an annual basis lead scientists will meet <strong>to</strong> per<strong>for</strong>m<br />
analyses, interpret results, and make recommendation <strong>for</strong> future management.<br />
PRFP Page 178
Methods<br />
We chose <strong>to</strong> divide <strong>the</strong> Penobscot in<strong>to</strong> seven sub-drainages based on salmon<br />
homing <strong>the</strong>ory and drainage geography (Figure 1). The Lower and Mid-Penobscot<br />
areas do not constitute discrete sub-drainages like <strong>the</strong> o<strong>the</strong>r areas, and <strong>the</strong>re<strong>for</strong>e<br />
how <strong>the</strong> population structure would functions is not as clear as in <strong>the</strong> more discrete<br />
areas. However, <strong>the</strong>y <strong>of</strong>fer <strong>for</strong> management and strategic efficiencies. The<br />
Penobscot system will be managed assuming that differentiated populations will<br />
eventually arise as res<strong>to</strong>ration progresses.<br />
Figure 1. Recovery Sub-Drainages <strong>of</strong> <strong>the</strong> Penobscot Basin:<br />
1. Lower Penobscot<br />
2. Piscataquis<br />
3. Pleasant<br />
4. East Branch<br />
5. Mattawamkeag<br />
6. Passadumkeag<br />
7. Mid-Penobscot<br />
PRFP Page 179
We made some key assumptions about salmon res<strong>to</strong>ration:<br />
1) The Penobscot basin contains seven discrete areas where unique<br />
populations should exist (West Branch is not included)<br />
2) Each area could support a self-sustaining population<br />
3) “Wild” means fish <strong>of</strong> completely natural heritage: <strong>the</strong> progeny <strong>of</strong> sea-run<br />
parents (adult s<strong>to</strong>cked progeny, egg planting and fry s<strong>to</strong>cking are NOT<br />
included in this group)<br />
4) <strong>Res<strong>to</strong>ration</strong> resources will remain constant and can be shifted and<br />
concentrated in target sub-drainages as o<strong>the</strong>r sub-drainages are res<strong>to</strong>red.<br />
We developed quantitative criteria in part by applying well recognized standards (e.g<br />
effective population size <strong>of</strong> 500), using data analysis from local research (quantile<br />
regression model linking juvenile densities <strong>to</strong> stream size), and used best<br />
pr<strong>of</strong>essional judgment and tried <strong>to</strong> make <strong>the</strong> measures logical when taken <strong>to</strong>ge<strong>the</strong>r.<br />
Goals and Objectives<br />
Goal: Sub-Goal <strong>for</strong> Atlantic Salmon: Rebuild Atlantic salmon populations <strong>to</strong><br />
stable, self-sustaining status with recreational fishable surplus.<br />
Objective 1: Meta-population capable <strong>of</strong> self-sustaining status and providing a<br />
recreational fishable surplus <strong>for</strong> 100 years with 95 % certainty.<br />
• Measure 1a: Within each sub-drainage: Ne > 500 exceeded by 20%, or<br />
sub-drainage-specific CSE exceeded by 20% on annual basis. [Use<br />
multiple (3) models <strong>to</strong> predict necessary population levels. Arrive at<br />
consensus among models.] Use <strong>the</strong> measure that is lowest <strong>for</strong> each<br />
sub-drainage.<br />
o Estimate Ne using modeling or algorithm based on N.<br />
o Estimate Ne using genetic assessment<br />
o Redd counts extrapolated <strong>to</strong> # spawners<br />
o Trap Counts<br />
o Telemetry Estimates<br />
� Strategy- meeting objectives listed below will lead <strong>to</strong> this<br />
objective. Develop plan <strong>for</strong> success: How and when <strong>to</strong><br />
s<strong>to</strong>p s<strong>to</strong>cking as populations recover. Use modeling and<br />
habitat estimates <strong>to</strong> create sub-drainages size targets<br />
with uncertainty included.<br />
� Strategy- manage populations <strong>to</strong> achieve CSE objective<br />
by considering all populations and targeting those most<br />
likely <strong>to</strong> recover first. Use adaptive approach <strong>to</strong> improve<br />
management <strong>for</strong> later populations.<br />
� Strategy- Shift resources <strong>to</strong> new sub-drainages as o<strong>the</strong>rs<br />
are res<strong>to</strong>red.<br />
PRFP Page 180
• Measure 1b: Sub-drainages with growth rate R equal <strong>to</strong> or greater<br />
than 1.<br />
o Estimate from adult <strong>to</strong> adult cohort returns (trap census or redd<br />
counts)<br />
o Estimate using modeling (PVA or matrix etc.) based on o<strong>the</strong>r<br />
available life stage data.<br />
� Strategy- focus management activities and assessments<br />
on population growth rates. Sub-drainages where natural<br />
reproduction is inadequate will never recover.<br />
Management must focus on growth rates as well as<br />
population size.<br />
� Develop assessment plan that will allow detection <strong>of</strong> subdrainage<br />
growth rates (e.g. concentrated redd counts,<br />
proportional adult returns estimated by telemetry etc.)<br />
Table 1. Year and Percentage <strong>of</strong> Criteria Met <strong>for</strong> Sub-drainages 1-7<br />
Sub-Drainage<br />
Year 1 2 3 4 5 6 7<br />
0 0 % 0 % 0 % 0 % 0 % 0 % 0 %<br />
5 20 % all 0 % 0 % 0 % 0 % 0 % 0 %<br />
10 20 % wild 20 % all 0 % 0 % 0 % 0 % 0 %<br />
15 50 % wild 20 % wild 20 % all 20 % all 0 % 0 % 0 %<br />
20 90 % wild 50 % wild 20 % wild 20 % wild 20 % all 20 % all 20 % all<br />
25 res<strong>to</strong>red 90 % wild 50 % wild 50 % wild 20 % wild 20 % wild 20 % wild<br />
30 res<strong>to</strong>red res<strong>to</strong>red 90 % wild 90 % wild 50 % wild 50 % wild 50 % wild<br />
35 res<strong>to</strong>red res<strong>to</strong>red res<strong>to</strong>red res<strong>to</strong>red 90 % wild 90 % wild 90 % wild<br />
40 res<strong>to</strong>red res<strong>to</strong>red res<strong>to</strong>red res<strong>to</strong>red res<strong>to</strong>red res<strong>to</strong>red res<strong>to</strong>red<br />
Key <strong>to</strong> table:<br />
0 % No demographic measures achieved<br />
20 % all 20 % <strong>of</strong> demographic measures is achieved considering both wild and<br />
hatchery fish.<br />
20 % <strong>to</strong> 90 % wild 20 % <strong>to</strong> 90 % <strong>of</strong> demographic measures is achieved by wild fish only.<br />
res<strong>to</strong>red All demographic measures achieved with a wild population (no hatchery<br />
supplementation).<br />
Figure 2. Generalized Sub-Drainage Recovery and Percentage Wild Fish Curves<br />
PRFP Page 181
Number <strong>of</strong> Sub-Drainages Recovered<br />
7<br />
6<br />
5<br />
4<br />
3<br />
2<br />
1<br />
0<br />
Number <strong>of</strong> Sub-Drainages<br />
Wild Percentage<br />
2009 2014 2019 2024 2029 2034 2039 2044 2049<br />
year<br />
Objective 2: Increase natural spawning <strong>to</strong> 100% <strong>of</strong> production by wild spawners in<br />
40 years<br />
• Increase wild proportion <strong>of</strong> overall escapement <strong>of</strong> wild sea-run and<br />
hatchery-derived adults, with wild fish meeting Objective 1 (Table 1).<br />
o Trap counts<br />
o Redd counts<br />
� Strategy- Penobscot Broods<strong>to</strong>ck Management <strong>Plan</strong> will<br />
be developed <strong>to</strong> help address this. Think creatively as <strong>to</strong><br />
how this can be accomplished.<br />
� Strategy- Increase freshwater production by habitat<br />
improvement, connectivity, intrinsic productivity, etc.<br />
• Increase <strong>the</strong> number <strong>of</strong> hatchery-derived adults spawning naturally <strong>to</strong><br />
augment wild spawners by doubling <strong>the</strong> 2008 number in 5 years in at<br />
least one sub-drainage, increasing by additional 50 % in 10 years in at<br />
least two sub-drainages, and no augmentation in 40 years.<br />
o Release data<br />
o Redd counts<br />
� Strategy- Penobscot Broods<strong>to</strong>ck Management <strong>Plan</strong> will<br />
be developed <strong>to</strong> help address this. Think creatively as <strong>to</strong><br />
how this can be accomplished. Identify areas <strong>for</strong> adult<br />
s<strong>to</strong>cking. Use adaptive management <strong>to</strong> assess results<br />
and aggressively adapt <strong>to</strong> in<strong>for</strong>mation.<br />
PRFP Page 182<br />
100<br />
90<br />
80<br />
70<br />
60<br />
50<br />
40<br />
30<br />
20<br />
10<br />
0<br />
Percent Wild Fish
Objective 3: Discontinue supplementation in sub-drainages meeting Objective 1<br />
measures (Table 1). S<strong>to</strong>cking should be halted at <strong>the</strong> earliest point possible <strong>to</strong><br />
encourage re-population by wild fish. By year 40, all salmon will be <strong>of</strong> wild origin.<br />
• Evaluate using s<strong>to</strong>cking records/recommendations.<br />
� Strategy- Develop a plan <strong>for</strong> success- how and when <strong>to</strong><br />
s<strong>to</strong>p s<strong>to</strong>cking. This must be peer-reviewed and should<br />
be a central tenet <strong>of</strong> <strong>the</strong> salmon program in Maine.<br />
Constantly assess populations <strong>to</strong> determine if s<strong>to</strong>cking is<br />
warranted under this plan.<br />
� Develop explicit adaptive management plan <strong>to</strong> halt<br />
s<strong>to</strong>cking based on Table 1 measures.<br />
Objective 4: Achieve self-sustaining smolt <strong>to</strong> adult return rates within five years <strong>of</strong> a<br />
sub-drainage achieving 20 % <strong>of</strong> Objective 1 measures <strong>for</strong> hatchery and wild fish<br />
combined (Table 1). Also assess hatchery-derived smolt <strong>to</strong> adult return rates that<br />
could lead <strong>to</strong> self-sustaining populations. Use trapping facilities <strong>to</strong> assess smolt <strong>to</strong><br />
adult return rates.<br />
• Measure 4a: Estimate required return rates <strong>for</strong> self-sustaining<br />
population annually based on population data and PVA model.<br />
� Strategy- use modeling <strong>to</strong> set targets with uncertainty. Test<br />
models against empirical data as <strong>the</strong>y become available.<br />
Adjust models as needed <strong>to</strong> improve target(s).<br />
• Measure 4b: Return rates based on marked groups at Veazie and/or<br />
Mil<strong>for</strong>d<br />
� Strategy- s<strong>to</strong>ck marked smolts and set up proper sampling<br />
scheme <strong>to</strong> assess return rates <strong>of</strong> hatchery fish. Compare <strong>to</strong><br />
wild. Adapt as necessary <strong>to</strong> improve. Change rearing<br />
regime/environment, s<strong>to</strong>cking methods (timing etc.).<br />
• Measure 4c: Naturally reared return rates<br />
� Strategy- Estimate natural return rates via juvenile or smolt<br />
assessments and returning adult census (trap or redd<br />
counts). Use data from un-dammed rivers <strong>to</strong> augment our<br />
understanding. Test against rates needed <strong>for</strong> recovery. Use<br />
in<strong>for</strong>mation <strong>to</strong> address habitat/environment issues.<br />
• Measure 4d: Smolt <strong>to</strong> adult return rates (SAR)<br />
o S<strong>to</strong>cked above one dam<br />
o SAR based on s<strong>to</strong>cking location<br />
� Strategy- Assess smolt return rates in relation <strong>to</strong> s<strong>to</strong>cking<br />
location and dams. Identify opportunities (promising return<br />
rates) and problems (return rates that are unlikely <strong>to</strong> yield<br />
recovery). Aggressively pursue proactive management in<br />
promising areas and identify limiting fac<strong>to</strong>rs in problem<br />
areas. Shift resources away from problem areas until<br />
limiting fac<strong>to</strong>rs have been addressed.<br />
• Measure 4e: Number <strong>of</strong> returns <strong>to</strong> Weldon as a proportion <strong>of</strong> what is<br />
s<strong>to</strong>cked upstream.<br />
PRFP Page 183
� Strategy- Use s<strong>to</strong>cking data and trap data <strong>to</strong> determine<br />
survival and homing <strong>of</strong> fish s<strong>to</strong>cked above Weldon. Shift<br />
management resources away <strong>for</strong>m areas that have limiting<br />
fac<strong>to</strong>rs that likely prevent recovery and aggressively manage<br />
areas that are promising <strong>for</strong> recovery.<br />
• Measure 4f: Return rate and number <strong>of</strong> rejuvenated kelts<br />
� Strategy- Estimate kelt <strong>to</strong> spawner survival. Use data <strong>to</strong><br />
improve population models. Determine if this survival can be<br />
improved. If so, pursue actions <strong>to</strong> improve if modeling<br />
suggests a worthwhile benefit <strong>of</strong> <strong>the</strong> population.<br />
� Strategy- Assess <strong>the</strong> potential <strong>of</strong> kelt rejuvenation. Do<br />
experimental work if needed. Use modeling <strong>to</strong> predict<br />
benefit and help make management decision as <strong>to</strong> value <strong>of</strong><br />
such a program.<br />
Objective 5: Achieve interim juvenile life stage-specific measures <strong>to</strong> assess progress<br />
<strong>to</strong>wards goal and <strong>to</strong> in<strong>for</strong>m management at specific shorter time intervals. Achieve<br />
within five years <strong>of</strong> a sub-drainage achieving 20 % <strong>of</strong> Objective 1 measures <strong>for</strong><br />
hatchery and wild fish combined (Table 1). Applies <strong>to</strong> both hatchery and wild fish,<br />
but applies <strong>to</strong> wild fish only <strong>to</strong> reach Objective 1.<br />
• Measure 3a: On average > = 240 eggs per unit deposition on annual<br />
basis within five years <strong>of</strong> a sub-drainage achieving 20 % <strong>of</strong> Objective 1<br />
measures <strong>for</strong> hatchery and wild fish combined (Table 1).<br />
o Redd counts extrapolated <strong>to</strong> # eggs<br />
� Strategy- Improve fish passage<br />
� Strategy- s<strong>to</strong>ck adults<br />
� Strategy- trap and truck sea-run adults<br />
� Strategy- Increase upstream escapement by decreasing<br />
broods<strong>to</strong>ck take and/or increasing adult returns.<br />
� Strategy- Develop more precise egg deposition rates <strong>for</strong><br />
sub-drainages.<br />
• Measure 3b: Use following measures (3c-3e) <strong>for</strong> hatchery and wild<br />
juveniles. Compare hatchery verses wild survival and/or population<br />
densities and smolt production.<br />
• Measure 3c: > = 90 % density quantile (from cumulative drainage area<br />
quantile regression model) or greater YOY and parr per unit <strong>of</strong> habitat<br />
within five years <strong>of</strong> a sub-drainage achieving 20 % <strong>of</strong> Objective 1<br />
measures <strong>for</strong> hatchery and wild fish combined (Table 1). Electr<strong>of</strong>ishing<br />
estimate or CPUE equivalent<br />
� Strategy- S<strong>to</strong>ck fry and improve fry s<strong>to</strong>cking methods<br />
� Strategy- S<strong>to</strong>ck eggs and improve egg s<strong>to</strong>cking methods<br />
� Strategy- S<strong>to</strong>ck reaches most likely <strong>to</strong> yield desired<br />
densities<br />
� Strategy- Increase connectivity<br />
� Strategy- Improve habitat complexity<br />
PRFP Page 184
� Strategy- Assess environmental conditions that are<br />
limiting<br />
� Strategy- Use quantile regression model coupled with<br />
development <strong>of</strong> adaptive management criteria based on<br />
quantiles.<br />
• Measure 3d: > = 3 smolts per unit (240 eggs/unit*0.0125 or estimate<br />
from parr quantile regression and typical smolt survival) within five<br />
years <strong>of</strong> a sub-drainage achieving 20 % <strong>of</strong> Objective 1 measures <strong>for</strong><br />
hatchery and wild fish combined (Table 1).<br />
o Smolt trap or o<strong>the</strong>r estimation method<br />
� Strategy- See 3c above…<br />
• Measure 3e: Egg <strong>to</strong> smolt survival <strong>of</strong> > = 1.25% within five years <strong>of</strong> a<br />
sub-drainage achieving 20 % <strong>of</strong> Objective 1 measures <strong>for</strong> hatchery and<br />
wild fish combined (Table 1).<br />
o Analysis <strong>of</strong> data<br />
� Strategy- See 3c above…<br />
� Collect appropriate juvenile abundance data and smolt<br />
data <strong>to</strong> assess. Use un-biased sampling approach.<br />
Objective 6: Increase upstream migra<strong>to</strong>ry survival rate within 15 years <strong>to</strong> allow selfsustaining<br />
levels.<br />
• Measure 6a: Improve upstream fish passage at dams <strong>to</strong> levels needed<br />
<strong>for</strong> self-sustaining population<br />
� Strategy- Estimate required passage efficiencies<br />
� Strategy- Review current in<strong>for</strong>mation and use <strong>to</strong> direct<br />
fur<strong>the</strong>r action under this objective.<br />
� Strategy- Assess fish passage at all dams as needed<br />
within 5 years<br />
� Strategy- Complete improvements based on passage<br />
efficiency and population effect within 10 years.<br />
� Strategy- Target current focus res<strong>to</strong>ration areas.<br />
• Measure 6b: Improve stream connectivity (small dams, culverts etc.) <strong>to</strong><br />
levels needed <strong>to</strong> achieve desired Ne and N.<br />
� Strategy- Assess connectivity limitations within 5 years<br />
� Strategy- Fix connectivity problems based on passage<br />
efficiency and population effect within 10 years<br />
� Strategy- Target current focus res<strong>to</strong>ration areas.<br />
Objective 7: Increase downstream migra<strong>to</strong>ry survival rate within 15 years <strong>to</strong> allow<br />
self-sustaining levels.<br />
• Measure 7a: Improve downstream fish passage at dams <strong>to</strong> levels<br />
needed <strong>for</strong> self-sustaining population<br />
� Strategy- Estimate required passage efficiencies<br />
� Strategy- Review current in<strong>for</strong>mation and use <strong>to</strong> direct<br />
fur<strong>the</strong>r action under this objective.<br />
PRFP Page 185
Reference<br />
� Strategy- Assess fish passage at all dams as needed<br />
within 5 years<br />
� Strategy- Complete improvements based on passage<br />
efficiency and population effect within 10 years.<br />
� Strategy- Target current focus res<strong>to</strong>ration areas.<br />
• Measure 7b: Improve stream connectivity (small dams, culverts etc.) <strong>to</strong><br />
levels needed <strong>to</strong> achieve desired Ne and N.<br />
� Strategy- Assess connectivity limitations within 5 years<br />
� Strategy- Fix connectivity problems based on passage<br />
efficiency and population effect within 10 years<br />
� Strategy- Target current focus res<strong>to</strong>ration areas.<br />
Tear, T. H., P. Kareiva, P. L. Angermeier, P. Comer, B. Cech, R. Kautz, L. Landon,<br />
D. Mehlan, K. Murphy, M. Ruckleshaus, J. M. Scott, and G. Wilhere. 2005.<br />
How much is enough? The recurrent problem <strong>of</strong> setting measureable<br />
objectives in conservation. BioScience. 55. 835-849.<br />
PRFP Page 186
Appendix G - Habitat Survey and Assessment <strong>Plan</strong> <strong>for</strong> <strong>the</strong> Penobscot Basin<br />
Author: Greg Mackey<br />
Currently <strong>the</strong>re is substantial coverage <strong>of</strong> Atlantic salmon habitat survey in <strong>the</strong><br />
Penobscot basin. However, <strong>the</strong> size <strong>of</strong> <strong>the</strong> basin precludes any type <strong>of</strong><br />
comprehensive field survey <strong>of</strong> salmon habitat. Such surveys are valuable because<br />
<strong>the</strong>y not only provide data <strong>of</strong> immediate use <strong>to</strong> managers and policy makes, but also<br />
provide baseline data <strong>for</strong> various modeling ef<strong>for</strong>ts. In addition <strong>to</strong> <strong>the</strong> field survey <strong>of</strong><br />
habitat, <strong>the</strong> entire Penobscot basin, as well as all Atlantic salmon waters in <strong>the</strong> state,<br />
has had Atlantic salmon habitat estimated via a GIS model. Fur<strong>the</strong>r refinement <strong>of</strong><br />
this model is planned.<br />
Habitat Survey<br />
Field survey <strong>of</strong> habitat should continue <strong>to</strong> use <strong>the</strong> DMR BSRFH “Big River” habitat<br />
survey method and focus on waters <strong>of</strong> importance <strong>to</strong> salmon management, but also<br />
focus on surveying a diversity <strong>of</strong> stream types (size, gradient, geographic location).<br />
This will help managers understand <strong>the</strong> scope and frequency <strong>of</strong> habitat across<br />
various stream types. Such surveys will also help <strong>to</strong> validate modeling ef<strong>for</strong>ts,<br />
providing more and faster habitat in<strong>for</strong>mation with estimates <strong>of</strong> precision at lower<br />
cost. A sampling plan <strong>for</strong> habitat survey will be established by biologists familiar with<br />
<strong>the</strong> basin and with <strong>the</strong> GIS habitat model. Such a survey may include stream<br />
reaches randomly chosen <strong>for</strong> a defined sampling frame. On an annual basis, a<br />
portion <strong>of</strong> each summer will be allotted <strong>to</strong> habitat survey, with balance between<br />
habitat assessment and survey.<br />
Habitat Assessment<br />
Large Woody Debris<br />
Recent surveys in coastal Maine rivers have revealed that large woody debris (LWD)<br />
is at extremely low levels. A study is underway <strong>to</strong> test <strong>the</strong> effectiveness <strong>of</strong> adding<br />
LWD <strong>to</strong> salmon habitat. However, no surveys have been done in <strong>the</strong> Penobscot<br />
basin, nor in more inland Maine rivers. The Penobscot basin contains a wider array<br />
<strong>of</strong> land use activities, <strong>for</strong>est types, and landscape features than does <strong>the</strong> coastal<br />
area where previous surveys were done. There<strong>for</strong>e, per<strong>for</strong>ming LWD surveys<br />
across reaches with different stream sizes, <strong>for</strong>est stands, <strong>to</strong>pography, and land use<br />
his<strong>to</strong>ry would help link LWD loading <strong>to</strong> <strong>the</strong>se variables. Assuming a link is revealed,<br />
we can use this in<strong>for</strong>mation <strong>to</strong> predict LWSD loadings in o<strong>the</strong>r streams. One avenue<br />
that may aid in this is using an LWD loading model based on <strong>for</strong>est stand data,<br />
environmental variables, and s<strong>to</strong>chastic events. Field surveys will help validate <strong>the</strong><br />
model and allow broader inferences <strong>to</strong> be made.<br />
PRFP Page 187
Water Temperature<br />
Water temperature is recorded annually at various sites in <strong>the</strong> Penobscot, in<br />
cooperation with Penobscot Indian Nation, who also record water temperatures.<br />
Water temperature moni<strong>to</strong>ring in <strong>the</strong> Penobscot basin falls within a larger state-wide<br />
water temperature moni<strong>to</strong>ring plan <strong>for</strong> Atlantic salmon waters. Recently, DMR<br />
BSRFH has been scaling back <strong>the</strong> number <strong>of</strong> temperature loggers deployed<br />
annually, and is concentrating on moni<strong>to</strong>ring key index sites and using additional<br />
loggers <strong>to</strong> rotate among sites <strong>for</strong> interest. This correlates water temperatures at new<br />
sites <strong>to</strong> <strong>the</strong> index site(s) and allows a prediction model <strong>to</strong> be constructed. Water<br />
temperature should continue <strong>to</strong> be recorded at index sites, while additional loggers<br />
shall be deployed at sites <strong>of</strong> interest. New sites may be chosen using a GTRS<br />
method. This will provide unbiased water temperature in<strong>for</strong>mation <strong>for</strong> <strong>the</strong> basin.<br />
The amount <strong>of</strong> ef<strong>for</strong>t <strong>to</strong> put in<strong>to</strong> water temperature moni<strong>to</strong>ring should be kept at or<br />
below current levels, unless a well-defined study is put <strong>for</strong>th. More ef<strong>for</strong>t should be<br />
put in<strong>to</strong> analysis and interpretation <strong>of</strong> water temperature data. Notably, a stream<br />
classification system should be finalized and put in<strong>to</strong> general use statewide (Figure<br />
1).<br />
Figure 1. Stream classification system based on summer water temperature<br />
variability and magnitude.<br />
Temperature Range<br />
Connectivity<br />
Extreme<br />
(> 6°)<br />
Moderate<br />
(3-6°)<br />
Stable<br />
(< 3°)<br />
Cold/Extreme Cool/Extreme Warm/Extreme<br />
Cold/Moderate Cool/Moderate Warm/Moderate<br />
Cold/Stable Cool/Stable Warm/Stable<br />
Cold (< 16°) Cool (16 - 22°) Warm (> 22°)<br />
Average Temperature<br />
Fish passage at dams<br />
Pursue additional fish passage studies (Atlantic salmon adult and smolt, o<strong>the</strong>r<br />
species as needed) at dams where studies have not been done, are incomplete, out<br />
<strong>of</strong> date, or insufficient. Such in<strong>for</strong>mation is critical <strong>for</strong> large scale management<br />
decisions. Without knowledge <strong>of</strong> dam-related mortality, all management actions<br />
PRFP Page 188
elated <strong>to</strong> diadromous fishes upstream are at risk <strong>of</strong> failure if dam-related mortality is<br />
<strong>to</strong>o high <strong>to</strong> allow viable populations. Establish a team <strong>to</strong> pursue such studies on an<br />
ongoing basis.<br />
Stream connectivity<br />
Stream connectivity surveys have been underway in <strong>the</strong> Penobscot basin. These<br />
surveys are planned <strong>to</strong> continue. In<strong>for</strong>mation <strong>for</strong>m <strong>the</strong>se surveys will be used <strong>to</strong><br />
make decisions on fixing stream connectivity problems. These actions should be<br />
orchestrated <strong>to</strong> 1) address stream connectivity in <strong>the</strong> areas that will most benefit<br />
Atlantic salmon (generally <strong>the</strong> most productive habitat), and 2) in subdrainages that<br />
are more likely <strong>to</strong> allow viable populations <strong>to</strong> persist. In additions, stream<br />
connectivity res<strong>to</strong>ration should be done from downstream <strong>to</strong> upstream. Stream<br />
connectivity survey data can also be used <strong>to</strong> model <strong>the</strong> amount <strong>of</strong> accessible (or<br />
inaccessible) habitat, and, <strong>the</strong>re<strong>for</strong>e, predict production potential more accurately.<br />
PRFP Page 189
Appendix H - Developing a Sampling <strong>Plan</strong> <strong>for</strong> <strong>the</strong> Penobscot Basin<br />
Author: Greg Mackey<br />
Introduction<br />
The Penobscot Basin is <strong>the</strong> largest river system in Maine and is managed <strong>for</strong><br />
Atlantic salmon and o<strong>the</strong>r diadromous fishes in <strong>the</strong> context <strong>of</strong> a state-wide setting.<br />
Sampling natural systems <strong>for</strong> management requires unbiased and spatially<br />
distributed sampling, with samples spaced relatively evenly in space. Sampling<br />
must balance trend and status data collection goals. In addition, sampling should<br />
allow <strong>for</strong> greater emphasis (sampling) ef<strong>for</strong>t within certain areas depending on needs<br />
<strong>of</strong> biologists and managers. Finally, sampling must be flexible <strong>to</strong> allow un-sampled<br />
sites <strong>to</strong> be accounted <strong>for</strong>, and <strong>to</strong> add sites as needed. This requires a probability<br />
sampling approach. Without probability sampling we cannot understand how<br />
samples represent <strong>the</strong> “real world’ and are likely <strong>to</strong> collect biased data that may<br />
result in incorrect conclusions and in<strong>for</strong>m poor management decisions. Clearly, this<br />
is vital <strong>for</strong> effective adaptive management. Fur<strong>the</strong>rmore, collecting data under a<br />
unified probability sampling plan with standardized pro<strong>to</strong>cols will greatly increase<br />
statistical power <strong>for</strong> <strong>the</strong> same level <strong>of</strong> sampling ef<strong>for</strong>t, allowing biologists <strong>to</strong> more<br />
powerfully analyze large spatial and temporal trends and status. Finally, <strong>the</strong><br />
sampling plan <strong>for</strong> <strong>the</strong> Penobscot should be integrated with a larger state-wide<br />
sampling plan <strong>to</strong> increase statistical power and optimize <strong>the</strong> value <strong>of</strong> limited<br />
sampling capacity.<br />
Such surveys are constructed using several components: The Master Sample<br />
concept is used <strong>to</strong> unify sampling that is per<strong>for</strong>med by many different entities, such<br />
as state-wide sampling. It requires 1) sampling from <strong>the</strong> same frame, and 2) using<br />
standardized sampling methods. Sampling Frame defines <strong>the</strong> domain from which<br />
samples are drawn (e.g. <strong>the</strong> river network or collection <strong>of</strong> all river networks in <strong>the</strong><br />
state). Multi-density categories are attributes <strong>of</strong> <strong>the</strong> frame that allow <strong>the</strong> sampling<br />
design <strong>to</strong> specify sampling ef<strong>for</strong>t based on <strong>the</strong> attribute (such as stream order).<br />
Stratification allows <strong>the</strong> frame <strong>to</strong> be divided in<strong>to</strong> units <strong>of</strong> interest <strong>for</strong> sampling, and<br />
strata may have differing sampling designs based on needs. Panels allow <strong>the</strong><br />
sampling design <strong>to</strong> incorporate multi-year designs so rotating samples may be used.<br />
Oversample allows <strong>the</strong> sampling design <strong>to</strong> specify “extra” samples that can be used<br />
if needed. These samples are consistent with <strong>the</strong> sampling design.<br />
Sampling activities in <strong>the</strong> Penobscot that require a probability sample include<br />
juvenile salmon surveys (electr<strong>of</strong>ishing or snorkeling), and redd surveys. In addition,<br />
surveys <strong>of</strong> habitat characteristics such as water temperature, water quality, or<br />
habitat features such as large woody debris or stream canopy cover may benefit<br />
from using probability sampling.<br />
We used <strong>the</strong> spsurvey package <strong>for</strong> R, developed by <strong>the</strong> US Environmental<br />
Protection Agency Environmental Moni<strong>to</strong>ring and Assessment Program. This<br />
package allows <strong>the</strong> creation <strong>of</strong> generalized random-tessellation stratified sampling<br />
PRFP Page 190
designs (GRTS), where samples are regularly distributed in space with known<br />
inclusion probabilities. Such samples are compatible with standard statistical<br />
methods (e.g. parametric and non-parametric methods), but statistical methods that<br />
take advantage <strong>of</strong> inclusion probability may also be used, such as those in <strong>the</strong> R<br />
package psurvey.analysis. We used <strong>the</strong> Penobscot Basin USGS NHD High GIS<br />
data as our sampling frame, and developed sampling designs in R. These designs<br />
can be readily edited <strong>to</strong> accommodate alternative sampling needs. Fur<strong>the</strong>r,<br />
although we focused only on <strong>the</strong> Penobscot <strong>for</strong> this exercise, we will create a statewide<br />
sampling design that integrates <strong>the</strong> Penobscot sampling plan. This will allow<br />
<strong>the</strong> same level <strong>of</strong> statistically rigorous sampling within <strong>the</strong> Penobscot basin, but also<br />
allow <strong>the</strong> Penobscot data and all o<strong>the</strong>r data within <strong>the</strong> state-wide sampling plan <strong>to</strong> be<br />
integrated. A final sampling plan <strong>for</strong> <strong>the</strong> Penobscot should be integrated in<strong>to</strong> a<br />
larger DPS-wide plan, and development <strong>of</strong> <strong>the</strong> plan should follow <strong>the</strong> steps outlined<br />
later in this document.<br />
For juvenile survey, we recommend a mix <strong>of</strong> full population estimates and relative<br />
abundance estimates per<strong>for</strong>med by electr<strong>of</strong>ishing. Fur<strong>the</strong>rmore, additional panels<br />
could be constructed <strong>to</strong> <strong>for</strong>mally include CPUE and snorkel samples.<br />
For redd surveys we recommend developing several index “reaches’ that are<br />
surveyed every year, preferably multiple times per year <strong>to</strong> ensure <strong>the</strong> most accurate<br />
counts possible, and a multi-panel GRTS design <strong>to</strong> provide greater spatial coverage.<br />
Process<br />
The final sampling plan should follow <strong>the</strong> process outlined in Figure 1. The plan will<br />
be constructed <strong>to</strong> address <strong>the</strong> various sampling needs <strong>to</strong> meet <strong>the</strong> objectives<br />
defined in <strong>the</strong> sample design process.<br />
Figure 1. Flowchart <strong>of</strong> sampling design development<br />
source: http://www.epa.gov/nheerl/arm/designpages/designprocoverview5.htm<br />
PRFP Page 191
The process begins with defining <strong>the</strong> objectives <strong>of</strong> <strong>the</strong> sampling program, and <strong>the</strong>n<br />
defines <strong>the</strong> target population(s) and <strong>the</strong> attribute(s) that are <strong>of</strong> interest. Next, <strong>the</strong><br />
sampling frame requirements and materials are specified, as are <strong>the</strong> sampling<br />
design requirements <strong>to</strong> meet <strong>the</strong> objectives. A sampling design and final sampling<br />
frame are created, and <strong>the</strong> design is <strong>the</strong>n used <strong>to</strong> select sampling sites from <strong>the</strong><br />
frame. The results are output as an ESRI shapefile with an attribute table. Overall,<br />
this must be an iterative process, balancing various sampling objectives with<br />
achievable sampling ef<strong>for</strong>t. There will be a trade<strong>of</strong>f between sampling <strong>for</strong> status and<br />
trends verses sampling <strong>to</strong> test specific hypo<strong>the</strong>ses. The objectives must balance<br />
<strong>the</strong>se competing needs given a certain amount <strong>of</strong> ef<strong>for</strong>t. The sample design should<br />
also address both short and long term needs. Sampling <strong>to</strong> assess particular<br />
management actions may require a very different design than that needed <strong>to</strong> asses<br />
naturally reproducing populations.<br />
Sample Size <strong>for</strong> Electr<strong>of</strong>ishing<br />
Sample size and power present many challenges. We have chosen <strong>to</strong> sample at<br />
least 5-10 sites per drainage statewide based on <strong>the</strong> analyses described below<br />
(also, see Figure 2):<br />
“We recommend a minimum <strong>of</strong> 5 – 10 sites be sampled annually within a HUC <strong>of</strong><br />
interest using ei<strong>the</strong>r multiple pass removal estimates <strong>of</strong> mean density or mean<br />
CPUE methodologies. This amount <strong>of</strong> sampling ef<strong>for</strong>t will provide 80% power in<br />
detecting a trend in <strong>the</strong> index <strong>of</strong> abundance <strong>for</strong> annual rates <strong>of</strong> change between 0.1<br />
and 0.2. Although <strong>the</strong> ability <strong>to</strong> detect smaller changes is desirable, <strong>the</strong> amount <strong>of</strong><br />
sampling required <strong>to</strong> detect such changes greatly increases at annual rates <strong>of</strong><br />
increase less than 0.1 and may not be feasible with limited sampling resources.<br />
Annual rates <strong>of</strong> change <strong>of</strong> 0.1 <strong>to</strong> 0.2 correspond <strong>to</strong> approximately a doubling or<br />
tripling <strong>of</strong> <strong>the</strong> index <strong>of</strong> abundance in a 10 year period. Because <strong>of</strong> <strong>the</strong> natural annual<br />
variation in parr abundance, anything less than a true doubling <strong>of</strong> abundance may<br />
be <strong>of</strong> little <strong>to</strong> no significance in overall population growth rates <strong>of</strong> Atlantic salmon.”<br />
(from J. Sweka, J. Trial, and J. Kocik, draft White Paper on Atlantic Salmon S<strong>to</strong>ck<br />
Assessment Status and Needs, April 7, 2008.).<br />
While trend detection is one goal <strong>of</strong> juvenile assessment, o<strong>the</strong>r goals such as<br />
describing <strong>the</strong> status <strong>of</strong> juvenile abundance, or mechanistic relationships between<br />
environmental variables and juvenile abundance, survival, or growth, are critically<br />
important. There<strong>for</strong>e, <strong>the</strong> sampling we describe here is a minimum <strong>to</strong> detect trends<br />
and describe status, but more in depth sampling may be required <strong>for</strong> some<br />
objectives.<br />
The 5-10 sites will represent annually sampled sites where full population estimates<br />
are per<strong>for</strong>med. In addition, a rotation <strong>of</strong> sites that includes CPUE and population<br />
estimates will be sampled. The design <strong>of</strong> this will be specific <strong>to</strong> <strong>the</strong> drainage, but will<br />
be based on a three year rotation, where each site will be visited every third year,<br />
PRFP Page 192
with panels starting in year 1, 2, and 3. A large overage <strong>of</strong> sites will also be created<br />
in an attempt <strong>to</strong> accommodate non-sampling and future sampling needs.<br />
Required number <strong>of</strong> sites<br />
25<br />
20<br />
15<br />
10<br />
5<br />
Sample size <strong>for</strong> 80% power<br />
0<br />
0.05 0.10 0.15 0.20 0.25 0.30 0.35 0.40 0.45 0.50<br />
Rate <strong>of</strong> change per year<br />
Figure 2. Electr<strong>of</strong>ishing population estimate samples needed <strong>to</strong> detect a rate<br />
<strong>of</strong> change in parr density<br />
Sample Size <strong>for</strong> Redd Counts<br />
Sample size <strong>for</strong> redd counts should encompass at least 80% <strong>of</strong> spawning areas<br />
within a drainage. For <strong>the</strong> Penobscot, <strong>the</strong> majority <strong>of</strong> <strong>the</strong> basin has not been<br />
surveyed <strong>for</strong> spawning habitat. With this in mind, we recommend sampling annually<br />
at least 80 % <strong>of</strong> all known spawning habitat, and also surveying a random sample <strong>of</strong><br />
reaches. As knowledge increases about <strong>the</strong> location <strong>of</strong> spawning habitat, sampling<br />
may be modified <strong>to</strong> take advantage <strong>of</strong> this. Reaches may be excluded, or added as<br />
ei<strong>the</strong>r annual or rotational reaches <strong>for</strong> sampling. The two objectives are trend<br />
detection over time, and status <strong>of</strong> spawning throughout <strong>the</strong> basin.<br />
Development <strong>of</strong> Sampling Design<br />
The following represents a fully realized juvenile Atlantic salmon probability sample<br />
<strong>for</strong> <strong>the</strong> Penobscot Basin. This provides a real example <strong>of</strong> <strong>the</strong> probability design, but<br />
this particular instance is used <strong>to</strong> illustrate what a sample focused on trend and<br />
status would be like. Fur<strong>the</strong>r refinement in sample size and proportional distribution<br />
across strata and stream widths is required. Fur<strong>the</strong>rmore, integration in<strong>to</strong> a statewide<br />
sampling plan should be done. The map in Figure 3 shows a sampling design<br />
with ten annually visited sites per strata, with and additional set <strong>of</strong> three rotating<br />
panels <strong>of</strong> ten sites per year. The samples are also distributed across three stream<br />
width categories: 0-12 m, 12-24 m, and >24 m. Not shown is a large over-sample<br />
that was generated <strong>to</strong> account <strong>for</strong> additional sites if needed.<br />
PRFP Page 193
This same sampling design can be used <strong>for</strong> o<strong>the</strong>r sampling needs, such as<br />
randomly identifying reaches or streams or sites <strong>to</strong> conduct water quality, water<br />
temperature, habitat attribute survey, or redd surveys. Sites must simply be chosen<br />
in <strong>the</strong> listed order within a stratum <strong>to</strong> con<strong>for</strong>m <strong>to</strong> <strong>the</strong> random sample design. This<br />
<strong>of</strong>fers flexibility and compatibility with complementary sampling ef<strong>for</strong>ts.<br />
West Branch and<br />
Webster Brook-<br />
Inaccessible<br />
Brown's Mill <strong>to</strong> Howland<br />
Headwaters <strong>to</strong> Guil<strong>for</strong>d<br />
Guil<strong>for</strong>d <strong>to</strong> Moosehead Manufacturing<br />
Veazie <strong>to</strong> Verona Island<br />
Headwaters <strong>to</strong> Weldon<br />
Mil<strong>for</strong>d <strong>to</strong> Veazie<br />
Medway <strong>to</strong> Weldon<br />
West Enfield <strong>to</strong> Mil<strong>for</strong>d<br />
Gilman <strong>to</strong> Stillwater<br />
Weldon <strong>to</strong> West Enfield<br />
Gilman <strong>to</strong> West Lowell Tannery<br />
Modeled Habitat<br />
PenPanel Every Year<br />
<br />
Figure 3. Multi-year panel probability sampling design <strong>for</strong> juvenile Atlantic<br />
salmon assessment in <strong>the</strong> Penobscot basin.<br />
Establishing a sampling design is <strong>of</strong> paramount importance. This should be<br />
established be<strong>for</strong>e major management activities take place under this plan. The<br />
program <strong>to</strong> generate <strong>the</strong> sampling designs has been created. The next step is <strong>to</strong><br />
PRFP Page 194<br />
panel<br />
OverSamp<br />
Year_1<br />
Year_2<br />
Year_3<br />
Year_Every
incorporate fur<strong>the</strong>r refinements until <strong>the</strong> design takes in<strong>to</strong> account <strong>the</strong> many fac<strong>to</strong>rs<br />
that influence sampling in <strong>the</strong> Penobscot basin.<br />
Penobscot Watershed Survey Design<br />
Description <strong>of</strong> Sample Design <strong>for</strong> Panel Design<br />
Target population: All perennial streams/rivers in <strong>the</strong> Penobscot basin, with <strong>the</strong> exception<br />
<strong>of</strong> <strong>the</strong> West Branch Penobscot and Webster Brook, which are both inaccessible <strong>to</strong><br />
Atlantic salmon.<br />
Sample Frame: GIS stream network coverage from NHD High resolution dataset<br />
developed by USGS. In addition, Atlantic salmon habitat modeled data based on<br />
NHD High was used <strong>for</strong> attribute data.<br />
Survey Design: A Generalized Random Tessellation Stratified (GRTS) survey design <strong>for</strong> a<br />
linear stream resource was used. The GRTS design includes reverse hierarchical<br />
ordering <strong>of</strong> <strong>the</strong> selected sites.<br />
Multi-density categories: Estimated stream widths based on hydrologic curves: 0-12, 12-24,<br />
and >24 m.<br />
Stratification: Stratify by Dam Reaches- portions <strong>of</strong> <strong>the</strong> basin sharing <strong>the</strong> same damrelated<br />
mortality <strong>for</strong> migrating smolts and adult Atlantic salmon.<br />
Panels: Three panels. Year_1 sites will be visited in year 1 and <strong>the</strong>n year 4, year 7,<br />
etc. Year_2 sites will be visited in year 2, year 5, year 8, etc. Year_3 sites will be<br />
visited in year 3, year 6, year 9, etc. Year_Every sites will be visited every year.<br />
Expected sample size: Ten sites per strata annually with an additional 10 rotating sites <strong>for</strong> a<br />
<strong>to</strong>tal <strong>of</strong> 20 annually per strata. Sampling distributed across stream width classes as<br />
"0-12"=15, "12-24"=15, ">24"=10.<br />
Oversample: 80 sites<br />
Site Use: The base design has 20 sites per stratum per year. Sites are listed in SiteID<br />
order and must be used in that order. All sites that occur prior <strong>to</strong> <strong>the</strong> last site used<br />
must have been evaluated <strong>for</strong> use and <strong>the</strong>n ei<strong>the</strong>r sampled or reason documented<br />
why that site was not used. As an example, if 30 sites are <strong>to</strong> be sampled in <strong>the</strong><br />
stratum, <strong>the</strong>n <strong>the</strong> first 30 sites in SiteID order would be used.<br />
Sample Frame Summary<br />
The <strong>to</strong>tal stream length (km) is 9976.5296 km.<br />
Stream length by Strata and Stream Class<br />
Stream<br />
Class<br />
Above<br />
Medway<br />
Brown's Mill<br />
<strong>to</strong> Howland<br />
Gilman <strong>to</strong><br />
Stillwater<br />
Gilman <strong>to</strong><br />
West Lowell<br />
Tannery<br />
Guil<strong>for</strong>d <strong>to</strong><br />
Moosehead<br />
Manufacturing<br />
PRFP Page 195
30 NA 108.08662 NA 23.64797 13.455749<br />
0-6 94.56231 1551.32447 269.754624 314.95553 83.686235<br />
6-18 12.45829 99.26386 29.218764 35.65461 1.097471<br />
18-24 8.78391 42.84213 4.493776 37.87435 NA<br />
24-30 NA 31.43446 18.43036 NA NA<br />
6-12 8.40795 202.84437 81.619907 62.01569 8.833266<br />
Sum 124.21246 2035.7959 403.517431 474.14814 107.072721<br />
Class<br />
Headwaters<br />
<strong>to</strong> Guil<strong>for</strong>d<br />
Headwaters<br />
<strong>to</strong> Weldon<br />
Medway <strong>to</strong><br />
Weldon<br />
Mil<strong>for</strong>d <strong>to</strong><br />
Veazie<br />
Veazie <strong>to</strong> Verona<br />
Island<br />
>30 14.59095 55.41505 NA 22.3422364 29.41184<br />
0-6 550.54023 1036.99794 96.5451132 156.4940706 789.92491<br />
6-18 27.22903 42.39188 0.8700078 0.5296745 61.75123<br />
18-24 15.43992 11.51391 2.7975842 NA 20.89443<br />
24-30 11.77406 11.65105 NA NA 32.77084<br />
6-12 50.8037 137.29964 12.5826661 20.1374415 240.40878<br />
Sum 670.37789 1295.26947 112.7953713 199.503423 1175.16202<br />
Class<br />
Weldon <strong>to</strong><br />
West Enfield<br />
West Ernfield<br />
<strong>to</strong> Mil<strong>for</strong>d Sum<br />
>30 97.26506 8.36267 372.5781<br />
0-6 2165.72194 342.19826 7452.7056<br />
6-18 117.4552 36.09102 464.011<br />
18-24 57.86753 16.40395 218.9115<br />
24-30 18.61077 15.69942 140.371<br />
6-12 374.26756 128.73143 1327.9524<br />
Sum 2831.18806 547.48675 9976.5296<br />
Site Selection Summary<br />
Number <strong>of</strong> Sites<br />
mdcaty OverSamp Year_1 Year_2 Year_3 Year_Every Sum<br />
0-12 310 45 38 33 39 465<br />
12-24 293 35 41 41 35 445<br />
>24 197 20 21 26 26 290<br />
Sum 800 100 100 100 100 1200<br />
Description <strong>of</strong> Sample Design Output:<br />
The sites are provided as a shapefile that can be read directly by ArcMap. The dbf<br />
file associated with <strong>the</strong> shapefile may be read by Excel.<br />
The dbf file has <strong>the</strong> following variable definitions:<br />
Variable Name Description<br />
SiteID Unique site identification (character)<br />
arcid Internal identification number<br />
x Albers x-coordinate<br />
y Albers y-coordinate<br />
mdcaty Multi-density categories used <strong>for</strong> unequal probability selection<br />
weight Weight (in meters), inverse <strong>of</strong> inclusion probability, <strong>to</strong> be used<br />
PRFP Page 196
in statistical analyses<br />
stratum Strata used in <strong>the</strong> survey design<br />
panel Identifies base sample by panel name and Oversample by<br />
OverSamp<br />
auxiliary variables Remaining columns are from <strong>the</strong> sample frame provided<br />
Projection In<strong>for</strong>mation<br />
No projection in<strong>for</strong>mation available. Uses <strong>the</strong> projection <strong>of</strong> <strong>the</strong> ArcMap project.<br />
Evaluation Process<br />
The survey design weights that are given in <strong>the</strong> design file assume that <strong>the</strong> survey<br />
design is implemented as designed. That is, only <strong>the</strong> sites that are in <strong>the</strong> base<br />
sample (not in <strong>the</strong> over sample) are used, and all <strong>of</strong> <strong>the</strong> base sites are used. This<br />
may not occur due <strong>to</strong> (1) sites not being a member <strong>of</strong> <strong>the</strong> target population, (2)<br />
landowners deny access <strong>to</strong> a site, (3) a site is physically inaccessible (safety<br />
reasons), or (4) site not sampled <strong>for</strong> o<strong>the</strong>r reasons. Typically, users prefer <strong>to</strong><br />
replace sites that can not be sampled with o<strong>the</strong>r sites <strong>to</strong> achieve <strong>the</strong> sample size<br />
planned. The site replacement process is described above. When sites are<br />
replaced, <strong>the</strong> survey design weights are no longer correct and must be adjusted.<br />
The weight adjustment requires knowing what happened <strong>to</strong> each site in <strong>the</strong> base<br />
design and <strong>the</strong> over sample sites. EvalStatus is initially set <strong>to</strong> “NotEval” <strong>to</strong> indicate<br />
that <strong>the</strong> site has yet <strong>to</strong> be evaluated <strong>for</strong> sampling. When a site is evaluated <strong>for</strong><br />
sampling, <strong>the</strong>n <strong>the</strong> EvalStatus <strong>for</strong> <strong>the</strong> site must be changed. Recommended codes<br />
are:<br />
EvalStatus<br />
Code<br />
Name Meaning<br />
TS Target Sampled site is a member <strong>of</strong> <strong>the</strong> target population and was<br />
sampled<br />
LD Landowner Denial landowner denied access <strong>to</strong> <strong>the</strong> site<br />
PB Physical Barrier physical barrier prevented access <strong>to</strong> <strong>the</strong> site<br />
NT Non-Target site is not a member <strong>of</strong> <strong>the</strong> target population<br />
NN Not Needed site is a member <strong>of</strong> <strong>the</strong> over sample and was not<br />
evaluated <strong>for</strong> sampling<br />
O<strong>the</strong>r codes Many times useful <strong>to</strong> have o<strong>the</strong>r codes. For example,<br />
ra<strong>the</strong>r than use NT, may use specific codes indicating<br />
why <strong>the</strong> site was non-target.<br />
Statistical Analysis<br />
Any statistical analysis <strong>of</strong> data must incorporate in<strong>for</strong>mation about <strong>the</strong> moni<strong>to</strong>ring<br />
survey design. In particular, when estimates <strong>of</strong> characteristics <strong>for</strong> <strong>the</strong> entire target<br />
population are computed, <strong>the</strong> statistical analysis must account <strong>for</strong> any stratification<br />
or unequal probability selection in <strong>the</strong> design. Procedures <strong>for</strong> doing this are<br />
available from <strong>the</strong> Aquatic Resource Moni<strong>to</strong>ring web page given in <strong>the</strong> bibliography.<br />
A statistical analysis library <strong>of</strong> functions is available from <strong>the</strong> web page <strong>to</strong> do<br />
common population estimates in <strong>the</strong> statistical s<strong>of</strong>tware environment R.<br />
For fur<strong>the</strong>r in<strong>for</strong>mation, contact<br />
Gregory Mackey<br />
Fisheries Scientist<br />
Bureau <strong>of</strong> Sea Run Fisheries and Habitat<br />
PRFP Page 197
Maine Department <strong>of</strong> Marine Resources<br />
Regular Mail<br />
172 State House Station<br />
Augusta, Maine 04333<br />
UPS/Fed Express<br />
6 Beech Street<br />
Hallowell, Maine 04347<br />
(207) 624-6358 voice<br />
(207) 287-9975 fax<br />
Bibliography:<br />
Stevens, Jr., D. L., D. P. Larsen, and A. R. Olsen. 2007. The role <strong>of</strong> sample<br />
surveys: Why should practitioners consider using a statistical sampling design? in D.<br />
H. Johnson, B. M. Shrier, J. S. O’Neal, J. A. Knutzen, X. Augerot, T. A. O’Neal, and<br />
T. N. Pearsons. Salmonidfield pro<strong>to</strong>cols handbook: techniques <strong>for</strong> assessing status<br />
and trends in salmon and trout populations. American Fisheries Society, Be<strong>the</strong>sda,<br />
Maryland.<br />
Stevens, D. L., Jr., and A. R. Olsen. 2004. Spatially-balanced sampling <strong>of</strong> natural<br />
resources in <strong>the</strong> presence <strong>of</strong> frame imperfections. Journal <strong>of</strong> American Statistical<br />
Association. 99. 262-278.<br />
Hayes, D., E. Baker, R. Bednarz, D. Borgeson, Jr., J. Braunscheidel, J, Breck, M.<br />
Brennigan, A. Harring<strong>to</strong>n, R. Hay, R. Lockwood, A. Nuhfer, J. Schneider, p.<br />
Seelbach, J. Waybrant, and T. Zorn. 2003. Developing a standardized sampling<br />
program: The Michigan experience. Fisheries. 28. 18-25.<br />
Diaz-Ramos, S., D. L. Stevens, Jr, and A. R. Olsen. 1996. EMAP Statistical Methods<br />
Manual. EPA/620/R-96/002, U.S. Environmental Protection Agency, Office <strong>of</strong><br />
Research and Development, NHEERL-Western Ecology Division, Corvallis, Oregon.<br />
Web Page: http://www.epa.gov/nheerl/arm<br />
PRFP Page 198
Appendix I – Downstream Passage Studies <strong>for</strong> Atlantic Salmon<br />
Author: Norm Dubé<br />
RESULTS OF DOWNSTREAM PASSAGE<br />
STUDIES FOR ATLANTIC SALMON,<br />
PENOBSCOT RIVER, MAINE<br />
MATTACEUK (WELDON) (FERC No. 2520)<br />
Project Description<br />
Project Works: 657’ long x 40’ high ogee spillway including 4’ high flashboards;<br />
roller gate 90’ long x 19’ high <strong>to</strong> control spills and headpond levels.<br />
Turbines: 4 Turbine Type: 2 fixed blade, 2 Kaplan<br />
Generating Capacity: 19.2 MW<br />
Hydraulic Capacity: 7,000 cfs<br />
Downstream Passage System<br />
Years Studied: 1987 – 1999 Life Stages Studied: smolts, kelts<br />
Permanent Bypass System: 1) single surface inlets integral with trashracks on two<br />
<strong>of</strong> four turbine <strong>for</strong>ebays <strong>for</strong> fish collection; 2) strobe lights in remaining two <strong>for</strong>ebays<br />
<strong>for</strong> fish repulsion; 3) one-inch clear spacing overlay trashracks <strong>to</strong> depth <strong>of</strong> 16 feet at<br />
full pond at all four turbine intakes <strong>to</strong> discourage fish entrainment; 4) a 42-inch<br />
underground fish passage pipe <strong>for</strong> transport <strong>of</strong> collected fish <strong>to</strong> <strong>the</strong> tailrace area.<br />
System installed in 1992.<br />
Study Methods: Radio telemetry; in-line moni<strong>to</strong>ring facility at passage pipe<br />
Collection Efficiency: Smolts -17% - 59%; six years combined – 38% (N = 155)<br />
Kelts – 63% (fall studies, three years, N = 8)<br />
Kelts – 76% (spring studies, three years, N = 25)<br />
Turbine Survival: Not studied; estimated at 1) 95% <strong>for</strong> smolts (Truebe, J. and M.<br />
Drooker. 1985. A Summary <strong>of</strong> State <strong>of</strong> <strong>the</strong> Art Methods <strong>for</strong> Passage <strong>of</strong> Downstream<br />
Migrating Salmon With Application <strong>to</strong> <strong>the</strong> Great Nor<strong>the</strong>rn Paper Weldon Station,<br />
Mattaceunk Project, Penobscot River, Maine. FERC No. 2520), and 2) 90% (acute<br />
mortality 10%, smolts, ASAL Model).<br />
Downstream Passage Routes: spillway, roll gate, log sluice, fixed blade propeller<br />
turbines (2), Kaplan turbines (2), downstream passage system.<br />
PRFP Page 199
WEST ENFIELD (FERC No. 2600)<br />
Project Description<br />
Project Works: 363’ long x 39’ high ogee spillway plus 6’ high flashboards; 45’ long<br />
non-overflow spillway; 107’ long gated spillway.<br />
Turbines: 2 Turbine Type: Pit Type (horizontal Kaplan turbines)<br />
Generating Capacity: 13 MW<br />
Hydraulic Capacity: 9,000 cfs<br />
Downstream Passage System<br />
Years Studied: 1990 – 1994 (smolts) Life Stages Studied: smolts; kelts<br />
1990 (kelts)<br />
Permanent Bypass System: weirs (5) plus transport flume; system installed when<br />
project redeveloped in 1988.<br />
Study Methods: radio telemetry<br />
Collection Efficiency: Smolts -2% - 36%; five years combined – 17% (N = 259)<br />
Kelts – 4% (spring study, N = 23)<br />
Turbine Survival: 97.7% (acute mortality 2.3%, smolts, Shepard 1993); estimated<br />
at 95% (acute mortality 5%, smolts, ASAL Model).<br />
Downstream Passage Routes: turbines, downstream passage system, spillway,<br />
and gates<br />
PRFP Page 200
MILFORD (FERC No. 2534)<br />
Project Description<br />
Project Works: 1,159’ long x 20’ high concrete gravity spillway plus 4.5’ high<br />
flashboards; 25’ wide concrete sluiceway and gate.<br />
Turbines: 4 Turbine Type: Kaplan (3); fixed blade (1)<br />
Generating Capacity: 6.4 MW<br />
Hydraulic Capacity: 5,200 cfs<br />
Downstream Passage System<br />
Years Studied: 1989 – 1990 (smolts) Life Stages Studied: smolts; kelts<br />
1988 – 1989 (kelts)<br />
Permanent Bypass System: No dedicated downstream bypass system at time <strong>of</strong><br />
studies; angled rack guidance system <strong>to</strong> direct downstream migrants <strong>to</strong> and through<br />
an empty turbine pit has since been deployed. System has not been studied.<br />
Study Methods: radio telemetry<br />
Collection Efficiency: Smolts – N/A; 41% turbine passage; 59% spillway passage;<br />
(N = 68)<br />
Kelts – N/A; 100% spillway passage; spring studies only,<br />
(N = 30)<br />
Turbine Survival: Not studied; estimated at 91% (acute mortality 9%, smolts, ASAL<br />
Model).<br />
Downstream Passage Routes: turbines, spillway, gates, and downstream passage<br />
system<br />
PRFP Page 201
VEAZIE (FERC No. 2403)<br />
Project Description<br />
Project Works: 902’ long x 25’ high concrete buttress spillway including 6.5’<br />
Obermeyer inflatable flashboard system; approximately 240’ long x 25’ high concrete<br />
<strong>for</strong>ebay including 3.5’ (approximate) high fixed flashboards.<br />
Turbines: 15 (Station A); 2 (Station B) Turbine Type: Station A: vertical Francis<br />
(15); Station B: vertical fixed blade (2)<br />
Generating Capacity: 5.4 MW (Station A); 3.0 MW (Station B)<br />
Hydraulic Capacity: 7,525 cfs<br />
Downstream Passage System<br />
Years Studied: 1989 – 1990 (smolts) Life Stages Studied: smolts; kelts<br />
1988 – 1989 (kelts)<br />
Permanent Bypass System: No dedicated downstream bypass system; attempts<br />
have been made <strong>to</strong> utilize trash gate/ice sluice as downstream bypass route <strong>for</strong><br />
smolts with limited success. Studies were undertaken when main spillway had 6.5’<br />
hinged wooden flashboards (i.e. prior <strong>to</strong> installation <strong>of</strong> Obermeyer system).<br />
Study Methods: radio telemetry<br />
Collection Efficiency: Smolts – N/A; 29% turbine passage; 71% spillway/ice sluice<br />
passage; (N = 42)<br />
Kelts – N/A; 100% spillway passage; spring studies only<br />
(N = 30)<br />
Turbine Survival: Not studied; estimated at 91% (acute mortality 9%, smolts, ASAL<br />
Model).<br />
Downstream Passage Routes: turbines, spillway, <strong>for</strong>ebay, trash gate, and ice<br />
sluice<br />
Note: downstream passage data collected <strong>for</strong> o<strong>the</strong>r projects in <strong>the</strong> lower Penobscot<br />
system (Stillwater, Orono, Great Works) but did not study specific downstream<br />
passage routes, ra<strong>the</strong>r only moni<strong>to</strong>red passage by <strong>the</strong> project.<br />
DOWNSTREAM PASSAGE STUDIES AT HYDROPOWER DAMS, PENOBSCOT<br />
RIVER, MAINE, 1987-1999<br />
(Atlantic Salmon)<br />
PRFP Page 202
Bangor-Pacific Hydro Associates. 1993. 1992 Evaluation <strong>of</strong> Downstream Fish<br />
Passage Facilities at <strong>the</strong> West Enfield Project (FERC No. 2600). 11 pp. +<br />
Appendices.<br />
Bangor-Pacific Hydro Associates. 1993. 1993 Evaluation <strong>of</strong> Downstream Fish<br />
Passage Facilities at <strong>the</strong> West Enfield Project (FERC No. 2600). 20 pp. +<br />
Appendices.<br />
Bangor-Pacific Hydro Associates. 1994. 1994 Evaluation <strong>of</strong> Downstream Fish<br />
Passage Facilities at <strong>the</strong> West Enfield Project (FERC No. 2600). 18 pp. +<br />
Appendices.<br />
Great Nor<strong>the</strong>rn Paper, Inc. 1987. 1987 Report on Downstream Passage <strong>of</strong> Atlantic<br />
Salmon Smolts and Kelts at Weldon Dam. Mattaceunk Project, FERC No. 2520.<br />
Great Nor<strong>the</strong>rn Paper, Inc., Millinocket, Maine. 32 pp. + Appendices.<br />
Great Nor<strong>the</strong>rn Paper, Inc. 1988. 1988 Report on Downstream Passage <strong>of</strong> Atlantic<br />
Salmon Smolts and Kelts at Weldon Dam. Great Nor<strong>the</strong>rn Paper, Inc., Millinocket,<br />
Maine. x + 90 pp. + Appendices.<br />
Great Nor<strong>the</strong>rn Paper, Inc. 1989. 1989 Report on Downstream Passage <strong>of</strong> Atlantic<br />
Salmon Smolts and Kelts at Weldon Dam. Great Nor<strong>the</strong>rn Paper, Inc., Millinocket,<br />
Maine. xi + 94 pp. + Appendices.<br />
Great Nor<strong>the</strong>rn Paper, Inc. 1990. 1990 Report on Downstream Passage <strong>of</strong> Atlantic<br />
Salmon Smolts and Kelts at Weldon Dam. Great Nor<strong>the</strong>rn Paper, Inc., Millinocket,<br />
Maine. 10 pp. + Appendices.<br />
Great Nor<strong>the</strong>rn Paper, Inc. 1992. 1991-1992 Report on <strong>the</strong> Effectiveness <strong>of</strong> Interim<br />
Downstream Passage Facilities <strong>for</strong> Atlantic Salmon Smolts and Kelts at Weldon<br />
Dam. Mattaceunk Project. FERC No. 2520. Great Nor<strong>the</strong>rn Paper, Inc., Millinocket,<br />
Maine. vi + 22 pp. + Appendices.<br />
Great Nor<strong>the</strong>rn Paper, Inc. 1993. 1993 Report on <strong>the</strong> Effectiveness <strong>of</strong> Permanent<br />
Downstream Passage Facilities <strong>for</strong> Atlantic Salmon at Weldon Dam. Mattaceunk<br />
Project. FERC No. 2520. Great Nor<strong>the</strong>rn Paper, Inc., Millinocket, Maine. ii + 54 pp. +<br />
Appendices.<br />
Great Nor<strong>the</strong>rn Paper, Inc. 1994. 1994 Report on <strong>the</strong> Effectiveness <strong>of</strong> Permanent<br />
Downstream Passage Facilities <strong>for</strong> Atlantic Salmon at Weldon Dam. Mattaceunk<br />
Project. FERC No. 2520. Great Nor<strong>the</strong>rn Paper, Inc., Millinocket, Maine. ii + 61 pp. +<br />
Appendices.<br />
Great Nor<strong>the</strong>rn Paper, Inc. 1995. 1995 Report on <strong>the</strong> Effectiveness <strong>of</strong> <strong>the</strong><br />
Permanent Downstream Passage System <strong>for</strong> Atlantic Salmon Weldon Dam.<br />
PRFP Page 203
Mattaceunk Project. FERC No. 2520. Great Nor<strong>the</strong>rn Paper, Inc., Millinocket, Maine.<br />
ii + 78 pp. + Appendices.<br />
Great Nor<strong>the</strong>rn Paper, Inc. 1997. 1997 Report on <strong>the</strong> Effectiveness <strong>of</strong> <strong>the</strong><br />
Permanent Downstream Passage System <strong>for</strong> Atlantic Salmon at Weldon Dam.<br />
Mattaceunk Project. FERC No. 2520. Great Nor<strong>the</strong>rn Paper, Inc., Millinocket, Maine.<br />
ii + 61 pp. + Appendices.<br />
Great Nor<strong>the</strong>rn Paper, Inc. 1998. 1998 Report on <strong>the</strong> Effectiveness <strong>of</strong> <strong>the</strong><br />
Permanent Downstream Passage System <strong>for</strong> Atlantic Salmon at Weldon Dam. Great<br />
Nor<strong>the</strong>rn Paper, Inc., Millinocket, Maine. iii + 36 pp. + Appendices.<br />
Great Nor<strong>the</strong>rn Paper, Inc. 1999. 1999 Report on <strong>the</strong> Effectiveness <strong>of</strong> Permanent<br />
Downstream Passage Facilities <strong>for</strong> Atlantic Salmon Weldon Dam. Mattaceunk<br />
Project, FERC No. 2520. Great Nor<strong>the</strong>rn Paper, Inc., Millinocket, Maine. 32 pp. +<br />
Appendices.<br />
Hall, S.D. and S.L. Shepard. 1990a. 1989 Progress Report <strong>of</strong> Atlantic Salmon Kelt<br />
Radio Telemetry Investigations on <strong>the</strong> Lower Penobscot River. Bangor Hydro-<br />
Electric Co., Bangor, Maine. 30 pp.<br />
Hall, S.D. and S.L. Shepard. 1990b. Report <strong>for</strong> 1989 Evaluation Studies <strong>of</strong><br />
Upstream and Downstream Facilities at <strong>the</strong> West Enfield Project (FERC No. 2600).<br />
Bangor-Pacific Hydro Associates. 17 pp. + Appendices.<br />
Shepard, S.L. 1988. 1988 Progress Report: Atlantic Salmon Kelt Radio Telemetry<br />
Investigations in <strong>the</strong> Lower Penobscot River. Bangor Hydro-Electric Co., 32 pp. +<br />
Appendices<br />
Shepard, S.L. 1991a. Report on Radio Telemetry Investigations <strong>of</strong> Atlantic Salmon<br />
Smolt Migration in <strong>the</strong> Penobscot River. Bangor Hydro-Electric Co., 38 pp. +<br />
Appendices.<br />
Shepard, S.L. 1991b. Evaluation <strong>of</strong> Upstream and Downstream Fish Passage<br />
Facilities at <strong>the</strong> West Enfield Project (FERC No. 2600). Bangor-Pacific Hydro<br />
Associates, 25 pp. + Appendices. (Note: fall 1989 and spring 1990 studies).<br />
Shepard, S.L. 1991c. Evaluation <strong>of</strong> Upstream and Downstream Fish Passage<br />
Facilities at <strong>the</strong> West Enfield Project (FERC No. 2600). Bangor-Pacific Hydro<br />
Associates, 27 pp. + Appendices. (Note: spring and fall 1991 studies).<br />
Shepard, S.L. 1993. Survival and Timing <strong>of</strong> Atlantic Salmon Smolts Passing <strong>the</strong><br />
West Enfield Hydroelectric Project. Bangor-Pacific Hydro Associates. 27 pp.<br />
PRFP Page 204
Shepard, S.L. and S.D. Hall. 1991. Final Report: Adult Atlantic Salmon Radio<br />
Telemetry Studies in <strong>the</strong> Penobscot River. Bangor Hydro-Electric Co., 49 pp. +<br />
Appendices.<br />
PRFP Page 205
Appendix J – Nor<strong>the</strong>rn Pike Risk Assessment <strong>for</strong> Piscataquis River<br />
Authors: Melissa Laser (edi<strong>to</strong>r), Fred Seavey (USFWS), Richard Dill (MDIFW), Merry Gallagher (MDIFW), Tim<br />
Obrey (MDIFW), Jeff Reardon (Penobscot Trust), Rory Saunders (NOAA), Tara Trinko (NOAA)<br />
Introduction<br />
The Penobscot River is New England's second largest river, with a watershed that<br />
covers about a third <strong>of</strong> <strong>the</strong> State <strong>of</strong> Maine (approximately 22,300 km 2 ; 8,600 mi 2 ). It<br />
is 563 km long (350 miles) and has a <strong>to</strong>tal fall <strong>of</strong> 488 m (1,770 feet) from its highest<br />
point, Penobscot Lake. There are diverse aquatic environments in <strong>the</strong> watershed<br />
with over 2,575 km (1,600 miles) <strong>of</strong> streams and rivers and more than 625 lakes and<br />
ponds with a <strong>to</strong>tal surface area <strong>of</strong> 103,036 ha (254,600 acres). For thousands <strong>of</strong><br />
years, diadromous fishes migrated through much <strong>of</strong> <strong>the</strong> basin, providing a<br />
connection between <strong>the</strong> Gulf <strong>of</strong> Maine and inland terrestrial and aquatic ecosystems.<br />
Since 1959, multiple reports have documented <strong>the</strong> issues facing diadromous fish<br />
res<strong>to</strong>ration in <strong>the</strong> Penobscot drainage.<br />
In 2006, <strong>the</strong> Maine Departments <strong>of</strong> Inland Fisheries and Wildlife (MDIFW) and<br />
Marine Resources (MDMR) began work on a strategic plan <strong>to</strong> res<strong>to</strong>re diadromous<br />
fish in support <strong>of</strong> <strong>the</strong> Penobscot River <strong>Res<strong>to</strong>ration</strong> Project (PRRP). The overarching<br />
goal <strong>of</strong> <strong>the</strong> Penobscot River diadromous fish res<strong>to</strong>ration strategy is <strong>to</strong> res<strong>to</strong>re and<br />
guide <strong>the</strong> management <strong>of</strong> diadromous fish populations, aquatic resources and <strong>the</strong><br />
ecosystems on which <strong>the</strong>y depend, <strong>for</strong> <strong>the</strong>ir intrinsic, ecological, economic,<br />
recreational, scientific, and educational values <strong>for</strong> use by <strong>the</strong> public. At least 85<br />
species <strong>of</strong> fish inhabit <strong>the</strong> Penobscot River basin (Baum 1983). Thirty-five are found<br />
in marine or estuarine waters, 33 occur in freshwater, five species <strong>to</strong>lerate a range <strong>of</strong><br />
salinities, and 12 are diadromous species that migrate between marine and<br />
freshwater habitats. All <strong>of</strong> <strong>the</strong> fishes are native <strong>to</strong> Maine with <strong>the</strong> exception <strong>of</strong> eight<br />
freshwater species. Since 1983, black crappie, green sunfish, largemouth bass,<br />
central mudminnow, white catfish, and nor<strong>the</strong>rn pike have been illegally introduced<br />
in<strong>to</strong> <strong>the</strong> Penobscot basin. Brown trout, an exotic species native <strong>to</strong> Europe, is<br />
currently s<strong>to</strong>cked by MDIFW <strong>for</strong> recreational fishing in one body <strong>of</strong> water located<br />
above a set <strong>of</strong> falls impassable <strong>to</strong> all species <strong>of</strong> fish but Atlantic salmon. Chain<br />
pickerel and smallmouth bass, managed by MDIFW as sportfish, were introduced<br />
in<strong>to</strong> Maine waters in <strong>the</strong> 1800s and have been spread legally and illegally throughout<br />
<strong>the</strong> basin. Landlocked salmon, rainbow smelt, lake trout and white perch are native<br />
<strong>to</strong> <strong>the</strong> Penobscot basin, but <strong>the</strong>ir range has been artificially expanded. This<br />
res<strong>to</strong>ration strategy focuses on native diadromous fishes, which are all currently at<br />
less than 1% <strong>of</strong> his<strong>to</strong>ric levels.<br />
Nor<strong>the</strong>rn pike is a non-native invasive species that has high potential <strong>for</strong> negative<br />
ecological impacts on native species. Management objectives <strong>to</strong> contain or eradicate<br />
this species within <strong>the</strong> Penobscot watershed may be in direct conflict with <strong>the</strong><br />
objectives <strong>of</strong> <strong>the</strong> diadromous fish res<strong>to</strong>ration strategy. This conflict is most apparent<br />
in actions relating <strong>to</strong> fish passage. The Howland by-pass, one aspect <strong>of</strong> <strong>the</strong> PRRP,<br />
will allow diadromous species access <strong>to</strong> <strong>the</strong> Piscataquis drainage but also opens <strong>the</strong><br />
drainage <strong>to</strong> natural dispersal <strong>of</strong> nor<strong>the</strong>rn pike.<br />
PRFP Page 206
Options under <strong>the</strong> Multiparty Settlement Agreement (MPA) were a bypass channel<br />
without trap and sort facilities, or removal <strong>of</strong> <strong>the</strong> dam. Construction <strong>of</strong> <strong>the</strong> bypass<br />
channel ra<strong>the</strong>r than dam removal was <strong>the</strong> preferred alternative by <strong>the</strong> res<strong>to</strong>ration<br />
parties as engineering design and hydraulic modeling showed a bypass channel<br />
could be constructed and provide free-swim upstream and downstream passage at<br />
<strong>the</strong> Howland dam, ra<strong>the</strong>r than necessitating dam removal. Thorough evaluation and<br />
engineering design <strong>of</strong> trap and sort facilities <strong>to</strong> prevent fur<strong>the</strong>r upstream movements<br />
<strong>of</strong> pike in<strong>to</strong> <strong>the</strong> Piscataquis River drainage through <strong>the</strong> bypass channel<br />
were conducted concurrently. This evaluation determined trap and sort facilities <strong>to</strong><br />
be unfeasible in meeting res<strong>to</strong>ration goals.<br />
The fisheries agencies and o<strong>the</strong>r parties agreed <strong>to</strong> undertake a <strong>for</strong>mal risk<br />
assessment <strong>of</strong> potential pike movements through <strong>the</strong> channel and in<strong>to</strong> upstream<br />
sub-drainages. This risk assessment seeks <strong>to</strong> document <strong>the</strong> timeline <strong>of</strong> events<br />
relating <strong>to</strong> <strong>the</strong> documentation <strong>of</strong> pike and <strong>the</strong> PRRP, <strong>the</strong> ecological risk <strong>of</strong> pike on<br />
native species, patterns <strong>of</strong> natural dispersal and human introductions, and focus<br />
areas <strong>for</strong> action. The section concludes with management actions <strong>to</strong> reduce <strong>the</strong><br />
impact <strong>of</strong> pike above <strong>the</strong> Howland bypass.<br />
Background<br />
In June 2004, PPL Corporation (PPL), state and federal resource agencies, <strong>the</strong><br />
Penobscot Indian Nation (PIN), and various NGOs, signed <strong>the</strong> Lower Penobscot<br />
River Multiparty Settlement Agreement (MPA), which led <strong>to</strong> <strong>the</strong> Penobscot River<br />
<strong>Res<strong>to</strong>ration</strong> Project (PRRP). This unprecedented and his<strong>to</strong>ric agreement provides<br />
<strong>the</strong> Penobscot River <strong>Res<strong>to</strong>ration</strong> Trust (Trust), a non-pr<strong>of</strong>it organization, <strong>the</strong> option<br />
<strong>to</strong> purchase three dams from PPL, decommission and remove <strong>the</strong> two lowermost<br />
dams on <strong>the</strong> main stem <strong>of</strong> <strong>the</strong> river (Veazie and Great Works), and decommission<br />
and pursue construction <strong>of</strong> an innovative experimental fish bypass around <strong>the</strong><br />
Howland dam, located upstream on <strong>the</strong> Piscataquis River.<br />
Under <strong>the</strong> Multi Party Agreement (MPA), <strong>the</strong> Trust was required <strong>to</strong> seek a “prior<br />
determination” by <strong>the</strong> U.S. Fish and Wildlife Service, <strong>the</strong> Maine Departments <strong>of</strong><br />
Inland Fisheries and Wildlife and Marine Resources, <strong>the</strong> Maine Atlantic Salmon<br />
Commission, and <strong>the</strong> PIN that <strong>the</strong> proposed bypass “will provide safe, timely, and<br />
effective fish passage sufficient <strong>to</strong> allow <strong>the</strong> fisheries management goals and<br />
objectives <strong>of</strong> <strong>the</strong> Resource Agencies and PIN <strong>to</strong> be met.”<br />
During <strong>the</strong> design process, in consultation with <strong>the</strong> fisheries agencies, <strong>the</strong> Trust<br />
developed an “Outline <strong>for</strong> Preliminary Design <strong>of</strong> Proposed Howland Fish Bypass”,<br />
which describes <strong>the</strong> in<strong>for</strong>mation needed by <strong>the</strong> agencies <strong>to</strong> make <strong>the</strong>ir “prior<br />
determination.” At <strong>the</strong> request <strong>of</strong> several agencies, this included <strong>the</strong> following:<br />
The preliminary design will also evaluate <strong>the</strong> feasibility and costs (including<br />
operating costs) <strong>of</strong> incorporating provisions <strong>for</strong> trapping/sorting/counting <strong>of</strong><br />
fish using <strong>the</strong> bypass. This includes measures <strong>to</strong> exclude upstream migration<br />
<strong>of</strong> nor<strong>the</strong>rn pike and black crappie, both <strong>of</strong> which do not now exist above <strong>the</strong><br />
PRFP Page 207
Howland Dam, and are considered by Maine Department <strong>of</strong> Inland Fisheries<br />
and Wildlife <strong>to</strong> be undesirable, non-native invasive species. Under <strong>the</strong> terms<br />
<strong>of</strong> <strong>the</strong> Settlement Agreement, <strong>the</strong> resource agencies are responsible <strong>for</strong><br />
management activities such as trapping/sorting/trucking.<br />
To fulfill that requirement, Milone and MacBroom, <strong>the</strong> Trust’s design consultant, subcontracted<br />
with Stantec <strong>to</strong> complete an evaluation <strong>of</strong> <strong>the</strong> feasibility and potential<br />
costs <strong>of</strong> incorporating a trap and sort facility in<strong>to</strong> <strong>the</strong> bypass channel. Stantec’s final<br />
report is attached. (Appendix A: Trapping/Sorting/Counting Facility Proposed<br />
Bypass Channel Howland Dam, Howland, Maine. May 20, 2008.) In addition <strong>to</strong><br />
completing <strong>the</strong> report, Stantec also participated with <strong>the</strong> Trust in a meeting attended<br />
by representatives <strong>of</strong> <strong>the</strong> US Fish and Wildlife Service, NOAA Fisheries, Maine<br />
Department <strong>of</strong> Marine Resources, Maine Department <strong>of</strong> Inland Fisheries and<br />
Wildlife, and <strong>the</strong> Penobscot Indian Nation on March 24, 2008 <strong>to</strong> discuss <strong>the</strong><br />
feasibility <strong>of</strong> trapping and sorting. A handout summarizing Stantec’s evaluation was<br />
distributed at <strong>the</strong> meeting and is included as Appendix B. The handout summarizes<br />
in<strong>for</strong>mation presented in more detail in <strong>the</strong> May 20 report.<br />
As a result <strong>of</strong> Stantec’s work and consultation with <strong>the</strong> agencies, <strong>the</strong> Trust<br />
determined that a trapping and sorting facility at <strong>the</strong> Howland Bypass could be<br />
designed and constructed, at an additional construction cost <strong>of</strong> $250,000 <strong>to</strong><br />
$500,000, and with annual maintenance and operations costs <strong>of</strong> $75,000 <strong>to</strong><br />
$300,000. The number <strong>of</strong> returning alewives would largely drive <strong>the</strong> maintenance<br />
and operations costs as <strong>the</strong> most abundant species anticipated. In consultation with<br />
<strong>the</strong> state and federal fisheries agencies, <strong>the</strong> Trust, as well as <strong>the</strong> state and federal<br />
fisheries agencies who had been consulted on this matter, determined that installing<br />
a trapping and sorting facility in <strong>the</strong> bypass channel would not be feasible, because:<br />
(1) A trap and sort facility would require design changes <strong>to</strong> <strong>the</strong> proposed bypass<br />
channel that would likely reduce its effectiveness in passing target species,<br />
which, under <strong>the</strong> terms <strong>of</strong> <strong>the</strong> MPA, would make <strong>the</strong> bypass channel “not<br />
feasible” and require <strong>the</strong> Trust <strong>to</strong> seek dam removal.<br />
(2) It was unlikely that <strong>the</strong> facility could be 100% effective in preventing<br />
undesirable species, including nor<strong>the</strong>rn pike, from passing <strong>the</strong> Howland Dam,<br />
because <strong>of</strong> uncertainty about <strong>the</strong> swimming capacity <strong>of</strong> nor<strong>the</strong>rn pike and<br />
concerns that required manual sorting would be subject <strong>to</strong> error due <strong>the</strong> large<br />
number <strong>of</strong> fish that would need <strong>to</strong> be handled. In addition, a trap and sort<br />
facility would do nothing <strong>to</strong> address what is probably <strong>the</strong> most potential vec<strong>to</strong>r<br />
<strong>for</strong> pike introduction in<strong>to</strong> <strong>the</strong> Piscataquis—illegal introductions. The presence<br />
<strong>of</strong> multiple dams in <strong>the</strong> Androscoggin, Kennebec, and Sebasticook<br />
watersheds has not prevented introduction <strong>of</strong> pike in<strong>to</strong> multiple waters <strong>the</strong>re;<br />
(3) The proposed trap and sort facility would have negative impacts on target<br />
species, including migra<strong>to</strong>ry delays, required handling <strong>of</strong> all fish passed,<br />
potential injuries <strong>to</strong> fish that attempted <strong>to</strong> leap <strong>the</strong> barrier, crowding, and <strong>the</strong><br />
need <strong>for</strong> a separate eel passage facility;<br />
(4) Annual maintenance and operations costs would be prohibitive, particularly as<br />
<strong>the</strong> number <strong>of</strong> returning alewives increased.<br />
PRFP Page 208
As a result <strong>of</strong> <strong>the</strong> discussion at <strong>the</strong> March 24 meeting, <strong>the</strong> Trust submitted<br />
Preliminary Design <strong>Plan</strong>s <strong>for</strong> <strong>the</strong> Howland Bypass that did not include a trap and sort<br />
facility <strong>for</strong> <strong>the</strong> agencies review, and requested a letter from each agency containing<br />
its “prior determination” that <strong>the</strong> proposed bypass channel would meet each<br />
agency’s needs. The Trust received a letter on June 17, 2008 from NOAA Fisheries,<br />
and on June 18, 2008 from <strong>the</strong> Penobscot Nation, <strong>the</strong> U.S. Fish and Wildlife Service,<br />
and <strong>the</strong> State <strong>of</strong> Maine (on behalf <strong>of</strong> <strong>the</strong> Maine Department <strong>of</strong> Inland Fisheries and<br />
Wildlife, <strong>the</strong> Maine Department <strong>of</strong> Marine Resources, and <strong>the</strong> Maine Atlantic Salmon<br />
Commission). All state and federal agencies concurred in <strong>the</strong> design <strong>of</strong> <strong>the</strong><br />
bypass—which did not include a trap and sort facility.<br />
The letter from <strong>the</strong> State <strong>of</strong> Maine stated that:<br />
“The State resource agencies do have concerns about <strong>the</strong> impact <strong>of</strong> invasive fish<br />
species such as nor<strong>the</strong>rn pike that are found in <strong>the</strong> lower reaches <strong>of</strong> <strong>the</strong> Penobscot.<br />
The agencies have agreed not <strong>to</strong> require a trap-and-sort facility at <strong>the</strong> proposed<br />
Howland Bypass, however ongoing strategic and operational planning may identify<br />
<strong>the</strong> need <strong>for</strong> additional upstream barriers <strong>to</strong> prevent <strong>the</strong> spread <strong>of</strong> invasive fish<br />
species in<strong>to</strong> native salmonid habitat.”<br />
Timeline<br />
Action <strong>Plan</strong> For Managing Invasive Aquatic Species<br />
In <strong>the</strong> late 1990s, concerns over invasive plants and nuisance species in Maine<br />
began <strong>to</strong> grow with <strong>the</strong> introduction <strong>of</strong> milfoil in<strong>to</strong> several waters in sou<strong>the</strong>rn Maine.<br />
There were also an increasing number <strong>of</strong> illegal introductions <strong>of</strong> fish species,<br />
particularly nor<strong>the</strong>rn pike, black crappie, smallmouth bass and largemouth bass in<br />
many waters in sou<strong>the</strong>rn and central Maine.<br />
In response, <strong>the</strong> 120 th Maine State Legislature passed legislation establishing an<br />
interagency task <strong>for</strong>ce on invasive plants and nuisance species. This committee<br />
contains 17 members including <strong>the</strong> commissioners <strong>of</strong> <strong>the</strong> following State agencies:<br />
Environmental Protection, Inland Fisheries and Wildlife, Health and Human<br />
Services, Agriculture, Food and Rural Resources, and Conservation. Twelve<br />
additional public members <strong>of</strong> <strong>the</strong> committee with expertise or interest in this area are<br />
appointed by <strong>the</strong> governor. The task <strong>for</strong>ce was charged with making<br />
recommendations <strong>to</strong> <strong>the</strong> Land and Water Council on <strong>the</strong> following subjects:<br />
A. The importation and transportation <strong>of</strong> invasive aquatic plants and nuisance<br />
species.<br />
B. Moni<strong>to</strong>ring and educational programs aimed at <strong>the</strong> control <strong>of</strong> invasive<br />
aquatic plants and nuisance species.<br />
C. A comprehensive state invasive aquatic plants and nuisance species<br />
management plan that meets <strong>the</strong> requirements <strong>of</strong> <strong>the</strong> National Invasive<br />
Species Act <strong>of</strong> 1996.<br />
D. A statewide inven<strong>to</strong>ry <strong>of</strong> invasive aquatic plants and nuisance species.<br />
PRFP Page 209
E. Methods <strong>to</strong> improve cooperation <strong>of</strong> state, provincial, federal and<br />
nongovernmental agencies in <strong>the</strong> area <strong>of</strong> invasive aquatic plants and<br />
nuisance species.<br />
F. Recommendations on <strong>the</strong> feasibility <strong>of</strong> implementing lake protection<br />
assessment districts that allow residents and owners <strong>of</strong> land within 250<br />
feet <strong>of</strong> inland waters <strong>to</strong> assess <strong>the</strong>mselves <strong>to</strong> raise funds in <strong>the</strong><br />
prevention and control <strong>of</strong> invasive aquatic plants.<br />
G. O<strong>the</strong>r recommendations as necessary <strong>to</strong> control <strong>the</strong> introduction <strong>of</strong><br />
invasive aquatic plants and nuisance species in <strong>the</strong> State.<br />
The task <strong>for</strong>ce was also directed, through this legislation, <strong>to</strong> cooperate with<br />
representatives from federal, state and local agencies and private environmental and<br />
commercial interests in <strong>the</strong> nor<strong>the</strong>astern United States <strong>to</strong> <strong>for</strong>m a nor<strong>the</strong>astern<br />
regional panel <strong>to</strong> establish priorities and coordinate activities <strong>to</strong> prevent <strong>the</strong> spread<br />
<strong>of</strong> milfoil and o<strong>the</strong>r invasive aquatic plants and nuisance species in <strong>the</strong> Nor<strong>the</strong>ast. In<br />
Oc<strong>to</strong>ber 2002, <strong>the</strong> task <strong>for</strong>ce finalized its’ comprehensive action plan <strong>for</strong> managing<br />
invasive species. The action plan notes that Maine must be vigilant <strong>to</strong> prevent<br />
fur<strong>the</strong>r introductions <strong>of</strong> exotic species which can displace native species, reduce<br />
biodiversity, disrupt food webs, and degrade habitats. The action plan lists all<br />
species identified by <strong>the</strong> task <strong>for</strong>ce as undesirable, exotic, invasive species; nor<strong>the</strong>rn<br />
pike are included. The action plan directed <strong>the</strong> Departments <strong>of</strong> Environmental<br />
Protection and Inland Fisheries and Wildlife <strong>to</strong> establish a Rapid Response plan <strong>for</strong><br />
<strong>the</strong> introduction <strong>of</strong> invasive fish species. The rapid response plan was signed in<br />
2006.<br />
Penobscot River <strong>Res<strong>to</strong>ration</strong> Project and Pushaw Lake<br />
Discussions <strong>for</strong> possible removal <strong>of</strong> one or more lower Penobscot River dams <strong>to</strong><br />
facilitate anadromous fisheries res<strong>to</strong>ration began in <strong>the</strong> early and mid 1990s during<br />
deliberations about <strong>the</strong> proposed new Basin Mills Hydroelectric Project at Orono.<br />
In 1997, <strong>for</strong>mal USDOI fish passage prescriptions <strong>for</strong> <strong>the</strong> lower Penobscot<br />
River dams (Veazie, proposed Basin Mills, Orono, Stillwater, Mil<strong>for</strong>d) were filed with<br />
<strong>the</strong> Federal Energy Regula<strong>to</strong>ry Commission (FERC). Following <strong>the</strong>se events,<br />
various options <strong>for</strong> anadromous res<strong>to</strong>ration were <strong>the</strong> subject <strong>of</strong> discussions between<br />
<strong>the</strong>n owner <strong>of</strong> <strong>the</strong> dams Bangor Hydro Electric Company, State and Federal<br />
fisheries agencies, PIN, and a coalition <strong>of</strong> conservation organizations and o<strong>the</strong>r<br />
interested parties.<br />
ASAL population modeling <strong>for</strong> res<strong>to</strong>ration <strong>of</strong> Atlantic salmon was undertaken during<br />
review <strong>of</strong> <strong>the</strong> proposed Basin Mills Project. This modeling indicated that incremental<br />
losses due <strong>to</strong> passage inefficiencies at multiple dams, even with state-<strong>of</strong>-<strong>the</strong>-art<br />
upstream and downstream fish passage facilities, would make it very difficult <strong>to</strong><br />
achieve res<strong>to</strong>ration or maintain a viable salmon population based upon natural<br />
recruitment alone. According <strong>to</strong> <strong>the</strong> model, removal <strong>of</strong> dams <strong>to</strong> provide unrestricted<br />
passage and reduce <strong>the</strong>se losses greatly improved chances <strong>of</strong> successful<br />
res<strong>to</strong>ration.<br />
PRFP Page 210
By 2000, PPL (new owner <strong>of</strong> <strong>the</strong> dams), PIN, State and Federal fisheries agencies<br />
and <strong>the</strong> coalition were continuing discussions on res<strong>to</strong>ration, fish passage and<br />
related requirements under <strong>the</strong> FERC licenses. The Howland Dam (Piscataquis<br />
River) and Enfield Dam (mainstem Penobscot River) were now included. Howland<br />
was due <strong>for</strong> FERC relicensing in 2000 (a new license application was filed in 1998<br />
and under review). Fish passage efficiency studies were being required <strong>for</strong> <strong>the</strong><br />
existing Howland Dam fishway. All parties remained interested in possible reduction<br />
<strong>of</strong> <strong>the</strong> number <strong>of</strong> dams <strong>to</strong> reduce upstream and downstream passage losses<br />
and facilitate res<strong>to</strong>ration potential.<br />
Over <strong>the</strong> next two years serious development continued <strong>to</strong>ward a collaborative<br />
Conceptual Settlement Agreement <strong>to</strong> address Penobscot River fisheries res<strong>to</strong>ration.<br />
Possible removals <strong>of</strong> <strong>the</strong> Veazie and Great Works dams were on <strong>the</strong> table, as was<br />
consideration <strong>of</strong> a bypass channel or dam removal at Howland. PPL, Federal and<br />
State fisheries agencies, PIN, Penobscot Coalition all remained engaged and<br />
committed <strong>to</strong> res<strong>to</strong>ration goals.<br />
In 2003, a Conceptual Agreement was finalized by <strong>the</strong> parties. It provided <strong>the</strong><br />
framework <strong>for</strong> development <strong>of</strong> a more detailed settlement agreement <strong>to</strong> fully address<br />
res<strong>to</strong>ration plans and fish passage issues at <strong>the</strong> multiple dams. It included<br />
consideration <strong>of</strong> a bypass channel at Howland capable <strong>of</strong> providing free-swim,<br />
unrestricted upstream passage <strong>for</strong> Atlantic salmon, shad and alewives. At this time<br />
black crappies in <strong>the</strong> Souadabscook drainage were <strong>the</strong> only confirmed invasive<br />
species in <strong>the</strong> lower Penobscot.<br />
In April 2004, <strong>the</strong> Multiparty Settlement Agreement was finalized. It <strong>for</strong>malized plans<br />
<strong>for</strong> removal <strong>of</strong> <strong>the</strong> Veazie and Great Works dams, and <strong>for</strong> evaluation <strong>of</strong> a possible<br />
bypass channel at Howland. Any bypass channel had <strong>to</strong> be capable <strong>of</strong> providing<br />
unrestricted upstream passage <strong>for</strong> res<strong>to</strong>ration species. If a free-swim bypass<br />
channel could not be designed or constructed <strong>the</strong> alternative <strong>to</strong> provide passage at<br />
Howland was dam removal. State <strong>of</strong> <strong>the</strong> art fishways or fish lifts were expressly not<br />
considered acceptable at Howland.<br />
In <strong>the</strong> summer <strong>of</strong> 2003 <strong>the</strong>re had been an unconfirmed report <strong>of</strong> a nor<strong>the</strong>rn pike<br />
being angled at Pushaw Lake, but <strong>the</strong> fish was not available <strong>for</strong> examination or<br />
species confirmation. A second angled pike was reported from Pushaw in <strong>the</strong><br />
summer <strong>of</strong> 2004. This time <strong>the</strong> fish (head only) was made available <strong>for</strong> examination<br />
by MDIFW biologists and confirmed <strong>to</strong> be a nor<strong>the</strong>rn pike. A second pike was<br />
caught and confirmed in January 2005. No pike were found by electr<strong>of</strong>ishing<br />
surveys <strong>of</strong> Pushaw Stream and <strong>the</strong> lower mainstem Penobscot River during summer<br />
2005. In June <strong>of</strong> 2006 two different anglers reported catching a nor<strong>the</strong>rn pike in <strong>the</strong><br />
Penobscot River. The first was near <strong>the</strong> confluence <strong>of</strong> Pushaw Stream <strong>to</strong> <strong>the</strong><br />
Penobscot River in Old Town, <strong>the</strong> second report was from just down river <strong>of</strong> <strong>the</strong><br />
Howland Dam. These reports prompted a temporary emergency closure <strong>of</strong> both <strong>the</strong><br />
Howland and West Enfield fishways. With advice from USFWS engineers, both<br />
fishways were modified <strong>to</strong> include a vertical jump <strong>of</strong> no less than 30 inches in order<br />
PRFP Page 211
<strong>to</strong> preclude <strong>the</strong> upstream passage <strong>of</strong> pike in <strong>the</strong> drainage. Renowned fisheries<br />
scientist and expert on Nor<strong>the</strong>rn pike, Dr. John Casselman, agreed that a 30-inch<br />
jump is adequate <strong>to</strong> prevent <strong>the</strong> upstream passage <strong>of</strong> pike through <strong>the</strong> fishways<br />
(pers. comm.).<br />
After <strong>the</strong> confirmation <strong>of</strong> <strong>the</strong> presence <strong>of</strong> nor<strong>the</strong>rn pike, a lake management plan was<br />
developed with <strong>the</strong> main goal <strong>of</strong> preventing fur<strong>the</strong>r spread <strong>of</strong> <strong>the</strong> invasive and<br />
controlling <strong>the</strong> population in Pushaw Lake (Gallagher et al. 2006). The Pushaw Lake<br />
management plan also examined methods <strong>for</strong> potentially eliminating or suppressing<br />
<strong>the</strong> pike population in Pushaw Lake. The plan noted that <strong>the</strong> large lake with<br />
considerable wetlands and residential development would be unsuitable <strong>for</strong> chemical<br />
reclamation. Several barrier methods were considered <strong>for</strong> <strong>the</strong> outlet but none were<br />
deemed feasible <strong>for</strong> a variety <strong>of</strong> reasons. The plan concludes that eradication <strong>of</strong> pike<br />
from Pushaw is unlikely, but that suppression or control methods should be explored<br />
and have been underway since 2006.<br />
Spring removal ef<strong>for</strong>ts have been conducted <strong>for</strong> three years (2006-08) with some<br />
success. So far, <strong>the</strong>re has not been a dramatic increase in <strong>the</strong> pike population at<br />
Pushaw Lake as evident by <strong>the</strong> low capture rate <strong>of</strong> pike by anglers. To date records<br />
indicate 60 female pike have been removed in 3+ years through angling and spring<br />
trap netting. The <strong>to</strong>tal pounds <strong>of</strong> females removed is ~ 300 which translates in<strong>to</strong><br />
about three million eggs (~ 10,000 eggs per pound <strong>of</strong> body weight).<br />
Following confirmation <strong>of</strong> nor<strong>the</strong>rn pike in Pushaw Lake, and <strong>the</strong><br />
recognized potential <strong>for</strong> upstream migration, <strong>the</strong> parties <strong>to</strong> <strong>the</strong> MPA agreed <strong>to</strong><br />
undertake an evaluation <strong>for</strong> feasibility <strong>of</strong> creating a fish passage barrier and trap and<br />
sort capability within any bypass channel <strong>to</strong> be constructed at Howland. Extensive<br />
hydraulic engineering and modeling was underway (by <strong>the</strong> Trust) <strong>to</strong> determine if a<br />
bypass channel capable <strong>of</strong> unrestricted upstream passage <strong>for</strong> res<strong>to</strong>ration species<br />
could in fact be designed.<br />
Accordingly, USFWS fishway design engineers and passage experts at <strong>the</strong> Conte<br />
Lab provided detailed evaluation. From that evaluation it was determined that<br />
any benefits <strong>of</strong> a bypass channel <strong>to</strong> provide free-swim migration <strong>for</strong> res<strong>to</strong>ration<br />
species would be completely negated by measures necessary <strong>to</strong> provide assurance<br />
<strong>of</strong> near-100% exclusion <strong>of</strong> pike. Extensive additional excavation <strong>of</strong> <strong>the</strong> channel and<br />
an elaborate upstream barrier dam and trap and sort facilities would be required. In<br />
addition, notwithstanding <strong>the</strong> high cost <strong>of</strong> construction and ongoing operation, even<br />
<strong>the</strong> most effective trap and sort operation possible at this site was considered<br />
<strong>to</strong> cause unacceptable delay in migration <strong>of</strong> <strong>the</strong> various res<strong>to</strong>ration species. Under<br />
<strong>the</strong> MPA, if a free-swim bypass channel could not be constructed <strong>the</strong><br />
alternative was breach or removal <strong>of</strong> <strong>the</strong> Howland Dam.<br />
The agencies and res<strong>to</strong>ration interests agreed <strong>the</strong> best alternative (ra<strong>the</strong>r than<br />
breaching or removing <strong>the</strong> Howland dam) would be <strong>to</strong> undertake a risk assessment<br />
<strong>for</strong> upstream pike movements and <strong>to</strong> evaluate existing or potential upstream<br />
PRFP Page 212
arriers <strong>to</strong> prevent movement <strong>of</strong> pike in<strong>to</strong> sensitive sub-drainages, resulting in this<br />
document.<br />
Ecological Risk<br />
Miller et al (1989) estimated that exotic introductions were responsible <strong>for</strong> 68% <strong>of</strong><br />
fish extinctions in North America. Introductions <strong>of</strong> large, <strong>to</strong>p-preda<strong>to</strong>rs such as<br />
nor<strong>the</strong>rn pike (Esox lucius) negatively affect resident fish communities by disrupting<br />
normal feeding behavior (Bystrom et al. 2007), decreasing prey biomass and<br />
abundance (He and Kitchell 1990; Findlay et al. 2005) and through extirpation <strong>of</strong><br />
native species (Findlay et al. 2005; Bystrom et al. 2007).<br />
Nor<strong>the</strong>rn pike introductions in Maine<br />
Nor<strong>the</strong>rn pike were initially introduced in<strong>to</strong> Maine in <strong>the</strong> 1970s, as <strong>the</strong> result <strong>of</strong> an<br />
illegal introduction in<strong>to</strong> <strong>the</strong> Belgrade Chain <strong>of</strong> Lakes (Brautigam 2001). Subsequent<br />
migration within <strong>the</strong> Belgrade Lakes drainage and additional illegal introductions are<br />
responsible <strong>for</strong> an expanding distribution within central and sou<strong>the</strong>rn Maine, which<br />
until <strong>the</strong> 1990s was limited <strong>to</strong> two river drainages, <strong>the</strong> Androscoggin and <strong>the</strong><br />
Kennebec. Since 1985, <strong>the</strong> number <strong>of</strong> nor<strong>the</strong>rn pike waters has increased from six<br />
<strong>to</strong> 49 (with 17 expected and one extirpated) statewide (Lucas 2008), representing<br />
72,789 acres in lake surface area (Table 1). In 2004, nor<strong>the</strong>rn pike were confirmed<br />
in Pushaw Lake in <strong>the</strong> Penobscot River drainage (Gallagher et al. 2006), effectively<br />
giving nor<strong>the</strong>rn pike access <strong>to</strong> over 100 river kilometers in <strong>the</strong> Penobscot mainstem<br />
from <strong>the</strong> mouth <strong>of</strong> <strong>the</strong> river <strong>to</strong> <strong>the</strong> Howland and West Enfield dams. Portions <strong>of</strong> <strong>the</strong><br />
upper watershed are also accessible if pike are able <strong>to</strong> use <strong>the</strong> existing fishways<br />
installed at <strong>the</strong> upper dams.<br />
Table 1. Waterbodies with reported pike occurrences<br />
County Year Lake Town Confirmed Status<br />
Kennebec 1980 Great Pond Belgrade Y Present<br />
Kennebec 1980 Ingham Pond Mount Vernon Y Present<br />
Kennebec 1980 Long Pond Belgrade Y Present<br />
Kennebec 1980 Messalonskee Lake Belgrade Y Present<br />
Kennebec 1980 Belgrade Stream Belgrade Y Present<br />
Kennebec 1980 Great Meadow Stream Belgrade Y Present<br />
Ox<strong>for</strong>d, Coos (NH) 1990 Umbagog Lake Magalloway Plt Y Present<br />
Kennebec, Somerset 1980 North Pond Rome Y Present<br />
Androscoggin 1994 Sabbatus Pond Greene Y Present<br />
Kennebec 1996 Berry Pond Winthrop Y Present<br />
Kennebec 1996 Dexter pond Winthrop N Present<br />
Kennebec 1996 Cobbosseecontee Lake Winthrop Y Present<br />
Kennebec 1996 Annabessacook Lake Monmouth Y Present<br />
Kennebec 1996 Lower Narrows Pond Winthrop Y Present<br />
Kennebec 1996 Upper Narrows Pond Winthrop N Present<br />
Kennebec 1996 Horseshoe Pond Litchfield N Present<br />
Kennebec 1996 Pleasant Pond Gardiner N Present<br />
Kennebec 1996 Wilson Pond Wayne N Present<br />
Somerset 1998 Androscoggin River Be<strong>the</strong>l Y Present<br />
PRFP Page 213
Kennebec 1998 Rome Trout Brook Rome Y Present<br />
Androscoggin 1999 Taylor Pond Auburn Y Present<br />
Androscoggin, Ox<strong>for</strong>d 1999 Bear Pond Hart<strong>for</strong>d Y Present<br />
Ox<strong>for</strong>d 1999 Little Bear Pond Hart<strong>for</strong>d Present<br />
Androscoggin 2000 Crystal Pond Turner N Present<br />
Androscoggin 2000 Little Sabbattus Pond Greene Y Present<br />
Kennebec 2000 Moose Pond Stream Mount Vernon Y Present<br />
Kennebec 2000 S<strong>to</strong>ny Brook Mount Vernon Y Present<br />
Androscoggin 2000 Androscoggin River Turner Y Present<br />
Sagadahoc 2001 Winnegance Lake Phippsburg Y Present<br />
Androscoggin 2002 Long Pond Livermore Y Present<br />
Kennebec 2002 Torsey Pond Mount Vernon Y Present<br />
Kennebec 2002 Webber Pond Vassalboro N Present<br />
Lincoln 2002 Biscay Pond Damariscotta N Present<br />
York 2002 Middle Branch Pond Waterboro Y Present<br />
Waldo 2002 Sheepscot Pond Palermo N Present<br />
York 2002 Estes Lake San<strong>for</strong>d Present<br />
Penobscot 2003 Pushaw Lake Al<strong>to</strong>n Y Present<br />
Cumberland 2003 Sebago Lake Sebago Y Present<br />
Androscoggin 2003 No Name Pond Lewis<strong>to</strong>n Y Present<br />
Kennebec, Androscoggin 2004 Androscoggin Lake Wayne N Present<br />
Kennebec 2004 Little Cobbosseecontee Winthrop Y Present<br />
Kennebec 2004 Lovejoy Pond Albion Y Present<br />
Androscoggin 2005 Round Pond Livermore Y Present<br />
Sagadahoc 2005 Nequassett Lake Woolwich Y Present<br />
Kennebec 2006 Mosher Pond Fayette Y Present<br />
Kennebec 2006 Kennebec River Augusta Y Present<br />
Penobscot 2006 Mud Pond Old Town Y Present<br />
Knox 2007 North Pond Warren Y Present<br />
Kennebec 2008 Kennebec River Waterville Y Present<br />
Cumberland 2009 Androscoggin River Brunswick Y Present<br />
Kennebec 2000s China Lake China N Unknown<br />
Androscoggin 2002 The Basin Auburn N Unknown<br />
Sagadahoc 2003 Wat-Tuh Lake Phippsburg N Unknown<br />
Hancock 2005 Great Pond Great Pond N Unknown<br />
Hancock 2005 Green Lake Ellsworth N Unknown<br />
Kennebec 2006 Pattee Pond Winslow N Unknown<br />
York 2006 Number One Pond San<strong>for</strong>d N Unknown<br />
Penobscot 2006 Stillwater River Old Town N Unknown<br />
Penobscot 2006 Penobscot River Howland N Unknown<br />
Ox<strong>for</strong>d 2007 Thompson Lake Otisfield N Unknown<br />
Cumberland 2007 Thompson Lake Casco N Unknown<br />
Cumberland 2007 Crescent Lake Raymond N Unknown<br />
Hancock 2007 Alliga<strong>to</strong>r Lake T34 MD N Unknown<br />
Penobscot 2008 Penobscot River Greenbush N Unknown<br />
Penobscot 2008 Penobscot River Howland N Unknown<br />
Knox 2008 Chickawaukie Pond Rockland N Unknown<br />
PRFP Page 214
Kennebec 2008 WhittierPond Vienna N Unknown<br />
Knox 2008 Seven Tree Pond Union N Unknown<br />
Lincoln 2003 Webber Pond Bremen unknown Extirpate<br />
YEAR refers <strong>to</strong> <strong>the</strong> year <strong>of</strong> <strong>the</strong> first report <strong>for</strong> <strong>the</strong> water, whe<strong>the</strong>r confirmed or not at <strong>the</strong> time<br />
LAKE is water <strong>of</strong> occurrence - <strong>the</strong> file started out as lakes but has since evolved <strong>to</strong> include flowing waters<br />
CONFIRMED refers <strong>to</strong> confirmation by a reputable source and <strong>of</strong>ten with corroborating evidence, like an indisputable pho<strong>to</strong><br />
etc.<br />
STATUS can be present (confirmed by biologist, known knowledgeable source or very well documented occurrences, such as<br />
indisputable pho<strong>to</strong>s); Unknown (reported but not confirmed by a reputable source); extirpate (was known <strong>to</strong> be present but is<br />
now considered extirpated depending on his<strong>to</strong>ry and removal ef<strong>for</strong>ts).<br />
Maine Case Studies<br />
Nor<strong>the</strong>rn Pike in Long Pond: While <strong>the</strong> impact <strong>of</strong> nor<strong>the</strong>rn pike on salmon<br />
populations in Maine has not been studied in detail, <strong>the</strong>re is strong circumstantial<br />
evidence that <strong>the</strong>y are major preda<strong>to</strong>rs on salmon <strong>of</strong> all sizes in some lakes. Long<br />
Pond in Kennebec County was traditionally a principal fishery <strong>for</strong> quality sized<br />
landlocked salmon with <strong>the</strong> fishery maintained by s<strong>to</strong>cking <strong>of</strong> hatchery fish. Nor<strong>the</strong>rn<br />
pike were first confirmed in Long Pond in 1980, and presumed <strong>to</strong> have gotten <strong>the</strong>re<br />
ei<strong>the</strong>r through natural dispersal from connected water bodies previously introduced<br />
with pike, or through an illegal introduction directly in<strong>to</strong> <strong>the</strong> lake. Lucas (MDIFW,<br />
unpublished data) showed increasing evidence <strong>of</strong> scarring (presumed <strong>to</strong> be <strong>the</strong><br />
result <strong>of</strong> attacks by pike) observed on adult salmon at Long Pond in <strong>the</strong> Belgrade<br />
Lakes Region was correlated with declining fall trap net catches <strong>of</strong> salmon (Figure<br />
1). This abrupt decline may be associated with <strong>the</strong> failure <strong>of</strong> <strong>the</strong> <strong>for</strong>age base<br />
possibly from several failed or weak smelt recruitment years. Trends based on poor<br />
smelt year class have been shown on Moosehead Lake with land locked salmon and<br />
lake trout. Nor<strong>the</strong>rn pike may have contributed <strong>to</strong> weakening <strong>the</strong> year class,<br />
however <strong>for</strong>age base is <strong>of</strong>ten very large and subject <strong>to</strong> s<strong>to</strong>chastic events that can<br />
produce very large annual fluctuations. In recent years s<strong>to</strong>cking <strong>of</strong> spring yearling<br />
salmon has been suspended at Long Pond in favor <strong>of</strong> s<strong>to</strong>cking larger fall yearling<br />
sized salmon in an ef<strong>for</strong>t <strong>to</strong> reduce pike predation. Pike have also been observed in<br />
<strong>the</strong> small tributaries <strong>to</strong> Long Pond, and where <strong>the</strong>y are present are believed <strong>to</strong> have<br />
impacted native brook trout populations in <strong>the</strong> tributaries (Scott Davis MDIFW,<br />
personal communication; see S<strong>to</strong>ny Brook scetion).<br />
Limited food habits data are available from Maine. At Long Pond, pike fed primarily<br />
on smelts. Thirty-seven pike s<strong>to</strong>machs were examined in <strong>the</strong> winters <strong>of</strong> 1994 and<br />
1995. Eleven (50%) <strong>of</strong> <strong>the</strong> 22 s<strong>to</strong>machs that contained food items contained smelts.<br />
In o<strong>the</strong>r pike waters in Maine, where <strong>the</strong>re are few if any salmonids present, white<br />
perch are heavily utilized as <strong>for</strong>age by nor<strong>the</strong>rn pike.<br />
PRFP Page 215
Salmon catch/day<br />
35<br />
30<br />
25<br />
20<br />
15<br />
10<br />
5<br />
0<br />
Salmon catch/day Percent scarred<br />
1988 1989 1990 1991 1992 1993 1994 1995 1996 1997 1998 1999 2000<br />
Year<br />
Figure 1. Incidence <strong>of</strong> scars and trapnet catch rates <strong>of</strong> salmon on spawning<br />
runs at Long Pond, Kennebec County, 1988-2000.<br />
Nor<strong>the</strong>rn Pike in S<strong>to</strong>ny Brook: MDIFW Region B biologists surveyed Long Pond<br />
tributaries in Mount Vernon <strong>for</strong> <strong>the</strong> first time on August 15, 2005. Long Pond is<br />
actively s<strong>to</strong>cked with fall yearling landlocked salmon and spring yearling brook trout.<br />
S<strong>to</strong>ny Brook and two proximate unnamed tributaries were surveyed <strong>to</strong> document fish<br />
species composition and general fish habitat condition in 2005. Small sized (127-<br />
229 mm length range) nor<strong>the</strong>rn pike were documented in <strong>the</strong> two streams closest <strong>to</strong><br />
Long Pond, S<strong>to</strong>ny Brook and an unnamed tributary <strong>to</strong> Long Pond. Water<br />
temperatures at all sites were adequate <strong>for</strong> coldwater species management and are<br />
likely used as <strong>the</strong>rmal refuges by young pike and brook trout (Figure 2).<br />
S<strong>to</strong>ny Brook continues <strong>to</strong> be moni<strong>to</strong>red and is frequently surveyed by backpack<br />
electr<strong>of</strong>ishing <strong>to</strong> assess fish community composition at various times <strong>of</strong> <strong>the</strong> year<br />
(Table 2). The sample site is located downstream from <strong>the</strong> crossing with Belgrade<br />
Road and <strong>the</strong> existing road-stream crossing culvert is impassable <strong>to</strong> upstream fish<br />
movement. Nor<strong>the</strong>rn pike have been collected at all survey events in June, July,<br />
August and early September. Pike in S<strong>to</strong>ny Brook typically range from 65 – 195 mm<br />
and represent young <strong>of</strong> <strong>the</strong> year (YOY), or perhaps 1+ age fish. Three wild brook<br />
trout (size range 142 – 164 mm) were collected during <strong>the</strong> April 2007 sampling event<br />
only and are presumed <strong>to</strong> have dropped down from S<strong>to</strong>ny Brook’s upper reaches.<br />
Across all sampling events, water temperatures range from 11.0C (Sept 07) – 21.8C<br />
(Aug 05) and appear <strong>to</strong> maintain adequate <strong>the</strong>rmal regimes throughout summer <strong>for</strong><br />
coldwater species management.<br />
The pattern <strong>of</strong> small sized pike present in S<strong>to</strong>ny Brook during <strong>the</strong> summer months is<br />
consistent with juvenile pike using <strong>the</strong> stream as a refuge. S<strong>to</strong>ny Brook is a small<br />
stream with an average width <strong>of</strong> 4.5m and does not provide adequate habitat or<br />
water depth <strong>for</strong> larger sized pike. It is likely that S<strong>to</strong>ny Brook acts as both a <strong>the</strong>rmal<br />
refuge and as a spatial refuge <strong>for</strong> small sized nor<strong>the</strong>rn pike from Long Pond. Pike<br />
PRFP Page 216<br />
80<br />
70<br />
60<br />
50<br />
40<br />
30<br />
20<br />
10<br />
0<br />
% salmon with scars
are a coldwater species and need access <strong>to</strong> cooler water habitats at all life stages.<br />
Hence, juvenile pike presence in S<strong>to</strong>ny Brook is consistent with temporary habitat<br />
use as pond temperatures rise. In addition, juvenile pike have been shown <strong>to</strong><br />
disperse <strong>to</strong> and temporarily inhabit areas where larger sized pike, or o<strong>the</strong>r fish<br />
preda<strong>to</strong>rs, tend not <strong>to</strong> inhabit. Similar juvenile pike movement and habitat use<br />
patterns have been correlated with anti-preda<strong>to</strong>ry behaviors such as avoiding<br />
cannibalism by larger conspecifics (Craig 2008).<br />
2 BKT<br />
19.2C<br />
13 PIK; 5 BKT<br />
18.4C<br />
S<strong>to</strong>ny Brook<br />
Figure 2. MDIFW Stream Survey locations <strong>for</strong> three tributaries <strong>to</strong> Long Pond.<br />
All sites were surveyed on August 15, 2005. Nor<strong>the</strong>rn pike and brook trout<br />
abundance at time <strong>of</strong> survey <strong>for</strong> each site denoted above.<br />
Table 2. S<strong>to</strong>ny Brook electr<strong>of</strong>ishing summary in<strong>for</strong>mation, 2005-2008.<br />
Date Temp Pike BKT WHS LMB PKL BND CCB GLS<br />
CPUE CPUE CPUE CPUE CPUE CPUE CPUE CPUE<br />
Aug 15,<br />
2005<br />
21.8 0.483 0.0 0.643 0.0 0.0 0.0 0.0 0.0<br />
Sept 12,<br />
2006<br />
13.0 0.172 0.0 0.057 0.230 0.115 0.0 0.0 0.0<br />
April 26,<br />
2007<br />
9.4 0.0 0.203 0.135 0.0 0.0 0.068 0.0 0.0<br />
June 15,<br />
2007<br />
15.8 0.857 0.0 0.095 0.0 0.095 0.0 0.476 0.0<br />
July 16,<br />
2007<br />
18.6 0.727 0.0 0.121 0.0 0.0 0.121 0.364 0.0<br />
Aug 15,<br />
2007<br />
17.5 0.273 0.0 0.091 1.457 0.091 0.091 0.182 0.0<br />
Sept 17,<br />
2007<br />
11.0 0.0 0.0 0.462 0.740 0.0 0.277 0.277 0.0<br />
PRFP Page 217<br />
3 PIK<br />
21.8C<br />
LONG POND
April 24,<br />
2008<br />
15.7 0.0 0.0 0.256 0.0 0.0 0.085 0.0 0.085<br />
Aug 20,<br />
2008<br />
16.5 0.052 0.0 0.0 0.052 0.105 0.052 0.0 0.0<br />
*BKT = brook trout, WHS = white sucker, LMB = largemouth bass, PKL = chain pickerel, BND =<br />
blacknose dace, CCB = creek chub, GLS = golden shiner<br />
Nor<strong>the</strong>rn Pike in Rome Trout Brook: Rome Trout Brook is a moni<strong>to</strong>ring site in<br />
MDIFW’s stream brook trout moni<strong>to</strong>ring project and is a tributary <strong>to</strong> Great Pond in<br />
Belgrade. Brook trout moni<strong>to</strong>ring sites are representative <strong>of</strong> ‘good’ trout habitat,<br />
randomly distributed throughout Maine, and are annually moni<strong>to</strong>red with intensive<br />
fish species and aquatic habitat data collection pro<strong>to</strong>cols. Complete fish species<br />
composition, species relative abundance, and brook trout population estimates by<br />
size class have been annually determined since 1993 with multi-pass electr<strong>of</strong>ishing<br />
techniques. The moni<strong>to</strong>ring site on Rome Trout Brook is approximately 1.5 km from<br />
<strong>the</strong> confluence with Great Pond. Nor<strong>the</strong>rn pike were confirmed in Great Pond in<br />
1980. One pike was captured within <strong>the</strong> survey section in 1998, 2001, and 2002.<br />
2001 and 2002 also correspond <strong>to</strong> years <strong>of</strong> below average precipitation and stream<br />
levels were subsequently quite low (Figure 3). Years 2001 and 2002 also<br />
correspond <strong>to</strong> years <strong>of</strong> overall lowest fish diversity (Figure 4) and YOY brook trout<br />
abundance (Figure 5).<br />
Jan 93<br />
Oct 93<br />
July 94<br />
April 95<br />
Jan 96<br />
Oct 96<br />
July 97<br />
April 98<br />
Jan 99<br />
Oct 99<br />
July 00<br />
April 01<br />
PHDI<br />
Jan 02<br />
Oct 02<br />
July 03<br />
April 04<br />
Jan 05<br />
Oct 05<br />
July 06<br />
April 07<br />
Jan 08<br />
Figure 3. Palmer Hydrological Drought Index <strong>for</strong> Maine, 1993-2009. Negative<br />
values denote drought conditions with values less than –4 signifying extreme<br />
drought. Data source: National Climatic Data Center, NOAA.<br />
PRFP Page 218<br />
Oct 08<br />
8<br />
6<br />
4<br />
2<br />
0<br />
-2<br />
-4<br />
-6
Figure 4. Total species composition <strong>for</strong> Rome Trout Brook, 1993-2007.<br />
200<br />
180<br />
160<br />
140<br />
120<br />
100<br />
80<br />
60<br />
40<br />
20<br />
0<br />
# <strong>of</strong> YOY BKT<br />
# <strong>of</strong> YOY BKT<br />
Pike presence<br />
1993 1994 1995 1996 1997 1998 1999 2000 2001 2002 2003 2004 2006 2007<br />
Figure 5. Abundance <strong>of</strong> Young <strong>of</strong> <strong>the</strong> Year (YOY) brook trout in Rome<br />
Trout Brook, 1993-2007. YOY defined as BKT <strong>to</strong>tal length ≤ 88 mm<br />
(derived from statewide estimate <strong>of</strong> BKT size at age collected from<br />
August – September <strong>of</strong> any given year. 2001 and 2002 were drought<br />
years.<br />
PRFP Page 219
BKT <strong>to</strong>tal N N<br />
0 50 100 150<br />
1993<br />
1994<br />
1995<br />
1996<br />
1997<br />
1998<br />
1999<br />
Pike presence<br />
2000<br />
year<br />
Figure 6. Total abundance <strong>of</strong> brook trout <strong>for</strong> Rome Trout Brook, 1993-2007.<br />
One pike<br />
found in moni<strong>to</strong>ring site in 1998, 2001, and 2002. 2001 and 2002 were drought<br />
years.<br />
Brook trout abundance in Rome Trout Brook varies annually with <strong>the</strong> lowest<br />
abundance in 2001 and 2002 (Figure 6). The lowest numbers <strong>of</strong> brook trout young<br />
<strong>of</strong> <strong>the</strong> year also occurred in 2001 and 2002 (Figure 5). Pike presence within this<br />
stream is not common with only 3 <strong>to</strong>tal pike being detected; one each in year 1998,<br />
2001 and 2002. It is difficult <strong>to</strong> determine if <strong>the</strong> greatly reduced brook trout indices<br />
<strong>for</strong> 2001 and 2002 are <strong>the</strong> result <strong>of</strong> pike presence at <strong>the</strong> time <strong>of</strong> <strong>the</strong> survey or if low<br />
flow and drought conditions exacerbated <strong>the</strong> effect (Figure 3). However, in <strong>the</strong> only<br />
year that pike were present and water conditions were normal, brook trout<br />
abundance and YOY abundance were within <strong>the</strong> range <strong>of</strong> annual variation in years<br />
that pike were absent. Those years also show <strong>the</strong> lowest overall relative fish species<br />
diversity and abundance that are indicative <strong>of</strong> drought stress. It is possible that pike<br />
intrusion 1.5 km upstream from <strong>the</strong>ir source lake is not a common occurrence and is<br />
precipitated by environmental stress that <strong>for</strong>ces some individuals <strong>to</strong> take extreme<br />
chances in unusual conditions.<br />
Baker Branch <strong>of</strong> <strong>the</strong> St John River: Muskellunge (Esox masquinongy) are an Esocid<br />
fish similar in morphology and ecology <strong>to</strong> nor<strong>the</strong>rn pike. Muskellunge occur in<br />
Maine’s St. John River system presumably as a result <strong>of</strong> legal s<strong>to</strong>cking events in<br />
Quebec’s Lac Frontiere in <strong>the</strong> late 1960s. Although muskellunge tend <strong>to</strong> move<br />
much greater distances than o<strong>the</strong>r esocids and tend <strong>to</strong> prefer large river habitats<br />
over truly lentic areas whereas pike tend <strong>to</strong> be <strong>the</strong> opposite, <strong>the</strong> fish community<br />
effects and habitat relationships caused by muskellunge are similar <strong>to</strong> <strong>the</strong> ecology <strong>of</strong><br />
PRFP Page 220<br />
2001<br />
2002<br />
2003<br />
2004<br />
BKT<br />
2006<br />
2007
nor<strong>the</strong>rn pike (Lucas 2008, Scott and Crossman 1973). Muskellunge presence was<br />
confirmed in Baker Lake in 1986 and Yoder’s survey <strong>of</strong> <strong>the</strong> St. John River found<br />
muskellunge presence in ten <strong>of</strong> fourteen surveyed reaches (2005).<br />
MDIFW conducted raft electr<strong>of</strong>ishing surveys on four reaches <strong>of</strong> <strong>the</strong> Baker Branch <strong>of</strong><br />
<strong>the</strong> St. John River on August 12 – 13, 2008 (Figure 7). Three surveyed reaches<br />
were above <strong>the</strong> confluence with Baker Lake and one reach was below <strong>the</strong> lake.<br />
Figure 7 Raft electr<strong>of</strong>ishing surveys on four reaches <strong>of</strong> <strong>the</strong> Baker Branch <strong>of</strong><br />
<strong>the</strong> St. John River on August 12 – 13, 2008.<br />
PRFP Page 221
Muskellunge in <strong>the</strong> Baker Branch <strong>of</strong> <strong>the</strong> St. John River were caught in <strong>the</strong> three<br />
reaches in closest proximity <strong>to</strong> Baker Lake. The reach fur<strong>the</strong>st from Baker Lake,<br />
ABOVE1, had no muskellunge caught, <strong>the</strong> highest catch rate <strong>of</strong> s<strong>of</strong>t rayed fish<br />
species (Figure 8) and <strong>the</strong> greatest overall species richness (Table 3). This pattern<br />
may be a reflection <strong>of</strong> ecological displacement where <strong>the</strong> presence <strong>of</strong> muskellunge<br />
shifts <strong>the</strong> fish community <strong>to</strong>ward less preferred prey species. Muskellunge, like<br />
nor<strong>the</strong>rn pike, prefer s<strong>of</strong>t-rayed fish species as <strong>for</strong>age when choices occur. <strong>Fishes</strong><br />
do vacate habitats or areas where preda<strong>to</strong>rs are known <strong>to</strong> occur or are detected (He<br />
and Kitchell 1990). Ecological displacement supports <strong>the</strong> pattern <strong>of</strong> a greater<br />
number <strong>of</strong> s<strong>of</strong>t rayed fishes in <strong>the</strong> reach fur<strong>the</strong>st from areas with muskellunge, as<br />
well as <strong>the</strong> expanded spatial pattern <strong>of</strong> brook trout presence in tributaries <strong>to</strong> <strong>the</strong><br />
Baker Branch <strong>of</strong> <strong>the</strong> St. John River, but apparently not present in <strong>the</strong> mainstem<br />
although summer water temperatures appear <strong>to</strong> be adequate <strong>for</strong> salmonids (Figure 8<br />
and Table 3) and <strong>the</strong>y likely occurred <strong>the</strong>re his<strong>to</strong>rically.<br />
CPUE<br />
0.12<br />
0.1<br />
0.08<br />
0.06<br />
0.04<br />
0.02<br />
0<br />
Muskie CPUE<br />
S<strong>of</strong>t ray CPUE<br />
Yellow Perch CPUE<br />
Below Above3 Above2 Above1<br />
Figure 8. Catch per electr<strong>of</strong>ishing second <strong>for</strong> surveyed reaches <strong>of</strong> <strong>the</strong> Baker Branch <strong>of</strong> <strong>the</strong> St.<br />
John River, August 2008. S<strong>of</strong>t ray CPUE is catch per ef<strong>for</strong>t <strong>for</strong> fallfish, white sucker, golden<br />
shiner, common shiner, burbot, blacknose dace, and creek chub combined.<br />
Table 3 Summarized results <strong>for</strong> four surveyed reaches <strong>of</strong> <strong>the</strong> Baker Branch <strong>of</strong> <strong>the</strong> St. John River, August 12-13, 2008.<br />
Reach Habitat Type Temp C Electr<strong>of</strong>ishing Species Species*<br />
time (sec) Richness<br />
Below Rapid 18.2 548 4 MUS, FLF,<br />
YLP, WHS,<br />
Above3 Deadwater 17.7 559 4 MUS, FLF,<br />
YLP, GLS<br />
Above2 Run 16.7 558 4 MUS, YLP,<br />
WHS, CMS<br />
PRFP Page 222
Above1 Run 16.3 551 7 FLF, YLP,<br />
WHS, CSK,<br />
BND, CCB,<br />
CMS<br />
* MUS = Muskellunge, FLF = Fallfish, YLP= Yellow Perch, WHS = White Sucker, GLS = Golden<br />
Shiner, CMS = Common Shiner, CSK = Burbot/Cusk, BND = Blacknose Dace, CCB = Creek Chub<br />
Chain pickerel: A study conducted by MDIFW in <strong>the</strong> 1960s revealed that pickerel<br />
were <strong>the</strong> most common preda<strong>to</strong>r on newly s<strong>to</strong>cked salmon. Predation by pickerel<br />
was observed at 27 <strong>of</strong> 42 lakes (64%) shortly after s<strong>to</strong>cking <strong>of</strong> landlocked salmon<br />
(Warner 1972). In all, 152 <strong>of</strong> 523 pickerel examined (30%) were found <strong>to</strong> have<br />
recently consumed a newly s<strong>to</strong>cked salmon. The average number <strong>of</strong> salmon per<br />
pickerel was 1.9 fish; however one fish devoured 32 newly s<strong>to</strong>cked salmon.<br />
Barr (1962) reported significant predation on migrating sea-run Atlantic salmon<br />
smolts by pickerel at Bedding<strong>to</strong>n Lake in <strong>the</strong> Narraguagus River drainage. In that<br />
study, 21% <strong>of</strong> pickerel greater than 10 inches long were found <strong>to</strong> have consumed a<br />
salmon smolt. Similarly, on <strong>the</strong> Penobscot River, Van den Ende (1993) documented<br />
that Atlantic salmon smolts were <strong>the</strong> most important dietary item <strong>of</strong> chain pickerel<br />
(11.5 - 24 inches in length) during <strong>the</strong> smolt run period on <strong>the</strong> Penobscot River,<br />
where 58 percent <strong>of</strong> all pickerel s<strong>to</strong>machs contained food items and smolts<br />
represented 80 percent <strong>of</strong> <strong>the</strong> wet weight <strong>of</strong> all prey items.<br />
Pickerel predation on newly s<strong>to</strong>cked brown trout was observed at Brandy Pond in<br />
Hancock County in 1989. In that study, newly s<strong>to</strong>cked spring yearling brown trout<br />
were observed in <strong>the</strong> s<strong>to</strong>machs <strong>of</strong> 15 <strong>of</strong> 54 pickerel (28%). The smallest pickerel<br />
that consumed a brown trout was 15 inches long. The mean length <strong>of</strong> <strong>the</strong> 54<br />
pickerel examined was 16.9 inches. The experimental s<strong>to</strong>cking was terminated due<br />
<strong>to</strong> unsatisfac<strong>to</strong>ry survival.<br />
Changes <strong>to</strong> Fish Communities after Introductions<br />
Invasions or introductions <strong>of</strong> <strong>to</strong>p preda<strong>to</strong>rs in<strong>to</strong> new ecosystems have been shown <strong>to</strong><br />
have negative effects on native <strong>to</strong>p preda<strong>to</strong>rs and dramatic cascading effects on<br />
lower trophic levels (Vander Zanden et al. 2004). Several studies have attributed<br />
large losses <strong>of</strong> s<strong>to</strong>cked and migrating salmonids <strong>to</strong> pike predation in riverine<br />
ecosystems. Petrvozvanskiy et al. (1988) documented that pike account <strong>for</strong><br />
approximately 35% <strong>of</strong> s<strong>to</strong>cked Atlantic salmon smolt mortality in <strong>the</strong> Keret River in<br />
Russia. Similarly, Larson (1985) and Kekäläinen (2008) attributed a 50% and 29%<br />
loss respectively <strong>of</strong> migrating juvenile Baltic salmon <strong>to</strong> predation from pike. Jepsen<br />
et al. (2006), working with hatchery s<strong>to</strong>cked Atlantic salmon smolts and wild brown<br />
trout observed 56% predation by pike during spring migration through Lake Tange, a<br />
12 kilometer long reservoir in <strong>the</strong> Danish River Gudenå watershed. Rutz<br />
(1996,1999) documented that juvenile salmon and trout species were <strong>the</strong> preferred<br />
<strong>for</strong>age <strong>of</strong> pike in several southcentral Alaskan waters. Rutz reported that 80% <strong>of</strong> <strong>the</strong><br />
non-empty pike s<strong>to</strong>machs from <strong>the</strong> Susitna River contained salmonids, even though<br />
suckers, sticklebacks, and o<strong>the</strong>r minnow species were present. He also notes that<br />
many <strong>of</strong> Susitna drainage lakes and streams that once contained native populations<br />
PRFP Page 223
<strong>of</strong> coho, chinook and sockeye salmon, rainbow trout, and Arctic grayling now contain<br />
only nor<strong>the</strong>rn pike.<br />
Studies in lake ecosystems have shown negative effects on <strong>the</strong> native <strong>to</strong>p preda<strong>to</strong>rs.<br />
In Sweden, nor<strong>the</strong>rn pike replaced artic char (Salvelinus alpinus) as <strong>to</strong>p preda<strong>to</strong>r<br />
after invasion by a combination <strong>of</strong> predation and competition (Bystrom et al. 2007).<br />
The study also reported a possible extinction <strong>of</strong> char and increases in zooplank<strong>to</strong>n<br />
and benthos. He and Kitchell (1990) documented changes after an experimental<br />
nor<strong>the</strong>rn pike introduction in<strong>to</strong> a lake that was previously piscivore free. Changes<br />
occurring in <strong>the</strong> fish community after nor<strong>the</strong>rn pike introduction ranged from<br />
decreased prey fish biomass, decreased abundance <strong>of</strong> dominant species and<br />
decreased mean size <strong>for</strong> species most vulnerable <strong>to</strong> predation (He and Kitchell<br />
1990). In a similar experiment, Findlay et al. (2005) reported that a non-native<br />
nor<strong>the</strong>rn pike introduction in<strong>to</strong> a small boreal lake resulted in one native species<br />
(Semotilus magariscus) was extirpated and ano<strong>the</strong>r native species (Perca<br />
flavescens) declined in abundance.<br />
Native Species Habitat and Diet Preferences<br />
Brook Trout -Stream populations: It has been well documented that brook trout<br />
prefer cool water. Baldwin (1956) reported that optimum growth rates occurred<br />
around 16.5 o C. Bonney (2006) reports <strong>the</strong> upper lethal temperature limit <strong>for</strong> brook<br />
trout at 25 o C. Resident stream populations <strong>of</strong> wild/native brook trout will spawn in<br />
shallow gravel areas <strong>of</strong> headwater streams. The spawning material may vary from<br />
fine sand <strong>to</strong> coarse, loose gravel and rubble (Everhart 1976). Brook trout prefer<br />
substrates that also are influenced with spring upwellings. Young <strong>of</strong> <strong>the</strong> year brook<br />
trout are typically located in shallow gravel riffle areas <strong>of</strong> <strong>the</strong>se streams throughout<br />
<strong>the</strong> summer months and in areas around springs. Griffith (1972) reports that streamdwelling<br />
juvenile brook trout prefer low water velocities (0.03 <strong>to</strong> 0.08 feet/second).<br />
As stream resident brook trout reach older ages, <strong>the</strong>y tend <strong>to</strong> prefer deeper habitats.<br />
Bonney (2006) notes that adult fish tend <strong>to</strong> migrate <strong>to</strong> pools in late summer and late<br />
winter and that pool habitat is critical <strong>to</strong> brook trout survival in periods <strong>of</strong> low water<br />
and high water temperature. MacMillian (1998) also reports that preda<strong>to</strong>r marks<br />
increased in frequency on brook trout crowded in<strong>to</strong> pools during periods <strong>of</strong> warm<br />
temperatures.<br />
Brook Trout - Lake populations: Brook trout inhabit ponds and lakes in Maine with a<br />
wide range <strong>of</strong> physical and biological characteristics. The vast majority <strong>of</strong> remaining<br />
wild and native populations are located in <strong>the</strong> nor<strong>the</strong>rn and western regions <strong>of</strong> <strong>the</strong><br />
state. Brook trout were distributed over <strong>the</strong> entire state prior <strong>to</strong> European settlement.<br />
Since this time, habitat degradation associated with development and <strong>the</strong><br />
introduction <strong>of</strong> exotic species has greatly diminished <strong>the</strong> range <strong>of</strong> wild/native brook<br />
trout in sou<strong>the</strong>rn and eastern Maine. Most <strong>of</strong> <strong>the</strong> brook trout fisheries in <strong>the</strong>se<br />
impacted areas are supported entirely by s<strong>to</strong>cking programs.<br />
Brook trout in lakes and ponds typically inhabit lit<strong>to</strong>ral habitat during most times <strong>of</strong><br />
<strong>the</strong> year. Brook trout abundance is <strong>of</strong>ten related <strong>to</strong> <strong>the</strong> amount <strong>of</strong> lit<strong>to</strong>ral habitat in<br />
PRFP Page 224
any given water. During warmer periods <strong>of</strong> <strong>the</strong> summer when water temperatures<br />
are highest, brook trout may seek deeper water refuge but are not commonly found<br />
in depths exceeding 9m. A recent year long radio telemetry study <strong>of</strong> brook trout in<br />
Chamberlain Lake confirmed that during <strong>the</strong> winter months <strong>the</strong> majority <strong>of</strong> tagged<br />
brook trout were in shallow bays with maximum depths less than 6m. These fish<br />
stayed in <strong>the</strong>se shallow locations <strong>for</strong> <strong>the</strong> duration <strong>of</strong> <strong>the</strong> winter. Tagged brook trout<br />
moved freely around <strong>the</strong> 13,000-acre oligotrophic lake system during <strong>the</strong> spring, but<br />
were usually located in lit<strong>to</strong>ral habitat near <strong>the</strong> shoreline.<br />
Brook trout in large lakes typically spawn in tributaries. Spawning runs are <strong>of</strong>ten<br />
influenced by wea<strong>the</strong>r conditions, primarily rain events, but usually begin in early<br />
September in nor<strong>the</strong>rn Maine. Actual spawning typically occurs from mid-Oc<strong>to</strong>ber<br />
through early November in Maine. Lake-dwelling brook trout seek <strong>the</strong> same type <strong>of</strong><br />
spawning substrate as stream-dwelling brook trout. Brook trout will travel several<br />
miles upstream in tributaries <strong>to</strong> locate suitable spawning habitat. Brook trout in small<br />
ponds <strong>of</strong>ten spawn along <strong>the</strong> shore in areas where <strong>the</strong>re is a spring influence when<br />
tributaries are not present. Auclair (1982) found that wild brook trout fry dropped out<br />
<strong>of</strong> <strong>the</strong>ir natal streams soon after hatching.<br />
Food habits <strong>of</strong> brook trout are very flexible. Bonney (2006) summarized data<br />
collected from <strong>the</strong> examination <strong>of</strong> over 1,700 brook trout s<strong>to</strong>machs in <strong>the</strong><br />
Moosehead Lake Region. Insects occurred in 50% <strong>of</strong> all s<strong>to</strong>machs examined,<br />
accounting <strong>for</strong> 34% <strong>of</strong> <strong>the</strong> <strong>to</strong>tal volume <strong>of</strong> food. Unidentified fish remains, smelts,<br />
and crayfish were also important food items <strong>for</strong> brook trout sampled from a variety <strong>of</strong><br />
waters.<br />
Landlocked Salmon: Naturally produced landlocked salmon populations have two<br />
distinct life phases: stream life and lake life. After hatching in <strong>the</strong> spring, young wild<br />
salmon live in <strong>the</strong>ir natal stream <strong>for</strong> one <strong>to</strong> three years. Salmon move in<strong>to</strong> lake<br />
habitat after smoltification occurs. In Maine, <strong>the</strong>re are a handful <strong>of</strong> rivers that have<br />
year-round salmon populations. One <strong>of</strong> <strong>the</strong> largest and most important river fisheries<br />
<strong>for</strong> wild landlocked salmon is <strong>the</strong> West Branch <strong>of</strong> <strong>the</strong> Penobscot River between<br />
Ripogenus Dam and Pemadumcook Lake.<br />
Spawning occurs in gravel substrate in flowing water. Salmon move in<strong>to</strong> streams<br />
and rivers in September and Oc<strong>to</strong>ber, while <strong>the</strong> actual act <strong>of</strong> spawning generally<br />
occurs in late Oc<strong>to</strong>ber through <strong>the</strong> month <strong>of</strong> November. The young salmon emerge<br />
from <strong>the</strong> redds in late April or early May. Young <strong>of</strong> <strong>the</strong> year salmon prefer shallow<br />
gravel habitat <strong>for</strong> <strong>the</strong> first summer. Salmon parr (stream life fish greater than age<br />
one) can withstand higher water velocities and are typically found in rocky riffle/run<br />
habitat. As <strong>the</strong> salmon matures, parr marks become less apparent and it undergoes<br />
smoltification process similar <strong>to</strong> Atlantic salmon, but less pronounced. It is during<br />
this time that <strong>the</strong> salmon migrate <strong>to</strong> lake habitat. Most movement out <strong>of</strong> <strong>the</strong> natal<br />
stream occurs in <strong>the</strong> spring (Warner and Harvey 1985).<br />
PRFP Page 225
Adult landlocked salmon, both wild and hatchery origin, can occur in a wide range <strong>of</strong><br />
lake types including: oligotrophic, mesotrophic, and even a few homo<strong>the</strong>rmous<br />
waters. Salmon prefer cool, well oxygenated water but can exist in less favorable<br />
conditions. Adult salmon are generally located in <strong>the</strong> <strong>the</strong>rmocline in <strong>the</strong> summer<br />
months if stratification occurs. They can frequently be found in <strong>the</strong> pelagic areas <strong>of</strong><br />
<strong>the</strong>se lakes. In <strong>the</strong> winter months, salmon are found not only suspended over<br />
deeper areas, but also in <strong>the</strong> lit<strong>to</strong>ral areas <strong>of</strong> lakes. Location <strong>of</strong> <strong>for</strong>age fish, primarily<br />
smelts, will <strong>of</strong>ten dictate <strong>the</strong> location <strong>of</strong> adult salmon. In <strong>the</strong> West Branch <strong>of</strong> <strong>the</strong><br />
Penobscot River, adult salmon overwinter in large deadwaters in <strong>the</strong> lower reaches<br />
<strong>of</strong> <strong>the</strong> river. Spear (in FERC Project No 2572, 1991) found that <strong>the</strong> most important<br />
overwintering deadwaters contained low velocities, shallow bays and logans, and<br />
muddy substrate.<br />
Food habits <strong>of</strong> YOY salmon were examined during <strong>the</strong> relicensing <strong>of</strong> <strong>the</strong> Ripogenus<br />
Dam in Maine. Data collected by Great Nor<strong>the</strong>rn Paper Co., Inc were presented in<br />
Warner and Harvey (1985). These young salmon were feeding primarily on insects<br />
including Ephemeroptera , Diptera, and Tricoptera. There is a paucity <strong>of</strong> in<strong>for</strong>mation<br />
<strong>of</strong> <strong>the</strong> food habits <strong>of</strong> salmon parr although it is likely <strong>the</strong>y feed similarly on insects.<br />
Adult landlocked salmon also feed on aquatic insects during summer months.<br />
However, smelts are considered <strong>the</strong> primary food source <strong>for</strong> adult salmon. Warner<br />
and Harvey (1985) details <strong>the</strong> importance <strong>of</strong> smelts <strong>for</strong> salmon growth and survival.<br />
Smelt populations are no<strong>to</strong>rious <strong>for</strong> wide fluctuations in density, which frequently<br />
results in poor growth <strong>for</strong> salmonids. Alternative food sources, such as landlocked<br />
alewives, have been established in some salmon waters. In Echo Lake, smelt<br />
growth suffered after <strong>the</strong> introduction <strong>of</strong> landlocked alewives (Warner and Harvey<br />
1985). Many <strong>of</strong> Maine’s tailwater river fisheries <strong>for</strong> landlocked salmon also benefit<br />
from smelt drift from impoundments upstream, which helps <strong>to</strong> sustain salmon growth<br />
in <strong>the</strong> river population. Spear (in FERC Project No 2572, 1991) estimated <strong>the</strong><br />
average <strong>to</strong>tal annual discharge <strong>of</strong> smelts in<strong>to</strong> <strong>the</strong> West Branch <strong>of</strong> <strong>the</strong> Penobscot<br />
River through <strong>the</strong> Ripogenus Dam from 1985 <strong>to</strong> 1989 <strong>to</strong> be 27,683 lbs. This section<br />
<strong>of</strong> river is managed <strong>for</strong> trophy landlocked salmon.<br />
Lake trout: Lake trout thrive in oligotrophic lakes. In <strong>the</strong> summer months <strong>the</strong>y are<br />
typically found in <strong>the</strong> hypolimnion and <strong>the</strong>y prefer temperatures around 10 o C (Scott<br />
and Crossman 1973). In <strong>the</strong> winter <strong>the</strong>y can be found at any depth. During <strong>the</strong><br />
spring months, be<strong>for</strong>e stratification occurs, lake trout are <strong>of</strong>ten found in <strong>the</strong> lit<strong>to</strong>ral<br />
zone. They can be occasionally found in larger tributaries <strong>to</strong> lakes in <strong>the</strong> spring,<br />
especially during periods when smelts are spawning. In Maine, young lake trout are<br />
found in <strong>the</strong> deepest basins (> 30m) during <strong>the</strong> summer months. Lake trout spawn<br />
on rocky shoals and shorelines in mid <strong>to</strong> late Oc<strong>to</strong>ber in Maine. The eggs are<br />
scattered amongst <strong>the</strong> rocks and settle in <strong>the</strong> crevices, where <strong>the</strong>y overwinter.<br />
Water depth over egg deposition may vary, but Auclair (1985) states that lake trout<br />
eggs were deposited in approximately one meter <strong>of</strong> water on shoals in Moosehead<br />
Lake. Subsequent work on Moosehead Lake supports Auclair’s findings.<br />
PRFP Page 226
In Maine, lake trout feed primarily on smelts. From 1985 <strong>to</strong> 2006, MDIFW staff<br />
examined 593 lake trout s<strong>to</strong>machs from Sebec Lake. Smelts occurred in 61% <strong>of</strong> <strong>the</strong><br />
s<strong>to</strong>machs containing food and constituted 51% <strong>of</strong> <strong>the</strong> <strong>to</strong>tal volume <strong>of</strong> food items.<br />
White perch were <strong>the</strong> next most important identifiable prey item occurring in 26% <strong>of</strong><br />
<strong>the</strong> s<strong>to</strong>machs with food and representing 26% <strong>of</strong> <strong>the</strong> <strong>to</strong>tal volume. From 1971-2006,<br />
3,267 lake trout s<strong>to</strong>machs were examined from Moosehead Lake. Smelts were by<br />
far <strong>the</strong> most important food item. Smelts occurred in 72% <strong>of</strong> <strong>the</strong> s<strong>to</strong>machs containing<br />
food and represented 81% <strong>of</strong> <strong>the</strong> <strong>to</strong>tal volume <strong>of</strong> food. The next most important food<br />
item was yellow perch, which occurred in just 4% <strong>of</strong> <strong>the</strong> s<strong>to</strong>machs containing food,<br />
and represented 4 % <strong>of</strong> <strong>the</strong> <strong>to</strong>tal volume. Of <strong>the</strong> 20 o<strong>the</strong>r identified fish or<br />
invertebrate food items in <strong>the</strong> sample, none exceeded 3% <strong>of</strong> <strong>the</strong> <strong>to</strong>tal volume.<br />
Atlantic Salmon: Danie et al. (1984) provides <strong>the</strong> following summary <strong>of</strong> salmon life<br />
his<strong>to</strong>ry. Atlantic salmon ascend freshwater streams <strong>to</strong> spawn on gravel substrate<br />
from mid-Oc<strong>to</strong>ber <strong>to</strong> mid-November. In Maine, eggs incubate <strong>for</strong> 175 <strong>to</strong> 195 days<br />
depending on water temperature, and hatch in April or early May. After hatching, <strong>the</strong><br />
15 mm long yolk-sac larvae (alevins) remain buried in <strong>the</strong> gravel depressions <strong>for</strong> up<br />
<strong>to</strong> six weeks while absorbing <strong>the</strong> yolk-sac <strong>for</strong> nourishment. The resulting 25 mm long<br />
fry begin <strong>for</strong>aging <strong>for</strong> <strong>the</strong>mselves and emerge, usually at night, from <strong>the</strong> gravel<br />
depressions. Larger freshwater juveniles (parr) will remain in riffle sections <strong>of</strong><br />
streams until <strong>the</strong>y are 125-150 mm in length, which may take from two <strong>to</strong> three<br />
years. Failure <strong>to</strong> attain this length by spring or early summer <strong>of</strong> <strong>the</strong> year will prevent<br />
parr from trans<strong>for</strong>ming in<strong>to</strong> smolts (seaward migrating juveniles). After attaining this<br />
critical length, parr undergo smoltification, which includes physical and physiological<br />
changes adaptive <strong>to</strong> a migration <strong>to</strong> a marine environment. The parr marks disappear<br />
and <strong>the</strong> skin develops a silvery pigmentation from deposition <strong>of</strong> guanine in <strong>the</strong> skin,<br />
<strong>the</strong> tail leng<strong>the</strong>ns and becomes more deeply <strong>for</strong>ked, and schooling behavior<br />
develops. Increases in water temperature and water level trigger downstream<br />
migration <strong>of</strong> smolts. Smolts from <strong>the</strong> western Atlantic migrate, within 3m <strong>of</strong> <strong>the</strong><br />
surface <strong>of</strong> <strong>the</strong> ocean, <strong>to</strong> feeding areas in <strong>the</strong> Davis Strait between Labrador and<br />
Greenland. Atlantic salmon will return <strong>to</strong> natal rivers <strong>to</strong> spawn after one (grilse) or<br />
two (bright salmon) years at sea. Salmon accumulate in estuaries, bays, and river<br />
mouths, be<strong>for</strong>e ascending streams. Upstream migration <strong>of</strong> salmon coincides with<br />
increases in water flow. Adult salmon do not feed while in freshwater. Atlantic<br />
salmon do not consistently die after spawning, and many spent fish (kelts) survive<br />
<strong>the</strong> winter in freshwater and begin <strong>to</strong> feed again. Mortality is high when kelts enter<br />
saltwater. Those kelts that survive and migrate <strong>to</strong> feeding grounds in <strong>the</strong> Davis<br />
Strait, may become repeat spawners. (From USFWS<br />
(http://www.fws.gov/r5gomp/gom/habitatstudy/metadata/Atlantic_salmon_model.htm).<br />
Risks <strong>to</strong> Native Species from Niche Overlap<br />
Habitat in <strong>the</strong> mainstem <strong>of</strong> <strong>the</strong> Piscataquis River and <strong>the</strong> Sebec River are likely both<br />
suitable <strong>for</strong> <strong>the</strong> establishment <strong>of</strong> resident pike populations (Figure 10). Both rivers<br />
are s<strong>to</strong>cked with spring and fall yearling brook trout. These fish are scattered<br />
throughout <strong>the</strong> Piscataquis River from Abbot <strong>to</strong> East Dover, including in<strong>to</strong> or near<br />
many deadwater areas that would likely hold adult and sub-adult pike if <strong>the</strong>y are<br />
<strong>the</strong>re. The Sebec River is s<strong>to</strong>cked below <strong>the</strong> Sebec Lake Dam in<strong>to</strong> run/pool habitat,<br />
PRFP Page 227
and in <strong>the</strong> Town <strong>of</strong> Milo below <strong>the</strong> Milo Dam deadwater. Pike are known <strong>to</strong> prefer<br />
s<strong>of</strong>t-rayed fish as <strong>for</strong>age (Petrvozvanskiy 1988; Hakanson 2002), including s<strong>to</strong>cked<br />
salmonids, and <strong>the</strong>re<strong>for</strong>e, it is likely that <strong>the</strong>re will be impacts on <strong>the</strong> s<strong>to</strong>cked brook<br />
trout fisheries in <strong>the</strong>se river systems.<br />
Current barriers on <strong>the</strong> Sebec River prohibit pike passage in<strong>to</strong> <strong>the</strong> section below <strong>the</strong><br />
Sebec Dam, however, brook trout s<strong>to</strong>cked below <strong>the</strong> Milo Dam may be vulnerable <strong>to</strong><br />
predation from nor<strong>the</strong>rn pike. There are dams on <strong>the</strong> mainstem <strong>of</strong> <strong>the</strong> Piscataquis<br />
located in <strong>the</strong> Towns <strong>of</strong> Dover-Foxcr<strong>of</strong>t and Guil<strong>for</strong>d, which could potentially pass<br />
pike via existing fishways. A barrier <strong>to</strong> pike in <strong>the</strong> existing fishway at <strong>the</strong> Browns Mill<br />
Project in South Dover would protect approximately 80% <strong>of</strong> <strong>the</strong> s<strong>to</strong>cked area from<br />
<strong>the</strong> establishment <strong>of</strong> pike through natural dispersal.<br />
The mainstem <strong>of</strong> <strong>the</strong> Pleasant River in Brownville is also s<strong>to</strong>cked with spring yearling<br />
brook trout and <strong>the</strong>re are no barriers <strong>to</strong> prevent <strong>the</strong> natural movement <strong>of</strong> nor<strong>the</strong>rn<br />
pike in<strong>to</strong> this section <strong>of</strong> river. There are deadwater areas in this section that<br />
contribute <strong>to</strong> <strong>the</strong> trout fishery. Pike could impact <strong>the</strong> s<strong>to</strong>cked fishery in this area<br />
through direct predation on s<strong>to</strong>cked brook trout.<br />
There are natural barriers at Gauntlet Falls and Gulf Hagas on <strong>the</strong> East and West<br />
Branches <strong>of</strong> <strong>the</strong> Pleasant River. However, <strong>the</strong>re are large areas that contain intact<br />
wild brook trout populations below <strong>the</strong>se impasses and <strong>the</strong>re are no alternatives <strong>for</strong><br />
prohibiting natural pike dispersal from <strong>the</strong>se areas. These rivers are unlikely <strong>to</strong> hold<br />
large populations <strong>of</strong> adult pike due <strong>to</strong> unsuitable pike habitat. However, Silver Lake,<br />
Upper Ebeemee Lake, and Lower Ebeemee Lake are suitable pike habitat and are<br />
located within <strong>the</strong>se systems. There are also areas suitable <strong>for</strong> pike interspersed in<br />
several wild trout streams including: Rapid Brook, Whets<strong>to</strong>ne Brook, Roaring Brook,<br />
and Hous<strong>to</strong>n Brook.<br />
There are numerous small streams in <strong>the</strong> Piscataquis River drainage. While only a<br />
small percentage have been inven<strong>to</strong>ried, it is likely that many, if not most, <strong>of</strong> <strong>the</strong><br />
small streams that have a source <strong>of</strong> coldwater will also contain resident populations<br />
<strong>of</strong> wild brook trout. Young pike have been documented in <strong>the</strong>se types <strong>of</strong> habitats in<br />
Maine during summer months in streams that are within close proximity <strong>to</strong> lakes with<br />
self-sustaining pike populations. Since young pike do occasionally occur in <strong>the</strong>se<br />
habitats and <strong>the</strong>y prefer s<strong>of</strong>t-rayed fish <strong>the</strong>re could be impacts at <strong>the</strong> local level <strong>for</strong><br />
<strong>the</strong>se wild trout populations, through direct predation or competition <strong>for</strong> <strong>the</strong>rmal<br />
refuge.<br />
As previously stated, it is possible <strong>to</strong> create a barrier on <strong>the</strong> mainstem <strong>of</strong> <strong>the</strong><br />
Piscataquis River, which would protect some <strong>of</strong> <strong>the</strong>se streams. However, many<br />
more exist in areas where <strong>the</strong>re are no large-scale opportunities <strong>to</strong> preclude pike<br />
movement. There<strong>for</strong>e, in <strong>the</strong>se areas, each small tributary will have <strong>to</strong> be<br />
individually assessed <strong>for</strong> opportunities <strong>to</strong> create pike barriers, such as altering<br />
culverts. Recent stream crossing assessments by <strong>the</strong> Maine Forest Service <strong>for</strong> <strong>the</strong><br />
PRFP Page 228
Piscataquis drainage will likely <strong>of</strong>fer opportunities <strong>to</strong> identify specific road-stream<br />
crossings <strong>for</strong> restricting pike passage in<strong>to</strong> quality brook trout streams.<br />
There is considerable niche overlap between nor<strong>the</strong>rn pike and brook trout in<br />
lacustrine habitat. Both prefer <strong>the</strong> lit<strong>to</strong>ral zone and both may seek cool water during<br />
<strong>the</strong> warmest periods <strong>of</strong> <strong>the</strong> summer. In winter months, brook trout are almost<br />
exclusively found in shallow areas <strong>of</strong> lakes and ponds. Radio telemetry data from<br />
Pushaw Lake indicate that pike may be found in <strong>the</strong> deeper areas <strong>of</strong> <strong>the</strong> lake during<br />
<strong>the</strong> winter months, yet most anglers fish <strong>for</strong> pike in depths less than 7m during <strong>the</strong><br />
ice fishing season. Direct predation is possible in situations where pike and brook<br />
trout occupy <strong>the</strong> same areas, as well as competition <strong>for</strong> <strong>for</strong>age, such as minnow<br />
species and rainbow smelts.<br />
Most <strong>of</strong> <strong>the</strong> wild/native brook trout lakes in this drainage are already protected from<br />
pike due <strong>to</strong> natural barriers. There are two wild/native brook trout ponds that are not<br />
protected by such a barrier. Both <strong>of</strong> <strong>the</strong>se ponds are small and relatively shallow.<br />
Dow Pond is classified as a wild brook trout water. It has a principal fishery <strong>for</strong> brook<br />
trout and has not been s<strong>to</strong>cked in over 25 years. Greenleaf Pond in Abbot also<br />
contains a principal fishery <strong>for</strong> brook trout and has never been s<strong>to</strong>cked. The<br />
s<strong>to</strong>cking status was unclear at <strong>the</strong> time <strong>of</strong> <strong>the</strong> last IFW inven<strong>to</strong>ry update, but a<br />
subsequent review <strong>of</strong> <strong>the</strong> his<strong>to</strong>rical s<strong>to</strong>cking archives failed <strong>to</strong> produce any record <strong>of</strong><br />
s<strong>to</strong>cking and a follow-up field survey is scheduled <strong>for</strong> 2009. This pond also contains<br />
pickerel and, <strong>the</strong>re<strong>for</strong>e, it is likely that pike would have access <strong>to</strong> this water if <strong>the</strong>y<br />
were able <strong>to</strong> reach <strong>the</strong> outlet that flows in<strong>to</strong> <strong>the</strong> Piscataquis River in Abbot.<br />
The outlet <strong>to</strong> Dow Pond is below <strong>the</strong> Brown’s Mill Dam and <strong>the</strong>re<strong>for</strong>e, any pike<br />
barrier on <strong>the</strong> mainstem <strong>of</strong> <strong>the</strong> Piscataquis River would not affect passage <strong>to</strong> this<br />
wild trout pond. Currently <strong>the</strong>re are no pickerel in Dow Pond, which suggests that a<br />
culvert on <strong>the</strong> Rtes 6 and 16 crossing is effectively preventing pickerel from<br />
accessing Dow Pond.<br />
The outlet <strong>of</strong> Greenleaf Pond is above <strong>the</strong> Guil<strong>for</strong>d Dam, <strong>the</strong>re<strong>for</strong>e a barrier on <strong>the</strong><br />
mainstem below Guil<strong>for</strong>d could eliminate <strong>the</strong> risk from <strong>the</strong> establishment <strong>of</strong> pike<br />
through natural dispersal.<br />
There are many waters in <strong>the</strong> Piscataquis Drainage that have coldwater fisheries<br />
maintained through s<strong>to</strong>cking. Many are upstream <strong>of</strong> natural barriers. There are<br />
several s<strong>to</strong>cked brook trout and splake waters in <strong>the</strong> Piscataquis Drainage not<br />
protected by natural barriers including such as Cedar Lake and Endless Lake.<br />
Impacts on <strong>the</strong>se s<strong>to</strong>cked fisheries are likely <strong>to</strong> be more severe at Endless Lake due<br />
<strong>to</strong> <strong>the</strong> available pike habitat. Schoodic Lake and Seboeis Lake are both s<strong>to</strong>cked with<br />
brook trout and/or splake. There are no natural barriers <strong>to</strong> <strong>the</strong>se waters, although<br />
existing dams currently prohibit <strong>the</strong> movement <strong>of</strong> pike in<strong>to</strong> <strong>the</strong>se lakes.<br />
The potential <strong>for</strong> nor<strong>the</strong>rn pike <strong>to</strong> adversely impact landlocked salmon populations is<br />
higher in lakes than in rivers and streams primarily because <strong>of</strong> <strong>the</strong> differing habitat<br />
PRFP Page 229
equirements between <strong>the</strong> two species. Predation <strong>of</strong> salmon by pike could be a<br />
fac<strong>to</strong>r at habitat edges, <strong>for</strong> example at points where riffle tail waters in<strong>to</strong> a pool or<br />
dead water section <strong>of</strong> stream. Foraging competition would likely be insignificant<br />
where juvenile pike and salmon populations <strong>to</strong> exist in close proximity <strong>to</strong> one<br />
ano<strong>the</strong>r.<br />
Juvenile salmon migrate from streams <strong>to</strong> lakes at age 1 <strong>to</strong> 3 years old<br />
(smoltification) and may be vulnerable <strong>to</strong> predation by adult pike if <strong>the</strong> migration<br />
route involves long stretches <strong>of</strong> dead water suitable <strong>for</strong> adult pike. Likewise, juvenile<br />
salmon will be vulnerable <strong>to</strong> predation by pike in <strong>the</strong> lake until <strong>the</strong>y reach an<br />
adequate size <strong>to</strong> escape being eaten. However, even adult salmon in Long Pond,<br />
Maine have been observed <strong>to</strong> have scars presumed <strong>to</strong> be from Nor<strong>the</strong>rn pike.<br />
Competition <strong>for</strong> <strong>for</strong>age may exist between salmon and pike in lakes, particularly if<br />
<strong>for</strong>age is limited resulting in a situation where both species are relying heavily upon<br />
rainbow smelt.<br />
The impact <strong>of</strong> Nor<strong>the</strong>rn pike on populations <strong>of</strong> lake trout (<strong>to</strong>gue) will likely be low, as<br />
<strong>to</strong>gue thrive in oligotrophic lakes and Nor<strong>the</strong>rn pike tend <strong>to</strong> do better in mesotrophic<br />
lakes. Adverse interactions between juvenile life stages <strong>of</strong> <strong>the</strong> two species, ei<strong>the</strong>r<br />
through competition <strong>for</strong> resources or through predation is low, as lake trout utilize<br />
deeper areas <strong>of</strong> lakes beginning at a very young age, while young pike prefer<br />
shallow vegetated waters. Likewise, adult lake trout prefer much deeper water<br />
depth’s than pike during <strong>the</strong> summer, so little interaction would be expected during<br />
that time <strong>of</strong> year. Pike may compete with lake trout <strong>for</strong> <strong>for</strong>age. As with salmon, lake<br />
trout prefer smelt when available, and may grow poorly if smelt are limited supply.<br />
Lake trout are a slow growing; <strong>the</strong>re<strong>for</strong>e <strong>the</strong>y may be vulnerable <strong>to</strong> predation <strong>for</strong> a<br />
longer time period than o<strong>the</strong>r salmonids.<br />
At <strong>the</strong> youngest juvenile life stages <strong>of</strong> Atlantic salmon and nor<strong>the</strong>rn pike, <strong>the</strong>re is no<br />
evidence <strong>for</strong> potential habitat overlap. Both species require very specialized habitats<br />
<strong>for</strong> growth and survival. Juvenile pike generally require “increase <strong>of</strong> water depth by<br />
approximately 10cm deep <strong>for</strong> every week after peak spawning, until fish reach<br />
150mm in length” (Casselman, 1995), which tends <strong>to</strong> be <strong>the</strong> opposite <strong>of</strong> salmon and<br />
will fur<strong>the</strong>r distinguish habitat preferences.<br />
During <strong>the</strong> smolt stage, pike may pose <strong>the</strong> greatest threat. At this time, all young <strong>of</strong><br />
year (YOY) pike (>150mm) as well as sub-adults have reached a size where <strong>the</strong><br />
average smolt size is within <strong>the</strong> prey size range <strong>for</strong> pike (Hart and Hamrin 1988,<br />
Nilsson and Brönmark 1999, Vehanen 2004). With <strong>the</strong> onset <strong>of</strong> spring, longer days<br />
and warmer waters stimulate mature pike <strong>to</strong> congregate near river and stream inlets<br />
in preparation <strong>for</strong> spawning. At this time, salmon smolts may be at <strong>the</strong> greatest risk,<br />
since <strong>the</strong>y are going through physiological changes preparing <strong>the</strong>m <strong>for</strong> a down river<br />
migration through many varying habitats. In <strong>the</strong>se river corridors, waters have<br />
typically reached temperatures above 9°C (Casselman , 1978) where increases in<br />
juvenile NP swimming activity occur; temperatures less than this and below 6°C<br />
show less sign <strong>of</strong> swimming activity. Adult NP show “rapid somatic growth at<br />
PRFP Page 230
approximately 14°C”. These temperatures, 9-14°C ar e ideal <strong>for</strong> migrating salmon<br />
smolts, and raises increased concern <strong>for</strong> <strong>the</strong> predation <strong>of</strong> smolt during migration. If<br />
an Atlantic salmon population exists all migrating smolts may pass through areas<br />
where pike have congregated. As pike dispersal tends <strong>to</strong> occur in a downstream<br />
manner (Casselman, conference call March 13, 2009), this perpetuates <strong>the</strong> risk <strong>of</strong><br />
pike predation on smolts as new pike populations become established throughout<br />
<strong>the</strong> down stream salmon migration corridor. This could also be <strong>the</strong> case if pike<br />
populations established <strong>the</strong>mselves up a river system, which has been <strong>the</strong> case in<br />
Alaskan rivers and streams (Dave Rutz, Alaska Department <strong>of</strong> Fish and Game<br />
Division <strong>of</strong> Sport Fish, e-mail conversation with Tim Obrey, Regional Fisheries<br />
Biologist Moosehead Lake Region Maine Inland Fisheries and Wildlife, March 20,<br />
2009).<br />
Returning adult salmon have presumably reached a size, which in general has<br />
excluded <strong>the</strong>m from being prey <strong>for</strong> juvenile and sub-adult pike. If a substantial pike<br />
population persists, larger adult pike could pose a threat <strong>to</strong> one sea winter and some<br />
two-sea winter adult salmon, in estuaries, head ponds and bogin areas leading <strong>to</strong><br />
summer <strong>the</strong>rmal refugia or spawning shoals. This migration may pose a threat <strong>to</strong><br />
returning salmon when larger pike are seeking food sources.<br />
Potential Habitat Model <strong>for</strong> Nor<strong>the</strong>rn Pike<br />
General<br />
Nor<strong>the</strong>rn pike are distributed throughout much <strong>of</strong> <strong>the</strong> nor<strong>the</strong>rn hemisphere, including<br />
North America and Eurasia (Brautigam 2001). They are not native in Maine or <strong>the</strong><br />
rest <strong>of</strong> New England except in Lake Champlain in western Vermont.<br />
Nor<strong>the</strong>rn pike can <strong>to</strong>lerate a wide range <strong>of</strong> environmental conditions but are primarily<br />
a cool-water species best adapted <strong>to</strong> shallow (< 12 m), productive, mesotrophiceutrophic<br />
environments (Brautigam 2001; Casselman and Lewis 1996). Pike<br />
generally become well established in habitats that are relatively shallow and contain<br />
abundant emergent wetland and submerged aquatic vegetation, which is needed <strong>for</strong><br />
spawning, nursery and <strong>for</strong> juvenile and adult <strong>for</strong>aging habitat. Pike can occur in<br />
oligotrophic waters, but more commonly inhabit mesotrophic or borderline eutrophic<br />
lakes and ponds (Inskip 1982). They are known <strong>to</strong> <strong>to</strong>lerate brackish water<br />
conditions (salinities less than 7 ppt).<br />
Nor<strong>the</strong>rn pike show age-based and seasonal shifts in habitat. As nor<strong>the</strong>rn pike<br />
mature, <strong>the</strong>ir vegetation preference changes from emergent wetland <strong>for</strong> fry <strong>to</strong><br />
emergent wetland and aquatic macrophytes (submerged and floating) <strong>for</strong> juveniles<br />
<strong>to</strong> submerged aquatic vegetation <strong>for</strong> adults (Casselman and Lewis 1996). They<br />
typically occur in shallow water in <strong>the</strong> spring and fall, and seek relatively deeper<br />
water during <strong>the</strong> height <strong>of</strong> <strong>the</strong> summer and in winter in response <strong>to</strong> environmental<br />
conditions. During <strong>the</strong> summer, nor<strong>the</strong>rn pike will seek cooler temperatures when<br />
water temperature exceeds 20°C and are physiologica l impacted (lose <strong>of</strong> weight) at<br />
surface temperature above 25°C (Casselman and Lewis 1996). In winter, nor<strong>the</strong>rn<br />
PRFP Page 231
pike tend <strong>to</strong> occupy deeper habitats in response <strong>to</strong> ice cover, die-back <strong>of</strong> vegetation<br />
and oxygen depletion (Casselman and Lewis 1996).<br />
Spawning Habitat<br />
Nor<strong>the</strong>rn pike spawn in shallow, sheltered water over vegetation in spring shortly<br />
after ice-out, when <strong>the</strong>se shallows have warmed <strong>to</strong> 8-12°C (Casselman and Lewis<br />
1996; Brautigam 2001). Emergent wetland, such as grasses and sedges, are<br />
preferred spawning substrates, but o<strong>the</strong>r vegetation may also be used but would be<br />
considered poorer quality spawning habitat (Casselman and Lewis 1996).<br />
Adult pike will migrate certain distances <strong>to</strong> spawning habitat (Inskip 1982). In<br />
general, pike do not disperse widely and utilize <strong>the</strong> nearest suitable spawning site<br />
(Craig 2008). Evidence <strong>for</strong> both spawning-site and natal-site fidelity has been<br />
shown by mark and recapture experiments and by population genetics, which<br />
support previous findings (Craig 2008; Inskip 1982). The absence <strong>of</strong> inundated<br />
vegetation can inhibit spawning, and spawning success is strongly influenced by<br />
water-level changes (Inskip 1982). High water levels at time <strong>of</strong> spawning with<br />
stable levels after incubation period are optimum (Caselman and Lewis 1996).<br />
Caselman and Lewis (1996) developed a qualitative rating <strong>for</strong> spawning habitat and<br />
identified several fac<strong>to</strong>rs that were essential <strong>for</strong> spawning habitat, including<br />
vegetation type and density, water level depth, water fluctuation and <strong>the</strong> exposure <strong>of</strong><br />
<strong>the</strong> location.<br />
Nursery Habitat<br />
In <strong>the</strong> early life stages, nor<strong>the</strong>rn pike are highly dependent on vegetation and <strong>the</strong>ir<br />
behavior and survival may depend on <strong>the</strong> extent and <strong>for</strong>m <strong>of</strong> cover (Craig 2008).<br />
Casselman and Lewis (1996) identified three optimum criteria <strong>for</strong> nursery habitat.<br />
The best habitat is contiguous with <strong>the</strong> spawning habitat; is composed <strong>of</strong> dense<br />
emergent wetland or aquatic macrophytes with between 40 and 90% cover; and is<br />
greater than 10 times <strong>the</strong> area <strong>of</strong> spawning habitat.<br />
The habitat frequented by young nor<strong>the</strong>rn pike during <strong>the</strong> first year is described by<br />
an increase <strong>of</strong> water depth by approximately 10 cm deep <strong>for</strong> every week after peak<br />
spawning, until <strong>the</strong> fish reach 150 mm in length (Casselman and Lewis 1996). The<br />
deepest depth occupied by young-<strong>of</strong>-year nor<strong>the</strong>rn pike was about 250 cm.<br />
Temperature is a very important fac<strong>to</strong>r <strong>for</strong> young-<strong>of</strong>-year nor<strong>the</strong>rn pike. The<br />
optimum temperature range is 22 <strong>to</strong> 23°C, a higher o ptimal temperature than<br />
juvenile or adult fish. Casselman and Lewis (1996) also found a significant<br />
correlation between year-class strength and mean temperature <strong>for</strong> July and August<br />
where ei<strong>the</strong>r a lower or higher temperature deviation from optimum resulted in much<br />
reduced year-class strength.<br />
Juvenile and Adult Habitat<br />
Juvenile and adult nor<strong>the</strong>rn pike are visual preda<strong>to</strong>rs and are primarily active during<br />
<strong>the</strong> day but usually feed crepuscularly. Their “ambush” predation style requires<br />
PRFP Page 232
cover, and aquatic macrophytes are preferred (Craig 2008). Adult nor<strong>the</strong>rn pike are<br />
generally found near <strong>the</strong> edge <strong>of</strong> vegetation or are o<strong>the</strong>rwise associated with<br />
structure in <strong>the</strong> lake and are typically sedentary (Brautigam 2001). A water body<br />
typically needs more than 25 % submerged macrophytes <strong>for</strong> a nor<strong>the</strong>rn pike<br />
dominated fish community <strong>to</strong> exist (Casselman and Lewis 1996). Optimal conditions<br />
<strong>for</strong> juvenile and adult habitat occur with intermediate densities <strong>of</strong> vegetative cover.<br />
Catches <strong>of</strong> juvenile and adult nor<strong>the</strong>rn pike were low at low macrophyte densities,<br />
highest at intermediate densities (35%-80%) and low in very dense, continuous<br />
vegetation (Casselman and Lewis 1996).<br />
Although nor<strong>the</strong>rn pike generally prefer shallow vegetated areas (usually less than 4<br />
m but sometimes as deep as 12 m) <strong>the</strong>y are not necessarily strongly tied <strong>to</strong> this<br />
habitat and exhibit some versatility in habitat selection. The selection and use <strong>of</strong><br />
vegetated areas depends on <strong>the</strong> size <strong>of</strong> fish with larger fish observed at <strong>the</strong><br />
vegetated, open-water, or at <strong>the</strong> interface <strong>of</strong> <strong>the</strong>se habitats and <strong>the</strong> smaller fish<br />
selecting more heavily vegetated areas (Casselman and Lewis 1996).<br />
Temperature is an important environmental fac<strong>to</strong>r <strong>for</strong> nor<strong>the</strong>rn pike with optimal<br />
temperature being 19 <strong>to</strong> 21°C (Casselman and Lewis 1 996). Nor<strong>the</strong>rn pike seek<br />
cooler temperatures when water temperature exceeds 20°C; are physiologically<br />
impacted (loss <strong>of</strong> weight) at surface temperatures above 25°C; and are significantly<br />
(even lethally) impaired above a range <strong>of</strong> 29.4 and 30°C (Casselman and Lewis<br />
1996). Early summer temperatures below 18°C are su boptimal <strong>for</strong> adult pike and<br />
will not result in <strong>the</strong> establishment <strong>of</strong> resident populations (J. Casselman, Queen’s<br />
University, personal communication, February 11, 2009). This relatively narrow<br />
water temperature <strong>to</strong>lerance may explain why nor<strong>the</strong>rn pike typically retreat <strong>to</strong><br />
deeper, colder areas in summer, yet nor<strong>the</strong>rn pike rarely occur below <strong>the</strong><br />
<strong>the</strong>rmocline in lakes that stratify (Inskip 1982).<br />
Nor<strong>the</strong>rn pike are relatively <strong>to</strong>lerant <strong>of</strong> low dissolved oxygen, but can be impacted by<br />
anoxic conditions ei<strong>the</strong>r in summer or winter (Inskip 1982). Well-oxygenated water<br />
in spawning and adjacent nursery habitat appears <strong>to</strong> be important <strong>for</strong> optimal<br />
reproduction <strong>of</strong> nor<strong>the</strong>rn pike (Casselman and Lewis 1996).<br />
Nor<strong>the</strong>rn pike have been found <strong>to</strong> be flexible in <strong>the</strong>ir response <strong>to</strong> water clarity and<br />
difference in behavior can be found within locations and populations (Craig 2008).<br />
Casselman and Lewis (1996) found that nor<strong>the</strong>rn pike weight was positively related<br />
<strong>to</strong> Secchi depth. For Secchi depth over 3 meters <strong>the</strong>n an increase in Secchi depth<br />
<strong>of</strong> 1 meter resulted in an increase in nor<strong>the</strong>rn pike weight <strong>of</strong> 6 percent.<br />
Nor<strong>the</strong>rn pike are not adapted <strong>to</strong> strong currents. Riverine habitat may be suitable<br />
<strong>for</strong> pike if it resembles a lake environment, i.e., standing or very slow moving. Water<br />
velocity exceeding 1.5 m/s can block spawning migrations (Inskip 1982). Nor<strong>the</strong>rn<br />
pike have little use <strong>for</strong> riverine habitats where <strong>the</strong> gradient exceeds 5 m/km (0.5 %<br />
slope), and have less <strong>to</strong>lerance <strong>for</strong> gradient than muskellunge (Inskip 1982).<br />
PRFP Page 233
However, it was determined that nor<strong>the</strong>rn pike dispersal in Sweden was precluded<br />
only when maximum stream slope approached 6.6 % (Spens et al. 2007).<br />
Dispersal<br />
Emigration and immigration can play an important role in fish population dynamics,<br />
however dispersal does not appear <strong>to</strong> be a significant population mechanism <strong>for</strong> <strong>the</strong><br />
nor<strong>the</strong>rn pike (Craig 2008). They are mainly but not exclusively sedentary and do<br />
not move far from a home range (Craig 2008). Nor<strong>the</strong>rn pike that disperse or<br />
migrate exhibit homing behavior as <strong>the</strong>y generally returned <strong>to</strong> <strong>the</strong> same spawning<br />
area <strong>the</strong> following year (Craig 2008). Females ra<strong>the</strong>r than males generally move<br />
greater distances (Koed et al. 2006). However, <strong>the</strong> migration distances between<br />
summer and spawning habitat are typically less than 2 kilometer and not more than<br />
10 kilometers (J. Casselman, Queen’s University, personal communication,<br />
February 11, 2009).<br />
Potential Habitat Model<br />
Abiotic fac<strong>to</strong>rs, such as temperature and vegetation, on nor<strong>the</strong>rn pike population<br />
dynamics are well established (Craig 2008). Several <strong>of</strong> <strong>the</strong>se fac<strong>to</strong>rs were used <strong>to</strong><br />
develop a model <strong>of</strong> potential habitat <strong>for</strong> pike in <strong>the</strong> Piscataquis River watershed. A<br />
model is a representation <strong>of</strong> a system or process that can be used <strong>to</strong> define a<br />
problem, organize an approach, understand <strong>the</strong> available data and make predictions<br />
(Starfield and Bleloch1986). Given that models are representations, <strong>the</strong>y have<br />
limitations based on <strong>the</strong> level <strong>of</strong> understanding one has about <strong>the</strong> issue and <strong>the</strong> type<br />
<strong>of</strong> data that is available.<br />
For nor<strong>the</strong>rn pike, <strong>the</strong> scientific literature is well established and provides a robust<br />
level <strong>of</strong> understanding. However, data on nor<strong>the</strong>rn pike (and <strong>to</strong> some extent our<br />
understanding) in Maine is limited. A model is one way <strong>to</strong> support management<br />
decisions that will be made on <strong>the</strong> overall risk from nor<strong>the</strong>rn pike when <strong>the</strong>re is<br />
uncertainty in our understanding or available data. The modeling approached was<br />
based on examining <strong>the</strong> critical habitat criteria <strong>for</strong> nor<strong>the</strong>rn pike discussed above,<br />
developing indica<strong>to</strong>rs from <strong>the</strong> literature <strong>for</strong> representing <strong>the</strong> habitat criteria and <strong>the</strong>n<br />
applying <strong>the</strong> indica<strong>to</strong>rs <strong>to</strong> develop a combined measure <strong>of</strong> habitat potential.<br />
Two potential habitat models were developed based on waterbodies (lakes and<br />
ponds) and waterways (streams and rivers). The models are based on <strong>the</strong> fac<strong>to</strong>rs<br />
and measures that could be developed using existing in<strong>for</strong>mation <strong>for</strong> <strong>the</strong> watershed<br />
(Tables 4 and 5). The model results are representative <strong>of</strong> habitat conditions based<br />
on <strong>the</strong> best available in<strong>for</strong>mation and assume a positive relationship between habitat<br />
conditions and <strong>the</strong> capacity <strong>for</strong> establishing resident pike populations. The results<br />
are provided as a ranking (low, medium or high potential) <strong>for</strong> waterbodies and as a<br />
value <strong>of</strong> 0 <strong>to</strong> 1 (0 being no or low suitability) <strong>for</strong> waterways.<br />
Methods<br />
Tables 4 and 5 describe <strong>the</strong> measures that were developed as critical habitat<br />
parameters based on: 1) <strong>the</strong> literature on <strong>the</strong> habitat requirements <strong>of</strong> nor<strong>the</strong>rn pike<br />
PRFP Page 234
and 2) <strong>the</strong> availability <strong>of</strong> data in Maine available <strong>for</strong> <strong>the</strong> watershed. The habitat<br />
parameters were developed first and <strong>the</strong>n applied without prior knowledge or<br />
through <strong>the</strong> direct use <strong>of</strong> <strong>the</strong> waterbody/waterway characteristics. Morphometric<br />
characteristics and water quality data were obtained from MDIFW (M. Gallagher,<br />
Fisheries Research Station, Bangor) and MDEP (R. Bouchard, Lake Moni<strong>to</strong>ring<br />
Program, Augusta). Wetland coverage and type were obtained through <strong>the</strong> National<br />
Wetland Inven<strong>to</strong>ry. Waterway data was obtained by modifying a model developed <strong>to</strong><br />
predict Atlantic salmon spawning and rearing habitat in Maine (Wright et al. 2008)<br />
through <strong>the</strong> use <strong>of</strong> hydraulic-geometry relations developed by Dudley (2004) <strong>for</strong><br />
rivers in coastal and central Maine.<br />
The waterbody classification was completed <strong>for</strong> 196 lakes and ponds in <strong>the</strong><br />
Piscataquis River watershed and was limited <strong>to</strong> those waterbodies that were greater<br />
than 2 HA (about 5 acres). Not all parameters were used in <strong>the</strong> waterbody<br />
classification because <strong>of</strong> <strong>the</strong> lack <strong>of</strong> water quality data. Early summer temperature<br />
(parameter 8) was available <strong>for</strong> only two lakes, <strong>to</strong>tal nitrogen (parameter 6) was<br />
available <strong>for</strong> 5 lakes, and summer water temperature was available <strong>for</strong> 26 lakes.<br />
These parameters were not used in <strong>the</strong> ranking approach. The lack <strong>of</strong> temperature<br />
data was un<strong>for</strong>tunate since Casselman and Lewis (1996) found that temperature<br />
was a significant parameter <strong>for</strong> determining <strong>the</strong> potential <strong>to</strong> develop a resident<br />
population.<br />
The waterbody model used a variation <strong>of</strong> <strong>the</strong> simple multiple attribute ranking<br />
technique (Goodwin and Wright 2004). Each waterbody was classified in<strong>to</strong> low,<br />
medium and high categories <strong>for</strong> each <strong>of</strong> <strong>the</strong> six parameters (Table 4). A parameter<br />
was not developed <strong>for</strong> a waterbody if no data was available. For example, <strong>the</strong> lake<br />
trophic state parameter was developed <strong>for</strong> 108 waterbodies but not <strong>for</strong> 86<br />
waterbodies (Table 4). A weight from 1 (less important) <strong>to</strong> 3 (more important) was<br />
assigned <strong>to</strong> each parameter through pr<strong>of</strong>essional judgment <strong>of</strong> <strong>the</strong> work group <strong>to</strong><br />
emphasize <strong>the</strong> importance <strong>of</strong> <strong>the</strong> life stage<br />
PRFP Page 235
Table 4 Nor<strong>the</strong>rn Pike Waterbody Habitat Parameters<br />
No. Habitat Parameter<br />
1 Lake Trophic State<br />
2 Lake Maximum<br />
Depth<br />
3 Spawning Habitat -<br />
Emergent Wetland<br />
4 Nursery Habitat –<br />
Emergent Habitat<br />
5 1 Water Temperature<br />
– Year Class<br />
Strength Condition<br />
6 1 Productivity using<br />
Length at Age II<br />
7 Productivity using<br />
Water Clarity<br />
8 1 Water Temperature<br />
- Resident<br />
9 Submerged<br />
Vegetation – Lake<br />
Cover<br />
Low Medium High Weight No. <strong>of</strong> Waterbodies<br />
with Data <strong>to</strong> Apply<br />
Parameter<br />
Description<br />
Oligatrophic Eutrophic Mesatrophic 2 108 Lake trophic classification<br />
< 1 m >12 m 1 - 12 m 2 91 Preferred water depth based on macrophyte<br />
occurrence, water clarity and occurrence from<br />
PRFP Page 236<br />
(Casselman and Lewis 1996)<br />
0.15 3 196 Ratio <strong>of</strong> emergent wetland (as defined by <strong>the</strong> National<br />
Wetland Inven<strong>to</strong>ry) within 200 m <strong>of</strong> <strong>the</strong> waterbody<br />
shoreline <strong>to</strong> <strong>to</strong>tal lake area from Inskip (1982)<br />
7.5 3 196 Nor<strong>the</strong>rn pike biomass (kg ha -1 ) based on % emergent<br />
wetland (National Wetland Inven<strong>to</strong>ry) within a 10 m <strong>of</strong><br />
<strong>the</strong> waterbody shoreline from Craig(1996): biomasss =<br />
4.875*(% emergent wetlands)<br />
< .2 0.2 – 0.6 >0.6 26 Average temperature in July-August <strong>to</strong> predict juvenile<br />
survival from Caselman and Lewis 1996): year class<br />
strength = 1474.81-199.59T +8.97T 2 -0.13T 3<br />
50 cm 5 Fish growth rate model based on lake morphometric<br />
measures and water quality from Wagner et al. (2006):<br />
growth =56.6(TN)-16(Color)+21.1(Mean<br />
Depth)+1.64(Lake Area)+466.5<br />
< 6.5m 6.5-13m > 13m 2 39 Fish growth based on water clarity from Casselman and<br />
Lewis (1996): weight = (Secchi-3)*0.06<br />
25°C<br />
19-19°C<br />
or 21-<br />
25°C<br />
19-21°C 2 Average temperature in early summer (Jun e 21 <strong>to</strong> July<br />
21) that determines <strong>the</strong> potential <strong>to</strong> develop a resident<br />
> 25% lake<br />
cover<br />
1 Parameters not used in <strong>the</strong> classification because <strong>of</strong> <strong>the</strong> lack <strong>of</strong> water quality data<br />
population from Casselman and Lewis (1996)<br />
2 39 Percent macrophyte lake cover through methods<br />
developed by Hakanson and Boulion (2002):<br />
%macrophyte cover = (10.49+1.502(Secchi/Mean<br />
Depth)-1.993(90/90-Latitude)-0.433SQRT(Maximum<br />
Depth)+0.490(log(Area <strong>of</strong> lake
Table 5 Nor<strong>the</strong>rn Pike Waterway Habitat Parameters<br />
No. Habitat<br />
Habitat Suitability<br />
Description<br />
Parameter 0 0.2 0.4 0.6 0.8 1<br />
10 Low Flow 16 cm Exclusionary criteria <strong>for</strong> waterway based on minimum low flow depth<br />
Minimum Water<br />
Depth<br />
using average depth <strong>of</strong> channel during low flow period.<br />
11 Maximum >=6.6% = 5 cm/sec < 5 cm/sec Exclusionary criteria from Inskip(1982) based on maximum velocity <strong>of</strong><br />
Velocity<br />
less than 5 cm/sec <strong>for</strong> nor<strong>the</strong>rn pike using average velocity during low<br />
flow period<br />
13 Stream Gradient >=0.5% 0.40 0.25 0.20 0.15
(early life stages were weighted more than later life stages) or <strong>the</strong> reliability <strong>of</strong> <strong>the</strong><br />
parameter. A weighted rank (weighted sum <strong>of</strong> each parameter divided by <strong>the</strong> sum <strong>of</strong><br />
<strong>the</strong> weights) was developed <strong>for</strong> each waterbody and classified in<strong>to</strong> low, medium and<br />
high potential nor<strong>the</strong>rn pike habitat.<br />
The waterway model used a variation <strong>of</strong> that proposed by Inskip (1982) and used only<br />
stream and river hydraulic characteristics. Hydraulic-geometry relationships (Dudley<br />
2004 and Wright et al. 2008) were used <strong>to</strong> approximate waterway channel<br />
characteristics <strong>for</strong> <strong>the</strong> low flow period (average velocity, depth and gradient) <strong>for</strong> each<br />
stream or river in <strong>the</strong> watershed. The classification was completed <strong>for</strong> stream or river<br />
segments or reaches <strong>to</strong> allow <strong>for</strong> more continuous classification along <strong>the</strong> length <strong>of</strong> a<br />
particular waterway (see Wright et al. 2008). A habitat suitability index was calculated<br />
from four parameters in Table 5. Three <strong>of</strong> <strong>the</strong> parameters (parameters 10-12) were<br />
exclusionary (ei<strong>the</strong>r present or absent). Stream gradient (parameter 12) was assigned<br />
five values ranging from 0 (not suitable) <strong>to</strong> 1 (most suitable). A habitat suitable index<br />
(HSI) was developed <strong>for</strong> each waterway segment by multiplying each <strong>of</strong> <strong>the</strong> parameter<br />
values. The HSI was assigned a value from 0 (not suitable) <strong>to</strong> 1 (most suitable) <strong>for</strong> all<br />
<strong>the</strong> classified waterway segments.<br />
Results<br />
The results <strong>for</strong> <strong>the</strong> waterbody and waterway models should be viewed as only indica<strong>to</strong>rs<br />
<strong>of</strong> <strong>the</strong> nor<strong>the</strong>rn pike population-habitat relationships with <strong>the</strong>ir primary value being <strong>to</strong><br />
improve decision-making in a structured approach. The models are only one aspect <strong>of</strong><br />
identifying <strong>the</strong> risk <strong>of</strong> nor<strong>the</strong>rn pike introductions and should not be relied upon solely <strong>for</strong><br />
decision making.<br />
1. Two ponds ranked high (Towne Pond and Oak Knoll Bog) with each pond being<br />
less than 8 HA in area (20 acres). High ranked waterbodies accounted <strong>for</strong> about<br />
1 percent <strong>of</strong> all <strong>the</strong> lakes and ponds.<br />
2. Ninety-four waterbodies ranked as medium potential and ranged from 2 <strong>to</strong> 582<br />
HA. About 90 percent were less than 40 HA (about 100 acres). The five largest<br />
waterbodies ranked as medium potential include: Endless Lake, Ebeemee Lake,<br />
Burden Pond, Second and Third Branch Ponds, and Shirley Bog. Medium<br />
ranked waterbodies accounted <strong>for</strong> 48 percent <strong>of</strong> all <strong>the</strong> lakes and ponds. Of<br />
<strong>the</strong>se, only Ebeemee and Endless will be accessible. All o<strong>the</strong>rs are above<br />
Sebec Dams (Burden), waterfalls (second and third WB Ponds) or Dover.<br />
3. One hundred waterbodies ranked as low potential and ranged from 2 <strong>to</strong> 2,841<br />
HA. They accounted <strong>for</strong> about 51 percent <strong>of</strong> all <strong>the</strong> lakes and ponds. About 66<br />
percent were less than 40 HA (about 100 acres). The five largest waterbodies<br />
ranked as low potential were: Schoodic Lake, Sebec Lake, Seboeis Lake, Lower<br />
Wilson Pond and Lake Onawa.<br />
PRFP Page 238
4. The 40 largest watebodies in <strong>the</strong> Piscataquis River watershed and <strong>the</strong>ir rank are<br />
listed in Table 6. Figure 9 shows <strong>the</strong> distribution and location <strong>of</strong> <strong>the</strong> ranked<br />
waterbodies in <strong>the</strong> watershed.<br />
Table 6 Piscaquis River Waterbodies Ranked <strong>for</strong> Nor<strong>the</strong>rn Pike Habitat Potential<br />
MIDAS Waterbody Name Area (acre) Area (HA) Rank<br />
956 Schoodic Lake 7,021 2,841 Low<br />
848 Sebec Lake 6,362 2,575 Low<br />
954 Seboeis Lake 4,913 1,988 Low<br />
942 Endless Lake 1,439 582 Medium<br />
342 Lower Wilson Pond 1,414 572 Low<br />
894 Lake Onawa 1,192 482 Low<br />
314 Bald Mountain Pond 1,146 464 Low<br />
2130 East Branch Lake 1,122 454 Low<br />
410 Upper Wilson Pond 987 399 Low<br />
914 Ebeemee Lake 905 366 Medium<br />
2004 Cedar Lake 654 265 Low<br />
916 Big Hous<strong>to</strong>n Pond 644 261 Low<br />
800 Long Pond 644 261 Low<br />
301 Lake Hebron 638 258 Low<br />
478 B Pond 610 247 Low<br />
758 Manhancock Pond 475 192 Low<br />
262 Kingsbury Pond 432 175 Low<br />
298 Piper Pond 423 171 Low<br />
838 First Buttermilk Pond 389 158 Low<br />
4130 Branns Mill Ponds 352 142 Low<br />
380 Monson Pond 351 142 Low<br />
864 Big Benson Pond 332 134 Low<br />
814 Indian Pond 290 117 Low<br />
2006 Flatiron Pond 284 115 Low<br />
922 Silver Lake 279 113 Low<br />
296 Whets<strong>to</strong>ne Pond 256 104 Low<br />
780 Rum Pond 232 94 Low<br />
774 First Davis Pond 216 87 Low<br />
884 Big Greenwood Pond 210 85 Low<br />
834 Burden Pond 201 82 Medium<br />
442 Second and Third Branch Ponds 199 80 Medium<br />
966 Upper Ebeemee Lake 192 78 Low<br />
260 Mayfield Pond 188 76 Low<br />
273 Buttermilk Pond 183 74 Low<br />
350 Shirley Bog (West) 179 73 Medium<br />
756 Harlow Pond 179 72 Medium<br />
368 Spectacle Ponds 178 72 Low<br />
412 Horseshoe Pond 171 69 Medium<br />
828 Little Benson Pond 149 60 Medium<br />
PRFP Page 239
Figure 9 Distribution and location <strong>of</strong> <strong>the</strong> ranked nor<strong>the</strong>rn pike waterbodies in <strong>the</strong> watershed<br />
PRFP Page 240
5. About 97 percent <strong>of</strong> <strong>the</strong> rivers and streams (2,714 km) in <strong>the</strong> watershed were<br />
assigned a HSI value <strong>of</strong> 0.<br />
6. Of <strong>the</strong> 3 percent (97 km) that were assigned a HSI value <strong>of</strong> 0.2 or higher, most<br />
were located in <strong>the</strong> Piscataquis River mainsteam downstream <strong>of</strong> <strong>the</strong> Town <strong>of</strong><br />
Guil<strong>for</strong>d and in <strong>the</strong> lower Sebec and Pleasant Rivers near <strong>the</strong> confluence <strong>of</strong> <strong>the</strong><br />
Piscataquis River (Figure 10).<br />
7. Ninety-four percent <strong>of</strong> <strong>the</strong> river segments that were suitable potential habitat <strong>for</strong><br />
nor<strong>the</strong>rn pike were rated as higher suitability (HSI values <strong>of</strong> 0.8 or 1).<br />
Figure 10 Riverine Rank <strong>for</strong> potential nor<strong>the</strong>rn pike habitat<br />
Verification/calibration <strong>of</strong> <strong>the</strong> nor<strong>the</strong>rn pike potential habitat model<br />
The calibration/verification was completed by:<br />
1. Normalizing <strong>the</strong> ratings that Robert VanRiper (MDIFW Biologist, Region B)<br />
provided <strong>for</strong> <strong>the</strong> nor<strong>the</strong>rn pike lakes in Region B <strong>to</strong> low, medium and high.<br />
VanRiper rated <strong>the</strong> lakes from 0 <strong>to</strong> 5 according <strong>to</strong> <strong>the</strong> following criteria:<br />
PRFP Page 241
5 - Fishery receives significant angling pressure (25% or more targeting<br />
fish) with decent catch rate (numbers and size)<br />
3 - Not principle fishery receiving 10% angling pressure with moderate<br />
catch rate (numbers and size)<br />
0 - Present but small fish with potentially large numbers <strong>of</strong> very small fish<br />
and few year classes (struggling population)<br />
2. Comparing <strong>the</strong> model classification <strong>to</strong> VanRiper 's ratings and trying <strong>to</strong><br />
improve <strong>the</strong> classification by changing <strong>the</strong> parameter weights.<br />
3. Modifying <strong>the</strong> lake depth parameter by testing mean lake depth, secchi/mean<br />
depth, lake area at 1 meter, and proportion <strong>of</strong> lake area at 1 meter (<strong>for</strong> lit<strong>to</strong>ral<br />
area). O<strong>the</strong>r parameters, such as slope, water temperature and <strong>the</strong> use <strong>of</strong> <strong>the</strong><br />
IFW wading bird and waterfowl habitat instead <strong>of</strong> NWI were used <strong>to</strong> try <strong>to</strong> explain<br />
or improve <strong>the</strong> classification.<br />
No improvements were made over <strong>the</strong> original model and weightings. The model<br />
correctly classified 66% percent <strong>of</strong> <strong>the</strong> nor<strong>the</strong>rn pike lakes rated by VanRiper,<br />
over classified 17% <strong>of</strong> <strong>the</strong> lakes (<strong>the</strong> model predicted a higher potential than <strong>the</strong><br />
rating), and under classified 17% <strong>of</strong> <strong>the</strong> lakes (<strong>the</strong> model predicted a lower<br />
potential than <strong>the</strong> rating). Overall, <strong>the</strong> model conservatively classified 83% <strong>of</strong> <strong>the</strong><br />
lakes by classifying <strong>the</strong>m correctly or overestimating <strong>the</strong> lake potential<br />
(classifying a lake as medium that VanRiper identified as low).<br />
The five nor<strong>the</strong>rn pike lakes that were under classified by <strong>the</strong> model were<br />
reviewed. Lake areas > 1000 HA, mesotrophic lakes, lakes that stratefy and <<br />
0.5 meters per year <strong>of</strong> run<strong>of</strong>f from watershed are <strong>the</strong> parameters that most<br />
predicted <strong>the</strong> model's under classified lakes in Region B (Ingham, Long, Great,<br />
Messalonskee and Little North/North Ponds). However, <strong>the</strong> lake type<br />
(mesotrophic) may be more indicative <strong>of</strong> lakes in Region B than Region F.<br />
Based on this screening criteria, at least three lakes would need <strong>to</strong> be reviewed<br />
using best pr<strong>of</strong>essional judgment: Silver, Upper Ebeemee and Seboeis Lakes.<br />
They meet some but not all <strong>of</strong> <strong>the</strong> screening criteria.<br />
In July 2009, <strong>the</strong> regional biologist were asked <strong>to</strong> review <strong>the</strong> results <strong>of</strong> <strong>the</strong> model<br />
and assign new ranks where needed and <strong>the</strong> reason <strong>for</strong> doing so. Ebeemee<br />
Lake, Endless Lake, Pond Farm Pond, Seboeis Lake, Silver Lake and Upper<br />
Ebeemee Lake were all rated as a medium during <strong>the</strong> pr<strong>of</strong>essional review ra<strong>the</strong>r<br />
than a low risk based on a healthy pickerel population is established in <strong>the</strong> lakes,<br />
and due <strong>to</strong> <strong>the</strong> abundance <strong>of</strong> pike spawning and nursery habitat.<br />
PRFP Page 242
Human-Caused Introductions<br />
Background<br />
There are three primary pathways <strong>for</strong> nor<strong>the</strong>rn pike: human-caused introduction; natural<br />
dispersal through volitional movement; and natural dispersal through non-volitional<br />
movement. Human-caused introductions are intentional or non-intentional introductions<br />
<strong>of</strong> nor<strong>the</strong>rn pike by people. Natural dispersal through volition movement are<br />
introductions that occur when nor<strong>the</strong>rn pike disperse <strong>to</strong> o<strong>the</strong>r locations through<br />
connected waterways. Natural dispersal through non-volitional movement are<br />
introductions by o<strong>the</strong>r natural means, such as <strong>the</strong> transport <strong>of</strong> fish by rap<strong>to</strong>rs <strong>to</strong> water<br />
bodies that may not have been connected <strong>to</strong> <strong>the</strong> waterbody <strong>of</strong> origin. The record <strong>of</strong><br />
nor<strong>the</strong>rn pike discovery was analyzed <strong>to</strong> determine: 1) <strong>the</strong> pattern <strong>of</strong> introduction and<br />
dispersal; 2) <strong>the</strong> rate <strong>for</strong> introductions and dispersal through <strong>the</strong>se introductions; and 3)<br />
<strong>the</strong> annual probability <strong>of</strong> an introduction through ei<strong>the</strong>r pathway.<br />
The discovery record is a his<strong>to</strong>ric account <strong>of</strong> <strong>the</strong> year that nor<strong>the</strong>rn pike were<br />
discovered in a lake or river. The introduction pathway is most <strong>of</strong>ten unobservable so it<br />
is difficult <strong>to</strong> be entirely certain <strong>of</strong> <strong>the</strong> pathway or <strong>the</strong> period it <strong>to</strong>ok <strong>to</strong> discovery <strong>the</strong><br />
population (Costello and Solow 2003; Solow and Costello 2004). Never<strong>the</strong>less,<br />
methods have been developed <strong>to</strong> model <strong>the</strong> discovery record <strong>to</strong> provide insight on <strong>the</strong><br />
process <strong>of</strong> introduction. This analysis is limited <strong>to</strong> human-caused and natural dispersal<br />
through volitional movement and assumes that natural dispersal through non-volitional<br />
movement (transport by birds) is a minor contribution <strong>to</strong> nor<strong>the</strong>rn pike dispersal.<br />
Method<br />
The discovery record was developed from <strong>the</strong> MDIFW database used <strong>to</strong> track nor<strong>the</strong>rn<br />
pike introductions (M. Gallagher, January 2008). The database includes <strong>the</strong> lake (and<br />
coordinate location); year <strong>of</strong> discovery; whe<strong>the</strong>r <strong>the</strong> introduction was confirmed by a<br />
reliable source; and a MDIFW judgment on whe<strong>the</strong>r pike are present in <strong>the</strong> lake. The<br />
discovery records were categorized based on <strong>the</strong> reliability (high, medium and low).<br />
High reliability means that MDIFW determined that pike presence was likely and<br />
confirmed; medium reliability was that presence was likely but pike were not confirmed;<br />
and low reliability was unknown presence and confirmation. Only <strong>the</strong> records with high<br />
and medium reliability were used in <strong>the</strong> analysis (Table 7).<br />
The pathway <strong>for</strong> each discovery record was classified as ei<strong>the</strong>r introduced or dispersal<br />
by examining <strong>the</strong> hydrological characteristics <strong>of</strong> <strong>the</strong> lake and determining whe<strong>the</strong>r it was<br />
isolated (first recorded occurrence in a watershed, geologically isolated through<br />
glaciation, or located at a watershed terminus); whe<strong>the</strong>r a downstream barrier existed<br />
that may prevent pike from migrating upstream; and what sources <strong>of</strong> pike were ei<strong>the</strong>r<br />
upstream or downstream <strong>of</strong> <strong>the</strong> lake. An assumption was made that <strong>the</strong> year <strong>of</strong><br />
discovery reflected <strong>the</strong> actual order <strong>of</strong> introduction or dispersal so that <strong>the</strong> discovery<br />
past discoveries only influence <strong>the</strong> dispersal pattern.<br />
All records were classified even if <strong>the</strong> pathway was unclear. In <strong>the</strong> Cobbosseecontee<br />
and Messalonskee Stream watersheds pike were discovered and confirmed in many <strong>of</strong><br />
PRFP Page 243
<strong>the</strong> lakes during <strong>the</strong> same year so <strong>the</strong> pattern <strong>of</strong> dispersal or introduction could not be<br />
discerned from ei<strong>the</strong>r isolation, presence <strong>of</strong> barriers or sources. In <strong>the</strong>se cases, <strong>the</strong><br />
classification was completed through interviews with <strong>the</strong> MDIFW regional biologists (J.<br />
Lucas and S. Davis, Region B).<br />
The classified discovery record was used <strong>to</strong> examine <strong>the</strong> introduction pattern in lakes<br />
using a qualitative time series approach <strong>of</strong> mapped discoveries and by developing a<br />
statistical model <strong>of</strong> that described <strong>the</strong> rate <strong>of</strong> discovery using methods developed by<br />
Solow and Costello (2004). The model is based on fitting a curve <strong>to</strong> <strong>the</strong> cumulative<br />
number <strong>of</strong> discoveries over time <strong>to</strong> produce a discovery curve that follows a Poisson<br />
distribution. These two approaches were used <strong>to</strong> describe <strong>the</strong> pattern <strong>of</strong> introduction<br />
and dispersal; <strong>the</strong> rate <strong>for</strong> introductions and dispersal through <strong>the</strong>se introductions; and<br />
<strong>the</strong> pathway probability.<br />
The dispersal and establishment in rivers was more difficult <strong>to</strong> assess using <strong>the</strong><br />
discovery record because it contained few records <strong>for</strong> <strong>the</strong> Kennebec and Androscoggin<br />
Rivers. Instead <strong>of</strong> using <strong>the</strong> discovery record <strong>to</strong> examine <strong>the</strong> pattern <strong>of</strong> discovery, <strong>the</strong><br />
comprehensive survey completed by Yoder et al. (2005) from 2002 <strong>to</strong> 2005 was used <strong>to</strong><br />
understand <strong>the</strong> dispersal and establishment <strong>of</strong> nor<strong>the</strong>rn pike in rivers after having<br />
become well established in <strong>the</strong> subwatershed <strong>of</strong> <strong>the</strong> Kennebec and Androscoggin<br />
Rivers. The purpose <strong>of</strong> <strong>the</strong>se surveys were <strong>to</strong> develop a fish assemblage assessment<br />
method <strong>for</strong> large mainstem rivers and included sampling about 140 miles <strong>of</strong> <strong>the</strong><br />
Kennebec (2002) and Sebasticook Rivers (2003) between Wyman Lake and<br />
Merrymeeting Bay and 160 miles <strong>of</strong> <strong>the</strong> Androscoggin River (2003) between Lake<br />
Umbagog and Merrymeeting Bay. The Penobscot River was also extensively sampled<br />
in 2004 (and more recently in 2008) from <strong>the</strong> West Branch <strong>to</strong> Souadabscook Stream<br />
area. A one kilometer segment <strong>of</strong> <strong>the</strong> river was sampled at each site using a<br />
standardized boat electr<strong>of</strong>ishing sampling methodology. This data was examined <strong>for</strong><br />
<strong>the</strong> presence or absence <strong>of</strong> pike. Locations were also identified where multiple age<br />
classes were found, indicating a resident population as opposed <strong>to</strong> dispersing fish.<br />
PRFP Page 244
Table 7 Maine Lake Nor<strong>the</strong>rn Pike Discovery Record<br />
MIDAS Lake Town County Confirmed Status Reliability Year Isolated Barrier Source Pathway<br />
5344 North Pond 1<br />
Smithfield Kennebec Y Present High 1969 Yes No Introduced<br />
5274 Great Pond Belgrade Kennebec Y Present High 1980 Dispersal<br />
5270 Ingham Pond Mount Vernon Kennebec Y Present High 1980 Dispersal<br />
5272 Long Pond Belgrade Kennebec Y Present High 1980 Dispersal<br />
5280 Messalonskee Lake Belgrade Kennebec Y Present High 1980 Dispersal<br />
3102 Umbagog Lake Magalloway Plt Ox<strong>for</strong>d, Coos (NH) Y Present High 1990 Yes Yes No Introduced<br />
5344 North Pond Rome Kennebec, Somerset Y Present High 1991 No No Yes Dispersal<br />
3796 Sabattus Pond Greene Androscoggin Y Present High 1994 Yes Yes No Introduced<br />
3828 Berry Pond Winthrop Kennebec Y Present High 1996 Introduced<br />
3830 Dexter pond Winthrop Kennebec N Present Medium 1996 Dispersal<br />
5236 Cobbosseecontee Lake Winthrop Kennebec Y Present High 1996 Dispersal<br />
9961 Annabessacook Lake Monmouth Kennebec Y Present High 1996 Introduced<br />
0103 Lower Narrows Pond Winthrop Kennebec Y Present High 1996 Dispersal<br />
0098 Upper Narrows Pond Winthrop Kennebec N Present Medium 1996 Dispersal<br />
5252 Horseshoe Pond Litchfield Kennebec N Present Medium 1996 Dispersal<br />
5254 Pleasant Pond Gardiner Kennebec N Present Medium 1996 Dispersal<br />
3832 Wilson Pond Wayne Kennebec N Present Medium 1996 Dispersal<br />
3750 Taylor Pond Auburn Androscoggin Y Present High 1999 Yes Yes No Introduced<br />
3624 Bear Pond Hart<strong>for</strong>d Androscoggin, Ox<strong>for</strong>d Y Present High 1999 Yes Yes No Introduced<br />
3624 Little Bear Pond Hart<strong>for</strong>d Ox<strong>for</strong>d Present Medium 1999 Yes Yes No Introduced<br />
3626 Crystal Pond Turner Androscoggin N Present Medium 2000 No No Yes Dispersal<br />
3790 Little Sabattus Pond Greene Androscoggin Y Present High 2000 No No Yes Dispersal<br />
0037 Winnegance Lake Phippsburg Sagadahoc Y Present High 2001 Yes Yes Yes Introduced<br />
3816 Long Pond Livermore Androscoggin Y Present High 2002 No No Yes Dispersal<br />
5307 Torsey Pond Mount Vernon Kennebec Y Present High 2002 Yes Yes No Introduced<br />
5408 Webber Pond Vassalboro Kennebec N Present Medium 2002 Yes Yes No Introduced<br />
5710 Biscay Pond Damariscotta Lincoln N Present Medium 2002 Yes Yes No Introduced<br />
3936 Middle Branch Pond Waterboro York Y Present High 2002 Yes Yes No Introduced<br />
4896 Sheepscot Pond Palermo Waldo N Present Medium 2002 Yes Yes No Introduced<br />
0007 Estes Lake San<strong>for</strong>d York N Present Medium 2002 No Yes Yes Introduced<br />
4857 Webber Pond Bremen Lincoln Unknown Extirpate High 2003 Yes No No Introduced<br />
0080 Pushaw Lake Al<strong>to</strong>n Penobscot Y Present High 2003 Yes Yes No Introduced<br />
5786 Sebago Lake Sebago Cumberland Y Present High 2003 Yes Yes No Introduced<br />
3836 Androscoggin Lake Wayne Kennebec, Androscoggin N Present Medium 2004 Yes Yes No Introduced<br />
8065 Little Cobbosseecontee Winthrop Kennebec Y Present High 2004 No No Yes Dispersal<br />
5176 Lovejoy Pond Albion Kennebec Y Present High 2004 Yes Yes No Introduced<br />
3818 Round Pond Livermore Androscoggin Y Present High 2005 No No Yes Dispersal<br />
5222 Nequassett Lake Woolwich Sagadahoc Y Present High 2005 Yes Yes No Introduced<br />
5650 Mosher Pond Fayette Kennebec Y Present High 2006 Yes Yes No Introduced<br />
2278 Mud Pond Old Town Penobscot Y Present High 2006 No No Yes Dispersal<br />
5690 North Pond Warren Knox Y Present High 2007 Yes No No Introduced<br />
1 Based on a back calculation <strong>of</strong> when pike were most likely introduced.<br />
PRFP Page 245
Pattern <strong>of</strong> Introduction and Dispersal in Lakes<br />
The pattern <strong>of</strong> introduction and dispersal in lakes from <strong>the</strong> discovery record in Table<br />
6 is graphically illustrated in a map time series in Appendix C. The following results<br />
were obtained from examining Table 7 and <strong>the</strong> discovery time series:<br />
a. The first known occurrence in Maine was documented in North Pond in<br />
1969 20 . Little North Pond and North Pond are connected and managed as<br />
<strong>the</strong> same water.<br />
b. Forty-one lakes have a medium or high reliability <strong>of</strong> pike presence. Pike were<br />
likely introduced in 23 lakes (56%) through human-caused introduction and<br />
18 lakes (44%) by dispersing from an established source population.<br />
c. The current pike distribution in Maine has resulted from 23 separate<br />
unauthorized introductions.<br />
d. In 10 <strong>of</strong> <strong>the</strong> 16 introduced watersheds, pike have not been found <strong>to</strong> have left<br />
<strong>the</strong>ir original waters or expand <strong>the</strong>ir distribution. In four cases, pike moved<br />
in<strong>to</strong> adjacent waters. In only two watersheds (Cobbosseecontee and<br />
Messalonskee Stream watersheds) did pike move <strong>to</strong> any great extent.<br />
However, both <strong>of</strong> those watersheds are substantially made up <strong>of</strong> lakes and<br />
ponds, and in at least one <strong>of</strong> <strong>the</strong>se instances, <strong>the</strong> pike moved downstream<br />
after being introduced.<br />
e. The pattern <strong>of</strong> introductions appears <strong>to</strong> occur in clusters where several illegal<br />
introductions will occur in adjacent watersheds within <strong>the</strong> same time period.<br />
f. In 15 <strong>of</strong> 23 introductions, <strong>the</strong> introductions were <strong>the</strong> first recorded occurrence<br />
<strong>of</strong> pike in <strong>the</strong> watershed.<br />
g. There are seven cases where <strong>the</strong> potential source is identified <strong>for</strong> which pike<br />
may have dispersed <strong>to</strong> ano<strong>the</strong>r lake. The dispersal period ranged from 1 <strong>to</strong><br />
22 years. The average and medium dispersal period was 7 and 3 years,<br />
respectively (Table 8).<br />
Table 8 Nor<strong>the</strong>rn pike dispersal in Maine lakes<br />
From Lake Year Discovered To Lake Year Discovered<br />
Little North Pond 1<br />
1969 North Pond 1991<br />
Little Bear and Bear Ponds 1999 Crystal Pond 2000<br />
Sabattus Pond 1994 Little Sabattus Pond 2000<br />
Little Bear, Bear and Crystal Ponds 1999/2000 Long Pond 2002<br />
Cobbosseecontee Lake 1996 Little Cobbosseecontee Lake 2004<br />
Long Pond 2002 Round Pond 2005<br />
Pushaw Lake 2003 Mud Pond 2006<br />
20 Based on a back calculation <strong>of</strong> when pike were most likely introduced (Little North Pond and North<br />
Pond are connected and managed as <strong>the</strong> same water).<br />
PRFP Page 246
Pattern <strong>of</strong> Introduction and Dispersal in Rivers<br />
The pattern <strong>of</strong> introduction and dispersal in rivers could not be obtained from <strong>the</strong><br />
discovery record because it included few occurrences. The comprehensive surveys<br />
by Yoder et al. (2005) and any follow-up surveys that were completed as part <strong>of</strong> this<br />
work (additional surveys <strong>for</strong> <strong>the</strong> Penobscot River in 2008) were used <strong>for</strong> this<br />
analysis. The purpose <strong>of</strong> Yoder’s work was <strong>to</strong> better understand fish assemblages<br />
and habitat associations in large rivers (non-wadeable) in Maine and most rivers<br />
were sampled over much <strong>of</strong> <strong>the</strong>ir entire length.<br />
1) Yoder et al. (2005) sampled 39 sites on <strong>the</strong> Kennebec River, 50 sites on <strong>the</strong><br />
Androscoggin River and 31 sites on <strong>the</strong> Penobscot River (see figures in<br />
Appendix C).<br />
2) Nor<strong>the</strong>rn pike were documented at two sites. One adult pike was captured at<br />
one site on <strong>the</strong> Kennebec River and four fish (adult and young-<strong>of</strong>-year) were<br />
captured at one site on <strong>the</strong> Androscoggin River.<br />
3) One resident population appears <strong>to</strong> have become established on <strong>the</strong><br />
Androscoggin River near <strong>the</strong> mouth <strong>of</strong> <strong>the</strong> Sabattus River, close <strong>to</strong> <strong>the</strong><br />
potential source (Sabattus Lake).<br />
4) No pike were documented in <strong>the</strong> rivers that were sampled in <strong>the</strong> Penobscot<br />
River watershed. Pike were first reported in Pushaw Lake in 2003, confirmed<br />
in 2005, and confirmed in Mud Pond in 2006. Given <strong>the</strong> empirical medium<br />
dispersal period <strong>of</strong> three years based on <strong>the</strong> discovery record, <strong>the</strong> sampling<br />
may have been early in <strong>the</strong> pike introduction and failed <strong>to</strong> detect <strong>the</strong>m and/or<br />
MDIFW control methods in Pushaw Lake have been successful in limiting<br />
pike dispersal.<br />
5) The establishment <strong>of</strong> pike populations in mainstem rivers appears <strong>to</strong> occur at<br />
a much lower rate than in lakes given <strong>the</strong> limited discoveries <strong>of</strong> pike in <strong>the</strong><br />
Androscoggin and Kennebec Rivers and <strong>the</strong> few occurrences found by Yoder.<br />
Rate and Probability in Lakes<br />
Methods developed in Solow and Costello (2004) <strong>for</strong> analyzing <strong>the</strong> discovery record<br />
were used <strong>to</strong> develop a model <strong>of</strong> <strong>the</strong> nor<strong>the</strong>rn pike discoveries in Maine lakes. A 5parameter<br />
model was fit <strong>to</strong> <strong>the</strong> discovery record and <strong>the</strong>n solved using maximumlikelihood<br />
estimation. This analysis constructed models <strong>for</strong> two cases. One case<br />
used only lakes where nor<strong>the</strong>rn pike were likely introduced through human-caused<br />
introductions (introduced). The o<strong>the</strong>r case used <strong>the</strong> entire discovery record,<br />
including lakes where pike were discovered through human-caused introductions or<br />
from natural dispersal (combined). The probability <strong>for</strong> introductions through<br />
dispersal was obtained by <strong>the</strong> difference <strong>of</strong> <strong>the</strong>se two models. A model was not able<br />
<strong>to</strong> be directly constructed <strong>for</strong> <strong>the</strong> dispersal pathway because dispersals were <strong>of</strong>ten<br />
PRFP Page 247
clumped (many documented in one year) and relatively infrequent (occurring over a<br />
relatively few years <strong>for</strong> <strong>the</strong> 30-year record).<br />
1) The model parameters and maximum-likelihood estimates (MLE) from Solow<br />
and Costello (2004) <strong>for</strong> <strong>the</strong> two cases are:<br />
Case<br />
ˆβ 0<br />
ˆβ 1<br />
0 ˆ γ 2 ˆ γ 1 ˆ γ<br />
PRFP Page 248<br />
MLE<br />
Introduced -3.3739 0.1208 32.2508 0.0625 0.0467 -21.32<br />
Combined -2.1520 0.0894 31.9848 0.0436 -0.0032 -22.05<br />
The data, which are plotted in Figure 11, are <strong>for</strong> introduced nor<strong>the</strong>rn pike<br />
discoveries from 1969 <strong>to</strong> 2007 and shows <strong>the</strong> fitted values (smooth line)<br />
along with <strong>the</strong> discovery data (dashed line).<br />
25<br />
Cu<br />
20<br />
mu<br />
lati<br />
ve<br />
Dis 15<br />
cov<br />
eri<br />
es 10<br />
5<br />
0<br />
19<br />
69 19<br />
71 19<br />
73 19<br />
75 19<br />
77 19<br />
79 19<br />
81 19<br />
83 19<br />
85 19<br />
87 19<br />
89 19<br />
91 19<br />
93 19<br />
95 19<br />
97 19<br />
99 20<br />
01 20<br />
03 20<br />
05 20<br />
07<br />
Year<br />
Figure 11 Nor<strong>the</strong>rn pike discoveries from human-caused introductions 1969-2007<br />
2) The estimated mean introduction rate raises from 0.03 introductions per year<br />
in 1969 <strong>to</strong> 2.6 introductions per year in 2007. The annual rate <strong>of</strong> increase is<br />
about 6.8% per year since 1969. The mean introduction rate in <strong>the</strong> 1970s,<br />
1980s, 1990s and 2000s was 0.06, 0.19, and 0.62 and 1.80 introductions per<br />
year, respectively.<br />
3) The rate <strong>of</strong> introduction is not constant nor has it declined over <strong>the</strong> 30-year<br />
record. This indicates that programs <strong>to</strong> decrease human-caused<br />
introductions may not be effective in controlling this pathway and that <strong>the</strong>se<br />
introductions may be difficult <strong>to</strong> control in <strong>the</strong> future.
4) The model developed by Solow and Costello (2004) has a Poisson<br />
distribution with an annual introduction rate described by μ t = exp( β 0 + β 1t<br />
),<br />
where β 0 and β1 were estimated through a maximum-likelihood method and<br />
are reported above. The Poisson distribution is useful in describing counts<br />
from rare events over a continuous timeframe. A Poisson probability density<br />
function (PDF) can be developed from <strong>the</strong> annual introduction rate that<br />
describes <strong>the</strong> probability <strong>of</strong> <strong>the</strong> number <strong>of</strong> discoveries one could expect <strong>for</strong><br />
that year. The PDF can be used <strong>to</strong> estimate <strong>the</strong> probability <strong>of</strong> <strong>the</strong> number <strong>of</strong><br />
discoveries occurring in any one year by:<br />
x<br />
λ<br />
P( x)<br />
= x<br />
e x!<br />
where x is <strong>the</strong> number <strong>of</strong> discoveries in an interval and λ is <strong>the</strong> mean rate<br />
over <strong>the</strong> interval. For this application, <strong>the</strong> mean introduction rate in 2007 <strong>of</strong><br />
2.64 introductions was used <strong>to</strong> determine <strong>the</strong> current probability <strong>for</strong> humancaused<br />
introductions. The probability <strong>of</strong> nor<strong>the</strong>rn pike dispersal in any one<br />
year was constructed by taking <strong>the</strong> difference (subtracting <strong>the</strong> two mean rates<br />
<strong>for</strong> 2007) <strong>of</strong> <strong>the</strong> combined and introduced models. The probability functions<br />
<strong>for</strong> human-caused introduction (smooth line) and natural dispersal (dashed<br />
line) are plotted in Figure 12.<br />
Annual Probability<br />
0.4000<br />
0.3500<br />
0.3000<br />
0.2500<br />
0.2000<br />
0.1500<br />
0.1000<br />
0.0500<br />
0.0000<br />
0 1 2 3 4 5 6 7 8 9 10 11<br />
Number <strong>of</strong> Introductions<br />
Human-caused Dispersal<br />
Figure 12 Probability density functions <strong>for</strong> human-caused introductions and dispersal <strong>of</strong> nor<strong>the</strong>rn pike<br />
Each curve in Figure 12 represents <strong>the</strong> probability <strong>of</strong> an introduction occurring<br />
in any one year in Maine. Inspection <strong>of</strong> <strong>the</strong> PDF <strong>for</strong> each case provides some<br />
insights on <strong>the</strong> risk <strong>of</strong> each pathway:<br />
a. The probability <strong>of</strong> having no introductions (maintaining <strong>the</strong> current<br />
condition) is more than four times more likely under natural dispersal ( ρ =<br />
0.32) than under human-caused introductions ( ρ =0.07). Natural dispersal<br />
PRFP Page 249
occurs at a lower mean rate (1.15 introductions per year) than humancaused<br />
introduction (2.63 introductions per year).<br />
b. There is a high probability that one or more annual introductions will occur<br />
by ei<strong>the</strong>r pathway. The annual probability <strong>of</strong> one or more human-caused<br />
introductions is very high ( ρ =0.93). The annual probability <strong>for</strong> one or<br />
more natural dispersals is also moderately high ( ρ =0.68). When<br />
comparing <strong>the</strong> two probabilities, <strong>the</strong> probability <strong>of</strong> having one or more<br />
introductions is 31% higher through human-caused introductions than<br />
under natural dispersal.<br />
c. Human-caused introductions are more likely <strong>to</strong> result in multiple<br />
introductions in one year than introductions through natural dispersal. The<br />
probability <strong>of</strong> three or more introductions in one year is 0.49 <strong>for</strong> humancaused<br />
introductions in contrast <strong>to</strong> a probability <strong>of</strong> 0.11 <strong>for</strong> natural<br />
dispersal. This higher probability may arise from <strong>the</strong> mechanism <strong>of</strong><br />
dispersal. Human-caused introductions can occur through a watershed in<br />
watersheds that are disassociated from those that contain nor<strong>the</strong>rn pike.<br />
Introductions through natural dispersal occur in watersheds where pike<br />
are found and more likely <strong>to</strong> occur in habitat adjacent <strong>to</strong> or downstream <strong>of</strong><br />
existing populations (J. Casselman, personal communication, March 13,<br />
2009).<br />
d. Both pathways pose a risk <strong>for</strong> introduction <strong>of</strong> nor<strong>the</strong>rn pike, however<br />
human-caused introductions pose a greater risk. They have a very low<br />
probability <strong>of</strong> resulting in no introductions in any one year, <strong>the</strong>y have a<br />
much higher mean rate <strong>of</strong> introduction, <strong>the</strong>y have a much higher<br />
probability <strong>of</strong> multiple introductions in one year, and <strong>the</strong>y can result in<br />
introductions in watersheds removed from those watersheds with<br />
populations <strong>of</strong> nor<strong>the</strong>rn pike.<br />
PRFP Page 250
Inven<strong>to</strong>ry <strong>of</strong> Risk Rating <strong>for</strong> Waterbodies<br />
In order <strong>to</strong> determine <strong>the</strong> extent <strong>of</strong> resources at risk above Howland, two approaches<br />
were taken. The first looked at identifying priority resources and associated<br />
geographic locations areas throughout <strong>the</strong> drainage, resulting in high, medium and<br />
low ranks <strong>for</strong> each HUC 12 watershed. The second looked at barriers <strong>to</strong> nor<strong>the</strong>rn<br />
pike, both natural and anthropogenic.<br />
Rating <strong>for</strong> <strong>the</strong> Resource<br />
A list <strong>of</strong> five priority resources was developed (see list below). For each resource, a<br />
score <strong>of</strong> 0, 1 or 2 was assigned based on occurrences; <strong>the</strong> presence <strong>of</strong> EBTJV high<br />
quality habitat (0 or 2), cold water management lakes (0,1, or 2), wild salmonids (0,1,<br />
or 2), species <strong>of</strong> concern (0 or 2 - American eel data is <strong>to</strong>o spotty <strong>to</strong> be valuable in<br />
rating), and <strong>the</strong> sum <strong>of</strong> Atlantic salmon habitat normalized <strong>for</strong> watershed size (0,1, or<br />
2 - where 0 has <strong>the</strong> lowest number <strong>of</strong> habitat units and is not a true zero). These<br />
scores were summed and rated as Category 1 (high) with four <strong>to</strong> six occurrences <strong>of</strong><br />
priority resources (30% <strong>of</strong> <strong>the</strong> drainage), Category 2 (medium) with one <strong>to</strong> three<br />
occurrences <strong>of</strong> priority resources (65% <strong>of</strong> <strong>the</strong> drainage), and Category 3 (low) with<br />
zero occurrences <strong>of</strong> priority resources (5% <strong>of</strong> <strong>the</strong> drainage), (Figure 13). In addition,<br />
two connections between <strong>the</strong> Piscataquis and <strong>the</strong> West Branch Penobscot were<br />
identified as concerns: 1) East Branch Lake has a north and south outlet where <strong>the</strong><br />
North flows in<strong>to</strong> <strong>the</strong> West Branch Penobscot and 2) a large wetland complex<br />
separates Ebeemee Lake, Sanborn Pond and Upper Jo-Mary Lake.<br />
High Priority Resource Classes<br />
• High quality brook trout habitat (see Appendix D): Thorn Brook, Kingsbury<br />
Stream and Pond, East Branch Pleasant River, Middle Branch Pleasant<br />
River, West Branch Pleasant River above Silver Lake<br />
• Wild landlocked salmon, lake trout or brook trout lakes: including Sebec lake<br />
and Schoodic Lake and Heritage brook trout ponds A (never been s<strong>to</strong>cked)<br />
and B (not s<strong>to</strong>cked in past 25 years). There are 62 <strong>to</strong>tal wild and native brook<br />
trout ponds in <strong>the</strong> drainage (Table 9).<br />
• Species <strong>of</strong> Concern: Lake whitefish in Hebron Lake, arctic char in Bald<br />
Mountain Pond as well as American eel throughout <strong>the</strong> drainage<br />
• Atlantic salmon: Based on Atlantic salmon habitat model<br />
• Lake management areas: Cold water management and remote lakes<br />
Known Barriers <strong>to</strong> Nor<strong>the</strong>rn pike<br />
As identified in <strong>the</strong> habitat model section <strong>of</strong> this document, nor<strong>the</strong>rn pike are not<br />
adapted <strong>to</strong> strong currents. Water velocity exceeding 1.5 m/s can block spawning<br />
migrations (Inskip 1982). Nor<strong>the</strong>rn pike have little use <strong>for</strong> riverine habitats where <strong>the</strong><br />
gradient exceeds 5 m/km (0.5 % slope), and have less <strong>to</strong>lerance <strong>for</strong> gradient than<br />
muskellunge (Inskip 1982). However, it was determined that nor<strong>the</strong>rn pike dispersal<br />
in Sweden was precluded only when maximum stream slope approached 6.6 %<br />
(Spens et al. 2007). In addition, renowned fisheries scientist and expert on Nor<strong>the</strong>rn<br />
pike, Dr. John Casselman, states that a 30-inch jump is adequate <strong>to</strong> prevent <strong>the</strong><br />
upstream passage <strong>of</strong> pike through <strong>the</strong> fishways (pers. comm.).<br />
PRFP Page 251
Figure 13 Resource value areas<br />
There<strong>for</strong>e, natural falls and dams where temporary velocity or jump barriers could be<br />
created were identified (Figure 14 and Table 10). These barriers would be<br />
considered emergency measures but not permanent solutions, as <strong>the</strong>y would allow<br />
passage <strong>of</strong> Atlantic salmon grilse and adults but will severely hinder <strong>the</strong> passage <strong>of</strong><br />
most native species including anadromous alosids (river herring and American shad)<br />
and as such should considered a short term solution. The adverse impact on<br />
anadromous alosids would be minimal in <strong>the</strong> short term since very few adult alosids<br />
are currently present below <strong>the</strong>se projects.<br />
Three main stem dams, Brown's Mill (Dover-Foxcr<strong>of</strong>t Lower), Moosehead<br />
Manufacturing (Dover-Foxcr<strong>of</strong>t Upper), and Guil<strong>for</strong>d (Interface), exist. All three have<br />
vertical slot fishways. Only Brown’s Mill has both upstream and downstream<br />
passage, although all three have upstream passage. The two dams in Dover-<br />
Foxcr<strong>of</strong>t are hydro-electric facilities. There are also two dams in <strong>the</strong> Sebec drainage<br />
(Milo and Sebec) that currently have no provisions <strong>for</strong> passage. The dam at<br />
Schoodic Lake has a 6’ dam with three gates – but at high water it may be passable<br />
and West Seboeis Lake dam is impassible.<br />
There are also several natural barriers in <strong>the</strong> drainage. These include a series <strong>of</strong><br />
falls around Gulf Hagas on <strong>the</strong> West Branch Pleasant, Gauntlet and Mud Gauntlet<br />
Falls on <strong>the</strong> East Branch Pleasant, two sets <strong>of</strong> mapped falls on Ship Pond Stream<br />
PRFP Page 252
(Buck's Falls and Cowyard Falls), multiple falls on Wilson Stream and its tributaries<br />
(Early Landing Falls; three unnamed falls just above <strong>the</strong> confluence with Leeman<br />
Brook; and Little Wilson Falls) and two falls on <strong>the</strong> Piscataquis River above Guil<strong>for</strong>d<br />
(an unnamed set <strong>of</strong> falls near a picnic area in Blanchard and Hatch Falls on <strong>the</strong><br />
West Branch Piscataquis).<br />
Figure 14 Natural and human barriers<br />
PRFP Page 253
Table 9 Wild and Native Brook Trout Ponds<br />
Lake Watershed Category County<br />
Baker Pond West Branch Pleasant River (1) at Silver Lake Native: Never been s<strong>to</strong>cked Piscataquis<br />
Bear Pond Big Wilson Stream (2) Native: Never been s<strong>to</strong>cked Piscataquis<br />
Bluff Pond West Branch Pleasant River (1) at Silver Lake Native: Never been s<strong>to</strong>cked Piscataquis<br />
Brown Pond Lake Onawa Native: Never been s<strong>to</strong>cked Piscataquis<br />
Burden Pond First Buttermilk Pond Native: Never been s<strong>to</strong>cked Piscataquis<br />
Buttermilk Pond First Buttermilk Pond Native: Never been s<strong>to</strong>cked Piscataquis<br />
Cedar Pond East Branch Pleasant River (2) Native: Never been s<strong>to</strong>cked Piscataquis<br />
Crockett Pond Thorn Brook Native: Never been s<strong>to</strong>cked Piscataquis<br />
Duck Pond First Buttermilk Pond Native: Never been s<strong>to</strong>cked Piscataquis<br />
East Chairback Pond Long Pond Native: Never been s<strong>to</strong>cked Piscataquis<br />
Gauntlet Pond East Branch Pleasant River (2) Native: Never been s<strong>to</strong>cked Piscataquis<br />
Greenwood Pond White Brook Native: Never been s<strong>to</strong>cked Piscataquis<br />
Grenell Pond Lower Wilson Pond Native: Never been s<strong>to</strong>cked Piscataquis<br />
Hedgehog Pond Long Pond Native: Never been s<strong>to</strong>cked Piscataquis<br />
Hutchinson Pond East Branch Pleasant River (1) Native: Never been s<strong>to</strong>cked Piscataquis<br />
Indian Pond Big Wilson Stream (1) at Bodfish Native: Never been s<strong>to</strong>cked Piscataquis<br />
Ira Bog Shirley Pond Native: Never been s<strong>to</strong>cked Piscataquis<br />
Juniper Knee Pond Little Wilson Stream Native: Never been s<strong>to</strong>cked Piscataquis<br />
Little Benson Pond Ship Pond Stream Native: Never been s<strong>to</strong>cked Piscataquis<br />
Little Grapevine Pond Sebec Lake (1) at Narrows Native: Never been s<strong>to</strong>cked Piscataquis<br />
Little Moxie Pond West Branch Piscataquis River Native: Never been s<strong>to</strong>cked Somerset<br />
Little Wilson Pond Little Wilson Stream Native: Never been s<strong>to</strong>cked Piscataquis<br />
Lower Doughty Pond East Branch Piscataquis River Native: Never been s<strong>to</strong>cked Piscataquis<br />
Marble Pond West Branch Piscataquis River Native: Never been s<strong>to</strong>cked Piscataquis<br />
Middle Branch Pond Middle Branch Pleasant River Native: Never been s<strong>to</strong>cked Piscataquis<br />
Mill Brook Pond Sebec Lake (2) at Sebec Native: Never been s<strong>to</strong>cked Piscataquis<br />
Moose Pond Little Wilson Stream Native: Never been s<strong>to</strong>cked Piscataquis<br />
Mountain Brook Pond West Branch Pleasant River (1) at Silver Lake Native: Never been s<strong>to</strong>cked Piscataquis<br />
Mountain View Pond East Branch Pleasant River (1) Native: Never been s<strong>to</strong>cked Piscataquis<br />
Notch Pond Lower Wilson Pond Native: Never been s<strong>to</strong>cked Piscataquis<br />
Ordway Pond West Branch Piscataquis River Native: Never been s<strong>to</strong>cked Piscataquis<br />
PRFP Page 254
Prescott Pond Little Wilson Stream Native: Never been s<strong>to</strong>cked Piscataquis<br />
Punchbowl Pond Thorn Brook Native: Never been s<strong>to</strong>cked Piscataquis<br />
Round Pond East Branch Pleasant River (1) Native: Never been s<strong>to</strong>cked Piscataquis<br />
Rum Pond Lower Wilson Pond Native: Never been s<strong>to</strong>cked Piscataquis<br />
Secret Pond Lake Onawa Native: Never been s<strong>to</strong>cked Piscataquis<br />
Spruce Mtn Ponds-West Silver Lake Native: Never been s<strong>to</strong>cked Piscataquis<br />
Trout Pond Long Pond Native: Never been s<strong>to</strong>cked Piscataquis<br />
unnamed pond Bald Mountain Pond Native: Never been s<strong>to</strong>cked Somerset<br />
Upper Doughty Pond East Branch Piscataquis River Native: Never been s<strong>to</strong>cked Piscataquis<br />
West Chairback Pond Big Hous<strong>to</strong>n Pond Native: Never been s<strong>to</strong>cked Piscataquis<br />
1st Little Ly<strong>for</strong>d Pond West Branch Pleasant River (1) at Silver Lake Wild: No direct s<strong>to</strong>cking since 1983 Piscataquis<br />
2nd Little Ly<strong>for</strong>d Pond West Branch Pleasant River (1) at Silver Lake Wild: No direct s<strong>to</strong>cking since 1983 Piscataquis<br />
B Pond B Pond Wild: No direct s<strong>to</strong>cking since 1983 Piscataquis<br />
Big Benson Pond Ship Pond Stream Wild: No direct s<strong>to</strong>cking since 1983 Piscataquis<br />
Big Ly<strong>for</strong>d Pond West Branch Pleasant River (1) at Silver Lake Wild: No direct s<strong>to</strong>cking since 1983 Piscataquis<br />
Dow Pond Piscataquis River (3) above Sebec River Wild: No direct s<strong>to</strong>cking since 1983 Piscataquis<br />
First West Branch Pond West Branch Pleasant River (1) at Silver Lake Wild: No direct s<strong>to</strong>cking since 1983 Piscataquis<br />
Fogg Pond Lower Wilson Pond Wild: No direct s<strong>to</strong>cking since 1983 Piscataquis<br />
Foss Pond Thorn Brook Wild: No direct s<strong>to</strong>cking since 1983 Piscataquis<br />
Horseshoe Pond Lower Wilson Pond Wild: No direct s<strong>to</strong>cking since 1983 Piscataquis<br />
Little Hous<strong>to</strong>n Pond Hous<strong>to</strong>n Brook Wild: No direct s<strong>to</strong>cking since 1983 Piscataquis<br />
Long Pond Wild: No direct s<strong>to</strong>cking since 1983 Piscataquis<br />
Mountain Pond Lower Wilson Pond Wild: No direct s<strong>to</strong>cking since 1983 Piscataquis<br />
Mud Greenwood Pond Wild: No direct s<strong>to</strong>cking since 1983 Piscataquis<br />
North Pond Big Wilson Stream (2) Wild: No direct s<strong>to</strong>cking since 1983 Piscataquis<br />
Second Buttermilk Pond First Buttermilk Pond Wild: No direct s<strong>to</strong>cking since 1983 Piscataquis<br />
Second West Branch Pd West Branch Pleasant River (1) at Silver Lake Wild: No direct s<strong>to</strong>cking since 1983 Piscataquis<br />
Spectacle Pond Thorn Brook Wild: No direct s<strong>to</strong>cking since 1983 Piscataquis<br />
Third West Branch Pond West Branch Pleasant River (1) at Silver Lake Wild: No direct s<strong>to</strong>cking since 1983 Piscataquis<br />
Upper Wilson Pond Lower Wilson Pond Wild: No direct s<strong>to</strong>cking since 1983 Piscataquis<br />
PRFP Page 255
Table 10 Piscataquis River Watershed Ponds With Outlet Barriers<br />
Name Type River Owner<br />
East Davee Brook Site #3 Dam Snows Pond<br />
Kingsbury Dam Dam KINGSBURY STREAM TOWN OF KINGSBURY<br />
Pingree Dam Dam PINGREE STREAM ROBERT TIPTON<br />
Branns Pond Dam Dam BLACK STREAM TOWN OF DOVER FOXCROFT<br />
Shirley Pond Dam Dam EAST BRANCH PISCATAQUIS RIVER TOWN OF SHIRLEY<br />
Phillips Brooks Dam Dam TR MONSON STREAM TOWN OF MONSON<br />
Big Bennett Pond Outlet Dam BENNETT BROOK SEBEC LAKE FISH+GAME ASS<br />
Sebec Dam Dam SEBEC RIVER BANGOR HYDRO ELECTRIC CO<br />
Schoodic Lake Dam Dam SCHOODIC STREAM BANGOR HYDRO ELECTRIC CO<br />
Milo Dam Dam SEBEC RIVER TOWN OF MILO<br />
Pond Farm Pond Dam Dam TR-SEBOEIS STREAM STATE OF ME DIFG<br />
Lower Wilson Pond Dam Dam BIG WILSON STREAM GREENVILLE MFG CO<br />
Pes<strong>to</strong>ck Dam Dam BIG WILSON STREAM GREENVILLE MFG CO<br />
Seboeis Dam Dam WEST BRANCH SEBOEIS STREAM BANGOR HYDRO ELECTRIC CO<br />
Lower Dam Dam PISCATAQUIS RIVER TOWN OF DOVER FOXCROFT<br />
Dunham Brook Site 2 Dam Dunham Brook<br />
Davee Brook #1 Dam Davee Brook<br />
Upper Dam Dam PISCATQUIS RIVER TOWN OF DOVER-FOXCROFT<br />
Carl<strong>to</strong>n Stream Dam Dam CARLTON STREAM NUMBER ALL INC<br />
Manhanock Pond Dam Dam CARLTON STREAM HALEY CONSTRUCTION CO<br />
Manhanock Pond Dam Dam CARLTON STREAM TOWN OF SANGERVILLE<br />
First Davis Pond Dam Dam DAVIS BROOK DIAMOND INTERNATIONAL CO<br />
Guil<strong>for</strong>d Industries Dam Dam PISCATAQUIS RIVER GUILFORD INDUSTRIES INC<br />
Bennett Pond Dam Dam Gales Brook<br />
Piper Pond Dam Dam Kingsbury Stream<br />
Buttermilk Falls Falls<br />
Gauntlet Falls Falls<br />
Cowyard Falls Falls<br />
Toby Falls Falls<br />
Monson Stream Falls Falls<br />
Garland Pond Outlet Dam Dam<br />
Little Hous<strong>to</strong>n Pond Impass block<br />
Mountain Brook Pond Falls Falls<br />
Cedar Pond Barrier block<br />
Gauntlet Pond Barrier block<br />
Mill Brook Pond Impass block<br />
West Chairback Pond Ledges block<br />
Eighteen Pond Falls Falls<br />
Cranberry Pond Impass block<br />
Notch Pond Impass block<br />
Little Wilson Falls Falls<br />
Earley Landing Falls Falls<br />
Bucks Falls Falls<br />
Hatch Falls Falls<br />
Key Conclusions<br />
PRFP Page 256
Summary <strong>of</strong> Ecological Risk<br />
Introductions <strong>of</strong> large, <strong>to</strong>p-preda<strong>to</strong>rs such as nor<strong>the</strong>rn pike (Esox lucius) negatively<br />
affect resident fish communities by disrupting normal feeding behavior (Bystrom et<br />
al. 2007), decreasing prey biomass and abundance (He and Kitchell 1990; Findlay et<br />
al. 2005) and through extirpation <strong>of</strong> native species (Findlay et al. 2005; Bystrom et<br />
al. 2007). Since 1985, <strong>the</strong> number <strong>of</strong> nor<strong>the</strong>rn pike waters has increased from six <strong>to</strong><br />
49 (with 17 expected and one extirpated) statewide (Lucas 2008), representing<br />
72,789 acres in lake surface area. Invasions or introductions <strong>of</strong> <strong>to</strong>p preda<strong>to</strong>rs in<strong>to</strong><br />
new ecosystems have been shown <strong>to</strong> have negative effects on native <strong>to</strong>p preda<strong>to</strong>rs<br />
and dramatic cascading effects on lower trophic levels (Vander Zanden et al. 2004).<br />
Several studies have attributed large losses <strong>of</strong> s<strong>to</strong>cked and migrating salmonids <strong>to</strong><br />
pike predation in riverine ecosystems.<br />
A barrier <strong>to</strong> pike in <strong>the</strong> existing fishway at <strong>the</strong> Browns Mill Project in South Dover<br />
would protect approximately 80% <strong>of</strong> <strong>the</strong> s<strong>to</strong>cked salmonid area from <strong>the</strong><br />
establishment <strong>of</strong> pike through natural dispersal.<br />
Pike are known <strong>to</strong> prefer s<strong>of</strong>t-rayed fish as <strong>for</strong>age (Petrvozvanskiy 1988; Hakanson<br />
2002), including s<strong>to</strong>cked salmonids, and <strong>the</strong>re<strong>for</strong>e, it is likely that <strong>the</strong>re will be<br />
impacts on <strong>the</strong> s<strong>to</strong>cked brook trout fisheries in <strong>the</strong>se river systems. Since young<br />
pike do occasionally occur in small streams that have a source <strong>of</strong> coldwater and <strong>the</strong>y<br />
prefer s<strong>of</strong>t-rayed fish <strong>the</strong>re could be impacts at <strong>the</strong> local level <strong>for</strong> wild trout<br />
populations, through direct predation or competition <strong>for</strong> <strong>the</strong>rmal refuge.<br />
There is considerable niche overlap between nor<strong>the</strong>rn pike and brook trout in<br />
lacustrine habitat. Both prefer <strong>the</strong> lit<strong>to</strong>ral zone and both may seek cool water during<br />
<strong>the</strong> warmest periods <strong>of</strong> <strong>the</strong> summer. Direct predation is possible in situations where<br />
pike and brook trout occupy <strong>the</strong> same areas, as well as competition <strong>for</strong> <strong>for</strong>age, such<br />
as minnow species and rainbow smelts.<br />
The potential <strong>for</strong> nor<strong>the</strong>rn pike <strong>to</strong> adversely impact landlocked salmon populations is<br />
higher in lakes than in rivers and streams primarily because <strong>of</strong> <strong>the</strong> differing habitat<br />
requirements between <strong>the</strong> two species. Predation <strong>of</strong> salmon by pike could be a<br />
fac<strong>to</strong>r at habitat edges. In addition, juvenile salmon may be vulnerable <strong>to</strong> predation<br />
by adult pike if <strong>the</strong> migration route involves long stretches <strong>of</strong> dead water suitable <strong>for</strong><br />
adult pike or in <strong>the</strong> lake until <strong>the</strong>y reach an adequate size <strong>to</strong> escape being eaten.<br />
Competition <strong>for</strong> <strong>for</strong>age may exist between salmon and pike in lakes, particularly if<br />
<strong>for</strong>age is limited resulting in a situation where both species are relying heavily upon<br />
rainbow smelt.<br />
The impact <strong>of</strong> Nor<strong>the</strong>rn pike on populations <strong>of</strong> lake trout (<strong>to</strong>gue) will likely be low, as<br />
<strong>to</strong>gue thrive in oligotrophic lakes and Nor<strong>the</strong>rn pike tend <strong>to</strong> do better in mesotrophic<br />
lakes.<br />
At <strong>the</strong> youngest juvenile life stages <strong>of</strong> Atlantic salmon and nor<strong>the</strong>rn pike, <strong>the</strong>re is no<br />
evidence <strong>for</strong> potential habitat overlap. With <strong>the</strong> onset <strong>of</strong> spring, longer days and<br />
PRFP Page 257
warmer waters stimulate mature pike <strong>to</strong> congregate near river and stream inlets in<br />
preparation <strong>for</strong> spawning. At this time, salmon smolts may be at <strong>the</strong> greatest risk,<br />
since <strong>the</strong>y are going through physiological changes preparing <strong>the</strong>m <strong>for</strong> a down river<br />
migration through many varying habitats.<br />
There are two connections between <strong>the</strong> Piscataquis and <strong>the</strong> West Branch<br />
Penobscot were identified as concerns: 1) East Branch Lake has a north and south<br />
outlet where <strong>the</strong> North flows in<strong>to</strong> <strong>the</strong> West Branch Penobscot and 2) a large wetland<br />
complex separates Ebeemee Lake, Sanborn Pond and Upper Jo-Mary Lake.<br />
Model Limits and Summary<br />
Measures were developed as critical habitat parameters based on: 1) <strong>the</strong> literature<br />
on <strong>the</strong> habitat requirements <strong>of</strong> nor<strong>the</strong>rn pike and 2) <strong>the</strong> availability <strong>of</strong> data in Maine<br />
available <strong>for</strong> <strong>the</strong> watershed. The habitat parameters were developed first and <strong>the</strong>n<br />
applied without prior knowledge or through <strong>the</strong> direct use <strong>of</strong> <strong>the</strong> waterbody/waterway<br />
characteristics.<br />
The results <strong>for</strong> <strong>the</strong> waterbody and waterway models should be viewed as only<br />
indica<strong>to</strong>rs <strong>of</strong> <strong>the</strong> nor<strong>the</strong>rn pike population-habitat relationships with <strong>the</strong>ir primary<br />
value being <strong>to</strong> improve decision-making in a structured approach. The models are<br />
only one aspect <strong>of</strong> identifying <strong>the</strong> risk <strong>of</strong> nor<strong>the</strong>rn pike introductions and should not<br />
be relied upon solely <strong>for</strong> decision making.<br />
1. Two ponds ranked high (Towne Pond and Oak Knoll Bog) with each pond<br />
being less than 8 HA in area (20 acres<br />
2. 94 waterbodies ranked as medium potential and ranged from 2 <strong>to</strong> 582 HA.<br />
About 90 percent were less than 40 HA (about 100 acres). The five largest<br />
waterbodies ranked as medium potential include: Endless Lake, Ebeemee<br />
Lake, Burden Pond, Second and Third Branch Ponds, and Shirley Bog.<br />
3. 100 waterbodies ranked as low potential and ranged from 2 <strong>to</strong> 2,841 HA. The<br />
five largest waterbodies ranked as low potential were: Schoodic Lake, Sebec<br />
Lake, Seboeis Lake, Lower Wilson Pond and Lake Onawa.<br />
4. About 97 percent <strong>of</strong> <strong>the</strong> rivers and streams (2,714 km) in <strong>the</strong> watershed were<br />
assigned a HSI value <strong>of</strong> 0.<br />
5. Of <strong>the</strong> 3 percent (97 km) that were assigned a HSI value <strong>of</strong> 0.2 or higher,<br />
most were located in <strong>the</strong> Piscataquis River mainsteam downstream <strong>of</strong> <strong>the</strong><br />
Town <strong>of</strong> Guil<strong>for</strong>d and in <strong>the</strong> lower Sebec and Pleasant Rivers near <strong>the</strong><br />
confluence <strong>of</strong> <strong>the</strong> Piscataquis River.<br />
6. Ninety-four percent <strong>of</strong> <strong>the</strong> river segments that were suitable potential habitat<br />
<strong>for</strong> nor<strong>the</strong>rn pike were rated as higher suitability (HSI values <strong>of</strong> 0.8 or 1).<br />
The calibration/verification was completed by normalizing <strong>the</strong> ratings that Robert<br />
VanRiper (MDIFW Biologist, Region B) provided <strong>for</strong> <strong>the</strong> nor<strong>the</strong>rn pike lakes in<br />
Region B. The model classification was compared <strong>to</strong> <strong>to</strong> VanRiper 's ratings and<br />
trying <strong>to</strong> improve <strong>the</strong> classification by changing <strong>the</strong> parameter weights.<br />
PRFP Page 258
No improvements were made over <strong>the</strong> original model and weightings. The model<br />
correctly classified 66% percent <strong>of</strong> <strong>the</strong> nor<strong>the</strong>rn pike lakes rated by VanRiper, over<br />
classified 17% <strong>of</strong> <strong>the</strong> lakes (<strong>the</strong> model predicted a higher potential than <strong>the</strong> rating),<br />
and under classified 17% <strong>of</strong> <strong>the</strong> lakes (<strong>the</strong> model predicted a lower potential than <strong>the</strong><br />
rating). Overall, <strong>the</strong> model conservatively classified 83% <strong>of</strong> <strong>the</strong> lakes by classifying<br />
<strong>the</strong>m correctly or overestimating <strong>the</strong> lake potential (classifying a lake as medium that<br />
VanRiper identified as low).<br />
The five nor<strong>the</strong>rn pike lakes that were under classified by <strong>the</strong> model were reviewed.<br />
Lake areas > 1000 HA, mesotrophic lakes, lakes that stratefy and < 0.5 meters per<br />
year <strong>of</strong> run<strong>of</strong>f from watershed are <strong>the</strong> parameters that most predicted <strong>the</strong> model's<br />
under classified lakes in Region B (Ingham, Long, Great, Messalonskee and Little<br />
North/North Ponds). However, <strong>the</strong> lake type (mesotrophic) may be more indicative <strong>of</strong><br />
lakes in Region B than Region F. Based on this screening criteria, at least three<br />
lakes would need <strong>to</strong> be reviewed using best pr<strong>of</strong>essional judgment: Silver, Upper<br />
Ebeemee and Seboeis Lakes. They meet some but not all <strong>of</strong> <strong>the</strong> screening criteria.<br />
Human Dispersal<br />
Natural dispersal occurs at a lower mean rate (1.15 introductions per year) than<br />
human-caused introduction (2.63 introductions per year). Human-caused<br />
introductions are more likely <strong>to</strong> result in multiple introductions in one year than<br />
introductions through natural dispersal. The probability <strong>of</strong> three or more<br />
introductions in one year is 0.49 <strong>for</strong> human-caused introductions in contrast <strong>to</strong> a<br />
probability <strong>of</strong> 0.11 <strong>for</strong> natural dispersal. This higher probability may arise from <strong>the</strong><br />
mechanism <strong>of</strong> dispersal. Human-caused introductions can occur through a<br />
watershed in watersheds that are disassociated from those that contain nor<strong>the</strong>rn<br />
pike. Introductions through natural dispersal occur in watersheds where pike are<br />
found and more likely <strong>to</strong> occur in habitat adjacent <strong>to</strong> or downstream <strong>of</strong> existing<br />
populations (J. Casselman, personal communication, March 13, 2009).<br />
Both pathways pose a risk <strong>for</strong> introduction <strong>of</strong> nor<strong>the</strong>rn pike, however human-caused<br />
introductions pose a greater risk. They have a very low probability <strong>of</strong> resulting in no<br />
introductions in any one year, <strong>the</strong>y have a much higher mean rate <strong>of</strong> introduction,<br />
<strong>the</strong>y have a much higher probability <strong>of</strong> multiple introductions in one year, and <strong>the</strong>y<br />
can result in introductions in watersheds removed from those watersheds with<br />
populations <strong>of</strong> nor<strong>the</strong>rn pike.<br />
Summary <strong>of</strong> Resources at Risk<br />
In order <strong>to</strong> determine <strong>the</strong> extent <strong>of</strong> resources at risk above Howland, two approaches<br />
were taken: identifying priority resources and associated geographic locations areas<br />
throughout <strong>the</strong> drainage, and barriers <strong>to</strong> nor<strong>the</strong>rn pike, both natural and<br />
anthropogenic.<br />
A list <strong>of</strong> five priority resources was developed. High priority resource classes<br />
include: high quality brook trout habitat, wild landlocked salmon, lake trout or brook<br />
trout lakes, species <strong>of</strong> Concern (Lake whitefish in Hebron Lake, arctic char in Bald<br />
PRFP Page 259
Mountain Pond as well as American eel throughout <strong>the</strong> drainage), Atlantic salmon,<br />
and Cold water management and remote lakes. Occurrences <strong>of</strong> priority resources<br />
were summed and rated as Category 1 (high) with four <strong>to</strong> six occurrences <strong>of</strong> priority<br />
resources (30% <strong>of</strong> <strong>the</strong> drainage), Category 2 (medium) with one <strong>to</strong> three<br />
occurrences <strong>of</strong> priority resources (65% <strong>of</strong> <strong>the</strong> drainage), and Category 3 (low) with<br />
zero occurrences <strong>of</strong> priority resources (5% <strong>of</strong> <strong>the</strong> drainage).<br />
Nor<strong>the</strong>rn pike are not adapted <strong>to</strong> strong currents. Water velocity exceeding 1.5 m/s<br />
can block spawning migrations (Inskip 1982). Nor<strong>the</strong>rn pike have little use <strong>for</strong><br />
riverine habitats where <strong>the</strong> gradient exceeds 5 m/km (0.5 % slope), and have less<br />
<strong>to</strong>lerance <strong>for</strong> gradient than muskellunge (Inskip 1982). There<strong>for</strong>e, natural falls and<br />
dams where temporary velocity or jump barriers could be created were identified.<br />
These barriers would be considered emergency measures but not permanent<br />
solutions.<br />
Tiered Risk Approach<br />
In order <strong>to</strong> articulate <strong>the</strong> risk, <strong>the</strong> drainage was divided in<strong>to</strong> three areas; 1) areas<br />
where barriers exist and some action is possible, 2) areas without barriers that have<br />
Category 1 resources and 3) areas without barriers that are category 2 or 3.<br />
Level 1 Management actions<br />
Locations where potential action can be taken are areas that are ei<strong>the</strong>r above<br />
natural barriers or above a human barrier that can be modified where Category 1<br />
resources are at risk. The risk <strong>of</strong> natural nor<strong>the</strong>rn pike dispersal in <strong>the</strong>se areas is<br />
low.<br />
• The Sebec drainage has two FERC regulated dams (Milo and Sebec) below<br />
<strong>the</strong> outlet that currently have no provisions <strong>for</strong> passage.<br />
• The upper Piscataquis River has three dams where temporary velocity or<br />
jump barriers can be installed; Lower Dover-Foxcr<strong>of</strong>t, Upper Dover-Foxcr<strong>of</strong>t<br />
and Guil<strong>for</strong>d, which all currently have passage.<br />
• The dam at Schoodic Lake has a 6’ dam with three gates – but at high water<br />
it may be passable and West Seboeis Lake dam is impassible.<br />
Level 2 Management actions<br />
Vulnerable areas with Category 1 resources are <strong>the</strong> highest concern. This category<br />
comprises 41% <strong>of</strong> accessible river habitat and 18% <strong>of</strong> accessible lake habitat<br />
drainage below natural falls or dams.<br />
• East Branch Pleasant and East Branch <strong>of</strong> <strong>the</strong> Seboeis are <strong>the</strong> two<br />
tributaries <strong>of</strong> <strong>the</strong> Piscataquis River that have <strong>the</strong> potential connections <strong>to</strong><br />
<strong>the</strong> West Branch.<br />
• Dow Pond is <strong>the</strong> only native/wild brook trout pond below an existing<br />
barrier.<br />
• Some restrictions on passage where possible that are compatible with<br />
phased alewife and shad res<strong>to</strong>ration goals.<br />
PRFP Page 260
Level 3 Management actions<br />
These areas are <strong>the</strong> lowest concern in <strong>the</strong> drainage. This category comprises 59%<br />
<strong>of</strong> accessible river habitat and 82% <strong>of</strong> accessible lake habitat drainage below natural<br />
falls or dams.<br />
• Suggest moni<strong>to</strong>ring in <strong>the</strong>se areas<br />
• Public education<br />
• No restrictions on passage<br />
PRFP Page 261
Management Actions<br />
2009:<br />
a. Maintain current blockages <strong>for</strong> pike in Sebec upper and lower until phase 1 <strong>of</strong><br />
alewife res<strong>to</strong>ration is complete and group 1 American shad res<strong>to</strong>ration is<br />
complete.<br />
a. Develop an MOU <strong>to</strong> re-visit in 2014<br />
b. Investigate and maintain current blockages <strong>for</strong> pike in Schoodic and Seboeis<br />
Lakes until phase 1 <strong>of</strong> alewife res<strong>to</strong>ration is complete and group 1 American<br />
shad res<strong>to</strong>ration is complete.<br />
a. Investigate current structures<br />
b. Develop plan <strong>of</strong> action <strong>for</strong> modification if necessary<br />
c. Develop an evaluation plan<br />
d. Develop a maintenance plan<br />
e. Develop an MOU <strong>to</strong> revisit in 2014<br />
c. Create velocity or jump barriers <strong>for</strong> pike while allowing Atlantic salmon <strong>to</strong> pass<br />
in D-F upper and lower and Guil<strong>for</strong>d lower until phase 1 <strong>of</strong> alewife res<strong>to</strong>ration<br />
is complete and group 1 American shad res<strong>to</strong>ration is complete<br />
a. Investigate current structures<br />
b. Develop plan <strong>of</strong> action <strong>for</strong> modification if necessary<br />
c. Develop an evaluation plan<br />
d. Develop a maintenance plan<br />
e. Develop an MOU <strong>to</strong> revisit in 2014<br />
d. Third party survey <strong>of</strong> potential connections and a development <strong>of</strong> solutions<br />
between <strong>the</strong> West Branch Penobscot River and <strong>the</strong> Pleasant River<br />
(Immediate need) - $15,000<br />
a. Upper Ebeemee and Upper Jo-Mary Lake (<strong>the</strong> West Branch<br />
Penobscot)<br />
b. East Branch Pond, which flows north and south <strong>to</strong> Nollesemic <strong>to</strong> Shad<br />
<strong>to</strong> <strong>the</strong> West Branch Penobscot below two impassable dams.<br />
e. Continue removal ef<strong>for</strong>ts at Pushaw - IFW cost one time $30,000 plus annual<br />
salary.<br />
a. Conduct a study <strong>of</strong> Pushaw Stream <strong>to</strong> look <strong>for</strong> juvenile pike<br />
f. Conduct a study <strong>of</strong> Mud Pond<br />
g. E-fish around <strong>the</strong> known spawning areas <strong>to</strong> look <strong>for</strong> nursery areas.<br />
h. Review current fishing regulations and develop recommendations <strong>for</strong><br />
changes.<br />
i. Review current education ef<strong>for</strong>ts and develop recommendations <strong>for</strong> changes.<br />
j. Maintain public education ef<strong>for</strong>ts highlighting <strong>the</strong> permanent repercussions<br />
and costs associated with illegal fish s<strong>to</strong>cking events.<br />
2010:<br />
b. Continue removal ef<strong>for</strong>ts at Pushaw - annual IFW cost<br />
c. If feasible, install barriers between <strong>the</strong> Pleasant River and <strong>the</strong> West Branch<br />
Penobscot River – Cost TBD<br />
PRFP Page 262
d. Conduct habitat surveys <strong>of</strong> <strong>the</strong> Penobscot mainstem from Mil<strong>for</strong>d <strong>to</strong> Howland<br />
<strong>to</strong> determine <strong>the</strong> spatial distribution, quantity and quality <strong>of</strong> habitat patches<br />
necessary <strong>for</strong> upstream pike dispersal.<br />
e. LIDAR survey <strong>for</strong> gradient <strong>to</strong> get better data on potential movement <strong>of</strong> pike<br />
and location <strong>of</strong> additional natural barriers.<br />
f. Implement changes <strong>to</strong> <strong>the</strong> fishing regulations<br />
g. Enhance educational ef<strong>for</strong>ts <strong>to</strong> reduce human introductions<br />
2011:<br />
a. Continue removal ef<strong>for</strong>ts at Pushaw - annual IFW cost<br />
b. Design a stratified random survey <strong>for</strong> non-natives in <strong>the</strong> drainage<br />
2012:<br />
a. Continue removal ef<strong>for</strong>ts at Pushaw - annual IFW cost<br />
b. Implement <strong>the</strong> non-native survey<br />
PRFP Page 263
References<br />
Auclair, R.P. 1982. Moosehead Lake Fishery Management. Maine Department <strong>of</strong><br />
Inland Fisheries and Wildlife. Fisheries Research Bulletin No. 11.<br />
Baldwin, N.S. 1956. Food consumption and growth <strong>of</strong> brook trout at different<br />
temperatures. Trans. Am. Fish Soc. 86: 323-328<br />
Barr, L. M. 1962. A life his<strong>to</strong>ry study <strong>of</strong> <strong>the</strong> chain pickerel, Esox niger LeSueur, in<br />
Bedding<strong>to</strong>n Lake, Maine. MS Thesis, University <strong>of</strong> Maine. 88pp.<br />
Baum, E. T. 1983. The Penobscot River: an Atlantic salmon river management<br />
report. Atlantic Sea Run Salmon Commission. Bangor, ME. 67 pp.<br />
Bonney, Forrest. 2006. Maine Brook Trout: Biology, Conservation, and<br />
Management. Maine Dept <strong>of</strong> Inland Fisheries and Wildlife.<br />
Brautigam, F. 2001. Nor<strong>the</strong>rn Pike Management <strong>Plan</strong>. Maine Department <strong>of</strong> Inland<br />
Fish and Wildlife. Grey, Maine. 26pp.<br />
Bys<strong>to</strong>m P., J. Karlsson, P. Nilsson, T. Van Kooten, J. Ask, and F. Ol<strong>of</strong>sson. 2007.<br />
Substitution <strong>of</strong> <strong>to</strong>p preda<strong>to</strong>rs: effects <strong>of</strong> pike invasion in a subarctic lake.<br />
Freshwater Biology 52(7): 1271–1280.<br />
Casselman, J. M. and C. A. Lewis. 1996. Habitat requires <strong>of</strong> nor<strong>the</strong>rn pike (Esox<br />
lucius). Can. J. Fish. Aquat. Sci. 53(Supl. 1): 161-174<br />
Costello, C. J. and A. R. Solow. One <strong>the</strong> pattern <strong>of</strong> discovery <strong>of</strong> introduced species.<br />
Proceedings <strong>of</strong> <strong>the</strong> National Academy <strong>of</strong> Sciences (USA) 100:3321-3323.<br />
Craig, F. J. 2008. A short review <strong>of</strong> pike ecology. Hydrobiologia 601:5-16.<br />
Danie, D.S., J.G. Trial and J.G. Stanley. 1984. Species pr<strong>of</strong>iles: life his<strong>to</strong>ries and<br />
environmental requirements <strong>of</strong> coastal fish and invertebrates (North Atlantic)<br />
Atlantic salmon. U.S. Fish and Wildlife Service, FWS/OBS-82/11.22. 19 pp.<br />
Dudley, R. 2004. Hydraulic-geometry relations <strong>for</strong> rivers in coastal and central<br />
Maine. U.S. Geological Survey. Scientific Investigations Report 2004-5042.<br />
Augusta, Maine.<br />
EBTJV. 2008. Conserving <strong>the</strong> Eastern Brook Trout: Action Strategies. 88 pp.<br />
Everhart, W.H. 1976. <strong>Fishes</strong> <strong>of</strong> Maine. Maine Dept <strong>of</strong> Inland Fisheries and Wildlife.<br />
Findlay, D.L., M.J. Vanni, M. Patterson, K.H. Mills, S.E.M. Kasian, W.J. Findlay, and<br />
A.G Salki. 2005. Dynamics <strong>of</strong> a boreal lake ecosystemduring a long-term<br />
manipulation <strong>of</strong> <strong>to</strong>p preda<strong>to</strong>rs. Ecosystems (8):603–618.<br />
PRFP Page 264
Gallagher, M., R. Dill and G. Kramer. 2006. Pushaw lake fisheries management<br />
plan: A plan <strong>for</strong> controlling nor<strong>the</strong>rn pike in <strong>the</strong> Penobscot river basin. A final<br />
programmatic report <strong>for</strong> <strong>the</strong> National Fish and Wildlife Foundation Project:<br />
Pushaw Lake Nor<strong>the</strong>rn Pike Assessment (ME) (2005-0009-023), 30p.<br />
Goodwin, P. and G. Wright. 2004. Decision Analysis <strong>for</strong> Management Judgement.<br />
3 rd Ed. John Wiley & Sons, New York. 477 pp.<br />
Griffith, J.R. 1972. Comparative behavior and habitat utilization <strong>of</strong> brook trout<br />
(Salvelinus fontinalis) and cutthroat trout (Salmo clarkii) in small streams in<br />
Nor<strong>the</strong>rn Idaho. Journal <strong>of</strong> <strong>the</strong> Fisheries Research Board <strong>of</strong> Canada 29(3):<br />
265-273.<br />
Hakanson, L. and V. V. Boulion. 2002. Empirical and dynamic models <strong>to</strong> predict <strong>the</strong><br />
cover, biomass and production <strong>of</strong> macrophytes in lakes. Ecological Modelling<br />
151:213-243.<br />
Hart, P. and Hamrin, S. 1988. Pike as a selective preda<strong>to</strong>r. Effects <strong>of</strong> prey size,<br />
availability, cover and pike jaw dimensions. – Oikos 51:220-226.<br />
He, X. and J.F. Kitchell. 1990. Direct and Indirect Effects <strong>of</strong> Predation on a Fish<br />
Community: A Whole-Lake Experiment. Transactions <strong>of</strong> <strong>the</strong> American<br />
Fisheries Society 119(5): 825–835.<br />
Hudy, M., T. M. Thieling, N. Gillespie and E. P. Smith. 2005. Distribution, Status and<br />
Perturbations <strong>to</strong> Brook Trout within <strong>the</strong> eastern United States. Final report <strong>to</strong><br />
<strong>the</strong> steering committee <strong>of</strong> Eastern Brook Trout Joint Venture . 77 pp.<br />
Hyvärinen P, Vehanen T. Effects <strong>of</strong> brown trout body size on post-s<strong>to</strong>cking survival<br />
and pike predation. Ecology <strong>of</strong> Freshwater Fish 2004: 13: 77-84. © Blackwell<br />
Munksgaard, 2004<br />
Inskip, P. D. 1982. Habitat suitability index models: nor<strong>the</strong>rn pike. U.S. Department<br />
<strong>of</strong> Interior, Fish and Wildlife Service. FWS/OBS-82/10.17. 40 pp.<br />
Jepsen, N., K. Aarestrup, F. Økland and G. Rasmussen. 2006. Survival <strong>of</strong><br />
radiotagged Atlantic salmon ( Salmo salar L.) – and trout ( Salmo trutta L.)<br />
smolts passing a reservoir during seaward migration. Hydrobiologia. Vol.<br />
371-372: 347-353.<br />
Kekäläinen, J., T. Niva, H. Huuskonen. 2008. Pike predation on hatchery reared<br />
Atlantic salmon smolts in a nor<strong>the</strong>rn Baltic river. Ecology <strong>of</strong> Freshwater Fish,<br />
Vol. 17, No. 1: 100-109.<br />
PRFP Page 265
Koed, A. Balleby, K., Mejlhede, P., and K. Aarestrup. 2006. Annual movement <strong>of</strong><br />
adult pik (Esox lucius L.) in a lowland river. Ecology <strong>of</strong> Freshwater Fish 15:<br />
191-199.<br />
Larson, K. 1985. The food <strong>of</strong> nor<strong>the</strong>rn pike (Esox lucius) in trout streams. Medd.<br />
Danm. Fiskeri-og Note: Republished in Journal <strong>of</strong> Fish Biology, Vol. 26,<br />
Issue 4: 391-397.<br />
Lucas, J. 2008. Revised: Nor<strong>the</strong>rn Pike Management <strong>Plan</strong>. Maine Department <strong>of</strong><br />
Inland Fish and Wildlife. Sidney, Maine. 26pp.<br />
MacMillian, J.L. 1998. Thermal ecology <strong>of</strong> brook trout (Salvelinus fontinalis) and<br />
Atlantic salmon (Salmo salar) in impounded streams: behavioral responses<br />
and population impacts. Masters Thesis, Acadia University, 193 pp.<br />
Miller, R. R., J. D. Williams, and J. E. Williams. 1989. Extinction <strong>of</strong> North American<br />
fishes during <strong>the</strong> past century. Fisheries 14(6): 22-38.<br />
Nilsson PA, Brönmark C, 1999. Foraging among cannibals and<br />
klep<strong>to</strong>parasites:effects <strong>of</strong> prey size on pike behavior. Behavioral Ecology<br />
vol.10 No. 5: 557-566.<br />
Petrozvanskiy, V.Y., V. F. Bugaev, Y. A. Shus<strong>to</strong>v and I. L. Shchurov. 1988. Some<br />
ecological characteristics <strong>of</strong> nor<strong>the</strong>rn pike, (Esox lucius), <strong>of</strong> <strong>the</strong> Keret’, a<br />
salmon river in <strong>the</strong> White Sea basin. Journal <strong>of</strong> Ichthyology, Vol. 28: 136-<br />
140.<br />
Scott, W.B. and E.J. Crossman. 1973. Freshwater fishes <strong>of</strong> Canada. Ottawa Fish<br />
Res. Board Can. Bull. 184.<br />
Solow, A. R. and C. J. Costello. 2004. Estimating <strong>the</strong> rate <strong>of</strong> species introductions<br />
from <strong>the</strong> discovery record. Ecology 85: 1822-1825.<br />
Spear, E. 1991. Application <strong>for</strong> new license <strong>for</strong> Ripogenus Project FERC No. 2572.<br />
Volume IX. Report on Fish Resources. Great Nor<strong>the</strong>rn Paper Nekoosa<br />
Corporation.<br />
Spence-Cheruvelil, K. and P. A. Soranno. 2008. Relationships between lake<br />
macrophyte cover and lake and landscape features. Aquatic Botany 88: 219-<br />
227<br />
Spens, J., Englund, G. and H. Lundqvist. 2007. Network connectivity and dispersal<br />
barriers: using geographic in<strong>for</strong>mation system (GIS) <strong>to</strong>ols <strong>to</strong> predict<br />
landscape scale distribution <strong>of</strong> a key preda<strong>to</strong>r (Esox lucius) among lakes.<br />
Journal <strong>of</strong> Applied Ecology 44: 1127-1137<br />
PRFP Page 266
Starfield, A. M. and A. L. Bleloch. 1991. Building Models <strong>for</strong> Conservation and<br />
Wildlife Management. Interaction Book Company, Minnesota. 253 pp.<br />
Van den Ende, O. 1993. Predation on Atlantic salmon smolts (Salmo salar) by<br />
smallmouth bass (Micropterus dolomieu) and chain pickerel (Esox niger) in<br />
<strong>the</strong> Penobscot River, Maine. M.S. Thesis, University <strong>of</strong> Maine, Orono,<br />
Maine. 95pp.<br />
Vander Zanden, M.J., J.D. Olden, J.H. Thorne, and N.E. Mandrak. 2004. Predicting<br />
occurrences and impacts <strong>of</strong> smallmouth bass introductions in north temperate<br />
lakes. Ecological Applications 14(1): 132-148.<br />
Warner, K. 1972. Fur<strong>the</strong>r studies <strong>of</strong> fish predation on salmon s<strong>to</strong>cked in Maine<br />
lakes. Progressive Fish Culturist 34 (4):217-221.<br />
Wagner, T., Bremigan, M. T., Spence-Cheruvelil, K. S., Soranno, P. A. and N. A.<br />
Nate. 2007. A multilevel modeling approach <strong>to</strong> assessing regional and local<br />
landscape features <strong>for</strong> lake classification and assessment <strong>of</strong> fish growth<br />
rates. Environmental Moni<strong>to</strong>ring and Assessment 130(1-3): 437<br />
Warner, K. and K.A. Havey. 1985. The Landlocked Salmon in Maine. Maine<br />
Department <strong>of</strong> Inland Fisheries and Wildlife.<br />
Wright, J., Sweka, J., Abbott, A. and T. Trinko. 2008. GIS-based Atlantic Salmon<br />
Habitat Model. Draft. NOAA-Fisheries. Orono, Maine.<br />
Yoder, C. O., Kulik, B. H., Apell, B. J. and J. M. Audet. 2005. 2005 Maine River<br />
Fish Assemblage Assessment: Volumes I. – III. Center <strong>for</strong> Applied<br />
Bioassessment and Biocriteria, Midwest Biodiversity Institute. Columbus,<br />
OH.<br />
PRFP Page 267
Appendices<br />
Appendix A: Trapping/Sorting/Counting Facility Proposed Bypass Channel Howland<br />
Dam, Howland, Maine. May 20, 2008<br />
Appendix B: A handout summarizing Stantec’s evaluation was distributed at <strong>the</strong><br />
meeting and is included as<br />
Appendix C: The pattern <strong>of</strong> introduction and dispersal in lakes from <strong>the</strong> discovery<br />
record graphically illustrated in a map time series<br />
Appendix D: Invasive species response and <strong>the</strong> Eastern Brook Trout joint Venture<br />
(EBTJV)<br />
PRFP Page 268
Appendix A: Trapping/Sorting/Counting Facility Proposed Bypass Channel<br />
Howland Dam, Howland, Maine. May 20, 2008<br />
PRFP Page 269
1 INTRODUCTION<br />
This report presents preliminary in<strong>for</strong>mation and comments regarding <strong>the</strong> feasibility <strong>of</strong> a<br />
facility <strong>for</strong> trapping, sorting, and counting <strong>of</strong> fish passing upstream in <strong>the</strong> proposed bypass<br />
channel (Proposed Bypass) at Howland Dam on <strong>the</strong> Piscataquis River adjacent <strong>to</strong> its<br />
confluence with <strong>the</strong> Penobscot River in Howland, Maine. The Proposed Bypass channel is<br />
identified in <strong>the</strong> Lower Penobscot River Basin Comprehensive Settlement Accord as a<br />
PRFP Page 270
means <strong>to</strong> “provide safe, timely and effective fish passage sufficient <strong>to</strong> allow <strong>the</strong> fisheries<br />
management goals and objective <strong>of</strong> <strong>the</strong> Resource Agencies and PIN <strong>to</strong> be met.”<br />
During <strong>the</strong> spring and summer <strong>of</strong> 2007, representatives <strong>of</strong> <strong>the</strong> Penobscot River <strong>Res<strong>to</strong>ration</strong><br />
Trust (Trust) met with state and federal fisheries agency staff <strong>to</strong> develop an Outline <strong>for</strong><br />
Preliminary Design <strong>of</strong> Proposed Howland Fish Bypass (Outline). The Outline included a<br />
provision that:<br />
“The preliminary design will also evaluate <strong>the</strong> feasibility and costs (including operating costs)<br />
<strong>of</strong> incorporating provisions <strong>for</strong> trapping/sorting/counting <strong>of</strong> fish using <strong>the</strong> bypass. This<br />
includes measures <strong>to</strong> exclude upstream migration <strong>of</strong> nor<strong>the</strong>rn pike and black crappie, both<br />
<strong>of</strong> which do not now exist above <strong>the</strong> Howland Dam, and are considered by Maine<br />
Department <strong>of</strong> Inland Fisheries and Wildlife <strong>to</strong> be undesirable, non-native invasive species.<br />
Under <strong>the</strong> terms <strong>of</strong> <strong>the</strong> Settlement Agreement, <strong>the</strong> resource agencies are responsible <strong>for</strong><br />
management activities such as trapping/sorting/trucking.”<br />
This letter is intended <strong>to</strong> address those concerns. The original intent <strong>of</strong> <strong>the</strong> Proposed<br />
Bypass was <strong>to</strong> provide simple, safe, low maintenance upstream and downstream fish<br />
passage <strong>for</strong> all species, all <strong>of</strong> <strong>the</strong> time. This report was prepared using conceptual design<br />
in<strong>for</strong>mation prepared by Milone & MacBroom, Inc. (MMI) and presents in<strong>for</strong>mation relevant<br />
<strong>to</strong> <strong>the</strong> general feasibility <strong>of</strong> a trapping/sorting/counting facility (TSCF). The intent <strong>of</strong> <strong>the</strong><br />
conceptual TSCF design discussed herein is <strong>to</strong> present general components <strong>of</strong> a TSCF<br />
relevant <strong>to</strong> <strong>the</strong> determination <strong>of</strong> <strong>the</strong> feasibility <strong>of</strong> a TSCF.<br />
A TSCF within <strong>the</strong> Proposed Bypass was identified by <strong>the</strong> Trust, in consultation with state<br />
and federal regula<strong>to</strong>ry authorities, as a means <strong>to</strong> (1) trap and survey upstream-migrating<br />
fish; and (2) exclude non-native fishes. As presented here, a TSCF system is an integrated<br />
system <strong>for</strong> trapping, sorting, and counting fish passing upstream and providing downstream<br />
conveyance <strong>for</strong> flow in <strong>the</strong> Proposed Bypass. The conceptual TSCF presented here<br />
<strong>the</strong>re<strong>for</strong>e consists <strong>of</strong> appurtenances intended <strong>to</strong> provide means <strong>to</strong> trap fish passing<br />
upstream and <strong>to</strong> provide <strong>for</strong> conveyance <strong>of</strong> water in<strong>to</strong> <strong>the</strong> Proposed Bypass.<br />
This study was being per<strong>for</strong>med as part <strong>of</strong> <strong>the</strong> ongoing work by MMI on <strong>the</strong> dam removal<br />
design <strong>for</strong> Veazie Dam and Great Works Dam on <strong>the</strong> Penobscot River and <strong>the</strong> design <strong>of</strong> a<br />
bypass channel at Howland Dam. In<strong>for</strong>mation presented in this report was developed from<br />
in<strong>for</strong>mation obtained as part <strong>of</strong> <strong>the</strong> ongoing project work, collaboration with Dr. Alex Haro <strong>of</strong><br />
<strong>the</strong> U.S Geological Survey, and comments and suggestions by participants during <strong>the</strong><br />
March 11, 2008, project teleconference.<br />
2 OBJECTIVES<br />
The primary objective <strong>of</strong> <strong>the</strong> Proposed Bypass is <strong>to</strong> provide safe, timely, and effective<br />
upstream and downstream passage <strong>for</strong> target diadromous fishes, including anadromous<br />
Atlantic salmon (Salmo salar), American shad (Alosa sapidissima), alewife (Alosa<br />
pseudoharengus), blueback herring (Alosa aestivalis), and sea lamprey (Petromyzon<br />
marinus), and catadromous American eel (Anguilla rostrata). Adult fish represent <strong>the</strong> target<br />
life-stage <strong>for</strong> upstream passage <strong>of</strong> <strong>the</strong> anadromous species. Target life stages <strong>for</strong> upstream<br />
passage <strong>of</strong> American eel include both <strong>the</strong> “elver” and “yellow” phases. These fish are herein<br />
collectively referred <strong>to</strong> as <strong>the</strong> target passage species. Multiple life stages <strong>of</strong> <strong>the</strong> target<br />
diadromous fishes may also use <strong>the</strong> Proposed Bypass <strong>for</strong> downstream passage.<br />
PRFP Page 271
A TSCF is considered here as an appurtenance <strong>to</strong> <strong>the</strong> Proposed Bypass <strong>to</strong> provide a means<br />
<strong>for</strong> exclusion <strong>of</strong> non-indigenous fishes, including nor<strong>the</strong>rn pike (Esox lucius) and black<br />
crappie (Pomoxis nigromaculatus). These two species are herein collectively referred <strong>to</strong> as<br />
target exclusion species. Relevant in<strong>for</strong>mation documenting <strong>the</strong> presence <strong>of</strong> nor<strong>the</strong>rn pike in<br />
<strong>the</strong> Penobscot River watershed is presented in <strong>the</strong> Pushaw Lake Fisheries Management<br />
<strong>Plan</strong>. This report documents <strong>the</strong> presence <strong>of</strong> illegally-introduced nor<strong>the</strong>rn pike in Pushaw<br />
Lake, which is a tributary <strong>to</strong> <strong>the</strong> Penobscot River, along with anecdotal reporting <strong>of</strong> nor<strong>the</strong>rn<br />
pike in <strong>the</strong> Penobscot River adjacent <strong>to</strong> Howland Dam.<br />
Overlapping swimming abilities <strong>of</strong> <strong>the</strong> target passage species and <strong>the</strong> target exclusion<br />
species preclude achieving <strong>the</strong> project objectives <strong>of</strong> upstream fish passage and exclusion<br />
solely through <strong>the</strong> design <strong>of</strong> a bypass channel. Exclusion <strong>of</strong> non-native fishes is <strong>the</strong>re<strong>for</strong>e<br />
<strong>the</strong> objective <strong>of</strong> <strong>the</strong> TSCF facility.<br />
The TSCF per<strong>for</strong>mance criterion is <strong>to</strong>tal (100 percent) exclusion <strong>of</strong> <strong>the</strong> target exclusion<br />
species. The need <strong>for</strong> <strong>to</strong>tal exclusion is based on <strong>the</strong> assumption that introduction <strong>of</strong> even<br />
small numbers <strong>of</strong> target exclusion species may result in reproduction in <strong>the</strong> Piscataquis<br />
River watershed upstream from Howland Dam.<br />
3 CONCEPTUAL DESIGN<br />
A conceptual design <strong>of</strong> a TSCF was developed <strong>for</strong> <strong>the</strong> Proposed Bypass, including general<br />
features and operational methods. The basis <strong>for</strong> this design is that <strong>to</strong>tal exclusion <strong>of</strong> <strong>the</strong><br />
target exclusion species cannot be achieved through <strong>the</strong> design <strong>of</strong> <strong>the</strong> Proposed Bypass<br />
and <strong>the</strong>re<strong>for</strong>e manual sorting <strong>of</strong> upstream passing fishes is required. As previously noted,<br />
overlapping swimming abilities <strong>of</strong> <strong>the</strong> target passage and exclusion species preclude<br />
exclusion based on hydraulic conditions in <strong>the</strong> Proposed Bypass.<br />
A general requirement <strong>of</strong> <strong>the</strong> system would be that all or most <strong>of</strong> <strong>the</strong> flow be routed through<br />
<strong>the</strong> TSCF trapping component during periods <strong>of</strong> low flow <strong>to</strong> maintain upstream fish passage<br />
during <strong>the</strong>se periods.<br />
Alternative means <strong>for</strong> excluding <strong>the</strong> target exclusion species, such as electrical barriers,<br />
were briefly considered as part <strong>of</strong> this analysis but were determined <strong>to</strong> be incapable <strong>of</strong><br />
achieving <strong>to</strong>tal exclusion.<br />
3.1 Overview<br />
This section presents a general overview <strong>of</strong> <strong>the</strong> conceptual TSCF. The conceptual TSCF<br />
includes a trapping system with an adjacent sorting area located on <strong>the</strong> right (northwest)<br />
side <strong>of</strong> <strong>the</strong> upstream limit <strong>of</strong> <strong>the</strong> Proposed Bypass.<br />
Based on a review <strong>of</strong> in<strong>for</strong>mation presented in <strong>the</strong> Conceptual Design <strong>Plan</strong>s by MMI dated<br />
March 2008 and o<strong>the</strong>r relevant materials, routing <strong>the</strong> entire flow <strong>of</strong> <strong>the</strong> Proposed Bypass<br />
through a TSCF does not appear <strong>to</strong> be practical. The proposed design <strong>the</strong>re<strong>for</strong>e provides <strong>for</strong><br />
routing <strong>of</strong> limited attraction flow through <strong>the</strong> trap system and <strong>the</strong> balance <strong>of</strong> <strong>the</strong> flow entering<br />
<strong>the</strong> Proposed Bypass over an adjacent weir. The weir would be designed <strong>to</strong> preclude<br />
upstream passage by some or all <strong>of</strong> <strong>the</strong> target passage species and all <strong>of</strong> <strong>the</strong> target<br />
exclusion species. The balance <strong>of</strong> <strong>the</strong> flow would be routed around <strong>the</strong> trapping facility<br />
through <strong>the</strong> TSCF conveyance channel with means <strong>to</strong> preclude upstream passage <strong>of</strong> all<br />
target species or allow upstream passage <strong>for</strong> a subset <strong>of</strong> target passage species. The only<br />
target passage species capable <strong>of</strong> upstream passage over a weir designed <strong>to</strong> exclude<br />
nor<strong>the</strong>rn pike would be Atlantic salmon. Alewife and American shad are expected <strong>to</strong><br />
PRFP Page 272
comprise <strong>the</strong> majority <strong>of</strong> fish passing upstream through <strong>the</strong> Proposed Bypass following<br />
implementation <strong>of</strong> res<strong>to</strong>ration projects in <strong>the</strong> Penobscot River watershed, and operation <strong>of</strong><br />
<strong>the</strong> TSCF would <strong>the</strong>re<strong>for</strong>e require handling <strong>of</strong> <strong>the</strong>se fish.<br />
Fish entering <strong>the</strong> trap system would be manually sorted with dip nets or similar equipment.<br />
Manual operations would require skilled staff on a daily basis while target res<strong>to</strong>ration<br />
species are active. As presented herein, <strong>the</strong> TSCF can be used <strong>for</strong> both single and twostage<br />
manual sorting <strong>of</strong> trapped fish. It is envisioned that two-stage sorting would be used<br />
initially <strong>to</strong> provide <strong>for</strong> <strong>the</strong> evaluation <strong>of</strong> sorting efficacy at excluding target exclusion species.<br />
Configuration <strong>of</strong> <strong>the</strong> sorting area <strong>for</strong> single or two-stage sorting would be accomplished<br />
through opening and closing gates between <strong>the</strong> sorting area immediately adjacent <strong>to</strong> <strong>the</strong><br />
trap and <strong>the</strong> hydraulic inlet <strong>to</strong> <strong>the</strong> TSCF in <strong>the</strong> Howland Dam impoundment on <strong>the</strong><br />
Piscataquis River. Trash racks or o<strong>the</strong>r means <strong>of</strong> excluding debris from <strong>the</strong> TSCF and/or<br />
Proposed Bypass may be necessary.<br />
3.2 Facility Details<br />
This section presents more-detailed in<strong>for</strong>mation on <strong>the</strong> TSCF, including design alternatives<br />
and facility operations.<br />
3.2.1 Location<br />
Site-specific fac<strong>to</strong>rs and functional considerations suggest that a facility located <strong>to</strong>wards <strong>the</strong><br />
upstream end <strong>of</strong> <strong>the</strong> Proposed Bypass would be most appropriate. This determination is<br />
based on biological fac<strong>to</strong>rs, <strong>the</strong> generally steep banks downstream from Howland Dam,<br />
potential flooding <strong>of</strong> a facility situated adjacent <strong>to</strong> <strong>the</strong> confluence <strong>of</strong> <strong>the</strong> Piscataquis and<br />
Penobscot Rivers, and constructability.<br />
Location <strong>of</strong> a TSCF along <strong>the</strong> upper reach <strong>of</strong> <strong>the</strong> Proposed Bypass has a number <strong>of</strong><br />
apparent practical advantages over a system located along <strong>the</strong> downstream reach <strong>of</strong> <strong>the</strong><br />
bypass channel.<br />
Installation <strong>of</strong> a TSCF on <strong>the</strong> upper reach <strong>of</strong> <strong>the</strong> Proposed Bypass would likely result in<br />
fewer fish dropping back through <strong>the</strong> Proposed Bypass, particularly if flow speeds are lower<br />
in <strong>the</strong> Proposed Bypass upstream from <strong>the</strong> TSCF. Locating <strong>the</strong> TSCF at <strong>the</strong> upstream end<br />
<strong>of</strong> <strong>the</strong> Proposed Bypass along <strong>the</strong> Howland Dam impoundment would apparently minimize<br />
<strong>the</strong> potential <strong>for</strong> fish dropping-back through <strong>the</strong> TSCF. Appropriate conditions <strong>for</strong> upstream<br />
fish passage upstream from <strong>the</strong> TSCF are also necessary <strong>to</strong> reduce impingement <strong>of</strong> fish on<br />
<strong>the</strong> TSCF appurtenances (e.g., bar racks). Locating <strong>the</strong> TSCF along <strong>the</strong> upper reach <strong>of</strong> <strong>the</strong><br />
Proposed Bypass may also limit <strong>the</strong> number <strong>of</strong> fish entering <strong>the</strong> system, as weak and/or<br />
injured fish and fish that lack a strong urge <strong>to</strong> move upstream through <strong>the</strong> system may not<br />
move far enough up <strong>the</strong> bypass channel <strong>to</strong> reach <strong>the</strong> TSCF.<br />
The high steep banks downstream from <strong>the</strong> Howland Dam pose a number <strong>of</strong> practical<br />
issues relevant <strong>to</strong> <strong>the</strong> TSCF, including potential flooding, constructability, access, and<br />
operations and maintenance. Potential flooding constraints can be determined using typical<br />
engineering methods, and would need <strong>to</strong> consider maximum water surface elevations in <strong>the</strong><br />
Penobscot River and potential overwashing <strong>of</strong> <strong>the</strong> adjacent land during flood events in <strong>the</strong><br />
Piscataquis River. Permanent access <strong>for</strong> heavy equipment <strong>to</strong> <strong>the</strong> TSCF would likely be<br />
required, including tank trucks <strong>for</strong> “trap and truck” s<strong>to</strong>cking. A TSCF located on <strong>the</strong> upper<br />
reach <strong>of</strong> <strong>the</strong> Proposed Bypass would likely have easier access <strong>for</strong> such equipment.<br />
PRFP Page 273
Because a TSCF would likely result in high concentrations <strong>of</strong> fish immediately downstream<br />
<strong>of</strong> <strong>the</strong> facility during periods <strong>of</strong> peak migration, <strong>the</strong> possibility <strong>of</strong> poaching should also be<br />
considered. In addition <strong>to</strong> providing conditions (e.g., deep water, limited access) that are not<br />
favorable <strong>to</strong> poaching, a location in a more visible area would also likely limit poaching.<br />
3.2.2 Trapping Facility Size<br />
A primary fac<strong>to</strong>r <strong>for</strong> determining <strong>the</strong> size <strong>of</strong> <strong>the</strong> TSCF is <strong>the</strong> number <strong>of</strong> fish requiring sorting<br />
at <strong>the</strong> facility during <strong>the</strong> peak migration periods <strong>of</strong> diadromous and resident fish. Peak daily<br />
numbers <strong>of</strong> fish will likely occur during <strong>the</strong> upstream migrations <strong>of</strong> adult alewife, blueback<br />
herring, and shad in May and June following implementation <strong>of</strong> res<strong>to</strong>ration projects (e.g.,<br />
removal <strong>of</strong> Veazie Dam and Great Works Dam) in <strong>the</strong> Penobscot River.<br />
Large numbers <strong>of</strong> seasonally-migrating resident fish, such as white sucker (Ca<strong>to</strong>s<strong>to</strong>mus<br />
commersoni), may also use <strong>the</strong> Proposed Bypass, and may represent <strong>the</strong> largest number <strong>of</strong><br />
fish passing through <strong>the</strong> Proposed Bypass prior <strong>to</strong> <strong>the</strong> implementation <strong>of</strong> <strong>the</strong> full suite <strong>of</strong><br />
res<strong>to</strong>ration projects in <strong>the</strong> Penobscot River watershed.<br />
Estimates have been developed by o<strong>the</strong>rs 21 <strong>of</strong> potential numbers <strong>of</strong> alewife and American<br />
shad <strong>for</strong> <strong>the</strong> Piscataquis River. This in<strong>for</strong>mation indicates that up <strong>to</strong> 245,000 adult shad may<br />
pass upstream at Howland Dam. Estimated adult alewife production <strong>for</strong> waterbodies in <strong>the</strong><br />
Piscataquis, Pleasant, Schoodic, Sebec, and Seboeis subwatersheds is in excess <strong>of</strong><br />
5,500,000. The upstream migration period <strong>for</strong> shad and alewife in <strong>the</strong> Penobscot River<br />
watershed is from May through June, or approximately 60 days, and it is <strong>the</strong>re<strong>for</strong>e assumed<br />
that in excess <strong>of</strong> 100,000 fish may attempt <strong>to</strong> move upstream at Howland Dam in a given<br />
day (4,200 per hour).<br />
Based on a minimum volume <strong>of</strong> 0.25 cubic-feet (CF) per pound <strong>of</strong> fish, an average alewife<br />
weight <strong>of</strong> 0.5 pounds, and a maximum passage rate <strong>of</strong> two-times <strong>the</strong> hourly passage<br />
number given above (8,400 fish), <strong>the</strong> TSCF trap would need <strong>to</strong> have a volume <strong>of</strong><br />
approximately 1,000 CF. A “holding area” would likely be necessary in <strong>the</strong> adjacent reach <strong>of</strong><br />
<strong>the</strong> Proposed Bypass <strong>to</strong> provide a buffer <strong>for</strong> potential numbers <strong>of</strong> fish exceeding <strong>the</strong><br />
handling capacity <strong>of</strong> <strong>the</strong> TSCF.<br />
A proposed guideline <strong>for</strong> <strong>the</strong> holding area is that it accommodate two-times <strong>the</strong> daily<br />
passage rate <strong>of</strong> 100,000 fish (200,000 fish) in a given 24-hour period. A volume <strong>of</strong><br />
approximately 25,000 CF would <strong>the</strong>re<strong>for</strong>e be required, which could be accomplished with a<br />
holding area <strong>of</strong> approximately 0.25 acres with an average depth <strong>of</strong> 2 feet. Provisions <strong>for</strong> this<br />
holding area obligate substantial additional areas <strong>of</strong> land <strong>for</strong> construction, and behavioral<br />
response may delay upstream fish migration.<br />
3.2.3 Weir<br />
The TSCF weir would need <strong>to</strong> be sized <strong>to</strong> preclude upstream passage by <strong>the</strong> target<br />
exclusion species <strong>for</strong> all hydrologic scenarios. Little in<strong>for</strong>mation is available regarding <strong>the</strong><br />
leaping ability <strong>of</strong> nor<strong>the</strong>rn pike, which is <strong>the</strong> largest <strong>of</strong> <strong>the</strong> target exclusion species and<br />
<strong>the</strong>re<strong>for</strong>e used here as <strong>the</strong> basis <strong>for</strong> exclusion at leaping barriers. The relatively large body<br />
size <strong>of</strong> nor<strong>the</strong>rn pike and associated potential <strong>for</strong> relatively high burst swimming speeds was<br />
used here <strong>to</strong> set a hydraulic barrier height <strong>of</strong> approximately 10 feet <strong>to</strong> achieve <strong>to</strong>tal<br />
21 Strategic <strong>Plan</strong> <strong>for</strong> <strong>the</strong> <strong>Res<strong>to</strong>ration</strong> <strong>of</strong> <strong>Diadromous</strong> <strong>Fishes</strong> <strong>to</strong> <strong>the</strong> Penobscot River (Draft 2-26-08),<br />
prepared by Gail Wippelhauser and Melissa Laser, Maine Department <strong>of</strong> Marine Resources, and MikeSmith and Richard Dill,<br />
Maine Department <strong>of</strong> Inland Fisheries and Wildlife<br />
PRFP Page 274
exclusion. In<strong>for</strong>mation from published literature was not located <strong>to</strong> document this<br />
assumption.<br />
Based on <strong>the</strong> approximately 14-foot difference in elevation between <strong>the</strong> Penobscot River<br />
and <strong>the</strong> Howland Dam impoundment at normal flow conditions, a 10-foot high hydraulic<br />
barrier integrated in<strong>to</strong> <strong>the</strong> TSCF would reduce rise <strong>of</strong> <strong>the</strong> Proposed Bypass from 14 <strong>to</strong> 4 feet<br />
at normal flows. Changes <strong>to</strong> this head differential during periods <strong>of</strong> high flow would need <strong>to</strong><br />
be evaluated <strong>to</strong> determine whe<strong>the</strong>r increased backwater effects would adversely affect <strong>the</strong><br />
efficacy <strong>of</strong> <strong>the</strong> hydraulic barrier at <strong>the</strong> weir.<br />
The use <strong>of</strong> a weir in a TSCF located at <strong>the</strong> upstream end <strong>of</strong> <strong>the</strong> Proposed Bypass would<br />
require setting <strong>the</strong> invert <strong>of</strong> <strong>the</strong> Proposed Bypass at a substantially lower elevation<br />
downstream from <strong>the</strong> TSCF. This would substantially increase <strong>the</strong> footprint <strong>of</strong> <strong>the</strong> Proposed<br />
Bypass and required excavation, <strong>the</strong>reby increasing <strong>the</strong> overall project cost while reducing<br />
<strong>the</strong> area <strong>of</strong> adjacent land <strong>for</strong> o<strong>the</strong>r uses.<br />
3.2.4 Debris Management<br />
Debris management may also be easier at <strong>the</strong> upstream limit <strong>of</strong> <strong>the</strong> Proposed Bypass, as a<br />
single system could be used <strong>to</strong> manage all debris in <strong>the</strong> vicinity <strong>of</strong> <strong>the</strong> upstream end <strong>of</strong> <strong>the</strong><br />
channel. Regardless <strong>of</strong> <strong>the</strong> location <strong>of</strong> <strong>the</strong> TSCF, consideration should be given <strong>to</strong> excluding<br />
large debris from entering <strong>the</strong> upstream end <strong>of</strong> <strong>the</strong> Proposed Bypass so as <strong>to</strong> minimize <strong>the</strong><br />
need <strong>for</strong> debris management in <strong>the</strong> channel.<br />
A variety <strong>of</strong> approaches may be appropriate <strong>for</strong> debris management, including trash racks,<br />
debris booms, and/or piers in <strong>the</strong> adjacent reach <strong>of</strong> <strong>the</strong> Piscataquis River <strong>to</strong> deflect debris. A<br />
trash rack system with a 1-foot clear spacing located immediately upstream from <strong>the</strong><br />
hydraulic entrance <strong>to</strong> <strong>the</strong> Proposed Bypass would provide an effective means <strong>for</strong> debris<br />
management, but might require substantial maintenance. A debris boom or piers <strong>to</strong> deflect<br />
debris might be less effective than a dedicated trash rack system but would likely require<br />
less maintenance. Existing piers in <strong>the</strong> Piscataquis River could potentially be used <strong>for</strong> debris<br />
management.<br />
The evaluation <strong>of</strong> <strong>the</strong> suitability <strong>of</strong> piers <strong>for</strong> debris management would need <strong>to</strong> evaluate flow<br />
routing over <strong>the</strong> Howland Dam during periods <strong>of</strong> high flow when large debris (e.g., whole<br />
trees) are likely in <strong>the</strong> adjacent reach <strong>of</strong> <strong>the</strong> Piscataquis River.<br />
3.2.5 Design Alternatives<br />
The conceptual TSCF design considers both "series" and "parallel" TSCF systems. A series<br />
TSCF refers herein <strong>to</strong> a system with a single route <strong>for</strong> upstream passing fish. A parallel<br />
TSFC system refers herein <strong>to</strong> a system with multiple routes <strong>for</strong> upstream passing fish, and<br />
may include routes without trapping facilities. The use <strong>of</strong> definitions based on upstream fish<br />
passage routes follows from <strong>the</strong> primary objectives <strong>of</strong> <strong>the</strong> Proposed Bypass—upstream fish<br />
passage, <strong>the</strong> recognized need <strong>for</strong> hydraulic conveyance in <strong>the</strong> Proposed Bypass, and <strong>the</strong><br />
associated need <strong>for</strong> debris management.<br />
Both series and parallel TSCF systems would <strong>the</strong>re<strong>for</strong>e consist <strong>of</strong> a trapping system<br />
handling a fraction <strong>of</strong> <strong>the</strong> <strong>to</strong>tal flow in <strong>the</strong> Proposed Bypass. The balance <strong>of</strong> <strong>the</strong> flow would<br />
be routed around <strong>the</strong> trapping facility through <strong>the</strong> TSCF conveyance channel with means <strong>to</strong><br />
preclude upstream passage <strong>of</strong> all target species (series TSCF system) or allow upstream<br />
passage <strong>for</strong> a subset <strong>of</strong> target passage species (parallel TSCF system).<br />
PRFP Page 275
The TSCF conveyance channel barrier would necessarily consist <strong>of</strong> a hydraulic barrier. A<br />
screen system suitable <strong>for</strong> excluding juvenile target exclusion species across <strong>the</strong> Proposed<br />
Bypass would be subject <strong>to</strong> fouling by small debris, including aquatic vegetation and o<strong>the</strong>r<br />
detritus. A hydraulic barrier <strong>for</strong> full (series TSCF system) or partial exclusion (parallel TSCF<br />
system) <strong>of</strong> upstream fish passage is <strong>the</strong>re<strong>for</strong>e considered as <strong>the</strong> only practical means <strong>to</strong><br />
convey flow in<strong>to</strong> <strong>the</strong> TSCF conveyance channel. A hydraulic barrier might consist <strong>of</strong> a free<br />
overfall (e.g., dam) or a reach with sustained high-speed flow and/or shallow depth under all<br />
conditions. The design <strong>of</strong> a hydraulic barrier <strong>to</strong> all upstream passing fish would need <strong>to</strong><br />
evaluate <strong>the</strong> swimming ability <strong>of</strong> larger target species, including adult Atlantic salmon and<br />
nor<strong>the</strong>rn pike. Little in<strong>for</strong>mation is available on <strong>the</strong> swimming and leaping ability <strong>of</strong> nor<strong>the</strong>rn<br />
pike, however, and a conservative design would <strong>the</strong>re<strong>for</strong>e be necessary <strong>to</strong> exclude adult<br />
nor<strong>the</strong>rn pike from passing <strong>the</strong> hydraulic barrier. It is assumed that a hydraulic barrier would<br />
block all but Atlantic salmon, and that all o<strong>the</strong>r target passage species would have <strong>to</strong> pass<br />
through <strong>the</strong> TSCF system.<br />
3.2.6 Parallel System<br />
A parallel TSCF system would be designed <strong>to</strong> provide upstream passage <strong>of</strong> adult Atlantic<br />
salmon through <strong>the</strong> TSCF conveyance channel based on <strong>the</strong>ir ability <strong>to</strong> leap barriers. A<br />
conceptual rendering <strong>of</strong> <strong>the</strong> parallel system is shown in Figure 1. Conceptual pr<strong>of</strong>ile<br />
renderings <strong>of</strong> <strong>the</strong> trapping and sorting areas are shown in Figure 2.<br />
A potential benefit <strong>of</strong> a parallel system is decreased length <strong>of</strong> <strong>the</strong> primary conveyance reach<br />
<strong>of</strong> <strong>the</strong> Proposed Bypass and improved debris management. A partial barrier comprised <strong>of</strong> a<br />
hydraulic drop could reduce <strong>the</strong> overall length <strong>of</strong> <strong>the</strong> primary conveyance channel. For<br />
example, a four-foot high drop structure in a primary channel with an average slope <strong>of</strong> three<br />
percent would eliminate approximately 130 feet <strong>of</strong> primary channel. The smaller side<br />
channel through <strong>the</strong> TSCF trapping component could be set at <strong>the</strong> average channel slope,<br />
but would be smaller and <strong>the</strong>re<strong>for</strong>e result in lower construction costs. Potential<br />
improvements <strong>to</strong> debris management could result from <strong>the</strong> ability <strong>to</strong> route debris past <strong>the</strong><br />
TSCF trapping component without <strong>the</strong> need <strong>for</strong> trash racks and associated mechanical<br />
cleaning equipment across <strong>the</strong> primary conveyance channel.<br />
The design <strong>of</strong> a barrier intended <strong>to</strong> allow <strong>for</strong> upstream passage <strong>of</strong> Atlantic salmon would<br />
need <strong>to</strong> consider relevant fish passage criteria, including sufficient depth below <strong>the</strong> barrier.<br />
Location <strong>of</strong> <strong>the</strong> TSCF conveyance channel barrier along <strong>the</strong> upper reach <strong>of</strong> <strong>the</strong> bypass<br />
channel would likely be more practical <strong>for</strong> a parallel system relative <strong>to</strong> a series system given<br />
<strong>the</strong> substantially reduced leaping ability <strong>of</strong> <strong>the</strong> o<strong>the</strong>r fish species considered here.<br />
Partitioning <strong>of</strong> flows through a parallel system conveyance channel would need <strong>to</strong> consider<br />
seasonal, species-specific migration periods and costs associated with operation and<br />
maintenance <strong>of</strong> <strong>the</strong> trapping component. A potential benefit <strong>of</strong> <strong>the</strong> parallel system is that it<br />
would provide <strong>for</strong> upstream passage <strong>of</strong> Atlantic salmon during when <strong>to</strong>tal numbers <strong>of</strong><br />
upstream passing fish do not warrant full-time operation <strong>of</strong> <strong>the</strong> trapping component.<br />
A critical design component <strong>of</strong> a parallel system would be assuring that <strong>the</strong> partial barrier is<br />
functional during periods <strong>of</strong> high flow when backwater conditions could potentially reduce<br />
<strong>the</strong> effectiveness <strong>of</strong> <strong>the</strong> partial barrier.<br />
A disadvantage <strong>of</strong> <strong>the</strong> parallel system is that it would not provide a means <strong>to</strong> trap all Atlantic<br />
salmon passing upstream through <strong>the</strong> Proposed Bypass.<br />
3.2.7 Series System<br />
PRFP Page 276
A series TSCF system would route all upstream passing fish through a trapping system. A<br />
benefit <strong>of</strong> this system is that it would provide means <strong>to</strong> trap all upstream passing fish. A<br />
conceptual rendering <strong>of</strong> <strong>the</strong> series system is shown in Figure 3.<br />
Location <strong>of</strong> a series TSCF conveyance channel barrier along <strong>the</strong> upper reach <strong>of</strong> <strong>the</strong><br />
Proposed Bypass may be problematic due <strong>to</strong> <strong>the</strong> need <strong>to</strong> have a sufficient hydraulic drop <strong>to</strong><br />
preclude passage by Atlantic salmon, and would <strong>the</strong>re<strong>for</strong>e likely necessitate o<strong>the</strong>r measures<br />
<strong>to</strong> preclude passage, such as minimizing depths downstream from <strong>the</strong> barrier. Such<br />
measures would also need <strong>to</strong> consider minimizing potential impingement and/or impact<br />
hazards <strong>to</strong> downstream passing fish.<br />
3.2.8 Downstream Fish Passage<br />
The Proposed Bypass will provide downstream fish passage, and <strong>the</strong> design and operation<br />
<strong>of</strong> a TSCF must <strong>the</strong>re<strong>for</strong>e consider potential impacts <strong>to</strong> downstream fish passage.<br />
Downstream passage <strong>of</strong> all fishes can be grossly considered based on <strong>the</strong> fraction <strong>of</strong> <strong>the</strong><br />
flow through <strong>the</strong> Proposed Bypass relative <strong>to</strong> <strong>the</strong> <strong>to</strong>tal flow in <strong>the</strong> Piscataquis River. For<br />
example, if all flow is routed through <strong>the</strong> Proposed Bypass during periods <strong>of</strong> lower flow in<br />
<strong>the</strong> Piscataquis River, <strong>the</strong>n all downstream passing fish would necessarily pass through <strong>the</strong><br />
Proposed Bypass.<br />
Potential hazards <strong>to</strong> fish passing downstream through <strong>the</strong> Proposed Bypass include<br />
impingement on screening systems and impact after passing over <strong>the</strong> weir. Hazard<br />
mitigation can be accomplished through <strong>the</strong> use <strong>of</strong> appropriate design criteria (e.g.,<br />
minimum flow speeds adjacent <strong>to</strong> screening systems). The use <strong>of</strong> a weir and velocity barrier<br />
<strong>for</strong> <strong>the</strong> series system described above poses a potential hazard <strong>to</strong> downstream migrating<br />
fish, as shallow depths immediately downstream from a weir could result in an impact<br />
hazard. This could be minimized by routing flows through <strong>the</strong> gate adjacent <strong>to</strong> <strong>the</strong> weir<br />
during periods <strong>of</strong> low flow.<br />
3.3 Operations and Maintenance<br />
<strong>Operational</strong> requirements at <strong>the</strong> TSCF may depend on fac<strong>to</strong>rs including maximum holding<br />
times <strong>for</strong> trapped fish and/or delays at <strong>the</strong> TSCF and numbers <strong>of</strong> fish encountering <strong>the</strong><br />
system.<br />
Maximum holding times <strong>for</strong> fish encountering <strong>the</strong> TSCF may be established based on<br />
regula<strong>to</strong>ry requirements <strong>for</strong> minimizing disruptions <strong>to</strong> upstream migration and/or <strong>the</strong> holding<br />
capacity <strong>of</strong> <strong>the</strong> TSCF and <strong>the</strong> Proposed Bypass. The expressed intent <strong>to</strong> provide “safe,<br />
timely and effective passage <strong>of</strong> <strong>the</strong> target species” does not explicitly specify a maximum<br />
delay that might be imposed by <strong>the</strong> TSCF.<br />
Movement <strong>of</strong> fish through <strong>the</strong> TSCF is depicted in Figures 4 and 5 <strong>for</strong> <strong>the</strong> parallel and series<br />
systems, respectively. Maximum holding times based on regula<strong>to</strong>ry requirements may vary<br />
seasonally and address only <strong>the</strong> target passage species or also include resident fish, such<br />
as white sucker. It is anticipated that <strong>the</strong> number <strong>of</strong> target passage species fish will increase<br />
over time following implementation <strong>of</strong> res<strong>to</strong>ration projects in <strong>the</strong> Penobscot River watershed.<br />
An estimate <strong>of</strong> initial numbers <strong>of</strong> target passage species fish passing through <strong>the</strong> Proposed<br />
Bypass is presented here based upon potential alewife production in East Branch,<br />
Embeemee, and Upper Embeemee Lakes in <strong>the</strong> Piscataquis River. The production estimate<br />
<strong>for</strong> <strong>the</strong>se three lakes is approximately 530,000 fish. Based on a 60-day migration period and<br />
a maximum daily passage rate <strong>of</strong> two-times <strong>the</strong> average passage rate, approximately<br />
PRFP Page 277
17,000 alewife per day would require handling at <strong>the</strong> TSCF <strong>to</strong> minimize delays <strong>to</strong> upstream<br />
passing <strong>the</strong>se fish.<br />
Seasonal spawning migrations <strong>of</strong> white sucker would likely overlap with <strong>the</strong> alewife<br />
migration, <strong>the</strong>reby increasing <strong>the</strong> number <strong>of</strong> fish at <strong>the</strong> facility. While estimates <strong>of</strong> sucker<br />
numbers were not obtained <strong>for</strong> this study, <strong>the</strong> presence <strong>of</strong> multiple fish species complicate<br />
sorting operations.<br />
A preliminary analysis was per<strong>for</strong>med <strong>to</strong> evaluate staffing needs at <strong>the</strong> TSCF during peak <strong>of</strong><br />
an alewife run <strong>of</strong> 530,000 fish. Assuming 12 hours <strong>of</strong> sorting operations each day and a<br />
maximum daily passage rate <strong>of</strong> 17,000 fish, approximately 1,500 fish would need <strong>to</strong> be<br />
sorted each hour.<br />
Operation <strong>of</strong> a two-stage sorting would double <strong>the</strong> approximate number <strong>of</strong> fish <strong>to</strong> be<br />
handled. Given that <strong>the</strong> sorting work requires care <strong>to</strong> exclude target exclusion species, it is<br />
estimated that a staff <strong>of</strong> four would be required <strong>for</strong> this work. Based on a full labor rate <strong>of</strong><br />
$30 per hour, <strong>the</strong> estimated cost <strong>for</strong> 30 days <strong>of</strong> peak migration sorting would be<br />
approximately $43,200. The estimated cost <strong>for</strong> a staff <strong>of</strong> two during <strong>the</strong> balance <strong>of</strong> <strong>the</strong><br />
alewife migration is $21,600, resulting in a <strong>to</strong>tal estimated labor cost <strong>of</strong> $64,800 <strong>for</strong> <strong>the</strong> 60day<br />
alewife migration period. The cost <strong>of</strong> sorting <strong>for</strong> <strong>the</strong> projected alewife production in <strong>the</strong><br />
Piscataquis River watershed (approximately 5,500,000 fish) at full productivity would likely<br />
be higher. Staffing <strong>of</strong> <strong>the</strong> TSCF would likely be required over <strong>the</strong> balance <strong>of</strong> <strong>the</strong> target<br />
passage species migration period, which extends <strong>to</strong> mid-April through mid-November <strong>for</strong><br />
Atlantic salmon.<br />
Assuming that a staff <strong>of</strong> one person could tend <strong>the</strong> trap <strong>for</strong> four hours each day from mid-<br />
April <strong>to</strong> <strong>the</strong> end <strong>of</strong> April and from July through mid-November, <strong>for</strong> a <strong>to</strong>tal <strong>of</strong> approximately<br />
150 days, <strong>the</strong> cost <strong>of</strong> this staffing would be approximately $18,000.<br />
The estimated operations costs presented here are <strong>for</strong> preliminary planning only, and would<br />
require revision based on <strong>the</strong> efficiency <strong>of</strong> sorting operations. These estimated costs do not<br />
include direct costs, such as transportation costs and maintenance <strong>of</strong> <strong>the</strong> TSCF.<br />
3.4 Eel Passage<br />
Dedicated passage facilities <strong>for</strong> American eel may be required <strong>for</strong> both <strong>the</strong> series and<br />
parallel systems due <strong>to</strong> <strong>the</strong> small size <strong>of</strong> upstream passing elver and <strong>to</strong> accommodate<br />
upstream movement <strong>of</strong> yellow-phase eels outside <strong>of</strong> typical migration windows. A variety <strong>of</strong><br />
eel-specific passage systems that would not be suitable <strong>for</strong> upstream passage by <strong>the</strong> target<br />
exclusion species may be appropriate at this site.<br />
4 DISCUSSION AND CONCLUSIONS<br />
This evaluation presents in<strong>for</strong>mation relevant <strong>to</strong> a TSCF on <strong>the</strong> Proposed Bypass adjacent<br />
<strong>to</strong> Howland Dam. The results <strong>of</strong> this evaluation suggest that <strong>to</strong>tal exclusion <strong>of</strong> <strong>the</strong> target<br />
exclusion species while allowing upstream passage <strong>of</strong> <strong>the</strong> target passage species cannot be<br />
achieved through <strong>the</strong> design <strong>of</strong> <strong>the</strong> Proposed Bypass, and that a dedicated TSCF would be<br />
required <strong>to</strong> trap, sort, and exclude <strong>the</strong> target exclusion species.<br />
Two schemes, series and parallel systems, are presented as general design configurations.<br />
General details are presented herein, but would need <strong>to</strong> be refined <strong>for</strong> <strong>the</strong> development <strong>of</strong> a<br />
final design. In addition <strong>to</strong> requiring a conservative design, successful operation <strong>of</strong> <strong>the</strong> TSCF<br />
PRFP Page 278
(i.e., <strong>to</strong>tal exclusion <strong>of</strong> <strong>the</strong> target exclusion species) would require thorough and ongoing<br />
oversight <strong>of</strong> facility operations. Based on <strong>the</strong> in<strong>for</strong>mation and analyses presented herein, it is<br />
apparently unrealistic <strong>to</strong> expect a TSCF <strong>to</strong> provide <strong>to</strong>tal exclusion <strong>of</strong> <strong>the</strong> target exclusion<br />
species over a period <strong>of</strong> years.<br />
While apparently successful ef<strong>for</strong>ts have been made <strong>to</strong> modify <strong>the</strong> existing fishpass facilities<br />
at Howland Dam and at <strong>the</strong> West Enfield Dam <strong>to</strong> exclude upstream passage <strong>of</strong> nor<strong>the</strong>rn<br />
pike, it is unders<strong>to</strong>od that <strong>the</strong>se modifications prevent upstream passage <strong>of</strong> target passage<br />
species such as alewife and American shad. Such exclusionary measures are apparently<br />
not consistent with <strong>the</strong> overall res<strong>to</strong>ration goals <strong>for</strong> <strong>the</strong> Penobscot River watershed. In<br />
addition, <strong>the</strong> efficacy <strong>of</strong> a TSCF <strong>for</strong> exclusion would be difficult <strong>to</strong> evaluate due <strong>to</strong> <strong>the</strong><br />
potential <strong>for</strong> illegal, anthropogenic introduction <strong>of</strong> target exclusion species upstream from<br />
Howland Dam.<br />
Based on in<strong>for</strong>mation and analyses per<strong>for</strong>med <strong>for</strong> this study, incorporating a TSCF in<strong>to</strong> <strong>the</strong><br />
Proposed Bypass would have substantial impacts on <strong>the</strong> project objective <strong>of</strong> safe, timely<br />
and effective fish passage at Howland Dam. Additionally, a TSCF would apparently negate<br />
any benefits associated with <strong>the</strong> use <strong>of</strong> a nature-like fishway as <strong>the</strong> model <strong>for</strong> <strong>the</strong> Proposed<br />
Bypass due <strong>the</strong> need <strong>to</strong> trap and sort and o<strong>the</strong>rwise hinder <strong>the</strong> free movement <strong>of</strong> migrating<br />
fishes at Howland Dam.<br />
5 SUMMARY<br />
The initial concept <strong>of</strong> a bypass channel on <strong>the</strong> Piscataquis River at Howland Dam was<br />
based upon successful European installations that provide simple, high capacity, and<br />
relatively low maintenance upstream fish passage. These European bypass channels are<br />
intentionally used <strong>to</strong> allow upstream and downstream passage <strong>of</strong> all species and all life<br />
stages. Inquiries have been made concerning potential means <strong>to</strong> exclude upstream passage<br />
<strong>of</strong> target exclusion species (i.e., nor<strong>the</strong>rn pike and black crappy) through <strong>the</strong> Proposed<br />
Bypass and in<strong>to</strong> <strong>the</strong> Piscataquis River watershed while providing safe, timely, and effective<br />
upstream and downstream passage <strong>of</strong> native diadromous fishes.<br />
The project team has evaluated several conceptual methods <strong>to</strong> prevent upstream passage<br />
<strong>of</strong> <strong>the</strong> target exclusion species, and determined that a conventional basket or chamber trap<br />
combined with manual sorting operations is <strong>the</strong> preferred procedure <strong>to</strong> attempt <strong>to</strong> achieve<br />
<strong>the</strong> objective <strong>of</strong> <strong>to</strong>tal exclusion. The following comments are noted <strong>for</strong> consideration <strong>of</strong><br />
whe<strong>the</strong>r <strong>to</strong> use a trap and sort facility:<br />
a) There is no certainty that a trap and sort facility would be 100 percent effective. A<br />
successful combination <strong>of</strong> dam removal on <strong>the</strong> main stem <strong>of</strong> <strong>the</strong> Penobscot River and<br />
bypass channel at Howland dam could result in <strong>the</strong> res<strong>to</strong>ration <strong>of</strong> millions <strong>of</strong> diadromous fish<br />
<strong>to</strong> <strong>the</strong> Piscataquis River watershed.<br />
b) A TSCF does not protect against intentional placement <strong>of</strong> non-native fish in <strong>the</strong> basin.<br />
c) A trap and sort facility would require significant operational and maintenance costs.<br />
d) A trap and sort facility would likely interfere with all upstream fish passage.<br />
Appendix A: Figures<br />
Figure 1 Conceptual Parallel TSCF System <strong>Plan</strong><br />
Figure 2 Conceptual TSCF System Pr<strong>of</strong>iles<br />
Figure 3 Conceptual Series TSCF System <strong>Plan</strong><br />
Figure 4 Conceptual Fish Handling in Parallel TSCF System<br />
Figure 5 Conceptual Fish Handling in Series TSCF System<br />
PRFP Page 279
PRFP Page 280
PRFP Page 281
PRFP Page 282
PRFP Page 283
PRFP Page 284
Appendix B<br />
Outline <strong>for</strong> Preliminary Design <strong>of</strong> Proposed Howland Fish Bypass<br />
Final Draft July 12, 2007<br />
This outline will be used as <strong>the</strong> basis <strong>for</strong> a request <strong>for</strong> proposals <strong>for</strong> preliminary design <strong>of</strong> <strong>the</strong><br />
Howland Fish Bypass. The RFP will contain introduc<strong>to</strong>ry in<strong>for</strong>mation from Sec. XI in <strong>the</strong><br />
Settlement Agreement, which calls <strong>for</strong> a fish bypass system at Howland, provided it can be<br />
shown <strong>to</strong> achieve safe, timely and effective upstream and downstream passage <strong>of</strong> target<br />
species throughout <strong>the</strong>ir migra<strong>to</strong>ry periods and a range <strong>of</strong> flows including low flow periods.<br />
As described in <strong>the</strong> Settlement Agreement, use <strong>of</strong> an effective bypass system will allow <strong>for</strong><br />
<strong>the</strong> existing Howland dam structure and impoundment <strong>to</strong> be substantially or entirely<br />
maintained.<br />
The RFP will also provide requisite design parameters that <strong>the</strong> resource agencies and/or<br />
PIN have identified <strong>to</strong> be necessary based on <strong>the</strong> Milone and MacBroom (MMI) report,<br />
Feasibility & Preliminary Environmental Assessment, Howland Dam, Howland, Maine, prior<br />
relicensing consultations on Howland, and o<strong>the</strong>r conditions associated with <strong>the</strong> site or needs<br />
<strong>of</strong> <strong>the</strong> target species.<br />
The preliminary design (along with <strong>the</strong> MMI report and o<strong>the</strong>r materials) will be part <strong>of</strong> <strong>the</strong><br />
administrative record referenced in <strong>the</strong> Settlement Agreement, and will be used by <strong>the</strong><br />
agencies and PIN as a basis <strong>for</strong> <strong>the</strong>ir commitment <strong>of</strong> support <strong>for</strong> <strong>the</strong> bypass prior <strong>to</strong> <strong>the</strong> time<br />
<strong>the</strong> Trust files its application <strong>for</strong> surrender <strong>of</strong> <strong>the</strong> license <strong>for</strong> <strong>the</strong> Howland hydro project. The<br />
Trust views <strong>the</strong> preliminary design as a critical planning step, which will be followed by<br />
continuing consultation and more detailed engineering work. Resource agencies and PIN<br />
will have an opportunity <strong>to</strong> review and comment on <strong>the</strong> results <strong>of</strong> <strong>the</strong> preliminary design<br />
study, and will be fur<strong>the</strong>r consulted by <strong>the</strong> Trust on issues related <strong>to</strong> <strong>the</strong> bypass after <strong>the</strong><br />
surrender application has been filed.<br />
The preliminary design will provide narrative in<strong>for</strong>mation and engineering drawings, as is<br />
typically done when developing plans <strong>for</strong> conventional fish passage facilities during FERC<br />
licensing. The RFP <strong>for</strong> preliminary design will also request initial ma<strong>the</strong>matical modeling<br />
(e.g., Computational Fluid Dynamics or CFD as recommended by Ben Rizzo <strong>of</strong> FWS) <strong>to</strong><br />
describe future hydraulic conditions and predict fish movements in <strong>the</strong> area below <strong>the</strong><br />
existing dam and powerhouse and within <strong>the</strong> bypass itself during <strong>the</strong> upstream and<br />
downstream migration period (as specified by <strong>the</strong> resource agencies – see <strong>for</strong> example,<br />
USFWS Sec. 18 Fishway Prescription <strong>for</strong> lower Penobscot River Hydro Projects, 1997). The<br />
modeling will take in<strong>to</strong> account differential flow levels in <strong>the</strong> Penobscot and Piscataquis<br />
rivers, including those events when <strong>the</strong> high water levels in <strong>the</strong> Penobscot drown out <strong>the</strong><br />
entrance <strong>to</strong> <strong>the</strong> bypass. Subsequent planning <strong>for</strong> <strong>the</strong> bypass (not covered in this RFP) will<br />
also include use <strong>of</strong> a physical model <strong>to</strong> better determine flow conditions and fine tune final<br />
construction plans <strong>to</strong> ensure safe, timely and effective passage <strong>of</strong> <strong>the</strong> target species. State<br />
and federal resource agencies and PIN will be consulted on specific requirements <strong>for</strong> both<br />
ma<strong>the</strong>matical and physical models.<br />
The preliminary design will also evaluate <strong>the</strong> feasibility and costs (including operating costs)<br />
<strong>of</strong> incorporating provisions <strong>for</strong> trapping/sorting/counting <strong>of</strong> fish using <strong>the</strong> bypass. This<br />
includes measures <strong>to</strong> exclude upstream migration <strong>of</strong> nor<strong>the</strong>rn pike and black crappie, both<br />
<strong>of</strong> which do not now exist above <strong>the</strong> Howland Dam, and are considered by Maine<br />
Department <strong>of</strong> Inland Fisheries and Wildlife <strong>to</strong> be undesirable, non-native invasive species.<br />
PRFP Page 285
Under <strong>the</strong> terms <strong>of</strong> <strong>the</strong> Settlement Agreement, <strong>the</strong> resource agencies are responsible <strong>for</strong><br />
management activities such as trapping/sorting/trucking.<br />
As a separate ef<strong>for</strong>t, <strong>the</strong> Trust will use in<strong>for</strong>mation from <strong>the</strong> preliminary design in developing<br />
its plans <strong>for</strong> long-term operation <strong>of</strong> <strong>the</strong> Howland fish bypass, including studies <strong>to</strong> evaluate<br />
<strong>the</strong> effectiveness <strong>of</strong> <strong>the</strong> system as described in <strong>the</strong> Settlement Agreement. The Trust will<br />
consult with <strong>the</strong> Town <strong>of</strong> Howland, resource agencies and PIN <strong>to</strong> reach agreement on<br />
responsibilities <strong>for</strong> day-<strong>to</strong>-day operation and maintenance <strong>of</strong> <strong>the</strong> bypass, including gates and<br />
control structures. (The state will need an agreement <strong>to</strong> ensure access <strong>to</strong> <strong>the</strong> bypass <strong>for</strong><br />
carrying out routine fishery management activities, unless <strong>the</strong> state ultimately becomes<br />
owner <strong>of</strong> <strong>the</strong> facility.) The Trust will also consult with <strong>the</strong> Town <strong>of</strong> Howland, resource<br />
agencies and PIN <strong>to</strong> develop an annual schedule <strong>for</strong> operating <strong>the</strong> bypass. In<strong>for</strong>mation on<br />
annual and daily operations, responsible parties and contacts, and similar matters would be<br />
contained in a Standard Operating Procedure <strong>for</strong> <strong>the</strong> bypass that meets <strong>the</strong> approval <strong>of</strong> <strong>the</strong><br />
resource agencies and PIN.<br />
The Trust will also consult with <strong>the</strong> Town and o<strong>the</strong>rs <strong>to</strong> clarify roles and responsibilities in<br />
maintaining <strong>the</strong> Howland dam and lands surrounding <strong>the</strong> bypass. The Trust will involve <strong>the</strong><br />
resource agencies and PIN in any discussions concerning recreational use <strong>of</strong> <strong>the</strong> bypass<br />
(e.g., fishing and boating) and abutting lands <strong>to</strong> ensure consistency with overall goals <strong>for</strong><br />
fish res<strong>to</strong>ration and management. The Trust plans <strong>to</strong> include <strong>the</strong> details on operation and<br />
maintenance <strong>of</strong> <strong>the</strong> bypass, dam and surrounding lands, including agreements with <strong>the</strong><br />
Town and resource agencies/PIN in its license surrender filings with FERC and <strong>the</strong> state.<br />
Target Species<br />
Based on current agency/Tribal plans and overall goals <strong>of</strong> <strong>the</strong> Penobscot River <strong>Res<strong>to</strong>ration</strong><br />
Project, <strong>the</strong> Howland bypass should be designed <strong>to</strong> provide safe, timely and effective<br />
upstream and downstream passage <strong>for</strong>:<br />
Species upstream/downstream (lifestage)<br />
Atlantic salmon upstream (adult), downstream (adult, juv.)<br />
American shad upstream (adult), downstream (adult, juv.)<br />
Alewife upstream (adult), downstream (adult, juv.)<br />
Blueback herring upstream (adult), downstream (adult, juv.)<br />
American eel upstream (juv.), downstream (adult)<br />
Sea lamprey upstream (adult), downstream (juv.)<br />
Additional Design Criteria<br />
1. Slope: Based on <strong>the</strong> findings in <strong>the</strong> Milone and MacBroom report, <strong>the</strong> bypass slope<br />
should not exceed 3 % (<strong>the</strong>y also modeled conditions with a 2.0 and 2.5 % slope).<br />
However, species-specific fish passage criteria (e.g., those contained in <strong>the</strong> Maine DOT’s<br />
Fish Passage Policy and Design Guide, 2nd ed., 2004) would be <strong>the</strong> basis <strong>for</strong> <strong>the</strong> actual<br />
design slope and placement <strong>of</strong> boulders and/or structures in <strong>the</strong> bypass.<br />
2. Operating Flows: The bypass should be designed <strong>to</strong> operate effectively whenever <strong>the</strong><br />
flow in <strong>the</strong> Piscataquis River is at or below 9,000 cfs at Howland. This range <strong>of</strong> operable<br />
flows is consistent with what had been prescribed <strong>for</strong> fish passage during relicensing<br />
proceedings at Howland, and is proportionally equivalent <strong>to</strong> <strong>the</strong> 40,000 cfs that is being used<br />
<strong>for</strong> <strong>the</strong> design <strong>of</strong> <strong>the</strong> new fish lift at Mil<strong>for</strong>d on <strong>the</strong> Penobscot. (As an indication <strong>of</strong> distribution<br />
<strong>of</strong> flows between <strong>the</strong> river and bypass channel, <strong>the</strong> MMI report calculates that <strong>the</strong> bypass<br />
PRFP Page 286
channel would carry almost 1000 cfs when <strong>the</strong> river flows are approximately 8000 cfs. At<br />
summer low flow, almost all <strong>of</strong> <strong>the</strong> river discharge would go in<strong>to</strong> <strong>the</strong> bypass.)<br />
3. Low flow channel – Relative <strong>to</strong> 2 above, passage during critically low flows will need <strong>to</strong> be<br />
addressed with a low flow channel.<br />
4. Water control structure – It is anticipated that <strong>the</strong> nature-like fish bypass will include a<br />
water management structure <strong>to</strong> maintain flows throughout <strong>the</strong> migra<strong>to</strong>ry run period.<br />
Outline <strong>of</strong> in<strong>for</strong>mation <strong>to</strong> be requested in <strong>the</strong> RFP<br />
Narrative:<br />
Description <strong>of</strong> bypass fish channels that have been designed and/or constructed elsewhere<br />
in <strong>the</strong> world: brief discussion <strong>of</strong> concepts <strong>of</strong> fish bypasses; examples from elsewhere<br />
Description <strong>of</strong> Howland site: location - relationship <strong>to</strong> existing infrastructure (dam,<br />
powerhouse, roads & bridges, etc.); current/<strong>for</strong>mer ownership and uses <strong>of</strong> land, including<br />
any restrictions contained in deeds or regula<strong>to</strong>ry orders; soil borings along channel (likely<br />
materials <strong>to</strong> be excavated, contamination); <strong>to</strong>pography using one-foot con<strong>to</strong>urs<br />
Hydrology and hydraulic considerations: (reference previous HEC-RAS modeling by Milone<br />
and MacBroom) (supplement with tables <strong>to</strong> show data) river flows during passage season;<br />
high and low flow issues; range <strong>of</strong> operating flows (up <strong>to</strong> 9,000 cfs); relationship between<br />
bypass and river flows; range <strong>of</strong> water depths/widths/velocities in bypass during low, mean,<br />
and high flow events, including conditions when high flows in <strong>the</strong> Penobscot drown out <strong>the</strong><br />
entrance <strong>to</strong> <strong>the</strong> bypass channel; relate hydraulic conditions <strong>to</strong> swimming abilities (design<br />
criteria) <strong>of</strong> target species; flooding and ice jams; results <strong>of</strong> additional modeling (computer<br />
derived), including analysis <strong>of</strong> flow field and velocity vec<strong>to</strong>rs below spillway near bypass<br />
entrance; need <strong>for</strong> control gate in upper end <strong>of</strong> bypass; assess <strong>the</strong> need <strong>for</strong>, and potential<br />
methods <strong>to</strong> enhance attraction flow under high flow conditions using powerhouse, flood<br />
gates, or o<strong>the</strong>r existing structures; future impoundment levels, head pond and tailwater<br />
elevations; hydraulic conditions at spillway and immediately below dam during downstream<br />
migration periods (<strong>to</strong> in<strong>for</strong>m on whe<strong>the</strong>r downstream migrating fish will travel over <strong>the</strong> dam<br />
without injury or mortality, or if additional structures or modifications may be needed <strong>for</strong><br />
downstream passage at <strong>the</strong> dam).<br />
Bypass design: layout (length, slope – not <strong>to</strong> exceed 3 % , width, depth, low flow channel,<br />
rock weirs/chevrons/resting pools, rip-rap side slopes, entrance and exit relative <strong>to</strong> existing<br />
spillway, gates and attraction flows); use <strong>of</strong> surrounding land; public safety issues<br />
Construction: construction equipment access and road grading; removal <strong>of</strong> existing turbines,<br />
flashboards, etc.; use <strong>of</strong> powerhouse and adjacent gates <strong>for</strong> attraction flow purposes;<br />
bypass materials and construction methods (ear<strong>the</strong>n cuts and fills, boulders <strong>for</strong> weirs and<br />
rip-rap); need <strong>for</strong> modifying ledge material below bypass entrance <strong>to</strong> enhance fish<br />
movement; erosion/sedimentation controls; disposal <strong>of</strong> excavated materials; removal <strong>of</strong><br />
temporary access and revegetation <strong>of</strong> banks areas; schedule (start, finish, work during<br />
winter, expected miles<strong>to</strong>nes); mitigation <strong>for</strong> affected infrastructure (existing s<strong>to</strong>rm drains,<br />
boat ramp, etc.); duration <strong>of</strong> construction; costs<br />
Also in<strong>for</strong>mation (including itemized cost estimates) <strong>for</strong>:<br />
- mobilization and demobilization<br />
- installation and removal or res<strong>to</strong>ration <strong>of</strong> construction access roads<br />
PRFP Page 287
- methods and location <strong>for</strong> diversion <strong>of</strong> water<br />
- erosion and sedimentation control<br />
- excavation, removal and disposal, at an approved <strong>of</strong>f-site location, <strong>of</strong> excavated materials<br />
- extension <strong>of</strong> s<strong>to</strong>rm drainage facilities<br />
- removal <strong>of</strong> submerged upstream c<strong>of</strong>ferdam materials left from previous projects<br />
- removal <strong>of</strong> piers and o<strong>the</strong>r submerged remains <strong>of</strong> previous developments<br />
- mitigative measures that may are found necessary upon inspection <strong>of</strong> <strong>the</strong> lowered<br />
reservoir area<br />
- water control structure<br />
- final design planning<br />
- construction management<br />
- permitting<br />
- contingencies<br />
Operation & maintenance: anticipated schedule and costs <strong>of</strong> routine operations and<br />
maintenance <strong>of</strong> <strong>the</strong> bypass channel, control structure and o<strong>the</strong>r design features<br />
Preliminary engineering design drawings:<br />
The preliminary design drawings will include <strong>the</strong> existing conditions plans (preferably 50scale<br />
plans or smaller scale), plan view sheets (with centerline and station numbers) <strong>of</strong><br />
channel and cross vane structures, channel pr<strong>of</strong>ile (tied in<strong>to</strong> station numbers), cross<br />
sections <strong>of</strong> <strong>the</strong> channel (at <strong>the</strong> cross vane locations and some areas between cross vanes)<br />
and over<strong>to</strong>p floodplain, and details <strong>of</strong> <strong>the</strong> water control structure, s<strong>to</strong>ne sizes and<br />
composition, and sequence <strong>of</strong> construction notes. The channel design should take in<strong>to</strong><br />
account not only low flow conditions, but how weaker-swimming fishes (e.g., juvenile eels)<br />
may be accommodated in <strong>the</strong> design (e.g., near shore rock or log structures) during at least<br />
normal flows. Any needs <strong>for</strong> floodplain and channel bank (re)vegetation should be included<br />
as part <strong>of</strong> a planting plan in <strong>the</strong> preliminary plan set. Lastly, <strong>the</strong> consultant should be<br />
encouraged <strong>to</strong> include any public safety measures in <strong>the</strong> plans, as needed.<br />
The consultant will be expected <strong>to</strong> provide all in<strong>for</strong>mation <strong>to</strong> develop and complete <strong>the</strong><br />
preliminary design plans. The plans will likely consist <strong>of</strong> six or more sheets (plans should be<br />
annotated with symbol legend and key design parameters – including operating flows, water<br />
surface elevations, and velocities):<br />
1. Existing conditions plan depicting <strong>to</strong>pography and bathymetry <strong>of</strong> <strong>the</strong> project site area, as<br />
well as head pond and tailwater surface elevations, flagged wetland boundaries, existing<br />
infrastructure, soil boring locations, and o<strong>the</strong>r natural or man-made features potentially<br />
affecting or affected by project design.<br />
2. Scaled plan view <strong>of</strong> <strong>the</strong> preferred design alternative, depicting dimensions, expected<br />
channel geometry/sinuosity, channel grade slope and bank slopes, rock material, instream<br />
grade control structures, water control structure, and o<strong>the</strong>r important features.<br />
3. Pr<strong>of</strong>ile and cross-section views <strong>of</strong> bypass channel and structures, including low flow<br />
channel, overbank floodplain grades, and expected water levels in bypass during low,<br />
normal and high operating flows and flood flows. The cross sections <strong>of</strong> cross weir structures<br />
will also be provided.<br />
Details <strong>of</strong> temporary water diversion and/or water control, channel and rock materials (sizes<br />
and composition), water control structure, entranceway (in relation <strong>to</strong> existing dam and<br />
PRFP Page 288
powerhouse), rock weir/chevron/resting pools, channel banks, and sequence <strong>of</strong><br />
construction.<br />
Appendix C<br />
Simplified spatial and temporal overlap <strong>of</strong> diadromous fishes in <strong>the</strong> Penobscot River<br />
ecosystem, where arrows represent peak activity periods.<br />
In many cases, movement patterns may be quite complex: <strong>for</strong> example, adult<br />
salmon may enter <strong>the</strong> river as early as April with a peak in June, dwindling <strong>of</strong>f at <strong>the</strong><br />
end <strong>of</strong> June and <strong>the</strong>n ano<strong>the</strong>r group <strong>of</strong> adults may move in beginning in August with<br />
a peak in September. Shown are rainbow smelt (Osmerus mordax), American eel<br />
(Anguilla rostrata), alewife (Alosa pseudoharengus), sea lamprey (Petromyzon<br />
marinus), blueback herring (Alosa aestivalis), American shad (Alosa sapidissima),<br />
and Atlantic salmon (Salmo salar). Not shown are shortnose sturgeon (Acipenser<br />
brevirostrum), Atlantic sturgeon (Acipenser oxyrinchus oxyrinchus), brook trout<br />
(Salvelinus fontinalis), Atlantic <strong>to</strong>mcod (Microgadus <strong>to</strong>mcod), and striped bass<br />
(Morone saxatilis), which would have spawned in <strong>the</strong> lower Penobscot River, below<br />
<strong>the</strong> first set <strong>of</strong> falls in Mil<strong>for</strong>d, Maine. YOY = young-<strong>of</strong>-year. Figure modified from<br />
Saunders et al. (2006) and in<strong>for</strong>mation in Collette and Klein-MacPhee (2002).<br />
(In<strong>for</strong>mation copied from page 63 <strong>of</strong> <strong>the</strong> Strategic <strong>Plan</strong> <strong>for</strong> <strong>the</strong> <strong>Res<strong>to</strong>ration</strong> <strong>of</strong><br />
<strong>Diadromous</strong> <strong>Fishes</strong> <strong>to</strong> <strong>the</strong> Penobscot River prepared by Maine Department <strong>of</strong><br />
Marine Resources and <strong>the</strong> Maine Department <strong>of</strong> Inland Fisheries and Wildlife [March<br />
2008])<br />
PRFP Page 289
Appendix B: A handout summarizing Stantec’s evaluation<br />
PRFP Page 290
PRFP Page 291
PRFP Page 293
PRFP Page 294
Appendix C: The pattern <strong>of</strong> introduction and dispersal in lakes from <strong>the</strong><br />
discovery record graphically illustrated in a map time series<br />
PRFP Page 295
PRFP Page 296
Appendix D: Invasive species response and <strong>the</strong> Eastern Brook Trout joint<br />
Venture (EBTJV)<br />
The Eastern Brook Trout Joint Venture: Fish Habitat Partnership (EBTJV) is a<br />
National Fish Habitat Action <strong>Plan</strong> partnership <strong>of</strong> state and federal agencies,<br />
nongovernmental organizations, and academic institutions. The EBTJV conducted a<br />
comprehensive assessment <strong>of</strong> <strong>the</strong> status <strong>of</strong> and threats <strong>to</strong> brook trout populations<br />
throughout <strong>the</strong>ir entire eastern United States range (Maine <strong>to</strong> Georgia) in 2005<br />
(Hudy et al. 2005). It revealed wild brook trout populations in <strong>the</strong> eastern United<br />
States are impaired. Intact stream populations <strong>of</strong> brook trout populations exist in only<br />
5% <strong>of</strong> <strong>the</strong> watersheds assessed. Wild stream populations <strong>of</strong> brook trout have<br />
vanished or are greatly reduced in nearly half <strong>of</strong> <strong>the</strong> watersheds. The vast majority <strong>of</strong><br />
his<strong>to</strong>rically occupied large rivers no longer support self-reproducing populations <strong>of</strong><br />
brook trout.<br />
Across <strong>the</strong> entire eastern brook trout range, <strong>the</strong> <strong>to</strong>p five perturbations <strong>for</strong> streamdwelling<br />
brook trout populations were high water temperature, agriculture, riparian<br />
condition, non-native fish species, and urbanization. Non-native fish species were<br />
considered <strong>the</strong> greatest threats <strong>to</strong> lake populations. Findings from <strong>the</strong> range-wide<br />
status and threats assessment were used <strong>to</strong> develop a unified vision, as well as<br />
goals, key priorities, and strategies <strong>for</strong> <strong>the</strong> Joint Venture.<br />
The EBTJV’s Conservation Strategy (EBTJV 2008) is a goal-oriented, sciencebased,<br />
action plan that explicitly states Joint Venture partner goals, presents<br />
guidance <strong>for</strong> decision-making, and provides methods <strong>for</strong> evaluating success. The<br />
fundamental framework <strong>of</strong> <strong>the</strong> Conservation Strategy is comprised <strong>of</strong> three distinct<br />
components: (1) vision; (2) principal goals and (3) key priorities. Because <strong>of</strong> <strong>the</strong><br />
large geographic distribution <strong>of</strong> brook trout in <strong>the</strong> eastern United States, <strong>the</strong> EBTJV<br />
conservation strategy is organized in<strong>to</strong> three primary levels <strong>of</strong> distinction: rangewide,<br />
regional, and state-level.<br />
The range-wide vision <strong>of</strong> <strong>the</strong> EBTJV is <strong>to</strong> ensure “healthy, fishable brook trout<br />
populations throughout <strong>the</strong>ir his<strong>to</strong>ric eastern United States range.” Key priorities<br />
serve as <strong>the</strong> framework <strong>for</strong> <strong>the</strong> development <strong>of</strong> state-level brook trout conservation<br />
action plans. The following key priorities were established <strong>to</strong> meet <strong>the</strong> principal<br />
goals <strong>of</strong> <strong>the</strong> EBTJV:<br />
1. Protect brook trout populations across <strong>the</strong> eastern United States.<br />
2. Res<strong>to</strong>re brook trout populations where original habitat conditions exist and<br />
where habitats can be res<strong>to</strong>red.<br />
3. Moni<strong>to</strong>r and evaluate brook trout population responses <strong>to</strong> habitat<br />
protection, enhancement and res<strong>to</strong>ration projects.<br />
4. Complete brook trout distribution and quantitative status assessments.<br />
5. Increase recreational fishing opportunities <strong>for</strong> wild brook trout.<br />
The state level is where <strong>the</strong> vast amount <strong>of</strong> brook trout conservation ef<strong>for</strong>ts occur.<br />
The EBTJV believes that ef<strong>for</strong>ts <strong>to</strong> improve <strong>the</strong> status <strong>of</strong> brook trout should begin by<br />
protecting “<strong>the</strong> best <strong>of</strong> <strong>the</strong> best” habitat that supports existing healthy, stable<br />
PRFP Page 297
populations. Although each member state developed a unique plan, common goals,<br />
objectives, and strategies were evident. With respect <strong>to</strong> invasive species concerns,<br />
commonalities among state plans <strong>for</strong> <strong>the</strong> EBTJV Conservation Strategy is summed<br />
by:<br />
• Prevent <strong>the</strong> spread <strong>of</strong> invasive species in<strong>to</strong> brook trout habitat.<br />
a. Develop EBTJV-produced educational pamphlets that highlight<br />
state-level, regional, and range-wide threats from invasive species.<br />
Update annually.<br />
b. Develop lists <strong>of</strong> invasives with state or federal agencies responsible<br />
<strong>for</strong> permitting aquaculture opera<strong>to</strong>rs or distribu<strong>to</strong>rs.<br />
c. Eradicate invasive species from brook trout habitat where feasible.<br />
(EBTJV 2008)<br />
Maine’s <strong>Plan</strong> <strong>for</strong> <strong>the</strong> EBTJV<br />
The Joint Venture is comprised <strong>of</strong> 17 states within <strong>the</strong> his<strong>to</strong>rical range <strong>of</strong> brook trout<br />
in <strong>the</strong> eastern United States. Each state was asked <strong>to</strong> produce a state-level brook<br />
trout conservation plan consistent with <strong>the</strong> vision <strong>of</strong> <strong>the</strong> EBTJV framed around <strong>the</strong><br />
five key priorities. Maine’s <strong>Plan</strong> was drafted in 2006 and accepted by <strong>the</strong> EBTJV<br />
Conservation Strategy/Habitat Subcommittee that same year.<br />
Maine’s wild brook trout populations are concentrated in <strong>the</strong> interior highlands <strong>of</strong> <strong>the</strong><br />
state, such as <strong>the</strong> Piscataquis River drainage. In 2005, <strong>the</strong> EBTJV status<br />
assessment found that Maine possessed almost 150 subwatersheds containing<br />
intact stream-dwelling brook trout populations. Survey ef<strong>for</strong>ts since <strong>the</strong>n have<br />
documented approximately 200 additional subwatersheds with intact stream dwelling<br />
brook trout populations and 55% (18/33) <strong>of</strong> <strong>the</strong> Piscataquis River’s subwatersheds<br />
maintain healthy wild brook trout populations (Figure 1). Intact brook trout<br />
populations in lakes are confined exclusively <strong>to</strong> <strong>the</strong> nor<strong>the</strong>rn states <strong>of</strong> Maine, New<br />
Hampshire, New York, and Vermont. In Maine, brook trout lakes in 323<br />
subwatersheds have severely reduced status.<br />
Maine identified invasive species issues as serious concerns <strong>for</strong> both lentic and lotic<br />
populations <strong>of</strong> brook trout (Hudy et al. 2005). Hence, strategies <strong>for</strong> mitigating <strong>the</strong><br />
effects <strong>of</strong> invasive species are featured prominently in Maine’s <strong>Plan</strong> <strong>for</strong> <strong>the</strong><br />
Conservation Strategy <strong>of</strong> <strong>the</strong> EBTJV (EBTJV 2008) and are listed below.<br />
PRIORITY 1: Assessment<br />
1.3 Maximize <strong>the</strong> contribution <strong>of</strong> wild brook trout s<strong>to</strong>cks <strong>to</strong> <strong>the</strong> fishery.<br />
Strategy 1.3.5. Prevent, eradicate or control <strong>the</strong> detrimental effects caused by<br />
<strong>the</strong> intrusion <strong>of</strong> non-native aquatic species in<strong>to</strong> brook trout habitats.<br />
PRIORITY 2: Habitat Protection<br />
2.1 Identify degraded stream habitats and prioritize sites <strong>for</strong> res<strong>to</strong>ration ef<strong>for</strong>ts<br />
PRFP Page 298
Strategy 2.1.3. Prevent <strong>the</strong> intrusion <strong>of</strong> non-native aquatic species in<strong>to</strong><br />
previously uncolonized habitats where natural land<strong>for</strong>m provides<br />
strategic opportunities <strong>for</strong> optimal or selective barrier placement.<br />
2.3 Permanently protect critical habitats.<br />
Strategy 2.3.1. Establish collaborative partnerships with State, Federal, Tribal<br />
and private entities <strong>for</strong> <strong>the</strong> permanent conservation <strong>of</strong> critical wild<br />
brook trout habitats and refuges.<br />
PRIORITY 3: Outreach<br />
3.2 Foster public/private collaborative stewardship <strong>of</strong> brook trout resources<br />
Strategy 3.2.2. Continue public education ef<strong>for</strong>ts highlighting <strong>the</strong> permanent<br />
ecological repercussions associated with illegal fish s<strong>to</strong>ckings.<br />
Figure 1. EBTJV status <strong>of</strong> wild brook trout populations in <strong>the</strong> Piscataquis River drainage.<br />
Dark green areas denote subwatersheds with 50% or greater occupied habitat and lighter<br />
green subwatersheds signify less than 50% habitat occupied by wild brook trout. Gray areas<br />
signify subwatersheds where wild brook trout but quantitative assessment is not complete.<br />
PRFP Page 299
Appendix K – Nor<strong>the</strong>rn Pike Movement Barrier Risk Assessment Survey<br />
PRFP Page 300
MAINE DEPARTMENT OF<br />
MARINE RESOURCES<br />
BANGOR, MAINE<br />
NORTHERN PIKE MOVEMENT BARRIER RISK<br />
ASSESSMENT SURVEY<br />
JULY 2009<br />
Prepared by:<br />
1
MAINE DEPARTMENT OF MARINE RESOURCES<br />
BANGOR, MAINE<br />
NORTHERN PIKE MOVEMENT BARRIER RISK ASSESSMENT SURVEY<br />
JULY 2009<br />
Prepared by:
MAINE DEPARTMENT OF MARINE RESOURCES<br />
BANGOR, MAINE<br />
NORTHERN PIKE MOVEMENT BARRIER RISK ASSESSMENT SURVEY<br />
TABLE OF CONTENTS<br />
1.0 INTRODUCTION .............................................................................................................. 1<br />
2.0 DESCRIPTION OF THE STUDY AREA ......................................................................... 2<br />
2.1 East Branch Lake .................................................................................................... 2<br />
2.2 Wangan and Sanborn Brooks.................................................................................. 2<br />
3.0 METHODS ......................................................................................................................... 4<br />
4.0 RESULTS ........................................................................................................................... 5<br />
4.1 East Branch Lake .................................................................................................... 6<br />
4.1.1 Seboeis Stream Outlet ................................................................................. 6<br />
4.1.2 Nollesemic Outlet ..................................................................................... 11<br />
4.1.3 Wangan and Sanborn Brooks.................................................................... 14<br />
5.0 DISCUSSION ................................................................................................................... 17<br />
5.1 East Branch Lake .................................................................................................. 17<br />
5.2 Wangan and Sanborn Brooks................................................................................ 18<br />
6.0 LITERATURE CITED ..................................................................................................... 19<br />
LIST OF FIGURES<br />
Figure 1: East Branch Lake Showing Both <strong>the</strong> North and South Outlet Streams ...................2<br />
Figure 2: Headwaters <strong>of</strong> Wangan and Sanborn Brooks ..........................................................3<br />
Figure 3: Horizontal Schematic View <strong>of</strong> South Outlet (East Branch Seboeis Stream)<br />
<strong>of</strong> East Branch Lake, Maine, May 29, 2009 at 18.5 cfs ...........................................9<br />
Figure 4: Water and Channel Elevations, South Outlet <strong>of</strong> East Branch Lake, Maine<br />
(Cross-Sectional View Looking Upstream) ...........................................................10<br />
Figure 5: Water and Channel Elevations, North Outlet <strong>of</strong> East Branch Lake, Maine<br />
(Cross-Sectional View Looking Upstream) ...........................................................13<br />
Figure 6: Location <strong>of</strong> Beaver Flowage Relative <strong>to</strong> Sanborn Brook, Wangan Brook<br />
and Governing Topographic Features (Red Line Indicates Partial GPS<br />
Track During Survey) ............................................................................................15<br />
i
Table <strong>of</strong> Contents (Cont’d)<br />
LIST OF PHOTOS<br />
Pho<strong>to</strong> 1: East Branch Seboeis Stream Approximately 100 Meters Downstream from<br />
East Branch Lake Outlet ..........................................................................................6<br />
Pho<strong>to</strong> 2: View <strong>of</strong> South Outlet <strong>of</strong> East Branch Lake, Looking Upstream .............................7<br />
Pho<strong>to</strong> 3: View Looking Downstream <strong>of</strong> South Outlet <strong>of</strong> East Branch Lake Showing<br />
Field S<strong>to</strong>ne Walls and Cribwork (left) and Hydraulic Control <strong>of</strong> East<br />
Branch Lake (right) ..................................................................................................7<br />
Pho<strong>to</strong> 4: View Looking Upstream at Cross-Section on Un-named North Outlet<br />
Stream Connecting East Branch Lake <strong>to</strong> Nollesemic Lake Where <strong>the</strong><br />
Stream Channel is Well-Defined ...........................................................................11<br />
Pho<strong>to</strong> 5: View Looking Downstream on Un-named North Outlet Stream<br />
Connecting East Branch Lake <strong>to</strong> Nollesemic Lake Where <strong>the</strong> Stream<br />
Channel Becomes Braided and Choked with Woody Debris ................................11<br />
Pho<strong>to</strong> 6: View Looking Northwesterly Toward Beaver Flowage from Upstream-<br />
Most Extremity <strong>of</strong> Depression that Forms an Ephemeral Tributary <strong>to</strong><br />
Sanborn Brook. ......................................................................................................16<br />
LIST OF APPENDICES<br />
Appendix 1: Survey <strong>of</strong> Natural Barriers in Headwater <strong>of</strong> Wangan Brook<br />
\\falcon\jobs\287\008\Docs\002 - Nor<strong>the</strong>rn Pike Movement Barrier Risk Assessment Survey 07-27-09.doc<br />
ii
MAINE DEPARTMENT OF MARINE RESOURCES<br />
BANGOR, MAINE<br />
NORTHERN PIKE MOVEMENT BARRIER RISK ASSESSMENT SURVEY<br />
1.0 INTRODUCTION<br />
In recent years non-indigenous fish species have become widespread throughout Maine,<br />
in some cases by deliberate introductions, and in o<strong>the</strong>r cases due <strong>to</strong> colonization from an<br />
expanding local population. In some cases, <strong>the</strong>re have been documented impacts <strong>to</strong> native<br />
species, such as brook trout, and o<strong>the</strong>r non-game species resulting from <strong>the</strong>se invasions (Boucher<br />
and Bonney, 2004; Gallagher, 2004).<br />
Nor<strong>the</strong>rn pike (Esox lucius) were illegally introduced in<strong>to</strong> <strong>the</strong> Belgrade Chain <strong>of</strong> Lakes in<br />
<strong>the</strong> 1970s, and are now present in <strong>the</strong> Kennebec, Androscoggin, and coastal river drainages<br />
(Maine DIFW, http://www.maine.gov/ifw/fishing/illegal_s<strong>to</strong>cking.htm). In <strong>the</strong> Penobscot<br />
watershed, a nor<strong>the</strong>rn pike population is established in Pushaw Lake, a tributary lake near<br />
Bangor.<br />
Nor<strong>the</strong>rn pike are believed <strong>to</strong> be presently confined <strong>to</strong> <strong>the</strong> Pushaw Stream subwatershed<br />
in <strong>the</strong> Penobscot drainage. Routine fishery moni<strong>to</strong>ring and also recent electr<strong>of</strong>ishing surveys <strong>of</strong><br />
Pushaw Stream and <strong>the</strong> Penobscot River have not detected nor<strong>the</strong>rn pike at o<strong>the</strong>r locations<br />
(Yoder, et al. 2005; Kleinschmidt Associates, 2009). However, <strong>the</strong>re is no barrier preventing<br />
volitional access from <strong>the</strong> Pushaw drainage <strong>to</strong> <strong>the</strong> mainstem Penobscot River. Should <strong>the</strong><br />
species ever become established in <strong>the</strong> Piscataquis River drainage, two tributary streams with<br />
headwaters in a breached divide between <strong>the</strong> Piscataquis and West Branch Penobscot drainages<br />
potentially could serve as a thoroughfare allowing nor<strong>the</strong>rn pike <strong>to</strong> invade <strong>the</strong> West Branch. The<br />
two sites <strong>of</strong> interest are: Wangan Brook (sou<strong>the</strong>rn-flowing inlet <strong>to</strong> Upper Ebemee Lake) in<br />
Piscataquis County and East Branch Lake which connects <strong>the</strong> East Branch Seboies Stream <strong>to</strong><br />
Nollesemic Lake in Penobscot County.<br />
The goal <strong>of</strong> this survey is <strong>to</strong> provide an analysis <strong>of</strong> <strong>the</strong> potential <strong>for</strong> <strong>the</strong>se two streams <strong>to</strong><br />
provide access <strong>to</strong> <strong>the</strong> West Branch <strong>for</strong> nor<strong>the</strong>rn pike, based on surveyed stream channel<br />
conditions.<br />
1
2.0 DESCRIPTION OF THE STUDY AREA<br />
2.1<br />
East Branch Lake<br />
East Branch Lake lies within T3R9 NWP, and is <strong>the</strong> headwater <strong>of</strong> <strong>the</strong> East Branch<br />
Seboeis Stream, which exits <strong>the</strong> lake along <strong>the</strong> sou<strong>the</strong>rn shoreline (Figure 1), <strong>the</strong>n flows<br />
south <strong>to</strong> <strong>the</strong> confluence with <strong>the</strong> Piscataquis River near Howland, Maine. The majority <strong>of</strong><br />
stream flow exits East Branch Lake via this outlet. Ano<strong>the</strong>r small, un-named brook exits<br />
<strong>the</strong> nor<strong>the</strong>ast corner <strong>of</strong> <strong>the</strong> lake and flows north <strong>to</strong> Nollesemic Lake. Nollesemic Lake in<br />
turn discharges <strong>to</strong> Nollesemic Stream and ultimately connects <strong>to</strong> <strong>the</strong> West Branch<br />
Penobscot near Millinocket, Maine.<br />
Figure 1: East Branch Lake Showing Both <strong>the</strong> North and South Outlet Streams<br />
2.2<br />
Wangan and Sanborn Brooks<br />
Wangan Brook originates on <strong>the</strong> east slope <strong>of</strong> an esker in T8R10 WELS, and<br />
descends easterly <strong>to</strong> a <strong>for</strong>ested wetland valley oriented north/south, where it turns south<br />
as a second-order stream, and eventually confluences with <strong>the</strong> East Branch Pleasant River<br />
2
at Upper Ebeemee Lake. The Pleasant River enters <strong>the</strong> Piscataquis River near Milo,<br />
Maine. Sanborn Brook originates from a tributary westerly <strong>of</strong> Sanborn Pond which is<br />
located in <strong>the</strong> same esker valley slightly north <strong>of</strong> Wangan Brook (Figure 2). Sanborn<br />
Brook flows north <strong>to</strong> Upper Jo-Mary Lake, and eventually drains <strong>to</strong> Pemadumcook Lake<br />
which is a flowage <strong>of</strong> <strong>the</strong> West Branch Penobscot including North Twin and South Twin<br />
lakes. The terrain separating <strong>the</strong>se two small streams is comprised <strong>of</strong> a low-relief,<br />
<strong>for</strong>ested wetland and mixed conifer <strong>for</strong>est, and a complex <strong>of</strong> alder thicket and beaver<br />
ponds. A short trough depression has <strong>for</strong>med a small perennial stream that exits an<br />
abandoned beaver dam southward <strong>to</strong> a connection with Wangan Brook. Ano<strong>the</strong>r<br />
depression extends between a bend in Sanborn Brook southwesterly <strong>to</strong>ward Wangan<br />
Brook that could convey water at high flows.<br />
Figure 2: Headwaters <strong>of</strong> Wangan and Sanborn Brooks<br />
(Red dotted line indicates pathway <strong>of</strong> trough that potentially could connect both<br />
watersheds)<br />
3
3.0 METHODS<br />
Both streams were surveyed <strong>the</strong> week <strong>of</strong> May 25, 2009. Maine DIFW provided<br />
invaluable guidance on access and locations, including GPS waypoints, especially <strong>for</strong> <strong>the</strong><br />
Wangan Brook site (T. Obrey, and Richard Dill, Maine DIFW, personal communication).<br />
Wangan Brook was reinvestigated a second time on July 8, 2009 following an extended period <strong>of</strong><br />
high rainfall which increased water levels through <strong>the</strong> study site.<br />
At each site, <strong>the</strong> most limiting passage point <strong>for</strong> migrating fish in <strong>the</strong> thoroughfare area<br />
was located and geo-referenced. Fac<strong>to</strong>rs such as stream slope, water depth, velocity, presence <strong>of</strong><br />
any physical obstruction (both vertical and horizontal) were collectively considered <strong>to</strong> evaluate<br />
each limiting passage site. Although <strong>the</strong> survey occurred in late May, nor<strong>the</strong>rn pike could be<br />
active immediately after ice-out when water levels are significantly higher (and thus hydraulic<br />
conditions different). Thus <strong>the</strong> seasonal high water elevation at each site was also identified and<br />
surveyed. Bankfull indica<strong>to</strong>rs such as changes in vegetation, leaf and substrate disturbance and<br />
bank erosion were collectively used <strong>to</strong> approximate <strong>the</strong> elevation <strong>of</strong> high water.<br />
Each site was geo-referenced with a Trimble model Geo XH GPS unit, and a cross-<br />
section transect established. Transect data included bed pr<strong>of</strong>ile elevations, water surface<br />
elevations (WSEL's) at <strong>the</strong> existing stream flow and at estimated bankfull. Lateral survey<br />
boundaries <strong>of</strong> each transect were defined by head- and tailpins established above <strong>the</strong> crest <strong>of</strong><br />
each bank. Headpins were located along <strong>the</strong> right bank (looking downstream). Pins were field-<br />
blazed and semi-permanently fixed with ei<strong>the</strong>r rebar or by using a large tree or o<strong>the</strong>r fixed object<br />
and <strong>the</strong>n field blazed with flagging and/or survey paint.<br />
A 300-ft fiberglass survey tape was secured between headpin and tailpin at each transect.<br />
Elevation and edge <strong>of</strong> water were recorded at intervals (verticals) along <strong>the</strong> tape. Verticals were<br />
established wherever an observable change in pr<strong>of</strong>ile occurred and/or at locations <strong>of</strong> special<br />
interest such as hydraulic controls. In <strong>the</strong> case <strong>of</strong> cribwork, beaver dams etc., water and object<br />
elevations were ga<strong>the</strong>red across both <strong>the</strong> crest and <strong>to</strong>e <strong>of</strong> <strong>the</strong> obstruction. Bed and water surface<br />
elevations were surveyed <strong>to</strong> <strong>the</strong> nearest 0.01-ft elevation using a surveying level and standard<br />
surveying techniques. Each site was also pho<strong>to</strong>graphed and schematically sketched.<br />
4
Discharge through <strong>the</strong> study area is unregulated, and <strong>the</strong>re<strong>for</strong>e subject <strong>to</strong> precipitation<br />
and climatic events. A staff gage was semi-permanently installed in <strong>the</strong> vicinity <strong>of</strong> each study<br />
site <strong>to</strong> verify that discharge remained adequately stable during hydraulic measurements and also<br />
<strong>to</strong> potentially serve as reference should future site visits occur at o<strong>the</strong>r discharge levels. Stage<br />
(water height) was recorded at <strong>the</strong> beginning and end <strong>of</strong> each survey.<br />
A discharge measurement transect was located in <strong>the</strong> vicinity <strong>of</strong> <strong>the</strong> study area in a<br />
location featuring a relatively flat stream bot<strong>to</strong>m with non-turbulent flow. Velocity was<br />
measured at intervals along <strong>the</strong> transect <strong>to</strong> <strong>the</strong> nearest 0.1-ft/s , using a calibrated Marsh-<br />
McBirney Model 2000 Flowmate electronic current meter attached <strong>to</strong> a <strong>to</strong>p-setting wading rod.<br />
In water less than 2.5-ft deep, mean-column-velocity was measured at 0.6 <strong>of</strong> <strong>the</strong> depth. In water<br />
greater than 2.5-ft deep, mean-column-velocity was taken as <strong>the</strong> average <strong>of</strong> <strong>the</strong> velocities<br />
measured at 0.2 and 0.8 <strong>of</strong> <strong>the</strong> depth. Each point velocity measurement used on a given vertical<br />
was <strong>the</strong> mean <strong>of</strong> a series <strong>of</strong> 20-second time-averaged readings.<br />
5
4.0 RESULTS<br />
4.1<br />
East Branch Lake<br />
4.1.1<br />
Seboeis Stream Outlet<br />
The East Branch Seboeis Stream outlet <strong>of</strong> East Branch Lake is <strong>the</strong> major<br />
outlet <strong>of</strong> <strong>the</strong> lake and approximately 16 ft wide; <strong>the</strong> stream below <strong>the</strong> outlet<br />
widens <strong>to</strong> approximately 25 ft, and features a channel sufficiently deep and<br />
unobstructed <strong>for</strong> nor<strong>the</strong>rn pike <strong>to</strong> readily ascend <strong>the</strong> stream. The stream channel<br />
is well-defined and provides instream and riparian cover, including resting pools<br />
and channels suitable <strong>for</strong> adult fish movement, resting and <strong>for</strong>aging (Pho<strong>to</strong> 1).<br />
Pho<strong>to</strong> 1: East Branch Seboeis Stream Approximately 100 Meters Downstream from<br />
East Branch Lake Outlet<br />
The stream exits <strong>the</strong> lake via a man-modified notch with fields<strong>to</strong>ne walls<br />
and cribwork that appears <strong>to</strong> have once been dammed (Pho<strong>to</strong>s 2 and 3). The<br />
existing hydraulic control <strong>for</strong> East Branch Lake lies just upstream from <strong>the</strong> outlet<br />
at a slightly higher elevation than <strong>the</strong> outlet.<br />
6
Pho<strong>to</strong> 2: View <strong>of</strong> South Outlet <strong>of</strong> East Branch Lake, Looking Upstream<br />
Pho<strong>to</strong> 3: View Looking Downstream <strong>of</strong> South Outlet <strong>of</strong> East Branch Lake Showing<br />
Field S<strong>to</strong>ne Walls and Cribwork (left) and Hydraulic Control <strong>of</strong> East Branch<br />
Lake (right)<br />
Stream flow was gauged as 18.5 cfs. At that discharge water descends<br />
from <strong>the</strong> lake hydraulic control through turbulent rapids <strong>to</strong> <strong>the</strong> cribwork, where it<br />
cascades over <strong>the</strong> log crest <strong>to</strong> a second shallow riffle which descends <strong>to</strong> a wide<br />
pool/run. A fish ascending from <strong>the</strong> pool <strong>to</strong>ward <strong>the</strong> crib work would experience<br />
riffle depths <strong>of</strong> 9-14 inches, and maximum velocities <strong>of</strong> 5 ft/sec prior <strong>to</strong> arriving<br />
at <strong>the</strong> crib work. The elevation difference between <strong>the</strong> crib <strong>to</strong>e <strong>to</strong> crib crest was<br />
0.4 ft (approximately 5 inches); at 18.5 cfs <strong>the</strong> net hydraulic head difference was<br />
0.6 ft (approximately 7 inches) (Figures 3 and 4). Upstream from <strong>the</strong> cribwork,<br />
<strong>the</strong> lake outlet hydraulic control elevation is 0.4 inches higher than <strong>the</strong> crib crest;<br />
and under <strong>the</strong> field conditions observed, <strong>the</strong> water elevation (97.7 ft. survey<br />
7
elevation) difference from <strong>the</strong> crib <strong>to</strong> <strong>the</strong> lake hydraulic control was 2.2 ft.<br />
However, <strong>the</strong> spring bankfull elevation line in <strong>the</strong> stream at a point downstream<br />
from <strong>the</strong> cribbing corresponded <strong>to</strong> an elevation 0f 97.8 ft, which is slightly higher<br />
than that <strong>of</strong> <strong>the</strong> June lake elevation, and also 1.9 ft higher in elevation than <strong>the</strong><br />
outlet hydraulic control. This suggests that under peak spring run-<strong>of</strong>f all outlet<br />
structures and <strong>the</strong> lake hydraulic control at this site are submerged. The duration<br />
and exact timing <strong>of</strong> this condition is currently undocumented.<br />
8
Lake el. 97.7 outlet hydraulic control el. 95.9 crib <strong>to</strong>p water el. 96.4 el. Spring high water 97.8<br />
EAST BRANCH LAKE<br />
outflow<br />
9<br />
Water elevation below crib 95.8<br />
Top <strong>of</strong> crib el.95.5 Bot<strong>to</strong>m <strong>of</strong> crib el. 95.1(typical)<br />
Figure 3: Horizontal Schematic View <strong>of</strong> South Outlet (East Branch Seboeis Stream) <strong>of</strong> East Branch Lake, Maine, May 29, 2009<br />
at 18.5 cfs<br />
(Not drawn <strong>to</strong> scale; features exaggerated <strong>for</strong> clarity)
Figure 4: Water and Channel Elevations, South Outlet <strong>of</strong> East Branch Lake, Maine (Cross-Sectional View Looking Upstream)<br />
10
4.1.2<br />
Nollesemic Outlet<br />
The un-named north outlet <strong>to</strong> Nollesemic Lake is a much smaller stream<br />
than <strong>the</strong> south outlet. It exits <strong>the</strong> lake via a wetland complex, and passes through<br />
upland <strong>for</strong>est, where <strong>the</strong> channel becomes highly braided and choked with woody<br />
debris and blow down. A defined stream channel briefly appears about 100<br />
meters upstream <strong>of</strong> <strong>the</strong> road that passes north <strong>of</strong> <strong>the</strong> lake; this channel resumes<br />
becoming blocked by braids and woody debris about ano<strong>the</strong>r 100 meters<br />
downstream from <strong>the</strong> road (Pho<strong>to</strong>s 4 and 5).<br />
Pho<strong>to</strong> 4: View Looking Upstream at Cross-Section on Un-named North Outlet Stream<br />
Connecting East Branch Lake <strong>to</strong> Nollesemic Lake Where <strong>the</strong> Stream<br />
Channel is Well-Defined<br />
Pho<strong>to</strong> 5: View Looking Downstream on Un-named North Outlet Stream Connecting<br />
East Branch Lake <strong>to</strong> Nollesemic Lake Where <strong>the</strong> Stream Channel Becomes<br />
Braided and Choked with Woody Debris<br />
11
A portion <strong>of</strong> <strong>the</strong> stream passes <strong>to</strong> <strong>the</strong> east <strong>of</strong> this watercourse, through an<br />
unwadable, muddy lowland swale with no defined channel. Fish exiting <strong>the</strong> lake<br />
via this outlet would descend in elevation but encounter dense thickets <strong>of</strong> brush<br />
and downed trees and shallow, braided stream channels where flow is dispersed<br />
and <strong>to</strong> some extent passes interstitially through substrate, sediment, rootwads, and<br />
brush incapable <strong>of</strong> passing adult sized fish. The areas covered by shallow braids,<br />
marsh and blow down did not lend <strong>the</strong>mselves <strong>to</strong> surveying. The well-defined<br />
stream channel in <strong>the</strong> vicinity <strong>of</strong> <strong>the</strong> road channel was surveyed at a natural<br />
constriction featuring a concentration <strong>of</strong> cobble-sized rocks that could limit<br />
passage at least at lower flows (Figure 5).<br />
12
Figure 5: Water and Channel Elevations, North Outlet <strong>of</strong> East Branch Lake, Maine (Cross-Sectional View Looking Upstream)<br />
13
4.1.3<br />
Wangan and Sanborn brooks are separated by a low-relief height-<strong>of</strong>-land<br />
traversed <strong>for</strong> approximately a 500-700 ft. distance by a narrow, low lying depression<br />
through <strong>the</strong> <strong>for</strong>ested esker valley. The depression extends from a sharp bend in Sanborn<br />
Brook westerly <strong>to</strong> <strong>the</strong> vicinity <strong>of</strong> a beaver flowage which is a tributary <strong>to</strong> Wangan<br />
Brook. The beaver dam emits discharge down a short connec<strong>to</strong>r stream channel <strong>to</strong><br />
Wangan Brook.<br />
On <strong>the</strong> date <strong>of</strong> <strong>the</strong> May site visit, Wangan Brook flow was gaged at 3.3 cfs and<br />
flow in <strong>the</strong> connec<strong>to</strong>r channel was 1.5 cfs. During <strong>the</strong> July site visit, Wangan Brook<br />
was not gaged, but estimated <strong>to</strong> be discharging about 10-15 cfs, and showed evidence <strong>of</strong><br />
having recently receded from slightly over its banks. The reach <strong>of</strong> Wangan Brook at <strong>the</strong><br />
<strong>to</strong>e <strong>of</strong> <strong>the</strong> esker that curves near <strong>the</strong> beaver pond shows evidence <strong>of</strong> stream evulsions;<br />
an abandoned channel <strong>of</strong> <strong>the</strong> brook appears <strong>to</strong> have received overflow that potentially<br />
funneled in<strong>to</strong> <strong>the</strong> lower end <strong>of</strong> <strong>the</strong> beaver flowage under extremely high run<strong>of</strong>f<br />
conditions.<br />
Wangan and Sanborn Brooks<br />
Most <strong>of</strong> <strong>the</strong> connec<strong>to</strong>r channel is trapezoidal-shaped, and comprised <strong>of</strong><br />
vegetated, ear<strong>the</strong>n banks and fine substrates. A staff gage in <strong>the</strong> connec<strong>to</strong>r stream<br />
indicated that <strong>the</strong> water level had risen 2 inches relative <strong>to</strong> May water levels in response<br />
<strong>to</strong> increased July outflow from <strong>the</strong> beaver flowage. The beaver pond water elevation<br />
had risen by approximately one foot.<br />
At <strong>the</strong> point <strong>of</strong> confluence, both Wangan Brook and <strong>the</strong> beaver flowage<br />
connec<strong>to</strong>r channels are sufficiently deep, wide and slow-flowing enough <strong>to</strong><br />
accommodate volitional passage <strong>of</strong> adult fish, including nor<strong>the</strong>rn pike under <strong>the</strong><br />
observed flow conditions. Two barriers in <strong>the</strong> connec<strong>to</strong>r channel were surveyed in May<br />
<strong>to</strong> determine if pike could gain access <strong>to</strong> <strong>the</strong> beaver pond (Appendix 1). Although <strong>the</strong><br />
beaver flowage is part <strong>of</strong> <strong>the</strong> Wangan Brook watershed, it is perched close <strong>to</strong> a shallow<br />
watershed divide. Thus <strong>the</strong> surrounding <strong>to</strong>pography was revisited in July (after heavy<br />
rains increased surface run<strong>of</strong>f) <strong>to</strong> empirically observe if low lying areas between <strong>the</strong><br />
14
eaver flowage and Sanborn Stream provide a hydraulic connection suitable <strong>for</strong> fish<br />
passage.<br />
The beaver flowage water elevation is presently controlled by <strong>the</strong> breached<br />
outlet <strong>of</strong> <strong>the</strong> dam and is <strong>the</strong> part <strong>of</strong> <strong>the</strong> Wangan Brook drainage that comes closest <strong>to</strong> <strong>the</strong><br />
Sanborn watershed (Figure 6). All low-lying areas that might conduct water between<br />
<strong>the</strong> beaver flowage and Sanborn Brook throughout this area were walked in July<br />
immediately following an extended period <strong>of</strong> heavy rains that temporarily resulted in<br />
near-spring stream run<strong>of</strong>f conditions. Several small ephemeral tributaries were<br />
observed <strong>to</strong> flow in<strong>to</strong> <strong>the</strong> Sanborn drainage from <strong>the</strong> direction <strong>of</strong> <strong>the</strong> beaver flowage,<br />
but were confirmed <strong>to</strong> have no direct hydraulic connection <strong>to</strong> <strong>the</strong> beaver flowage. A<br />
slight height <strong>of</strong> land between <strong>the</strong> drainages was observed that divides <strong>the</strong> existing<br />
beaver flowage from <strong>the</strong> nearest stream head by approximately 250 ft. (Pho<strong>to</strong> 6). It is<br />
apparent by examination <strong>of</strong> undisturbed leaf litter, vegetation and <strong>for</strong>est duff across this<br />
height <strong>of</strong> land that this watershed divide has not recently been subject <strong>to</strong> inundation, and<br />
thus is not a connection that migrating fish can utilize <strong>to</strong> cross between watersheds.<br />
Figure 6: Location <strong>of</strong> Beaver Flowage Relative <strong>to</strong> Sanborn Brook, Wangan Brook and<br />
Governing Topographic Features (Red Line Indicates Partial GPS Track During<br />
Survey)<br />
15
Pho<strong>to</strong> 6: View Looking Northwesterly Toward Beaver Flowage from Upstream-Most<br />
Extremity <strong>of</strong> Depression that Forms an Ephemeral Tributary <strong>to</strong> Sanborn Brook.<br />
Beaver flowage is approximately 250 ft distant (can be seen as <strong>the</strong> clearing in <strong>the</strong> distance).<br />
Elevation <strong>of</strong> divide appears <strong>to</strong> be approximately 2-3 ft. higher than pool elevation <strong>of</strong><br />
beaver flowage.<br />
16
5.0 DISCUSSION<br />
5.1<br />
Under <strong>the</strong> existing conditions, it appears that it is <strong>the</strong>oretically possible <strong>for</strong><br />
nor<strong>the</strong>rn pike <strong>to</strong> access <strong>the</strong> West Branch Penobscot drainage by way <strong>of</strong> East Branch<br />
Lake. Pike established in <strong>the</strong> Piscataquis/Seboeis drainage would be able <strong>to</strong> ascend East<br />
Branch Seboeis Stream <strong>to</strong> <strong>the</strong> outlet <strong>of</strong> <strong>the</strong> lake where <strong>the</strong> crib work <strong>of</strong> an abandoned dam<br />
<strong>for</strong>ms a partial barrier under low flow conditions. Under flow conditions found in this<br />
survey, a pike would need <strong>to</strong> swim upstream against <strong>the</strong> riffle flow, <strong>the</strong>n leap a 0.4 ft<br />
hydraulic jump at <strong>the</strong> crib work. Bell (1990) gives <strong>the</strong> maximum darting speed <strong>of</strong> a 14inch<br />
pike as 4 ft/sec., which is less than <strong>the</strong> observed velocity <strong>of</strong> <strong>the</strong> riffle immediately<br />
below <strong>the</strong> lake outlet. This suggests that most pike would have a difficult time ascending<br />
<strong>the</strong> riffle <strong>to</strong> <strong>the</strong> cribbing. At lower outflows, <strong>the</strong> velocity may be reduced, but channel<br />
depth would also be reduced, which may also inhibit <strong>the</strong> ability <strong>of</strong> a pike <strong>to</strong> ascend <strong>the</strong><br />
riffle and complete a leap over <strong>the</strong> cribbing. However under spring run-<strong>of</strong>f conditions<br />
this barrier may be sufficiently submerged <strong>to</strong> briefly enable free swim passage upstream<br />
<strong>to</strong> <strong>the</strong> lake.<br />
East Branch Lake<br />
Nor<strong>the</strong>rn pike from East Branch Lake would next need <strong>to</strong> traverse downstream<br />
via <strong>the</strong> unnamed stream <strong>to</strong> <strong>the</strong> north <strong>to</strong> enter <strong>the</strong> West Branch drainage via Nollesemic<br />
Lake. This outlet stream appears <strong>to</strong> be impassible <strong>for</strong> adult-sized pike due <strong>to</strong> <strong>the</strong><br />
preponderance <strong>of</strong> wetland, blow down thickets and shallow braids, which limits<br />
downstream passage <strong>to</strong> only shallow and interstitial channel routes. However it is<br />
possible that young <strong>of</strong> year or juveniles produced by a breeding population <strong>of</strong> East<br />
Branch Lake pike could be sufficiently small <strong>to</strong> potentially pass downstream through<br />
<strong>the</strong>se obstacles and thus colonize Nollesemic Lake.<br />
We conclude that if pike were <strong>to</strong> become established in East Branch Lake, <strong>the</strong>re is<br />
potential <strong>for</strong> <strong>the</strong> species <strong>to</strong> eventually colonize <strong>the</strong>ir way downstream <strong>to</strong>ward <strong>the</strong> West<br />
Branch if juvenile fish traverse <strong>the</strong> un-named brook. Although <strong>the</strong> probability <strong>of</strong> this<br />
occurring appears relatively low, it cannot be ruled out. There<strong>for</strong>e, if a future fish barrier<br />
solution is deemed justified, strategic options include construction <strong>of</strong> a barrier at a<br />
17
location that would prevent fish from ascending <strong>to</strong> East Branch Lake from <strong>the</strong> Seboeis<br />
Stream, or alternatively, closing <strong>the</strong> outlet <strong>to</strong> <strong>the</strong> Nollesemic drainage with a dike.<br />
5.2<br />
Wangan and Sanborn Brooks<br />
Fish movement access <strong>to</strong> <strong>the</strong> Sanborn Brook watershed from Wangan Brook does<br />
not currently exist due <strong>to</strong> <strong>the</strong> low divide separating <strong>the</strong> beaver flowage in <strong>the</strong> Wangan<br />
Brook watershed from ephemeral stream channels that are tributaries <strong>to</strong> Sanborn Brook.<br />
Although <strong>the</strong>se channels are not connected <strong>to</strong> <strong>the</strong> beaver flowage, <strong>the</strong>y begin <strong>to</strong><br />
<strong>for</strong>m just a few hundred feet away from <strong>the</strong> flowage just beyond a low-relief divide. The<br />
close proximity <strong>of</strong> this divide <strong>to</strong> <strong>the</strong> beaver dam in low-gradient <strong>to</strong>pography means that<br />
<strong>the</strong> integrity <strong>of</strong> this barrier may be potentially subject <strong>to</strong> any changing physical condition<br />
<strong>of</strong> <strong>the</strong> beaver dam. The condition, size and volume <strong>of</strong> beaver flowages can be very<br />
ephemeral. Likewise, <strong>the</strong> evulsive nature <strong>of</strong> <strong>the</strong> Wangan Brook channel where it passes<br />
near <strong>the</strong> beaver dam means that <strong>the</strong> channel may migrate ei<strong>the</strong>r away from, or <strong>to</strong>ward <strong>the</strong><br />
beaver flowage over time. Under a scenario where <strong>the</strong> dam was re-built by beaver, a<br />
higher flowage level may be res<strong>to</strong>red that is nearer in elevation <strong>to</strong> that <strong>of</strong> <strong>the</strong> divide.<br />
There is evidence that at high flow an existing side channel <strong>of</strong> Wangan Brook could<br />
<strong>the</strong>oretically fill a res<strong>to</strong>red beaver flowage <strong>to</strong> <strong>the</strong> point where <strong>the</strong> existing low-pr<strong>of</strong>ile<br />
divide might be breached. Any nor<strong>the</strong>rn pike inhabiting <strong>the</strong> beaver flowage could, under<br />
those very specific set <strong>of</strong> hydraulic conditions (that may persist only briefly) escape <strong>to</strong> <strong>the</strong><br />
Sanborn drainage. The probability <strong>of</strong> this occurring appears extremely low, however it<br />
may be advisable <strong>to</strong> periodically re-inspect this site <strong>to</strong> confirm that <strong>the</strong> status <strong>of</strong> <strong>the</strong><br />
beaver flowage relative <strong>to</strong> Wangan Brook and <strong>the</strong> divide has not changed.<br />
18
6.0 LITERATURE CITED<br />
Bell, M.C. 1990. Fisheries handbook <strong>of</strong> engineering requirements and biological criteria. Fish<br />
passage development and evaluation program. Corps <strong>of</strong> Engineers, N. Pac. Div.,<br />
Portland, OR.<br />
Boucher, D.P. and F.R. Bonney. 2004. Rapid River fishery management. American Fisheries<br />
Society, Atlantic International Chapter Annual Meeting. Lake Morey, Vermont.<br />
September 2004.<br />
Gallagher, M. 2004. Comparing Maine lake and stream fish assemblages as a function <strong>of</strong><br />
watershed condition. American Fisheries Society, Atlantic International Chapter Annual<br />
Meeting. Lake Morey, Vermont. September 2004.<br />
Kleinschmidt Associates. 2009. Penobscot River fish assemblage survey interim report.<br />
January, 2009. NOAA Fisheries, Woods Hole, MA.<br />
Yoder, C.O., B.H. Kulik and J.M. Audet. 2005. Maine rivers fish assemblage assessment:<br />
Interim Report II. Penobscot River & tributaries: 2004. Midwest Biodiversity Institute<br />
Center <strong>for</strong> Applied Bioassessment & Biocriteria, Columbus, OH 43221; Kleinschmidt<br />
Associates, Pittsfield, ME. 94 pp.<br />
19
APPENDIX 1<br />
SURVEY OF NATURAL BARRIERS IN HEADWATER OF WANGAN BROOK<br />
A boulder and cobble riffle constriction was observed at approximately <strong>the</strong> midpoint <strong>of</strong><br />
<strong>the</strong> beaver flowage connec<strong>to</strong>r channel that, at low flow, is <strong>the</strong> first potential barrier <strong>to</strong> a pike-<br />
sized fish moving upstream from Wangan Brook (Pho<strong>to</strong>s A-1 and A-2).<br />
Pho<strong>to</strong> A-1: View <strong>of</strong> Typical Channel Connecting Beaver Flowage <strong>to</strong> Wangan Brook<br />
Pho<strong>to</strong> A-2: Instream Passage Constriction Between Beaver Flowage and Wangan Brook.<br />
Orange Blazing Indicates Transect Location (view looking upstream)<br />
A-1
Transect W-1 was located at this constriction, and was configured <strong>to</strong> transect both <strong>the</strong><br />
connection channel and also Wangan Brook above <strong>the</strong> confluence (Figure A-1). Upstream<br />
passage <strong>for</strong> adult or juvenile nor<strong>the</strong>rn pike would be restricted under <strong>the</strong>se flow conditions;<br />
however, <strong>the</strong> bankfull elevation indicates that under peak spring run-<strong>of</strong>f conditions, this riffle<br />
would be submerged (Figure A-2). Given <strong>the</strong> relatively low gradient <strong>of</strong> this reach, it is unlikely<br />
that velocities at peak run-<strong>of</strong>f would be limiting <strong>for</strong> upstream movements, in which case, this<br />
would cease <strong>to</strong> be an upstream barrier under such conditions.<br />
If nor<strong>the</strong>rn pike were <strong>to</strong> ascend <strong>the</strong> channel fur<strong>the</strong>r, <strong>the</strong>y would next encounter a short<br />
segment <strong>of</strong> shallow, braided channels (which at higher flows would likely be passable) be<strong>for</strong>e<br />
encountering a largely intact, j-shaped abandoned beaver dam approximately 200 ft in length<br />
(Pho<strong>to</strong>s A-3 and –A-4, Figure A-1).<br />
Although <strong>the</strong> nor<strong>the</strong>rn end <strong>of</strong> <strong>the</strong> beaver dam was breached, under <strong>the</strong> observed<br />
conditions water was exiting <strong>the</strong> beaver flowage via leakage ra<strong>the</strong>r than through <strong>the</strong> breach<br />
directly <strong>to</strong> a channel. During <strong>the</strong> second site visit, water depth had increased by approximately<br />
one foot, but water still was exiting via leakage.<br />
Under <strong>the</strong>se conditions <strong>the</strong> beaver dam creates an impassable upstream passage barrier.<br />
Transect W-2 depicts crest and <strong>to</strong>e elevations along <strong>the</strong> axis <strong>of</strong> <strong>the</strong> dam, and also <strong>the</strong> elevation <strong>of</strong><br />
spring high water elevation <strong>of</strong> <strong>the</strong> channel immediately below <strong>the</strong> beaver dam (Figure A-3).<br />
Under spring conditions it does appear that <strong>the</strong> channel below <strong>the</strong> dam can backwater <strong>to</strong> an<br />
elevation greater than <strong>the</strong> breach invert, which could briefly facilitate upstream fish movement,<br />
particularly if <strong>the</strong> beaver pond water elevation was high, which is probable during spring run-<strong>of</strong>f.<br />
Given <strong>the</strong> ephemeral nature <strong>of</strong> beaver dams, it is also possible that <strong>the</strong> shape, size <strong>of</strong> <strong>the</strong> dam and<br />
invert elevation <strong>of</strong> breaches can change from year <strong>to</strong> year, so that <strong>the</strong> observed passage<br />
conditions can potentially change from year <strong>to</strong> year.<br />
A-2
Figure A-1: Orientation <strong>of</strong> Study Site at <strong>the</strong> Trough Connection between Wangan Brook and Sanborn Brook Drainages. Transect W-1<br />
bisects <strong>the</strong> connec<strong>to</strong>r at a constriction with large cobble and boulders; transect W-2 is a longitudinal pr<strong>of</strong>ile <strong>of</strong> an abandoned<br />
beaver dam (not drawn <strong>to</strong> scale).<br />
A-3
Figure A-2: Transect W-1. Water and Channel Elevations Wangan Brook and Connec<strong>to</strong>r Trough from Sanborn Brook. Cross-sectional<br />
view looking upstream.<br />
A-4
Pho<strong>to</strong> A-3: View from within Sanborn Brook beaver flowage looking <strong>to</strong>ward <strong>the</strong> connec<strong>to</strong>r<br />
channel outlet at crest <strong>of</strong> dam, panned <strong>to</strong> <strong>the</strong> north, breach is at far right.<br />
Pho<strong>to</strong> A-4: View from within beaver flowage looking <strong>to</strong>ward <strong>the</strong> connec<strong>to</strong>r channel outlet<br />
downstream at crest <strong>of</strong> dam, panned <strong>to</strong> <strong>the</strong> south.<br />
A-5
Figure A-3: Transect W-2. Crest, <strong>to</strong>e and high water elevations at beaver dam dividing <strong>the</strong> Sanborn Brook and Wangan Brook watersheds.<br />
Cross-sectional view looking upstream.<br />
A-6
Response <strong>to</strong> Comments and Suggested changes <strong>to</strong> <strong>the</strong><br />
Draft <strong>Operational</strong> <strong>Plan</strong> <strong>for</strong> <strong>the</strong> <strong>Res<strong>to</strong>ration</strong> <strong>of</strong> <strong>Diadromous</strong> <strong>Fishes</strong> <strong>to</strong> <strong>the</strong> Penobscot<br />
River<br />
7-2-09<br />
Section 1<br />
Comment: While hatcheries are an important short-term aspect <strong>of</strong> fishery res<strong>to</strong>ration, in<br />
<strong>the</strong> long run hatcheries are not <strong>the</strong> answer. An active ef<strong>for</strong>t is needed <strong>to</strong> res<strong>to</strong>re <strong>the</strong><br />
fisheries, and short-term measureable results are needed <strong>to</strong> overcome <strong>the</strong> political<br />
issues.<br />
Response: DMR’s goal <strong>of</strong> res<strong>to</strong>ring American shad <strong>to</strong> <strong>the</strong>ir his<strong>to</strong>ric abundance within a<br />
50-year period is only possible with a s<strong>to</strong>cking program. Adult returns in excess <strong>of</strong><br />
broods<strong>to</strong>ck needed <strong>for</strong> <strong>the</strong> hatchery (1200 fish annually) will be allowed <strong>to</strong> migrate<br />
upriver and spawn naturally. Safe and efficient shad passage at Mil<strong>for</strong>d, Howland, West<br />
Enfield, and Mattaceunk (Weldon) is essential <strong>for</strong> natural expansion <strong>of</strong> this portion <strong>of</strong> <strong>the</strong><br />
population.<br />
In order <strong>to</strong> meet <strong>the</strong> objectives <strong>of</strong> our long-term strategic plan <strong>for</strong> Atlantic salmon,<br />
<strong>the</strong> role <strong>of</strong> hatcheries needs <strong>to</strong> be reduced or eliminated. However, given <strong>the</strong> timeframe<br />
<strong>of</strong> <strong>the</strong> operational plan, we don’t <strong>for</strong>esee a reduction in our reliance on hatcheries. We<br />
are trying <strong>to</strong> maximize <strong>the</strong> benefit <strong>of</strong> hatchery products, reduce sea-run broods<strong>to</strong>ck<br />
requirement in an ef<strong>for</strong>t <strong>to</strong> increase natural spawning.<br />
The plan states under <strong>the</strong> Atlantic salmon introduction (p28) ”Pending<br />
improvement in marine survival rates and freshwater production, hatchery<br />
supplementation will continue <strong>to</strong> play a vital role in an integrated management<br />
approach.” Hatcheries are an interim <strong>to</strong>ol <strong>to</strong> maintain and possibly increase salmon<br />
abundances. The term “interim” is used ra<strong>the</strong>r than “short-term”, because we have no<br />
idea when and if marine survival will improve. It is accepted that low marine survival is<br />
a major fac<strong>to</strong>r in <strong>the</strong> decline <strong>of</strong> Atlantic salmon in Maine. In order <strong>to</strong> increase<br />
escapement we need <strong>to</strong> have more adult salmon returning or find ways <strong>to</strong> reduce<br />
broods<strong>to</strong>ck requirements. Strategies 12.2 and 12.3 (p31) relate <strong>to</strong> reducing sea-run<br />
broods<strong>to</strong>ck and thus increase escapement. The o<strong>the</strong>r strategies under objective 12<br />
(p30) are an ef<strong>for</strong>t <strong>to</strong> increase natural spawning. Objective 13, strategies 13.1 and 13.2<br />
(p31) recognize that by increasing <strong>the</strong> survival <strong>of</strong> hatchery products (ei<strong>the</strong>r in <strong>the</strong><br />
hatchery <strong>of</strong> in <strong>the</strong> wild) broods<strong>to</strong>ck requirements are reduced or adult returns increase.<br />
Strategy 15.1 (p31) recognizes that increasing hatchery production <strong>to</strong> gain more returns<br />
can <strong>of</strong>fset low freshwater and marine survival. It must also be recognized that at some<br />
point densities could become an issue; however, in is unlikely that our hatcheries could<br />
produce enough salmon <strong>for</strong> that <strong>to</strong> become an issue. Thus, this operational plan<br />
emphasizes using hatcheries and hatchery products as a means <strong>to</strong> increase adult<br />
returns, spawning escapement and ultimately natural reproduction. At <strong>the</strong> same time<br />
that we are trying <strong>to</strong> increase upstream escapement <strong>of</strong> adults salmon <strong>the</strong>y must also be<br />
able <strong>to</strong> reach quality spawning habitat. For example, if we increase spawning<br />
escapement by 100 salmon, but <strong>the</strong>y need <strong>to</strong> ascend 5 fishways that are 90% efficient,<br />
<strong>the</strong> effective escapement is only 60 salmon. In some instance passage at some<br />
facilities could be as low as 20% or even zero at times depending on flow conditions<br />
PRFP Page 330
and maintenance operations at a facility. No one strategy will be effective in increasing<br />
salmon abundances, but collectively <strong>the</strong>y will have a positive impact.<br />
Comment: Include a provision <strong>for</strong> a S<strong>to</strong>cking Management <strong>Plan</strong> <strong>for</strong> all s<strong>to</strong>cking ef<strong>for</strong>ts <strong>to</strong><br />
address elements such as: identification <strong>of</strong> broods<strong>to</strong>ck source, numbers <strong>of</strong> broods<strong>to</strong>ck<br />
used, disposition <strong>of</strong> broods<strong>to</strong>ck, calculation <strong>of</strong> effective population size, life stage<br />
s<strong>to</strong>cked, date/time <strong>of</strong> s<strong>to</strong>cking, location <strong>of</strong> s<strong>to</strong>cking and numbers s<strong>to</strong>cked.<br />
Response: In<strong>for</strong>mation pertaining <strong>to</strong> many <strong>of</strong> <strong>the</strong>se elements is included in <strong>the</strong> alewife<br />
and shad sections <strong>of</strong> <strong>the</strong> <strong>Operational</strong> <strong>Plan</strong> (P11, P14, P21, P25), and will be included in<br />
<strong>the</strong> Penobscot annual report. There are also three tasks that relate <strong>to</strong> s<strong>to</strong>cking and<br />
broods<strong>to</strong>ck management <strong>for</strong> Atlantic salmon. Task 12.1.1 (p37) calls <strong>for</strong> <strong>the</strong><br />
development <strong>of</strong> a Broods<strong>to</strong>ck Management <strong>Plan</strong>, which will outline a strategy <strong>for</strong> <strong>the</strong><br />
disposition <strong>of</strong> adult returns, use or collections <strong>of</strong> alternate life stages as broods<strong>to</strong>ck,<br />
target numbers; including best use <strong>of</strong> <strong>the</strong> captive reared line, effective population size<br />
and minimizing domestication effects. Task 12.1.2 (p38) is a related task that<br />
specifically addresses <strong>the</strong> use <strong>of</strong> hatchery versus wild returns. Broods<strong>to</strong>ck<br />
requirements are based on how many and what products are needed <strong>for</strong> s<strong>to</strong>cking and<br />
hatchery capacities. Task 13.2.1 (p41) is <strong>the</strong> development <strong>of</strong> an integrated s<strong>to</strong>cking<br />
adaptive management plan. This plan will develop an integrated s<strong>to</strong>cking strategy that<br />
will maximize <strong>the</strong> benefit <strong>of</strong> each life stage being s<strong>to</strong>cked with <strong>the</strong> goal <strong>of</strong> increase<br />
returns <strong>of</strong> adult salmon that are motivated <strong>to</strong> migrate <strong>to</strong>wards quality spawning habitat.<br />
Both tasks are closely related and will need <strong>to</strong> be developed concurrently.<br />
Alewives<br />
Comment: Disappointment was expressed that <strong>the</strong> State is not s<strong>to</strong>cking alewives in<br />
Fields Pond this year and would like <strong>to</strong> see fish s<strong>to</strong>cked <strong>the</strong>re as soon as possible.<br />
Response: NOAA and UM requested that DMR not s<strong>to</strong>ck Fields Pond, because <strong>the</strong>re is<br />
an ongoing study <strong>to</strong> assess natural (uns<strong>to</strong>cked) recolonization following removal <strong>of</strong> two<br />
downstream dams.<br />
Comment: Concern about what alewives would do <strong>to</strong> <strong>the</strong> fish present in ponds.<br />
Response: DEP, DIFW, and DMR conducted a 10-year study between 1987 and 1996<br />
<strong>to</strong> examine <strong>the</strong> impacts <strong>of</strong> s<strong>to</strong>cking alewives on existing fish populations in Lake<br />
George. The study encompassed a four-year period “be<strong>for</strong>e” alewife s<strong>to</strong>cking, a threeyear<br />
period “during” alewife s<strong>to</strong>cking, and a three-year period “after” alewife s<strong>to</strong>cking.<br />
None <strong>of</strong> <strong>the</strong> major (brown trout, smallmouth bass, chain pickerel, and white perch) or<br />
minor sportfish (brown bullhead, burbot, pumpkinseed sunfish, redbreast sunfish, and<br />
yellow perch) showed a difference in average length or weight when “be<strong>for</strong>e” and “after”<br />
periods were compared. The impact <strong>of</strong> alewife s<strong>to</strong>cking on smelt abundance was<br />
confounded by a commercial smelt fishery that occurred during study, and sampling<br />
methods that removed a large number <strong>of</strong> pre-spawn smelt in <strong>the</strong> “be<strong>for</strong>e” period.<br />
However, young-<strong>of</strong>-year smelt grew significantly faster “during” alewife s<strong>to</strong>cking.<br />
Comment: Concerns over early mortality syndrome in salmonids due <strong>to</strong> thiamine in east<br />
coast alewives.<br />
PRFP Page 331
Response: Early mortality syndrome (EMS) is a non-infectious disease, associated with<br />
low thiamine that affects lake trout and o<strong>the</strong>r salmonids. Most reports <strong>of</strong> EMS are from<br />
<strong>the</strong> Great Lakes and New York Finger Lakes, where native <strong>for</strong>age fish (e.g. emerald<br />
shiner) have declined and have been replaced by non-native land-locked alewife that<br />
can contain high levels <strong>of</strong> thiaminase, an enzyme that breaks down thiamine.<br />
Most <strong>of</strong> <strong>the</strong> studies from <strong>the</strong> Great Lakes stress that land-locked alewife are <strong>the</strong><br />
primary <strong>for</strong>age species <strong>of</strong> <strong>the</strong> salmonids that have exhibited EMS (Honeyfield et al.<br />
2005). In recent years a decline in <strong>the</strong> landlocked alewife abundance has resulted in a<br />
recovery <strong>of</strong> <strong>the</strong> wild lake trout population in some <strong>of</strong> <strong>the</strong> Great Lakes. An increased<br />
percentage <strong>of</strong> o<strong>the</strong>r <strong>for</strong>age species in <strong>the</strong> diet seems <strong>to</strong> <strong>of</strong>fset <strong>the</strong> effects <strong>of</strong> thiaminase<br />
in <strong>the</strong> alewives.<br />
Anadromous alewives are in lakes <strong>for</strong> only a portion <strong>of</strong> <strong>the</strong> year, May <strong>to</strong> Oc<strong>to</strong>ber.<br />
In Echo Lake, Maine, where landlocked alewives were introduced, alewives were<br />
seasonal food <strong>for</strong> landlocked Atlantic salmon, while smelt were eaten all year (Lackey<br />
1969, Speirs 1974). Thus, smelt not alewives were <strong>the</strong> primary <strong>for</strong>age species <strong>for</strong><br />
landlocked Atlantic salmon. This seasonality in <strong>the</strong> diets <strong>of</strong> landlocked salmon is, in part,<br />
because <strong>the</strong> two prey species inhabit different parts <strong>of</strong> lakes. In <strong>the</strong> summer months<br />
juvenile alewives are found above <strong>the</strong> <strong>the</strong>rmocline in <strong>the</strong> lit<strong>to</strong>ral and pelagic zones <strong>of</strong><br />
lakes (Lackey 1970). In <strong>the</strong>se months, juvenile and adult smelt migrate diurnally from<br />
deeper water in<strong>to</strong> <strong>the</strong> <strong>the</strong>rmocline <strong>to</strong> feed, making <strong>the</strong>m more available <strong>to</strong> salmon and<br />
lake trout that feed in or below <strong>the</strong> <strong>the</strong>rmocline.<br />
Most landlocked salmon fisheries in PN watershed lakes are supported by s<strong>to</strong>cking,<br />
not natural reproduction. During <strong>the</strong> period <strong>of</strong> sea-run alewife introductions in<strong>to</strong> Lake<br />
George no significant changes in <strong>the</strong> average size and weight <strong>of</strong> s<strong>to</strong>cked brown trout<br />
were observed.<br />
Honeyfield, D. C., J. P. Hinterkopf, J. D. Fitzsimons, D. E. Tillitt, J. L. Zajicek and S. B.<br />
Brown. 2005. Development <strong>of</strong> Thiamine Deficiencies and Early Mortality<br />
Syndrome in Lake Trout by Feeding Experimental and Feral Fish Diets<br />
Containing Thiaminase. Journal <strong>of</strong> Aquatic Animal Health 17: 4-12.<br />
Lackey, R.T. 1969. Food Interrelationships <strong>of</strong> Salmon, Trout, Alewives, and Smelt in a<br />
Maine Lake. Transactions <strong>of</strong> <strong>the</strong> American Fisheries Society. 98(4): 641–646.<br />
Lackey, R.T. 1970. Seasonal depth distribution <strong>of</strong> landlocked Salmon, Brook Trout,<br />
landlocked Alewives, and American Smelt in a small Lake. Journal Fisheries<br />
Research Board <strong>of</strong> Canada. 27(9): 1656–1660.<br />
Spiers, G.D. 1974. Food Habits <strong>of</strong> Landlocked Salmon and Brook Trout in a Maine Lake<br />
after Introduction <strong>of</strong> Landlocked Alewives. Transactions <strong>of</strong> <strong>the</strong> American<br />
Fisheries Society. 103(2): 396–399.<br />
Comment: How we will determine success at Howland and o<strong>the</strong>r lakes?<br />
Response: Success will be determined primarily by annual counts <strong>of</strong> returning adult<br />
alewife at Mil<strong>for</strong>d, West Enfield, Pumpkin Hill and Howland (6.1.4 on P10, P23), and<br />
secondarily by biweekly beach seine surveys <strong>for</strong> juvenile fish (6.1.6 on P10, P23).<br />
Counts at Howland may require special techniques (e.g. videotaping); if this is not<br />
feasible, alewife returns <strong>to</strong> may have <strong>to</strong> be moni<strong>to</strong>red at <strong>the</strong> appropriate lake outlet.<br />
PRFP Page 332
Comment: Several people requested that we better define <strong>the</strong> timetable <strong>for</strong> Schoodic,<br />
Seboeis, and Sebec and note Phase 2 and 3 timetables <strong>to</strong> clarify plans in <strong>the</strong> future.<br />
Response: DMR will use a three-phased approach <strong>for</strong> alewife res<strong>to</strong>ration with each<br />
phase potentially requiring up <strong>to</strong> 16 years <strong>of</strong> annual s<strong>to</strong>cking. Within <strong>the</strong>se broad<br />
categories, lakes will be prioritized based on previously described attributes. Lakes<br />
identified as Phase 1 in <strong>the</strong> <strong>Operational</strong> <strong>Plan</strong> remain unchanged. Phase 2 and Phase 3<br />
lakes will be s<strong>to</strong>cked using broods<strong>to</strong>ck collected at <strong>the</strong> Mil<strong>for</strong>d fishlift. Phase 3 lakes,<br />
which were cooperatively identified by DMR and DIFW, will be s<strong>to</strong>cked last, and some<br />
will require fur<strong>the</strong>r investigation be<strong>for</strong>e s<strong>to</strong>cking. Phase 3 waters include Cold Stream<br />
Pond, Upper Cold Stream Pond, Nica<strong>to</strong>us Lake, West Lake, Duck Lake, Gassabias<br />
Lake, Seboeis Lake, Schoodic Lake, Sebec Lake, Piper Pond, Upper Pond, and<br />
Pleasant Lake). Collectively <strong>the</strong>se lakes are <strong>the</strong> source water <strong>for</strong> a hatchery, support<br />
classic cold-water fisheries, are blocked <strong>to</strong> prevent spread <strong>of</strong> pike, or may be above<br />
his<strong>to</strong>rically impassable falls. The remaining lakes are included in Phase 2.<br />
Comment: A commenter recommends a reduction in <strong>the</strong> extent <strong>of</strong> Phase I alewife<br />
res<strong>to</strong>ration from 13 <strong>to</strong> 7 his<strong>to</strong>rical lakes (Chemo, Pushaw, Boyd, Little Pushaw, Mud,<br />
Saponac, and Madagascal), lakes <strong>to</strong> which <strong>the</strong>re is presently access without <strong>the</strong> need<br />
<strong>for</strong> passage through ei<strong>the</strong>r <strong>the</strong> Howland or West Enfield dams.<br />
Response: Phase I alewife lakes were purposely chosen <strong>to</strong> include his<strong>to</strong>rical habitat<br />
above <strong>the</strong> Howland, West Enfield, and Pumpkin Hill dams. Passage efficiency at <strong>the</strong>se<br />
dams needs <strong>to</strong> be assessed <strong>for</strong> multiple species, and improved if necessary. The most<br />
cost-effective approach is <strong>to</strong> test efficiency <strong>for</strong> all species in a limited time frame, and<br />
make improvements once that benefit all species. In addition, <strong>the</strong> Settlement<br />
Agreement provides <strong>for</strong> a 15-year period after <strong>the</strong> Mil<strong>for</strong>d fishlift becomes operational<br />
<strong>for</strong> effectiveness testing <strong>of</strong> <strong>the</strong> Howland bypass.<br />
Comment: NOAA and USFWS comments on alewife res<strong>to</strong>ration concern <strong>the</strong> source <strong>of</strong><br />
broods<strong>to</strong>ck <strong>to</strong> be used. USFWS recommends that <strong>the</strong> <strong>Plan</strong> states that: 1) a priority is<br />
placed on using in-basin broods<strong>to</strong>ck sources <strong>for</strong> alewives <strong>to</strong> <strong>the</strong> greatest extent<br />
possible; 2) if it is determined that out-<strong>of</strong>-basin broods<strong>to</strong>ck sources are necessary,<br />
follow <strong>the</strong> “next nearest neighbor concept” in selecting sources <strong>of</strong> fish <strong>to</strong> s<strong>to</strong>ck <strong>the</strong><br />
Penobscot, and 3) that waterbodies that are initially s<strong>to</strong>cked with in-basin fish should be<br />
limited <strong>to</strong> <strong>the</strong> use <strong>of</strong> those same in-basin sources. In a case where <strong>the</strong> in-basin source<br />
is not large enough <strong>to</strong> fully meet <strong>the</strong> s<strong>to</strong>cking requirement, <strong>the</strong>n in-basin sources should<br />
be used first; o<strong>the</strong>r sources could <strong>the</strong>n be used <strong>to</strong> meet <strong>the</strong> remaining fish requirement.<br />
NOAA recommends inclusion <strong>of</strong> <strong>the</strong> decision process <strong>for</strong> assessing feasibility <strong>of</strong><br />
different broods<strong>to</strong>ck sources.<br />
Response: DMR’s experience is that successful alewife res<strong>to</strong>ration does not require inbasin<br />
or next-nearest-neighbor sources <strong>of</strong> broods<strong>to</strong>ck. For example, <strong>the</strong> large alewife<br />
population (>1.3 million in 2009) on <strong>the</strong> Sebasticook River was res<strong>to</strong>red using<br />
Androscoggin River broods<strong>to</strong>ck, which was res<strong>to</strong>red using Royal River broods<strong>to</strong>ck,<br />
which was s<strong>to</strong>cked with fish from <strong>the</strong> Damariscotta River. However, we have stated our<br />
willingness <strong>to</strong> use in-basin broods<strong>to</strong>ck as a first option and next-nearest-neighbor<br />
broods<strong>to</strong>ck as a second option if certain conditions are met. The conditions are: 1) on<br />
<strong>the</strong> basis <strong>of</strong> existing in<strong>for</strong>mation DMR, NOAA, and USFWS determine that a donor<br />
PRFP Page 333
population can provide 97,500 alewife annually <strong>for</strong> up <strong>to</strong> 16 years without harm <strong>to</strong> <strong>the</strong><br />
donor population; 2) new funding is available <strong>for</strong> constructing or upgrading a trappingsorting<br />
facility <strong>for</strong> safely obtaining <strong>the</strong> broods<strong>to</strong>ck, and this facility must be operational<br />
by May 1, 2011 at <strong>the</strong> latest; 3) new funding is available <strong>for</strong> trucks and staff <strong>to</strong> carry out<br />
s<strong>to</strong>cking beginning May 1, 2011 at <strong>the</strong> latest; and 5) if broods<strong>to</strong>ck are obtained from a<br />
<strong>to</strong>wn with fishing rights <strong>the</strong> <strong>to</strong>wn must be reimbursed <strong>for</strong> lost revenue. As we have<br />
previously stated, if s<strong>to</strong>cking must be done with existing staff and equipment dedicated<br />
<strong>to</strong> <strong>the</strong> Kennebec and Androscoggin res<strong>to</strong>ration projects, fiscal and programmatic<br />
constraints dictate <strong>the</strong> use <strong>of</strong> broods<strong>to</strong>ck from those two rivers.<br />
Comment: If exogenous fish s<strong>to</strong>cks are used during Phase 1, what would <strong>the</strong> target<br />
count at <strong>the</strong> Mil<strong>for</strong>d Project fishway <strong>for</strong> deciding when Phase 1 s<strong>to</strong>cking would switch<br />
from an exogenous source <strong>to</strong> an in-basin source?<br />
Response: Target <strong>for</strong> switch is ~532,000.<br />
Comment: A cost should be estimated <strong>for</strong> developing in-basin trapping facilities at<br />
Souadabscook Stream and <strong>the</strong> Orland River <strong>for</strong> alewife as part <strong>of</strong> work item number<br />
7.1.2.<br />
Response: Work item (s/b) 6.1.2 is <strong>to</strong> develop cost estimates, which will require<br />
engineer <strong>to</strong> review sites.<br />
Shad<br />
Comment: A commenter recommends reducing <strong>the</strong> extent <strong>of</strong> Group I river reaches <strong>for</strong><br />
shad res<strong>to</strong>ration <strong>to</strong> “Mil<strong>for</strong>d Dam <strong>to</strong> West Enfield dam”, and “Passadumkeag mouth <strong>to</strong><br />
Lowell Dam”.<br />
Response: Phase I shad habitat was purposely chosen <strong>to</strong> include his<strong>to</strong>rical habitat<br />
above <strong>the</strong> Howland, West Enfield, and Pumpkin Hill dams. Passage efficiency at <strong>the</strong>se<br />
dams needs <strong>to</strong> be assessed <strong>for</strong> multiple species, and improved if necessary. The most<br />
cost-effective approach is <strong>to</strong> test efficiency <strong>for</strong> all species in a limited time frame, and<br />
make improvements once that benefit all species. In addition, <strong>the</strong> Settlement<br />
Agreement provides <strong>for</strong> a 15-year period after <strong>the</strong> Mil<strong>for</strong>d fishlift becomes operational<br />
<strong>for</strong> effectiveness testing <strong>of</strong> <strong>the</strong> Howland bypass.<br />
Comment: Collectively, NOAA and USFWS recommendations regarding shad<br />
res<strong>to</strong>ration include 1) delaying action until <strong>the</strong> number <strong>of</strong> shad returning <strong>to</strong> Mil<strong>for</strong>d has<br />
been evaluated <strong>for</strong> 2-3 years, 2) developing an adaptive management plan or decision<br />
tree that would determine management alternatives (natural recolonization vs. hatchery<br />
supplementation using in-basin broods<strong>to</strong>ck vs. hatchery supplementation using out-<strong>of</strong>basin<br />
broods<strong>to</strong>ck) based on thresholds <strong>of</strong> fish captured in <strong>the</strong> Mil<strong>for</strong>d fishway, and 3)<br />
developing a S<strong>to</strong>cking Management <strong>Plan</strong> or a Broods<strong>to</strong>ck Management <strong>Plan</strong>.<br />
Response: Nei<strong>the</strong>r NOAA nor USFWS has criticized DMR’s objective <strong>of</strong> res<strong>to</strong>ring shad<br />
<strong>to</strong> his<strong>to</strong>rical habitat and abundance in 40-50 years nor have <strong>the</strong>y criticized our estimates<br />
<strong>of</strong> abundance, so DMR will continue <strong>to</strong> use <strong>the</strong>se targets. DMR developed two models<br />
<strong>to</strong> explore scenarios that were likely <strong>to</strong> achieve res<strong>to</strong>ration in <strong>the</strong> 40-50 year time frame<br />
(8-10 shad generations). These models are simple, because <strong>the</strong>re is a paucity <strong>of</strong><br />
demographic data <strong>for</strong> shad. The first model explores <strong>the</strong> possibility <strong>of</strong> achieving <strong>the</strong><br />
PRFP Page 334
es<strong>to</strong>ration objective by natural recolonization; it uses a range <strong>of</strong> starting population<br />
sizes and intrinsic rates <strong>of</strong> increase from one generation <strong>to</strong> <strong>the</strong> next (Table 1). The<br />
model indicates that achieving Measure 7.1 (633,300 adult shad returns in 35-40 years)<br />
by natural recolonization would require ei<strong>the</strong>r a very high rate <strong>of</strong> increase <strong>for</strong> a<br />
prolonged period or a very large starting population. For example, this target could be<br />
reached with a starting population <strong>of</strong> 2500-5000 fish that on average doubled in<br />
abundance every five years. This level <strong>of</strong> reproduction might be expected in bacteria,<br />
but not in shad. If <strong>the</strong> rate <strong>of</strong> reproduction is reduced <strong>to</strong> 1.5 or 1.25, <strong>the</strong> size <strong>of</strong> <strong>the</strong><br />
starting population would have <strong>to</strong> be 40,000 <strong>to</strong> 135,000 fish. DMR is not aware <strong>of</strong> shad<br />
populations in Maine or elsewhere that consistently are achieving <strong>the</strong>se levels <strong>of</strong><br />
reproduction; remnant populations on <strong>the</strong> east coast that have been greater than about<br />
1000 fish; or any large river res<strong>to</strong>ration that has been accomplished by natural<br />
recolonization. DMR has concluded that reliance on natural recolonization is not a valid<br />
management strategy.<br />
DMR next modeled res<strong>to</strong>ration at two fry s<strong>to</strong>cking levels (Table 2). The model<br />
assumes one adult return <strong>for</strong> each 318 hatchery fry released and 100 adult returns <strong>for</strong><br />
each 86 spawning adults (reproduction rate = 1.1627907) based on data presented in<br />
<strong>Res<strong>to</strong>ration</strong> <strong>of</strong> American Shad <strong>to</strong> <strong>the</strong> Susquehanna River: Annual Progress Report<br />
2000. For simplicity <strong>the</strong> model assumes a starting population <strong>of</strong> 0 and no repeat<br />
spawning. While re<strong>for</strong>matting <strong>the</strong> model <strong>for</strong> presentation, DMR discovered an error in<br />
its original calculations. The corrected model indicates that fry s<strong>to</strong>cking would have <strong>to</strong><br />
continue <strong>for</strong> a longer period <strong>of</strong> time than originally reported, and that <strong>the</strong> higher s<strong>to</strong>cking<br />
rates are needed <strong>to</strong> achieve <strong>the</strong> shad res<strong>to</strong>ration objective.<br />
DMR considered <strong>the</strong> consequences <strong>of</strong> <strong>the</strong> recommendation made by USFWS and<br />
NOAA <strong>to</strong> delay an active res<strong>to</strong>ration program. Delaying activity <strong>for</strong> at least five years<br />
would make it more difficult <strong>to</strong> reach <strong>the</strong> achievable population target <strong>of</strong> 633,000 fish in<br />
50 years. There is no guarantee that <strong>the</strong> private Waldoboro Hatchery would be<br />
available <strong>to</strong> produce shad after a five-year hiatus, and <strong>the</strong>re currently are no o<strong>the</strong>r<br />
hatcheries in New England with <strong>the</strong> capacity or capability <strong>of</strong> producing 12 million shad<br />
fry. In addition, <strong>the</strong> proposed schedule <strong>for</strong> testing passage effectiveness at mainstem<br />
dams <strong>for</strong> multiple species and making improvements at a single time would be<br />
jeopardized. DMR has determined that delaying active res<strong>to</strong>ration carries <strong>to</strong>o great a<br />
risk <strong>for</strong> <strong>the</strong> res<strong>to</strong>ration.<br />
The State and federal agencies have not come <strong>to</strong> agreement about <strong>the</strong> source <strong>of</strong><br />
broods<strong>to</strong>ck that would be used <strong>to</strong> produce hatchery-reared fry. Potential sources <strong>of</strong><br />
1200 adult shad remain as limited as <strong>the</strong>y were when <strong>the</strong> Strategic <strong>Plan</strong> <strong>to</strong> Res<strong>to</strong>re<br />
American Shad (Alosa sapidissima) <strong>to</strong> <strong>the</strong> Penobscot River, Maine was completed in<br />
2001. NOAA has recommended an extensive comparison <strong>of</strong> biological characteristics<br />
(e.g. degree <strong>of</strong> iteroparity, age at maturity, duration <strong>of</strong> freshwater rearing, migration<br />
distance <strong>to</strong> spawning ground) <strong>of</strong> s<strong>to</strong>cks within 500 miles <strong>of</strong> <strong>the</strong> Penobscot. We believe<br />
this recommendation is unrealistic. DMR’s experience is that minimum mortality occurs<br />
if <strong>to</strong>tal transport time <strong>of</strong> adult shad broods<strong>to</strong>ck is 3 hours or less, and that mortality<br />
significantly increases, especially <strong>for</strong> large females, when <strong>to</strong>tal transport time is 5 hours<br />
or more. The <strong>Operational</strong> <strong>Plan</strong> compares potential broods<strong>to</strong>ck sources in <strong>the</strong> Gulf <strong>of</strong><br />
Maine with a maximum transport time <strong>of</strong> 5 hours (Table 3). The Merrimack is <strong>the</strong> only<br />
population that can provide sufficient broods<strong>to</strong>ck with certainty.<br />
PRFP Page 335
DMR proposes <strong>to</strong> expand <strong>the</strong> Waldoboro shad hatchery and initiate a fry-s<strong>to</strong>cking<br />
program on <strong>the</strong> Penobscot using broods<strong>to</strong>ck from <strong>the</strong> Merrimack. DMR proposes <strong>to</strong><br />
s<strong>to</strong>ck <strong>the</strong> fry above Howland, so <strong>the</strong> bypass can be assessed. When sufficient shad<br />
returns (1200) are captured at Mil<strong>for</strong>d <strong>the</strong>y can be used as broods<strong>to</strong>ck.<br />
Table 1. Results <strong>of</strong> natural recolonization model.<br />
Generational expansion rate = 2 Generational expansion rate = 1.5<br />
Year Population 1 Population 2 Population 4 Year Population 1 Population 2 Population 3 Population 4<br />
1 1,000 2,500 5,000 1 1,000 2,500 5,000 40,000<br />
6 2,000 5,000 10,000 6 1,500 3,750 7,500 60,000<br />
11 4,000 10,000 20,000 11 2,250 5,625 11,250 90,000<br />
16 8,000 20,000 40,000 16 3,375 8,438 16,875 135,000<br />
21 16,000 40,000 80,000 21 5,063 12,656 25,313 202,500<br />
26 32,000 80,000 160,000 26 7,594 18,984 37,969 303,750<br />
31 64,000 160,000 320,000 31 11,391 28,477 56,953 455,625<br />
36 128,000 320,000 640,000 36 17,086 42,715 85,430 683,438<br />
41 256,000 640,000 1,280,000 41 25,629 64,072 128,145 1,025,156<br />
46 512,000 1,280,000 2,560,000 46 38,443 96,108 192,217 1,537,734<br />
51 1,024,000 2,560,000 51 57,665 144,163 288,325 2,306,602<br />
56 2,048,000 56 86,498 216,244 432,488 3,459,902<br />
Generational expansion rate = 1.25 Generational expansion rate = 1.16<br />
Year Population 1 Population 2 Population 3 Year Population 1 Population 2 Population 3 Population 4<br />
1 1,000 2,500 135,000 1 1,000 2,500 135,000 225,000<br />
6 1,250 3,125 168,750 6 1,163 2,907 156,977 261,628<br />
11 1,563 3,906 210,938 11 1,352 3,380 182,531 304,218<br />
16 1,953 4,883 263,672 16 1,572 3,930 212,245 353,742<br />
21 2,441 6,104 329,590 21 1,828 4,570 246,797 411,328<br />
26 3,052 7,629 411,987 26 2,126 5,314 286,973 478,289<br />
31 3,815 9,537 514,984 31 2,472 6,179 333,690 556,150<br />
36 4,768 11,921 643,730 36 2,874 7,185 388,012 646,686<br />
41 5,960 14,901 804,663 41 3,342 8,355 451,176 751,960<br />
46 7,451 18,626 1,005,828 46 3,886 9,715 524,623 874,372<br />
51 9,313 23,283 1,257,285 51 4,519 11,297 610,027 1,016,712<br />
56 11,642 29,104 1,571,607 56 5,254 13,136 709,334 1,182,223<br />
Measure 7.1: 633,300 adult shad returns in 35-40 years<br />
PRFP Page 336
Table 2. Results <strong>of</strong> fry s<strong>to</strong>cking model.<br />
318 fry <strong>to</strong> adult 1.162790698 generational reproductive rate<br />
Fry s<strong>to</strong>cking years<br />
Return<br />
Annual<br />
adult<br />
years returns Y1-5 Y6-10 Y11-15 Y16-20 Y21-25 Y26-30 Y31-35 Y36-40 Y41-45 Y46-51<br />
6,000,000 6,000,000 6,000,000 6,000,000 6,000,000 6,000,000 6,000,000 6,000,000 6,000,000 6,000,000<br />
Y6-10 18,868 18,868<br />
Y11-15 40,807 21,939 18,868<br />
Y16-20 66,318 25,511 21,939 18,868<br />
Y21-25 95,982 29,664 25,511 21,939 18,868<br />
Y26-30 130,475 34,493 29,664 25,511 21,939 18,868<br />
Y31-35 170,583 40,108 34,493 29,664 25,511 21,939 18,868<br />
Y36-40 217,221 46,637 40,108 34,493 29,664 25,511 21,939 18,868<br />
Y41-45 271,450 54,229 46,637 40,108 34,493 29,664 25,511 21,939 18,868<br />
Y46-50 334,508 63,057 54,229 46,637 40,108 34,493 29,664 25,511 21,939 18,868<br />
Y51-55 407,830 73,323 63,057 54,229 46,637 40,108 34,493 29,664 25,511 21,939 18,868<br />
Y56-60 474,221 85,259 73,323 63,057 54,229 46,637 40,108 34,493 29,664 25,511 21,939<br />
Y61-65 551,420 99,138 85,259 73,323 63,057 54,229 46,637 40,108 34,493 29,664 25,511<br />
Y66 641,186 115,277 99,138 85,259 73,323 63,057 54,229 46,637 40,108 34,493 29,664<br />
Return<br />
years<br />
Fry s<strong>to</strong>cking years<br />
Annual<br />
adult<br />
returns Y1-5 Y6-10 Y11-15 Y16-20 Y21-25 Y26-30 Y31-35 Y36-40 Y41-45 Y46-51<br />
12,000,000 12,000,000 12,000,000 12,000,000 12,000,000 12,000,000 12,000,000 12,000,000 12,000,000 12,000,000<br />
Y6-10 37,736 37,736<br />
Y11-15 81,615 43,879 37,736<br />
Y16-20 132,637 51,022 43,879 37,736<br />
Y21-25 191,965 59,328 51,022 43,879 37,736<br />
Y26-30 260,950 68,986 59,328 51,022 43,879 37,736<br />
Y31-35 341,167 80,216 68,986 59,328 51,022 43,879 37,736<br />
Y36-40 434,441 93,275 80,216 68,986 59,328 51,022 43,879 37,736<br />
Y41-45 542,900 108,459 93,275 80,216 68,986 59,328 51,022 43,879 37,736<br />
Y46-50 669,015 126,115 108,459 93,275 80,216 68,986 59,328 51,022 43,879 37,736<br />
Table 3. Nearest potential sources <strong>of</strong> American shad broods<strong>to</strong>ck.<br />
River system Distance Status <strong>of</strong> run<br />
Penobscot 0 mi Size unknown, not easily captured<br />
Narraguagus 100 adults in 2008<br />
Kennebec/Androscoggin 58 mi Size unknown, ongoing res<strong>to</strong>ration, not easily<br />
captured<br />
Saco 93 mi ~1200 adults, ongoing res<strong>to</strong>ration, capture at<br />
fishlift<br />
Merrimack 125 mi ~29,000 in 2008, ongoing res<strong>to</strong>ration, capture at<br />
fishlift<br />
St. John 179 mi Less than 1000 in 28 <strong>of</strong> 29 years from 1974-2002<br />
O<strong>the</strong>r <strong>Diadromous</strong> Fish<br />
Comment: There is a need <strong>to</strong> s<strong>to</strong>p <strong>the</strong> commercial fishing <strong>for</strong> lamprey and perhaps eels.<br />
Response: DMR is not aware <strong>of</strong> any commercial harvest <strong>for</strong> lamprey in <strong>the</strong> Penobscot<br />
drainage. Eel harvest in <strong>the</strong> entire State is a very small percentage <strong>of</strong> <strong>to</strong>tal east coast<br />
harvest, and would require a legislative change.<br />
Comment: Has DMR considered o<strong>the</strong>r species like sea run white perch?<br />
Response: We believe all diadromous species are addressed in <strong>the</strong> plan. Bigelow and<br />
Schroeder note that white perch are not anadromous in <strong>the</strong> Gulf <strong>of</strong> Maine, and <strong>the</strong>y<br />
have never been caught in our beach seine surveys in <strong>the</strong> lower river.<br />
PRFP Page 337
Salmon<br />
Comment: There are advocates <strong>of</strong> active Atlantic salmon res<strong>to</strong>ration and would like it <strong>to</strong><br />
be speeded up <strong>to</strong> 10 years ra<strong>the</strong>r than 40.<br />
Response: Ten years encompasses only two Atlantic salmon generations<br />
(approximately 5 years per generation). This time frame is far <strong>to</strong>o short <strong>for</strong> 1) a<br />
sustained population response, and 2) <strong>to</strong> implement management actions and adjust as<br />
<strong>the</strong> actions are ei<strong>the</strong>r successful or unsuccessful. Fur<strong>the</strong>rmore, longer time frames are<br />
necessary when habitat improvements are needed <strong>for</strong> res<strong>to</strong>ration. However, <strong>the</strong> plan is<br />
<strong>to</strong> res<strong>to</strong>re sections <strong>of</strong> <strong>the</strong> basin over time: this may result in important sections <strong>of</strong> <strong>the</strong><br />
basin res<strong>to</strong>red over a much shorter time frame. The 40 year time table is aggressive,<br />
but allows time <strong>to</strong> test management strategies and improve management. It also allows<br />
time <strong>for</strong> habitat improvements <strong>to</strong> occur and have an effect on <strong>the</strong> ecosystem. Finally,<br />
with limited resources, all possible actions cannot be per<strong>for</strong>med everywhere; <strong>the</strong>re<strong>for</strong>e a<br />
phased approach over time is necessary. This timeline is intended <strong>to</strong> in<strong>for</strong>m managers<br />
as <strong>to</strong> how <strong>to</strong> structure recovery actions over space and time, and <strong>to</strong> assess progress<br />
<strong>to</strong>wards recovery objectives. It does not preclude faster recovery, but does provide a<br />
yardstick by which <strong>to</strong> measure our progress.<br />
Comment: A commenter recommended more use <strong>of</strong> instream hatcheries <strong>for</strong> salmon.<br />
Response: The objective <strong>of</strong> salmon res<strong>to</strong>ration is <strong>to</strong> establish a self-sustaining salmon<br />
population. This operational plan was developed <strong>to</strong> maximize <strong>the</strong> benefit from<br />
hatcheries within <strong>the</strong> constraints <strong>of</strong> <strong>the</strong> current salmon program. Ultimately, hatcheries<br />
would not be needed. With that said, in basin hatcheries would provide many benefits<br />
<strong>to</strong> <strong>the</strong> salmon program. For example, timing <strong>of</strong> hatching and emergence would be<br />
synchronized with natural production in <strong>the</strong> River. However, It is likely that <strong>the</strong> hatchery<br />
environment itself is a bigger fac<strong>to</strong>r than location.<br />
Comment: Predation by cormorants and seals is not addressed in <strong>the</strong> plan.<br />
Response: Predation <strong>of</strong> salmon by cormorants and seals is an issue that we are<br />
concerned about. One hypo<strong>the</strong>sis is that by res<strong>to</strong>ring o<strong>the</strong>r diadromous species such<br />
as alewife, blueback herring, and shad, preda<strong>to</strong>rs will have an alternative prey base.<br />
Thus, providing a “prey buffer” <strong>for</strong> salmon as well as, trout and smallmouth bass. One<br />
unknown is <strong>the</strong> possibility <strong>of</strong> a numerical response, an increase in <strong>the</strong> abundance <strong>of</strong> a<br />
preda<strong>to</strong>r species. If food resources are <strong>the</strong> limiting fac<strong>to</strong>r <strong>for</strong> a preda<strong>to</strong>r species, we<br />
would expect an increase in <strong>the</strong>ir population. However, if ano<strong>the</strong>r fac<strong>to</strong>r is limiting <strong>the</strong>ir<br />
abundance, such as roosting sites, <strong>the</strong>n an increase in <strong>the</strong>ir <strong>for</strong>age base would not<br />
result in a numerical response.<br />
Comment: Several people expressed skepticism <strong>of</strong> <strong>the</strong> fry s<strong>to</strong>cking program.<br />
Response: Currently, <strong>the</strong> salmon program is geared <strong>to</strong>wards fry s<strong>to</strong>cking and smolt<br />
production. There is limited ability <strong>to</strong> change that in <strong>the</strong> near-term. However, <strong>the</strong>re are<br />
several tasks in <strong>the</strong> operational plan that are directly and indirectly related <strong>to</strong> fry<br />
s<strong>to</strong>cking and freshwater production. Task 12.1.1 (p37) <strong>the</strong> development <strong>of</strong> a<br />
Broods<strong>to</strong>ck Management <strong>Plan</strong> will outline a strategy <strong>for</strong> <strong>the</strong> disposition <strong>of</strong> adult returns.<br />
The primary objective <strong>of</strong> <strong>the</strong> management plan is <strong>to</strong> increase adult escapement. By<br />
PRFP Page 338
increasing escapement and increasing natural spawning we hope <strong>to</strong> reduce <strong>the</strong><br />
emphasis on fry s<strong>to</strong>cking <strong>to</strong> populate freshwater habitat. An additional series <strong>of</strong> tasks<br />
are designed <strong>to</strong> evaluate all aspects <strong>of</strong> s<strong>to</strong>cking, from which products are s<strong>to</strong>cked <strong>to</strong><br />
when, where, and how many <strong>of</strong> each are s<strong>to</strong>cked. Currently, we know that <strong>the</strong> best<br />
adult return rates are from s<strong>to</strong>ck smolts. However, fry s<strong>to</strong>cking has not been evaluated<br />
successfully <strong>to</strong> returning adults. We are not able <strong>to</strong> distinguish between wild salmon<br />
and those s<strong>to</strong>cked as fry. Fur<strong>the</strong>rmore, no s<strong>to</strong>cking ef<strong>for</strong>t has been assessed <strong>for</strong><br />
lifetime fitness, which is <strong>the</strong> critical measure <strong>of</strong> a s<strong>to</strong>cking program geared <strong>to</strong><br />
res<strong>to</strong>ration. S<strong>to</strong>cked smolt may not produce successful adult spawners in <strong>the</strong> wild. This<br />
operational plan incorporates an adaptive management approach that will facility<br />
changes in hatchery production <strong>to</strong> that increase adult escapement and increase<br />
freshwater production. In <strong>the</strong> future, that may or may not include a fry s<strong>to</strong>cking<br />
program. With that said, this operational plan, with a lifespan <strong>of</strong> five years, was<br />
developed <strong>to</strong> maximizing <strong>the</strong> benefit from hatchery products within <strong>the</strong> boundaries <strong>of</strong> <strong>the</strong><br />
current salmon program.<br />
Comment: The Service, NOAA-Fisheries and <strong>the</strong> State <strong>of</strong> Maine are currently working<br />
on an Atlantic salmon recovery framework, which is not yet completed. The <strong>Plan</strong>’s<br />
operational objectives will need <strong>to</strong> align with this framework so <strong>the</strong> <strong>Plan</strong> will have <strong>to</strong><br />
have some provision <strong>to</strong> modify <strong>the</strong> objectives <strong>to</strong> be consistent with <strong>the</strong> framework.<br />
Response: In introduc<strong>to</strong>ry material we highlight <strong>the</strong> importance <strong>of</strong> <strong>the</strong> framework and in<br />
Section 5 <strong>the</strong>re are two tasks that clearly indicate <strong>the</strong> plan will be integrated with<br />
regional and local management groups. [1: Participate in regional fisheries management<br />
and assessment ef<strong>for</strong>ts at both administrative and scientific levels and 5: Work closely<br />
with <strong>the</strong> Atlantic salmon Action Teams.] We could not delay this plan until <strong>the</strong><br />
framework was completed. However, we believe that <strong>the</strong> operational objectives are<br />
consistent with objectives discussed during <strong>the</strong> framework process. The priority <strong>of</strong> <strong>the</strong><br />
objectives is likely what will be affected as <strong>the</strong> framework is used <strong>to</strong> develop portfolios.<br />
Comment: Since Atlantic Salmon can navigate beyond <strong>the</strong> exclusion devises at <strong>the</strong><br />
West Enfield and Howland Dams, why would you authorize <strong>the</strong> removal <strong>of</strong> exclusion<br />
devices at both <strong>of</strong> <strong>the</strong>se dams be<strong>for</strong>e passage by o<strong>the</strong>r target species is required at<br />
ei<strong>the</strong>r dam?<br />
Response: There is currently no plan <strong>to</strong> remove <strong>the</strong> hydraulic barrier at <strong>the</strong> Howland<br />
and West Enfield Projects until it is necessary <strong>for</strong> res<strong>to</strong>ration. For example, <strong>the</strong> state<br />
would not consider removing <strong>the</strong> West Enfield barrier until adult shad or river herring<br />
return <strong>to</strong> <strong>the</strong> site. However, <strong>the</strong> U.S. Fish and Wildlife Service and NOAA-Fisheries<br />
may require an assessment <strong>of</strong> <strong>the</strong> barrier <strong>for</strong> Atlantic salmon under <strong>the</strong> Endangered<br />
Species Act. Based on this assessment, <strong>the</strong> Services may request changes <strong>to</strong> <strong>the</strong><br />
barrier if it delays or impedes <strong>the</strong> upstream migration <strong>of</strong> salmon.<br />
Section 2 - Connectivity<br />
Comment: It was suggested that an MOU between IFW and DMR <strong>to</strong> agree upon<br />
species dispositions at dams be completed be<strong>for</strong>e <strong>the</strong> plan is finalized.<br />
Response: DMR and IFW will develop and sign a MOU <strong>to</strong> identify <strong>the</strong> disposition <strong>of</strong> nonnative<br />
species that will be revisited annually.<br />
PRFP Page 339
Table 4. Species disposition<br />
Species put back<br />
Species passed<br />
Species <strong>to</strong> be removed<br />
downriver<br />
upriver<br />
Nor<strong>the</strong>rn pike None identified at this time Native inland species<br />
Largemouth bass Atlantic salmon<br />
Central mud minnow alewife<br />
Black Crappie blueback herring<br />
Green Sunfish American shad<br />
Brown trout striped bass<br />
Rainbow trout sea lamprey<br />
Splake<br />
O<strong>the</strong>r non-native / exotic new<br />
American eel<br />
species<br />
Chain pickerel<br />
Smallmouth bass<br />
Comment: Objective 16.0 identifies a 90 percent efficiency or higher at fish passage<br />
facilities <strong>for</strong> mainstem dams within 10 years <strong>to</strong> ensure diadromous fish conservation.<br />
The Service prefers not <strong>to</strong> prescribe passage efficiencies at fishways and are not able<br />
<strong>to</strong> support a per<strong>for</strong>mance stand <strong>of</strong> 90 percent.<br />
Response: DMR fully understands <strong>the</strong> Service’s rationale, as it is extremely difficult <strong>to</strong><br />
pinpoint efficiency <strong>of</strong> passage facilities. There are whole suites <strong>of</strong> fac<strong>to</strong>rs that can affect<br />
passage including discharge, water temperature, timing <strong>of</strong> arrival at <strong>the</strong> facility, location<br />
<strong>of</strong> <strong>the</strong> facility, <strong>the</strong> number <strong>of</strong> facilities, etc. The comment seems peculiar at this time<br />
since <strong>the</strong> Service was a signa<strong>to</strong>ry <strong>to</strong> two recent settlement agreements (Madison Paper<br />
and Saco) where 80% (interim facilities) and 90% (permanent facilities) passage<br />
efficiencies were included as per<strong>for</strong>mance standards and, <strong>to</strong> my knowledge, <strong>the</strong> Service<br />
did not object <strong>to</strong> <strong>the</strong>ir inclusion. Part <strong>of</strong> <strong>the</strong> difficulty with passage is <strong>the</strong> ambiguity in<br />
“safe, timely, and effective”. There is no ‘black and white’ in <strong>the</strong> sense that a facility<br />
needs <strong>to</strong> per<strong>for</strong>m at a standard and if it does not, alternatives need <strong>to</strong> be pursued. For<br />
example, a passage facility is “safe” if target species pass without injury or death no<br />
matter how long <strong>the</strong>y take <strong>to</strong> pass; is “effective” if target species pass <strong>the</strong> facility<br />
whe<strong>the</strong>r <strong>the</strong>y pass immediately upon approach <strong>to</strong> <strong>the</strong> facility or three months after<br />
approach since <strong>the</strong> desired result (passage) was achieved; <strong>the</strong> key is “timely” but even<br />
<strong>the</strong> language above – “without detrimental delay” – is vague. When does delay become<br />
detrimental? We will revise <strong>the</strong> narrative and objectives accordingly and discuss <strong>the</strong><br />
substitution <strong>of</strong> “safe, timely, and effective” <strong>for</strong> efficiency standards.<br />
Section 3 – Habitat<br />
Comment: A commenter urged us <strong>to</strong> include changes <strong>to</strong> regulations that allow pollution<br />
and sprawl <strong>to</strong> occur.<br />
Response: DEP, DOT, and SPO are <strong>the</strong> State agencies that have <strong>the</strong> statu<strong>to</strong>ry authority<br />
<strong>to</strong> address <strong>the</strong>se issues. We are recommending that we continue <strong>to</strong> work with <strong>the</strong>se<br />
agencies in Objective 29.<br />
Comment: Use references suggested by SHARE in <strong>the</strong> Habitat Section.<br />
Response: We will incorporate <strong>the</strong> SHARE references in<strong>to</strong> <strong>the</strong> document.<br />
PRFP Page 340
Section 4 - Non-Native/Nor<strong>the</strong>rn Pike<br />
Comment: Several people suggested that <strong>the</strong> closest fish <strong>to</strong> compare Nor<strong>the</strong>rn pike <strong>to</strong><br />
is chain pickerel ra<strong>the</strong>r than muskies, which are a riverine fish.<br />
Response: Chain pickerel and nor<strong>the</strong>rn pike have many life his<strong>to</strong>ry similarities, however<br />
one must be careful about using pickerel as a surrogate <strong>for</strong> nor<strong>the</strong>rn pike. The chain<br />
pickerel has a higher optimal temperature (prefer warmer water) than <strong>the</strong> nor<strong>the</strong>rn pike,<br />
which is clearly indicated by <strong>the</strong>ir more sou<strong>the</strong>rn distributional range. A water body with<br />
pickerel may not support nor<strong>the</strong>rn pike at <strong>the</strong> same densities or even at all if it is <strong>to</strong>o<br />
warm. Adult nor<strong>the</strong>rn pike are also known <strong>to</strong> be more flexible with <strong>for</strong>aging habitat,<br />
since <strong>the</strong>y are larger, have a larger relative gape size compared <strong>to</strong> chain pickerel and<br />
can be found in deeper, less vegetated areas.<br />
Comment: The non-native species focused <strong>to</strong>o much on pike, but <strong>the</strong> o<strong>the</strong>r species<br />
(such as large mouth bass) should be addressed more and would like <strong>to</strong> see <strong>the</strong>m all<br />
removed.<br />
Response: The State <strong>of</strong> Maine has developed an advisory list <strong>of</strong> over 80 invasive<br />
species that includes nor<strong>the</strong>rn pike, however <strong>the</strong> state has not gone as far as <strong>to</strong> include<br />
pike in a regula<strong>to</strong>ry definition <strong>of</strong> an invasive species as it has done with certain aquatic<br />
invasive plants. The state’s advisory list recommends selective control and<br />
management <strong>for</strong> nor<strong>the</strong>rn pike. This approach <strong>of</strong> selective control and management<br />
has also been used <strong>for</strong> o<strong>the</strong>r species, such as smallmouth bass. For example, <strong>the</strong><br />
Maine Department <strong>of</strong> Inland Fisheries and Wildlife manages smallmouth bass as a<br />
fishery in many Maine lakes and ponds, however it also works <strong>to</strong> limit <strong>the</strong>ir introduction<br />
through regulation, law en<strong>for</strong>cement and angler education. The Departments <strong>of</strong> Inland<br />
Fisheries and Wildlife and Marine Resources are working on a MOU <strong>to</strong> identify species<br />
that will be removed at Mil<strong>for</strong>d (see page 11). MDIFW maintains a list <strong>of</strong> waterbodies<br />
with non-native species (table 5 and 6).<br />
Table 5. Streams with non-native species<br />
Stream Name LMB PKL SMB CMM BNT<br />
Alamoosook Lake X<br />
Alder Stream X<br />
Babcock Brook X<br />
Baskahegan Lake X<br />
Baskahegan Stream X<br />
Bear Brook X<br />
Bear Brook-Little Pushaw Pond X<br />
Black Stream X<br />
Blackman Stream-Chemo Pond X X X<br />
Crooked Brook X<br />
Crossuntic Stream X<br />
East Branch Seboeis Stream X<br />
Ebhorse Stream X<br />
Finn Brook X<br />
Fish Stream X<br />
Hoyt Brook X<br />
PRFP Page 341
Kingsbury Pond X<br />
Long Pond X<br />
Long Pond X<br />
Lower Black Stream X<br />
Lower Kenduskeag Stream X<br />
Lower Marsh Stream X<br />
Lower Mattamiscontis Stream X<br />
Lower Mattawamkeag River X<br />
Lower Seboeis River X<br />
Lower Souadabscook Stream X<br />
Macwahoc Brook X<br />
Mattakeunk Stream X<br />
Middle Kenduskeag Stream X<br />
Middle Mattawamkeag River X<br />
Middle Passadumkeag River-Saponac Pond X<br />
Molunkus Lake X<br />
Mud Brook X<br />
Nica<strong>to</strong>us Lake X X X<br />
North Branch Marsh Stream X<br />
Penobscot River at Orson Island X<br />
Piscataquis River at Schoodic Stream X<br />
Sandy Stream X<br />
Scutaze Stream X<br />
Sebec Lake X X<br />
Sebec River X<br />
Seboeis Stream X<br />
Sedgeunkedunk Stream X<br />
Ship Pond Stream X<br />
Sly Brook-Caribou Lake X<br />
Upper Marsh Stream X<br />
Upper Mattawamkeag River X<br />
Upper Molunkus Stream X<br />
Upper Pushaw Stream X X X<br />
West Branch Dead Stream X<br />
Wy<strong>to</strong>pitlock Stream X<br />
LMB-large mouth bass<br />
PKL – pickerel<br />
SMB – small mouth bass<br />
CMM – central mud minnow<br />
BNT – brown trout<br />
Table 6. Lakes with non-native species<br />
Lake Name BLC BNT GSF LMB PIK PKL SMB<br />
Abbee Pond X<br />
Alamoosook Lake X X X X<br />
Ambajejus Lake X<br />
Badger Pond X<br />
PRFP Page 342
Basin Pond X<br />
Baskahegan Lake X X<br />
Bear Pond X<br />
Ben Annis Pond X X<br />
Bennett Pond X<br />
Big Bennett Pond X X<br />
Big Madagascal Pond X X<br />
Bowlin Pond X<br />
Boyd Lake X X<br />
Branns Mill Pond (North) X X X<br />
Branns Mill Pond (South) X X X<br />
Brewer Lake X<br />
Cambolasse Pond X X X<br />
Caribou, Egg & Long Pd X X X<br />
Cedar Lake X<br />
Center Pond X<br />
Chemo Pond X X X<br />
Cold Stream Pond X X<br />
Cranberry Pond X<br />
Crooked Brook Flowage X X<br />
Crooked Pond X X X<br />
Crystal Lake X<br />
Dolby Pond X<br />
Drake Lake X X<br />
Dunham Pond X<br />
East Branch Lake X X<br />
Ebeemee Lake X X<br />
Ebeemee Lake (East Pd) X X<br />
Edding<strong>to</strong>n Pond X X<br />
Eighteen Pond X<br />
Elbow Lake X<br />
Endless Lake X X<br />
Eskutassis Pond X X<br />
Etna Pond X X X<br />
Faulkner Lake X<br />
Fields Pond X X<br />
First Buttermilk Pond X<br />
First Davis Pond X<br />
Fitts Pond X<br />
Flinn Pond X<br />
Folsom Pond X X X<br />
Garland Pond X X<br />
Gassabias Lake X<br />
George Pond X X X<br />
Grand Lake Sebois X X<br />
Green Pond X<br />
Greenleaf Pond X<br />
PRFP Page 343
Halfmoon Pond X<br />
Hammond Pond X X X<br />
Hancock Pond X X X<br />
Harlow Pond X X X<br />
Harriman Pond X<br />
Haywire Pond X<br />
Heart Pond X<br />
Hermon Pond X X X X<br />
Holbrook Pond X X<br />
Horseshoe Lake X<br />
Hot Pond X<br />
Hothole Pond X X<br />
Jackson Brook Lake X X<br />
Jacob Buck Pond X<br />
Jaquith Pond X<br />
Jones Pond X<br />
Kingsbury Pond X<br />
Little Bennett Pond X X<br />
Little Madagascal Pond X X<br />
Little Mattamiscontis Lake X<br />
Little Pickerel Pond X X<br />
LIttle Pushaw Pond X X<br />
Little Salmon Strm Lk X X<br />
Long Lake X X<br />
Long Pond X X<br />
Lower Hot Brook Lake X X<br />
Lower Jo-Mary Lake X<br />
Lower Shin Pond X<br />
Lower Togue Pond X<br />
Manhancock Pond X X X<br />
Marr Pond X X<br />
Mattamiscontis Lake X<br />
Mattanawcook Pond X X X<br />
Mattaseunk Lake X X<br />
Mattawamkeag Lake X X<br />
Mayfield Pond X<br />
Middle Jo-Mary Lake X X<br />
Millinocket Lake X<br />
Molunkus Lake X X X<br />
Mud Pond X X X<br />
Nica<strong>to</strong>us Lake X X X X<br />
Nollesemic Lake X<br />
North Twin Lake X<br />
Nor<strong>to</strong>n Pond X<br />
Parks Pond X X<br />
Passamagamet Lake X<br />
Patten Pond X<br />
PRFP Page 344
Pemadumcook Chain Lake X<br />
Pickerel Pond X<br />
Piper Pond X<br />
Pleasant Lake X X<br />
Pleasant Pond X X<br />
Plunkett Pond X X<br />
Pond Farm Pond X<br />
Private Pond X<br />
Pug Pond X<br />
Pushaw Lake X X X X<br />
Reed Pond X<br />
Round Pond X X<br />
Rush Pond X<br />
Salmon Stream Lake X X<br />
Salmon Stream Pond X<br />
Saponac Pond X X<br />
Schoodic Lake X X<br />
Sebec Lake X X<br />
Seboeis Lake X X<br />
Second Davis Pond X<br />
Silver Lake X X X X<br />
Skitacook Lake X<br />
Snag Pond X X X<br />
Snow's Pond X<br />
Snowshoe Lake X X<br />
South Branch Lake X X<br />
South Twin Lake X<br />
Spaulding Lake X X<br />
Spectacle Ponds (east) X X<br />
Spectacle Ponds (west) X X<br />
Spring Lake X<br />
Swetts Pond X X<br />
The Basin X X<br />
Thistle Pond X<br />
Toddy Pond X X X X<br />
Tracy Pond X X X<br />
Turkey Tail Lake X X<br />
Upper Cold Stream Pond X X<br />
Upper Ebeemee Lake X X<br />
Upper Hot Brook Lake X X<br />
Upper Jo-Mary Lake X X<br />
Upper Macwahoc Lake X<br />
Upper Mattawamkeag Lk X X<br />
Upper Shin Pond X<br />
Upper Togue Pond X<br />
Wadleigh Pond X<br />
Weir Pond X<br />
PRFP Page 345
West Garland Pond X<br />
West Lake X X X<br />
West Lake Basin X X<br />
White Horse Lake X X<br />
Williams Pond X<br />
Wy<strong>to</strong>pitlock Lake X X<br />
BLC – black crappie<br />
BNT – brown trout<br />
GSF – green sunfish<br />
LMB - large mouth bass<br />
PIK – nor<strong>the</strong>rn pike<br />
PKL – pickerel<br />
SMB – small mouth bass<br />
Comment: There were several comments about human introductions <strong>of</strong> non-native<br />
species, including suggestions <strong>to</strong> make <strong>the</strong> penalties more intense; make en<strong>for</strong>cement<br />
a priority and <strong>to</strong> make catch and kill <strong>of</strong> all non-native species in <strong>the</strong> Penobscot<br />
manda<strong>to</strong>ry.<br />
Response: MDMR and IFW will work with <strong>the</strong> Warden Service and <strong>the</strong> At<strong>to</strong>rney<br />
General’s <strong>of</strong>fice about changing en<strong>for</strong>cement.<br />
Comment: Human introductions are a big problem and we need <strong>to</strong> solve that problem<br />
regardless <strong>of</strong> what happens at Howland.<br />
Response: The State <strong>of</strong> Maine is very concerned with <strong>the</strong> control and appropriate<br />
management <strong>of</strong> introduced aquatic species and produced an action plan in 2002 <strong>for</strong><br />
managing introductions. The nor<strong>the</strong>rn pike risk assessment indicated that humancaused<br />
introductions are a significant fac<strong>to</strong>r in <strong>the</strong> establishment and dispersal <strong>of</strong> pike.<br />
When possible, <strong>the</strong> State will explore novel approaches <strong>to</strong> managing introduced species<br />
and some <strong>of</strong> <strong>the</strong>se could include increased public education, rewards <strong>for</strong> in<strong>for</strong>mation on<br />
illegal s<strong>to</strong>cking and strict regulations <strong>to</strong> remove pike that are caught by anglers.<br />
Comment: It was recommended that <strong>the</strong> barrier at Howland remain <strong>for</strong> 10 years and<br />
that current nor<strong>the</strong>rn pike suppression ef<strong>for</strong>ts continue and be funded <strong>for</strong> 10 years.<br />
Response: The Howland by-pass, one aspect <strong>of</strong> <strong>the</strong> Penobscot River <strong>Res<strong>to</strong>ration</strong><br />
Project, will allow diadromous species access <strong>to</strong> <strong>the</strong> Piscataquis drainage but also<br />
opens <strong>the</strong> drainage <strong>to</strong> natural dispersal <strong>of</strong> nor<strong>the</strong>rn pike. Options under <strong>the</strong> Multiparty<br />
Settlement Agreement, which <strong>the</strong> State <strong>of</strong> Maine is a signa<strong>to</strong>ry <strong>to</strong>, (MPA) were a bypass<br />
channel without trap and sort facilities, or removal <strong>of</strong> <strong>the</strong> dam. Construction <strong>of</strong> <strong>the</strong><br />
bypass channel ra<strong>the</strong>r than dam removal was <strong>the</strong> preferred alternative by <strong>the</strong><br />
res<strong>to</strong>ration parties as engineering design and hydraulic modeling showed a bypass<br />
channel could be constructed and provide free-swim upstream and downstream<br />
passage at <strong>the</strong> Howland dam, ra<strong>the</strong>r than necessitating dam removal. Thorough<br />
evaluation and engineering design <strong>of</strong> trap and sort facilities <strong>to</strong> prevent fur<strong>the</strong>r upstream<br />
movements <strong>of</strong> pike in<strong>to</strong> <strong>the</strong> Piscataquis River drainage through <strong>the</strong> bypass channel<br />
were conducted concurrently. This evaluation determined trap and sort facilities <strong>to</strong> be<br />
unfeasible in meeting res<strong>to</strong>ration goals. The fisheries agencies and o<strong>the</strong>r parties<br />
PRFP Page 346
agreed <strong>to</strong> undertake a <strong>for</strong>mal risk assessment <strong>of</strong> potential pike movements through <strong>the</strong><br />
channel and in<strong>to</strong> upstream sub-drainages. The measures that <strong>the</strong> State has taken or<br />
are proposing in <strong>the</strong> <strong>Plan</strong> <strong>to</strong> control pike are feasible and prudent measures <strong>to</strong> minimize<br />
<strong>the</strong> risk <strong>of</strong> harm. The benefits <strong>of</strong> res<strong>to</strong>ring diadromous fish <strong>to</strong> <strong>the</strong> Piscataquis River<br />
watershed, in light <strong>of</strong> <strong>the</strong> management actions currently in place and proposed <strong>to</strong><br />
control <strong>the</strong> risks <strong>of</strong> nor<strong>the</strong>rn pike in <strong>the</strong> watershed, outweigh any potential negative<br />
impacts.<br />
Control measures have been implemented by <strong>the</strong> State <strong>of</strong> Maine and its partners<br />
<strong>for</strong> <strong>the</strong> population <strong>of</strong> nor<strong>the</strong>rn pike in Pushaw Lake and Mud Pond. IFW will be<br />
sampling Pushaw Stream in June <strong>to</strong> try and determine if pike have colonized (and <strong>to</strong><br />
what extent) in <strong>the</strong> stream. If a large viable population is found, <strong>the</strong>n we may need <strong>to</strong><br />
rethink our ef<strong>for</strong>ts at Pushaw Lake. The current in<strong>for</strong>mation indicates that this population<br />
has not caused economic harm or harm <strong>to</strong> human, animal or plant health nor has it<br />
dispersed widely since its human-caused introduction. The <strong>Plan</strong> provides additional<br />
measures <strong>to</strong> selectively control and manage this introduction.<br />
Comment: Will <strong>the</strong>re be any restrictions against s<strong>to</strong>cking rainbow trout in farm ponds?<br />
Response: IFW traditionally asks DMR <strong>for</strong> comments prior <strong>to</strong> permitting farm/private<br />
pond s<strong>to</strong>cking in <strong>the</strong> Penobscot drainage. A new written MOU is being developed that<br />
states MIFW will permit <strong>the</strong> s<strong>to</strong>cking <strong>of</strong> Rainbow and Brown trout in private ponds within<br />
in <strong>the</strong> Penobscot River drainage, provided <strong>the</strong> pond has no outlet. An exception <strong>to</strong> this<br />
rule is if a pond without an outlet is in close proximity <strong>to</strong> <strong>the</strong> river or a tributary and <strong>the</strong>re<br />
is potential <strong>for</strong> fish <strong>to</strong> escape during any high water event. All ponds in question are <strong>to</strong><br />
be inspected by MIFW or MDMR staff prior <strong>to</strong> allocation <strong>of</strong> a permit from MIFW <strong>for</strong><br />
species o<strong>the</strong>r than brook trout.<br />
Comment: The Nor<strong>the</strong>rn pike risk assessment under estimates <strong>the</strong> risk <strong>of</strong> pike.<br />
Response: The risk assessment used <strong>the</strong> best available science and expertise from<br />
state and federal agencies within Maine. The assessment represents a biological<br />
opinion on <strong>the</strong> ecological harm that may be associated with a pike introduction, <strong>the</strong><br />
pathways <strong>for</strong> introduction, <strong>the</strong> potential habitat that may be impacted and <strong>the</strong> current<br />
quality <strong>of</strong> that habitat <strong>for</strong> native species. While <strong>the</strong>re is some uncertainty in <strong>the</strong> opinion<br />
due <strong>to</strong> limited in<strong>for</strong>mation, it provides specific steps that will limit <strong>the</strong> distribution <strong>of</strong><br />
natural dispersal <strong>of</strong> pike in <strong>the</strong> watershed at known barriers and proposes measures <strong>to</strong><br />
control illegal introductions.<br />
Comment: Several comments suggested that Executive Order 13112 and Maine State<br />
law prohibit <strong>the</strong> introduction <strong>of</strong> non-native species, which means <strong>the</strong> State and Federal<br />
agencies are violating <strong>the</strong> law as <strong>the</strong> Nor<strong>the</strong>rn Pike an illegal introduction and suggest<br />
amending <strong>the</strong> plan <strong>to</strong> maintain consistency with established State and Federal policy.<br />
The suggested amendments were <strong>to</strong> keep <strong>the</strong> Howland and Enfield Dams as barriers <strong>to</strong><br />
upstream movement <strong>of</strong> pike and o<strong>the</strong>r invasive species.<br />
Response: In <strong>the</strong>ir June 8, 2009 comments on <strong>the</strong> draft <strong>Plan</strong>, <strong>the</strong> U.S. Fish and Wildlife<br />
Service provided <strong>the</strong>ir opinion on <strong>the</strong> Service’s consistency with Executive Order 13112<br />
on Invasive Species related <strong>to</strong> <strong>the</strong> Penobscot River <strong>Res<strong>to</strong>ration</strong> Project. The Service<br />
does not believe that any <strong>of</strong> <strong>the</strong> actions it has taken are likely <strong>to</strong> cause or promote <strong>the</strong><br />
PRFP Page 347
spread <strong>of</strong> any invasive species, and has determined that, even if <strong>the</strong>re were a risk <strong>of</strong><br />
spread, <strong>the</strong> benefits <strong>of</strong> <strong>the</strong> Penobscot River <strong>Res<strong>to</strong>ration</strong> Project clearly outweigh <strong>the</strong><br />
potential harm. They fur<strong>the</strong>r explain that <strong>the</strong> available in<strong>for</strong>mation on nor<strong>the</strong>rn pike in<br />
<strong>the</strong> Penobscot River watershed does not indicate that it has caused economic harm or<br />
harm <strong>to</strong> human, animal or plant health nor has it dispersed widely since its humancaused<br />
introduction. The Service was involved in assisting <strong>to</strong> complete <strong>the</strong> nor<strong>the</strong>rn<br />
pike risk assessment and <strong>the</strong>y stated that <strong>the</strong> additional measures <strong>to</strong> selectively control<br />
and manage this introduction are feasible and prudent measures <strong>to</strong> minimize <strong>the</strong> risk <strong>of</strong><br />
harm.<br />
The Service also explained that Section 2(2)(iv) <strong>of</strong> <strong>the</strong> Executive Order calls <strong>for</strong> <strong>the</strong><br />
res<strong>to</strong>ration <strong>of</strong> native species and habitats <strong>to</strong> reduce <strong>the</strong> effects <strong>of</strong> invasive species and<br />
<strong>to</strong> prevent fur<strong>the</strong>r invasions. Consequently, <strong>the</strong>y believe that this <strong>Plan</strong> and <strong>the</strong> elements<br />
in Lower Penobscot River Multiparty Settlement Agreement are consistent with <strong>the</strong><br />
Executive Order because <strong>the</strong>y are meant <strong>to</strong> res<strong>to</strong>re diadromous fish <strong>to</strong> <strong>the</strong> watershed.<br />
The State <strong>of</strong> Maine has developed an advisory list <strong>of</strong> over 80 invasive species that<br />
includes nor<strong>the</strong>rn pike (located in Appendix D <strong>of</strong> <strong>the</strong> State <strong>of</strong> Maine Action <strong>Plan</strong> For<br />
Managing Invasive Aquatic Species), however <strong>the</strong> state has not gone as far as <strong>to</strong><br />
include pike in a regula<strong>to</strong>ry definition <strong>of</strong> an invasive species as it has done with certain<br />
aquatic invasive plants (Title 38: Chapter 3: Subchapter 1: §410-N. Aquatic nuisance<br />
species control). In and <strong>of</strong> itself, <strong>the</strong> advisory list is not a regulation or law. The state’s<br />
advisory list recommends selective control and management <strong>for</strong> Nor<strong>the</strong>rn pike, which<br />
have been implemented by <strong>the</strong> state and its partners <strong>for</strong> <strong>the</strong> population <strong>of</strong> nor<strong>the</strong>rn pike<br />
in Pushaw Lake and Mud Pond. The nor<strong>the</strong>rn pike risk assessment provides additional<br />
measures <strong>to</strong> selectively control and manage this introduction. The Action <strong>Plan</strong> notes, as<br />
does <strong>the</strong> risk assessment, illegal introductions are <strong>the</strong> main pathway <strong>for</strong> this species.<br />
The measures that <strong>the</strong> state has taken or are proposing <strong>to</strong> control pike are feasible and<br />
prudent measures <strong>to</strong> minimize <strong>the</strong> risk <strong>of</strong> harm.<br />
Comment: What is <strong>the</strong> projected time frame that <strong>the</strong> pike could make it up <strong>the</strong> river if <strong>the</strong><br />
barriers are removed?<br />
Response: No data or methods were readily available <strong>to</strong> predict <strong>the</strong> rate <strong>of</strong> natural<br />
dispersal <strong>of</strong> nor<strong>the</strong>rn pike. We believe that <strong>the</strong> natural dispersal rate would be low<br />
because <strong>of</strong> several life his<strong>to</strong>ry traits:<br />
1. Nor<strong>the</strong>rn pike have a narrow optimum temperature range <strong>of</strong> between 19 and 21º<br />
C. This temperature range is <strong>of</strong>ten exceeded in <strong>the</strong> summer months on <strong>the</strong><br />
mainstem rivers;<br />
2. Nor<strong>the</strong>rn pike are generally sedentary and do not move great distances (2<br />
kilometers). This behavior has been documented in Pushaw Lake through radio<br />
telemetry;<br />
3. The greatest movement <strong>of</strong> pike occurs during <strong>the</strong> spawning period in early spring<br />
and <strong>the</strong>re is some indication in <strong>the</strong> literature that it may be related <strong>to</strong> a return <strong>to</strong><br />
natal spawning sites as opposed <strong>to</strong> dispersal <strong>to</strong> new sites;<br />
4. Pike dispersal appears <strong>to</strong> be related <strong>to</strong> an increase in density. The density <strong>of</strong><br />
pike in Pushaw Lake appears <strong>to</strong> be low so we do not expect density-dependent<br />
movement <strong>to</strong> occur in <strong>the</strong> near future;<br />
PRFP Page 348
5. Pike spawning and nursery habitat is typically contiguous and requires emergent<br />
wetland so dispersing populations would be associated with wetland complexes<br />
and with those wetland complexes that are closest <strong>to</strong> an existing population.<br />
There are sections <strong>of</strong> <strong>the</strong> Penobscot River that have little emergent wetland,<br />
which would likely slow dispersal <strong>of</strong> pike upstream; and<br />
6. Pike prefer lentic or non-flowing water so rivers with even moderate flow are a<br />
less preferred habitat. This habitat preference would favor a low natural<br />
dispersal rate through mainstem river corridors.<br />
These aspects <strong>of</strong> pike biology lead us <strong>to</strong> conclude that human-caused introductions are<br />
a greater threat than natural dispersal within <strong>the</strong> Penobscot River watershed.<br />
Comment: S<strong>to</strong>cked brown trout would have a greater impact on native species than<br />
nor<strong>the</strong>rn pike.<br />
Response: Brown trout, an exotic species native <strong>to</strong> Europe, is currently s<strong>to</strong>cked by<br />
MDIFW <strong>for</strong> recreational fishing in Nica<strong>to</strong>us Lake located above a set <strong>of</strong> falls impassable<br />
<strong>to</strong> all species <strong>of</strong> fish but Atlantic salmon. IFW and DMR are working on an MOU <strong>to</strong> be<br />
revisited every five years <strong>to</strong> continue this ef<strong>for</strong>t. Nica<strong>to</strong>us Lake is a 5,165 acre lake<br />
located T40 MD in Hancock County. It is managed <strong>for</strong> both warm water (chain pickerel,<br />
smallmouth bass, and white perch) and cold water (brown trout and landlocked salmon)<br />
species <strong>of</strong> game fish.<br />
Brown trout were s<strong>to</strong>cked in Nica<strong>to</strong>us Lake his<strong>to</strong>rically from 1938 <strong>to</strong> 1942, and<br />
more recently from 1998 <strong>to</strong> <strong>the</strong> present. The lake was managed as a principal fishery<br />
<strong>for</strong> s<strong>to</strong>cked landlocked salmon from 1971 <strong>to</strong> 1997, but due <strong>to</strong> poor growth and holdover,<br />
a management decision was made <strong>to</strong> switch <strong>to</strong> brown trout, a hardier coldwater species<br />
<strong>of</strong> fish and a less discriminate <strong>for</strong>ager than salmon. Currently 4,000 fall yearling age<br />
brown trout (18 month old) and 1,500 spring yearling age landlocked salmon (12 month<br />
old) are s<strong>to</strong>cked annually. The next sport fish survey (winter creel census) is scheduled<br />
<strong>for</strong> winter 2010 or 2011.<br />
MIFW will continue <strong>to</strong> s<strong>to</strong>ck brown trout at Nica<strong>to</strong>us Lake <strong>for</strong> <strong>the</strong> next 5 years<br />
(2014). During this time period at least one winter sport fish survey will be conducted<br />
and volunteer angler book data will be syn<strong>the</strong>sized <strong>to</strong> determine <strong>the</strong> importance <strong>of</strong> <strong>the</strong><br />
Nica<strong>to</strong>us Lake brown trout fishery <strong>to</strong> <strong>the</strong> angling public. In addition, regional staff will<br />
conduct one or more summer lake habitat (basic water quality) and fish sample surveys<br />
(gill netting or trap netting) <strong>to</strong> determine if management goals (age and growth) are<br />
being met. At <strong>the</strong> end <strong>of</strong> <strong>the</strong> five year period a final report will be developed and <strong>the</strong><br />
interagency MOU <strong>for</strong> <strong>the</strong> brown trout s<strong>to</strong>cking program at Nica<strong>to</strong>us Lake revisited.<br />
Comment: The tasks designed <strong>to</strong> assess <strong>the</strong> risks associated with non-native species<br />
should include an additional provision <strong>to</strong> obtain more in<strong>for</strong>mation about <strong>the</strong> ecological<br />
effects <strong>of</strong> pike where <strong>the</strong>y occur in o<strong>the</strong>r Maine waters, especially in lotic habitats.<br />
Response: We agree that <strong>the</strong> risks associated with introduced species need fur<strong>the</strong>r<br />
research in Maine and have revised <strong>the</strong> plan <strong>to</strong> include this <strong>to</strong>pic in <strong>the</strong> adaptive<br />
management planning ef<strong>for</strong>t.<br />
Comment: How will <strong>the</strong> migration <strong>of</strong> alewives affect pike?<br />
PRFP Page 349
Response: There are conditions when pike may have a less sedentary and more<br />
pelagic feeding behavior, however <strong>the</strong>se conditions are typically related <strong>to</strong> a lack <strong>of</strong> prey<br />
<strong>to</strong> sustain <strong>the</strong>m in <strong>the</strong>ir preferred habitat. Ano<strong>the</strong>r period that female pike may feed<br />
more pelagicly is in <strong>the</strong> fall during egg development. During this period, female pike<br />
must increase body weight by 10 <strong>to</strong> 30 percent, which may require <strong>the</strong>m <strong>to</strong> <strong>for</strong>age in a<br />
larger than normal home range <strong>to</strong> meet this physiological need.<br />
No observations have been documented on <strong>the</strong> interaction <strong>of</strong> anadromous<br />
alewife and pike. In <strong>the</strong> Great Lakes, <strong>the</strong> landlocked alewife is a preferred prey <strong>for</strong> adult<br />
pike and <strong>the</strong>y have been observed feeding on alewife from areas <strong>of</strong> cover. During<br />
conditions <strong>of</strong> low food availability, adult pike may exploit adult alewife in lentic habitats<br />
however juvenile alewife are likely <strong>to</strong> be <strong>to</strong>o small <strong>to</strong> be preferred prey <strong>for</strong> most size<br />
classes <strong>of</strong> pike.<br />
Comment: What criteria were used in nor<strong>the</strong>rn pike habitat model?<br />
Response: The potential habitat model was developed through in<strong>for</strong>mation reported in<br />
<strong>the</strong> literature, available data on <strong>the</strong> lakes, and verified by applying it <strong>to</strong> ponds and lakes<br />
in <strong>the</strong> Belgrade area where nor<strong>the</strong>rn pike have existed and been managed <strong>for</strong> many<br />
years. The model predictions were compared <strong>to</strong> <strong>the</strong> predictions <strong>of</strong> <strong>the</strong> local biologists<br />
that were developed based on pr<strong>of</strong>essional judgment. The model was not perfect (17%<br />
<strong>of</strong> <strong>the</strong> lakes were classified by <strong>the</strong> model as being lower in potential than identified by<br />
<strong>the</strong> local biologist) so it is likely that not all <strong>the</strong> lakes were classified properly.<br />
The model used a three-tiered scale: low, medium or high habitat potential. The<br />
rank was assigned <strong>for</strong> lakes and ponds by assessing nine habitat parameters based on<br />
<strong>the</strong> published literature. The rank reflects <strong>the</strong> relative habitat conditions <strong>for</strong> pike based<br />
on <strong>the</strong> nine parameters, what is know about <strong>the</strong> species-habitat relationships and<br />
assumes a positive relationship between habitat condition and population capacity (<strong>the</strong><br />
pike population will be related <strong>to</strong> <strong>the</strong> suitability <strong>of</strong> <strong>the</strong> habitat).<br />
The model is useful because it provides an a priori method <strong>to</strong> rank lakes (a<br />
process that is repeatable and applied without bias), it provides a method <strong>to</strong> rank lakes<br />
when <strong>the</strong>re is limited knowledge (<strong>the</strong>re are hundreds <strong>of</strong> lakes in <strong>the</strong> Piscataquis River<br />
watershed and most have not been extensively surveyed), it provides a predictive<br />
capability, it is practical <strong>to</strong> implement, and it allows a structured decision making<br />
process that is based on <strong>the</strong> literature. One step that was not completed prior <strong>to</strong> <strong>the</strong><br />
release <strong>of</strong> <strong>the</strong> draft plan is <strong>to</strong> review <strong>the</strong> list with <strong>the</strong> local biologists and adjust it based<br />
on pr<strong>of</strong>essional judgment. We intend <strong>to</strong> do this next step <strong>for</strong> <strong>the</strong> final plan.<br />
Comment: Several people requested that <strong>the</strong> MOUs on Schoodic, Seboeis, and Sebec<br />
be clarified.<br />
Response: DMR and IFW will develop and sign a MOU <strong>to</strong> keep barriers in place on<br />
Sebec, Dover (whichever provides <strong>the</strong> best option), Seboeis, and Schoodic <strong>to</strong> be<br />
revisited at a minimum <strong>of</strong> every 5 years. We will consult with <strong>the</strong> Services at <strong>the</strong> time <strong>of</strong><br />
renewal.<br />
a. Sebec Lake (Phase 3 alewife lake): Maintain current blockages <strong>for</strong> invasive fish<br />
species at <strong>the</strong> outlet <strong>of</strong> Sebec Lake and on <strong>the</strong> Sebec River at <strong>the</strong> Milo Hydro<br />
Project until such time that Phase 2 alewife res<strong>to</strong>ration is complete.<br />
PRFP Page 350
. Schoodic Lake (Phase 3 alewife lake): Maintain current blockages <strong>for</strong> invasive<br />
fish species at <strong>the</strong> outlet <strong>of</strong> Schoodic Lake until such time that Phase 2 alewife<br />
res<strong>to</strong>ration is complete.<br />
c. Seboeis Lake (Phase 3 alewife lake): Maintain current blockages <strong>for</strong> invasive<br />
fish species at <strong>the</strong> outlet <strong>of</strong> Seboeis Lake until such time that Phase 2 alewife<br />
res<strong>to</strong>ration is complete.<br />
d. Piscataquis River (Dover-Foxcr<strong>of</strong>t and Guil<strong>for</strong>d): Create and maintain a minimum<br />
30-inch vertical jump barrier <strong>to</strong> preclude upstream passage <strong>of</strong> invasive fish<br />
species while still allowing Atlantic salmon <strong>to</strong> pass upstream at one or more <strong>of</strong><br />
<strong>the</strong> upstream passage facilities located at Brown’s Mill, Moosehead<br />
Manufacturing, and Guil<strong>for</strong>d. Keep <strong>the</strong> barrier in place at least until such time<br />
that Phase 1 alewife res<strong>to</strong>ration is complete and Group 1 American shad<br />
res<strong>to</strong>ration is complete.<br />
Section 5 – Communication etc<br />
Comment: The science is sound but a greater emphasis on <strong>the</strong> outreach is needed.<br />
Education <strong>of</strong> <strong>the</strong> general public as <strong>to</strong> <strong>the</strong> benefits and importance <strong>of</strong> alewife res<strong>to</strong>ration<br />
is absolutely vital and <strong>the</strong>re should be a stronger focus in <strong>the</strong> plan.<br />
Response: We propose <strong>to</strong> add a task <strong>to</strong> Objective 27 that reads: Develop an outreach<br />
strategy that incorporates <strong>the</strong> tasks that follow and identifies additional ways <strong>to</strong> educate<br />
<strong>the</strong> general public on <strong>the</strong> benefits and importance <strong>of</strong> alewife res<strong>to</strong>ration. NFWF has<br />
indicated <strong>to</strong> DMR that <strong>the</strong>y are interested in funding a two-year outreach position. The<br />
successful candidate will work on an outreach plan and develop educational materials<br />
(i.e. that can be used at meetings, schools, public speaking engagements, in blogs and<br />
chat rooms, at outdoor shows, <strong>the</strong> Penobscot River Festival, left at Chamber <strong>of</strong><br />
Commences, press release, etc) and enlist members <strong>of</strong> <strong>the</strong> public <strong>to</strong> assist with<br />
outreach.<br />
Comment: There needs <strong>to</strong> be more on economics in this plan from multiple aspects,<br />
including costs and benefits.<br />
Response: The agencies involved in this operational plan are responsible <strong>for</strong> fisheries<br />
management. One <strong>of</strong> <strong>the</strong> strategies (29) was <strong>to</strong> enlist <strong>the</strong> interest and collaboration <strong>of</strong><br />
experts in human dimensions, <strong>to</strong> evaluate <strong>the</strong> economics related <strong>to</strong> anadromous fish<br />
res<strong>to</strong>ration, including costs and benefits. Fur<strong>the</strong>r, we use human dimensions <strong>to</strong> include<br />
all levels <strong>of</strong> society, including communities (see page 104).<br />
Appendices:<br />
Comment: Appendix E should be expanded <strong>to</strong> include a discussion <strong>of</strong> <strong>the</strong> management<br />
alternatives <strong>for</strong> alosine res<strong>to</strong>ration (e.g., natural recovery, use <strong>of</strong> in-basin adult transfers,<br />
use <strong>of</strong> out-<strong>of</strong>-basin fish transfers, hatchery culture), <strong>the</strong> pros and cons <strong>of</strong> each<br />
alternative, and a description <strong>of</strong> why an alternative may or may not meet <strong>the</strong> res<strong>to</strong>ration<br />
objective.<br />
Response: Appendix E was meant <strong>to</strong> address <strong>the</strong> complex options available <strong>for</strong> Atlantic<br />
salmon management. We do not feel <strong>the</strong> inclusion <strong>of</strong> o<strong>the</strong>r species management<br />
options is appropriate. Appendix A discusses management approaches <strong>for</strong> alosines.<br />
PRFP Page 351
Comment: <strong>Plan</strong> <strong>of</strong>ten uses <strong>the</strong> terms self-sustaining and sustainable without a clear<br />
definition<br />
Response: We will replace <strong>the</strong> term “sustainable” with <strong>the</strong> term “self-sustaining”<br />
throughout <strong>the</strong> document <strong>for</strong> clarity and consistency. We will insert this definition <strong>for</strong><br />
self-sustaining: “A population that exists in sufficient numbers <strong>to</strong> replace itself through<br />
time without supplementation with hatchery fish. It does not necessarily produce surplus<br />
fish <strong>for</strong> harvest. Self-sustaining diadromous populations spawn in <strong>the</strong> wild, and migrate<br />
<strong>to</strong> and from <strong>the</strong> ocean with a minimum <strong>of</strong> human interference.”<br />
Target population levels meet <strong>the</strong> definition <strong>of</strong> self-sustaining based on empirical<br />
experience, <strong>the</strong>ory, and modeling. We used <strong>the</strong>se in<strong>for</strong>mation sources as available <strong>to</strong><br />
establish target population levels. Where target populations levels are specified, we<br />
believe <strong>the</strong>se levels will result in self-sustaining populations. However, establishing<br />
self-sustaining population levels a priori has been one <strong>of</strong> <strong>the</strong> greatest challenges <strong>of</strong><br />
conservation biology, and we do not propose <strong>to</strong> solve this challenge in this plan. The<br />
levels set are our best estimate <strong>of</strong> what will be needed <strong>to</strong> achieve self-sustaining status.<br />
To move beyond this, involved population dynamics modeling, such as PVA, would be<br />
required <strong>to</strong> estimate <strong>the</strong> probability <strong>of</strong> achieving self-sustaining status under various<br />
scenarios. However, such modeling is only as good as <strong>the</strong> assumptions and data used<br />
<strong>to</strong> build <strong>the</strong> model(s).<br />
O<strong>the</strong>rs:<br />
Comment: What happens when alewives are leaving - will it impact bait seiners?<br />
Response: We asked <strong>the</strong> IFW regional <strong>of</strong>fices <strong>for</strong> in<strong>for</strong>mation. Region A didn’t recall<br />
any complaints but suspects <strong>the</strong> bait dealers may have simply learned <strong>to</strong> avoid <strong>the</strong><br />
situation. Region B had a complaint about anadromous alewives migrating <strong>the</strong> fall in <strong>the</strong><br />
Sebasticook River. Region C is not aware <strong>of</strong> dealers who spend any time seining <strong>for</strong><br />
bait when <strong>the</strong> juvenile alewives are on <strong>the</strong> shore.<br />
Comment: What fishing regulations might be put in place below Mil<strong>for</strong>d Dam when it is<br />
<strong>the</strong> first dam on <strong>the</strong> river?<br />
Response: The same 150 foot closure below <strong>the</strong> fishway (already in place) will remain<br />
and <strong>the</strong> closure below <strong>the</strong> Veazie Dam will be revisited.<br />
Comment: The placement <strong>of</strong> size limits in Schoodic <strong>for</strong> LLS is a concern.<br />
Response: This question has less <strong>to</strong> do with <strong>the</strong> diadromous fish plan and more <strong>to</strong> do<br />
with <strong>the</strong> Atlantic salmon ESA listing, and potential impacts <strong>to</strong> recreational fishing. MIFW<br />
manages Schoodic Lake as a trophy landlocked salmon water, and plans <strong>to</strong> do so in <strong>the</strong><br />
future. The 25-inch maximum length limit <strong>for</strong> landlocked salmon that is in place <strong>for</strong> <strong>the</strong><br />
Downeast salmon rivers as well as <strong>the</strong> mainstem Penobscot River that protects 2SW<br />
sea-run Atlantic salmon in areas where incidental take may occur, would severely<br />
hamper <strong>the</strong> trophy landlocked salmon program at Schoodic Lake. Currently DMR does<br />
not place a high value on Schoodic Lake nor its’ tributaries with regard <strong>to</strong> sea-run<br />
Atlantic salmon production.<br />
PRFP Page 352
Comment: Several people commented that <strong>the</strong> money needed <strong>to</strong> carry out this plan<br />
could be better spent.<br />
Response: The missions <strong>of</strong> DMR, <strong>to</strong> conserve, manage and res<strong>to</strong>re diadromous fish<br />
populations <strong>to</strong> Maine’s rivers, and <strong>of</strong> IFW <strong>to</strong> conserve, protect and enhance <strong>the</strong> inland<br />
fisheries and wildlife resources, are <strong>the</strong> reasons why we developed this plan. No<br />
money has been earmarked <strong>for</strong> this plan.<br />
Comment: Several people commented that <strong>the</strong> plan protects most <strong>of</strong> <strong>the</strong> resources and<br />
is a balance between protection and res<strong>to</strong>ration and is ambitious, extensive, complete,<br />
ecosystem-based, and holistic.<br />
Response: Thank you<br />
Comment: Many comments were about <strong>the</strong> PRRP and not <strong>the</strong> fisheries plan.<br />
Response: There are o<strong>the</strong>r avenues <strong>to</strong> express concerns or support <strong>for</strong> <strong>the</strong> PRRP as<br />
<strong>the</strong> project goes through permitting. All notices regarding this project are placed in<br />
Bangor Daily News.<br />
Recommended Changes <strong>to</strong> POP<br />
1. More in<strong>for</strong>mation on <strong>the</strong> shad model will be added as an appendix<br />
2. The shad and alewife sections will be clarified – particularly that Sebec, Seboeis<br />
and Schoodic are all Phase 3 lakes and <strong>to</strong> clarify that in basin s<strong>to</strong>cks will be used<br />
first if <strong>the</strong> funding is available.<br />
3. Staff will have a discussion about <strong>the</strong> substitution <strong>of</strong> “safe, timely, and effective”<br />
<strong>for</strong> efficiency standards in <strong>the</strong> passage section.<br />
4. The four MOUs will be finalized and added as Appendices<br />
5. Additional references will be added <strong>to</strong> <strong>the</strong> habitat section<br />
6. A task will be added <strong>to</strong> Objective 27 that reads: Develop an outreach strategy<br />
that incorporates <strong>the</strong> tasks that follow and identifies additional ways <strong>to</strong> educate<br />
<strong>the</strong> general public on <strong>the</strong> benefits and importance <strong>of</strong> alewife res<strong>to</strong>ration.<br />
7. The pike group will meet and review <strong>the</strong> habitat model results and use best<br />
pr<strong>of</strong>essional judgment <strong>to</strong> re-classify risk <strong>to</strong> lakes and this will be added <strong>to</strong> <strong>the</strong><br />
plan.<br />
8. We will replace <strong>the</strong> term “sustainable” with <strong>the</strong> term “self-sustaining” throughout<br />
<strong>the</strong> document <strong>for</strong> clarity and consistency. We will insert this definition <strong>for</strong> selfsustaining:<br />
“A population that exists in sufficient numbers <strong>to</strong> replace itself through<br />
time without supplementation with hatchery fish.<br />
9. Work plan tables will be consistent with costs and staff needs<br />
10. Lead authors <strong>for</strong> each section and appendices<br />
11. Add Atlantic salmon strategic objectives as an Appendix<br />
12. Fix spelling and <strong>for</strong>matting errors<br />
13. Remove Section 6 as it is internal <strong>to</strong> DMR<br />
14. Clarify that we will update but not re-write <strong>the</strong> plan and budget in 5 years<br />
15. The response <strong>to</strong> comments will be added <strong>to</strong> <strong>the</strong> end <strong>of</strong> <strong>the</strong> plan.<br />
PRFP Page 353