Random Processes – Fundamentals 1 Generation of a Random ...
Random Processes – Fundamentals 1 Generation of a Random ...
Random Processes – Fundamentals 1 Generation of a Random ...

Create successful ePaper yourself
Turn your PDF publications into a flip-book with our unique Google optimized e-Paper software.
5 Probability Density Function withing a Time Interval, Autocorrelation<br />
Coefficients<br />
Autocorrelation coefficient R(n1, n2) indicates, how “the signal at time n1 is similar with the same signal<br />
at time n2”. The coefficient is calculated as:<br />
R(n1, n2) =<br />
� +∞ � +∞<br />
−∞<br />
−∞<br />
x1x2p(x1, x2, n1, n2)dx1dx2,<br />
thus we need to calculate 2-dimensional probability density function in the time interval from n1 to n2<br />
which will be estimated using a 2-D histogram. Calculation <strong>of</strong> the histogram, approximation to the 2-<br />
D probability density function and calculation <strong>of</strong> the autocorrelation coefficients is implemented in the<br />
function hist2opt (don’t use the function hist2 <strong>–</strong> reference in the lecture slides). An example for n1 = 50<br />
and n2 = n1 + 0 . . . + 20:<br />
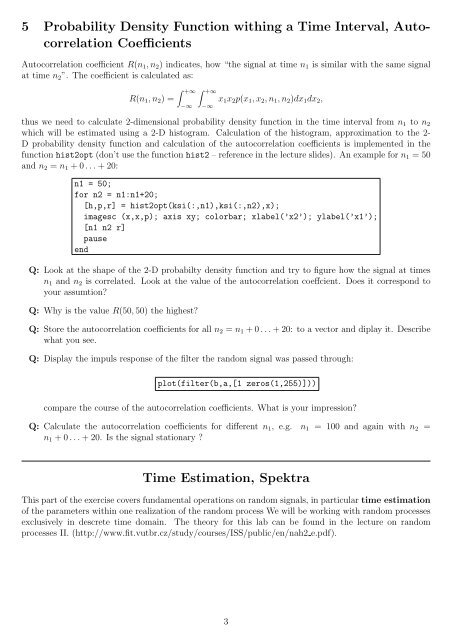
n1 = 50;<br />
for n2 = n1:n1+20;<br />
[h,p,r] = hist2opt(ksi(:,n1),ksi(:,n2),x);<br />
imagesc (x,x,p); axis xy; colorbar; xlabel(’x2’); ylabel(’x1’);<br />
[n1 n2 r]<br />
pause<br />
end<br />
Q: Look at the shape <strong>of</strong> the 2-D probabilty density function and try to figure how the signal at times<br />
n1 and n2 is correlated. Look at the value <strong>of</strong> the autocorrelation coeffcient. Does it correspond to<br />
your assumtion?<br />
Q: Why is the value R(50, 50) the highest?<br />
Q: Store the autocorrelation coefficients for all n2 = n1 + 0 . . . + 20: to a vector and diplay it. Describe<br />
what you see.<br />
Q: Display the impuls response <strong>of</strong> the filter the random signal was passed through:<br />
plot(filter(b,a,[1 zeros(1,255)]))<br />
compare the course <strong>of</strong> the autocorrelation coefficients. What is your impression?<br />
Q: Calculate the autocorrelation coefficients for different n1, e.g. n1 = 100 and again with n2 =<br />
n1 + 0 . . . + 20. Is the signal stationary ?<br />
Time Estimation, Spektra<br />
This part <strong>of</strong> the exercise covers fundamental operations on random signals, in particular time estimation<br />
<strong>of</strong> the parameters within one realization <strong>of</strong> the random process We will be working with random processes<br />
exclusively in descrete time domain. The theory for this lab can be found in the lecture on random<br />
processes II. (http://www.fit.vutbr.cz/study/courses/ISS/public/en/nah2 e.pdf).<br />
3