Commuter Rail
StateofCommuterRailSystem
StateofCommuterRailSystem

Create successful ePaper yourself
Turn your PDF publications into a flip-book with our unique Google optimized e-Paper software.
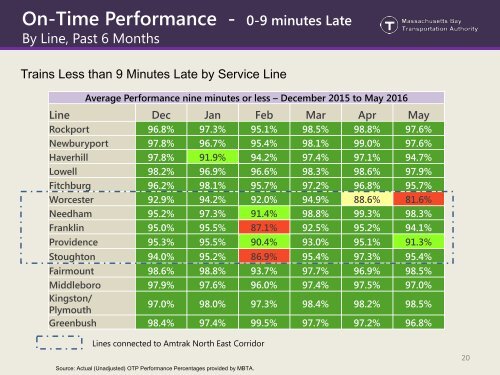
On-Time Performance - 0-9 minutes Late<br />
By Line, Past 6 Months<br />
Trains Less than 9 Minutes Late by Service Line<br />
Average Performance nine minutes or less – December 2015 to May 2016<br />
Line Dec Jan Feb Mar Apr May<br />
Rockport 96.8% 97.3% 95.1% 98.5% 98.8% 97.6%<br />
Newburyport 97.8% 96.7% 95.4% 98.1% 99.0% 97.6%<br />
Haverhill 97.8% 91.9% 94.2% 97.4% 97.1% 94.7%<br />
Lowell 98.2% 96.9% 96.6% 98.3% 98.6% 97.9%<br />
Fitchburg 96.2% 98.1% 95.7% 97.2% 96.8% 95.7%<br />
Worcester 92.9% 94.2% 92.0% 94.9% 88.6% 81.6%<br />
Needham 95.2% 97.3% 91.4% 98.8% 99.3% 98.3%<br />
Franklin 95.0% 95.5% 87.1% 92.5% 95.2% 94.1%<br />
Providence 95.3% 95.5% 90.4% 93.0% 95.1% 91.3%<br />
Stoughton 94.0% 95.2% 86.9% 95.4% 97.3% 95.4%<br />
Fairmount 98.6% 98.8% 93.7% 97.7% 96.9% 98.5%<br />
Middleboro 97.9% 97.6% 96.0% 97.4% 97.5% 97.0%<br />
Kingston/<br />
Plymouth<br />
97.0% 98.0% 97.3% 98.4% 98.2% 98.5%<br />
Greenbush 98.4% 97.4% 99.5% 97.7% 97.2% 96.8%<br />
Lines connected to Amtrak North East Corridor<br />
Source: Actual (Unadjusted) OTP Performance Percentages provided by MBTA.<br />
20