

technologies
mic6301ZqIz
mic6301ZqIz

Create successful ePaper yourself
Turn your PDF publications into a flip-book with our unique Google optimized e-Paper software.
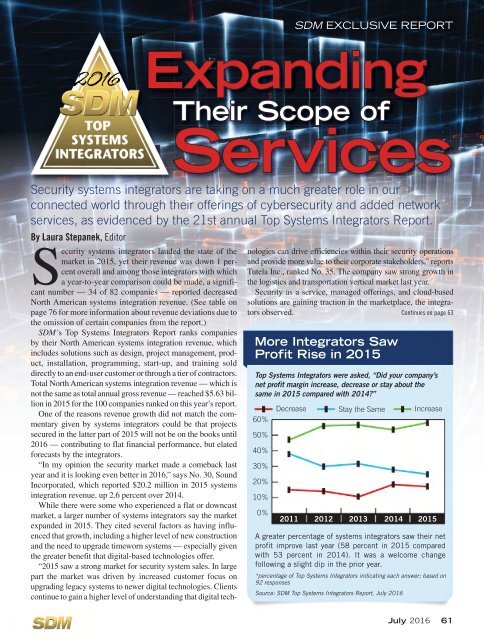
SDM EXCLUSIVE REPORT<br />
2016<br />
Expanding<br />
Their Scope of<br />
Services<br />
Security systems integrators are taking on a much greater role in our<br />
connected world through their offerings of cybersecurity and added network<br />
services, as evidenced by the 21st annual Top Systems Integrators Report.<br />
By Laura Stepanek, Editor<br />
Security systems integrators lauded the state of the<br />
market in 2015, yet their revenue was down 1 percent<br />
overall and among those integrators with which<br />
a year-to-year comparison could be made, a significant<br />
number — 34 of 82 companies — reported decreased<br />
North American systems integration revenue. (See table on<br />
page 76 for more information about revenue deviations due to<br />
the omission of certain companies from the report.)<br />
SDM’s Top Systems Integrators Report ranks companies<br />
by their North American systems integration revenue, which<br />
includes solutions such as design, project management, product,<br />
installation, programming, start-up, and training sold<br />
directly to an end-user customer or through a tier of contractors.<br />
Total North American systems integration revenue — which is<br />
not the same as total annual gross revenue — reached $5.63 billion<br />
in 2015 for the 100 companies ranked on this year’s report.<br />
One of the reasons revenue growth did not match the commentary<br />
given by systems integrators could be that projects<br />
secured in the latter part of 2015 will not be on the books until<br />
2016 — contributing to flat financial performance, but elated<br />
forecasts by the integrators.<br />
“In my opinion the security market made a comeback last<br />
year and it is looking even better in 2016,” says No. 30, Sound<br />
Incorporated, which reported $20.2 million in 2015 systems<br />
integration revenue, up 2.6 percent over 2014.<br />
While there were some who experienced a flat or downcast<br />
market, a larger number of systems integrators say the market<br />
expanded in 2015. They cited several factors as having influenced<br />
that growth, including a higher level of new construction<br />
and the need to upgrade timeworn systems — especially given<br />
the greater benefit that digital-based <strong>technologies</strong> offer.<br />
“2015 saw a strong market for security system sales. In large<br />
part the market was driven by increased customer focus on<br />
upgrading legacy systems to newer digital <strong>technologies</strong>. Clients<br />
continue to gain a higher level of understanding that digital <strong>technologies</strong><br />
can drive efficiencies within their security operations<br />
and provide more value to their corporate stakeholders,” reports<br />
Tutela Inc., ranked No. 35. The company saw strong growth in<br />
the logistics and transportation vertical market last year.<br />
Security as a service, managed offerings, and cloud-based<br />
solutions are gaining traction in the marketplace, the integrators<br />
observed.<br />
Continues on page 63<br />
More Integrators Saw<br />
Profit Rise in 2015<br />
Top Systems Integrators were asked, “Did your company’s<br />
net profit margin increase, decrease or stay about the<br />
same in 2015 compared with 2014?”<br />
60%<br />
50%<br />
40%<br />
30%<br />
20%<br />
10%<br />
0%<br />
Decrease Stay the Same Increase<br />
2011 2012 2013<br />
2014 2015<br />
A greater percentage of systems integrators saw their net<br />
profit improve last year (58 percent in 2015 compared<br />
with 53 percent in 2014). It was a welcome change<br />
following a slight dip in the prior year.<br />
*percentage of Top Systems Integrators indicating each answer; based on<br />
92 responses<br />
Source: SDM Top Systems Integrators Report, July 2016<br />
July 2016 61
2016<br />
21 st ANNUAL REPORT<br />
North American Number of New Value of<br />
2016 2015 Company & Headquarters Systems Integration Non-Residential Non-Residential Top 3 Markets Full-time Business<br />
Rank Rank Location Revenue 2015 Projects, 2015 Projects, 2015 Contributing to Revenue Employees Locations<br />
1 1 Tyco Integrated Security<br />
Boca Raton, Fla.<br />
2 4 Convergint Technologies<br />
Schaumburg, Ill.<br />
3 5 Johnson Controls Inc.<br />
Milwaukee, Wis.<br />
4 6 Kratos Public Safety & Security<br />
Solutions Inc.<br />
San Diego, Calif.<br />
5 Red Hawk Fire & Security<br />
Boca Raton, Fla.<br />
6 Kastle Systems International<br />
Falls Church, Va.<br />
7 8 G4S Secure Integration LLC<br />
Omaha, Neb.<br />
8 10 Vector Security Inc.<br />
Warrendale, Pa.<br />
9 11 Securadyne Systems LLC<br />
Dallas, Texas<br />
10 12 VTI Security<br />
Burnsville, Minn.<br />
11 13 AFA Protective Systems Inc.<br />
Syosset, N.Y.<br />
12 15 RFI Communications & Security Systems<br />
San Jose, Calif.<br />
13 17 Securityhunter Inc.<br />
Baltimore, Md.<br />
14 19 Entech Sales & Service Inc.<br />
Dallas, Texas<br />
15 14 Tech Systems Inc.<br />
Duluth, Ga.<br />
16 18 Universal Protection Security Systems<br />
Santa Ana, Calif.<br />
17 20 Unlimited Technology Inc.<br />
Chester Springs, Pa.<br />
18 25 Intertech Ci<br />
Pittsburgh, Pa.<br />
19 28 SIGNET Electronic Systems Inc.<br />
Norwell, Mass.<br />
20 43 Mountain Alarm<br />
Ogden, Utah<br />
21 24 Interface Security Systems Holdings Inc.<br />
Earth City, Mo.<br />
22 23 Genesis Security Systems LLC<br />
Germantown, Md.<br />
23 40 GSI<br />
Troy, Mich.<br />
$3,054,000,000e<br />
na na na 10,000e<br />
200<br />
e<br />
$471,000,000 11,260 $350,000,000 na 2,161 67<br />
$314,000,000 3,330 $225,000,000 govt, corp, edu 637 118<br />
$144,700,000e na na na 500e 31e<br />
$100,000,000 3,900 $119,000,000 corp, health, hotel 1,400 37<br />
$80,500,000 na na corp 421 10<br />
$77,875,785 852 $48,856,979 na 494 17<br />
$74,910,250 5,692 $75,000,000 retail, transport, health 1,375 35<br />
$70,000,000 na $70,000,000 utilities, edu 288 19<br />
$59,442,000 na na utilities, financial, health 205 8<br />
$45,350,000 6,109 $42,175,000 retail, airport, corp 400 15<br />
$44,975,048 1,498 $42,382,000 na 231 5<br />
$42,800,466 39 $42,800,466 govt 39 1<br />
$39,780,000 131 $39,780,000 na 268 8<br />
$36,680,941 1,300 $36,405,462 health, financial 256 2<br />
$34,116,944 1,336 na na 278 13<br />
$32,409,000 785 na na 77 5<br />
$31,177,503 12 $23,574,000 na 183 8<br />
$30,700,000 880 $30,700,000 govt, edu, health 63 3<br />
$26,854,919 3,500 $17,956,101 na 214 10<br />
$24,511,035 15,000 $33,400,000 na 683 15<br />
$23,500,000 35 $18,000,000 corp, utilities, financial 61 1<br />
$23,400,000 na $23,400,000 industrial, financial,<br />
utilities<br />
87 2<br />
■ No. 2 – Acquired and integrated GS Security and Dakota Security. SDM’s 2007 and 2012 Systems Integrator of the Year. ■ No. 3 – Double-digit growth in sales volume and ended year with largest<br />
projects backlog to date. SDM’s 2009 Systems Integrator of the Year. ■ No. 6 – Launched KastlePresence; IoT platform available in the App Store. SDM’s 2015 Systems Integrator of the Year. ■ No.<br />
7 – SDM’s 2013 Systems Integrator of the Year (and 2008 as Adesta). ■ No. 8 – SDM’s 2015 Dealer of the Year. ■ No. 13 – Captured Social Security Administration Blanket Purchase Agreement<br />
for $210 M for the next 5 years. ■ No. 15 – SDM’s 2004 Systems Integrator of the Year. ■ No. 17 – Developed and launched a big data offering. SDM’s 2014 Systems Integrator of the Year. ■ No.<br />
19 – Closed a $1,890,000 prison security project. ■ No. 21 – Won contract for multiple security/video solutions with 4,100-site retailer.<br />
e = SDM estimate. na = not available. Abbreviations to markets: airport = airports; corp = corporate office space; correctional = correctional; edu = education/campus; entertainment =<br />
entertainment/sports venues; financial = financial/banking; gaming = casinos/gaming; govt = government; health = healthcare; hotels = hotels/hospitality; industrial = industrial; law = law<br />
enforcement; retail = retail/restaurants; transport = transportation/distribution; utilities = utilities/critical infrastructure.<br />
62 July 2016
21 st ANNUAL REPORT<br />
Continued from page 61<br />
“In general, we participated in a strong market in 2015; good<br />
economic trends in many of the markets we serve helped to drive<br />
strong sales performance,” notes ADS Security, ranked No. 48,<br />
reporting 14.1 percent higher integration revenue. “While we<br />
saw growth across the board, we especially saw strong growth in<br />
our commercial segment and, in particular, with our cloud-based<br />
services such as SecureDoor (managed access control) and our<br />
family of RemoteView video (cloud based video storage).”<br />
Integrated Security Technologies says, “We are still looking<br />
to see the cloud services end of the business take off. It has<br />
been discussed more frequently but we anticipate some activity<br />
taking hold in 2016.”<br />
Other integrators also commented on factors that contributed<br />
to a strong marketplace:<br />
Telenet VoIP Inc. (No. 92): “Overall the market seemed to<br />
be healthier, margins seemed to stay flat but more opportunities<br />
were available for bidding. After structured cabling, and<br />
network upgrades, CCTV and access control seem to continue<br />
to be the focal point of educational entities.<br />
Advanced Electronic Solutions (No. 51): “2015 was a<br />
strong year for AES. We had many upgrades to IP systems<br />
as well as a number of new major projects. Profits increased<br />
as opposed to 2014.”<br />
Sentry Security (No. 94): “Market was strong in 2015. Integrated<br />
systems dominated.”<br />
Security Integrations (No. 40): “The market was strong,<br />
fueled by upgrades from analog CCTV to IP-based solutions.”<br />
Tele-Tector of Maryland Inc. (No. 68): “The market was<br />
strong in the area of upgrading analog systems to IP base.”<br />
Perhaps most telling about the direction that things are heading<br />
in comes from an observation by MidCo Inc., ranked No.<br />
28: “There is a need for more network-savvy systems integrators<br />
like MidCo.”<br />
Not only are offerings of cloud-based and managed security<br />
solutions growing, but the market is desiring — and demand-<br />
Continues on page 68<br />
Guide to Reading the Top Systems Integrators Report<br />
Top Systems Integrators:<br />
2015 Performance Statistics<br />
Total North American<br />
systems integration<br />
revenue:<br />
Total North American revenue from systems integration for<br />
the 100 largest integrators reached $5.63 billion in 2015<br />
from solutions such as design, project management,<br />
product, installation, programming, start-up, and training<br />
sold directly to an end-user customer or through a tier of<br />
contractors. It does not include recurring revenue from<br />
service and monitoring, as integrators were asked to report<br />
that amount separately in order to be ranked on the SDM<br />
100, a report based on RMR in the security industry. A<br />
comparison between the top 100 companies ranked this<br />
year and the top 100 ranked in 2015 shows a 17.34<br />
percent decrease in systems integration revenue. This<br />
can be attributed to the fact that several of the largest<br />
systems integrators either did not reply to SDM’s requests<br />
for information, could not comply due to restrictions of<br />
being publicly held, or were omitted due to acquisition<br />
(includes Diebold Security – will report next year as<br />
Securitas Electronic Security Inc.; Stanley Convergent<br />
Security Solutions; Protection 1; Schneider Electric; SDI;<br />
DTT; and Dakota Security Systems, among the top 25).<br />
Source: SDM Top Systems Integrators Report, July 2016<br />
2014 2015<br />
$6.83 billion $5.63 billion<br />
New systems started: 123,849 112,352<br />
Total full-time<br />
employed:<br />
Business locations<br />
operated:<br />
39,971 27,785<br />
1,164 894<br />
The 2016 Top Systems Integrators Report ranks North<br />
American companies by their security systems integration<br />
revenue. This ranking is based on data provided to<br />
or, in a few cases, estimated by SDM. Ranked companies<br />
were asked to submit either an audited or reviewed<br />
financial statement, or a copy of their income tax return<br />
showing total gross receipts for the stated period. The<br />
vast majority of the firms ranked are privately held.<br />
The main table, which begins on page 62, ranks<br />
100 companies by their North American revenue in<br />
2015 from their security system integration projects.<br />
Integration includes solutions such as design, project<br />
management, product, installation, programming, startup,<br />
training, and time-and-materials-based service sold<br />
directly to an end-user customer or through a tier of contractors.<br />
This includes revenue related to security, such<br />
as: access control, ID/badging, video surveillance/analytics,<br />
intrusion alarms, perimeter security, electronic gate<br />
entry, intercom/communications, fire protection, etc. It<br />
does not include recurring revenue, as that is counted<br />
towards ranking on the SDM 100 (www.SDMmag.com/<br />
SDM100Report).<br />
Note: an e following the figure indicates it is an SDM<br />
estimate.<br />
To find a company by name, use the alphabetical index<br />
on page 78.<br />
July 2016 63
2016<br />
21 st ANNUAL REPORT<br />
North American Number of New Value of<br />
2016 2015 Company & Headquarters Systems Integration Non-Residential Non-Residential Top 3 Markets Full-time Business<br />
Rank Rank Location Revenue 2015 Projects, 2015 Projects, 2015 Contributing to Revenue Employees Locations<br />
24 Access Systems Integration<br />
Eatontown, N.J.<br />
25 26 Security Corporation<br />
Novi, Mich.<br />
26 31 Advanced Cabling Systems<br />
North Little Rock, Ark.<br />
27 32 Low Voltage Contractors Inc.<br />
Minneapolis, Minn.<br />
28 35 MidCo Inc.<br />
Burr Ridge, Ill.<br />
29 33 MSE Corporate Security<br />
Branchburg, N.J.<br />
30 27 Sound Incorporated<br />
Naperville, Ill.<br />
31 30 Integrated Security Technologies<br />
Herndon, Va.<br />
32 34 Allied Fire & Security<br />
Spokane, Wash.<br />
33 55 NextGen Security LLC<br />
King of Prussia, Pa.<br />
34 39 Security Equipment Inc.<br />
Omaha, Neb.<br />
35 49 Tutela Inc.<br />
Brunswick, Ga.<br />
36 52 ACT<br />
Clifton, N.J.<br />
37 36 KST Security<br />
Indianapolis, Ind.<br />
38 45 Firstline Security Systems Inc.<br />
Anaheim, Calif.<br />
39 37 CTSI<br />
Chantilly, Va.<br />
40 56 Security Integrations<br />
Albany, N.Y.<br />
41 38 TRL Systems Inc.<br />
Rancho Cucamonga, Calif.<br />
42 42 American Alarm & Communications<br />
Arlington, Mass.<br />
43 82 Redrock Security & Cabling Inc.<br />
Irvine, Calif.<br />
44 46 The Protection Bureau<br />
Exton, Pa.<br />
45 47 Security and Data Technologies Inc.<br />
Newtown, Pa.<br />
46 58 RAE Security<br />
Houston, Texas<br />
$23,002,793 668 $19,687,594 na 80 1<br />
$22,824,416 na na na 112 2<br />
$22,819,000 50 $22,800,000 corp, edu, financial 168 4<br />
$22,630,743 1,179 $18,292,158 financial, govt, health 113 3<br />
$21,125,410 3,150 $20,000,000 corp, utilities, edu 101 3<br />
$20,400,000 na na retail, health,<br />
entertainment<br />
84 6<br />
$20,200,000 200 $19,912,117 edu, corp, financial 77 1<br />
$20,180,000 805 $20,180,000 govt, health, edu 83 2<br />
$20,000,000 180 $15,800,000 corp, health, edu 81 3<br />
$19,137,505 640 $19,137,505 utilities, industrial, health 58 3<br />
$18,029,072 2,483 $14,744,687 edu, health, corp 167 4<br />
$17,600,000 883 $16,115,671 na 54 15<br />
$16,965,000 84 $12,000,000 health, edu, financial 39 2<br />
$16,343,788 300 $13,415,607 health, industrial, corp 63 4<br />
$15,750,000 235 $11,500,000 utilities, financial, corp 58 3<br />
$15,055,298 147 $11,285,592 govt, health, edu 48 1<br />
$14,986,083 200 $12,000,000 law, utilities, industrial 37 3<br />
$14,967,269 513 $14,967,269 na 177 5<br />
$14,889,368 4,534 $14,934,718 property mgmt, govt,<br />
financial<br />
204 5<br />
$14,874,642 98 $14,874,642 apartments, corp 45 2<br />
$14,850,000 1,300 $7,810,128 retail, corp, edu 180 4<br />
$14,021,173 288 $12,887,952 na 95 1<br />
$13,314,318 300 $13,000,000 na 45 1<br />
■ No. 24 – Completed management buy-out from MSA Security and began operating as an independent company. ■ No. 27 – Secured a large state hospital project, which called for multiple disciplines<br />
and platforms. ■ No. 28 – Global international integrated system in the Middle East. ■ No. 33 – Achieved DHS SAFETY Act Designation for Perimeter Protection Services. ■ No. 34 – Consolidated<br />
from two separate buildings into a new corporate headquarters including moving UL central station. ■ No. 35 – In process of overhauling all administrative software to a new ERM platform. Opened<br />
three new full-service locations: Charlotte, N.C.; Sunrise, Fla.; and Anaheim, Calif., as well as New York City in March 2016. ■ No. 40 – Acquired a small IT services company. ■ No. 44 – Celebrated<br />
40 years in business as a family-owned company.<br />
e = SDM estimate. na = not available. Abbreviations to markets: airport = airports; corp = corporate office space; correctional = correctional; edu = education/campus; entertainment =<br />
entertainment/sports venues; financial = financial/banking; gaming = casinos/gaming; govt = government; health = healthcare; hotels = hotels/hospitality; industrial = industrial; law = law<br />
enforcement; retail = retail/restaurants; transport = transportation/distribution; utilities = utilities/critical infrastructure.<br />
64 July 2016
21 st ANNUAL REPORT<br />
Largest Project in 2015: $26 Million<br />
Company<br />
Value of 2016<br />
Largest Project Rank<br />
Johnson Controls Inc. ......$26,000,000 ..........3<br />
Interface Security<br />
Systems Holdings Inc. .....$14,800,000 ........21<br />
Convergint<br />
Technologies....................$10,000,000 ..........2<br />
Minuteman Security<br />
Technologies Inc. ...............$8,087,960 ........53<br />
G4S Secure<br />
Integration LLC..................$7,500,000 ..........7<br />
Security Integrations .........$5,400,000 ........40<br />
Securityhunter Inc. ............$5,211,003 ........13<br />
Red Hawk Fire &<br />
Security .............................$5,000,000 ..........5<br />
VTI Security .......................$5,000,000 ........10<br />
NextGen Security, LLC ........$5,000,000 ........33<br />
ACT....................................$3,956,240 ........36<br />
RAE Security ......................$3,200,000 ........46<br />
Midstate Security<br />
Company ...........................$2,983,555 ........50<br />
Telenet VoIP Inc. ................$2,883,232 ........92<br />
Advanced Electronic<br />
Solutions ...........................$2,575,000 ........51<br />
Unlimited<br />
Technology Inc. ..................$2,200,000 ........17<br />
Integrated Security<br />
Technologies......................$2,168,400 ........31<br />
MidCo Inc. .........................$2,147,000 ........28<br />
RFI Communications<br />
& Security Systems............$2,100,000 ........12<br />
Mountain Alarm.................$2,000,000 ........20<br />
Sound Incorporated ...........$2,000,000 ........30<br />
Firstline Security<br />
Systems Inc. ......................$1,940,000 ........38<br />
SIGNET Electronic<br />
Systems Inc. ......................$1,900,000 ........19<br />
Genesis Security<br />
Systems LLC ......................$1,800,000 ........22<br />
CTSI...................................$1,763,328 ........39<br />
GSI ....................................$1,750,000 ........23<br />
Advanced Cabling<br />
Systems.............................$1,750,000 ........26<br />
AFA Protective<br />
Systems Inc. ......................$1,597,000 ........11<br />
Tele-Tector of<br />
Maryland, Inc. ...................$1,568,250 ........68<br />
Universal Protection<br />
Security Systems ...............$1,529,672 ........16<br />
TRL Systems Inc. ...............$1,400,000 ........41<br />
Value of 2016<br />
Company Largest Project Rank<br />
Strategic Security<br />
Solutions ...........................$1,400,000 ........83<br />
Tech Systems Inc. ..............$1,260,402 ........15<br />
Entech Sales &<br />
Service Inc.........................$1,247,783 ........14<br />
Intertech Ci .......................$1,200,000 ........18<br />
KST Security ......................$1,200,000 ........37<br />
Low Voltage<br />
Contractors Inc..................$1,142,000 ........27<br />
Life Safety Engineered<br />
Systems Inc. ......................$1,100,000 ........54<br />
Tutela Inc. ............................$982,000 ........35<br />
Scarsdale Security<br />
Systems Inc. .........................$975,000 ........60<br />
Access Systems<br />
Integration ...........................$935,094 ........24<br />
Redrock Security &<br />
Cabling Inc...........................$920,000 ........43<br />
CGL Electronic Security Inc. ..$765,000 ........56<br />
Security Equipment Inc. .......$663,528 ........34<br />
Security and Data<br />
Technologies Inc. ..................$635,969 ........45<br />
Allied Fire & Security ............$600,000 ........32<br />
Engineered Security<br />
Systems................................$590,224 ........87<br />
Guardian Protection<br />
Services................................$569,545 ........62<br />
Electronic Security<br />
Concepts LLC .......................$535,000 ........72<br />
The Protection Bureau ..........$503,170 ........44<br />
Will Electronics.....................$500,000 ........71<br />
APL Access & Security Inc. ...$450,000 ........65<br />
Kimberlite Corp. ...................$449,767 ........89<br />
MSE Corporate Security ........$440,000 ........29<br />
D/A Central Inc. ....................$433,000 ........70<br />
Per Mar Security Services .....$432,000 ........69<br />
PASS Security .......................$425,000 ........64<br />
New York Security Solutions ..$412,682 ........88<br />
Vector Security Inc. ...............$375,000 ..........8<br />
Sonitrol of Buffalo,<br />
Rochester, Toronto ................$375,000 ........96<br />
American Alarm &<br />
Communications ..................$356,000 ........42<br />
Vision Security<br />
Technologies.........................$342,193 ........63<br />
Stone Security ......................$341,061 ........59<br />
Sonitrol New England ...........$317,187 ........57<br />
Largest Project Winner:<br />
Johnson Controls<br />
Customer:<br />
New York Power Authority<br />
Johnson Controls will, for up to a two-year<br />
term, engineer, procure and construct systems<br />
associated with physical and cyber<br />
security upgrades in order to maintain<br />
compliance with the North American Electric<br />
Reliability Corporation’s Critical Infrastructure<br />
Protection (NERC CIP), Version 5<br />
Standards. The upgrades consist of physical<br />
and cyber security enhancements,<br />
including cameras, access controls<br />
and methods of preventing and detecting<br />
intrusion in Authority substations.<br />
The contract includes work at five of the<br />
Authority’s generation and transmission<br />
facilities and eight remote substations.<br />
Company<br />
Value of 2016<br />
Largest Project Rank<br />
Southeastern Security<br />
Professionals LLC .................$295,000 ........79<br />
Sentry Security .....................$290,000 ........94<br />
EMC Security ........................$280,000 ........95<br />
Matson Alarm Co. Inc. ..........$275,000 ........85<br />
SCI Inc..................................$250,000 ........90<br />
Peak Alarm Co. Inc. ..............$225,000 ........81<br />
Atronic Alarms Inc. ...............$197,695 ........78<br />
F.E. Moran Inc. Alarm and<br />
Monitoring Services ..............$194,590 ........47<br />
Custom Security Systems .....$173,000 ........99<br />
Bates Security LLC /<br />
Sonitrol of Lexington.............$131,000 ........77<br />
Sonitrol Pacifi c .....................$111,910 ........86<br />
Fleenor Security Systems ......$108,965 ........82<br />
Sonitrol of Sacramento<br />
& Orange County,<br />
Cybex Security ......................$106,598 ........76<br />
Sonitrol Tri-County................$102,000 ........97<br />
These 78 systems integrators reported having the highest-value security projects started in 2015. Note: Four of the top 10<br />
companies did not report their largest project size, as requested by SDM. Projects below $100,000 are not ranked here.<br />
Source: SDM Top Systems Integrators Report, July 2016<br />
July 2016 65
2016<br />
21 st ANNUAL REPORT<br />
North American Number of New Value of<br />
2016 2015 Company & Headquarters Systems Integration Non-Residential Non-Residential Top 3 Markets Full-time Business<br />
Rank Rank Location Revenue 2015 Projects, 2015 Projects, 2015 Contributing to Revenue Employees Locations<br />
47 29 F.E. Moran Inc. Alarm<br />
and Monitoring Services<br />
Champaign, Ill.<br />
48 54 ADS Security L.P.<br />
Nashville, Tenn.<br />
49 44 SSD Alarm Systems / Kern Security &<br />
Fire / Alpha Alarm & McNeill Security<br />
Anaheim, Calif.<br />
50 53 Midstate Security Company<br />
Wyoming, Mich.<br />
51 66 Advanced Electronic Solutions<br />
College Point, N.Y.<br />
52 62 Alarm Detection Systems Inc.<br />
Aurora, Ill.<br />
53 50 Minuteman Security Technologies Inc.<br />
Andover, Mass.<br />
54 Life Safety Engineered Systems Inc.<br />
Buffalo, N.Y.<br />
55 67 Operational Security Systems Inc.<br />
Atlanta, Ga.<br />
56 CGL Electronic Security Inc.<br />
Westwood, Mass.<br />
57 65 Sonitrol New England<br />
Rocky Hill, Conn.<br />
58 59 Dallas Security Systems Inc.<br />
& DSS Fire Inc.<br />
Dallas, Texas<br />
59 80 Stone Security<br />
Salt Lake City, Utah<br />
60 63 Scarsdale Security Systems Inc.<br />
Scarsdale, N.Y.<br />
61 71 AVS Technology<br />
Totowa, N.J.<br />
62 69 Guardian Protection Services<br />
Warrendale, Pa.<br />
63 Vision Security Technologies<br />
Birmingham, Ala.<br />
64 68 PASS Security<br />
Fairview Heights, Ill.<br />
65 75 APL Access & Security Inc.<br />
Gilbert, Ariz.<br />
66 60 Sentry Communications & Security<br />
Hicksville, N.Y.<br />
67 73 Ackerman Security Systems<br />
Atlanta, Ga.<br />
$13,150,482 1,693 $14,571,930 retail, financial, hotel 174 6<br />
$12,800,224 4,375 $6,491,100 retail, corp, industrial 334 19<br />
$12,281,070 na na na na 12<br />
$11,741,165 228 $11,493,165 correctional, health, retail 78 1<br />
$11,535,000 82 na na 75 3<br />
$11,228,103 1,024 $6,624,966 na 306 4<br />
$11,170,235 693 $11,170,235 na 46 3<br />
$10,211,516 119 $5,965,746 na 72 4<br />
$9,664,676 315 na edu, financial, health na 2<br />
$9,302,874 104 $8,536,027 na 43 1<br />
$9,254,435 1,236 $7,534,241 edu, corp, industrial 97 5<br />
$8,140,330 2,500 $8,140,330 na 140 2<br />
$8,126,967 247 $4,860,721 edu, govt, transport 24 2<br />
$7,828,922 1,206 $7,304,651 retail, corp, airport 101 2<br />
$7,750,000 na na na 60 3<br />
$7,574,579 4,223 $7,574,579 retail, health, edu 1,048 14<br />
$7,200,000 100 $6,200,000 edu, govt, health na 2<br />
$7,179,516 500 $7,179,516 na 48 1<br />
$7,056,574 50 $5,000,000 corp, govt, health 40 2<br />
$6,900,000 250 $5,800,000 corp, transport, health na 1<br />
$6,610,393 2,120 $5,024,665 retail, health, govt 319 2<br />
■ No. 48 – Formally introduced ADS +Rewards Customer Loyalty program, which allows existing customers to earn loyalty rebates towards system upgrades based upon their tenure with ADS.■ No.<br />
52 – Purchased Safe Systems Inc., Louisville, Colo. ■ No. 53 – Introduced TransitSentry v1.5, a wireless mass transit video surveillance platform developed by Minuteman. ■ No. 56 – Outgrew<br />
Norwood, Mass., facility and acquired a 13,275 sq. ft. state-of-the-art facility in Westwood, Mass., which includes a customer training center and a technology lab. ■ No. 57 – Full integration of<br />
Mutualink into central station to help leverage verified dispatch to the PSAP. ■ No. 59 – Adding another higher-education organization to client roster: Salt Lake Community College, Utah’s largest<br />
college serving more than 60,000 students on 10 campuses. ■ No. 62 – Opened a second central station in Arizona; the centers in Arizona and Pennsylvania will operate as if they are one, while<br />
enabling independent redundancy. In addition to Customer Care Operations, Data Services, and Technical Support, the site also will incorporate a state-of-the-art training facility.<br />
e = SDM estimate. na = not available. Abbreviations to markets: airport = airports; corp = corporate office space; correctional = correctional; edu = education/campus; entertainment =<br />
entertainment/sports venues; financial = financial/banking; gaming = casinos/gaming; govt = government; health = healthcare; hotels = hotels/hospitality; industrial = industrial; law = law<br />
enforcement; retail = retail/restaurants; transport = transportation/distribution; utilities = utilities/critical infrastructure.<br />
66 July 2016
2016<br />
21 st ANNUAL REPORT<br />
Integrators’ Sales Revenue<br />
By Product Category<br />
Top Systems Integrators were asked to break out their<br />
2015 revenue by type of product. The majority is earned<br />
from integrated non-residential systems that combine<br />
two or more different technology solutions. No significant<br />
changes were recorded from 2014 to 2015 in the percentage<br />
of revenue from these types of products.<br />
Badging<br />
1%<br />
IT hardware/<br />
software<br />
1%<br />
Intercom/<br />
communications<br />
2%<br />
Integrated<br />
residential<br />
systems<br />
3%<br />
Continued from page 63<br />
ing — solutions that deliver “big data.” There is also a greater<br />
emphasis on cybersecurity, say the integrators of their clients.<br />
“ITO and big data will continue to be a focus of our goforward<br />
strategy. The industry is way behind other industries<br />
in the use of data. Video analytic metadata is going to become<br />
very valuable,” claims D/A Central Inc., ranked No. 70.<br />
Therefore, the need for security systems integrators to become<br />
more network-savvy is greater than ever. When asked what<br />
percentage of projects sold in 2015 incorporated IP-based technology,<br />
45 percent of systems integrators noted that between<br />
three-fourths and 100 percent of their projects incorporated IP.<br />
WHICH MARKETS ARE SPENDING?<br />
A handful of vertical segments stood out as front-runners<br />
in spending on integrated security products and services:<br />
education (especially higher-ed), healthcare, utilities/critical<br />
infrastructure, and transportation/logistics. Integrators also<br />
mentioned:<br />
• Energy<br />
• Retail (especially<br />
multi-location)<br />
• Banking<br />
68 July 2016<br />
Other<br />
1%<br />
Fire protection<br />
9%<br />
Intrusion alarms<br />
10%<br />
Integrated<br />
non-residential<br />
systems<br />
42%*<br />
Video<br />
surveillance<br />
18%<br />
Access control<br />
13%<br />
*percentage of Top Systems Integrators’ 2015 sales revenue; based on 89 responses.<br />
Source: SDM Top Systems Integrators Report, July 2016<br />
• Multi-unit residential<br />
• Hospitality<br />
• Government<br />
• Banking<br />
Integrators’ Sales Revenue<br />
By Service Category<br />
Top Systems Integrators were asked to break out their<br />
2015 revenue by type of service. The majority is earned<br />
from system sales and installation. No significant changes<br />
were recorded from 2014 to 2015 in the percentage<br />
of revenue from these types of services.<br />
Equipment leases<br />
1%<br />
Sales/installation<br />
58%*<br />
Hosted/managed<br />
services<br />
2%<br />
Test and<br />
inspection<br />
3%<br />
Non-contracted<br />
service<br />
7%<br />
Service contracts<br />
11%<br />
*percentage of Top Systems Integrators’ 2015 service revenue; based on 93 responses.<br />
Source: SDM Top Systems Integrators Report, July 2016<br />
Monitoring<br />
18%<br />
No. 2-ranked Convergint Technologies emphasizes the<br />
broad-reaching application of video <strong>technologies</strong>: “The market<br />
for security systems sales and integrated systems continued its<br />
strong growth in 2015. Video sales continue to dominate as customers<br />
begin to look beyond traditional security applications<br />
and start looking at using video for manufacturing, process<br />
improvement, regulatory compliance, etc.<br />
“The best growth came from the utility segment as these<br />
customers continue to be concerned about the security of their<br />
infrastructures. With the downturn in the price of oil, petrochemical<br />
has been hit the hardest in terms of being weak in<br />
2015,” Convergint says.<br />
No. 7-ranked G4S Secure Integration LLC, calls out critical<br />
infrastructure as a leading sector. “Our strongest sector is<br />
definitely critical infrastructure. We see tons of potential in that<br />
market to adhere by NERC/CIP regulations and see ourselves<br />
as one of the best providers,” the company says.<br />
No. 59, Stone Security, says the positive marketplace had a<br />
constructive effect on its operations. “We felt the market was<br />
stronger in 2015 than 2014 especially in education and industrial<br />
markets. We were forced to add a number of people to the<br />
organization to keep up with increased demand in 2015.”<br />
No. 81-ranked Peak Alarm Co. Inc., affirms that spending on<br />
integrated security solutions continues to hold up. “The market<br />
in 2015 continued to be strong in security systems sales driven<br />
Continues on page 76
2016<br />
21 st ANNUAL REPORT<br />
North American Number of New Value of<br />
2016 2015 Company & Headquarters Systems Integration Non-Residential Non-Residential Top 3 Markets Full-time Business<br />
Rank Rank Location Revenue 2015 Projects, 2015 Projects, 2015 Contributing to Revenue Employees Locations<br />
68 Tele-Tector of Maryland Inc.<br />
Columbia, Md.<br />
69 76 Per Mar Security Services<br />
Davenport, Iowa<br />
70 D/A Central Inc.<br />
Oak Park, Mich.<br />
71 77 Will Electronics<br />
St. Louis, Mo.<br />
72 83 Electronic Security Concepts LLC<br />
Scottsdale, Ariz.<br />
73 89 Artel Communications Corp.<br />
Plainview, N.Y.<br />
74 DynaFire Inc.<br />
Casselberry, Fla.<br />
75 Atlantic Coast Alarm Inc.<br />
Mays Landing, N.J.<br />
76 95 Sonitrol of Sacramento & Orange<br />
County, Cybex Security<br />
Roseville, Calif.<br />
77 84 Bates Security LLC / Sonitrol of Lexington<br />
Lexington, Ky.<br />
78 87 Atronic Alarms Inc.<br />
Lenexa, Kan.<br />
79 Southeastern Security Professionals LLC<br />
Norcross, Ga.<br />
80 88 Select Security<br />
Lancaster, Pa.<br />
81 86 Peak Alarm Co. Inc.<br />
Salt Lake City, Utah<br />
82 90 Fleenor Security Systems<br />
Johnson City, Tenn.<br />
83 Strategic Security Solutions<br />
Raleigh, N.C.<br />
84 Acadiana Security Plus<br />
Broussard, La.<br />
85 92 Matson Alarm Co. Inc.<br />
Fresno, Calif.<br />
86 96 Sonitrol Pacific<br />
Portland, Ore.<br />
87 81 Engineered Security Systems<br />
Towaco, N.J.<br />
88 New York Security Solutions<br />
Brooklyn, N.Y.<br />
89 85 Kimberlite Corp.<br />
Fresno, Calif.<br />
90 93 SCI Inc.<br />
Albuquerque, N.M.<br />
$6,518,284 303 $6,286,200 health, govt, corp 88 1<br />
$6,516,917 5,023 $19,946,615 na 354 14<br />
$6,382,534 245 $6,632,000 industrial, financial,<br />
health<br />
42 2<br />
$6,043,266 na $4,731,430 na 26 1<br />
$6,008,263 510 $4,500,000 govt, health, edu 32 1<br />
$6,000,000 15 $6,000,000 na 10 1<br />
$5,885,805 240 $5,878,000 na 146 4<br />
$5,821,709 na na govt, health, edu 33 3<br />
$5,323,594 392 $5,296,129 corp, govt, industrial 49 2<br />
$5,310,823 561 $3,244,624 edu, corp, industrial 54 1<br />
$5,267,958 708 $2,893,178 corp, hotel, retail 53 1<br />
$5,261,967 374 $4,533,151 na 31 1<br />
$5,117,000 na $5,117,000 retail, financial, hotel 161 10<br />
$4,731,871 1,366 $3,100,000 corp, industrial, retail 88 4<br />
$4,563,074 575 $2,772,076 industrial, health, corp 54 1<br />
$4,342,717 1,086 na health, corp, edu 12 1<br />
$3,651,391 193 $1,222,667 govt, industrial, corp 80 1<br />
$3,155,762 1,114 $2,109,730 na 68 4<br />
$3,061,422 415 $3,006,422 edu, corp, govt 82 5<br />
$2,940,471 210 $2,620,471 na 48 4<br />
$2,875,608 600 $2,875,608 na 13 1<br />
$2,868,000 36 $2,843,000 edu, law, govt 108 8<br />
$2,814,303 252 $1,932,461 govt, utilities 13 1<br />
■ No. 73 – Opened 10 new school projects and secured two major NYCT contracts. ■ No. 77 – Acquired Kentucky Alarm Services. ■ No. 79 – Joined PSA co-op as an owner company. ■ No. 81 –<br />
Launched PeakEdge, an access control package centered on an affordable entry point with aggressive RMR generation. This is in addition to PeakLink and PeakView, security and video surveillance<br />
packages. ■ No. 82 – In 2015 began the process of converting estimating and CRM system to WeSuite. Also in the final stages of getting central station UL listed. ■ No. 86 – Recognized as Sonitrol<br />
Dealer of the Year at the 2015 Sonitrol National Dealers Association. ■ No. 88 – Became an exclusive safety and security provider for six NYC public hospitals. ■ No. 89 – Completed technology and<br />
communication infrastructure upgrade.<br />
e = SDM estimate. na = not available. Abbreviations to markets: airport = airports; corp = corporate office space; correctional = correctional; edu = education/campus; entertainment =<br />
entertainment/sports venues; financial = financial/banking; gaming = casinos/gaming; govt = government; health = healthcare; hotels = hotels/hospitality; industrial = industrial; law = law<br />
enforcement; retail = retail/restaurants; transport = transportation/distribution; utilities = utilities/critical infrastructure.<br />
70 July 2016
2016<br />
21 st ANNUAL REPORT<br />
North American Number of New Value of<br />
2016 2015 Company & Headquarters Systems Integration Non-Residential Non-Residential Top 3 Markets Full-time Business<br />
Rank Rank Location Revenue 2015 Projects, 2015 Projects, 2015 Contributing to Revenue Employees Locations<br />
91 94 Redwire / Sonitrol of Tallahassee,<br />
Bay, NW FL, EC FL<br />
Tallahassee, Fla.<br />
92 Telenet VoIP Inc.<br />
El Segundo, Calif.<br />
93 Washington Alarm Inc.<br />
Seattle, Wash.<br />
94 Sentry Security<br />
Wheeling, Ill.<br />
95 97 EMC Security<br />
Suwanee, Ga.<br />
96 98 Sonitrol of Buffalo, Rochester, Toronto<br />
Buffalo, N.Y.<br />
97 99 Sonitrol Tri-County<br />
Grand Blanc, Mich.<br />
98 100 World Wide Security & GC Alarm Inc.<br />
Garden City, N.Y.<br />
99 91 Custom Security Systems<br />
Lacey, Wash.<br />
100 Sonitrol Security Systems of the Triangle<br />
Raleigh, N.C.<br />
$2,810,323 na na na 73 6<br />
$2,741,179 68 $8,355,120 edu, corp, industrial 52 1<br />
$2,715,772 337 $1,403,031 edu, corp, industrial 53 2<br />
$2,645,261 156 $2,395,000 hotel, financial, industrial 25 1<br />
$2,600,000 840 $2,886,999 edu, corp, utilities 127 1<br />
$2,475,500 297 $4,151,771 industrial, corp, transport 78 3<br />
$2,255,429 883 $2,181,000 corp, industrial, transport 60 3<br />
$2,101,113 na na hotel, edu, corp 53 2<br />
$2,060,910 412 $2,060,910 edu, corp, utilities 99 3<br />
$1,749,882 180 $1,750,000 corp, health, industrial 25 1<br />
■ No. 92 – Design and installation of the IP audio/video intercom system for Marlton School for the Deaf. ■ No. 95 – Major Georgia theme park facility landed for systems and monitoring.<br />
e = SDM estimate. na = not available. Abbreviations to markets: airport = airports; corp = corporate office space; correctional = correctional; edu = education/campus; entertainment =<br />
entertainment/sports venues; financial = financial/banking; gaming = casinos/gaming; govt = government; health = healthcare; hotels = hotels/hospitality; industrial = industrial; law = law<br />
enforcement; retail = retail/restaurants; transport = transportation/distribution; utilities = utilities/critical infrastructure.<br />
Top 10 Integrators<br />
By Total Revenue<br />
Among companies ranked on the Top Systems Integrators<br />
Report, these businesses reported (or were estimated by<br />
SDM) the highest total revenue in 2015: Johnson Controls,<br />
Tyco Integrated Security, and Convergint Technologies<br />
are the top three.<br />
Company<br />
Total Revenue<br />
Johnson Controls Inc. $4,443,000,000<br />
Tyco Integrated Security $3,879,000,000<br />
Convergint Technologies LLC $471,000,000<br />
Vector Security Inc. $300,800,000<br />
Red Hawk Fire & Security $220,000,000<br />
Guardian Protection Services $187,406,066<br />
Interface Security Systems Holdings Inc. $149,400,000<br />
Kratos Public Safety & Security Solutions Inc. $144,700,000<br />
G4S Secure Integration LLC $136,521,182<br />
Entech Sales & Service Inc. $102,000,000<br />
Source: SDM Top Systems Integrators Report, July 2016<br />
Integrators Predict<br />
Performance in 2016<br />
Top Systems Integrators were asked, “How do you expect<br />
revenues in 2016 to compare with revenues in 2015?”<br />
Decrease<br />
1%<br />
Stay the same<br />
13%<br />
Increase<br />
86%*<br />
Nearly nine in 10 Top Systems Integrators (86 percent)<br />
expect their 2016 revenues to exceed 2015’s. These<br />
results exceed the expectations systems integrators had<br />
in 2015.<br />
*percentage of Top Systems Integrators indicating each answer; based<br />
on 91 responses<br />
Source: SDM Top Systems Integrators Report, July 2016<br />
72 July 2016
2016<br />
21 st ANNUAL REPORT<br />
Top 3 Market Sectors:<br />
Office Space, Education, Healthcare — Again<br />
Top Systems Integrators were asked to rank the sectors that<br />
provided the most significant portion of their 2015 revenue.<br />
2014<br />
1. Corporate<br />
2. Education/campus<br />
3. Healthcare<br />
4. Government<br />
5. Industrial<br />
6. Retail/restaurant<br />
7. Financial/banking<br />
8. Utilities/critical<br />
infrastructure<br />
2015<br />
1. Corporate<br />
2. Education/campus<br />
3. Healthcare<br />
4. Government<br />
5. Industrial<br />
6. Retail/restaurant<br />
7. Financial/banking<br />
8. Utilities/critical<br />
infrastructure<br />
9. Transportation/distribution 9. Transportation/distribution<br />
10. Hotel/hospitality 10. Hotel/hospitality<br />
& Airports<br />
(tied for this position)<br />
These top 10 market sectors provided the most significant<br />
portion of revenues to systems integrators in 2015<br />
— and the top 10 list is almost exactly the same yearover-year.<br />
For the past several years, corporate/property<br />
management, education, and healthcare have steadfastly<br />
been among the top market sectors for integrators.<br />
Source: SDM Top Systems Integrators Report, July 2016<br />
Integrators Give<br />
Thumbs up to Funding<br />
Top Systems Integrators were asked, “Do you think funding<br />
for security projects was generally better, worse, or about<br />
the same in 2015 as it was in 2014?”<br />
Don’t Know<br />
1%<br />
Worse<br />
5%<br />
About<br />
the same<br />
40%<br />
Better<br />
54%*<br />
Top Systems Integrators have a positive outlook on the state<br />
of funding for their clients’ security projects, citing conditions<br />
such as an increase in crime and concern for employee<br />
safety. One respondent said the economy is on the upswing,<br />
and fear of current events, such as active shooters, is helping<br />
to keep security projects active. Among the 5 percent<br />
who see funding as worse than the previous year, they cite<br />
frozen state funds, among other reasons.<br />
*percentage of Top Systems Integrators indicating each answer; based on 89<br />
responses<br />
Source: SDM Top Systems Integrators Report, July 2016<br />
Average Percentage of Jobs on an Integrator’s Staff<br />
This chart, which you can<br />
use to compare job titles<br />
in your own company with<br />
industry averages, shows<br />
the average percentage<br />
distribution of job titles<br />
among Top Systems<br />
Integrator companies.<br />
More than two-thirds of<br />
jobs (36 percent) are<br />
comprised of installation<br />
and technical service<br />
positions.<br />
*average percentage distribution<br />
of staff titles among systems<br />
integrators; based on 91 responses<br />
Source: SDM Top Systems<br />
Integrators Report, July 2016<br />
General management<br />
4%<br />
Executive<br />
management<br />
2%<br />
Administrative<br />
9%<br />
Customer service<br />
6%<br />
Finance<br />
4%<br />
Central station<br />
7%<br />
Sales/marketing<br />
12%<br />
Other<br />
8%<br />
Installation<br />
21%*<br />
Project management<br />
7%<br />
Technical service<br />
15%<br />
Engineering/<br />
design<br />
3%<br />
IT<br />
2%<br />
74 July 2016
2016<br />
21 st ANNUAL REPORT<br />
Top Systems Integrators: 8-Year Performance<br />
Billions $ (% change)<br />
9<br />
8<br />
7<br />
6<br />
5<br />
4<br />
3<br />
2<br />
1<br />
0<br />
$7.81*<br />
(17.1)<br />
2007<br />
$7.86<br />
(0.6)<br />
2008<br />
$8.05<br />
top 100 only<br />
(2.4)<br />
2009<br />
$7.14 †<br />
top 100 only<br />
(-11.3)<br />
2010<br />
$6.91<br />
top 100 only<br />
(-3.2)<br />
2011<br />
Year<br />
$6.31**<br />
top 100 only<br />
(-9)<br />
2012<br />
$7.36<br />
top 100 only<br />
17.5<br />
2013<br />
$6.81 ‡<br />
top 100 only<br />
(-7.1)<br />
2014<br />
$5.63***<br />
top 100 only<br />
(-17.3)<br />
2015<br />
North American systems integration revenue (as reported to<br />
or estimated by SDM) reached $5.63 billion in 2015, based<br />
on reporting from 100 Top Systems Integrators. This amount<br />
registers a 17.34 percent decrease, which is attributed to<br />
the omission of several large integrators from the report<br />
(see footnotes below and chart on page 63). For integrators<br />
whose revenue could be compared year-over-year, total<br />
systems integration revenue actually decreased 1 percent.<br />
*2007 figure reflects a correction to reported revenues for Johnson Controls and ADT,<br />
following incorrect reporting in 2006. While it appears that there was a 17 percent<br />
increase in total revenue between 2006 and 2007, it was actually 4 percent growth.<br />
†<br />
In the 2010 report, several notable companies did not participate, including SAIC,<br />
Red Hawk Security, North American Video, and National Security Systems Inc., which<br />
skewed the results. Among systems integrators for which a year-to-year comparison<br />
could be made, there was actually only a 4.4 percent decrease in performance<br />
between 2009 and 2010.<br />
**Two major factors contributed to the decrease in systems integration revenue; ADT<br />
was not ranked, and Siemens Industry Inc. systems integration revenue was adjusted<br />
downward by an SDM estimate.<br />
‡<br />
Siemens Industry Inc., which had been ranked in 2015 using estimated systems<br />
integration revenue, was not ranked in 2016. On the surface, it appears that Top<br />
Systems Integrators revenue declined 7.1 percent in 2015. When Siemens is<br />
removed from this calculation for comparison purposes, however, systems integration<br />
revenue for the top 100 companies grew very slightly, at 0.35 percent year-over-year.<br />
***A 17.34 percent decrease in systems integration revenue is attributable to the<br />
fact that several of the largest systems integrators either did not reply to SDM’s<br />
requests for information, could not comply due to restrictions of being publicly held,<br />
or were omitted due to acquisition (includes Diebold Security – will report next year as<br />
Securitas Electronic Security Inc.; Stanley Convergent Security Solutions; Protection<br />
1; Schneider Electric; SDI; DTT; and Dakota Security Systems, among the top 25).<br />
Source: SDM Top Systems Integrators Report, July 2016<br />
Continued from page 68<br />
by corporate spending arising from office and warehouse<br />
expansion. No specific market exhibited low or no growth.”<br />
In addition to specific drivers in individual market segments,<br />
the overall concern about active-shooter situations and terrorist<br />
episodes in general is casting its shadow across North America<br />
and spreading into the systems integration industry.<br />
“Terrorism in the news, especially domestic terrorism,<br />
has led to an increased focus on security. The education segment,<br />
in particular, has dedicated a large amount of budget to<br />
improving security,” writes No. 43-ranked Redrock Security<br />
& Cabling Inc.<br />
“The concern of continued terrorist activity will continue to<br />
drive the need for improved security solutions, which will drive<br />
increased funding,” asserts No. 3-ranked Johnson Controls Inc.<br />
According to No. 13-ranked Securityhunter Inc., terrorism<br />
is a top issue in the security marketplace. “The federal government<br />
is investing heavily in securing its people and facilities. A<br />
great market opportunity exists in helping to secure the border,<br />
and key infrastructure locations like airports.”<br />
MORE ONLINE<br />
To find this article online, as well as previous years’<br />
editions of the Top Systems Integrators Reports, visit<br />
www.SDMmag.com/Top-Systems-Integrators-Report.<br />
Among the top trending issues that Top Systems Integrators<br />
think will have the greatest impact on their business in<br />
2016, active-shooters/acts of terrorism, cybersecurity, and the<br />
growth of Security as a Service through cloud-based services<br />
and managed offerings stand out. The first has the potential<br />
to produce devastating consequences, yet provides opportunities<br />
for integrators to become a key part of securing America<br />
against such atrocious deeds. ■<br />
More from the Report<br />
To gain additional information beyond that published in<br />
this issue and online, the complete SDM Top Systems<br />
Integrators Report and Database is available in Excel<br />
format. Included are contact names, mailing addresses,<br />
telephone numbers, website URLs, targeted vertical<br />
markets, branch office locations, and much more.<br />
SDM’s Top Systems Integrators Report and Database<br />
contains the information needed to target products and<br />
services to the systems integration market.<br />
The cost of the report is $595. It may be ordered by<br />
contacting Heidi Fusaro at 630-518-5470 or by emailing<br />
fusaroh@bnpmedia.com.<br />
76 July 2016
2016<br />
21 st ANNUAL REPORT<br />
Alphabetical Index to Companies<br />
Company 2016 Rank Company 2016 Rank Company 2016 Rank<br />
Acadiana Security Plus . . . . . . . . . . . . . . . . . . 84<br />
Access Systems Integration. . . . . . . . . . . . . . . 24<br />
Ackerman Security Systems. . . . . . . . . . . . . . . 67<br />
ACT . . . . . . . . . . . . . . . . . . . . . . . . . . . . . . . . . 36<br />
ADS Security L.P. . . . . . . . . . . . . . . . . . . . . . . . 48<br />
Advanced Cabling Systems. . . . . . . . . . . . . . . 26<br />
Advanced Electronic Solutions . . . . . . . . . . . . 51<br />
AFA Protective Systems Inc.. . . . . . . . . . . . . . . 11<br />
Alarm Detection Systems Inc. . . . . . . . . . . . . . 52<br />
Allied Fire & Security. . . . . . . . . . . . . . . . . . . . 32<br />
American Alarm & Communications . . . . . . . . 42<br />
APL Access & Security Inc. . . . . . . . . . . . . . . . 65<br />
Artel Communications Corp. . . . . . . . . . . . . . . 73<br />
Atlantic Coast Alarm Inc. . . . . . . . . . . . . . . . . 75<br />
Atronic Alarms Inc. . . . . . . . . . . . . . . . . . . . . . 78<br />
AVS Technology . . . . . . . . . . . . . . . . . . . . . . . . 61<br />
Bates Security LLC / Sonitrol of Lexington. . . . 77<br />
CGL Electronic Security Inc.. . . . . . . . . . . . . . . 56<br />
Convergint Technologies . . . . . . . . . . . . . . . . . . 2<br />
CTSI. . . . . . . . . . . . . . . . . . . . . . . . . . . . . . . . . 39<br />
Custom Security Systems . . . . . . . . . . . . . . . . 99<br />
D/A Central Inc.. . . . . . . . . . . . . . . . . . . . . . . . 70<br />
Dallas Security Systems Inc.<br />
& DSS Fire Inc. . . . . . . . . . . . . . . . . . . . . . . 58<br />
DynaFire Inc. . . . . . . . . . . . . . . . . . . . . . . . . . . 74<br />
Electronic Security Concepts LLC . . . . . . . . . . 72<br />
EMC Security. . . . . . . . . . . . . . . . . . . . . . . . . . 95<br />
Engineered Security Systems. . . . . . . . . . . . . . 87<br />
Entech Sales & Service Inc.. . . . . . . . . . . . . . . 14<br />
F.E. Moran Inc. Alarm and<br />
Monitoring Services . . . . . . . . . . . . . . . . . . 47<br />
Firstline Security Systems Inc.. . . . . . . . . . . . . 38<br />
Fleenor Security Systems. . . . . . . . . . . . . . . . . 82<br />
G4S Secure Integration LLC. . . . . . . . . . . . . . . . 7<br />
Genesis Security Systems LLC. . . . . . . . . . . . . 22<br />
GSI . . . . . . . . . . . . . . . . . . . . . . . . . . . . . . . . . 23<br />
Guardian Protection Services . . . . . . . . . . . . . 62<br />
Integrated Security Technologies. . . . . . . . . . . 31<br />
Interface Security Systems Holdings Inc.. . . . . 21<br />
Intertech Ci . . . . . . . . . . . . . . . . . . . . . . . . . . . 18<br />
Johnson Controls Inc. . . . . . . . . . . . . . . . . . . . . 3<br />
Kastle Systems International. . . . . . . . . . . . . . . 6<br />
Kimberlite Corp. . . . . . . . . . . . . . . . . . . . . . . . 89<br />
Kratos Public Safety & Security<br />
Solutions Inc. . . . . . . . . . . . . . . . . . . . . . . . . 4<br />
KST Security . . . . . . . . . . . . . . . . . . . . . . . . . . 37<br />
Life Safety Engineered Systems Inc. . . . . . . . . 54<br />
Low Voltage Contractors Inc.. . . . . . . . . . . . . . 27<br />
Matson Alarm Co. Inc.. . . . . . . . . . . . . . . . . . . 85<br />
MidCo Inc.. . . . . . . . . . . . . . . . . . . . . . . . . . . . 28<br />
Midstate Security Company. . . . . . . . . . . . . . . 50<br />
Minuteman Security Technologies Inc.. . . . . . . 53<br />
Mountain Alarm. . . . . . . . . . . . . . . . . . . . . . . . 20<br />
MSE Corporate Security. . . . . . . . . . . . . . . . . . 29<br />
New York Security Solutions. . . . . . . . . . . . . . . 88<br />
NextGen Security LLC. . . . . . . . . . . . . . . . . . . . 33<br />
Operational Security Systems Inc.. . . . . . . . . . 55<br />
PASS Security . . . . . . . . . . . . . . . . . . . . . . . . . 64<br />
Peak Alarm Co. Inc.. . . . . . . . . . . . . . . . . . . . . 81<br />
Per Mar Security Services . . . . . . . . . . . . . . . . 69<br />
RAE Security . . . . . . . . . . . . . . . . . . . . . . . . . . 46<br />
Red Hawk Fire & Security . . . . . . . . . . . . . . . . . 5<br />
Redrock Security & Cabling Inc. . . . . . . . . . . . 43<br />
Redwire / Sonitrol of Tallahassee,<br />
Bay, NW FL, EC FL . . . . . . . . . . . . . . . . . . . . 91<br />
RFI Communications & Security Systems . . . . 12<br />
Scarsdale Security Systems Inc. . . . . . . . . . . . 60<br />
SCI Inc. . . . . . . . . . . . . . . . . . . . . . . . . . . . . . . 90<br />
Securadyne Systems LLC. . . . . . . . . . . . . . . . . . 9<br />
Security and Data Technologies Inc. . . . . . . . . 45<br />
Security Corporation . . . . . . . . . . . . . . . . . . . . 25<br />
Security Equipment Inc. . . . . . . . . . . . . . . . . . 34<br />
Security Integrations. . . . . . . . . . . . . . . . . . . . 40<br />
Securityhunter Inc. . . . . . . . . . . . . . . . . . . . . . 13<br />
Select Security. . . . . . . . . . . . . . . . . . . . . . . . . 80<br />
Sentry Communications & Security . . . . . . . . . 66<br />
Sentry Security . . . . . . . . . . . . . . . . . . . . . . . . 94<br />
SIGNET Electronic Systems Inc.. . . . . . . . . . . . 19<br />
Sonitrol New England . . . . . . . . . . . . . . . . . . . 57<br />
Sonitrol of Buffalo, Rochester, Toronto . . . . . . 96<br />
Sonitrol of Sacramento & Orange County,<br />
Cybex Security. . . . . . . . . . . . . . . . . . . . . . . 76<br />
Sonitrol Pacific . . . . . . . . . . . . . . . . . . . . . . . . 86<br />
Sonitrol Security Systems of the Triangle . . . 100<br />
Sonitrol Tri-County. . . . . . . . . . . . . . . . . . . . . . 97<br />
Sound Incorporated. . . . . . . . . . . . . . . . . . . . . 30<br />
Southeastern Security Professionals LLC . . . . 79<br />
SSD Alarm Systems / Kern Security & Fire /<br />
Alpha Alarm & McNeill Security . . . . . . . . . 49<br />
Stone Security . . . . . . . . . . . . . . . . . . . . . . . . . 59<br />
Strategic Security Solutions . . . . . . . . . . . . . . 83<br />
Tech Systems Inc. . . . . . . . . . . . . . . . . . . . . . . 15<br />
Telenet VoIP Inc. . . . . . . . . . . . . . . . . . . . . . . . 92<br />
Tele-Tector of Maryland Inc.. . . . . . . . . . . . . . . 68<br />
The Protection Bureau. . . . . . . . . . . . . . . . . . . 44<br />
TRL Systems Inc.. . . . . . . . . . . . . . . . . . . . . . . 41<br />
Tutela Inc. . . . . . . . . . . . . . . . . . . . . . . . . . . . . 35<br />
Tyco Integrated Security . . . . . . . . . . . . . . . . . . 1<br />
Universal Protection Security Systems . . . . . . 16<br />
Unlimited Technology Inc. . . . . . . . . . . . . . . . . 17<br />
Vector Security Inc. . . . . . . . . . . . . . . . . . . . . . . 8<br />
Vision Security Technologies . . . . . . . . . . . . . . 63<br />
VTI Security . . . . . . . . . . . . . . . . . . . . . . . . . . . 10<br />
Washington Alarm Inc. . . . . . . . . . . . . . . . . . . 93<br />
Will Electronics . . . . . . . . . . . . . . . . . . . . . . . . 71<br />
World Wide Security & GC Alarm Inc.. . . . . . . . 98<br />
78 July 2016