

VANUATU
Qffx302d60u
Qffx302d60u

You also want an ePaper? Increase the reach of your titles
YUMPU automatically turns print PDFs into web optimized ePapers that Google loves.
6 National Green Export Review of Vanuatu:<br />
to low production in the primary subsector, it is less<br />
obvious that copra export declines also reflect a recent<br />
increase of value addition in the sector. Currently there<br />
are 5 coconut oil processing mills in Vanuatu all of<br />
which are operating at under-capacity due to the low<br />
rate of production at the primary level. 8<br />
1.5 The effect of tariff policy on the<br />
sector<br />
Recently with an increase in tariffs relating to the<br />
importation of chicken products aimed at developing<br />
Vanuatu’s infant chicken industry and the development<br />
of the domestic capacity for growing its own poultry<br />
products, it has become necessary for poultry farmers<br />
to consider locally produces chicken feed. In this<br />
respect, although no international tariffs has been<br />
imposed on the importation of coconut products, the<br />
sector is enhanced by the protection of the poultry<br />
sector which does impact positively in the sector given<br />
the subsequent demand for coconut based chicken<br />
feed and other animal coconut based feed.<br />
Vanuatu exports 71 percent of its copra to the<br />
Philippines and around 45 percent of its coconut oil<br />
and other copra by-products to Malaysia. At a 10<br />
percent import duty rate Vanuatu’s copra imports<br />
to the Philippines makes for a comparatively less<br />
costly base for manufacturing coconut oil and feed<br />
meal accounting for the mass exportation of copra<br />
to the Philippines in the face of domestic capacity for<br />
processing all the copra being exported. One line of<br />
action to ensure that Vanuatu’s copra is processed<br />
locally would be to impose levies on exportation of<br />
raw materials for which there is adequate domestic<br />
capacity for processing and adding value.<br />
1.6 Role and performance of the coconut<br />
sector in the national economy<br />
Copra has been the mainstay of Vanuatu’s economy<br />
for well over a century and will continue for the near<br />
future to be the second largest export after tourism.<br />
A comparative assessment of the 45 percent<br />
contribution of the three main cash crops to exports<br />
in June 2014 shows that coconut constitutes 90<br />
percent whereas the contribution of cocoa and<br />
sandalwood makes for only 10 percent. The lack of<br />
relevant information continues to be a major constraint<br />
in determining the extent to which spinoff effects from<br />
the production of copra affect the service sector.<br />
Nevertheless, it was noted in 2003 that 6.4 percent<br />
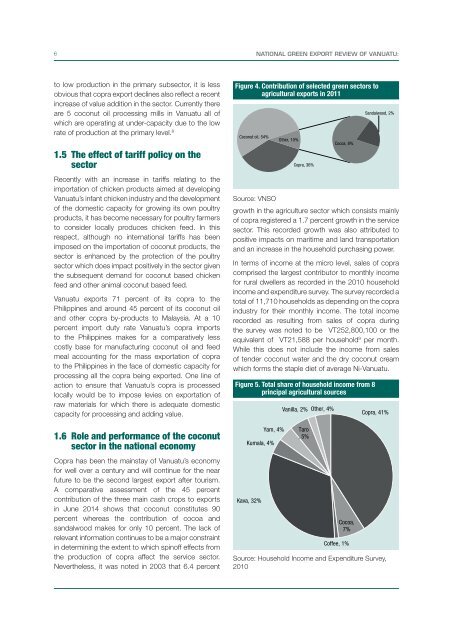
Figure 4. Contribution of selected green sectors to<br />
agricultural exports in 2011<br />
Coconut oil, 54%<br />
Other, 10%<br />
Copra, 36%<br />
Cocoa, 8%<br />
Sandalwood, 2%<br />
Source: VNSO<br />
growth in the agriculture sector which consists mainly<br />
of copra registered a 1.7 percent growth in the service<br />
sector. This recorded growth was also attributed to<br />
positive impacts on maritime and land transportation<br />
and an increase in the household purchasing power.<br />
In terms of income at the micro level, sales of copra<br />
comprised the largest contributor to monthly income<br />
for rural dwellers as recorded in the 2010 household<br />
income and expenditure survey. The survey recorded a<br />
total of 11,710 households as depending on the copra<br />
industry for their monthly income. The total income<br />
recorded as resulting from sales of copra during<br />
the survey was noted to be VT252,800,100 or the<br />
equivalent of VT21,588 per household 9 per month.<br />
While this does not include the income from sales<br />
of tender coconut water and the dry coconut cream<br />
which forms the staple diet of average Ni-Vanuatu.<br />
Figure 5. Total share of household income from 8<br />
principal agricultural sources<br />
Kava, 32%<br />
Yam, 4%<br />
Kumala, 4%<br />
Vanilla, 2% Other, 4%<br />
Taro<br />
, 5%<br />
Cocoa,<br />
7%<br />
Coffee, 1%<br />
Copra, 41%<br />
Source: Household Income and Expenditure Survey,<br />
2010