VANUATU
Qffx302d60u
Qffx302d60u
Create successful ePaper yourself
Turn your PDF publications into a flip-book with our unique Google optimized e-Paper software.
iv<br />
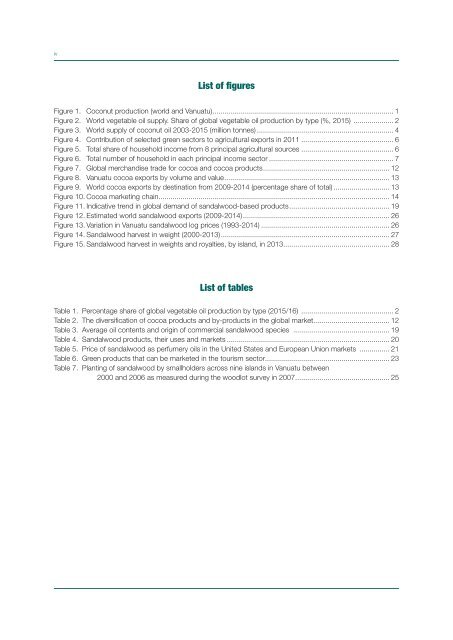
List of figures<br />
Figure 1. Coconut production (world and Vanuatu)........................................................................................... 1<br />
Figure 2. World vegetable oil supply. Share of global vegetable oil production by type (%, 2015) ..................... 2<br />
Figure 3. World supply of coconut oil 2003-2015 (million tonnes)..................................................................... 4<br />
Figure 4. Contribution of selected green sectors to agricultural exports in 2011............................................... 6<br />
Figure 5. Total share of household income from 8 principal agricultural sources............................................... 6<br />
Figure 6. Total number of household in each principal income sector............................................................... 7<br />
Figure 7. Global merchandise trade for cocoa and cocoa products................................................................ 12<br />
Figure 8. Vanuatu cocoa exports by volume and value................................................................................... 13<br />
Figure 9. World cocoa exports by destination from 2009-2014 (percentage share of total)............................. 13<br />
Figure 10. Cocoa marketing chain.................................................................................................................... 14<br />
Figure 11. Indicative trend in global demand of sandalwood-based products................................................... 19<br />
Figure 12. Estimated world sandalwood exports (2009-2014).......................................................................... 26<br />
Figure 13. Variation in Vanuatu sandalwood log prices (1993-2014)................................................................. 26<br />
Figure 14. Sandalwood harvest in weight (2000-2013)..................................................................................... 27<br />
Figure 15. Sandalwood harvest in weights and royalties, by island, in 2013...................................................... 28<br />
List of tables<br />
Table 1. Percentage share of global vegetable oil production by type (2015/16) ............................................... 2<br />
Table 2. The diversification of cocoa products and by-products in the global market...................................... 12<br />
Table 3. Average oil contents and origin of commercial sandalwood species ................................................. 19<br />
Table 4. Sandalwood products, their uses and markets.................................................................................. 20<br />
Table 5. Price of sandalwood as perfumery oils in the United States and European Union markets ................ 21<br />
Table 6. Green products that can be marketed in the tourism sector............................................................... 23<br />
Table 7. Planting of sandalwood by smallholders across nine islands in Vanuatu between<br />
2000 and 2006 as measured during the woodlot survey in 2007................................................ 25


