

A Layperson’s Guide to the Option Pricing Model
Article_Mercer-Capital-Guide-Option-Pricing-Model
Article_Mercer-Capital-Guide-Option-Pricing-Model

You also want an ePaper? Increase the reach of your titles
YUMPU automatically turns print PDFs into web optimized ePapers that Google loves.
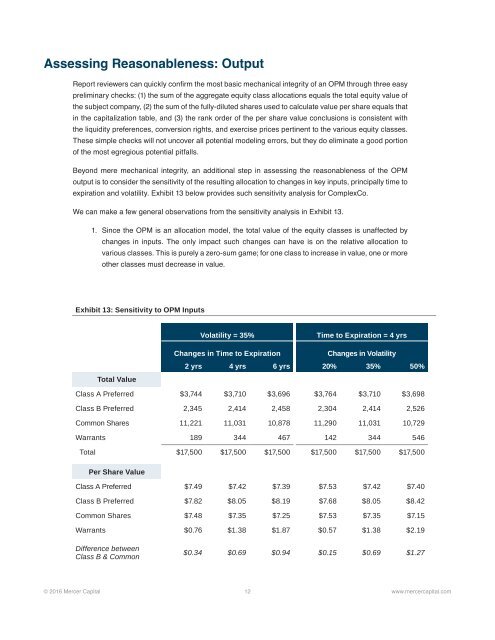
Assessing Reasonableness: Output<br />
Report reviewers can quickly confirm <strong>the</strong> most basic mechanical integrity of an OPM through three easy<br />
preliminary checks: (1) <strong>the</strong> sum of <strong>the</strong> aggregate equity class allocations equals <strong>the</strong> <strong>to</strong>tal equity value of<br />
<strong>the</strong> subject company, (2) <strong>the</strong> sum of <strong>the</strong> fully-diluted shares used <strong>to</strong> calculate value per share equals that<br />
in <strong>the</strong> capitalization table, and (3) <strong>the</strong> rank order of <strong>the</strong> per share value conclusions is consistent with<br />
<strong>the</strong> liquidity preferences, conversion rights, and exercise prices pertinent <strong>to</strong> <strong>the</strong> various equity classes.<br />
These simple checks will not uncover all potential modeling errors, but <strong>the</strong>y do eliminate a good portion<br />
of <strong>the</strong> most egregious potential pitfalls.<br />
Beyond mere mechanical integrity, an additional step in assessing <strong>the</strong> reasonableness of <strong>the</strong> OPM<br />
output is <strong>to</strong> consider <strong>the</strong> sensitivity of <strong>the</strong> resulting allocation <strong>to</strong> changes in key inputs, principally time <strong>to</strong><br />
expiration and volatility. Exhibit 13 below provides such sensitivity analysis for ComplexCo.<br />
We can make a few general observations from <strong>the</strong> sensitivity analysis in Exhibit 13.<br />
1. Since <strong>the</strong> OPM is an allocation model, <strong>the</strong> <strong>to</strong>tal value of <strong>the</strong> equity classes is unaffected by<br />
changes in inputs. The only impact such changes can have is on <strong>the</strong> relative allocation <strong>to</strong><br />
various classes. This is purely a zero-sum game; for one class <strong>to</strong> increase in value, one or more<br />
o<strong>the</strong>r classes must decrease in value.<br />
Exhibit 13: Sensitivity <strong>to</strong> OPM Inputs<br />
Volatility = 35%<br />
Time <strong>to</strong> Expiration = 4 yrs<br />
Total Value<br />
Changes in Time <strong>to</strong> Expiration<br />
Changes in Volatility<br />
2 yrs 4 yrs 6 yrs 20% 35% 50%<br />
Class A Preferred $3,744 $3,710 $3,696 $3,764 $3,710 $3,698<br />
Class B Preferred 2,345 2,414 2,458 2,304 2,414 2,526<br />
Common Shares 11,221 11,031 10,878 11,290 11,031 10,729<br />
Warrants 189 344 467 142 344 546<br />
Total $17,500 $17,500 $17,500 $17,500 $17,500 $17,500<br />
Per Share Value<br />
Class A Preferred $7.49 $7.42 $7.39 $7.53 $7.42 $7.40<br />
Class B Preferred $7.82 $8.05 $8.19 $7.68 $8.05 $8.42<br />
Common Shares $7.48 $7.35 $7.25 $7.53 $7.35 $7.15<br />
Warrants $0.76 $1.38 $1.87 $0.57 $1.38 $2.19<br />
Difference between<br />
Class B & Common<br />
$0.34 $0.69 $0.94 $0.15 $0.69 $1.27<br />
© 2016 Mercer Capital 12 www.mercercapital.com