

A Layperson’s Guide to the Option Pricing Model
Article_Mercer-Capital-Guide-Option-Pricing-Model
Article_Mercer-Capital-Guide-Option-Pricing-Model

Create successful ePaper yourself
Turn your PDF publications into a flip-book with our unique Google optimized e-Paper software.
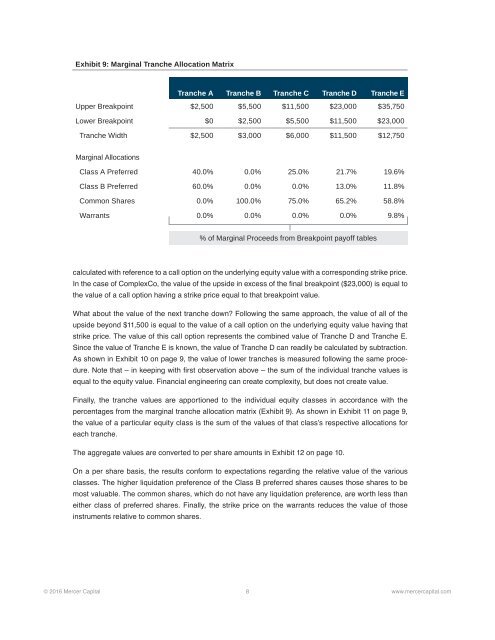
Exhibit 9: Marginal Tranche Allocation Matrix<br />
Tranche A Tranche B Tranche C Tranche D Tranche E<br />
Upper Breakpoint $2,500 $5,500 $11,500 $23,000 $35,750<br />
Lower Breakpoint $0 $2,500 $5,500 $11,500 $23,000<br />
Tranche Width $2,500 $3,000 $6,000 $11,500 $12,750<br />
Marginal Allocations<br />
Class A Preferred 40.0% 0.0% 25.0% 21.7% 19.6%<br />
Class B Preferred 60.0% 0.0% 0.0% 13.0% 11.8%<br />
Common Shares 0.0% 100.0% 75.0% 65.2% 58.8%<br />
Warrants 0.0% 0.0% 0.0% 0.0% 9.8%<br />
% of Marginal Proceeds from Breakpoint payoff tables<br />
calculated with reference <strong>to</strong> a call option on <strong>the</strong> underlying equity value with a corresponding strike price.<br />
In <strong>the</strong> case of ComplexCo, <strong>the</strong> value of <strong>the</strong> upside in excess of <strong>the</strong> final breakpoint ($23,000) is equal <strong>to</strong><br />
<strong>the</strong> value of a call option having a strike price equal <strong>to</strong> that breakpoint value.<br />
What about <strong>the</strong> value of <strong>the</strong> next tranche down? Following <strong>the</strong> same approach, <strong>the</strong> value of all of <strong>the</strong><br />
upside beyond $11,500 is equal <strong>to</strong> <strong>the</strong> value of a call option on <strong>the</strong> underlying equity value having that<br />
strike price. The value of this call option represents <strong>the</strong> combined value of Tranche D and Tranche E.<br />
Since <strong>the</strong> value of Tranche E is known, <strong>the</strong> value of Tranche D can readily be calculated by subtraction.<br />
As shown in Exhibit 10 on page 9, <strong>the</strong> value of lower tranches is measured following <strong>the</strong> same procedure.<br />
Note that – in keeping with first observation above – <strong>the</strong> sum of <strong>the</strong> individual tranche values is<br />
equal <strong>to</strong> <strong>the</strong> equity value. Financial engineering can create complexity, but does not create value.<br />
Finally, <strong>the</strong> tranche values are apportioned <strong>to</strong> <strong>the</strong> individual equity classes in accordance with <strong>the</strong><br />
percentages from <strong>the</strong> marginal tranche allocation matrix (Exhibit 9). As shown in Exhibit 11 on page 9,<br />
<strong>the</strong> value of a particular equity class is <strong>the</strong> sum of <strong>the</strong> values of that class’s respective allocations for<br />
each tranche.<br />
The aggregate values are converted <strong>to</strong> per share amounts in Exhibit 12 on page 10.<br />
On a per share basis, <strong>the</strong> results conform <strong>to</strong> expectations regarding <strong>the</strong> relative value of <strong>the</strong> various<br />
classes. The higher liquidation preference of <strong>the</strong> Class B preferred shares causes those shares <strong>to</strong> be<br />
most valuable. The common shares, which do not have any liquidation preference, are worth less than<br />
ei<strong>the</strong>r class of preferred shares. Finally, <strong>the</strong> strike price on <strong>the</strong> warrants reduces <strong>the</strong> value of those<br />
instruments relative <strong>to</strong> common shares.<br />
© 2016 Mercer Capital 8 www.mercercapital.com