

Textbook Chapter 1

You also want an ePaper? Increase the reach of your titles
YUMPU automatically turns print PDFs into web optimized ePapers that Google loves.
<strong>Chapter</strong><br />
1<br />
Prerequisites<br />
for Calculus<br />
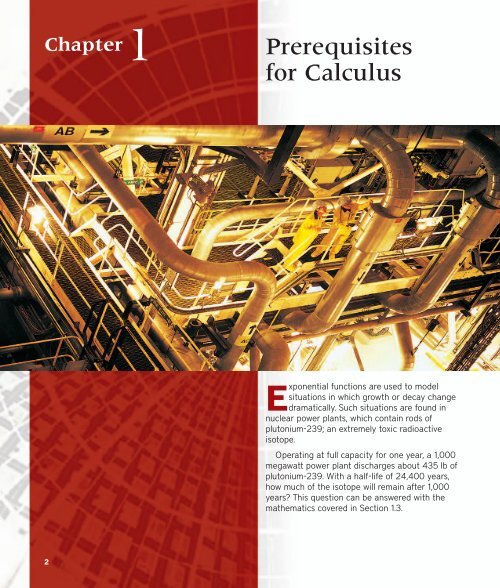
Exponential functions are used to model<br />
situations in which growth or decay change<br />
dramatically. Such situations are found in<br />
nuclear power plants, which contain rods of<br />
plutonium-239; an extremely toxic radioactive<br />
isotope.<br />
Operating at full capacity for one year, a 1,000<br />
megawatt power plant discharges about 435 lb of<br />
plutonium-239. With a half-life of 24,400 years,<br />
how much of the isotope will remain after 1,000<br />
years? This question can be answered with the<br />
mathematics covered in Section 1.3.<br />
2
<strong>Chapter</strong> 1 Overview<br />
Section 1.1 Lines 3<br />
This chapter reviews the most important things you need to know to start learning calculus.<br />
It also introduces the use of a graphing utility as a tool to investigate mathematical<br />
ideas, to support analytic work, and to solve problems with numerical and graphical methods.<br />
The emphasis is on functions and graphs, the main building blocks of calculus.<br />
Functions and parametric equations are the major tools for describing the real world in<br />
mathematical terms, from temperature variations to planetary motions, from brain waves<br />
to business cycles, and from heartbeat patterns to population growth. Many functions<br />
have particular importance because of the behavior they describe. Trigonometric functions<br />
describe cyclic, repetitive activity; exponential, logarithmic, and logistic functions<br />
describe growth and decay; and polynomial functions can approximate these and most<br />
other functions.<br />
1.1<br />
What you’ll learn about<br />
• Increments<br />
• Slope of a Line<br />
• Parallel and Perpendicular Lines<br />
• Equations of Lines<br />
• Applications<br />
. . . and why<br />
Linear equations are used extensively<br />
in business and economic<br />
applications.<br />
Lines<br />
Increments<br />
One reason calculus has proved to be so useful is that it is the right mathematics for relating<br />
the rate of change of a quantity to the graph of the quantity. Explaining that relationship<br />
is one goal of this book. It all begins with the slopes of lines.<br />
When a particle in the plane moves from one point to another, the net changes or<br />
increments in its coordinates are found by subtracting the coordinates of its starting point<br />
from the coordinates of its stopping point.<br />
DEFINITION<br />
Increments<br />
If a particle moves from the point (x 1 , y 1 ) to the point (x 2 , y 2 ), the increments in its<br />
coordinates are<br />
x x 2 x 1 and y y 2 y 1 .<br />
y<br />
L<br />
P 2 (x 2 , y 2 )<br />
y rise<br />
P 1 (x 1 , y 1 ) Q(x 2 , y 1 )<br />
x run<br />
The symbols x and y are read “delta x” and “delta y.” The letter is a Greek capital<br />
d for “difference.” Neither x nor y denotes multiplication; x is not “delta times x” nor<br />
is y “delta times y.”<br />
Increments can be positive, negative, or zero, as shown in Example 1.<br />
EXAMPLE 1 Finding Increments<br />
The coordinate increments from 4, 3 to (2, 5) are<br />
x 2 4 2, y 5 3 8.<br />
From (5, 6) to (5, 1), the increments are<br />
x 5 5 0, y 1 6 5. Now try Exercise 1.<br />
O<br />
Figure 1.1 The slope of line L is<br />
m r ise<br />
y<br />
.<br />
run<br />
x<br />
x<br />
Slope of a Line<br />
Each nonvertical line has a slope, which we can calculate from increments in coordinates.<br />
Let L be a nonvertical line in the plane and P 1 (x 1 , y 1 ) and P 2 (x 2 , y 2 ) two points on L<br />
(Figure 1.1). We call y y 2 y 1 the rise from P 1 to P 2 and x x 2 x 1 the run from
4 <strong>Chapter</strong> 1 Prerequisites for Calculus<br />
P 1 to P 2 . Since L is not vertical, x 0 and we define the slope of L to be the amount of<br />
rise per unit of run. It is conventional to denote the slope by the letter m.<br />
L 1<br />
L 2<br />
Slope m 1 Slope m 2<br />
m 1<br />
m 2<br />
θ 1<br />
θ 2<br />
1<br />
1<br />
x<br />
DEFINITION Slope<br />
Let P 1 (x 1 , y 1 ) and P 2 (x 2 , y 2 ) be points on a nonvertical line, L. The slope of L is<br />
m r ise<br />
y y<br />
2 y1<br />
.<br />
run<br />
x x 2 x1<br />
Figure 1.2 If L 1 L 2 , then u 1 u 2 and<br />
m 1 m 2 . Conversely, if m 1 m 2 , then<br />
u 1 u 2 and L 1 L 2 .<br />
O<br />
y<br />
L 1<br />
L 2<br />
C<br />
Slope m Slope m 1 1<br />
2<br />
h<br />
<br />
2<br />
1<br />
A D a B<br />
Figure 1.3 ADC is similar to CDB.<br />
Hence f 1 is also the upper angle in CDB,<br />
where tan f 1 ah.<br />
x<br />
A line that goes uphill as x increases has a positive slope. A line that goes downhill as x<br />
increases has a negative slope. A horizontal line has slope zero since all of its points have<br />
the same y-coordinate, making y 0. For vertical lines, x 0 and the ratio yx is<br />
undefined. We express this by saying that vertical lines have no slope.<br />
Parallel and Perpendicular Lines<br />
Parallel lines form equal angles with the x-axis (Figure 1.2). Hence, nonvertical parallel<br />
lines have the same slope. Conversely, lines with equal slopes form equal angles with the<br />
x-axis and are therefore parallel.<br />
If two nonvertical lines L 1 and L 2 are perpendicular, their slopes m 1 and m 2 satisfy<br />
m 1 m 2 1, so each slope is the negative reciprocal of the other:<br />
1<br />
1<br />
m 1 , m m 2 .<br />
m<br />
2<br />
The argument goes like this: In the notation of Figure 1.3, m 1 tanf 1 ah, while<br />
m 2 tanf 2 ha. Hence, m 1 m 2 (ah)(ha) 1.<br />
1<br />
Equations of Lines<br />
The vertical line through the point (a, b) has equation x a since every x-coordinate on<br />
the line has the value a. Similarly, the horizontal line through (a, b) has equation y b.<br />
6<br />
5<br />
4<br />
3<br />
2<br />
1<br />
y<br />
Along this line,<br />
x 2.<br />
(2, 3)<br />
Along this line,<br />
y 3.<br />
0 1 2 3 4<br />
Figure 1.4 The standard equations for<br />
the vertical and horizontal lines through<br />
the point (2, 3) are x 2 and y 3.<br />
(Example 2)<br />
x<br />
EXAMPLE 2<br />
Finding Equations of Vertical and Horizontal Lines<br />
The vertical and horizontal lines through the point (2, 3) have equations x 2 and<br />
y 3, respectively (Figure 1.4). Now try Exercise 9.<br />
We can write an equation for any nonvertical line L if we know its slope m and the<br />
coordinates of one point P 1 (x 1 , y 1 ) on it. If P(x, y) is any other point on L, then<br />
so that<br />
DEFINITION<br />
The equation<br />
y y1<br />
m,<br />
x x<br />
1<br />
y y 1 m(x x 1 ) or y m(x x 1 ) y 1 .<br />
Point-Slope Equation<br />
y m(x x 1 ) y 1<br />
is the point-slope equation of the line through the point (x 1 , y 1 ) with slope m.
Section 1.1 Lines 5<br />
EXAMPLE 3<br />
Using the Point-Slope Equation<br />
Write the point-slope equation for the line through the point (2, 3) with slope 32.<br />
SOLUTION<br />
We substitute x 1 2, y 1 3, and m 32 into the point-slope equation and obtain<br />
y 3 2 x 2 3 or y 3 2 x 6. Now try Exercise 13.<br />
(0, b)<br />
y<br />
(x, y)<br />
y = mx + b<br />
Slope m<br />
The y-coordinate of the point where a nonvertical line intersects the y-axis is the<br />
y-intercept of the line. Similarly, the x-coordinate of the point where a nonhorizontal line<br />
intersects the x-axis is the x-intercept of the line. A line with slope m and y-intercept<br />
b passes through (0, b) (Figure 1.5), so<br />
y mx 0 b, or, more simply, y mx b.<br />
0<br />
b<br />
Figure 1.5 A line with slope m and<br />
y-intercept b.<br />
x<br />
DEFINITION Slope-Intercept Equation<br />
The equation<br />
y mx b<br />
is the slope-intercept equation of the line with slope m and y-intercept b.<br />
EXAMPLE 4 Writing the Slope-Intercept Equation<br />
Write the slope-intercept equation for the line through (2, 1) and (3, 4).<br />
SOLUTION<br />
The line’s slope is<br />
4 1<br />
m 5 3 2<br />
5 1.<br />
We can use this slope with either of the two given points in the point-slope equation. For<br />
(x 1 , y 1 ) (2, 1), we obtain<br />
y 1 • x 2 1<br />
y x 2 1<br />
y x 1. Now try Exercise 17.<br />
If A and B are not both zero, the graph of the equation Ax By C is a line. Every line<br />
has an equation in this form, even lines with undefined slopes.<br />
DEFINITION General Linear Equation<br />
The equation<br />
Ax By C (A and B not both 0)<br />
is a general linear equation in x and y.
6 <strong>Chapter</strong> 1 Prerequisites for Calculus<br />
y = – 8 x + 4<br />
5<br />
Although the general linear form helps in the quick identification of lines, the slopeintercept<br />
form is the one to enter into a calculator for graphing.<br />
EXAMPLE 5<br />
Analyzing and Graphing a General Linear Equation<br />
Find the slope and y-intercept of the line 8x 5y 20. Graph the line.<br />
SOLUTION<br />
Solve the equation for y to put the equation in slope-intercept form:<br />
8x 5y 20<br />
5y 8x 20<br />
[–5, 7] by [–2, 6]<br />
Figure 1.6 The line 8x 5y 20.<br />
(Example 5)<br />
y 8 5 x 4<br />
This form reveals the slope (m 85) and y-intercept (b 4), and puts the equation<br />
in a form suitable for graphing (Figure 1.6).<br />
Now try Exercise 27.<br />
EXAMPLE 6<br />
Writing Equations for Lines<br />
Write an equation for the line through the point (1, 2) that is (a) parallel, and<br />
(b) perpendicular to the line L: y 3x 4.<br />
SOLUTION<br />
The line L, y 3x 4, has slope 3.<br />
(a) The line y 3(x 1) 2, or y 3x 5, passes through the point (1, 2), and<br />
is parallel to L because it has slope 3.<br />
(b) The line y (13)(x 1) 2, or y (13)x 53, passes through the point<br />
(1, 2), and is perpendicular to L because it has slope 13.<br />
Now try Exercise 31.<br />
EXAMPLE 7 Determining a Function<br />
The following table gives values for the linear function f (x) mx b. Determine m<br />
and b.<br />
x<br />
ƒ(x)<br />
1<br />
143<br />
1 43<br />
2 133<br />
SOLUTION<br />
The graph of f is a line. From the table we know that the following points are on the<br />
line: (1, 143), (1, 43), (2, 133).<br />
Using the first two points, the slope m is<br />
m 43 (143)<br />
(1) 6<br />
3.<br />
1<br />
2<br />
So f (x) 3x b . Because f (1) 143, we have<br />
f (1) 3(1) b<br />
143 3 b<br />
b 53.<br />
continued
Section 1.1 Lines 7<br />
Thus, m 3, b 53, and f (x) 3x 5 3.<br />
We can use either of the other two points determined by the table to check our work.<br />
Now try Exercise 35.<br />
Applications<br />
Many important variables are related by linear equations. For example, the relationship<br />
between Fahrenheit temperature and Celsius temperature is linear, a fact we use to advantage<br />
in the next example.<br />
EXAMPLE 8<br />
Temperature Conversion<br />
Find the relationship between Fahrenheit and Celsius temperature. Then find the Celsius<br />
equivalent of 90ºF and the Fahrenheit equivalent of 5ºC.<br />
SOLUTION<br />
Because the relationship between the two temperature scales is linear, it has the form<br />
F mC b. The freezing point of water is F 32º or C 0º, while the boiling point<br />
is F 212º or C 100º. Thus,<br />
32 m • 0 b and 212 m • 100 b,<br />
so b 32 and m (212 32)100 95. Therefore,<br />
F 9 5 C 32, or C 5 F 32.<br />
9<br />
These relationships let us find equivalent temperatures. The Celsius equivalent of 90ºF is<br />
The Fahrenheit equivalent of 5ºC is<br />
C 5 90 3232.2°.<br />
9<br />
F 9 5 32 23°. Now try Exercise 43.<br />
5<br />
Some graphing utilities have a feature<br />
that enables them to approximate the<br />
relationship between variables with a<br />
linear equation. We use this feature in<br />
Example 9.<br />
Table 1.1 World Population<br />
Year Population (millions)<br />
1980 4454<br />
1985 4853<br />
1990 5285<br />
1995 5696<br />
2003 6305<br />
2004 6378<br />
2005 6450<br />
Source: U.S. Bureau of the Census, Statistical<br />
Abstract of the United States, 2004–2005.<br />
It can be difficult to see patterns or trends in lists of paired numbers. For this reason, we<br />
sometimes begin by plotting the pairs (such a plot is called a scatter plot) to see whether<br />
the corresponding points lie close to a curve of some kind. If they do, and if we can find an<br />
equation y f (x) for the curve, then we have a formula that<br />
1. summarizes the data with a simple expression, and<br />
2. lets us predict values of y for other values of x.<br />
The process of finding a curve to fit data is called regression analysis and the curve is<br />
called a regression curve.<br />
There are many useful types of regression curves—power, exponential, logarithmic, sinusoidal,<br />
and so on. In the next example, we use the calculator’s linear regression feature<br />
to fit the data in Table 1.1 with a line.<br />
EXAMPLE 9<br />
Regression Analysis—–Predicting World Population<br />
Starting with the data in Table 1.1, build a linear model for the growth of the world population.<br />
Use the model to predict the world population in the year 2010, and compare<br />
this prediction with the Statistical Abstract prediction of 6812 million.<br />
continued
8 <strong>Chapter</strong> 1 Prerequisites for Calculus<br />
SOLUTION<br />
Why Not Round the Decimals in<br />
Equation 1 Even More?<br />
If we do, our final calculation will be<br />
way off. Using y 80x 153, 849, for<br />
instance, gives y 6951 when<br />
x 2010, as compared to y 6865,<br />
an increase of 86 million. The rule is:<br />
Retain all decimal places while working<br />
a problem. Round only at the end. We<br />
rounded the coefficients in Equation 1<br />
enough to make it readable, but not<br />
enough to hurt the outcome. However,<br />
we knew how much we could safely<br />
round only from first having done the<br />
entire calculation with numbers<br />
unrounded.<br />
Model Upon entering the data into the grapher, we find the regression equation to be approximately<br />
y 79.957x 153848.716, (1)<br />
where x represents the year and y the population in millions.<br />
Figure 1.7a shows the scatter plot for Table 1.1 together with a graph of the regression<br />
line just found. You can see how well the line fits the data.<br />
X = 2010 Y = 6864.854<br />
[1975, 2010] by [4000, 7000]<br />
(a)<br />
[1975, 2010] by [4000, 7000]<br />
(b)<br />
Figure 1.7 (Example 9)<br />
Solve Graphically Our goal is to predict the population in the year 2010. Reading<br />
from the graph in Figure 1.7b, we conclude that when x is 2010, y is approximately<br />
6865.<br />
Rounding Rule<br />
Round your answer as appropriate, but<br />
do not round the numbers in the calculations<br />
that lead to it.<br />
Confirm Algebraically Evaluating Equation 1 for x 2010 gives<br />
y 79.957(2010) 153848.716<br />
6865.<br />
Interpret The linear regression equation suggests that the world population in the<br />
year 2010 will be about 6865 million, or approximately 53 million more than the Statistical<br />
Abstract prediction of 6812 million. Now try Exercise 45.<br />
Regression Analysis<br />
Regression analysis has four steps:<br />
1. Plot the data (scatter plot).<br />
2. Find the regression equation. For a line, it has the form y mx b.<br />
3. Superimpose the graph of the regression equation on the scatter plot to see the fit.<br />
4. Use the regression equation to predict y-values for particular values of x.
Section 1.1 Lines 9<br />
Quick Review 1.1 (For help, go to Section 1.1.)<br />
1. Find the value of y that corresponds to x 3 in<br />
y 2 4(x 3). 2<br />
2. Find the value of x that corresponds to y 3 in<br />
y 3 2(x 1). 1<br />
In Exercises 3 and 4, find the value of m that corresponds to the<br />
values of x and y.<br />
3. x 5, y 2, m y <br />
<br />
3 1<br />
x 4<br />
4. x 1, y 3, m 2 <br />
<br />
y<br />
3 x<br />
5 4 <br />
In Exercises 5 and 6, determine whether the ordered pair is a solution<br />
to the equation.<br />
5. 3x 4y 5 6. y 2x 5<br />
(a) (2, 14) (b) (3, 1) (a) (1, 7) (b) (2, 1)<br />
Yes No Yes No<br />
In Exercises 7 and 8, find the distance between the points.<br />
7. (1, 0), (0, 1) 2 8. (2, 1), (1, 13) 5 3 <br />
In Exercises 9 and 10, solve for y in terms of x.<br />
9. 4x 3y 7 10. 2x 5y 3<br />
y 4 3 x 7 3 <br />
y 2 5 x 3 5 <br />
Section 1.1 Exercises<br />
1. x 2, y 3 2. x 2, y 4<br />
In Exercises 1–4, find the coordinate increments from A to B.<br />
In Exercises 25 and 26, the line contains the origin and the point in the<br />
1. A(1, 2), B(1, 1) 2. A(3, 2), B(1, 2)<br />
upper right corner of the grapher screen. Write an equation for the line.<br />
x 5,<br />
x 0,<br />
3. A(3, 1), B(8, 1) 4. A(0, 4), B(0, 2)<br />
25. 26.<br />
y 0<br />
y 6<br />
In Exercises 5–8, let L be the line determined by points A and B.<br />
(a) Plot A and B. (b) Find the slope of L.<br />
(c) Draw the graph of L.<br />
5. A(1, 2), B(2, 1) (b) 3 6. A(2, 1), B(1, 2) (b) 1 3 y 5 2 x y 2 5 x<br />
[–5, 5] by [–2, 2]<br />
7. A(2, 3), B(1, 3) (b) 0 8. A(1, 2), B(1, 3)<br />
[–10, 10] by [–25, 25]<br />
(b) Has no slope (undefined)<br />
In Exercise 9–12, write an equation for (a) the vertical line and (b) In Exercises 27–30, find the (a) slope and (b) y-intercept, and<br />
the horizontal line through the point P.<br />
(c) graph the line.<br />
9. P(3, 2) x 3; y 2 10. P(1, 43) x 1; y 4 27. 3x 4y 12 28. x y 2<br />
3 (a) 3 4 (b) 3<br />
(a) –1 (b) 2<br />
11. P(0, 2) x 0; y 2 12. P(p, 0)<br />
x y<br />
x ; y 0 29. 4 1 (a) 4 (b) 4 30. y 2x 4 (a) 2 (b) 4<br />
3 3<br />
In Exercises 13–16, write the point-slope equation for the line<br />
In Exercises 31–34, write an equation for the line through P that is<br />
through the point P with slope m.<br />
(a) parallel to L, and (b) perpendicular to L.<br />
13. P(1, 1), m 1 14. P(1, 1), m 1<br />
31. P(0, 0), L: y –x 2 32. P(2, 2), L:2x y 4<br />
15. P(0, 3), m 2 16. P(4, 0), m 2<br />
33. P(2, 4), L: x 5 34. P(1, 12), L: y 3<br />
In Exercises 17–20, write the slope-intercept equation for the line<br />
with slope m and y-intercept b.<br />
17. m 3, b 2 y 3x 2 18. m 1, b 2 y x 2<br />
19. m 12, b 3 20. m 13, b 1 y 1 3 x 1<br />
In Exercises 21–24, write a general linear equation for the line<br />
through the two points.<br />
21. (0, 0), (2, 3) 3x – 2y 0 22. (1, 1), (2, 1) y 1<br />
23. (2, 0), (2, 2) x 2 24. (2, 1), (2, 2) 3x 4y 2<br />
In Exercises 35 and 36, a table of values is given for the linear<br />
function f (x) mx b. Determine m and b.<br />
35. 36.<br />
x f(x)<br />
x f(x)<br />
1 2<br />
3 9<br />
5 16<br />
2 1<br />
m 7 2 ,<br />
m 3 2 ,<br />
4 4<br />
b 3 2 b 2<br />
6 7<br />
13. y 1(x – 1) 1 14. y 1(x 1) 1<br />
15. y 2(x – 0) 3 16. y 2(x 4) 0 19. y 1 31. (a) y x (b) y x 32. (a) y 2x – 2 (b) y 1<br />
2 x 3 2 x 3<br />
33. (a) x 2 (b) y 4 34. (a) y 1 (b) x 1<br />
2
10 <strong>Chapter</strong> 1 Prerequisites for Calculus<br />
In Exercises 37 and 38, find the value of x or y for which the line<br />
through A and B has the given slope m.<br />
37. A(2, 3), B(4, y), m 23 y 1<br />
38. A(8, 2), B(x, 2), m 2 x 6<br />
39. Revisiting Example 4 Show that you get the same equation in<br />
Example 4 if you use the point (3, 4) to write the equation.<br />
40. Writing to Learn x- and y-intercepts<br />
(a) Explain why c and d are the x-intercept and y-intercept,<br />
respectively, of the line<br />
x c y 1.<br />
d<br />
(b) How are the x-intercept and y-intercept related to c and d in<br />
the line<br />
x c y 2?<br />
d<br />
41. Parallel and Perpendicular Lines For what value of k<br />
are the two lines 2x ky 3 and x y 1 (a) parallel? k 2<br />
(b) perpendicular? k 2<br />
Group Activity In Exercises 42–44, work in groups of two or<br />
three to solve the problem.<br />
42. Insulation By measuring slopes in the figure below, find the temperature<br />
change in degrees per inch for the following materials.<br />
(a) gypsum wallboard<br />
(b) fiberglass insulation<br />
(c) wood sheathing<br />
(d) Writing to Learn Which of the materials in (a)–(c) is the<br />
best insulator? the poorest? Explain.<br />
Temperature (°F)<br />
80°<br />
70°<br />
60°<br />
50°<br />
40°<br />
30°<br />
20°<br />
10°<br />
0°<br />
Air<br />
inside<br />
room<br />
at<br />
72°F<br />
0<br />
Gypsum wallboard<br />
Fiberglass<br />
between studs<br />
1 2 3 4 5 6 7<br />
Distance through wall (inches)<br />
Sheathing<br />
Siding<br />
Air outside<br />
at 0°F<br />
43. Pressure under Water The pressure p experienced by a diver<br />
under water is related to the diver’s depth d by an equation of the<br />
form p kd 1(k a constant). When d 0 meters, the pressure<br />
is 1 atmosphere. The pressure at 100 meters is 10.94 atmospheres.<br />
Find the pressure at 50 meters. 5.97 atmospheres (k 0.0994)<br />
44. Modeling Distance Traveled A car starts from point P at<br />
time t 0 and travels at 45 mph.<br />
(a)Write an expression d(t) for the distance the car travels from P.<br />
d(t) 45t<br />
(b) Graph y d(t).<br />
(c) What is the slope of the graph in (b)? What does it have to do<br />
with the car? Slope is 45, which is the speed in miles per hour.<br />
(d) Writing to Learn Create a scenario in which t could have<br />
negative values.<br />
(e) Writing to Learn Create a scenario in which the y-intercept<br />
of y d(t) could be 30.<br />
In Exercises 45 and 46, use linear regression analysis.<br />
45. Table 1.2 shows the mean annual compensation of construction<br />
workers.<br />
Table 1.2 Construction Workers’ Average Annual<br />
Compensation<br />
Annual Total Compensation<br />
Year<br />
(dollars)<br />
1999 42,598<br />
2000 44,764<br />
2001 47,822<br />
2002 48,966<br />
Source: U.S. Bureau of the Census, Statistical Abstract of the United<br />
States, 2004–2005.<br />
y 2216.2x 4387470.6<br />
(a) Find the linear regression equation for the data.<br />
(b) Find the slope of the regression line. What does the slope<br />
represent?<br />
(c) Superimpose the graph of the linear regression equation on a<br />
scatter plot of the data.<br />
(d) Use the regression equation to predict the construction workers’<br />
average annual compensation in the year 2008. about $62,659<br />
46. Table 1.3 lists the ages and weights of nine girls.<br />
Table 1.3 Girls’ Ages and Weights<br />
Age (months)<br />
Weight (pounds)<br />
19 22<br />
21 23<br />
24 25<br />
27 28<br />
29 31<br />
31 28<br />
34 32<br />
38 34<br />
43 39<br />
y 0.680x 9.013<br />
(a) Find the linear regression equation for the data.<br />
(b) Find the slope of the regression line. What does the slope<br />
represent?<br />
(c) Superimpose the graph of the linear regression equation on a<br />
scatter plot of the data.<br />
(d) Use the regression equation to predict the approximate<br />
weight of a 30-month-old girl. 29 pounds
Section 1.1 Lines 11<br />
Standardized Test Questions<br />
You should solve the following problems without using a<br />
graphing calculator.<br />
47. True or False The slope of a vertical line is zero. Justify your<br />
answer. False. A vertical line has no slope.<br />
48. True or False The slope of a line perpendicular to the line<br />
y mx b is 1m. Justify your answer. False. The slope is 1/m.<br />
49. Multiple Choice Which of the following is an equation of the<br />
line through (3, 4) with slope 12? A<br />
(A) y 4 1 2 (x 3) (B) y 3 1 (x 4)<br />
2<br />
(C) y 4 2(x 3) (D) y 4 2(x 3)<br />
(E) y 3 2(x 4)<br />
50. Multiple Choice Which of the following is an equation of the<br />
vertical line through (–2, 4)? E<br />
(A) y 4 (B) x 2 (C) y 4<br />
(D) x 0<br />
(E) x 2<br />
51. Multiple Choice Which of the following is the x-intercept of<br />
the line y 2x 5? D<br />
(A) x 5 (B) x 5 (C) x 0<br />
(D) x 52<br />
(E) x 52<br />
52. Multiple Choice Which of the following is an equation of the<br />
line through (2, 1) parallel to the line y 3x 1? B<br />
(A) y 3x 5 (B) y 3x 7 (C) y 1 3 x 1 3 <br />
(D) y 3x 1 (E) y 3x 4<br />
Extending the Ideas<br />
53. The median price of existing single-family homes has increased consistently<br />
during the past few years. However, the data in Table 1.4<br />
show that there have been differences in various parts of the country.<br />
Table 1.4<br />
Median Price of Single-Family Homes<br />
Year South (dollars) West (dollars)<br />
1999 145,900 173,700<br />
2000 148,000 196,400<br />
2001 155,400 213,600<br />
2002 163,400 238,500<br />
2003 168,100 260,900<br />
Source: U.S. Bureau of the Census, Statistical Abstract of the United<br />
States, 2004–2005.<br />
(a) Find the linear regression equation for home cost in the South.<br />
(b) What does the slope of the regression line represent?<br />
(c) Find the linear regression equation for home cost in the West.<br />
(d) Where is the median price increasing more rapidly, in the<br />
South or the West?<br />
54. Fahrenheit versus Celsius We found a relationship between<br />
Fahrenheit temperature and Celsius temperature in Example 8.<br />
(a) Is there a temperature at which a Fahrenheit thermometer and<br />
a Celsius thermometer give the same reading? If so, what is it?<br />
(b) Writing to Learn Graph y 1 (95)x 32, y 2 <br />
(59)(x 32), and y 3 x in the same viewing window.<br />
Explain how this figure is related to the question in part (a).<br />
55. Parallelogram Three different parallelograms have vertices at<br />
(1, 1), (2, 0), and (2, 3). Draw the three and give the coordinates<br />
of the missing vertices.<br />
56. Parallelogram Show that if the midpoints of consecutive sides<br />
of any quadrilateral are connected, the result is a parallelogram.<br />
57. Tangent Line Consider the circle of radius 5 centered at (0, 0).<br />
Find an equation of the line tangent to the circle at the point (3, 4).<br />
58. Group Activity Distance From a Point to a Line This<br />
activity investigates how to find the distance from a point P(a, b)<br />
to a line L: Ax By C.<br />
(a) Write an equation for the line M through P perpendicular to L.<br />
(b) Find the coordinates of the point Q in which M and L intersect.<br />
Aa Bb C<br />
(c) Find the distance from P to Q. Distance <br />
A 2 B<br />
2<br />
Answers<br />
39. y 1(x – 3) 4<br />
y x –3 4<br />
y x 1, which is the same equation.<br />
40. (a) When y 0, x c; when x 0, y d.<br />
(b) The x-intercept is 2c and the y-intercept is 2d.<br />
42. (a) –3.75 degrees/inch (b) –16.1 degrees/inch<br />
(c) –7.1 degrees/inch<br />
(d) Best: fiberglass; poorest: gypsum wallboard. The best insulator will<br />
have the largest temperature change per inch, because that will allow<br />
larger temperature differences on opposite sides of thinner layers.<br />
44. (d) Suppose the car has been traveling 45 mph for several hours when it is<br />
first observed at point P at time t 0.<br />
(e) The car starts at time t 0 at a point 30 miles past P.<br />
53. (a) y 5980x 11,810,220<br />
(b) The rate at which the median price is increasing in dollars per year.<br />
(c) y 21650x 43,105,030<br />
(d) South: $5,980 per year, West: $21,650 per year; more rapidly in the<br />
West<br />
56. Suppose that the vertices of the original quadrilateral are (a, b), (c, d),<br />
(e, f ), and (g, h). When the midpoints are connected, the pairs of opposite<br />
f b<br />
sides of the resulting figure have slopes or h d<br />
, and opposite<br />
e a g c<br />
sides are parallel.<br />
57. y 3 4 (x3) 4 or y 3 4 x 2 5<br />
<br />
4<br />
58. (a) y B A (xa) b<br />
(b) The coordinates are<br />
a C ABb<br />
B2 A<br />
A<br />
2 , A2 b C ABa<br />
B2<br />
A<br />
B<br />
2 <br />
B2
12 <strong>Chapter</strong> 1 Prerequisites for Calculus<br />
1.2<br />
What you’ll learn about<br />
• Functions<br />
• Domains and Ranges<br />
• Viewing and Interpreting Graphs<br />
• Even Functions and Odd<br />
Functions——Symmetry<br />
• Functions Defined in Pieces<br />
• Absolute Value Function<br />
• Composite Functions<br />
. . . and why<br />
Functions and graphs form the<br />
basis for understanding mathematics<br />
and applications.<br />
Functions and Graphs<br />
Functions<br />
The values of one variable often depend on the values for another:<br />
• The temperature at which water boils depends on elevation (the boiling point drops as<br />
you go up).<br />
• The amount by which your savings will grow in a year depends on the interest rate offered<br />
by the bank.<br />
• The area of a circle depends on the circle’s radius.<br />
In each of these examples, the value of one variable quantity depends on the value of<br />
another. For example, the boiling temperature of water, b, depends on the elevation, e; the<br />
amount of interest, I, depends on the interest rate, r. We call b and I dependent variables<br />
because they are determined by the values of the variables e and r on which they depend.<br />
The variables e and r are independent variables.<br />
A rule that assigns to each element in one set a unique element in another set is called a<br />
function. The sets may be sets of any kind and do not have to be the same. A function is<br />
like a machine that assigns a unique output to every allowable input. The inputs make up<br />
the domain of the function; the outputs make up the range (Figure 1.8).<br />
x<br />
Input<br />
(Domain)<br />
f<br />
f(x)<br />
Output<br />
(Range)<br />
Figure 1.8 A “machine” diagram for a<br />
function.<br />
DEFINITION<br />
Function<br />
A function from a set D to a set R is a rule that assigns a unique element in R to each<br />
element in D.<br />
In this definition, D is the domain of the function and R is a set containing the range<br />
(Figure 1.9).<br />
Leonhard Euler<br />
(1707—1783)<br />
Leonhard Euler, the<br />
dominant mathematical<br />
figure of his century<br />
and the most prolific<br />
mathematician ever,<br />
was also an astronomer,<br />
physicist,<br />
botanist, and chemist,<br />
and an expert in oriental languages. His<br />
work was the first to give the function<br />
concept the prominence that it has in<br />
mathematics today. Euler’s collected<br />
books and papers fill 72 volumes. This<br />
does not count his enormous correspondence<br />
to approximately 300 addresses.<br />
His introductory algebra text, written<br />
originally in German (Euler was Swiss),<br />
is still available in English translation.<br />
D domain set<br />
(a)<br />
R range set<br />
Figure 1.9 (a) A function from a set D to a set R. (b) Not a function. The assignment is<br />
not unique.<br />
Euler invented a symbolic way to say “y is a function of x”:<br />
y f (x),<br />
which we read as “y equals f of x.” This notation enables us to give different functions different<br />
names by changing the letters we use. To say that the boiling point of water is a<br />
function of elevation, we can write b f (e). To say that the area of a circle is a function of<br />
the circle’s radius, we can write A A(r), giving the function the same name as the dependent<br />
variable.<br />
D<br />
(b)<br />
R
Section 1.2 Functions and Graphs 13<br />
The notation y f (x) gives a way to denote specific values of a function. The value of f<br />
at a can be written as f (a), read “f of a.”<br />
EXAMPLE 1<br />
The Circle-Area Function<br />
Write a formula that expresses the area of a circle as a function of its radius. Use the<br />
formula to find the area of a circle of radius 2 in.<br />
SOLUTION<br />
If the radius of the circle is r, then the area A(r) of the circle can be expressed as<br />
A(r) pr 2 . The area of a circle of radius 2 can be found by evaluating the function A(r)<br />
at r 2.<br />
A(2) p(2) 2 4p<br />
The area of a circle of radius 2 is 4p in 2 . Now try Exercise 3.<br />
0<br />
Name: The set of all real numbers<br />
Notation: – x or (–, )<br />
a<br />
Name: The set of numbers greater than a<br />
Notation: a x or (a, )<br />
Domains and Ranges<br />
In Example 1, the domain of the function is restricted by context: the independent variable<br />
is a radius and must be positive. When we define a function y f (x) with a formula and<br />
the domain is not stated explicitly or restricted by context, the domain is assumed to be the<br />
largest set of x-values for which the formula gives real y-values—the so-called natural<br />
domain. If we want to restrict the domain, we must say so. The domain of y x 2 is understood<br />
to be the entire set of real numbers. We must write “y x 2 , x 0” if we want to restrict<br />
the function to positive values of x.<br />
The domains and ranges of many real-valued functions of a real variable are intervals or<br />
combinations of intervals. The intervals may be open, closed, or half-open (Figures 1.10 and<br />
1.11) and finite or infinite (Figure 1.12).<br />
a<br />
Name: The set of numbers greater than<br />
or equal to a<br />
Notation: a ≤ x or [a, )<br />
a<br />
b<br />
Name: Open interval ab<br />
Notation: a < x < b or (a, b)<br />
x<br />
a<br />
b<br />
Closed at a and open at b<br />
Notation: a ≤ x < b or [a, b)<br />
x<br />
b<br />
Name: The set of numbers less than b<br />
Notation: x b or (–, b)<br />
a<br />
b<br />
Name: Closed interval ab<br />
Notation: a ≤ x ≤ b or [a, b]<br />
x<br />
a<br />
b<br />
Open at a and closed at b<br />
Notation: a < x ≤ b or (a, b]<br />
x<br />
b<br />
Name: The set of numbers less than<br />
or equal to b<br />
Notation: x ≤ b or (– , b]<br />
Figure 1.12 Infinite intervals—rays on<br />
the number line and the number line itself.<br />
The symbol (infinity) is used merely for<br />
convenience; it does not mean there is a<br />
number .<br />
Figure 1.10 Open and closed finite<br />
intervals.<br />
Figure 1.11 Half-open finite intervals.<br />
The endpoints of an interval make up the interval’s boundary and are called<br />
boundary points. The remaining points make up the interval’s interior and are called<br />
interior points. Closed intervals contain their boundary points. Open intervals contain<br />
no boundary points. Every point of an open interval is an interior point of the<br />
interval.<br />
Viewing and Interpreting Graphs<br />
The points (x, y) in the plane whose coordinates are the input-output pairs of a function<br />
y ƒ(x) make up the function’s graph. The graph of the function y x 2, for example,<br />
is the set of points with coordinates (x, y) for which y equals x 2.
14 <strong>Chapter</strong> 1 Prerequisites for Calculus<br />
EXAMPLE 2<br />
Identifying Domain and Range of a Function<br />
Identify the domain and range, and then sketch a graph of the function.<br />
(a) y 1 x <br />
(b) y x<br />
SOLUTION<br />
(a) The formula gives a real y-value for every real x-value except x 0. (We cannot divide<br />
any number by 0.) The domain is (, 0) (0, ). The value y takes on every real number<br />
except y 0. (y c 0 if x 1c) The range is also (, 0) (0, ). A sketch is<br />
shown in Figure 1.13a.<br />
y<br />
y<br />
4<br />
4<br />
3<br />
3<br />
2<br />
2<br />
1<br />
1<br />
–4<br />
–3<br />
–2<br />
–1<br />
–1<br />
1 2 3 4<br />
x<br />
–2<br />
–1<br />
–1<br />
1 2 3 4 5 6<br />
x<br />
–2<br />
–2<br />
–3<br />
–4<br />
(a)<br />
(b)<br />
Figure 1.13 A sketch of the graph of (a) y 1x and (b) y x. (Example 2)<br />
(b) The formula gives a real number only when x is positive or zero. The domain is<br />
[0, ). Because x denotes the principal square root of x, y is greater than or equal to<br />
zero. The range is also [0, ). A sketch is shown in Figure 1.13b.<br />
Now try Exercise 9.<br />
Graphing with pencil and paper requires that you develop graph drawing skills. Graphing<br />
with a grapher (graphing calculator) requires that you develop graph viewing skills.<br />
Graph Viewing Skills<br />
1. Recognize that the graph is reasonable.<br />
2. See all the important characteristics of the graph.<br />
3. Interpret those characteristics.<br />
4. Recognize grapher failure.<br />
Being able to recognize that a graph is reasonable comes with experience. You need to<br />
know the basic functions, their graphs, and how changes in their equations affect the<br />
graphs.<br />
Grapher failure occurs when the graph produced by a grapher is less than precise—or<br />
even incorrect—usually due to the limitations of the screen resolution of the grapher.
Section 1.2 Functions and Graphs 15<br />
EXAMPLE 3 Identifying Domain and Range of a Function<br />
Use a grapher to identify the domain and range, and then draw a graph of the function.<br />
(a) y 4 x 2<br />
(b) y x 2/3<br />
SOLUTION<br />
(a) Figure 1.14a shows a graph of the function for 4.7 x 4.7 and<br />
3.1 y 3.1, that is, the viewing window [4.7, 4.7] by [3.1, 3.1], with<br />
x-scale y-scale 1. The graph appears to be the upper half of a circle. The domain<br />
appears to be [2, 2]. This observation is correct because we must have<br />
4 x 2 0, or equivalently, 2 x 2. The range appears to be [0, 2], which can<br />
also be verified algebraically.<br />
y = x 2/3<br />
Graphing y = x 2/3 —–Possible<br />
Grapher Failure<br />
On some graphing calculators you need<br />
to enter this function as y (x 2 ) 1/3 or<br />
y (x 1/3 ) 2 to obtain a correct graph.<br />
Try graphing this function on your grapher.<br />
y = 4 – x 2 [–4.7, 4.7] by [–2, 4]<br />
[–4.7, 4.7] by [–3.1, 3.1]<br />
(a)<br />
(b)<br />
Figure 1.14 The graph of (a) y 4 x 2 and (b) y x 2/3 . (Example 3)<br />
y<br />
(b) Figure 1.14b shows a graph of the function in the viewing window<br />
[4.7, 4.7] by [2, 4], with x-scale y-scale 1. The domain appears to be<br />
(, ), which we can verify by observing that x 2/3 ( 3<br />
x) 2 . Also the range is<br />
[0, ) by the same observation. Now try Exercise 15.<br />
y x 2 (x, y)<br />
(–x, y)<br />
O<br />
x<br />
Even Functions and Odd Functions—Symmetry<br />
The graphs of even and odd functions have important symmetry properties.<br />
(a)<br />
y<br />
O<br />
y x 3 (x, y)<br />
x<br />
DEFINITIONS Even Function, Odd Function<br />
A function y ƒ(x) is an<br />
even function of x if f x f x,<br />
odd function of x if f x f x,<br />
for every x in the function’s domain.<br />
(–x, –y)<br />
(b)<br />
Figure 1.15 (a) The graph of y x 2<br />
(an even function) is symmetric about the<br />
y-axis. (b) The graph of y x 3 (an odd<br />
function) is symmetric about the origin.<br />
The names even and odd come from powers of x. If y is an even power of x, as in y x 2 or<br />
y x 4 , it is an even function of x (because (x) 2 x 2 and (x) 4 x 4 ). If y is an odd power<br />
of x, as in y x or y x 3 , it is an odd function of x (because (x) 1 x and (x) 3 x 3 ).<br />
The graph of an even function is symmetric about the y-axis. Since f (x) f (x), a point<br />
(x, y) lies on the graph if and only if the point (x, y) lies on the graph (Figure 1.15a).<br />
The graph of an odd function is symmetric about the origin. Since f (x) = f (x), a<br />
point (x, y) lies on the graph if and only if the point (x, y) lies on the graph (Figure 1.15b).
16 <strong>Chapter</strong> 1 Prerequisites for Calculus<br />
y<br />
y x 2 1<br />
Equivalently, a graph is symmetric about the origin if a rotation of 180º about the origin<br />
leaves the graph unchanged.<br />
y x 2<br />
EXAMPLE 4<br />
Recognizing Even and Odd Functions<br />
f (x) x 2<br />
f (x) x 2 1<br />
Even function: (x) 2 x 2 for all x; symmetry about y-axis.<br />
1<br />
0<br />
x<br />
f (x) x<br />
f (x) x 1<br />
Even function: (x) 2 1 x 2 1 for all x; symmetry about<br />
y-axis (Figure 1.16a).<br />
Odd function: (x) x for all x; symmetry about the origin.<br />
(a)<br />
y<br />
Not odd: f (x) x 1, but f (x) x 1. The two are not<br />
equal.<br />
Not even: (x) 1 x 1 for all x 0 (Figure 1.16b).<br />
Now try Exercises 21 and 23.<br />
y x 1<br />
It is useful in graphing to recognize even and odd functions. Once we know the graph<br />
of either type of function on one side of the y-axis, we know its graph on both sides.<br />
1<br />
y x<br />
Functions Defined in Pieces<br />
–1<br />
0<br />
x<br />
While some functions are defined by single formulas, others are defined by applying<br />
different formulas to different parts of their domains.<br />
(b)<br />
Figure 1.16 (a) When we add the constant<br />
term 1 to the function y x 2 , the<br />
resulting function y x 2 1 is still even<br />
and its graph is still symmetric about the y-<br />
axis. (b) When we add the constant term 1<br />
to the function y x, the resulting function<br />
y x 1 is no longer odd. The symmetry<br />
about the origin is lost. (Example 4)<br />
EXAMPLE 5 Graphing Piecewise-Defined Functions<br />
{<br />
x, x 0<br />
Graph y f x x2 , 0 x 1<br />
1, x 1.<br />
SOLUTION<br />
The values of f are given by three separate formulas: y x when x 0, y x 2 when<br />
0 x 1, and y 1 when x 1. However, the function is just one function, whose<br />
domain is the entire set of real numbers (Figure 1.17). Now try Exercise 33.<br />
y =<br />
–x, x < 0<br />
x 2 , 0 ≤ x ≤ 1<br />
1, x > 1<br />
EXAMPLE 6<br />
Writing Formulas for Piecewise Functions<br />
Write a formula for the function y f (x) whose graph consists of the two line<br />
segments in Figure 1.18.<br />
[–3, 3] by [–1, 3]<br />
Figure 1.17 The graph of a piecewise<br />
defined function. (Example 5).<br />
SOLUTION<br />
We find formulas for the segments from (0, 0) to (1, 1) and from (1, 0) to (2, 1) and<br />
piece them together in the manner of Example 5.<br />
Segment from (0, 0) to (1, 1) The line through (0, 0) and (1, 1) has slope<br />
m (1 0)(1 0) 1 and y-intercept b 0. Its slope-intercept equation is y x.<br />
The segment from (0, 0) to (1, 1) that includes the point (0, 0) but not the point (1, 1) is<br />
the graph of the function y x restricted to the half-open interval 0 x 1, namely,<br />
y x, 0 x 1.<br />
continued
Section 1.2 Functions and Graphs 17<br />
1<br />
y<br />
y f (x)<br />
(1, 1) (2, 1)<br />
0 1<br />
2<br />
Figure 1.18 The segment on the left contains<br />
(0, 0) but not (1, 1). The segment on<br />
the right contains both of its endpoints.<br />
(Example 6)<br />
x<br />
Segment from (1, 0) to (2, 1) The line through (1, 0) and (2, 1) has slope<br />
m (1 0)(2 1) 1 and passes through the point (1, 0). The corresponding<br />
point-slope equation for the line is<br />
y 1x 1 0, or y x 1.<br />
The segment from (1, 0) to (2, 1) that includes both endpoints is the graph of y x 1<br />
restricted to the closed interval 1 x 2, namely,<br />
y x 1, 1 x 2.<br />
Piecewise Formula Combining the formulas for the two pieces of the graph,<br />
we obtain<br />
x, 0 x 1<br />
f x { x 1, 1 x 2. Now try Exercise 43.<br />
Absolute Value Function<br />
The absolute value function y x is defined piecewise by the formula<br />
x, x 0<br />
x { x, x 0.<br />
The function is even, and its graph (Figure 1.19) is symmetric about the y-axis.<br />
y –x<br />
y<br />
3<br />
2<br />
1<br />
y x<br />
y x<br />
y = | x –2|–1<br />
–3<br />
–2<br />
–1<br />
0 1<br />
2 3<br />
x<br />
Figure 1.19 The absolute value function has domain , and range 0, .<br />
EXAMPLE 7 Using Transformations<br />
Draw the graph of f x x 2 1. Then find the domain and range.<br />
[–4, 8] by [–3, 5]<br />
Figure 1.20 The lowest point of the<br />
graph of f x x 2 1 is 2, 1.<br />
(Example 7)<br />
SOLUTION<br />
The graph of f is the graph of the absolute value function shifted 2 units horizontally to<br />
the right and 1 unit vertically downward (Figure 1.20). The domain of ƒ is , and<br />
the range is 1, . Now try Exercise 49.<br />
x<br />
g<br />
g(x)<br />
f<br />
f(g(x))<br />
Figure 1.21 Two functions can be composed<br />
when a portion of the range of the<br />
first lies in the domain of the second.<br />
Composite Functions<br />
Suppose that some of the outputs of a function g can be used as inputs of a function f. We<br />
can then link g and f to form a new function whose inputs x are inputs of g and whose outputs<br />
are the numbers f (g(x)), as in Figure 1.21. We say that the function f (g(x)) (read
18 <strong>Chapter</strong> 1 Prerequisites for Calculus<br />
“f of g of x”) is the composite of g and f. It is made by composing g and ƒ in the order of<br />
first g, then f. The usual “stand-alone” notation for this composite is f g, which is read as<br />
“f of g.” Thus, the value of f g at x is f g(x) f (g(x)).<br />
EXAMPLE 8<br />
Composing Functions<br />
Find a formula for f (g(x)) if g(x) x 2 and f (x) x 7. Then find f (g(2)).<br />
SOLUTION<br />
To find f (g(x)), we replace x in the formula f (x) x 7 by the expression given for<br />
g(x).<br />
f x x 7<br />
f gx gx 7 x 2 7<br />
We then find the value of f (g(2)) by substituting 2 for x.<br />
f g2 2 2 7 3<br />
Now try Exercise 51.<br />
EXPLORATION 1<br />
Composing Functions<br />
Some graphers allow a function such as y 1 to be used as the independent variable of<br />
another function. With such a grapher, we can compose functions.<br />
1. Enter the functions y 1 f (x) 4 x 2 , y 2 g(x) x, y 3 y 2 (y 1 (x)), and<br />
y 4 y 1 (y 2 (x)). Which of y 3 and y 4 corresponds to f g? to g f ?<br />
2. Graph y 1 , y 2 , and y 3 and make conjectures about the domain and range of y 3 .<br />
3. Graph y 1 , y 2 , and y 4 and make conjectures about the domain and range of y 4 .<br />
4. Confirm your conjectures algebraically by finding formulas for y 3 and y 4 .<br />
Quick Review 1.2 (For help, go to Appendix A1 and Section 1.2.)<br />
In Exercises 1–6, solve for x.<br />
1. 3x 1 5x 3 [2, ) 2. x(x 2) 0 (, 0) (2, )<br />
3. x 3 4 [1, 7] 4. x 2 5<br />
5. x 2 16 (4, 4) 6. 9 x 2 0 [3, 3]<br />
(, 3] [7, )<br />
In Exercises 7 and 8, describe how the graph of ƒ can be transformed<br />
to the graph of g.<br />
7. f (x) x 2 , g(x) (x 2) 2 3<br />
8. f x x, gx x 5 2<br />
7. Translate the graph of f 2 units left and 3 units downward.<br />
8. Translate the graph of f 5 units right and 2 units upward.<br />
In Exercises 9–12, find all real solutions to the equations.<br />
9. f (x) x 2 5<br />
(a) ƒ(x) 4 (b) f (x) 6<br />
x 3, 3 No real solution<br />
10. f (x) 1x<br />
(a) f x 5 (b) f (x) 0 (a) x 1 5 (b) No solution<br />
11. f x x 7<br />
(a) f (x) 4 x 9 (b) f (x) 1 x 6<br />
12. f x 3 x 1<br />
(a) f (x) 2 (b) f (x) 3<br />
x 7 x 28
2. (a) h(s) 3<br />
s (b) h(3) 3 3<br />
m 3. (a) S(e) 6e 2 (b) S(5) 150 ft 2<br />
2<br />
2<br />
Section 1.2 Functions and Graphs 19<br />
Section 1.2 Exercises<br />
In Exercises 1–4, (a) write a formula for the function and (b) use the<br />
formula to find the indicated value of the function.<br />
1. the area A of a circle as a function of its diameter d; the area of a<br />
circle of diameter 4 in. (a) A(d) <br />
d 2 2 (b) A(4) 4 in 2<br />
2. the height h of an equilateral triangle as a function of its side length<br />
s; the height of an equilateral triangle of side length 3 m<br />
3. the surface area S of a cube as a function of the length of the<br />
cube’s edge e; the surface area of a cube of edge length 5 ft<br />
4. the volume V of a sphere as a function of the sphere’s radius r;<br />
the volume of a sphere of radius 3 cm<br />
In Exercises 5–12, (a) identify the domain and range and (b) sketch<br />
the graph of the function.<br />
5. y 4 x 2 (, ); (, 4] 6. y x 2 9 (, ); [9, )<br />
7. y 2 x 1 [1, ); [2, ) 8. y x (, 0]; (, 0]<br />
1<br />
9. y (, 2) (2, ); 10. y 4 x (, 0]; [0, )<br />
x 2 (, 0) (0, )<br />
11. y 1 1 x 12. y 1 1<br />
x2<br />
(, 0) (0, ); (, 1) (1, ) (, 0) (0, ); (1, )<br />
In Exercises 13–20, use a grapher to (a) identify the domain and<br />
range and (b) draw the graph of the function.<br />
13. y 3 x (, ); (, ) 14. y 23 x (, 3]; [0, )<br />
15. y 3 1 x 2 (, ); (, 1] 16. y 9 x 2 [3, 3]; [0, 3]<br />
17. y x 25 (, ); [0, ) 18. y x 32 [0, ); [0, )<br />
19. y 3 x<br />
3<br />
20. y <br />
1<br />
(, ); (, ) (2, 2); [0.5, )<br />
4 x<br />
2<br />
In Exercises 21–30, determine whether the function is even, odd, or<br />
neither. Try to answer without writing anything (except the answer).<br />
21. y x 4 Even 22. y x x 2 Neither<br />
23. y x 2 Neither 24. y x 2 3 Even<br />
25. y x 2 2 Even 26. y x x 3 Odd<br />
x3<br />
27. y Odd x<br />
2<br />
1<br />
28. y 3 2 x Neither<br />
1<br />
1<br />
29. y Neither 30. y x 1<br />
x<br />
2<br />
Even<br />
1<br />
In Exercises 31–34, graph the piecewise-defined functions.<br />
(a) V(r) 4 3 r 3 (b) V(3) 36 cm 3<br />
3 x, x 1<br />
1, x 0<br />
31. f x { 32. f x 2x, 1 x<br />
{ x, x 0<br />
4 x 2 , x 1<br />
33. f x 32x 32, 1 x 3<br />
{<br />
x 3, x 3<br />
x 2 , x 0<br />
34. f x <br />
{ x3 , 0 x 1<br />
2x 1, x 1<br />
35. Writing to Learn The vertical line test to determine whether<br />
a curve is the graph of a function states: If every vertical line in<br />
the xy-plane intersects a given curve in at most one point, then<br />
the curve is the graph of a function. Explain why this is true.<br />
36. Writing to Learn For a curve to be symmetric about the<br />
x-axis, the point (x, y) must lie on the curve if and only if the point<br />
(x, y) lies on the curve. Explain why a curve that is symmetric<br />
about the x-axis is not the graph of a function, unless the function<br />
is y 0.<br />
In Exercises 37–40, use the vertical line test (see Exercise 35) to<br />
determine whether the curve is the graph of a function.<br />
37. No y<br />
38. Yes y<br />
39. Yes y<br />
40. No<br />
In Exercises 41–48, write a piecewise formula for the function.<br />
41. y See page 21. 42. y See page 21.<br />
1<br />
0<br />
43. y See page 21. 44. See page 21. y<br />
2<br />
(1, 1)<br />
(2, 1)<br />
2<br />
2<br />
5<br />
x<br />
x<br />
x<br />
x<br />
2<br />
0<br />
1 2 3<br />
3<br />
2<br />
1<br />
y<br />
–1<br />
–1<br />
–2<br />
–3<br />
1<br />
4<br />
2<br />
(2, –1)<br />
x<br />
x<br />
x<br />
x
20 <strong>Chapter</strong> 1 Prerequisites for Calculus<br />
45. y<br />
46.<br />
See page 21.<br />
See page 21.<br />
(–1, 1) (1, 1)<br />
1<br />
47. y<br />
48. y<br />
See page 21.<br />
(T, 1)<br />
See page 21.<br />
1<br />
A<br />
0<br />
T –2<br />
T<br />
3<br />
x<br />
0<br />
–A<br />
T –2<br />
2<br />
T<br />
y<br />
(–2, –1) (1, –1) (3, –1)<br />
3T —2<br />
1<br />
2T<br />
x<br />
x<br />
y 2.893x 2 24.107x 590.214<br />
(a) Find the quadratic regression for the data in Table 1.5. Let<br />
x 0 represent 1990, x 1 represent 1991, and so forth.<br />
(b) Superimpose the graph of the quadratic regression equation<br />
on a scatter plot of the data.<br />
(c) Use the quadratic regression to predict the amount of revenue<br />
in 2008. $1093 million or $1.093 billion.<br />
(d) Now find the linear regression for the data and use it to predict<br />
the amount of revenue in 2008.<br />
linear regression: y 33.75x 312.5; $920 million in 2008<br />
55. The Cone Problem Begin with a circular piece of paper with a<br />
4-in. radius as shown in (a). Cut out a sector with an arc length of<br />
x. Join the two edges of the remaining portion to form a cone<br />
with radius r and height h, as shown in (b).<br />
In Exercises 49 and 50, (a) draw the graph of the function. Then find<br />
its (b) domain and (c) range.<br />
49. f (x) |3 x| 2 50. f (x) 2|x 4| 3<br />
(b) All reals (c) (, 2] (b) All reals (c) [3, )<br />
In Exercises 51 and 52, find<br />
(a) f (g(x)) (b) g( f (x)) (c) f (g(0))<br />
(d) g(ƒ(0)) (e) g(g(2)) (f) f ( f (x))<br />
51. f (x) x 5, g(x) x 2 3 (a) x 2 2 (b) x 2 10x 22<br />
(c) 2 (d) 22 (e) –2 (f) x 10<br />
52. f (x) x 1, g(x) x 1<br />
(a) x (b) x (c) 0 (d) 0 (e) –4 (f) x 2<br />
53. Copy and complete the following table.<br />
x 2 f (x) x<br />
g(x) ƒ(x) (ƒ g)(x)<br />
(a) ? g(x) x 5 x<br />
2 5<br />
1<br />
(b) ? 11x x g(x) <br />
x 1<br />
(c) 1x ? f (x) 1 x<br />
x <br />
2<br />
(d) x ? ⏐x⏐, x 0<br />
54. Broadway Season Statistics Table 1.5 shows the gross revenue<br />
for the Broadway season in millions of dollars for several<br />
years.<br />
Table 1.5<br />
Broadway Season Revenue<br />
Year<br />
Amount ($ millions)<br />
1997 558<br />
1998 588<br />
1999 603<br />
2000 666<br />
2001 643<br />
2002 721<br />
2003 771<br />
Source: The League of American Theatres and Producers, Inc.,<br />
New York, NY, as reported in The World Almanac and Book of<br />
Facts, 2005.<br />
(a)<br />
4 in.<br />
x<br />
h<br />
(b)<br />
r<br />
4 in.<br />
(a) Explain why the circumference of the base of the cone is<br />
8p x.<br />
Because the circumference of the original circle was 8p and<br />
a piece of length x was removed.<br />
(b) Express the radius r as a function of x. r 8p x<br />
4 <br />
2p 2<br />
xp <br />
(c) Express the height h as a function of x.<br />
(d) Express the volume V of the cone as a function of x.<br />
56. Industrial Costs Dayton Power and Light, Inc., has a power<br />
plant on the Miami River where the river is 800 ft wide. To lay a<br />
new cable from the plant to a location in the city 2 mi downstream<br />
on the opposite side costs $180 per foot across the river<br />
and $100 per foot along the land.<br />
(a) Suppose that the cable goes from the plant to a point Q on<br />
the opposite side that is x ft from the point P directly opposite<br />
the plant. Write a function C(x) that gives the cost of laying the<br />
cable in terms of the distance x. C(x) 180800 2 x 2 100(10,560 x)<br />
56. (b)<br />
(b) Generate a table of values to determine if the least expensive<br />
C(0) $1,200,000 location for point Q is less than 2000 ft or greater than 2000 ft<br />
C(500) $1,175,812<br />
C(1000) $1,186,512<br />
from point P.<br />
C(1500) $1,212,000<br />
2 mi<br />
C(2000) $1,243,732<br />
P x Q<br />
Dayton<br />
C(2500) $1,278,479<br />
C(3000) $1,314,870<br />
Values beyond this are<br />
all larger. It would appear<br />
800 ft<br />
that the least expen-<br />
sive location is less than<br />
Power plant<br />
2000 feet from point P.<br />
(Not to scale)<br />
55. (c) h 16 r 2 16p x x 2<br />
55. (d) V 1<br />
2p<br />
3 pr2 h (8p x)2 16px x <br />
<br />
2<br />
24p<br />
2
Section 1.2 Functions and Graphs 21<br />
Standardized Test Questions<br />
You should solve the following problems without using a<br />
graphing calculator.<br />
57. True or False The function f (x) x 4 x 2 x is an even<br />
function. Justify your answer. False. f (x) ≠ f (x)<br />
58. True or False The function f (x) x 3 is an odd function. Justify<br />
your answer. True. f (x) f (x)<br />
59. Multiple Choice Which of the following gives the domain of<br />
x<br />
f (x) ? B<br />
9 x<br />
2<br />
<br />
(A) x 3 (B) (3, 3) (C) [3, 3]<br />
(D) (, 3) (3, ) (E) (3, )<br />
60. Multiple Choice Which of the following gives the range of<br />
1<br />
f (x) 1 ? A x 1<br />
(A) (, 1) (1, ) (B) x 1 (C) all real numbers<br />
(D) (, 0) (0, ) (E) x 0<br />
61. Multiple Choice If f (x) 2x 1 and g(x) x 3, which of<br />
the following gives ( f g)(2)? D<br />
(A) 2 (B) 6 (C) 7 (D) 9 (E) 10<br />
62. Multiple Choice The length L of a rectangle is twice as long as<br />
its width W. Which of the following gives the area A of the rectangle<br />
as a function of its width? C<br />
(A) A(W) 3W (B) A(W) 1 2 W 2 (C) A(W) 2W 2<br />
(D) A(W) W 2 2W<br />
Explorations<br />
(E) A(W) W 2 2W<br />
In Exercises 63–66, (a) graph f g and g f and make a conjecture<br />
about the domain and range of each function. (b) Then confirm your<br />
conjectures by finding formulas for f g and g f.<br />
63. f (x) x 7, gx x<br />
64. f (x) 1 x 2 , gx x<br />
65. f (x) x 2 3, gx x 2<br />
66. f x 2 x <br />
x <br />
, 1<br />
3<br />
gx 3 x 1<br />
2 <br />
x<br />
x, 0 x 1<br />
41. f x { 2 x, 1 x 2<br />
0 x 1<br />
0, 1 x 2<br />
42. f x 2, 2 x 3<br />
0, 3 x 4<br />
2 x, 0 x 2<br />
43. f x 5 3 x , 2 x 5<br />
3<br />
3x 3, 1 x 0<br />
44. f x 2x 3, 0 x 2<br />
( f ° g)(x) x 7; (g ° f )(x) x 7<br />
( f ° g)(x) 1 (x) 2 1 x, x 0<br />
(g ° f)(x) 1x <br />
2<br />
45. f x <br />
<br />
Group Activity In Exercises 67–70, a portion of the graph of a<br />
function defined on [2, 2] is shown. Complete each graph assuming<br />
that the graph is (a) even, (b) odd.<br />
67. y<br />
68. y<br />
1.5<br />
69. y 70.<br />
–2<br />
y f (x)<br />
0 1 2<br />
–1<br />
1.3<br />
Extending the Ideas<br />
0<br />
x<br />
x<br />
0 1 2<br />
71. Enter y 1 x, y 2 1 x and y 3 y 1 y 2 on your<br />
grapher.<br />
(a) Graph y 3 in [3, 3] by [1, 3].<br />
(b) Compare the domain of the graph of y 3 with the domains of<br />
the graphs of y 1 and y 2 .<br />
(c) Replace y 3 by<br />
y 1 y 2 , y 2 y 1 , y 1<br />
# y 2 , y 1 y 2 , and y 2 y 1 ,<br />
in turn, and repeat the comparison of part (b).<br />
(d) Based on your observations in (b) and (c), what would you<br />
conjecture about the domains of sums, differences, products, and<br />
quotients of functions?<br />
72. Even and Odd Functions<br />
(a) Must the product of two even functions always be even?<br />
Give reasons for your answer.<br />
(b) Can anything be said about the product of two odd functions?<br />
Give reasons for your answer.<br />
<br />
x, 1 x 0<br />
1, 0 x 1<br />
3 2 x 48. f x<br />
, 1 x 3<br />
2<br />
x<br />
, 2 x 0<br />
46. f x <br />
2<br />
2x 2, 0 x 1<br />
1, 1 x 3<br />
47. f x 0, 0 x T 2 <br />
2 T<br />
x 1,<br />
T 2 x T<br />
1<br />
–1<br />
–2<br />
–1<br />
A, 0 x T 2 <br />
A,<br />
T 2 x T<br />
A, T x 3 <br />
2T<br />
A, 3 T x 2T<br />
2<br />
65. (b) ( f ° g)(x) (x) 2<br />
2 3<br />
x 1, x 2<br />
(g ° f )(x) x <br />
2 1<br />
66. (b) ( f ° g)(x) x, x 2<br />
(g ° f )(x) x, x 3<br />
1.3<br />
0<br />
–1.3<br />
y<br />
x<br />
x
22 <strong>Chapter</strong> 1 Prerequisites for Calculus<br />
1.3<br />
What you’ll learn about<br />
• Exponential Growth<br />
• Exponential Decay<br />
• Applications<br />
• The Number e<br />
. . . and why<br />
Exponential functions model<br />
many growth patterns.<br />
Exponential Functions<br />
Exponential Growth<br />
Table 1.6 shows the growth of $100 invested in 1996 at an interest rate of 5.5%, compounded<br />
annually.<br />
Table 1.6<br />
Savings Account Growth<br />
Year Amount (dollars) Increase (dollars)<br />
1996 100<br />
5.50<br />
1997 100(1.055) 105.50<br />
5.80<br />
1998 100(1.055) 2 111.30<br />
6.12<br />
1999 100(1.055) 3 117.42<br />
6.46<br />
2000 100(1.055) 4 123.88<br />
After the first year, the value of the account is always 1.055 times its value in the previous<br />
year. After n years, the value is y 100 • (1.055) n .<br />
Compound interest provides an example of exponential growth and is modeled by a<br />
function of the form y P • a x , where P is the initial investment and a is equal to 1 plus<br />
the interest rate expressed as a decimal.<br />
The equation y P • a x , a 0, a 1, identifies a family of functions called<br />
exponential functions. Notice that the ratio of consecutive amounts in Table 1.6 is always<br />
the same: 111.30105.30 117.42111.30 123.88117.42 1.055. This fact is an important<br />
feature of exponential curves that has widespread application, as we will see.<br />
y = 2 x DEFINITION Exponential Function<br />
[–6, 6] by [–2, 6]<br />
(a)<br />
EXPLORATION 1 Exponential Functions<br />
1. Graph the function y a x for a 2, 3, 5, in a [5, 5] by [2, 5] viewing window.<br />
2. For what values of x is it true that 2 x 3 x 5 x ?<br />
3. For what values of x is it true that 2 x 3 x 5 x ?<br />
4. For what values of x is it true that 2 x 3 x 5 x ?<br />
5. Graph the function y (1a) x a x for a 2, 3, 5.<br />
6. Repeat parts 2–4 for the functions in part 5.<br />
y = 2 –x<br />
Let a be a positive real number other than 1. The function<br />
f x a x<br />
is the exponential function with base a.<br />
[–6, 6] by [–2, 6]<br />
(b)<br />
Figure 1.22 A graph of (a) y 2 x and<br />
(b) y 2 x .<br />
The domain of f (x) a x is , and the range is 0, . If a 1, the graph of f<br />
looks like the graph of y 2 x in Figure 1.22a. If 0 a 1, the graph of ƒ looks like the<br />
graph of y 2 x in Figure 1.22b.<br />
EXAMPLE 1<br />
Graphing an Exponential Function<br />
Graph the function y 2(3 x ) 4. State its domain and range.<br />
continued
Section 1.3 Exponential Functions 23<br />
y = 2(3 x ) – 4<br />
SOLUTION<br />
Figure 1.23 shows the graph of the function y. It appears that the domain is (, ). The<br />
range is (4, ) because 2(3 x ) 0 for all x. Now try Exercise 1.<br />
[–5, 5] by [–5, 5]<br />
Figure 1.23 The graph of y 2(3 x ) 4.<br />
(Example 1)<br />
EXAMPLE 2<br />
Finding Zeros<br />
Find the zeros of f (x) 5 2.5 x graphically.<br />
SOLUTION<br />
Figure 1.24a suggests that f has a zero between x 1 and x 2, closer to 2. We can<br />
use our grapher to find that the zero is approximately 1.756 (Figure 1.24b).<br />
Now try Exercise 9.<br />
y = 5 – 2.5 x [–5, 5] by [–8, 8]<br />
Exponential functions obey the rules for exponents.<br />
Rules for Exponents<br />
If a 0 and b 0, the following hold for all real numbers x and y.<br />
1. a x • a y a xy 2. a x<br />
a<br />
a y xy<br />
3. a x y a y x a xy<br />
x<br />
4. a x • b x (ab) x 5. ( a b ) a<br />
<br />
x b<br />
x<br />
(a)<br />
y = 5 – 2.5 x<br />
In Table 1.6 we observed that the ratios of the amounts in consecutive years were always<br />
the same, namely the interest rate. Population growth can sometimes be modeled<br />
with an exponential function, as we see in Table 1.7 and Example 3.<br />
Table 1.7 gives the United States population for several recent years. In this table we<br />
have divided the population in one year by the population in the previous year to get an<br />
idea of how the population is growing. These ratios are given in the third column.<br />
Zero<br />
X=1.7564708 Y=0<br />
[–5, 5] by [–8, 8]<br />
(b)<br />
Figure 1.24 (a) A graph of<br />
f (x) 5 2.5 x . (b) Showing the use of<br />
the ZERO feature to approximate the zero<br />
of f. (Example 2)<br />
Table 1.7 United States Population<br />
Year Population (millions) Ratio<br />
1998 276.1<br />
279.3276.1 1.0116<br />
1999 279.3<br />
282.4279.3 1.0111<br />
2000 282.4<br />
285.3282.4 1.0102<br />
2001 285.3<br />
288.2285.3 1.0102<br />
2002 288.2<br />
291.0288.2 1.0097<br />
2003 291.0<br />
Source: Statistical Abstract of the United States, 2004–2005.<br />
EXAMPLE 3 Predicting United States Population<br />
Use the data in Table 1.7 and an exponential model to predict the population of the<br />
United States in the year 2010.<br />
continued
24 <strong>Chapter</strong> 1 Prerequisites for Calculus<br />
SOLUTION<br />
Based on the third column of Table 1.7, we might be willing to conjecture that the population<br />
of the United States in any year is about 1.01 times the population in the previous<br />
year.<br />
If we start with the population in 1998, then according to the model the population<br />
(in millions) in 2010 would be about<br />
276.1(1.01) 12 311.1,<br />
or about 311.1 million people. Now try Exercise 19.<br />
Exponential Decay<br />
Exponential functions can also model phenomena that produce a decrease over time, such<br />
as happens with radioactive decay. The half-life of a radioactive substance is the amount<br />
of time it takes for half of the substance to change from its original radioactive state to a<br />
nonradioactive state by emitting energy in the form of radiation.<br />
(<br />
1 t/20<br />
y = 5 , y = 1<br />
2<br />
(<br />
Intersection<br />
X=46.438562 Y=1<br />
[0, 80] by [–3, 5]<br />
Figure 1.25 (Example 4)<br />
Table 1.8<br />
U.S. Population<br />
Year Population (millions)<br />
1880 50.2<br />
1890 63.0<br />
1900 76.2<br />
1910 92.2<br />
1920 106.0<br />
1930 123.2<br />
1940 132.1<br />
1950 151.3<br />
1960 179.3<br />
1970 203.3<br />
1980 226.5<br />
1990 248.7<br />
Source: The Statistical Abstract of the United<br />
States, 2004–2005.<br />
EXAMPLE 4<br />
Modeling Radioactive Decay<br />
Suppose the half-life of a certain radioactive substance is 20 days and that there are<br />
5 grams present initially. When will there be only 1 gram of the substance remaining?<br />
SOLUTION<br />
Model The number of grams remaining after 20 days is<br />
5 ( 1 2 ) 5 2 .<br />
The number of grams remaining after 40 days is<br />
2<br />
5 ( 1 2 )( 1 2 ) ( 5 1 2 ) 5 4 .<br />
The function y 5(12) t20 models the mass in grams of the radioactive substance after<br />
t days.<br />
Solve Graphically Figure 1.25 shows that the graphs of y 1 5(12) t20 and<br />
y 2 1 (for 1 gram) intersect when t is approximately 46.44.<br />
Interpret There will be 1 gram of the radioactive substance left after approximately<br />
46.44 days, or about 46 days 10.5 hours. Now try Exercise 23.<br />
Compound interest investments, population growth, and radioactive decay are all<br />
examples of exponential growth and decay.<br />
DEFINITIONS<br />
Exponential Growth, Exponential Decay<br />
The function y k • a x , k 0 is a model for exponential growth if a 1, and a<br />
model for exponential decay if 0 a 1.<br />
Applications<br />
Most graphers have the exponential growth and decay model y k • a x built in as an exponential<br />
regression equation. We use this feature in Example 5 to analyze the U.S. population<br />
from the data in Table 1.8.
Section 1.3 Exponential Functions 25<br />
1<br />
EXAMPLE 5<br />
Predicting the U.S. Population<br />
Use the population data in Table 1.8 to estimate the population for the year 2000. Compare<br />
the result with the actual 2000 population of approximately 281.4 million.<br />
X = 12<br />
Y = 308.1712<br />
[–1, 15] by [–50, 350]<br />
SOLUTION<br />
Model Let x 0 represent 1880, x 1 represent 1890, and so on. We enter the data<br />
into the grapher and find the exponential regression equation to be<br />
f (x) (56.4696)(1.1519) x .<br />
Figure 1.26 shows the graph of f superimposed on the scatter plot of the data.<br />
Figure 1.26 (Example 5)<br />
Solve Graphically The year 2000 is represented by x 12. Reading from the curve,<br />
we find<br />
f 12308.2.<br />
The exponential model estimates the 2000 population to be 308.2 million, an overestimate<br />
of approximately 26.8 million, or about 9.5%.<br />
Now try Exercise 39(a, b).<br />
EXAMPLE 6<br />
Interpreting Exponential Regression<br />
What annual rate of growth can we infer from the exponential regression equation in<br />
Example 5?<br />
y = (1 + 1/x) x<br />
SOLUTION<br />
Let r be the annual rate of growth of the U.S. population, expressed as a decimal. Because<br />
the time increments we used were 10-year intervals, we have<br />
(1 r) 10 1.1519<br />
r 10 1.1519 1<br />
r 0.014<br />
The annual rate of growth is about 1.4%.<br />
Now try Exercise 39(c).<br />
[–10, 10] by [–5, 10]<br />
X<br />
1000<br />
2000<br />
3000<br />
4000<br />
5000<br />
6000<br />
7000<br />
Y1<br />
2.7169<br />
2.7176<br />
2.7178<br />
2.7179<br />
2.718<br />
2.7181<br />
2.7181<br />
Y1 = (1+1/X)^X<br />
Figure 1.27 A graph and table of values<br />
for f (x) (1 1x) x both suggest that as<br />
x→ , f x→ e 2.718.<br />
The Number e<br />
Many natural, physical, and economic phenomena are best modeled by an exponential<br />
function whose base is the famous number e, which is 2.718281828 to nine decimal<br />
places. We can define e to be the number that the function f (x) (1 1x) x approaches<br />
as x approaches infinity. The graph and table in Figure 1.27 strongly suggest that such a<br />
number exists.<br />
The exponential functions y e x and y e x are frequently used as models of exponential<br />
growth or decay. For example, interest compounded continuously uses the model<br />
y P • e rt , where P is the initial investment, r is the interest rate as a decimal, and t is<br />
time in years.
26 <strong>Chapter</strong> 1 Prerequisites for Calculus<br />
Quick Review 1.3 (For help, go to Section 1.3.)<br />
In Exercises 1–3, evaluate the expression. Round your answers to<br />
3 decimal places.<br />
1. 5 23 2.924 2. 3 2 4.729<br />
3. 3 1.5 0.192<br />
In Exercises 4–6, solve the equation. Round your answers to<br />
4 decimal places.<br />
4. x 3 17 2.5713 5. x 5 24 1.8882<br />
6. x 10 1.4567 1.0383<br />
In Exercises 7 and 8, find the value of investing P dollars for n years<br />
with the interest rate r compounded annually.<br />
7. P $500, r 4.75%, n 5 years $630.58<br />
8. P $1000, r 6.3%, n 3 years $1201.16<br />
)<br />
)<br />
In Exercises 9 and 10, simplify the exponential expression.<br />
9. x<br />
3y2<br />
2<br />
<br />
<br />
x<br />
4y3<br />
3 x 18 y 5 1<br />
b2<br />
2<br />
c2<br />
1<br />
<br />
<br />
x<br />
1 8 10.<br />
y ( 5 a3 c4<br />
( a4 b3<br />
a 2 b 1 c 6 a2<br />
b c6<br />
Section 1.3 Exercises<br />
1. Domain: All reals Range: (, 3) 2. Domain: All reals Range: (3, )<br />
In Exercises 1–4, graph the function. State its domain and range.<br />
1. y 2 x 3 2. y e x 3<br />
3. y 3 • e x 2 4. y 2 x 1<br />
Domain: All reals Range: (2, ) Domain: All reals Range: (, 1)<br />
In Exercises 5–8, rewrite the exponential expression to have the indicated<br />
base.<br />
5. 9 2x , base 3 3 4x 6. 16 3x , base 2 2 12x<br />
7. (18) 2x , base 2 2 6x 8. (127) x , base 3 3 3x<br />
In Exercises 9–12, use a graph to find the zeros of the function.<br />
9. f (x) 2 x 5 2.322 10. f (x) e x 4 1.386<br />
11. f (x) 3 x 0.5 0.631 12. f (x) 3 2 x 1.585<br />
In Exercises 13–18, match the function with its graph. Try to do it<br />
without using your grapher.<br />
13. y 2 x (a) 14. y 3 x (d) 15. y 3 x (e)<br />
16. y 0.5 x (c) 17. y 2 x 2 (b) 18. y 1.5 x 2 (f)<br />
(a)<br />
(c)<br />
(e)<br />
(b)<br />
(d)<br />
(f)<br />
19. Population of Nevada Table 1.9 gives the population of<br />
Nevada for several years.<br />
Table 1.9<br />
Population of Nevada<br />
Year Population (thousands)<br />
1998 1,853<br />
1999 1,935<br />
2000 1,998<br />
2001 2,095<br />
2002 2,167<br />
2003 2,241<br />
Source: Statistical Abstract of the United States,<br />
2004–2005.<br />
(a) Compute the ratios of the population in one year by the population<br />
in the previous year. 1.0443, 1.0326, 1.0485, 1.0344, 1.0341<br />
(b) Based on part (a), create an exponential model for the population<br />
of Nevada. One possibility is 1853(1.04) n<br />
(c) Use your model in part (b) to predict the population of<br />
Nevada in 2010. 2,967 thousand, or 2,967,000<br />
20. Population of Virginia Table 1.10 gives the population of<br />
Virginia for several years.<br />
Table 1.10 Population of Virginia<br />
Year Population (thousands)<br />
1998 6,901<br />
1999 7,000<br />
2000 7,078<br />
2001 7,193<br />
2002 7,288<br />
2003 7,386<br />
Source: Statistical Abstract of the United States,<br />
2004–2005.<br />
(a) Compute the ratios of the population in one year by the<br />
population in the previous year. 1.0143, 1.0111, 1.0162, 1.0132, 1.0134<br />
(b) Based on part (a), create an exponential model for the<br />
population of Virginia. One possibility is 6901(1.013) n<br />
(c) Use your model in part (b) to predict the population of<br />
Virginia in 2008. 7,852 thousand, or 7,852,000
Section 1.3 Exponential Functions 27<br />
In Exercises 21–32, use an exponential model to solve the problem. 33. y 2x 3<br />
21. Population Growth The population of Knoxville is 500,000<br />
x y y<br />
x y Change ( ¢y)<br />
and is increasing at the rate of 3.75% each year. Approximately<br />
1 1<br />
2<br />
1 ?<br />
when will the population reach 1 million? After 19 years<br />
2 1<br />
?<br />
2<br />
3 3<br />
2 ?<br />
2<br />
22. Population Growth The population of Silver Run in the year<br />
? 4 5<br />
1890 was 6250. Assume the population increased at a rate of<br />
3 ?<br />
?<br />
2.75% per year.<br />
4 ?<br />
2 48 2.815 10 14<br />
(a) Estimate the population in 1915 and 1940.<br />
1915: 12,315;<br />
1940: 24,265<br />
(b) Approximately when did the population reach 50,000?<br />
1967 [76.651 years after 1890] 34. y 3x 4<br />
23. Radioactive Decay The half-life of phosphorus-32 is about<br />
x y Change ( ¢y)<br />
x y y<br />
14 days. There are 6.6 grams present initially.<br />
1 1<br />
1 ?<br />
3<br />
(a) Express the amount of phosphorus-32 remaining as a<br />
2 2<br />
?<br />
function of time t.<br />
A(t) 6.6<br />
1 2 ?<br />
2 t/14<br />
3<br />
3 5<br />
3<br />
?<br />
4 8<br />
(b) When will there be 1 gram remaining? About 38.1145 days later<br />
3 ?<br />
?<br />
24. Finding Time If John invests $2300 in a savings account with<br />
4 ?<br />
a 6% interest rate compounded annually, how long will it take<br />
until John’s account has a balance of $4150? 10.129 years<br />
35. y x 2<br />
25. Doubling Your Money Determine how much time is required<br />
x y y<br />
x y Change ( ¢y)<br />
for an investment to double in value if interest is earned at the<br />
1 1<br />
3<br />
rate of 6.25% compounded annually. 11.433 years<br />
1 ?<br />
2 4<br />
5<br />
?<br />
3 9<br />
26. Doubling Your Money Determine how much time is required<br />
2 ?<br />
7<br />
for an investment to double in value if interest is earned at the<br />
?<br />
4 16<br />
3 ?<br />
rate of 6.25% compounded monthly. 11.119 years<br />
?<br />
4 ?<br />
27. Doubling Your Money Determine how much time is required<br />
for an investment to double in value if interest is earned at the<br />
rate of 6.25% compounded continuously. 11.090 years<br />
36. y 3e x<br />
x y y<br />
28. Tripling Your Money Determine how much time is required<br />
x y Ratio (y i y i1 )<br />
1 8.155<br />
for an investment to triple in value if interest is earned at the rate<br />
2.718<br />
1 ?<br />
2 22.167<br />
of 5.75% compounded annually. 19.650 years<br />
?<br />
2.718<br />
2 ?<br />
3 60.257<br />
2.718<br />
29. Tripling Your Money Determine how much time is required<br />
? 4 163.794<br />
3 ?<br />
for an investment to triple in value if interest is earned at the rate<br />
?<br />
of 5.75% compounded daily. 19.108 years<br />
4 ?<br />
30. Tripling Your Money Determine how much time is required<br />
for an investment to triple in value if interest is earned at the rate<br />
of 5.75% compounded continuously.<br />
37. Writing to Learn Explain how the change ¢ y is related to<br />
19.106 years<br />
the slopes of the lines in Exercises 33 and 34. If the changes in x<br />
are constant for a linear function, what would you conclude<br />
about the corresponding changes in y?<br />
31. Cholera Bacteria Suppose that a colony of bacteria starts<br />
with 1 bacterium and doubles in number every half hour. How<br />
many bacteria will the colony contain at the end of 24 h?<br />
32. Eliminating a Disease Suppose that in any given year, the<br />
number of cases of a disease is reduced by 20%. If there are<br />
10,000 cases today, how many years will it take<br />
(a) to reduce the number of cases to 1000? 10.319 years<br />
(b) to eliminate the disease; that is, to reduce the number of<br />
cases to less than 1? 41.275 years<br />
Group Activity In Exercises 33–36, copy and complete the table<br />
for the function.<br />
38. Bacteria Growth The number of bacteria in a petri dish culture<br />
after t hours is<br />
B 100e 0.693t .<br />
(a) What was the initial number of bacteria present? 100<br />
(b) How many bacteria are present after 6 hours? 6394<br />
(c) Approximately when will the number of bacteria be 200?<br />
Estimate the doubling time of the bacteria. After about 1 hour,<br />
which is the doubling time<br />
37. Since x 1, the corresponding value of y is equal to the slope<br />
of the line. If the changes in x are constant for a linear function,<br />
then the corresponding changes in y are constant as well.
28 <strong>Chapter</strong> 1 Prerequisites for Calculus<br />
39. Population of Texas Table 1.11 gives the population of<br />
Texas for several years.<br />
Table 1.11 Population of Texas<br />
Year Population (thousands)<br />
1980 14,229<br />
1990 16,986<br />
1995 18,959<br />
1998 20,158<br />
1999 20,558<br />
2000 20,852<br />
Source: Statistical Abstract of the United States,<br />
2004–2005.<br />
(a) Let x 0 represent 1980, x 1 represent 1981, and so forth.<br />
Find an exponential regression for the data, and superimpose its<br />
graph on a scatter plot of the data. y 14153.84(1.01963) x<br />
(b) Use the exponential regression equation to estimate the<br />
population of Texas in 2003. How close is the estimate to the actual<br />
population of 22,119,000 in 2003? Estimate: 22,133,000; the<br />
estimate exceeds the actual by 14,000<br />
(c) Use the exponential regression equation to estimate the annual<br />
rate of growth of the population of Texas. 0.020 or 2%<br />
40. Population of California Table 1.12 gives the population of<br />
California for several years.<br />
Table 1.12 Population of California<br />
Year Population (thousands)<br />
1980 23,668<br />
1990 29,811<br />
1995 31,697<br />
1998 32,988<br />
1999 33,499<br />
2000 33,872<br />
Source: Statistical Abstract of the United States,<br />
2004–2005.<br />
(a) Let x 0 represent 1980, x 1 represent 1981, and so forth.<br />
Find an exponential regression for the data, and superimpose its<br />
graph on a scatter plot of the data. y 24121.49(1.0178) x<br />
(b) Use the exponential regression equation to estimate the population<br />
of California in 2003. How close is the estimate to the<br />
actual population of 35,484,000 in 2003? Estimate: 36,194,000; the<br />
estimate exceeds the actual by 710,000<br />
(c) Use the exponential regression equation to estimate the annual<br />
rate of growth of the population of California. 0.018 or 1.8%<br />
Standardized Test Questions<br />
You may use a graphing calculator to solve the following<br />
problems.<br />
41. True or False The number 3 2 is negative. Justify your answer.<br />
42. True or False If 4 3 2 a False. It is positive 19.<br />
, then a 6. Justify your answer.<br />
True. 4 3 (2 2 ) 3 2 6<br />
43. Multiple Choice John invests $200 at 4.5% compounded annually.<br />
About how long will it take for John’s investment to double in<br />
value? D<br />
(A) 6 yrs (B) 9 yrs (C) 12 yrs (D) 16 yrs (E) 20 yrs<br />
44. Multiple Choice Which of the following gives the domain of<br />
y 2e x 3? A<br />
(A) (, ) (B) [3, ) (C) [1, ) (D) (,3]<br />
(E) x 0<br />
45. Multiple Choice Which of the following gives the range of<br />
y 4 2 x ? B<br />
(A) (, ) (B) (,4) (C) [4, )<br />
(D) (,4] (E) all reals<br />
46. Multiple Choice Which of the following gives the best<br />
approximation for the zero of f (x) 4 e x ? C<br />
(A) x 1.386 (B) x 0.386 (C) x 1.386<br />
(D) x 3 (E) there are no zeros<br />
Exploration<br />
47. Let y 1 x 2 and y 2 2 x .<br />
(a) Graph y 1 and y 2 in [5, 5] by [2, 10]. How many times do<br />
you think the two graphs cross?<br />
(b) Compare the corresponding changes in y 1 and y 2 as x<br />
changes from 1 to 2, 2 to 3, and so on. How large must x be for<br />
the changes in y 2 to overtake the changes in y 1 ?<br />
(c) Solve for x: x 2 2 x . (d) Solve for x: x 2 2 x .<br />
x 0.7667, x 2, x 4 (0.7667, 2) (4, )<br />
Extending the Ideas<br />
In Exercises 48 and 49, assume that the graph of the exponential<br />
function ƒ(x) k#<br />
a x passes through the two points. Find the values<br />
of a and k.<br />
48. (1, 4.5), (1, 0.5) 49. (1, 1.5), (1, 6)<br />
a 3, k 1.5 a 0.5, k 3
Section 1.3 Exponential Functions 29<br />
Quick Quiz for AP* Preparation: Sections 1.1–1.3<br />
You may use graphing calculator to solve the following<br />
problems.<br />
1. Multiple Choice Which of the following gives an equation for<br />
the line through (3, 1) and parallel to the line y 2x 1? C<br />
(A) 1 2 x 7 2 (B) y 1 2 x 5 <br />
2<br />
(C) y 2x 5<br />
(D) y 2x 7 (E) y 2x 1<br />
2. Multiple Choice If f (x) x 2 1 and g(x) 2x 1, which<br />
of the following gives f g(2)? D<br />
(A) 2 (B) 5 (C) 9 (D) 10 (E) 15<br />
3. Multiple Choice The half-life of a certain radioactive substance<br />
is 8 hrs. There are 5 grams present initially. Which of the<br />
following gives the best approximation when there will be 1<br />
gram remaining? E<br />
(A) 2 (B)10 (C) 15 (D) 16 (E) 19<br />
4. Free Response Let f (x) e x 2.<br />
(a) Find the domain of f. (, ) (b) Find the range of f.<br />
(c) Find the zeros of f. x 0.693<br />
(2, )
30 <strong>Chapter</strong> 1 Prerequisites for Calculus<br />
1.4<br />
What you’ll learn about<br />
• Relations<br />
• Circles<br />
• Ellipses<br />
• Lines and Other Curves<br />
. . . and why<br />
Parametric equations can be<br />
used to obtain graphs of relations<br />
and functions.<br />
x = √t, y = t<br />
[–5, 5] by [–5, 10]<br />
Figure 1.28 You must choose a smallest<br />
and largest value for t in parametric mode.<br />
Here we used 0 and 10, respectively.<br />
(Example 1)<br />
Parametric Equations<br />
Relations<br />
A relation is a set of ordered pairs (x, y) of real numbers. The graph of a relation is the<br />
set of points in the plane that correspond to the ordered pairs of the relation. If x and y are<br />
functions of a third variable t, called a parameter, then we can use the parametric mode of<br />
a grapher to obtain a graph of the relation.<br />
EXAMPLE 1<br />
Graphing Half a Parabola<br />
Describe the graph of the relation determined by<br />
x t, y t, t 0.<br />
Indicate the direction in which the curve is traced. Find a Cartesian equation for a curve<br />
that contains the parametrized curve.<br />
SOLUTION<br />
Set x 1 t, y 1 t, and use the parametric mode of the grapher to draw the graph in<br />
Figure 1.28. The graph appears to be the right half of the parabola y x 2 . Notice that<br />
there is no information about t on the graph itself. The curve appears to be traced to the<br />
upper right with starting point (0, 0).<br />
Confirm Algebraically Both x and y will be greater than or equal to zero<br />
because t 0. Eliminating t we find that for every value of t,<br />
y t t 2 x 2 .<br />
Thus, the relation is the function y x 2 , x 0.<br />
Now try Exercise 5.<br />
DEFINITIONS<br />
Parametric Curve, Parametric Equations<br />
If x and y are given as functions<br />
x f t,<br />
y gt<br />
over an interval of t-values, then the set of points x, y f t, gt defined by<br />
these equations is a parametric curve. The equations are parametric equations<br />
for the curve.<br />
The variable t is a parameter for the curve and its domain I is the parameter interval.<br />
If I is a closed interval, a t b, the point ( f (a), g(a)) is the initial point of the curve<br />
and the point ( f (b), g(b)) is the terminal point of the curve. When we give parametric<br />
equations and a parameter interval for a curve, we say that we have parametrized the<br />
curve. The equations and interval constitute a parametrization of the curve.<br />
In Example 1, the parameter interval is 0, , so (0, 0) is the initial point and there is<br />
no terminal point.<br />
A grapher can draw a parametrized curve only over a closed interval, so the portion it<br />
draws has endpoints even when the curve being graphed does not. Keep this in mind when<br />
you graph.
Section 1.4 Parametric Equations 31<br />
Circles<br />
In applications, t often denotes time, an angle, or the distance a particle has traveled along<br />
its path from its starting point. In fact, parametric graphing can be used to simulate the<br />
motion of the particle.<br />
EXPLORATION 1<br />
Parametrizing Circles<br />
Let x a cos t and y a sin t.<br />
1. Let a 1, 2, or 3 and graph the parametric equations in a square viewing window<br />
using the parameter interval [0, 2p]. How does changing a affect this<br />
graph?<br />
2. Let a 2 and graph the parametric equations using the following parameter intervals:<br />
[0, p2], [0, p], [0, 3p2], [2p, 4p], and [0, 4p]. Describe the role of<br />
the length of the parameter interval.<br />
3. Let a 3 and graph the parametric equations using the intervals [p2, 3p2],<br />
[p, 2p], [3p2, 3p], and [p, 5p]. What are the initial point and terminal point<br />
in each case?<br />
4. Graph x 2 cos (t) and y 2 sin (t) using the parameter intervals [0, 2p],<br />
[p, 3p], and [p2, 3p2]. In each case, describe how the graph is traced.<br />
For x a cos t and y a sin t, we have<br />
x 2 y 2 a 2 cos 2 t a 2 sin 2 t a 2 (cos 2 t sin 2 t) a 2 (1) a 2 ,<br />
using the identity cos 2 t sin 2 t 1. Thus, the curves in Exploration 1 were either circles<br />
or portions of circles, each with center at the origin.<br />
EXAMPLE 2 Graphing a Circle<br />
Describe the graph of the relation determined by<br />
x 2 cos t, y 2 sin t, 0 t 2p.<br />
x = 2 cos t,<br />
y = 2 sin t<br />
Find the initial and terminal points, if any, and indicate the direction in which the curve<br />
is traced. Find a Cartesian equation for a curve that contains the parametrized curve.<br />
SOLUTION<br />
Figure 1.29 shows that the graph appears to be a circle with radius 2. By watching the<br />
graph develop we can see that the curve is traced exactly once counterclockwise. The<br />
initial point at t 0 is (2, 0), and the terminal point at t 2p is also (2, 0).<br />
Next we eliminate the variable t.<br />
[–4.7, 4.7] by [–3.1, 3.1]<br />
Figure 1.29 A graph of the parametric<br />
curve x 2 cos t, y 2 sin t, with Tmin <br />
0, Tmax 2p, and Tstep p24 0.131.<br />
(Example 2)<br />
x 2 y 2 4 cos 2 t 4 sin 2 t<br />
4 (cos 2 t sin 2 t)<br />
4 Because cos 2 t sin 2 t 1<br />
The parametrized curve is a circle centered at the origin of radius 2.<br />
Now try Exercise 9.
32 <strong>Chapter</strong> 1 Prerequisites for Calculus<br />
Ellipses<br />
Parametrizations of ellipses are similar to parametrizations of circles. Recall that the standard<br />
form of an ellipse centered at (0, 0) is<br />
x<br />
2 a<br />
2 y 2 b<br />
2 1.<br />
x = 3 cos t, y = 4 sin t<br />
[–9, 9] by [–6, 6]<br />
Figure 1.30 A graph of the parametric<br />
equations x 3 cos t, y 4 sin t for<br />
0 t 2p. (Example 3)<br />
EXAMPLE 3<br />
Graphing an Ellipse<br />
Graph the parametric curve x 3 cos t, y 4 sin t, 0 t 2p.<br />
Find a Cartesian equation for a curve that contains the parametric curve. What portion<br />
of the graph of the Cartesian equation is traced by the parametric curve? Indicate the direction<br />
in which the curve is traced and the initial and terminal points, if any.<br />
SOLUTION<br />
Figure 1.30 suggests that the curve is an ellipse. The Cartesian equation is<br />
( x <br />
3 )2<br />
( y cos<br />
4 )2<br />
2 t sin 2 t 1,<br />
so the parametrized curve lies along an ellipse with major axis endpoints 0, 4<br />
and minor axis endpoints 3, 0. As t increases from 0 to 2p, the point (x, y) <br />
(3 cos t, 4 sin t) starts at (3, 0) and traces the entire ellipse once counterclockwise. Thus,<br />
(3, 0) is both the initial point and the terminal point. Now try Exercise 13.<br />
EXPLORATION 2<br />
Parametrizing Ellipses<br />
Let x a cos t and y b sin t.<br />
1. Let a 2 and b 3. Then graph using the parameter interval 0, 2p. Repeat,<br />
changing b to 4, 5, and 6.<br />
2. Let a 3 and b 4. Then graph using the parameter interval 0, 2p. Repeat,<br />
changing a to 5, 6, and 7.<br />
3. Based on parts 1 and 2, how do you identify the axis that contains the major axis<br />
of the ellipse? the minor axis?<br />
4. Let a 4 and b 3. Then graph using the parameter intervals [0, p2], [0, p],<br />
[0, 3p2], and [0, 4p]. Describe the role of the length of the parameter interval.<br />
5. Graph x 5 cos (t) and y 2 sin (t) using the parameter intervals (0, 2p],<br />
[p, 3p], and [p2, 3p2]. Describe how the graph is traced. What are the initial<br />
point and terminal point in each case?<br />
For x a cos t and y b sin t, we have (xa) 2 (yb) 2 cos 2 t sin 2 t 1. Thus,<br />
the curves in Exploration 2 were either ellipses or portions of ellipses, each with center at<br />
the origin.<br />
In the exercises you will see how to graph hyperbolas parametrically.<br />
Lines and Other Curves<br />
Lines, line segments, and many other curves can be defined parametrically.
Section 1.4 Parametric Equations 33<br />
x = 3t, y = 2 –2t<br />
EXAMPLE 4 Graphing a Line Segment<br />
Draw and identify the graph of the parametric curve determined by<br />
x 3t, y 2 2t, 0 t 1.<br />
SOLUTION<br />
The graph (Figure 1.31) appears to be a line segment with endpoints (0, 2) and (3, 0).<br />
T=0<br />
X=0 Y=2<br />
[–4, 4] by [–2, 4]<br />
Figure 1.31 The graph of the line segment<br />
x 3t, y 2 2t, 0 t 1, with<br />
trace on the initial point (0, 2). (Example 4)<br />
x = 2 cot t, y = 2 sin 2 t<br />
Confirm Algebraically When t 0, the equations give x 0 and y 2. When<br />
t 1, they give x 3 and y 0. When we substitute t x3 into the y equation, we obtain<br />
x<br />
y 2 2 <br />
3 2 x 2.<br />
3<br />
Thus, the parametric curve traces the segment of the line y (23)x 2 from the<br />
point (0, 2) to (3, 0). Now try Exercise 17.<br />
If we change the parameter interval [0, 1] in Example 4 to (, ), the parametrization<br />
will trace the entire line y (23)x 2.<br />
The bell-shaped curve in Exploration 3 is the famous witch of Agnesi. You will find<br />
more information about this curve in Exercise 47.<br />
[–5, 5] by [–2, 4]<br />
Figure 1.32 The witch of Agnesi<br />
(Exploration 3)<br />
Maria Agnesi (1718—1799)<br />
The first text to include<br />
differential and integral<br />
calculus along with analytic<br />
geometry, infinite<br />
series, and differential<br />
equations was written in<br />
the 1740s by the Italian<br />
mathematician Maria<br />
Gaetana Agnesi. Agnesi, a gifted scholar<br />
and linguist whose Latin essay defending<br />
higher education for women was published<br />
when she was only nine years old,<br />
was a well-published scientist by age 20,<br />
and an honorary faculty member of the<br />
University of Bologna by age 30.<br />
Today, Agnesi is remembered chiefly<br />
for a bell-shaped curve called the witch<br />
of Agnesi. This name, found only in<br />
English texts, is the result of a mistranslation.<br />
Agnesi’s own name for the curve<br />
was versiera or “turning curve.” John<br />
Colson, a noted Cambridge mathematician,<br />
probably confused versiera with<br />
avversiera, which means “wife of the<br />
devil” and translated it into “witch.”<br />
EXPLORATION 3<br />
Graphing the Witch of Agnesi<br />
The witch of Agnesi is the curve<br />
x 2 cot t, y 2 sin 2 t, 0 t p.<br />
1. Draw the curve using the window in Figure 1.32. What did you choose as a<br />
closed parameter interval for your grapher? In what direction is the curve traced?<br />
How far to the left and right of the origin do you think the curve extends?<br />
2. Graph the same parametric equations using the parameter intervals (p2, p2),<br />
(0, p2), and (p2, p). In each case, describe the curve you see and the direction<br />
in which it is traced by your grapher.<br />
3. What happens if you replace x 2 cot t by x 2 cot t in the original parametrization?<br />
What happens if you use x 2 cot (p t)?<br />
EXAMPLE 5<br />
Parametrizing a Line Segment<br />
Find a parametrization for the line segment with endpoints (2, 1) and (3, 5).<br />
SOLUTION<br />
Using (2, 1) we create the parametric equations<br />
x 2 at, y 1 bt.<br />
These represent a line, as we can see by solving each equation for t and equating to obtain<br />
x 2<br />
y 1<br />
.<br />
a b<br />
continued
34 <strong>Chapter</strong> 1 Prerequisites for Calculus<br />
This line goes through the point (2, 1) when t 0. We determine a and b so that the<br />
line goes through (3, 5) when t 1.<br />
3 2 a ⇒ a 5 x 3 when t 1.<br />
5 1 b ⇒ b 4 y 5 when t 1.<br />
Therefore,<br />
x 2 5t, y 1 4t, 0 t 1<br />
is a parametrization of the line segment with initial point (2, 1) and terminal point (3, 5).<br />
Now try Exercise 23.<br />
Quick Review 1.4<br />
(For help, go to Section 1.1 and Appendix A1.)<br />
In Exercises 1–3, write an equation for the line.<br />
1. the line through the points (1, 8) and (4, 3) y 5 3 x 2 9<br />
<br />
3<br />
2. the horizontal line through the point (3, 4) y 4<br />
3. the vertical line through the point (2, 3) x 2<br />
In Exercises 4–6, find the x- and y-intercepts of the graph of the<br />
x-intercepts: x 3 and x 3<br />
relation.<br />
4. x y-intercepts: y 4 and y <br />
2<br />
y2<br />
x2<br />
1 5. <br />
9 1 6<br />
1 6<br />
y 4<br />
2<br />
9 1<br />
x-intercepts: x 4 and x 4<br />
y-intercepts: None<br />
6. 2y 2 x-intercept: x 1<br />
x 1<br />
1 1<br />
y-intercepts: y and y <br />
2 2<br />
In Exercises 7 and 8, determine whether the given points lie on the<br />
graph of the relation.<br />
7. 2x 2 y y 2 3<br />
(a) (1, 1) Yes (b) (1, 1) No (c) (12, 2) Yes<br />
8. 9x 2 18x 4y 2 27<br />
(a) (1, 3) Yes (b) (1, 3) Yes (c) (1, 3) No<br />
9. Solve for t. t 2x 5<br />
<br />
3<br />
(a) 2x 3t 5 (b) 3y 2t 1 t 3y 1<br />
<br />
2<br />
10. For what values of a is each equation true?<br />
(a) a 2 a (b) a 2 a (c) 4a 2 2a<br />
a 0 All reals All reals<br />
Section 1.4 Exercises<br />
1. Graph (c). Window: [4, 4] by [3, 3], 0 t 2p 9. (b) x 2 y 2 1; upper half (or y 1 ; x 2 all) 11. (b) x 2 y 2 1; upper half (or y 1 ; x 2 all)<br />
In Exercises 1–4, match the parametric equations with their graph. In Exercises 5–22, a parametrization is given for a curve.<br />
State the approximate dimensions of the viewing window. Give a parameter<br />
interval that traces the curve exactly once.<br />
any? Indicate the direction in which the curve is traced.<br />
(a) Graph the curve. What are the initial and terminal points, if<br />
1. x 3 sin(2t), y 1.5 cos t<br />
(b) Find a Cartesian equation for a curve that contains the parametrized<br />
curve. What portion of the graph of the Cartesian<br />
2. x sin 3 t, y cos 3 Graph (a).<br />
t<br />
Window: [2, 2] by [2, 2], 0 t 2p<br />
3. x 7 sin t sin(7t), y 7 cos t cos(7t)<br />
equation is traced by the parametrized curve?<br />
4. x 12 sin t 3 sin(6t), y 12 cos t 3 cos(6t)<br />
5. x 3t, y 9t 2 , t (b) y x 2 ; all<br />
6. x t, y t, t 0 (b) y x 2 ; left half (or x y; all)<br />
(a)<br />
(c)<br />
3. Graph (d). Window: [10, 10] by [10, 10], 0 t 2p<br />
4. Graph (b). Window: [15, 15] by [15, 15], 0 t 2p<br />
(b)<br />
(d)<br />
7. x t, y t, t 0 (b) y x; all (or x y 2 ; upper half)<br />
8. x (sec 2 t) 1, y tan t, p2 t p2 (b) x y 2 ; all<br />
9. x cos t, y sin t, 0 t p<br />
10. x sin (2pt), y cos (2pt), 0 t 1 (b) x 2 y 2 1; all<br />
11. x cos (p t), y sin (p t), 0 t p<br />
x<br />
12. x 4 cos t, y 2 sin t, 0 t 2p (b) 4 <br />
2<br />
<br />
y<br />
2 <br />
2<br />
1; all<br />
13. x 4 sin t, y 2 cos t, 0 t p<br />
14. x 4 sin t, y 5 cos t, 0 t 2p<br />
15. x 2t 5, y 4t 7, t (b) y 2x 3; all<br />
x<br />
13. (b) 4 <br />
2<br />
<br />
y<br />
2 <br />
2<br />
1;<br />
right half (or x 24 ; y 2 all)<br />
x<br />
14. (b) 4 <br />
2<br />
<br />
y<br />
5 <br />
2<br />
1; all
Section 1.4 Parametric Equations 35<br />
16. x 1 t, y 1 t, t (b) y x 2; all<br />
17. x t, y 1 t, 0 t 1 (b) y x 1; (0, 1) to (1, 0)<br />
18. x 3 3t, y 2t, 0 t 1 (b) y 2 x 2; (3, 0) to (0, 2)<br />
3<br />
19. x 4 – t, y t, 0 t (b) y x 4; x 4<br />
20. x t 2 , y 4, t 2 0 t 2 (b) y 4; x x 0<br />
21. x sin t, y cos 2t, t (b) y 2x 2 1; 1 x 1<br />
22. x t 2 3, y t, t 0 (b) x y 2 3; lower half<br />
(or y x ; 3 all)<br />
In Exercises 23–28, find a parametrization for the curve.<br />
23. the line segment with endpoints (1, 3) and (4, 1) See page 36.<br />
24. the line segment with endpoints (1, 3) and (3, 2) See page 36.<br />
25. the lower half of the parabola x 1 y 2 See page 36.<br />
26. the left half of the parabola y x 2 2x See page 36.<br />
27. the ray (half line) with initial point (2, 3) that passes through the<br />
point (1, 1) Possible answer: x 2 3t, y 3 4t, t 0<br />
28. the ray (half line) with initial point (1, 2) that passes through<br />
the point (0, 0) Possible answer: x 1 t, y 2 2t, t 0<br />
Group Activity In Exercises 29–32, refer to the graph of<br />
x 3 t, y t 1, 5 t 5,<br />
shown in the figure. Find the values of t that produce the graph in the<br />
given quadrant.<br />
29. Quadrant I 1 t 3 30. Quadrant II 3 t 5<br />
31. Quadrant III 5 t 3 32. Quadrant IV 3 t 1<br />
Standardized Test Questions<br />
You may use a graphing calculator to solve the following<br />
problems.<br />
37. True or False The graph of the parametric curve x 3 cos t,<br />
y 4 sin t is a circle. Justify your answer. False. It is an ellipse.<br />
38. True or False The parametric curve x 2 cos (t),<br />
y 2 sin (t), 0 t 2p is traced clockwise. Justify your answer.<br />
True. Circle starting at (2, 0) and ending at (2, 0).<br />
In Exercises 39 and 40, use the parametric curve x 5t, y 3 3t,<br />
0 t 1.<br />
39. Multiple Choice Which of the following describes its graph?<br />
(A) circle (B) parabola (C) ellipse<br />
D<br />
(D) line segment (E) line<br />
40. Multiple Choice Which of the following is the initial point<br />
of the curve? C<br />
(A) (5, 6) (B) (0, 3) (C) (0, 3) (D) (5, 0)<br />
(E) (10, 3)<br />
41. Multiple Choice Which of the following describes the graph<br />
of the parametric curve x 3 sin t, y 3 cos t? A<br />
(A) circle (B) parabola (C) ellipse<br />
(D) hyperbola (E) line<br />
42. Multiple Choice Which of the following describes the graph<br />
of the parametric curve x 3t, y 2t, t 1? E<br />
(A) circle (B) parabola (C) line segment<br />
(D) line (E) ray<br />
In Exercises 33 and 34, find a parametrization for the part of the<br />
graph that lies in Quadrant I. Possible answer: x t, y t, 3 t 0<br />
33. y x 2 2x 2 34. y x<br />
3<br />
Possible answer: x t, y t 2 2t 2, t > 0<br />
35. Circles Find parametrizations to model the motion of a particle that<br />
starts at (a, 0) and traces the circle x 2 y 2 a 2 , a 0, as indicated.<br />
See page 36.<br />
(a) once clockwise (b) once counterclockwise<br />
(c) twice clockwise (d) twice counterclockwise<br />
36. Ellipses Find parametrizations to model the motion of a particle<br />
that starts at (a, 0) and traces the ellipse<br />
as indicated. See page 36.<br />
(a) once clockwise<br />
(c) twice clockwise<br />
[–6, 6] by [–8, 8]<br />
x<br />
a <br />
2<br />
<br />
y<br />
b <br />
2<br />
1, a 0, b 0,<br />
(b) once counterclockwise<br />
(d) twice counterclockwise<br />
Explorations<br />
43. Hyperbolas Let x a sec t and y b tan t.<br />
(a) Writing to Learn Let a 1, 2, or 3, b 1, 2, or 3, and<br />
graph using the parameter interval (p2, p2). Explain what you<br />
see, and describe the role of a and b in these parametric equations.<br />
(Caution: If you get what appear to be asymptotes, try using the approximation<br />
[1.57, 1.57] for the parameter interval.)<br />
(b) Let a 2, b 3, and graph in the parameter interval<br />
(p2, 3p2). Explain what you see.<br />
(c) Writing to Learn Let a 2, b 3, and graph using the<br />
parameter interval (p2, 3p2). Explain why you must be<br />
careful about graphing in this interval or any interval that contains<br />
p2.<br />
(d) Use algebra to explain why<br />
x <br />
a 2 y<br />
<br />
b 2 1.<br />
(e) Let x a tan t and y b sec t. Repeat (a), (b), and (d) using<br />
an appropriate version of (d).<br />
44. Transformations Let x (2 cos t) h and y (2 sin t) k.<br />
(a) Writing to Learn Let k 0 and h 2, 1, 1, and 2, in<br />
turn. Graph using the parameter interval [0, 2p]. Describe the<br />
role of h. h determines the x-coordinate of the center of the circle. It<br />
causes a horizontal shift of the graph.
36 <strong>Chapter</strong> 1 Prerequisites for Calculus<br />
(b) Writing to Learn Let h 0 and k 2, 1, 1, and 2, in<br />
turn. Graph using the parameter interval [0, 2p]. Describe the<br />
role of k. k determines the y-coordinate of the center of the circle. It<br />
causes a vertical shift of the graph.<br />
(c) Find a parametrization for the circle with radius 5 and center<br />
at (2, 3). x 5 cos t 2, y 5 sin t 3, 0 t 2p<br />
(d) Find a parametrization for the ellipse centered at (3, 4)<br />
with semimajor axis of length 5 parallel to the x-axis and semiminor<br />
axis of length 2 parallel to the y-axis.x 5 cos t 3,<br />
y 2 sin t 4, 0 t 2p<br />
In Exercises 45 and 46, a parametrization is given for a curve.<br />
(a) Graph the curve. What are the initial and terminal points, if<br />
any? Indicate the direction in which the curve is traced.<br />
(b) Find a Cartesian equation for a curve that contains the parametrized<br />
curve. What portion of the graph of the Cartesian<br />
equation is traced by the parametrized curve?<br />
45. x sec t, y tan t, p2 t p2<br />
(b) x 2 – y 2 1; left branch (or x y ; 2 1 all)<br />
46. x tan t, y 2 sec t, p2 t p2<br />
(b) 2<br />
y <br />
2<br />
x 2 1; lower branch (or y 2x 2 1<br />
Extending the Ideas<br />
; all)<br />
47. The Witch of Agnesi The bell-shaped witch of Agnesi can be<br />
constructed as follows. Start with the circle of radius 1, centered<br />
at the point (0, 1) as shown in the figure.<br />
23. Possible answer: x 1 5t, y 3 4t, 0 t 1<br />
24. Possible answer: x 1 4t, y 3 5t, 0 t 1<br />
25. Possible answer: x t 2 1, y t, t 0<br />
26. Possible answer: x t, y t 2 2t, t 1<br />
35. Possible answers:<br />
(a) x a cos t, y a sin t, 0 t 2p<br />
(b) x a cos t, y a sin t, 0 t 2p<br />
(c) x a cos t, y a sin t, 0 t 4p<br />
(d) x a cos t, y a sin t, 0 t 4p<br />
36. Possible answers:<br />
(a) x a cos t, y b sin t, 0 t 2p<br />
(b) x a cos t, y b sin t, 0 t 2<br />
(c) x a cos t, y b sin t, 0 t 4<br />
(d) x a cos t, y b sin t, 0 t 4p<br />
y = 2<br />
Q<br />
(0, 1)<br />
O<br />
Choose a point A on the line y 2, and connect it to the origin<br />
with a line segment. Call the point where the segment crosses the<br />
circle B. Let P be the point where the vertical line through A<br />
crosses the horizontal line through B. The witch is the curve<br />
traced by P as A moves along the line y 2.<br />
Find a parametrization for the witch by expressing the coordinates<br />
of P in terms of t, the radian measure of the angle that segment<br />
OA makes with the positive x-axis. The following equalities<br />
(which you may assume) will help:<br />
(i) x AQ (ii) y 2 AB sin t (iii) AB # AO (AQ) 2<br />
x 2 cot t, y 2 sin 2 t ,0 t p<br />
48. Parametrizing Lines and Segments<br />
(a) Show that x x 1 (x 2 x 1 )t, y y 1 (y 2 y 1 )t,<br />
t is a parametrization for the line through<br />
the points (x 1 , y 1 ) and (x 2 , y 2 ).<br />
(b) Find a parametrization for the line segment with endpoints<br />
(x 1 , y 1 ) and (x 2 , y 2 ).<br />
48. (a) If x 2 x 1 then the line is a vertical line and the first parametric equation<br />
gives x x 1 , while the second will give all real values for y since<br />
it cannot be the case that y 2 y 1 as well. Otherwise, solving the first<br />
equation for t gives<br />
x<br />
x<br />
t <br />
1<br />
<br />
x 2 x1<br />
Substituting that into the second equation for t gives<br />
y<br />
y y 1 y 1<br />
<br />
x2<br />
2 x1<br />
<br />
(x x 1 )<br />
which is the point-slope form of the equation for the line through<br />
(x 1 , y 1 ) and (x 2 , y 2 ). Note that the first equation will cause x to take on<br />
all real values, because x 2 – x 1 is not zero. Therefore, all of the points<br />
on the line will be traced out.<br />
(b) Use the equations for x and y given in part (a) with 0 t 1.<br />
y<br />
B<br />
t<br />
A<br />
P(x, y)<br />
x
Section 1.5 Functions and Logarithms 37<br />
1.5<br />
What you’ll learn about<br />
• One-to-One Functions<br />
• Inverses<br />
• Finding Inverses<br />
• Logarithmic Functions<br />
• Properties of Logarithms<br />
• Applications<br />
. . . and why<br />
Logarithmic functions are used in<br />
many applications, including finding<br />
time in investment problems.<br />
y = |x|<br />
Functions and Logarithms<br />
One-to-One Functions<br />
As you know, a function is a rule that assigns a single value in its range to each point in its<br />
domain. Some functions assign the same output to more than one input. For example,<br />
f (x) x 2 assigns the output 4 to both 2 and 2. Other functions never output a given<br />
value more than once. For example, the cubes of different numbers are always different.<br />
If each output value of a function is associated with exactly one input value, the function<br />
is one-to-one.<br />
DEFINITION<br />
One-to-One Function<br />
A function f (x) is one-to-one on a domain D if f a f b whenever a b.<br />
The graph of a one-to-one function y f (x) can intersect any horizontal line at most<br />
once (the horizontal line test). If it intersects such a line more than once it assumes the<br />
same y-value more than once, and is therefore not one-to-one (Figure 1.33).<br />
y<br />
y x 2<br />
y<br />
y x 3<br />
Same y-value<br />
1<br />
0<br />
x<br />
–1<br />
0<br />
1<br />
x<br />
y = √x<br />
[–5, 5] by [–2, 5]<br />
(a)<br />
One-to-one: Graph meets each<br />
horizontal line once.<br />
Not one-to-one: Graph meets some<br />
horizontal lines more than once.<br />
Figure 1.33 Using the horizontal line test, we see that y x 3 is one-to-one and y x 2 is not.<br />
EXAMPLE 1<br />
Using the Horizontal Line Test<br />
Determine whether the functions are one-to-one.<br />
(a) f (x) x<br />
(b) g(x) x<br />
[–5, 5] by [–2, 3]<br />
(b)<br />
Figure 1.34 (a) The graph of f (x) x<br />
and a horizontal line. (b) The graph of<br />
g(x) x and a horizontal line.<br />
(Example 1)<br />
SOLUTION<br />
(a) As Figure 1.34a suggests, each horizontal line y c, c 0, intersects the graph of<br />
f (x) x twice. So f is not one-to-one.<br />
(b) As Figure 1.34b suggests, each horizontal line intersects the graph of g(x) x<br />
either once or not at all. The function g is one-to-one.<br />
Now try Exercise 1.
38 <strong>Chapter</strong> 1 Prerequisites for Calculus<br />
Inverses<br />
Since each output of a one-to-one function comes from just one input, a one-to-one<br />
function can be reversed to send outputs back to the inputs from which they came. The<br />
function defined by reversing a one-to-one function f is the inverse of f. The functions<br />
in Tables 1.13 and 1.14 are inverses of one another. The symbol for the inverse of f is f 1 ,<br />
read “f inverse.” The 1 in f 1 is not an exponent; f 1 (x) does not mean 1f (x).<br />
Table 1.13 Rental Charge<br />
versus Time<br />
Time x Charge y<br />
(hours) (dollars)<br />
1 5.00<br />
2 7.50<br />
3 10.00<br />
4 12.50<br />
5 15.00<br />
6 17.50<br />
Table 1.14 Time versus<br />
Rental Charge<br />
Charge x Time y<br />
(dollars) (hours)<br />
5.00 1<br />
7.50 2<br />
10.00 3<br />
12.50 4<br />
15.00 5<br />
17.50 6<br />
As Tables 1.13 and 1.14 suggest, composing a function with its inverse in either order<br />
sends each output back to the input from which it came. In other words, the result of composing<br />
a function and its inverse in either order is the identity function, the function that<br />
assigns each number to itself. This gives a way to test whether two functions f and g are inverses<br />
of one another. Compute f g and g f. If ( f g)(x) (g f )(x) x, then f and g are<br />
inverses of one another; otherwise they are not. The functions ƒ(x) x 3 and g(x) x 13 are<br />
inverses of one another because (x 3 ) 13 x and (x 13 ) 3 x for every number x.<br />
EXPLORATION 1 Testing for Inverses Graphically<br />
For each of the function pairs below,<br />
(a) Graph f and g together in a square window.<br />
(b) Graph f g. (c) Graph g f.<br />
What can you conclude from the graphs?<br />
1. f (x) x 3 , g(x) x 13 2. f (x) x, g(x) 1x<br />
3. f (x) 3x, g(x) x3 4. f (x) e x , g(x) ln x<br />
Finding Inverses<br />
How do we find the graph of the inverse of a function? Suppose, for example, that the function<br />
is the one pictured in Figure 1.35a. To read the graph, we start at the point x on the<br />
x-axis, go up to the graph, and then move over to the y-axis to read the value of y. If we start<br />
with y and want to find the x from which it came, we reverse the process (Figure 1.35b).<br />
The graph of f is already the graph of f 1 , although the latter graph is not drawn in the<br />
usual way with the domain axis horizontal and the range axis vertical. For f 1 , the inputoutput<br />
pairs are reversed. To display the graph of f 1 in the usual way, we have to reverse<br />
the pairs by reflecting the graph across the 45º line y x (Figure 1.35c) and interchanging<br />
the letters x and y (Figure 1.35d). This puts the independent variable, now called x, on the<br />
horizontal axis and the dependent variable, now called y, on the vertical axis.
Section 1.5 Functions and Logarithms 39<br />
y<br />
RANGE OF f<br />
y<br />
0<br />
x<br />
y<br />
x<br />
DOMAIN OF f<br />
y f(x)<br />
(a) To find the value of f at x, we start at x,<br />
go up to the curve, and then over to the y-axis.<br />
x<br />
DOMAIN OF f –1<br />
y<br />
0<br />
y<br />
x<br />
RANGE OF f –1<br />
x f –1 (y)<br />
(b) The graph of f is also the graph of f –1 .<br />
To find the x that gave y, we start at y and go<br />
over to the curve and down to the x-axis. The<br />
domain of f –1 is the range of f. The range of<br />
f –1 is the domain of f.<br />
x<br />
RANGE OF f –1<br />
(a, b)<br />
y x<br />
x f –1 (y)<br />
(b, a)<br />
RANGE OF f –1<br />
y f –1 (x)<br />
0<br />
DOMAIN OF f –1<br />
y<br />
0<br />
DOMAIN OF f –1<br />
x<br />
(c) To draw the graph of f –1 in the<br />
usual way, we reflect the system<br />
across the line y = x.<br />
(d) Then we interchange the letters x and y.<br />
We now have a normal-looking graph of f –1<br />
as a function of x.<br />
Figure 1.35 The graph of y f 1 (x).<br />
The fact that the graphs of f and f 1 are reflections of each other across the line y x<br />
is to be expected because the input-output pairs (a, b) of f have been reversed to produce<br />
the input-output pairs (b, a) of f 1 .<br />
The pictures in Figure 1.35 tell us how to express f 1 as a function of x algebraically.<br />
Writing ƒ 1 as a Function of x<br />
1. Solve the equation y f (x) for x in terms of y.<br />
2. Interchange x and y. The resulting formula will be y f 1 (x).<br />
EXAMPLE 2<br />
Finding the Inverse Function<br />
Show that the function y f (x) 2x 4 is one-to-one and find its inverse function.<br />
SOLUTION<br />
Every horizontal line intersects the graph of f exactly once, so f is one-to-one and has<br />
an inverse.<br />
Step 1:<br />
Solve for x in terms of y: y 2x 4<br />
x 1 2 y 2<br />
continued
40 <strong>Chapter</strong> 1 Prerequisites for Calculus<br />
Step 2:<br />
Interchange x and y: y 1 2 x 2<br />
The inverse of the function f (x) 2x 4 is the function f 1 (x) (12)x 2. We<br />
can verify that both composites are the identity function.<br />
f 1 ( f (x)) 1 (2x 4) 2 x 2 2 x<br />
2<br />
Graphing y ƒ(x) and y ƒ 1 (x)<br />
Parametrically<br />
We can graph any function y ƒ (x) as<br />
x 1 t, y 1 ƒ (t).<br />
Interchanging t and ƒ (t) produces parametric<br />
equations for the inverse:<br />
x 2 ƒ (t), y 2 t.<br />
f ( f 1 (x)) 2 1 2 x 2 4 x 4 4 x<br />
Now try Exercise 13.<br />
We can use parametric graphing to graph the inverse of a function without finding an<br />
explicit rule for the inverse, as illustrated in Example 3.<br />
EXAMPLE 3<br />
Graphing the Inverse Parametrically<br />
(a) Graph the one-to-one function f (x) x 2 , x 0, together with its inverse and the<br />
line y x, x 0.<br />
(b) Express the inverse of f as a function of x.<br />
SOLUTION<br />
(a) We can graph the three functions parametrically as follows:<br />
Graph of f: x 1 t, y 1 t 2 , t 0<br />
Graph of f 1 : x 2 t 2 , y 2 t<br />
Graph of y x: x 3 t, y 3 t<br />
[–1.5, 3.5] by [–1, 2]<br />
Figure 1.36 The graphs of f and f 1 are<br />
reflections of each other across the line<br />
y x. (Example 3)<br />
Figure 1.36 shows the three graphs.<br />
(b) Next we find a formula for ƒ 1 (x).<br />
Step 1:<br />
Solve for x in terms of y.<br />
y x 2<br />
y x 2 <br />
Step 2:<br />
Interchange x and y.<br />
y x Because x 0.<br />
x y<br />
Thus, f 1 (x) x. Now try Exercise 27.<br />
Logarithmic Functions<br />
If a is any positive real number other than 1, the base a exponential function f (x) a x is<br />
one-to-one. It therefore has an inverse. Its inverse is called the base a logarithm function.<br />
DEFINITION<br />
Base a Logarithm Function<br />
The base a logarithm function y log a x is the inverse of the base a exponential<br />
function y a x (a 0, a 1).<br />
The domain of log a x is 0, , the range of a x . The range of log a x is , , the domain<br />
of a x .
Section 1.5 Functions and Logarithms 41<br />
Because we have no technique for solving for x in terms of y in the equation y a x ,we<br />
do not have an explicit formula for the logarithm function as a function of x. However, the<br />
graph of y log a x can be obtained by reflecting the graph of y a x across the line y x,<br />
or by using parametric graphing (Figure 1.37).<br />
Logarithms with base e and base 10 are so important in applications that calculators<br />
have special keys for them. They also have their own special notation and names:<br />
log e x ln x,<br />
[–6, 6] by [–4, 4]<br />
Figure 1.37 The graphs of y 2 x (x 1 t,<br />
y 1 2 t ), its inverse y log 2 x (x 2 2 t ,<br />
y 2 t), and y x (x 3 t, y 3 t).<br />
log 10 x log x.<br />
The function y ln x is called the natural logarithm function and y log x is often<br />
called the common logarithm function.<br />
Properties of Logarithms<br />
Because a x and log a x are inverses of each other, composing them in either order gives the<br />
identity function. This gives two useful properties.<br />
Inverse Properties for a x and log a x<br />
1. Base a: a log a x x, log a a x x, a 1, x 0<br />
2. Base e: e ln x x, ln e x x, x 0<br />
These properties help us with the solution of equations that contain logarithms and<br />
exponential functions.<br />
EXAMPLE 4<br />
Using the Inverse Properties<br />
Solve for x: (a) ln x 3t 5 (b) e 2x 10<br />
SOLUTION<br />
(a) ln x 3t 5<br />
e ln x e 3t5<br />
x e 3t5<br />
(b) e 2x 10<br />
ln e 2x ln 10<br />
2x ln 10<br />
Exponentiate both sides.<br />
Inverse Property<br />
Take logarithms of both sides.<br />
Inverse Property<br />
x 2<br />
l ln 10 1.15<br />
Now try Exercises 33 and 37.<br />
The logarithm function has the following useful arithmetic properties.<br />
Properties of Logarithms<br />
For any real numbers x 0 and y 0,<br />
1. Product Rule: log a xy log a x log a y<br />
2. Quotient Rule: log a x y log a x log a y<br />
3. Power Rule: log a x y y log a x
42 <strong>Chapter</strong> 1 Prerequisites for Calculus<br />
EXPLORATION 2<br />
Supporting the Product Rule<br />
Let y 1 ln (ax), y 2 ln x, and y 3 y 1 y 2 .<br />
1. Graph y 1 and y 2 for a 2, 3, 4, and 5. How do the graphs of y 1 and y 2 appear to<br />
be related?<br />
2. Support your finding by graphing y 3 .<br />
3. Confirm your finding algebraically.<br />
The following formula allows us to evaluate log a x for any base a 0, a 1, and to<br />
obtain its graph using the natural logarithm function on our grapher.<br />
Change of Base Formula<br />
ln<br />
x<br />
log a x <br />
l n a<br />
y = ln x<br />
ln 2<br />
EXAMPLE 5<br />
Graph ƒ(x) log 2 x.<br />
Graphing a Base a Logarithm Function<br />
SOLUTION<br />
We use the change of base formula to rewrite f (x).<br />
[–6, 6] by [–4, 4]<br />
Figure 1.38 The graph of f (x) log 2 x<br />
using f (x) (ln x)(ln 2). (Example 5)<br />
ln<br />
x<br />
f (x) log 2 x .<br />
l n 2<br />
Figure 1.38 gives the graph of f. Now try Exercise 41.<br />
Applications<br />
In Section 1.3 we used graphical methods to solve exponential growth and decay<br />
problems. Now we can use the properties of logarithms to solve the same problems<br />
algebraically.<br />
EXAMPLE 6<br />
Finding Time<br />
Sarah invests $1000 in an account that earns 5.25% interest compounded annually. How<br />
long will it take the account to reach $2500?<br />
SOLUTION<br />
Model The amount in the account at any time t in years is 1000(1.0525) t , so we need<br />
to solve the equation<br />
1000(1.0525) t 2500.<br />
continued
Section 1.5 Functions and Logarithms 43<br />
Table 1.15 Saudi Arabia’s<br />
Natural Gas Production<br />
Year Cubic Feet (trillions)<br />
1997 1.60<br />
1998 1.65<br />
1999 1.63<br />
2000 1.76<br />
2001 1.90<br />
Source: Statistical Abstract of the<br />
United States, 2004–2005.<br />
Solve Algebraically<br />
(1.0525) t 2.5 Divide by 1000.<br />
ln (1.0525) t ln 2.5<br />
t ln 1.0525 ln 2.5 Power Rule<br />
ln 2.<br />
5<br />
t 17.9<br />
ln 1. 0525<br />
Take logarithms of both sides.<br />
Interpret The amount in Sarah’s account will be $2500 in about 17.9 years, or about<br />
17 years and 11 months. Now try Exercise 47.<br />
f (x) = 0.3730 + (0.611) ln x<br />
X = 12<br />
[–5, 15] by [–1, 3]<br />
Y = 1.8915265<br />
Figure 1.39 The value of f at x 12 is<br />
about 1.89. (Example 7)<br />
1<br />
EXAMPLE 7<br />
Estimating Natural Gas Production<br />
Table 1.15 shows the annual number of cubic feet in trillions of natural gas produced by<br />
Saudi Arabia for several years.<br />
Find the natural logarithm regression equation for the data in Table 1.15 and use it to<br />
estimate the number of cubic feet of natural gas produced by Saudi Arabia in 2002.<br />
Compare with the actual amount of 2.00 trillion cubic feet in 2002.<br />
SOLUTION<br />
Model We let x 0 represent 1990, x 1 represent 1991, and so forth. We compute<br />
the natural logarithm regression equation to be<br />
f (x) 0.3730 (0.611) ln(x).<br />
Solve Graphically Figure 1.39 shows the graph of f superimposed on the scatter<br />
plot of the data. The year 2002 is represented by x 12. Reading from the graph we<br />
find f (12) 1.89 trillion cubic feet.<br />
Interpret The natural logarithmic model gives an underestimate of 0.11 trillion cubic<br />
feet of the 2002 natural gas production. Now try Exercise 49.<br />
Quick Review 1.5 (For help, go to Sections 1.2, 1.3, and 1.4.)<br />
In Exercises 1–4, let f (x) 3 x, 1 g(x) x 2 1, and evaluate the<br />
expression.<br />
1. ( f g)(1) 1<br />
2. (g f )(7) 5<br />
3. ( f g)(x) x 2/3<br />
4. (g f )(x) (x 1) 2/3 1<br />
In Exercises 5 and 6, choose parametric equations and a parameter<br />
interval to represent the function on the interval specified.<br />
1<br />
5. y , x 2 6. y x, x 3<br />
x 1<br />
Possible answer:<br />
Possible answer:<br />
1<br />
x t, y , t 2<br />
x t, y t, t 3<br />
t 1<br />
In Exercises 7–10, find the points of intersection of the two curves.<br />
Round your answers to 2 decimal places.<br />
7. y 2x 3, y 5 (4, 5)<br />
8. y 3x 5, y 3 8 3 , 3 (2.67, 3)<br />
9. (a) y 2 x , y 3 (1.58, 3)<br />
(b) y 2 x ,<br />
y 1 No intersection<br />
10. (a) y e x , y 4 (1.39, 4)<br />
(b) y e x ,<br />
y 1 No intersection
44 <strong>Chapter</strong> 1 Prerequisites for Calculus<br />
Section 1.5 Exercises<br />
35. x ln 3 5<br />
2<br />
0.96 or 0.96 36. x log 2 5 <br />
221<br />
2.26 or 2.26<br />
In Exercises 1–6, determine whether the function is one-to-one.<br />
1. y<br />
2.<br />
y<br />
No<br />
Yes<br />
3. y<br />
4.<br />
Yes<br />
No<br />
5. y<br />
6.<br />
Yes<br />
No<br />
y = –3x 3<br />
0<br />
y = 1 x<br />
y 2 x<br />
In Exercises 7–12, determine whether the function has an inverse<br />
function.<br />
3<br />
7. y 1 Yes 8. y x x 2<br />
2 5x No 9. y x 3 4x 6 No<br />
10. y x 3 x Yes 11. y ln x 2 No 12. y 2 3x Yes<br />
In Exercises 13–24, find f 1 and verify that<br />
x<br />
x<br />
x<br />
y = int x<br />
( f f 1 )(x) ( f 1 f )(x) x.<br />
y<br />
y<br />
y x + 1<br />
x<br />
1<br />
y =<br />
x 2 + 1<br />
x<br />
x<br />
In Exercises 33–36, solve the equation algebraically. Support your<br />
solution graphically.<br />
ln<br />
2<br />
33. (1.045) t t <br />
2 34. e 0.05t ln 3<br />
ln 1.045<br />
3 t 21.97<br />
0 .05<br />
35. e x e x 3 15.75 36. 2 x 2 x 5<br />
In Exercises 37 and 38, solve for y.<br />
37. ln y 2t 4 y e 2t4 38. ln (y 1) ln 2 x ln x<br />
y 2xe x 1<br />
In Exercises 39–42, draw the graph and determine the domain and<br />
range of the function.<br />
Domain: (, 3); Range: all reals Domain: (2, ); Range: all reals<br />
39. y 2 ln (3 x) 4 40. y 3 log (x 2) 1<br />
Domain: (1, ); Range: all reals Domain: (4, ); Range: all reals<br />
41. y log 2 (x 1) 42. y log 3 (x 4)<br />
In Exercises 43 and 44, find a formula for f 1 and verify that<br />
( f f 1 )(x) ( f 1 ƒ)(x) x.<br />
f 1 (x) log 1.1<br />
x<br />
<br />
50 x<br />
100<br />
50<br />
<br />
43. f (x) 1 2x<br />
44. f (x) <br />
1 1.1 x<br />
45. Self-inverse Prove that the function f is its own inverse.<br />
(a) f (x) 1 x 2 , x 0 (b) f (x) 1x<br />
46. Radioactive Decay The half-life of a certain radioactive substance<br />
is 12 hours. There are 8 grams present initially.<br />
(a) Express the amount of substance remaining as a function of<br />
time t. Amount 8 1 2 t/12<br />
(b) When will there be 1 gram remaining? After 36 hours<br />
47. Doubling Your Money Determine how much time is required<br />
for a $500 investment to double in value if interest is earned at<br />
the rate of 4.75% compounded annually. About 14.936 years.<br />
(If the interest is only paid annually, it will take 15 years.)<br />
48. Population Growth The population of Glenbrook is 375,000<br />
and is increasing at the rate of 2.25% per year. Predict when the<br />
population will be 1 million. After about 44.081 years<br />
In Exercises 49 and 50, let x 0 represent 1990, x 1 represent<br />
1991, and so forth.<br />
49. Natural Gas Production<br />
(a) Find a natural logarithm regression equation for the data in<br />
Table 1.16 and superimpose its graph on a scatter plot of the data.<br />
13. f (x) 2x 3 f 1 (x) x 3<br />
Table 1.16 Canada’s Natural Gas<br />
14. f (x) 5 4x f 1 (x) 5 x<br />
<br />
2<br />
4<br />
Production<br />
15. ƒ(x) x 3 1 16. f (x) x 2 1, x 0<br />
17. f (x) x 2 f<br />
, x 0 1 (x) x 1/2<br />
Year Cubic Feet (trillions)<br />
18. f (x) x 23 , x 0<br />
or x<br />
f 1 (x) x 3/2<br />
1997 5.76<br />
19. f (x) (x 2) 2 , x 2 f 1 (x) 2 (x) 1/2 or 2 x <br />
1998 5.98<br />
20. f (x) x 2 2x 1, x 1 f 1 (x) x 1/2 1 or x 1 21. f 1 1<br />
(x) x<br />
1/2 or <br />
<br />
1x 1999 6.26<br />
1<br />
21. f (x) x 2, x 0 22. f (x) x<br />
13 <br />
2000 6.47<br />
f 1 1 1<br />
(x) x<br />
1/3 or <br />
3<br />
x<br />
2001 6.60<br />
23. f (x) 2 x 1<br />
<br />
24. f (x) x <br />
<br />
3<br />
Source: Statistical Abstract of the United States,<br />
f<br />
x 3<br />
x 2<br />
1 (x) 2 x 3<br />
f 1 (x) 1 3x<br />
<br />
<br />
2004–2005.<br />
x 2<br />
x 1<br />
In Exercises 25–32, use parametric graphing to graph f, f 1 , and y x.<br />
(b) Estimate the number of cubic feet of natural gas produced by<br />
Canada in 2002. Compare with the actual amount of 6.63 trillion<br />
25. f (x) e x 26. f (x) 3 x 27. f (x) 2 x<br />
cubic feet in 2002. 6.79 trillion; the estimate exceeds the actual<br />
28. f (x) 3 x 29. f (x) ln x 30. f (x) log x<br />
amount by 0.16 trillion cubic feet<br />
(c) Predict when Canadian natural gas production will reach 7<br />
31. f (x) sin 1 x 32. f (x) tan 1 x<br />
trillion cubic feet. sometime during 2003<br />
15. f 1 (x) (x 1) 1/3 or 3 x 1 16. f 1 (x) (x 1) 1/2 or x 1<br />
43. f 1 (x) log 2<br />
x<br />
<br />
100 x
50. Natural Gas Production<br />
(a) Find a natural logarithm regression equation for the data in<br />
Table 1.17 and superimpose its graph on a scatter plot of the<br />
data.<br />
Table 1.17 China’s Natural Gas<br />
Production<br />
Year Cubic Feet (trillions)<br />
1997 0.75<br />
1998 0.78<br />
1999 0.85<br />
2000 0.96<br />
2001 1.07<br />
Source: Statistical Abstract of the United States,<br />
2004–2005.<br />
(b) Estimate the number of cubic feet of natural gas produced by<br />
China in 2002. Compare with the actual amount of 1.15 trillion<br />
cubic feet in 2002. 1.10 trillion; the estimate is an under estimate of the<br />
actual amount by 0.05 trillion cubic feet<br />
(c) Predict when China’s natural gas production will reach 1.5<br />
trillion cubic feet. sometime during 2011<br />
51. Group Activity Inverse Functions Let y f (x) mx b,<br />
m 0.<br />
(a) Writing to Learn Give a convincing argument that f is a<br />
one-to-one function.<br />
(b) Find a formula for the inverse of f. How are the slopes of f<br />
and f 1 related? f 1 (x) x b<br />
; the slopes are reciprocals<br />
m<br />
(c) If the graphs of two functions are parallel lines with a<br />
nonzero slope, what can you say about the graphs of the inverses<br />
of the functions? They are also parallel lines with nonzero slope.<br />
(d) If the graphs of two functions are perpendicular lines with a<br />
nonzero slope, what can you say about the graphs of the inverses<br />
of the functions? They are also perpendicular lines with nonzero slopes.<br />
Standardized Test Questions<br />
You should solve the following problems without using a<br />
graphing calculator.<br />
52. True or False The function displayed in the graph below is<br />
one-to-one. Justify your answer.<br />
False. It fails the horizontal<br />
line test. There are horizontal y<br />
lines that intersect the curve 3<br />
times. For example, the x-axis.<br />
x<br />
Section 1.5 Functions and Logarithms 45<br />
False. Consider f (x) x 2 , g(x) x. Notice that ( f ° g)(x) x but f is not<br />
one-to-one.<br />
53. True or False If ( f g)(x) x, then g is the inverse function<br />
of f. Justify your answer.<br />
In Exercises 54 and 55, use the function f (x) 3 ln (x 2).<br />
54. Multiple Choice Which of the following is the domain of ƒ?<br />
(A) x 2 (B) (, ) (C) (2, )<br />
C<br />
(D) [1.9, ) (E) (0, )<br />
55. Multiple Choice Which of the following is the range of ƒ? A<br />
(A) (, ) (B) (, 0) (C) (2, )<br />
(D) (0, ) (E) (0, 5.3)<br />
56. Multiple Choice Which of the following is the inverse of<br />
f (x) 3x 2? E<br />
1<br />
(A) g(x) (B) g(x) x (C) g(x) 3x 2<br />
3x 2<br />
(D) g(x) x 2<br />
(E) g(x) x 2<br />
<br />
3<br />
3<br />
57. Multiple Choice Which of the following is a solution of the<br />
equation 2 3 x 1? B<br />
(A) x 2 (B) x 1 (C) x 0<br />
(D) x 1<br />
Exploration<br />
(E) There are no solutions.<br />
58. Supporting the Quotient Rule Let y 1 ln (xa), y 2 <br />
ln x, y 3 y 2 y 1 , and y 4 e y 3 .<br />
y 2 is a vertical shift (upward) of y 1<br />
(a) Graph y 1 and y 2 for a 2, 3, 4, and 5. How are the graphs of<br />
y 1 and y 2 related?<br />
Each graph of y 3 is a horizontal line.<br />
(b) Graph y 3 for a 2, 3, 4, and 5. Describe the graphs.<br />
(c) Graph y 4 for a 2, 3, 4, and 5. Compare the graphs to the<br />
graph of y a. The graphs of y 4 and y a are the same.<br />
(d) Use e y 3 e<br />
y 2 y 1 a to solve for y1 . y 1 ln x – ln a<br />
59. If the graph of f (x) passes the horizontal line test, so will the graph of<br />
g(x) f (x) since it’s the same graph reflected about the x-axis.<br />
Extending the Ideas<br />
59. One-to-One Functions If ƒ is a one-to-one function, prove<br />
that g(x) f (x) is also one-to-one.<br />
60. One-to-One Functions If ƒ is a one-to-one function and f (x)<br />
is never zero, prove that g(x) 1f (x) is also one-to-one.<br />
61. Domain and Range Suppose that a 0, b 1, and b 0.<br />
Determine the domain and range of the function.<br />
(a) y a(b cx ) d (b) y a log b (x c) d<br />
62. Group Activity Inverse Functions<br />
Let f (x) a x b<br />
, c 0, ad bc 0.<br />
cx d<br />
(a) Writing to Learn Give a convincing argument that ƒ is<br />
one-to-one.<br />
(b) Find a formula for the inverse of f.<br />
(c) Find the horizontal and vertical asymptotes of f.<br />
(d) Find the horizontal and vertical asymptotes of f 1 . How are<br />
they related to those of f ?<br />
1<br />
, f (x 1 ) f (x 2 ), and x 1 x 2 since f is one-to-one.<br />
f ( x 2 )<br />
60. Suppose that g(x 1 ) g(x 2 ). Then f (<br />
1<br />
x 1 )
46 <strong>Chapter</strong> 1 Prerequisites for Calculus<br />
1.6<br />
What you’ll learn about<br />
•Radian Measure<br />
•Graphs of Trigonometric<br />
Functions<br />
•Periodicity<br />
•Even and Odd Trigonometric<br />
Functions<br />
•Transformations of<br />
Trigonometric Graphs<br />
•Inverse Trigonometric<br />
Functions<br />
. . . and why<br />
Trigonometric functions can be<br />
used to model periodic behavior<br />
and applications such as musical<br />
notes.<br />
O<br />
y<br />
Terminal ray<br />
r<br />
θ<br />
x<br />
P(x, y)<br />
y<br />
x<br />
Initial ray<br />
Figure 1.41 An angle u in standard<br />
position.<br />
C<br />
Unit<br />
Circle<br />
B<br />
of<br />
B'<br />
1<br />
θ<br />
circle<br />
A<br />
r<br />
radius<br />
Figure 1.40 The radian measure of angle<br />
ACB is the length u of arc AB on the unit<br />
circle centered at C. The value of u can be<br />
found from any other circle, however, as<br />
the ratio sr.<br />
r<br />
s<br />
A'<br />
Trigonometric Functions<br />
Radian Measure<br />
The radian measure of the angle ACB at the center of the unit circle (Figure 1.40) equals<br />
the length of the arc that ACB cuts from the unit circle.<br />
EXAMPLE 1<br />
Finding Arc Length<br />
Find the length of an arc subtended on a circle of radius 3 by a central angle of measure<br />
2p3.<br />
SOLUTION<br />
According to Figure 1.40, if s is the length of the arc, then<br />
s r u 3(2p3) 2p. Now try Exercise 1.<br />
When an angle of measure u is placed in standard position at the center of a circle of<br />
radius r (Figure 1.41), the six basic trigonometric functions of u are defined as follows:<br />
sine: sin u y r <br />
cosine: cos u x r <br />
tangent: tan u y x <br />
Graphs of Trigonometric Functions<br />
cosecant: csc u r <br />
y<br />
secant: sec u r <br />
x<br />
cotangent: cot u x y <br />
When we graph trigonometric functions in the coordinate plane, we usually denote the independent<br />
variable (radians) by x instead of u. Figure 1.42 on the next page shows sketches<br />
of the six trigonometric functions. It is a good exercise for you to compare these with what<br />
you see in a grapher viewing window. (Some graphers have a “trig viewing window.”)<br />
EXPLORATION 1<br />
Unwrapping Trigonometric Functions<br />
Set your grapher in radian mode, parametric mode, and simultaneous mode (all<br />
three). Enter the parametric equations<br />
x 1 cos t, y 1 sin t and x 2 t, y 2 sin t.<br />
1. Graph for 0 t 2p in the window [1.5, 2p] by [2.5, 2.5]. Describe the<br />
two curves. (You may wish to make the viewing window square.)<br />
2. Use trace to compare the y-values of the two curves.<br />
3. Repeat part 2 in the window [1.5, 4p] by [5, 5], using the parameter interval<br />
0 t 4p.<br />
4. Let y 2 cos t. Use trace to compare the x-values of curve 1 (the unit circle)<br />
with the y-values of curve 2 using the parameter intervals [0, 2p] and [0, 4p].<br />
5. Set y 2 tan t, csc t, sec t, and cot t. Graph each in the window [1.5, 2p] by<br />
[2.5, 2.5] using the interval 0 t 2p. How is a y-value of curve 2 related to<br />
the corresponding point on curve 1? (Use trace to explore the curves.)
Section 1.6 Trigonometric Functions 47<br />
Angle Convention: Use Radians<br />
From now on in this book it is assumed<br />
that all angles are measured in radians<br />
unless degrees or some other unit is<br />
stated explicitly. When we talk about<br />
the angle p3, we mean p3 radians<br />
(which is 60º), not p3 degrees. When<br />
you do calculus, keep your calculator in<br />
radian mode.<br />
y<br />
y cos x<br />
y sin x<br />
y tan x<br />
x<br />
x – —2 3 – – –2 0 –2 —2 3<br />
– –– 0 –2 —2 3 2 – – –2 0 –2 —2 3 2<br />
2<br />
Function: y<br />
Function: y sin x<br />
tan<br />
Function: y cos x<br />
Domain: x<br />
Domain: – x Domain: – x<br />
<br />
<br />
<br />
–2 , —2 3 , . . .<br />
Range: –1 ≤y ≤1<br />
Period: 2<br />
Range: –1 ≤y ≤1<br />
Period: 2<br />
Range: – y <br />
Period: <br />
(a) (b) (c)<br />
y<br />
y sec x<br />
y<br />
y<br />
y csc x<br />
y<br />
y<br />
y cot x<br />
x<br />
– 3 —2<br />
– –– 2<br />
1<br />
0 –2 —2 3<br />
x<br />
1<br />
– – –2 0 –2 —2 3 2<br />
x<br />
– – –2 0 –2 —2 3 2<br />
1<br />
x<br />
Domain: x –2 , —2 3 , . . .<br />
Domain: x 0, , 2, . . .<br />
Domain: x 0, , 2, . . .<br />
Range: y ≤ –1 and y 1<br />
Range: y ≤ –1 and y 1<br />
Range: – y <br />
Period: 2 Period: 2 Period: <br />
(d)<br />
(e)<br />
(f)<br />
≤<br />
Figure 1.42 Graphs of the (a) cosine, (b) sine, (c) tangent, (d) secant, (e) cosecant, and<br />
(f) cotangent functions using radian measure.<br />
≤<br />
Periods of Trigonometric<br />
Functions<br />
Period p: tan (x + p) = tan x<br />
cot (x + p) = cot x<br />
Period 2p: sin (x + 2p) = sin x<br />
cos (x + 2p) = cos x<br />
sec (x + 2p) = sec x<br />
csc (x + 2p) = csc x<br />
Periodicity<br />
When an angle of measure u and an angle of measure u 2p are in standard position,<br />
their terminal rays coincide. The two angles therefore have the same trigonometric function<br />
values:<br />
cos (u 2p) cos u sin (u 2p) sin u tan (u 2p) tan u<br />
(1)<br />
sec (u 2p) sec u csc (u 2p) csc u cot (u 2p) cot u<br />
Similarly, cos (u 2p) cos u, sin (u 2p) sin u, and so on.<br />
We see the values of the trigonometric functions repeat at regular intervals. We<br />
describe this behavior by saying that the six basic trigonometric functions are periodic.<br />
DEFINITION<br />
Periodic Function, Period<br />
A function f (x) is periodic if there is a positive number p such that f (x p) f (x)<br />
for every value of x. The smallest such value of p is the period of f.<br />
As we can see in Figure 1.42, the functions cos x, sin x, sec x, and csc x are periodic<br />
with period 2p. The functions tan x and cot x are periodic with period p.<br />
Even and Odd Trigonometric Functions<br />
The graphs in Figure 1.42 suggest that cos x and sec x are even functions because their graphs<br />
are symmetric about the y-axis. The other four basic trigonometric functions are odd.
48 <strong>Chapter</strong> 1 Prerequisites for Calculus<br />
y<br />
EXAMPLE 2<br />
Confirming Even and Odd<br />
Show that cosine is an even function and sine is odd.<br />
P(x, y)<br />
r<br />
<br />
SOLUTION<br />
From Figure 1.43 it follows that<br />
x<br />
cos (u) x cos u,<br />
r sin<br />
(u) y<br />
sin u,<br />
r<br />
P'(x, y)<br />
r<br />
<br />
so cosine is an even function and sine is odd. Now try Exercise 5.<br />
Figure 1.43 Angles of opposite sign.<br />
(Example 2)<br />
y<br />
EXAMPLE 3<br />
Finding Trigonometric Values<br />
Find all the trigonometric values of u if sin u 35 and tan u 0.<br />
SOLUTION<br />
The angle u is in the fourth quadrant, as shown in Figure 1.44, because its sine and tangent<br />
are negative. From this figure we can read that cos u 45, tan u 34, csc u 53,<br />
sec u 54, and cot u 43. Now try Exercise 9.<br />
θ<br />
(4, –3)<br />
Figure 1.44 The angle u in standard<br />
position. (Example 3)<br />
5<br />
4<br />
3<br />
x<br />
Transformations of Trigonometric Graphs<br />
The rules for shifting, stretching, shrinking, and reflecting the graph of a function apply<br />
to the trigonometric functions. The following diagram will remind you of the controlling<br />
parameters.<br />
Vertical stretch or shrink;<br />
reflection about x-axis<br />
Horizontal stretch or shrink;<br />
reflection about y-axis<br />
y afbx c d<br />
Horizontal shift<br />
Vertical shift<br />
The general sine function or sinusoid can be written in the form<br />
f x A sin<br />
[ 2 p x C<br />
B ] D,<br />
where A is the amplitude, B is the period, C is the horizontal shift, and D is the vertical<br />
shift.<br />
EXAMPLE 4<br />
Graphing a Trigonometric Function<br />
Determine the (a) period, (b) domain, (c) range, and (d) draw the graph of the function<br />
y 3 cos (2x p) 1.<br />
SOLUTION<br />
We can rewrite the function in the form<br />
y 3 cos<br />
2 x p 2 1.<br />
(a) The period is given by 2pB, where 2pB 2. The period is p.<br />
(b) The domain is (, ).<br />
(c) The graph is a basic cosine curve with amplitude 3 that has been shifted up<br />
1 unit. Thus, the range is [2, 4].<br />
continued
Section 1.6 Trigonometric Functions 49<br />
y = 3 cos (2x – p) + 1, y = cos x<br />
(d) The graph has been shifted to the right p2 units. The graph is shown in<br />
Figure 1.45 together with the graph of y cos x. Notice that four periods of<br />
y 3 cos (2x p) 1 are drawn in this window. Now try Exercise 13.<br />
Musical notes are pressure waves in the air. The wave behavior can be modeled with<br />
great accuracy by general sine curves. Devices called Calculator Based Laboratory (CBL)<br />
systems can record these waves with the aid of a microphone. The data in Table 1.18 give<br />
pressure displacement versus time in seconds of a musical note produced by a tuning fork<br />
and recorded with a CBL system.<br />
[–2p, 2p] by [–4, 6]<br />
Figure 1.45 The graph of<br />
y 3 cos(2x p) 1 (blue) and the<br />
graph of y cos x (red). (Example 4)<br />
Table 1.18<br />
Tuning Fork Data<br />
Time Pressure Time Pressure Time Pressure<br />
0.00091 0.080 0.00271 0.141 0.00453 0.749<br />
0.00108 0.200 0.00289 0.309 0.00471 0.581<br />
0.00125 0.480 0.00307 0.348 0.00489 0.346<br />
0.00144 0.693 0.00325 0.248 0.00507 0.077<br />
0.00162 0.816 0.00344 0.041 0.00525 0.164<br />
0.00180 0.844 0.00362 0.217 0.00543 0.320<br />
0.00198 0.771 0.00379 0.480 0.00562 0.354<br />
0.00216 0.603 0.00398 0.681 0.00579 0.248<br />
0.00234 0.368 0.00416 0.810 0.00598 0.035<br />
0.00253 0.099 0.00435 0.827<br />
y = 0.6 sin (2488.6x – 2.832) + 0.266<br />
[0, 0.0062] by [–0.5, 1]<br />
Figure 1.46 A sinusoidal regression<br />
model for the tuning fork data in Table 1.18.<br />
(Example 5)<br />
EXAMPLE 5 Finding the Frequency of a Musical Note<br />
Consider the tuning fork data in Table 1.18.<br />
(a) Find a sinusoidal regression equation (general sine curve) for the data and superimpose<br />
its graph on a scatter plot of the data.<br />
(b) The frequency of a musical note, or wave, is measured in cycles per second, or<br />
hertz (1 Hz 1 cycle per second). The frequency is the reciprocal of the period<br />
of the wave, which is measured in seconds per cycle. Estimate the frequency of<br />
the note produced by the tuning fork.<br />
SOLUTION<br />
(a) The sinusoidal regression equation produced by our calculator is approximately<br />
y 0.6 sin (2488.6x 2.832) 0.266.<br />
Figure 1.46 shows its graph together with a scatter plot of the tuning fork data.<br />
2p<br />
(b) The period is sec, so the frequency is 24 88.6<br />
396 Hz.<br />
24 88.6<br />
2p<br />
Interpretation The tuning fork is vibrating at a frequency of about 396 Hz. On the<br />
pure tone scale, this is the note G above middle C. It is a few cycles per second different<br />
from the frequency of the G we hear on a piano’s tempered scale, 392 Hz.<br />
Now try Exercise 23.<br />
Inverse Trigonometric Functions<br />
None of the six basic trigonometric functions graphed in Figure 1.42 is one-to-one. These<br />
functions do not have inverses. However, in each case the domain can be restricted to produce<br />
a new function that does have an inverse, as illustrated in Example 6.
50 <strong>Chapter</strong> 1 Prerequisites for Calculus<br />
x = t, y = sin t, –<br />
<br />
≤ t ≤<br />
2<br />
<br />
2<br />
EXAMPLE 6 Restricting the Domain of the Sine<br />
Show that the function y sin x, p2 x p2, is one-to-one, and graph its inverse.<br />
SOLUTION<br />
Figure 1.47a shows the graph of this restricted sine function using the parametric equations<br />
x 1 t, y 1 sin t, p 2 t p 2 .<br />
[–3, 3] by [–2, 2]<br />
(a)<br />
This restricted sine function is one-to-one because it does not repeat any output values.<br />
It therefore has an inverse, which we graph in Figure 1.47b by interchanging the ordered<br />
pairs using the parametric equations<br />
x 2 sin t, y 2 t, p 2 t p . Now try Exercise 25.<br />
2<br />
x = sin t, y = t, –<br />
<br />
≤ t ≤<br />
2<br />
<br />
2<br />
The inverse of the restricted sine function of Example 6 is called the inverse sine function.<br />
The inverse sine of x is the angle whose sine is x. It is denoted by sin 1 x or arcsin x.<br />
Either notation is read “arcsine of x” or “the inverse sine of x.”<br />
The domains of the other basic trigonometric functions can also be restricted to produce<br />
a function with an inverse. The domains and ranges of the resulting inverse functions<br />
become parts of their definitions.<br />
[–3, 3] by [–2, 2]<br />
(b)<br />
Figure 1.47 (a) A restricted sine<br />
function and (b) its inverse. (Example 6)<br />
DEFINITIONS Inverse Trigonometric Functions<br />
Function Domain Range<br />
y cos 1 x 1 x 1 0 y p<br />
y sin 1 x 1 x 1 p 2 y p 2 <br />
y tan 1 x ∞ x ∞ p 2 y p 2 <br />
y sec 1 x x 1 0 y p, y p 2 <br />
y csc 1 x x 1 p 2 y p 2 , y 0<br />
y cot 1 x ∞ x ∞ 0 y p<br />
The graphs of the six inverse trigonometric functions are shown in Figure 1.48.<br />
EXAMPLE 7<br />
Finding Angles in Degrees and Radians<br />
Find the measure of cos 1 (0.5) in degrees and radians.<br />
SOLUTION<br />
Put the calculator in degree mode and enter cos 1 (0.5). The calculator returns 120,<br />
which means 120 degrees. Now put the calculator in radian mode and enter cos 1 (0.5).<br />
The calculator returns 2.094395102, which is the measure of the angle in radians. You<br />
can check that 2p3 2.094395102. Now try Exercise 27.
Section 1.6 Trigonometric Functions 51<br />
Domain: –1 ≤ x ≤ 1<br />
Range: 0 ≤ y ≤ <br />
y<br />
Domain: –1 ≤ x ≤ 1<br />
Domain: – < x < <br />
Range: –<br />
–2<br />
<br />
≤ y ≤ –2 Range: –<br />
–2<br />
<br />
< y < –2<br />
y<br />
y<br />
–1<br />
1<br />
y sin –1 x<br />
x<br />
–2<br />
–2<br />
–2<br />
–2<br />
<br />
y cos –1 x<br />
–2<br />
–2<br />
–1<br />
y tan –1 x<br />
1 2<br />
x<br />
–1<br />
1<br />
x<br />
–<br />
–<br />
(a)<br />
(b)<br />
(c)<br />
Domain: x ≤ –1 or x ≥ 1<br />
Domain: x ≤ –1 or x ≥ 1<br />
Range: 0 ≤ y ≤ , y ≠<br />
–2 Range: –<br />
–2 ≤ y ≤<br />
–2 , y ≠ 0<br />
y<br />
y<br />
Domain: – < x < <br />
Range: 0 < y < <br />
y<br />
–2<br />
<br />
y sec –1 x<br />
–2<br />
–1<br />
1 2<br />
y csc –1 x<br />
x<br />
<br />
–2<br />
y cot –1 x<br />
–2<br />
–1<br />
1 2<br />
x<br />
–2<br />
–2<br />
–<br />
–2<br />
–1<br />
1 2<br />
x<br />
(d)<br />
(e)<br />
(f)<br />
Figure 1.48 Graphs of (a) y cos 1 x, (b) y sin 1 x, (c) y tan 1 x, (d) y sec 1 x, (e) y csc 1 x, and (f) y cot 1 x.<br />
EXAMPLE 8<br />
Solve for x.<br />
(a) sin x 0.7 in 0 x 2p<br />
Using the Inverse Trigonometric Functions<br />
(b) tan x 2 in x <br />
SOLUTION<br />
(a) Notice that x sin 1 (0.7) 0.775 is in the first quadrant, so 0.775 is one solution<br />
of this equation. The angle p x is in the second quadrant and has sine<br />
equal to 0.7. Thus two solutions in this interval are<br />
sin 1 (0.7) 0.775 and p sin 1 (0.7) 2.366.<br />
(b) The angle x tan 1 (2) 1.107 is in the fourth quadrant and is the only solution<br />
to this equation in the interval p2 x p2 where tan x is one-toone.<br />
Since tan x is periodic with period p, the solutions to this equation are of<br />
the form<br />
tan 1 (2) kp 1.107 kp<br />
where k is any integer. Now try Exercise 31.
52 <strong>Chapter</strong> 1 Prerequisites for Calculus<br />
2. 4 50<br />
p ° 143.24 5. x 0.6435, x 2.4981 6. x 1.9823, x 4.3009<br />
Quick Review 1.6 (For help, go to Sections 1.2 and 1.6.)<br />
In Exercises 1–4, convert from radians to degrees or degrees to radians.<br />
1. p3 60° 2. 2.5 3. 40º 2 p p<br />
<br />
9 4. 45º <br />
4 <br />
In Exercises 5–7, solve the equation graphically in the given interval.<br />
5. sin x 0.6, 0 x 2p 6. cos x 0.4, 0 x 2p<br />
7. tan x 1, p 2 x 3 p x 0.7854<br />
2 <br />
or p 4 , x 3.9270 or 5 4<br />
p <br />
8. Show that f (x) 2x 2 3 is an even function. Explain why its<br />
graph is symmetric about the y-axis.<br />
9. Show that f (x) x 3 3x is an odd function. Explain why its<br />
graph is symmetric about the origin.<br />
10. Give one way to restrict the domain of the function f (x) x 4 2<br />
to make the resulting function one-to-one.<br />
Section 1.6 Exercises<br />
In Exercises 1–4, the angle lies at the center of a circle and subtends<br />
an arc of the circle. Find the missing angle measure, circle radius, or<br />
arc length.<br />
Angle Radius Arc Length<br />
1. 5p8 2 ? 5 p <br />
4<br />
72<br />
2. 175º ? 10 3.274 7 p<br />
3. ? 14 7 1 radian or 28.65°<br />
2<br />
4. ? 6 3p2 p radian or 45°<br />
4<br />
In Exercises 5–8, determine if the function is even or odd.<br />
5. secant Even 6. tangent Odd<br />
7. cosecant Odd 8. cotangent Odd<br />
In Exercises 9 and 10, find all the trigonometric values of u with the<br />
given conditions.<br />
9. cos u 1 5<br />
sin 8/17, tan 8/15, csc 17/8,<br />
, sin u 0<br />
17<br />
sec 17/15, cot 15/8<br />
sin 2/2, cos 2/2, csc 2,<br />
10. tan u 1, sin u 0<br />
sec 2, cot 1<br />
In Exercises 11–14, determine (a) the period, (b) the domain,<br />
(c) the range, and (d) draw the graph of the function.<br />
11. y 3 csc (3x p) 2 12. y 2 sin (4x p) 3<br />
13. y 3 tan (3x p) 2<br />
14. y 2 sin <br />
2x p 3 <br />
In Exercises 15 and 16, choose an appropriate viewing window to<br />
display two complete periods of each trigonometric function in<br />
radian mode.<br />
15. (a) y sec x (b) y csc x (c) y cot x<br />
16. (a) y sin x (b) y cos x (c) y tan x<br />
In Exercises 17–22, specify (a) the period, (b) the amplitude, and<br />
(c) identify the viewing window that is shown.<br />
17. y 1.5 sin 2x 18. y 2 cos 3x<br />
(a) p (b) 1.5 (c) [2p, 2p] by [2, 2] (a) 2 p (b) 2 (c)<br />
3<br />
[ 2 2p , 3p<br />
3<br />
] by [4, 4]<br />
19. y 3 cos 2x 20. y 5 sin 2<br />
x <br />
(a) p (b) 3 (c) [2p, 2p] by [4, 4]<br />
21. y 4 sin p x 22. y cos px<br />
3<br />
(a) 4p (b) 5 (c) [4p, 4p] by [10, 10]<br />
(a) 6 (b) 4 (c) [3, 3] by [5, 5] (a) 2 (b) 1 (c) [4, 4] by [2, 2]<br />
23. Group Activity A musical note like that produced with a tuning<br />
fork or pitch meter is a pressure wave. Table 1.19 gives frequencies<br />
(in Hz) of musical notes on the tempered scale. The<br />
pressure versus time tuning fork data in Table 1.20 were collected<br />
using a CBL and a microphone.<br />
Table 1.19 Frequencies of Notes<br />
Note Frequency (Hz)<br />
C 262<br />
C z or D x 277<br />
D 294<br />
D z or E x 311<br />
E 330<br />
F 349<br />
F z or G x 370<br />
G 392<br />
G z or A x 415<br />
A 440<br />
A z or B x 466<br />
B 494<br />
C (next octave) 524<br />
Source: CBL System Experimental Workbook,<br />
Texas Instruments, Inc., 1994.
Section 1.6 Trigonometric Functions 53<br />
33. x p 6 and x 5 35. x 7 p 11p<br />
36. x 3 2kp and x 2kp, k any integer<br />
kp, k any integer<br />
6<br />
6<br />
6<br />
4p<br />
Table 1.20 Tuning Fork Data<br />
In Exercises 25–26, show that the function is one-to-one, and graph<br />
Time (s) Pressure Time (s) Pressure<br />
its inverse.<br />
0.0002368 1.29021 0.0049024 1.06632 25. y cos x, 0 x p 26. y tan x, p 2 x p 2 <br />
0.0005664 1.50851 0.0051520 0.09235<br />
In Exercises 27–30, give the measure of the angle in radians and degrees.<br />
Give exact answers whenever possible.<br />
0.0008256 1.51971 0.0054112 1.44694<br />
0.0010752 1.51411 0.0056608 1.51411<br />
0.0013344 1.47493 0.0059200 1.51971 27. sin 1 (0.5) p 6 radian or 30° 28. sin1 2<br />
p radian or –45°<br />
2 4<br />
0.0015840 0.45619 0.0061696 1.51411<br />
Exercise 43 to approximate the answers to the following questions<br />
about the temperatures in Fairbanks, Alaska, shown in the<br />
(a) Find the value of b assuming that the period is 12 months. b p 6 <br />
(b) How is the amplitude a related to the difference 80º 30º?<br />
figure in Exercise 43. Assume that the year has 365 days.<br />
It’s half of the difference, so a 25<br />
Highest: 62°F; lowest: 12°F<br />
(c) Use the information in (b) to find k. k 55<br />
(a) What are the highest and lowest mean daily temperatures?<br />
(d) Find h, and write an equation for y. h 5; y 25 sin [ p 6 (t 5) ] 55 (b) What is the average of the highest and lowest mean daily temperatures?<br />
0.0018432 0.89280 0.0064288 1.43015<br />
29. tan 1 (5) 30. cos 1 (0.7)<br />
0.0020928 1.51412 0.0066784 0.19871<br />
1.3734 radians or –78.6901° 0.7954 radian or 45.5730°<br />
0.0023520 1.15588 0.0069408 1.06072 In Exercises 31–36, solve the equation in the specified interval.<br />
0.0026016 0.04758 0.0071904 1.51412 31. tan x 2.5, 0 x 2p x 1.190 and x 4.332<br />
0.0028640 1.36858 0.0074496 0.97116<br />
32. cos x 0.7, 2p x 4p x 8.629 and x 10.220<br />
0.0031136 1.50851 0.0076992 0.23229<br />
33. csc x 2, 0 x 2p 34. sec x 3, p x p<br />
0.0033728 1.51971 0.0079584 1.46933<br />
35. sin x 0.5, x 36. cot x 1, x 0.0036224 1.51411 0.0082080 1.51411<br />
<br />
0.0038816 1.45813 0.0084672 1.51971<br />
In Exercises 37–40, use the given information to find the values of<br />
0.0041312 0.32185 0.0087168 1.50851<br />
the six trigonometric functions at the angle u. Give exact answers.<br />
0.0043904 0.97676 0.0089792 1.36298<br />
37. u sin 1 8 <br />
17 38. u tan 1 5<br />
0.0046400 1.51971<br />
12<br />
y 1.543 sin (2468.635x 0.494) 0.438<br />
(a) Find a sinusoidal regression equation for the data in Table<br />
1.20 and superimpose its graph on a scatter plot of the data.<br />
(b) Determine the frequency of and identify the musical note<br />
produced by the tuning fork. Frequency 392.9, so it must be a “G.”<br />
39. The point P(3, 4) is on the terminal side of u.<br />
40. The point P(2, 2) is on the terminal side of u.<br />
In Exercises 41 and 42, evaluate the expression.<br />
41. sin <br />
cos 1 7<br />
42. tan<br />
11<br />
9<br />
<br />
72<br />
9<br />
0.771 sin1 0.959<br />
11<br />
13<br />
88<br />
24. Temperature Data Table 1.21 gives the average monthly temperatures<br />
for St. Louis for a 12-month period starting with January.<br />
Model the monthly temperature with an equation of the form<br />
y a sin [b(t h)] k,<br />
43. Temperatures in Fairbanks, Alaska Find the (a) amplitude,<br />
(b) period, (c) horizontal shift, and (d) vertical shift of the model<br />
used in the figure below. (e) Then write the equation for the model.<br />
y in degrees Fahrenheit, t in months, as follows:<br />
60<br />
Table 1.21 Temperature Data for St. Louis<br />
Time (months) Temperature (ºF)<br />
40<br />
1 34<br />
20<br />
2 30<br />
3 39<br />
0<br />
4 44<br />
5 58<br />
20<br />
6 67<br />
7 78<br />
Normal mean air temperature for Fairbanks, Alaska, plotted as data<br />
8 80<br />
points (red). The approximating sine function ƒ(x) is drawn in blue.<br />
9 72<br />
Source: “Is the Curve of Temperature Variation a Sine Curve? ” by B. M. Lando<br />
10 63<br />
and C. A. Lando, The Mathematics Teacher, 7.6, Fig. 2, p. 535 (Sept . 1977).<br />
11 51<br />
12 40<br />
44. Temperatures in Fairbanks, Alaska Use the equation of<br />
(e) Superimpose a graph of y on a scatter plot of the data.<br />
Why is this average the vertical shift of the function?<br />
Average 25°F. This is because the average of the highest and lowest<br />
values of the (unshifted) sine function is 0.<br />
Temperature (°F)<br />
Jan<br />
Feb<br />
Mar<br />
Apr<br />
May<br />
Jun<br />
Jul<br />
Jan<br />
Aug<br />
Sep<br />
Oct<br />
Nov<br />
Dec<br />
Feb<br />
Mar
54 <strong>Chapter</strong> 1 Prerequisites for Calculus<br />
45. Even-Odd<br />
(a) Show that cot x is an odd function of x.<br />
(b) Show that the quotient of an even function and an odd<br />
function is an odd function.<br />
46. Even-Odd<br />
(a) Show that csc x is an odd function of x.<br />
(b) Show that the reciprocal of an odd function is odd.<br />
47. Even-Odd Show that the product of an even function and an<br />
odd function is an odd function.<br />
48. Finding the Period Give a convincing argument that the period<br />
of tan x is p.<br />
49. Sinusoidal Regression Table 1.22 gives the values of the<br />
function<br />
f (x) a sin (bx c) d<br />
accurate to two decimals.<br />
Table 1.22 Values of a Function<br />
x<br />
ƒ(x)<br />
1 3.42<br />
2 0.73<br />
3 0.12<br />
4 2.16<br />
5 4.97<br />
6 5.97<br />
y 3.0014 sin (0.9996x 2.0012) 2.9999<br />
(a) Find a sinusoidal regression equation for the data.<br />
(b) Rewrite the equation with a, b, c, and d rounded to the nearest<br />
integer. y 3 sin (x 2) 3<br />
Standardized Test Questions<br />
You may use a graphing calculator to solve the following<br />
problems.<br />
50. True or False The period of y sin(x2) is p. Justify your<br />
answer. False. It is 4p because 2p/B 1/2 implies the period B is 4p.<br />
51. True or False The amplitude of y 1 2 cos x is 1. Justify your<br />
answer. False. The amplitude is 1/2.<br />
In Exercises 52–54, f (x) 2 cos(4x p) 1.<br />
52. Multiple Choice Which of the following is the domain of ƒ?<br />
(A) [p, p] (B) [3, 1] (C) [1, 4] D<br />
(D) (, ) (E) x 0<br />
53. Multiple Choice Which of the following is the range of ƒ? B<br />
(A) (3, 1) (B) [3, 1] (C) (1, 4)<br />
(D) [1, 4] (E) (, )<br />
47. Assume that f is even and g is odd.<br />
Then f (x) g(x) f (x)[g(x)] f (x)g(x) so fg is odd.<br />
48. If (a, b) is the point on the unit circle corresponding to the angle , then<br />
(a, b) is the point on the unit circle corresponding to the angle<br />
( p) since it is exactly halfway around the circle. This means that both<br />
tan and tan ( p) have the same value, b a .<br />
54. Multiple Choice Which of the following is the period of f ? E<br />
(A) 4p (B) 3p (C) 2p (D) p (E) p2<br />
55. Multiple Choice Which of the following is the measure of<br />
tan 1 (3) in degrees? A<br />
(A) 60º (B) 30º (C) 30º (D) 60º (E) 120º<br />
Exploration<br />
56. Trigonometric Identities Let ƒ(x) sin x cos x.<br />
(a) Graph y ƒ(x). Describe the graph.<br />
(b) Use the graph to identify the amplitude, period, horizontal<br />
shift, and vertical shift.<br />
(c) Use the formula<br />
sin cos b cos a sin b sin (a b)<br />
for the sine of the sum of two angles to confirm your answers.<br />
Extending the Ideas<br />
57. Exploration Let y sin (ax) cos (ax).<br />
Use the symbolic manipulator of a computer algebra system<br />
(CAS) to help you with the following:<br />
(a) Express y as a sinusoid for a 2, 3, 4, and 5.<br />
(b) Conjecture another formula for y for a equal to any positive<br />
integer n.<br />
(c) Check your conjecture with a CAS.<br />
(d) Use the formula for the sine of the sum of two angles<br />
(see Exercise 56c) to confirm your conjecture.<br />
58. Exploration Let y a sin x b cos x.<br />
Use the symbolic manipulator of a computer algebra system<br />
(CAS) to help you with the following:<br />
(a) Express y as a sinusoid for the following pairs of values:<br />
a 2, b 1; a 1, b 2; a 5, b 2; a 2, b 5;<br />
a 3, b 4.<br />
(b) Conjecture another formula for y for any pair of positive<br />
integers. Try other values if necessary.<br />
(c) Check your conjecture with a CAS.<br />
(d) Use the following formulas for the sine or cosine of a sum or<br />
difference of two angles to confirm your conjecture.<br />
sin a cos b cos a sin b sin (a b)<br />
cos a cos b sin a sin b cos (a b)<br />
In Exercises 59 and 60, show that the function is periodic and find its<br />
period.<br />
59. y sin 3 x 60. y tan x<br />
In Exercises 61 and 62, graph one period of the function.<br />
61. f (x) sin (60x)<br />
62. f (x) cos (60px)<br />
59. Since sin (x) has period 2p, (sin (x 2p)) 3 (sin (x)) 3 . This function has<br />
period 2p. A graph shows that no smaller number works for the period.<br />
60. Since tan (x) has period p, tan (x p) tan (x). This function has<br />
period p. A graph shows that no smaller number works for the period.
<strong>Chapter</strong> 1 Key Terms 55<br />
Quick Quiz for AP* Preparation: Sections 1.4–1.6<br />
You should solve the following problems without using a<br />
graphing calculator.<br />
1. Multiple Choice Which of the following is the domain of<br />
f (x) log 2 (x 3)? C<br />
(A) (, ) (B) (, 3) (C) (3, )<br />
(D) [3, ) (E) (, 3]<br />
2. Multiple Choice Which of the following is the range of<br />
f (x) 5 cos(x p) 3? D<br />
(A) (, ) (B) [2, 4] (C) [8, 2]<br />
(D) [2, 8]<br />
(E)<br />
2 5 , 8 5 <br />
3. Multiple Choice Which of the following gives the solution of<br />
tan x 1 in p x 3 2p ? E<br />
(A) p 4 (B) p 4 (C) p 3 (D) 3 p 5p (E) <br />
4 4<br />
4. Free Response Let f (x) 5x 3.<br />
(a) Find the inverse g of f. g(x) x 3<br />
<br />
5<br />
(b) Compute f g(x). Show your work.<br />
(c) Compute g f (x). Show your work.<br />
(b) f ° g(x) f x 3<br />
5<br />
5 x 3<br />
5<br />
3 x 3 3 x<br />
(c) g ° f (x) g(5x – 3) (5x 3) 3<br />
5 x<br />
x<br />
5 5<br />
<strong>Chapter</strong> 1 Key Terms<br />
absolute value function (p. 17)<br />
base a logarithm function (p. 40)<br />
boundary of an interval (p. 13)<br />
boundary points (p. 13)<br />
change of base formula (p. 42)<br />
closed interval (p. 13)<br />
common logarithm function (p. 41)<br />
composing (p. 18)<br />
composite function (p. 17)<br />
compounded continuously (p. 25)<br />
cosecant function (p. 46)<br />
cosine function (p. 46)<br />
cotangent function (p. 46)<br />
dependent variable (p. 12)<br />
domain (p. 12)<br />
even function (p. 15)<br />
exponential decay (p. 24)<br />
exponential function base a (p. 22)<br />
exponential growth (p. 24)<br />
function (p. 12)<br />
general linear equation (p. 5)<br />
graph of a function (p. 13)<br />
graph of a relation (p. 30)<br />
grapher failure (p. 15)<br />
half-life (p. 24)<br />
half-open interval (p. 13)<br />
identity function (p. 38)<br />
increments (p. 3)<br />
independent variable (p. 12)<br />
initial point of parametrized curve (p. 30)<br />
interior of an interval (p. 13)<br />
interior points of an interval (p. 13)<br />
inverse cosecant function (p. 50)<br />
inverse cosine function (p. 50)<br />
inverse cotangent function (p. 50)<br />
inverse function (p. 38)<br />
inverse properties for a x and log a x (p. 41)<br />
inverse secant function (p. 50)<br />
inverse sine function (p. 50)<br />
inverse tangent function (p. 50)<br />
linear regression (p. 7)<br />
natural domain (p. 13)<br />
natural logarithm function (p. 41)<br />
odd function (p. 15)<br />
one-to-one function (p. 37)<br />
open interval (p. 13)<br />
parallel lines (p. 4)<br />
parameter (p. 30)<br />
parameter interval (p. 30)<br />
parametric curve (p. 30)<br />
parametric equations (p. 30)<br />
parametrization of a curve (p. 30)<br />
parametrize (p. 30)<br />
period of a function (p. 47)<br />
periodic function (p. 47)<br />
perpendicular lines (p. 4)<br />
piecewise defined function (p. 16)<br />
point-slope equation (p. 4)<br />
power rule for logarithms (p. 41)<br />
product rule for logarithms (p. 41)<br />
quotient rule for logarithms (p. 41)<br />
radian measure (p. 46)<br />
range (p. 12)<br />
regression analysis (p. 7)<br />
regression curve (p. 7)<br />
relation (p. 30)<br />
rise (p. 3)<br />
rules for exponents (p. 23)<br />
run (p. 3)<br />
scatter plot (p. 7)<br />
secant function (p. 46)<br />
sine function (p. 46)<br />
sinusoid (p. 48)<br />
sinusoidal regression (p. 49)<br />
slope (p. 4)<br />
slope-intercept equation (p. 5)<br />
symmetry about the origin (p. 15)<br />
symmetry about the y-axis (p. 15)<br />
tangent function (p. 46)<br />
terminal point of parametrized curve (p. 30)<br />
witch of Agnesi (p. 33)<br />
x-intercept (p. 5)<br />
y-intercept (p. 5)
56 <strong>Chapter</strong> 1 Prerequisites for Calculus<br />
<strong>Chapter</strong> 1 Review Exercises<br />
10. y 5 3 x 1 9<br />
<br />
3<br />
The collection of exercises marked in red could be used as a chapter In Exercises 39 and 40, write a piecewise formula for the function.<br />
12. with x-intercept 3 and y-intercept 5 y 5 3 x 5<br />
find the (b) domain and (c) range of each.<br />
13. the line y f (x), where ƒ has the following values: y 1 2 x 3 43. f (x) 2 x 2 , g(x) x 2<br />
44. f (x) x, g(x) 1 x<br />
<br />
x 2 2 4<br />
In Exercises 45–48, a parametrization is given for a curve.<br />
f x 4 2 1<br />
(a) Graph the curve. Identify the initial and terminal points, if<br />
test.<br />
In Exercises 1–14, write an equation for the specified line.<br />
39. y<br />
40. y<br />
1. through (1, 6) with slope 3 y 3x 9<br />
1<br />
5<br />
(2, 5)<br />
2. through (1, 2) with slope 12 y 1 2 x 3 2 <br />
3. the vertical line through (0, 3) x 0<br />
x<br />
0 1 2<br />
4. through (3, 6) and (1, 2) y 2x<br />
x<br />
5. the horizontal line through (0, 2) y 2<br />
f (x) { 1x, 0 x 1<br />
0 4<br />
6. through (3, 3) and (2, 5) y 2 2 x, 1 x 2<br />
5 x 2 1<br />
<br />
In Exercises 41 and 42, find<br />
5<br />
7. with slope 3 and y-intercept 3 y 3x 3<br />
(a) ( f g)(1) (b) (g f )(2) (c) ( f f )(x) (d) (g g)(x)<br />
8. through (3, 1) and parallel to 2x y 2 y 2x 5<br />
9. through (4, 12) and parallel to 4x 3y 12 y 4 3 x 2 0 41. f (x) 1<br />
<br />
x , g(x) 1<br />
(a) 1<br />
(c) x, x 0<br />
x 1<br />
(b) <br />
2 2.5 2 5 1<br />
(d) <br />
3<br />
1 x 2<br />
2<br />
10. through (2, 3) and perpendicular to 3x 5y 1<br />
42. f (x) 2 x, g(x) 3 x 1<br />
11. through (1, 2) and perpendicular to 1 2 x 1 3 y 1 y 2 3 x 8 3 (a) 2 (b) 1 (c) x (d) 3 3 x 1<br />
1<br />
In Exercises 43 and 44, (a) write a formula for ƒ g and g ƒ and<br />
any. Indicate the direction in which the curve is traced.<br />
14. through (4, 2) with x-intercept 3 y 2 7 x 6 7 <br />
(b) Find a Cartesian equation for a curve that contains the parametrized<br />
In Exercises 15–18, determine whether the graph of the function is<br />
symmetric about the y-axis, the origin, or neither.<br />
curve. What portion of the graph of the Cartesian<br />
equation is traced by the parametrized curve?<br />
15. y x 15 Origin 16. y x 25 y-axis<br />
45. x 5 cos t, y 2 sin t, 0 t 2p<br />
17. y x 2 2x 1 Neither 18. y e x 2 y-axis<br />
46. x 4 cos t, y 4 sin t, p2 t 3p2<br />
In Exercises 19–26, determine whether the function is even, odd, or<br />
neither.<br />
19. y x 2 1 Even 20. y x 5 x 3 x Odd<br />
21. y 1 cos x Even 22. y sec x tan x Odd<br />
4<br />
1<br />
23. y x<br />
x3<br />
Odd<br />
2x<br />
24. y 1 sin x Neither<br />
25. y x cos x Neither 26. y x 4 1 Even<br />
In Exercises 27–38, find the (a) domain and (b) range, and (c) graph<br />
the function.<br />
27. y x 2 28. y 2 1 x<br />
29. y 16 x 2 30. y 3 2x 1<br />
31. y 2e x 3 32. y tan (2x p)<br />
33. y 2 sin (3x p) 1 34. y x 25<br />
35. y ln (x 3) 1 36. y 1 3 2 x<br />
x, 4 x 0<br />
37. y { x, 0 x 4<br />
x 2, 2 x 1<br />
38. y x, 1 x 1<br />
{<br />
x 2, 1 x 2<br />
47. x 2 t, y 11 2t, 2 t 4<br />
48. x 1 t, y 4 2t, t 2<br />
In Exercises 49–52, give a parametrization for the curve.<br />
49. the line segment with endpoints (2, 5) and (4, 3)<br />
Possible answer: x 2 6t, y 5 2t, 0 t 1<br />
50. the line through (3, 2) and (4, 1)<br />
Possible answer: x 3 7t, y 2 t, t <br />
51. the ray with initial point (2, 5) that passes through (1, 0)<br />
Possible answer: x 2 3t, y 5 5t, 0 t<br />
52. y x (x 4), x 2<br />
Possible answer: x t, y t(t 4), t 2<br />
Group Activity In Exercises 53 and 54, do the following.<br />
(a) Find f 1 and show that ( f f 1 )(x) ( f 1 f )(x) x.<br />
(b) Graph ƒ and ƒ 1 in the same viewing window.<br />
53. f (x) 2 3x 54. f (x) (x 2) 2 , x 2<br />
In Exercises 55 and 56, find the measure of the angle in radians and<br />
degrees.<br />
0.6435 radians or 36.8699°<br />
55. sin 1 (0.6)<br />
1.1607 radians or 66.5014°<br />
56. tan 1 (2.3)<br />
57. Find the six trigonometric values of u cos 1 (37). Give exact<br />
answers.<br />
58. Solve the equation sin x 0.2 in the following intervals.<br />
(a) 0 x 2p (b) x <br />
59. Solve for x: e 0.2x 4 x 5 ln 4<br />
58. (a) x 3.3430 and x 6.0818<br />
(b) x 3.3430 2kp and x 6.0818 2kp, k any integer
<strong>Chapter</strong> 1 Review Exercises 57<br />
60. The graph of ƒ is shown. Draw<br />
the graph of each function.<br />
(a) y f (x)<br />
(b) y f (x)<br />
(c) y 2f (x 1) 1<br />
(d) y 3f (x 2) 2<br />
61. A portion of the graph of a function<br />
defined on [3, 3] is shown.<br />
Complete the graph assuming that<br />
the function is<br />
(a) even.<br />
(b) odd.<br />
62. Depreciation Smith Hauling purchased an 18-wheel truck for<br />
$100,000. The truck depreciates at the constant rate of $10,000<br />
per year for 10 years.<br />
V 100,000 10,000x, 0 x 10<br />
(a) Write an expression that gives the value y after x years.<br />
(b) When is the value of the truck $55,000? After 4.5 years<br />
63. Drug Absorption A drug is administered intravenously for<br />
pain. The function<br />
f (t) 90 52 ln (1 t), 0 t 4<br />
gives the number of units of the drug in the body after t hours.<br />
(a) What was the initial number of units of the drug administered?<br />
90 units<br />
(b) How much is present after 2 hours? (c) Draw the graph of f.<br />
90 52 ln 3 32.8722 units<br />
64. Finding Time If Joenita invests $1500 in a retirement account<br />
that earns 8% compounded annually, how long will it take this<br />
single payment to grow to $5000?<br />
65. Guppy Population The number of guppies in Susan’s<br />
aquarium doubles every day. There are four guppies initially.<br />
(a) Write the number of guppies as a function of time t. N 4 2 t<br />
(b) How many guppies were present after 4 days? after 1 week?<br />
4 days: 64; one week: 512<br />
(c) When will there be 2000 guppies? After ln 500<br />
8.9658 days,<br />
or after nearly 9 days.<br />
ln 2<br />
(d) Writing to Learn Give reasons why this might not be a<br />
good model for the growth of Susan’s guppy population.<br />
66. Doctoral Degrees Table 1.23 shows the number of doctoral<br />
degrees earned by Hispanic students for several years. Let x 0<br />
represent 1980, x 1 represent 1981, and so forth.<br />
Table 1.23 Doctorates Earned by Hispanic<br />
Americans<br />
Year<br />
Number of Degrees<br />
1981 456<br />
1985 677<br />
1990 780<br />
1995 984<br />
2000 1305<br />
Source: Statistical Abstract of the United States, 2004–2005.<br />
2<br />
1<br />
–1<br />
–1<br />
y<br />
1<br />
(1, –1)<br />
65. (d) Because it suggests the number of guppies will continue to double indefinitely and become arbitrarily<br />
large, which is impossible due to the finite size of the tank and the oxygen supply in the water.<br />
y<br />
1<br />
2<br />
(3, 2)<br />
3<br />
x<br />
x<br />
(a) Find a linear regression equation for the data and superimpose<br />
its graph on a scatter plot of the data. y 41.770x 414.342<br />
(b) Use the regression equation to predict the number of doctoral<br />
degrees that will be earned by Hispanic Americans in 2002. How<br />
close is the estimate to the actual number in 2002 of 1432?<br />
1333; the prediction is less than the actual number by 99<br />
(c) Writing to Learn Find the slope of the regression line.<br />
What does the slope represent?<br />
67. Population of New York Table 1.24 shows the population of<br />
New York State for several years. Let x 0 represent 1980, x 1<br />
represent 1981, and so forth.<br />
Table 1.24 Population of New York State<br />
Year Population (thousands)<br />
1980 17,558<br />
1990 17,991<br />
1995 18,524<br />
1998 18,756<br />
1999 18,883<br />
2000 18,977<br />
Source: Statistical Abstract of the United States, 2004–2005.<br />
y (17467.361) (1.00398) x<br />
(a) Find the exponential regression equation for the data and<br />
superimpose its graph on a scatter plot of the data.<br />
(b) Use the regression equation to predict the population in 2003.<br />
How close is the estimate to the actual number in 2003 of 19,190<br />
thousand? 19,138,000; the prediction is less than the actual number by<br />
about 52,000<br />
(c) Use the exponential regression equation to estimate the annual<br />
rate of growth of the population of New York State.<br />
0.00398 or 0.4%<br />
AP* Examination Preparation<br />
You may use a graphing calculator to solve the following<br />
problems.<br />
68. Consider the point P(2, 1) and the line L: x y 2.<br />
(a) Find the slope of L. m 1<br />
y x 1<br />
(b) Write an equation for the line through P and parallel to L.<br />
(c) Write an equation for the line through P and perpendicular to L.<br />
y x 3<br />
(d) What is the x-intercept of L? 2<br />
69. Let f (x) 1 ln(x 2).<br />
(2, ) (, )<br />
(a) What is the domain of f? (b) What is the range of f ?<br />
(c) What are the x-intercepts of the graph of ƒ? x 2 e 4.718<br />
(d) Find f 1 . (e) Confirm your answer algebraically in part (d).<br />
70. Let f (x) 1 3 cos(2x).<br />
(, )<br />
[2, 4]<br />
(a) What is the domain of f ? (b) What is the range of f ?<br />
(c) What is the period of f ? p<br />
(d) Is f an even function, odd function, or neither? even<br />
(e) Find all the zeros of f in p 2 x p. x 2.526<br />
69. (d) f 1 (x) 2 e 1x


