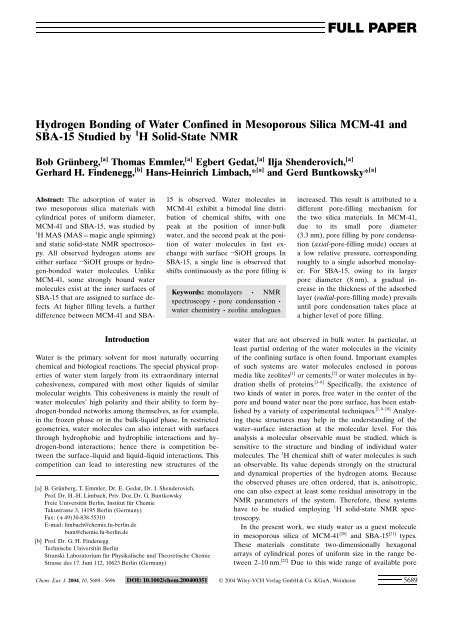
Hydrogen Bonding of Water Confined in Mesoporous Silica MCM-41 ...
Hydrogen Bonding of Water Confined in Mesoporous Silica MCM-41 ...
Hydrogen Bonding of Water Confined in Mesoporous Silica MCM-41 ...

Create successful ePaper yourself
Turn your PDF publications into a flip-book with our unique Google optimized e-Paper software.
<strong>Hydrogen</strong> <strong>Bond<strong>in</strong>g</strong> <strong>of</strong> <strong>Water</strong> <strong>Conf<strong>in</strong>ed</strong> <strong>in</strong> <strong>Mesoporous</strong> <strong>Silica</strong> <strong>MCM</strong>-<strong>41</strong> and<br />
SBA-15 Studied by 1 H Solid-State NMR<br />
Bob Grünberg, [a] Thomas Emmler, [a] Egbert Gedat, [a] Ilja Shenderovich, [a]<br />
Gerhard H. F<strong>in</strong>denegg, [b] Hans-He<strong>in</strong>rich Limbach,* [a] and Gerd Buntkowsky* [a]<br />
Abstract: The adsorption <strong>of</strong> water <strong>in</strong><br />
two mesoporous silica materials with<br />
cyl<strong>in</strong>drical pores <strong>of</strong> uniform diameter,<br />
<strong>MCM</strong>-<strong>41</strong> and SBA-15, was studied by<br />
1 H MAS (MAS = magic angle sp<strong>in</strong>n<strong>in</strong>g)<br />
and static solid-state NMR spectroscopy.<br />
All observed hydrogen atoms are<br />
either surface SiOH groups or hydrogen-bonded<br />
water molecules. Unlike<br />
<strong>MCM</strong>-<strong>41</strong>, some strongly bound water<br />
molecules exist at the <strong>in</strong>ner surfaces <strong>of</strong><br />
SBA-15 that are assigned to surface defects.<br />
At higher fill<strong>in</strong>g levels, a further<br />
difference between <strong>MCM</strong>-<strong>41</strong> and SBA-<br />
Introduction<br />
<strong>Water</strong> is the primary solvent for most naturally occurr<strong>in</strong>g<br />
chemical and biological reactions. The special physical properties<br />
<strong>of</strong> water stem largely from its extraord<strong>in</strong>ary <strong>in</strong>ternal<br />
cohesiveness, compared with most other liquids <strong>of</strong> similar<br />
molecular weights. This cohesiveness is ma<strong>in</strong>ly the result <strong>of</strong><br />
water molecules high polarity and their ability to form hydrogen-bonded<br />
networks among themselves, as for example,<br />
<strong>in</strong> the frozen phase or <strong>in</strong> the bulk-liquid phase. In restricted<br />
geometries, water molecules can also <strong>in</strong>teract with surfaces<br />
through hydrophobic and hydrophilic <strong>in</strong>teractions and hydrogen-bond<br />
<strong>in</strong>teractions; hence there is competition between<br />
the surface–liquid and liquid–liquid <strong>in</strong>teractions. This<br />
competition can lead to <strong>in</strong>terest<strong>in</strong>g new structures <strong>of</strong> the<br />
[a] B. Grünberg, T. Emmler, Dr. E. Gedat, Dr. I. Shenderovich,<br />
Pr<strong>of</strong>. Dr. H.-H. Limbach, Priv. Doz. Dr. G. Buntkowsky<br />
Freie Universität Berl<strong>in</strong>, Institut für Chemie<br />
Takustrasse 3, 1<strong>41</strong>95 Berl<strong>in</strong> (Germany)<br />
Fax: (+ 49) 30-838-55310<br />
E-mail: limbach@chemie.fu-berl<strong>in</strong>.de<br />
bunt@chemie.fu-berl<strong>in</strong>.de<br />
[b] Pr<strong>of</strong>. Dr. G. H. F<strong>in</strong>denegg<br />
Technische Universität Berl<strong>in</strong><br />
Stranski Laboratorium für Physikalische und Theoretische Chemie<br />
Strasse des 17. Juni 112, 10623 Berl<strong>in</strong> (Germany)<br />
15 is observed. <strong>Water</strong> molecules <strong>in</strong><br />
<strong>MCM</strong>-<strong>41</strong> exhibit a bimodal l<strong>in</strong>e distribution<br />
<strong>of</strong> chemical shifts, with one<br />
peak at the position <strong>of</strong> <strong>in</strong>ner-bulk<br />
water, and the second peak at the position<br />
<strong>of</strong> water molecules <strong>in</strong> fast exchange<br />
with surface SiOH groups. In<br />
SBA-15, a s<strong>in</strong>gle l<strong>in</strong>e is observed that<br />
shifts cont<strong>in</strong>uously as the pore fill<strong>in</strong>g is<br />
Keywords: monolayers · NMR<br />
spectroscopy · pore condensation ·<br />
water chemistry · zeolite analogues<br />
FULL PAPER<br />
<strong>in</strong>creased. This result is attributed to a<br />
different pore-fill<strong>in</strong>g mechanism for<br />
the two silica materials. In <strong>MCM</strong>-<strong>41</strong>,<br />
due to its small pore diameter<br />
(3.3 nm), pore fill<strong>in</strong>g by pore condensation<br />
(axial-pore-fill<strong>in</strong>g mode) occurs at<br />
a low relative pressure, correspond<strong>in</strong>g<br />
roughly to a s<strong>in</strong>gle adsorbed monolayer.<br />
For SBA-15, ow<strong>in</strong>g to its larger<br />
pore diameter (8 nm), a gradual <strong>in</strong>crease<br />
<strong>in</strong> the thickness <strong>of</strong> the adsorbed<br />
layer (radial-pore-fill<strong>in</strong>g mode) prevails<br />
until pore condensation takes place at<br />
a higher level <strong>of</strong> pore fill<strong>in</strong>g.<br />
water that are not observed <strong>in</strong> bulk water. In particular, at<br />
least partial order<strong>in</strong>g <strong>of</strong> the water molecules <strong>in</strong> the vic<strong>in</strong>ity<br />
<strong>of</strong> the conf<strong>in</strong><strong>in</strong>g surface is <strong>of</strong>ten found. Important examples<br />
<strong>of</strong> such systems are water molecules enclosed <strong>in</strong> porous<br />
media like zeolites [1] or cements, [2] or water molecules <strong>in</strong> hydration<br />
shells <strong>of</strong> prote<strong>in</strong>s. [3–8] Specifically, the existence <strong>of</strong><br />
two k<strong>in</strong>ds <strong>of</strong> water <strong>in</strong> pores, free water <strong>in</strong> the center <strong>of</strong> the<br />
pore and bound water near the pore surface, has been established<br />
by a variety <strong>of</strong> experimental techniques. [1,9–19] Analyz<strong>in</strong>g<br />
these structures may help <strong>in</strong> the understand<strong>in</strong>g <strong>of</strong> the<br />
water–surface <strong>in</strong>teraction at the molecular level. For this<br />
analysis a molecular observable must be studied, which is<br />
sensitive to the structure and b<strong>in</strong>d<strong>in</strong>g <strong>of</strong> <strong>in</strong>dividual water<br />
molecules. The 1 H chemical shift <strong>of</strong> water molecules is such<br />
an observable. Its value depends strongly on the structural<br />
and dynamical properties <strong>of</strong> the hydrogen atoms. Because<br />
the observed phases are <strong>of</strong>ten ordered, that is, anisotropic,<br />
one can also expect at least some residual anisotropy <strong>in</strong> the<br />
NMR parameters <strong>of</strong> the system. Therefore, these systems<br />
have to be studied employ<strong>in</strong>g 1 H solid-state NMR spectroscopy.<br />
In the present work, we study water as a guest molecule<br />
<strong>in</strong> mesoporous silica <strong>of</strong> <strong>MCM</strong>-<strong>41</strong> [20] and SBA-15 [21] types.<br />
These materials constitute two-dimensionally hexagonal<br />
arrays <strong>of</strong> cyl<strong>in</strong>drical pores <strong>of</strong> uniform size <strong>in</strong> the range between<br />
2–10 nm. [22] Due to this wide range <strong>of</strong> available pore<br />
Chem. Eur. J. 2004, 10, 5689 – 5696 DOI: 10.1002/chem.200400351 2004 Wiley-VCH Verlag GmbH & Co. KGaA, We<strong>in</strong>heim 5689
FULL PAPER<br />
sizes, they are very versatile molecular sieves. Whereas<br />
<strong>MCM</strong>-<strong>41</strong> silicas have pore sizes <strong>in</strong> the range <strong>of</strong> 2–6 nm and<br />
smooth pore surfaces, SBA-15 silicas can be typically prepared<br />
<strong>in</strong> the range <strong>of</strong> 5–10 nm and exhibit considerable surface<br />
roughness, which is attributed to (SiO 2) n islands on the<br />
surface. [23] Ow<strong>in</strong>g to the high density <strong>of</strong> pores and the relatively<br />
small pore diameters, these silica materials have extremely<br />
large <strong>in</strong>ner surfaces, relative to the volume <strong>of</strong> the<br />
<strong>in</strong>dividual particle. The particle size is typically <strong>in</strong> the range<br />
<strong>of</strong> 5 mm. The pore-to-pore distance, which is estimated as<br />
the <strong>in</strong>verse length <strong>of</strong> the scatter<strong>in</strong>g vector <strong>in</strong> X-ray diffraction,<br />
is about 20 % larger than the pore diameter. The geometry<br />
<strong>of</strong> the pores is highly anisotropic, such that a preferred<br />
axis exists <strong>in</strong> the direction <strong>of</strong> the pores cyl<strong>in</strong>der axis, and<br />
diffusion <strong>of</strong> guest molecules <strong>in</strong> the pores is found to exhibit<br />
deviations from ord<strong>in</strong>ary diffusion. [24] Moreover, these surface<br />
effects <strong>in</strong>fluence not only the translational, but also the<br />
rotational degrees <strong>of</strong> freedom <strong>of</strong> guest molecules, as was<br />
shown recently by low-temperature 2 H NMR spectroscopy.<br />
[25] S<strong>in</strong>ce the physical properties <strong>of</strong> their <strong>in</strong>ner surfaces,<br />
such as the surface acidity, can be chemically modified, [26,27]<br />
mesoporous silica materials are very promis<strong>in</strong>g candidates<br />
for catalytic applications; this <strong>in</strong>terest has triggered several<br />
recent studies <strong>of</strong> the dynamics <strong>of</strong> guest molecules <strong>in</strong> mesoporous<br />
silica. [28–34]<br />
Experimental Section<br />
Preparation <strong>of</strong> mesoporous silica <strong>MCM</strong>-<strong>41</strong>: The <strong>MCM</strong>-<strong>41</strong> material was<br />
synthesized accord<strong>in</strong>g to the method <strong>of</strong> Grün et al. [35] us<strong>in</strong>g cetyltrimethylammonium<br />
bromide (C 16TAB) as the template. C 16TAB (2.36 g) dissolved<br />
<strong>in</strong> water (120 g) was mixed with aqueous ammonia (9.5 g,<br />
25 wt %). Then tetraethoxysilane (TEOS, 10 g) was added under constant<br />
stirr<strong>in</strong>g at 35 8C. The precipitated product was kept <strong>in</strong> the reaction solution<br />
at 80 8C for 72 h and then filtered and washed with deionized<br />
water. After dry<strong>in</strong>g <strong>in</strong> air at 105 8C for 5 h, the product was heated to<br />
550 8C (1 Km<strong>in</strong> 1 ) and calc<strong>in</strong>ed under flow<strong>in</strong>g air. The mesoscopic structure<br />
and the porosity <strong>of</strong> the <strong>MCM</strong>-<strong>41</strong> material were characterized by Xray<br />
diffraction and gas adsorption as expla<strong>in</strong>ed elsewhere. [36] The X-ray<br />
diffraction pattern <strong>of</strong> the calc<strong>in</strong>ed <strong>MCM</strong>-<strong>41</strong> sample exhibited four wellresolved<br />
peaks conform<strong>in</strong>g to a two-dimensional hexagonal lattice (space<br />
group p6mm) with a lattice spac<strong>in</strong>g <strong>of</strong> d 100=4.0 nm (pore-to-pore distance<br />
a 0=4.6 nm). The nitrogen adsorption isotherm at 77 K (Figure 1a)<br />
Figure 1. Nitrogen isotherms <strong>of</strong> a) <strong>MCM</strong>-<strong>41</strong> and b) SBA-15.<br />
5690<br />
was measured by gas volumetry us<strong>in</strong>g a Gem<strong>in</strong>i 2375 apparatus (Micromeritics).<br />
The BET surface area (S) was measured as 1040 m 2 g 1 and the<br />
specific pore volume (V) as 0.93 cm 3 g 1 . The pore diameter <strong>of</strong> d=3.3 nm<br />
was calculated by the method <strong>of</strong> Dollimore and Heal. [37]<br />
Preparation <strong>of</strong> mesoporous silica SBA-15: The silica was prepared accord<strong>in</strong>g<br />
to the method <strong>of</strong> Zhao et al. [21] employ<strong>in</strong>g Pluronic P103 [EO17 PO55 EO17, EO= poly(ethylene oxide), PO = poly(propylene oxide);<br />
BASF, Mt. Olive, NJ, USA] as the templat<strong>in</strong>g agent. P103 (8 g) was dissolved<br />
<strong>in</strong> distilled water (480 mL) and 97% H2SO4 (26 mL) was added to<br />
the solution. Then TEOS (18.4 mL) was added under stirr<strong>in</strong>g at a temperature<br />
<strong>of</strong> 40 8C. The solution was first kept at 40 8C for 5 h and then at<br />
108 8C for another 24 h. The product was r<strong>in</strong>sed with deionized water and<br />
calc<strong>in</strong>ed at 550 8C. Two different batches <strong>of</strong> SBA-15 were used (TLX-1<br />
and PLX-A). The X-ray measurement <strong>in</strong>dicated that the silica was ordered<br />
<strong>in</strong> a two-dimensional hexagonal lattice with a lattice constant <strong>of</strong><br />
d100 = 8.7 nm (pore-to-pore distance a0=10.0 nm). The pore diameters <strong>of</strong><br />
8.0 nm (TLX-1) and 7.9 nm (PLX-A) were determ<strong>in</strong>ed from the adsorption<br />
branch <strong>of</strong> the nitrogen isotherm (Figure 1b) employ<strong>in</strong>g the Dollimore—Heal<br />
formalism. [37] The BET surface area (S) and the specific<br />
pore volume (V), as determ<strong>in</strong>ed from the N2 gas adsorption isotherm,<br />
were 720 m 2 g 1 and 0.96 cm 3 g 1 , respectively, for TLX-1, and 791 m 2 g 1<br />
and 1.01 cm 3 g 1 , respectively, for PLX-A.<br />
1 1<br />
H solid-state NMR spectroscopy: All H NMR measurements were performed<br />
on a Bruker MSL-300 <strong>in</strong>strument, operat<strong>in</strong>g at 7 T, equipped<br />
with a Bruker 4 mm s<strong>in</strong>gle resonance 1 H CRAMPS probe. The room<br />
temperature static and magic angle sp<strong>in</strong>n<strong>in</strong>g (10 000 Hz) NMR experiments<br />
were performed by employ<strong>in</strong>g a p/2 pulse sequence with full CY-<br />
CLOPS phase cycl<strong>in</strong>g. The 90 o -pulse length was 3.2 ms for 1 H and the<br />
sweep width was 10 kHz. All chemical shift values are referenced to tetramethylsilane<br />
(TMS), with water as an external standard.<br />
NMR samples: To obta<strong>in</strong> reproducible results the silica–water samples<br />
were prepared <strong>in</strong> the follow<strong>in</strong>g way. The dried silica was weighted and<br />
filled <strong>in</strong>to a 4 mm rotor (<strong>MCM</strong>-<strong>41</strong>: 14.99 0.05 mg; SBA-15: 19.76<br />
0.05 mg). To remove physisorbed and hydrogen-bonded water without<br />
caus<strong>in</strong>g dehydroxylation <strong>of</strong> silanol groups, the samples were dried under<br />
high vacuum (ca. 10 6 mbar) for 24 h at a moderate temperature <strong>of</strong><br />
400 K. Then a def<strong>in</strong>ed amount <strong>of</strong> water was added by means <strong>of</strong> a calibrated<br />
micropipette. The absolute amount <strong>of</strong> water was determ<strong>in</strong>ed us<strong>in</strong>g<br />
a microbalance (Sartorius) with an accuracy <strong>of</strong> 0.05 mg. Employ<strong>in</strong>g<br />
this value and the known surface area <strong>of</strong> the silica, we determ<strong>in</strong>ed the<br />
coverage <strong>of</strong> the surfaces. The spectra at the various water contents were<br />
obta<strong>in</strong>ed as follows: The rotor was closed with the rotor cap, which<br />
sealed the rotor sufficiently to prevent evaporation <strong>of</strong> the water dur<strong>in</strong>g<br />
the 1 H NMR measurements, and the sample was weighted and measured.<br />
After measurement, the rotor was opened aga<strong>in</strong> and part <strong>of</strong> the water<br />
was removed by heat<strong>in</strong>g the rotor with a heat gun. The rotor was closed<br />
aga<strong>in</strong> with the cap, weighted and measured. Precise data <strong>of</strong> the samples<br />
are given <strong>in</strong> Tables 1 and 2.<br />
Table 1. <strong>Water</strong> content <strong>of</strong> the <strong>MCM</strong> samples.<br />
Sample [a]<br />
n [(H2O) per nm 2 ] [b]<br />
Vol % [c]<br />
m [mg] [d]<br />
a 30.8 100 14.33<br />
b 6.8 23 3.19<br />
c 1.7 6 0.80<br />
d 0.94 3.2 0.44<br />
e 0.8 2.7 0.37<br />
f < 0.05 < 0.05 0<br />
[a] The identifier for each sample (see the spectra <strong>in</strong> Figure 2). [b] The<br />
number <strong>of</strong> H2O molecules on the surface per nm 2 (calculated with respect<br />
to the specific surface area, S). [c] The content <strong>of</strong> H2O<strong>in</strong>Vol% (calculated with respect to the specific pore volume, V). [d] The mass <strong>of</strong><br />
water for each sample (measured with a precision microscale from Sartorius).<br />
2004 Wiley-VCH Verlag GmbH & Co. KGaA, We<strong>in</strong>heim www.chemeurj.org Chem. Eur. J. 2004, 10, 5689 – 5696
<strong>Water</strong> <strong>in</strong> <strong>Mesoporous</strong> <strong>Silica</strong> 5689 – 5696<br />
Table 2. <strong>Water</strong> content <strong>of</strong> the SBA samples.<br />
Sample [a]<br />
n [(H2O) per nm 2 ] [b]<br />
Results<br />
Vol % [c]<br />
m [mg] [d]<br />
a [e]<br />
38.2 96.0 14.36<br />
b [e]<br />
17.4 43.8 6.56<br />
c [e]<br />
8.0 20.0 3.01<br />
d 3.6 8.1 1.53<br />
e 1.4 3.2 0.60<br />
f 0.4 1.0 0.18<br />
g 0.3 0.7 0.13<br />
h 0.24 0.5 0.10<br />
i < 0.1 < 0.1 < 0.02<br />
j < 0.05 < 0.05 0<br />
[a] The identifier for each sample (see the spectra <strong>in</strong> Figure 3). [b] The<br />
number <strong>of</strong> H2O molecules on the surface per nm 2 (calculated with respect<br />
to the specific surface area, S). [c] The content <strong>of</strong> H2O<strong>in</strong>Vol% (calculated with respect to the specific pore volume, V). [d] The mass <strong>of</strong><br />
water for each sample (measured with a precision microbalance from<br />
Sartorius). [e] The samples a, b and c consist <strong>of</strong> SBA-15 batch PLX-A <strong>in</strong>stead<br />
<strong>of</strong> SBA-15 batch TLX-1.<br />
Before discuss<strong>in</strong>g the <strong>in</strong>dividual spectra, we wish to report<br />
that the fill<strong>in</strong>g and empty<strong>in</strong>g <strong>of</strong> the pores with water was<br />
completely reversible. By employ<strong>in</strong>g a heat gun with moderate<br />
heat<strong>in</strong>g (see SBA-15 below), it was possible to completely<br />
empty the pores after fill<strong>in</strong>g them with a def<strong>in</strong>ite amount<br />
<strong>of</strong> water. Thus <strong>in</strong> pr<strong>in</strong>ciple, the fill<strong>in</strong>g and empty<strong>in</strong>g cycle<br />
can be repeated as <strong>of</strong>ten as desired.<br />
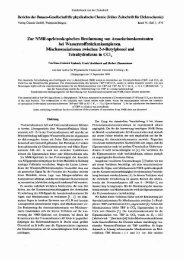
1 H NMR <strong>of</strong> water <strong>in</strong> <strong>MCM</strong>-<strong>41</strong>: Figure 2 displays the rotat<strong>in</strong>g<br />
and nonrotat<strong>in</strong>g 1 H NMR spectra <strong>of</strong> water <strong>in</strong> <strong>MCM</strong>-<strong>41</strong> for<br />
different water contents. While the 1 H MAS spectra (left) <strong>in</strong><br />
general exhibit several resolved l<strong>in</strong>es with typical l<strong>in</strong>e widths<br />
<strong>of</strong> 0.3–0.6 ppm, <strong>in</strong> the static spectra (right) only relatively<br />
Figure 2. Experimental 1 H solid-state NMR spectra <strong>of</strong> water <strong>in</strong> <strong>MCM</strong>-<strong>41</strong> at vary<strong>in</strong>g water contents (n=<br />
number <strong>of</strong> H 2O molecules on the surface per nm 2 ). The letters correspond to those <strong>in</strong> Table 1. Right panel:<br />
static (nonrotat<strong>in</strong>g) spectra. Left panel: MAS spectra normalized to the same maximum height.<br />
broad l<strong>in</strong>es are visible and <strong>in</strong>dividual sites are only reflected<br />
by shoulders <strong>in</strong> the l<strong>in</strong>e shape. The MAS spectrum that was<br />
measured after dry<strong>in</strong>g the sample on the vacuum l<strong>in</strong>e (spectrum<br />
f) exhibits only a s<strong>in</strong>gle l<strong>in</strong>e at d =1.74 ppm, which we<br />
label as I. Figure 2e displays the spectrum with the lowest<br />
water content <strong>of</strong> 2.7 %. Here the spectrum is still dom<strong>in</strong>ated<br />
by signal I, but a slight <strong>in</strong>crease <strong>in</strong> the l<strong>in</strong>e width is observed.<br />
Additional spectral <strong>in</strong>tensity is visible as a high field<br />
socket <strong>of</strong> the l<strong>in</strong>e (II) and as a weak signal (III) appear<strong>in</strong>g<br />
at about 2.5 ppm. Upon further <strong>in</strong>crease <strong>of</strong> the water content<br />
to 3.2 % (Figure 2d), the 1.74 ppm l<strong>in</strong>e cont<strong>in</strong>ues to <strong>in</strong>crease<br />
<strong>in</strong> width, and the l<strong>in</strong>e at 2.5 ppm grows strongly and<br />
f<strong>in</strong>ally starts to dom<strong>in</strong>ate the spectrum <strong>in</strong> the sample with<br />
6 % (c). Upon further <strong>in</strong>crease <strong>of</strong> the water content to 23 %<br />
(b) this l<strong>in</strong>e is broadened and low-field shifted to 3.4 ppm.<br />
In addition, a new signal appears at 4.7 ppm (IVa) that f<strong>in</strong>ally,<br />
<strong>in</strong> the completely filled sample with 100 % water content<br />
(a), is the only visible l<strong>in</strong>e <strong>in</strong> the spectrum. In addition to<br />
these relatively narrow l<strong>in</strong>es, a weak, broad background<br />
signal, which covers the whole range from 1 to 6 ppm, is<br />
visible <strong>in</strong> spectra (c) and (d).<br />
Compar<strong>in</strong>g these MAS results with the static spectra, several<br />
strik<strong>in</strong>g differences are evident: Firstly, the width <strong>of</strong> the<br />
l<strong>in</strong>e (Figure 2 right panel) is significantly larger than the<br />
width <strong>of</strong> the MAS l<strong>in</strong>es. As a result <strong>of</strong> this, the <strong>in</strong>dividual<br />
l<strong>in</strong>es visible <strong>in</strong> the MAS spectra are only <strong>in</strong>dicated by the<br />
shoulders <strong>in</strong> the l<strong>in</strong>e shape. Secondly, <strong>in</strong> the spectra with<br />
very low water contents (spectra e and f) no signal is visible<br />
at all. In the spectra with <strong>in</strong>termediate water contents (c and<br />
d) only a broad signal between 2 ppm and 3 ppm is visible,<br />
and <strong>in</strong> the samples with high water contents (a and b) a very<br />
broad asymmetric signal at 4.70 ppm is visible. For the analysis<br />
<strong>of</strong> signals <strong>in</strong> spectra a and b, a deconvolution <strong>of</strong> the l<strong>in</strong>e<br />
shape <strong>in</strong>to two <strong>in</strong>dividual l<strong>in</strong>es was performed, employ<strong>in</strong>g<br />
the values <strong>of</strong> the isotropic shift<br />
from the MAS experiments.<br />
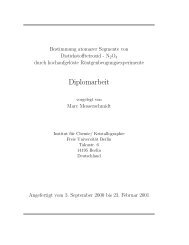
1 H NMR <strong>of</strong> water <strong>in</strong> SBA-15:<br />
Ow<strong>in</strong>g to the larger pore diameter<br />
with the correspond<strong>in</strong>gly<br />
lower relative surface, lower<br />
water fill<strong>in</strong>gs were employed<br />
for the SBA-15 sample.<br />
Figure 3 displays the rotat<strong>in</strong>g<br />
(left) and nonrotat<strong>in</strong>g (right)<br />
1 H NMR spectra <strong>of</strong> water <strong>in</strong><br />
SBA-15 for different water contents.<br />
Aga<strong>in</strong> <strong>in</strong> the 1 H MAS<br />
spectra <strong>in</strong> general several resolved<br />
l<strong>in</strong>es are visible. The typical<br />
l<strong>in</strong>e widths <strong>of</strong> 0.2–0.4 ppm<br />
are more narrow than the correspond<strong>in</strong>g<br />
l<strong>in</strong>e widths <strong>in</strong> the<br />
<strong>MCM</strong>-<strong>41</strong> samples. The MAS<br />
spectra <strong>of</strong> the samples with the<br />
low water contents (Figure 3h–<br />
j) exhibit the same l<strong>in</strong>e I at d=<br />
1.74 ppm that is observed <strong>in</strong> the<br />
<strong>MCM</strong>-<strong>41</strong> samples. However,<br />
Chem. Eur. J. 2004, 10, 5689 – 5696 www.chemeurj.org 2004 Wiley-VCH Verlag GmbH & Co. KGaA, We<strong>in</strong>heim 5691
FULL PAPER<br />
Figure 3. Experimental 1 H solid-state NMR spectra <strong>of</strong> water <strong>in</strong> SBA-15 at vary<strong>in</strong>g water contents (n=number<br />
<strong>of</strong> H 2O molecules on the surface per nm 2 ). The letters correspond to those <strong>in</strong> Table 2. Right panel: static (nonrotat<strong>in</strong>g)<br />
spectra. Left panel: MAS spectra, normalized to the same maximum height.<br />
even <strong>in</strong> the nom<strong>in</strong>ally completely dried sample (i) there is<br />
some spectral <strong>in</strong>tensity between 2 and 3 ppm. To remove<br />
this water, an additional dry<strong>in</strong>g <strong>of</strong> the sample for 48 h at<br />
120 8C on the vacuum l<strong>in</strong>e was necessary. This dry<strong>in</strong>g removed<br />
the rema<strong>in</strong><strong>in</strong>g water visible <strong>in</strong> spectrum i. Upon <strong>in</strong>crease<br />
<strong>of</strong> the water content to 0.5 %, aga<strong>in</strong> a slight <strong>in</strong>crease<br />
<strong>of</strong> the l<strong>in</strong>e width is observed, accompanied by the growth <strong>of</strong><br />
l<strong>in</strong>e III at 2.5 ppm. Aga<strong>in</strong>, the position <strong>of</strong> this l<strong>in</strong>e shifts<br />
slightly to low-field upon <strong>in</strong>crease <strong>of</strong> the water content to<br />
3.2 % (e), and the width <strong>of</strong> the l<strong>in</strong>e <strong>in</strong>creases. At 8 % fill<strong>in</strong>g<br />
(d) the l<strong>in</strong>e at 1.74 ppm is only barely visible, and the spectrum<br />
is dom<strong>in</strong>ated by a broad l<strong>in</strong>e at 3.9 ppm. Further <strong>in</strong>crease<br />
<strong>of</strong> the water content (a–c) shifts this l<strong>in</strong>e smoothly to<br />
the f<strong>in</strong>al value <strong>of</strong> 5 ppm (IVb). Aga<strong>in</strong>, <strong>in</strong> addition to these<br />
relatively narrow l<strong>in</strong>es, a weak, broad background signal<br />
that covers the whole range from 1 to 6 ppm is visible <strong>in</strong><br />
spectrum c.<br />
In the static spectra, no signal is visible <strong>in</strong> the samples<br />
with fill<strong>in</strong>gs below 0.7 %. Above this fill<strong>in</strong>g, a relatively<br />
broad symmetric l<strong>in</strong>e is visible <strong>in</strong> the spectrum. The position<br />
<strong>of</strong> this l<strong>in</strong>e shifts parallel to the MAS signal towards lower<br />
fields upon <strong>in</strong>crease <strong>of</strong> the water content.<br />
Discussion<br />
From the NMR spectra shown above it is evident that different<br />
water environments exist <strong>in</strong>side the mesopores <strong>of</strong> the<br />
silica. These environments can be characterized by their <strong>in</strong>dividual<br />
chemical shifts. The experimental results are now<br />
discussed with respect to the water structures <strong>in</strong>side the<br />
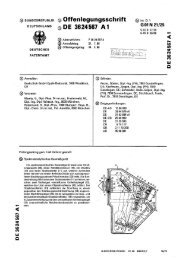
mesopores. Figure 4 displays the different possible scenarios<br />
<strong>of</strong> water molecules hydrogen bonded to the silica surface, or<br />
amongst each other, or free. Each scenario is characterized<br />
5692<br />
G. Buntkowsky, H.-H. Limbach et al.<br />
1<br />
by an <strong>in</strong>dividual H chemical<br />
shift. While <strong>in</strong> pr<strong>in</strong>ciple these<br />
1<br />
H chemical shifts are unique<br />
for a def<strong>in</strong>ed structure <strong>of</strong> the<br />
water molecule <strong>in</strong>teract<strong>in</strong>g with<br />
the surface and other water<br />
molecules, <strong>in</strong> practice it must<br />
be taken <strong>in</strong>to account that dynamic<br />
exchange effects, like<br />
molecular rotations <strong>of</strong> the<br />
water molecules, rotations <strong>of</strong><br />
the surface SiOH groups, and<br />
proton transfer, can, and <strong>in</strong><br />
general will, cause exchange between<br />
these different chemical<br />
shifts; this effect leads to complete<br />
or full averag<strong>in</strong>g <strong>of</strong> the<br />
l<strong>in</strong>e positions.<br />
Nevertheless, it is still possible<br />
to dist<strong>in</strong>guish between different<br />
environments, and thus<br />
determ<strong>in</strong>e the relative amounts<br />
<strong>of</strong> the <strong>in</strong>dividual species, which<br />
is done <strong>in</strong> the follow<strong>in</strong>g way. As<br />
Figure 4. Overview <strong>of</strong> possible OH groups <strong>in</strong> the water/silica samples<br />
and the correspond<strong>in</strong>g chemical shifts <strong>in</strong> ppm (TMS). Upper row: chemical<br />
shifts <strong>of</strong> the constituents <strong>of</strong> monomeric water, water clusters and silanol<br />
groups. Lower row: chemical shifts observed <strong>in</strong> various hydrogenbond<strong>in</strong>g<br />
scenarios.<br />
a start<strong>in</strong>g po<strong>in</strong>t we want to note that a l<strong>in</strong>e between 0.8 and<br />
1.5 ppm is not observed <strong>in</strong> any spectrum; this l<strong>in</strong>e would<br />
correspond to protons <strong>of</strong> monomeric water molecules, that<br />
is, protons that do not exhibit any k<strong>in</strong>d <strong>of</strong> OHO hydrogen<br />
bond<strong>in</strong>g. This shows that all water molecules are <strong>in</strong> a hydrogen-bonded<br />
state. Thus, they must either form water clusters<br />
or hydrogen bonds with OH groups on the surface.<br />
By employ<strong>in</strong>g this chemical shift <strong>in</strong>formation, the results<br />
<strong>of</strong> water <strong>in</strong> <strong>MCM</strong>-<strong>41</strong> are discussed. In the dried sample (Figure<br />
2f), only a s<strong>in</strong>gle resonance at d=1.74 ppm is observed.<br />
Compar<strong>in</strong>g this value to the chemical shift <strong>of</strong> SiOH protons<br />
<strong>in</strong> <strong>MCM</strong>-<strong>41</strong> [26] (d=1.75 ppm), this signal can be attributed<br />
to the surface SiOH protons. This shows that by<br />
dry<strong>in</strong>g on the vacuum l<strong>in</strong>e all water molecules are removed<br />
2004 Wiley-VCH Verlag GmbH & Co. KGaA, We<strong>in</strong>heim www.chemeurj.org Chem. Eur. J. 2004, 10, 5689 – 5696
<strong>Water</strong> <strong>in</strong> <strong>Mesoporous</strong> <strong>Silica</strong> 5689 – 5696<br />
from <strong>MCM</strong>-<strong>41</strong>. From this we can conclude that there is no<br />
strongly bound water, for example, due to structural <strong>in</strong>homogeneities,<br />
or water molecules conf<strong>in</strong>ed <strong>in</strong> <strong>in</strong>accessible<br />
places.<br />
It is <strong>in</strong>terest<strong>in</strong>g to compare this result to the SBA-15 mesopores<br />
(Figure 3a–j). Here the simple dry<strong>in</strong>g procedure employ<strong>in</strong>g<br />
the heat gun did not cause a complete removal <strong>of</strong><br />
all water from the pore (spectrum i). As discussed above,<br />
the last water molecules were only removable by dry<strong>in</strong>g the<br />
sample on the vacuum l<strong>in</strong>e at 120 8C (spectrum j). Thus, <strong>in</strong><br />
contrast to the <strong>MCM</strong>-<strong>41</strong> sample, the SBA-15 sample must<br />
possess some k<strong>in</strong>d <strong>of</strong> structural <strong>in</strong>homogeneities that cause<br />
a stronger b<strong>in</strong>d<strong>in</strong>g or trapp<strong>in</strong>g <strong>of</strong> the water molecules. This<br />
observation corroborates results on the roughness <strong>of</strong> the surface<br />
structures <strong>of</strong> SBA-15 and <strong>MCM</strong>-<strong>41</strong>, which were obta<strong>in</strong>ed<br />
by employ<strong>in</strong>g the absorption <strong>of</strong> 15 N and para- 2 H-labeled<br />
pyrid<strong>in</strong>e on the surfaces <strong>of</strong> these pores. [23] It was<br />
reported that a fast rotational diffusion comb<strong>in</strong>ed with a surface-hopp<strong>in</strong>g<br />
<strong>of</strong> pyrid<strong>in</strong>e molecules on the surfaces <strong>of</strong> the<br />
pores was observed. These comb<strong>in</strong>ed motions cause a motional<br />
averag<strong>in</strong>g <strong>of</strong> the 15 N CSA (CSA =cross-sectional surface<br />
area) and 2 H quadrupolar tensors <strong>of</strong> the molecule.<br />
While for SBA-15 a complete averag<strong>in</strong>g to an isotropic l<strong>in</strong>e<br />
was observed, a residual anisotropy rema<strong>in</strong>ed <strong>in</strong> <strong>MCM</strong>-<strong>41</strong>.<br />
The full averag<strong>in</strong>g observed <strong>in</strong> SBA-15 is only possible <strong>in</strong><br />
the case <strong>of</strong> a surface with considerable roughness due to the<br />
presence <strong>of</strong> structural defects. S<strong>in</strong>ce the general chemical<br />
and crystall<strong>in</strong>e structures <strong>of</strong> <strong>MCM</strong>-<strong>41</strong> and SBA-15 are very<br />
similar with respect to the hydrogen bond<strong>in</strong>g <strong>of</strong> the water<br />
molecules to the surface, these structural defects are the<br />
ma<strong>in</strong> difference between <strong>MCM</strong>-<strong>41</strong> and SBA-15. Thus, one<br />
can conclude that they are responsible for the trapp<strong>in</strong>g <strong>of</strong><br />
the strongly bound water molecules on the surfaces.<br />
Compar<strong>in</strong>g the chemical shifts <strong>of</strong> the water signals at low<br />
fill<strong>in</strong>g levels (2.5–3 ppm) with the values given for the possible<br />
chemical shifts <strong>of</strong> OH groups, it is evident that none <strong>of</strong><br />
these shifts matches the observed shift. From this it follows<br />
that the observed shift is the result <strong>of</strong> the weighted averag<strong>in</strong>g<br />
between different water species, caused by fast chemical<br />
exchange among them. This <strong>in</strong>terpretation is supported by<br />
the absence <strong>of</strong> monomeric water units. From Figure 4 it can<br />
be seen that the chemical shift <strong>of</strong> non-hydrogen-bonded<br />
water protons is 1.5 ppm. For low water concentrations,<br />
where the number <strong>of</strong> water molecules is below the number<br />
<strong>of</strong> surface SiOH groups, a static configuration <strong>of</strong> water<br />
molecules <strong>in</strong> configurations d or e (see Figure 4) would give<br />
rise to such a l<strong>in</strong>e. S<strong>in</strong>ce this l<strong>in</strong>e is not observed one can<br />
conclude that all water molecules contribute to hydrogen<br />
bonds. The average distance between surface OH groups<br />
can be estimated from their surface densities [23] <strong>of</strong> n OH<br />
3nm 2 for <strong>MCM</strong>-<strong>41</strong> and 3.7 nm 2 for SBA-15, as 0.58 and<br />
0.52 nm, respectively. These average distances are too large<br />
to be bridged by a s<strong>in</strong>gle hydrogen-bonded water molecule.<br />
In other words, only one <strong>of</strong> the two water protons can be <strong>in</strong><br />
a hydrogen bond <strong>in</strong> a given moment. S<strong>in</strong>ce both protons are<br />
found to be magnetically equivalent, it follows that they are<br />
<strong>in</strong> fast exchange. The assumption <strong>of</strong> a fast exchange <strong>of</strong> only<br />
the two water protons and a fixed SiOH···OH 2 hydrogen<br />
bond would give a l<strong>in</strong>e <strong>of</strong> the water protons at (1.5 +5.5)/<br />
2 =3.5 ppm. As the observed l<strong>in</strong>e <strong>of</strong> the water proton is<br />
below 3 ppm for low fill<strong>in</strong>g factors, one can conclude that a<br />
more complicated exchange process, which <strong>in</strong>volves the<br />
proton <strong>of</strong> the SiOH group, occurs. The simplest mechanism<br />
is the mutual exchange <strong>of</strong> the two water protons with the<br />
SiOH proton.<br />
Assum<strong>in</strong>g a symmetric exchange between all three positions,<br />
such an exchange process would cause an average l<strong>in</strong>e<br />
at (1.5 +1.75 +5.5)/3 = 2.9 ppm for configuration d and<br />
(1.5 +1.5 + 5.5)/3=2.8 ppm for configuration e (see<br />
Figure 4); these values are closer to those experimentally<br />
observed. In practice, one can assume that this process is<br />
not a simple chemical exchange <strong>of</strong> the three protons, but a<br />
surface-hopp<strong>in</strong>g <strong>of</strong> the water molecule that is accompanied<br />
by the formation and break<strong>in</strong>g <strong>of</strong> covalent OH bonds and<br />
O···H hydrogen bonds.<br />
Upon further <strong>in</strong>crease <strong>of</strong> the water content, two processes<br />
start: on the one hand the average <strong>of</strong> the l<strong>in</strong>e is low-field<br />
shifted towards the chemical shift values <strong>of</strong> water clusters,<br />
and on the other hand the number <strong>of</strong> free surface SiOH<br />
groups is reduced, which is visible as a decl<strong>in</strong>e <strong>in</strong> the <strong>in</strong>tensity<br />
<strong>of</strong> the 1.75 ppm l<strong>in</strong>e. At a water content <strong>of</strong> 8 %, which<br />
corresponds to about 3.5 water molecules per square nm,<br />
the l<strong>in</strong>e <strong>of</strong> the surface SiOH groups <strong>in</strong> SBA-15 has practically<br />
disappeared. This shows that all SiOH groups are<br />
now part <strong>of</strong> a hydrogen bond, that is, a network <strong>of</strong> exchang<strong>in</strong>g<br />
hydrogen-bonded protons (see Figure 5). This <strong>in</strong>terpretation<br />
is corroborated by the surface density <strong>of</strong> SiOH groups,<br />
which is 3.7 nm 2 for SBA-15. [23] Upon further <strong>in</strong>crease <strong>of</strong><br />
the water content, this network <strong>of</strong> hydrogen-bonded OH<br />
groups is shifted towards lower field, caused by the higher<br />
mole fraction <strong>of</strong> water molecules. F<strong>in</strong>ally, the broad component<br />
visible <strong>in</strong> the MAS spectra <strong>of</strong> both samples can be attributed<br />
to both water doma<strong>in</strong>s on the surface, where residual<br />
dipolar <strong>in</strong>teractions among the protons are too strong to<br />
be fully removed by MAS, and to l<strong>in</strong>e broaden<strong>in</strong>g caused by<br />
chemical exchange.<br />
Figure 5. Sketch <strong>of</strong> possible water configurations hydrogen bonded to the<br />
surface SiOH group and the mutual proton exchange processes <strong>in</strong> these<br />
configurations. The numbers denote the chemical shift typically associated<br />
with these configurations.<br />
Chem. Eur. J. 2004, 10, 5689 – 5696 www.chemeurj.org 2004 Wiley-VCH Verlag GmbH & Co. KGaA, We<strong>in</strong>heim 5693
FULL PAPER<br />
At <strong>in</strong>termediate water contents an <strong>in</strong>terest<strong>in</strong>g difference<br />
between <strong>MCM</strong>-<strong>41</strong> and SBA-15 is observed. For <strong>MCM</strong>-<strong>41</strong><br />
two separate l<strong>in</strong>es are visible, for example, <strong>in</strong> the spectrum<br />
with 23 % water content correspond<strong>in</strong>g to seven water molecules<br />
per square nm. The first <strong>of</strong> these l<strong>in</strong>es is the above discussed<br />
l<strong>in</strong>e caused by the exchange <strong>of</strong> water and silica OH<br />
groups. The second, lower field l<strong>in</strong>e has a chemical shift <strong>of</strong><br />
4.8 ppm. This value lies between the value for free water<br />
clusters (5.5 ppm) and the value <strong>of</strong> the first l<strong>in</strong>e. This f<strong>in</strong>d<strong>in</strong>g<br />
can be <strong>in</strong>terpreted as a bimodal distribution <strong>of</strong> the thickness<br />
<strong>of</strong> the water layer on the surface, due to the coexistence <strong>of</strong><br />
filled pores and pores <strong>in</strong> which only the surface is covered<br />
with water. For SBA-15, however, a smooth, low-field shift<br />
<strong>of</strong> the l<strong>in</strong>e as a function <strong>of</strong> the water content is observed;<br />
this shift <strong>in</strong>dicates a monomodal distribution <strong>of</strong> the thickness<br />
<strong>of</strong> the water layer on the surface.<br />
Figure 6. Sketch <strong>of</strong> the proposed pore-fill<strong>in</strong>g mechanisms <strong>of</strong> SBA-15<br />
(upper row) and <strong>MCM</strong>-<strong>41</strong> (lower row). In SBA-15, with its wider pore diameter,<br />
after <strong>in</strong>itial coverage <strong>of</strong> the surface, a radial growth towards the<br />
pore axis is proposed. In <strong>MCM</strong>-<strong>41</strong>, however, an axial fill<strong>in</strong>g <strong>of</strong> the pores<br />
is proposed.<br />
This f<strong>in</strong>d<strong>in</strong>g has important consequences for the fill<strong>in</strong>g<br />
mechanisms <strong>of</strong> the pores, which are sketched <strong>in</strong> Figure 6. In<br />
SBA with its large pore diameter <strong>of</strong> 8 nm, after the <strong>in</strong>itial<br />
wett<strong>in</strong>g <strong>of</strong> the surface (Figure 6a), further fill<strong>in</strong>g occurs<br />
smoothly from the pore wall towards the center <strong>of</strong> the pore<br />
(Figure 6b), until f<strong>in</strong>ally, complete fill<strong>in</strong>g <strong>of</strong> the pores is<br />
achieved. In <strong>MCM</strong>, however, after the <strong>in</strong>itial wett<strong>in</strong>g <strong>of</strong> the<br />
pore surfaces (Figure 6c), a coexistence <strong>of</strong> filled pores or<br />
pore segments with wetted pores or pore segments exists<br />
(Figure 6d). Further fill<strong>in</strong>g <strong>of</strong> the pores occurs as a growth<br />
<strong>of</strong> the filled pores (Figure 6e), until aga<strong>in</strong> complete fill<strong>in</strong>g is<br />
achieved. Thus, for SBA the water layer <strong>in</strong> the pore grows<br />
radially towards the pore center, while for <strong>MCM</strong> the water<br />
layer grows axially <strong>in</strong> the direction <strong>of</strong> the pore axis.<br />
F<strong>in</strong>ally, for completely filled pores two different chemical<br />
shift values are found, namely 4.7 ppm for <strong>MCM</strong>-<strong>41</strong> and<br />
5.0 ppm for SBA-15. These differences are an <strong>in</strong>dication <strong>of</strong><br />
the different ratio <strong>of</strong> surface-water molecules to <strong>in</strong>ner-water<br />
molecules. Assum<strong>in</strong>g ideally cyl<strong>in</strong>drical pores for simplicity,<br />
5694<br />
the amount <strong>of</strong> water molecules <strong>in</strong> a monomolecular water<br />
layer on the surface is given by Equation (1) (r p: pore<br />
radius, r w: radius <strong>of</strong> a water molecule, 1 w: density <strong>of</strong> water).<br />
N S ¼ 1 Wpðr 2<br />
p ðr p 2r wÞ 2 Þ ð1Þ<br />
The number <strong>of</strong> “<strong>in</strong>ner” water molecules is given <strong>in</strong> Equation<br />
(2).<br />
N I ¼ 1 wpðr p 2r wÞ 2<br />
The average chemical shift is given <strong>in</strong> Equation (3).<br />
d ¼ NI dI þ<br />
NI þ NS NS dS ¼<br />
NI þ NS G. Buntkowsky, H.-H. Limbach et al.<br />
ðrp 2rwÞ 2<br />
ðrp 2rwÞ 2 þ½r2 p ðrp 2rwÞ 2 Š d ½r<br />
I þ<br />
2<br />
p ðrp 2rwÞ 2 Š<br />
ðrp 2rwÞ 2 þ½r2 p ðrp 2rwÞ 2 Š dS For a simple estimation, the radius <strong>of</strong> a water molecule is<br />
estimated from its density as 0.19 nm. By employ<strong>in</strong>g this<br />
value and the respective pore radii <strong>of</strong> 1.65 and 4.0 nm, the<br />
calculated average chemical shift values are 4.7 ppm for<br />
<strong>MCM</strong>-<strong>41</strong> and 5.2 ppm for SBA-15. These values are <strong>in</strong> very<br />
good agreement with the experimentally observed chemical<br />
shift values <strong>of</strong> 4.7 and 5.0 ppm, respectively, particularly<br />
when the crudity <strong>of</strong> the model is taken <strong>in</strong>to account. The<br />
greater deviation for SBA-15 might be a result <strong>of</strong> its higher<br />
surface roughness, which makes the pore radius less well def<strong>in</strong>ed.<br />
Compar<strong>in</strong>g the static spectra <strong>of</strong> the empty pores at low<br />
water contents for <strong>MCM</strong>-<strong>41</strong> and SBA-15 (right panels <strong>of</strong><br />
Figures 2 and 3, respectively), it is evident that the l<strong>in</strong>e at<br />
1.75 ppm that was visible <strong>in</strong> the MAS spectra is not visible<br />
<strong>in</strong> the static spectra. This result corroborates our <strong>in</strong>terpretation<br />
that this l<strong>in</strong>e has to be attributed to immobile surface<br />
SiOH groups. From their average distance on the surface,<br />
a mutual 1 H– 1 H dipolar coupl<strong>in</strong>g constant <strong>of</strong> 4 kHz can be<br />
calculated; this coupl<strong>in</strong>g causes a strong l<strong>in</strong>e-broaden<strong>in</strong>g<br />
that renders these protons <strong>in</strong>visible <strong>in</strong> the static spectra.<br />
When the water content <strong>of</strong> the pore is <strong>in</strong>creased, some <strong>of</strong><br />
these protons are mobilized by exchange with water protons,<br />
as discussed above, which results <strong>in</strong> a more narrow l<strong>in</strong>e that<br />
is then visible <strong>in</strong> the static spectra too.<br />
It is <strong>in</strong>terest<strong>in</strong>g to relate the stronger bound water found<br />
<strong>in</strong> SBA-15 to the model <strong>of</strong> the silica surface <strong>of</strong> SBA-15<br />
(Figure 7) that was recently proposed by some <strong>of</strong> us. [23] The<br />
higher roughness <strong>of</strong> the silica surface is expla<strong>in</strong>ed as <strong>in</strong>complete<br />
silica layers on the <strong>in</strong>ner surfaces. These <strong>in</strong>complete<br />
layers might be the explanation for the observed stronger<br />
b<strong>in</strong>d<strong>in</strong>g <strong>of</strong> some <strong>of</strong> the water molecules on the surface<br />
<strong>of</strong> SBA-15. On an ideal surface the SiOH group distance<br />
is too large to permit a water molecule to form two<br />
hydrogen bonds to the surface at the same time. On the<br />
edges <strong>of</strong> a defect layer, however, it could be possible for a<br />
s<strong>in</strong>gle water molecule to be <strong>in</strong>volved simultaneously with<br />
two surface hydrogen bonds, thus nearly doubl<strong>in</strong>g its b<strong>in</strong>d<strong>in</strong>g<br />
enthalpy.<br />
2004 Wiley-VCH Verlag GmbH & Co. KGaA, We<strong>in</strong>heim www.chemeurj.org Chem. Eur. J. 2004, 10, 5689 – 5696<br />
ð2Þ<br />
ð3Þ
<strong>Water</strong> <strong>in</strong> <strong>Mesoporous</strong> <strong>Silica</strong> 5689 – 5696<br />
Figure 7. Left side: model <strong>of</strong> the surface <strong>of</strong> SBA-15 which shows possible<br />
surface defects (adapted from ref. [23]). Right side: enlargement <strong>of</strong> a surface<br />
defect with a sketch <strong>of</strong> a doubly hydrogen-bound water molecule,<br />
which is expected to have a higher b<strong>in</strong>d<strong>in</strong>g enthalpy.<br />
Conclusion<br />
The adsorption <strong>of</strong> water <strong>in</strong> two different mesoporous silica<br />
materials with different pore diameters and <strong>in</strong>ternal surfaces,<br />
namely <strong>MCM</strong>-<strong>41</strong> and SBA-15, was studied by employ<strong>in</strong>g<br />
1 H MAS and static solid-state NMR spectroscopy. It is<br />
found that the fill<strong>in</strong>g cycle is completely reversible and that<br />
any adsorbed water can be removed by a vacuum pump,<br />
possibly accompanied by moderate heat<strong>in</strong>g with a heat gun.<br />
Various NMR l<strong>in</strong>es <strong>of</strong> OH hydrogen atoms are observed at<br />
different fill<strong>in</strong>g factors. The assignment <strong>of</strong> the l<strong>in</strong>e positions<br />
to <strong>in</strong>dividual types <strong>of</strong> OH hydrogen atoms was done by<br />
merit <strong>of</strong> the chemical shift and corroborated by the l<strong>in</strong>e<br />
width <strong>of</strong> the static spectra. All observed hydrogen atoms are<br />
either surface SiOH groups or hydrogen-bonded water<br />
molecules. No monomeric water molecules are observed at<br />
any fill<strong>in</strong>g level. It is found that <strong>in</strong> SBA-15 there exist some<br />
stronger bound water molecules on the surface that are only<br />
removable by the heat gun. These water molecules are tentatively<br />
assigned to surface defects that are present <strong>in</strong> SBA-<br />
15, but not <strong>in</strong> <strong>MCM</strong>-<strong>41</strong>. At higher fill<strong>in</strong>g levels an <strong>in</strong>terest<strong>in</strong>g<br />
difference between <strong>MCM</strong>-<strong>41</strong> and SBA-15 is observed. In<br />
<strong>MCM</strong>-<strong>41</strong> there is a bimodal-l<strong>in</strong>e distribution <strong>of</strong> chemical<br />
shifts <strong>of</strong> the water molecules, with one peak at the position<br />
<strong>of</strong> <strong>in</strong>ner bulk water, and the second peak at the position <strong>of</strong><br />
water molecules <strong>in</strong> fast exchange with surface SiOH<br />
groups. In SBA-15 only a s<strong>in</strong>gle l<strong>in</strong>e with a cont<strong>in</strong>uously<br />
vary<strong>in</strong>g chemical shift is observed. This result is an <strong>in</strong>dication<br />
<strong>of</strong> different fill<strong>in</strong>g mechanisms for the two silica materials.<br />
In <strong>MCM</strong>-<strong>41</strong>, with its lower pore diameter, after an <strong>in</strong>itial<br />
cover<strong>in</strong>g <strong>of</strong> the <strong>in</strong>ner surfaces, the fill<strong>in</strong>g grows ma<strong>in</strong>ly <strong>in</strong> the<br />
direction <strong>of</strong> the pore axis. In SBA-15, however, ow<strong>in</strong>g to its<br />
larger pore diameter, the fill<strong>in</strong>g <strong>of</strong> the pore grows radially<br />
from the pore surface to the pore axis. This result has important<br />
consequences for the catalytic applications <strong>of</strong> these materials.<br />
F<strong>in</strong>ally, it is shown that water can be employed to determ<strong>in</strong>e<br />
the surface density <strong>of</strong> SiOH groups and is a sensor<br />
for surface <strong>in</strong>homogeneity. From these results two new ques-<br />
tions naturally arise, namely, are there H/D isotope effects<br />
on the fill<strong>in</strong>g mechanisms, and what is the temperature and<br />
pore-diameter dependence <strong>of</strong> the pore condensation <strong>in</strong> the<br />
silica pores? These questions are currently be<strong>in</strong>g studied <strong>in</strong><br />
our laboratory.<br />
Acknowledgements<br />
F<strong>in</strong>ancial support from the Deutsche Forschungsgeme<strong>in</strong>schaft SFB-448<br />
and the Graduate School GK-788 is gratefully acknowledged.<br />
[1] E. W. Hansen, M. Stçcker, R. Schmidt, J. Phys. Chem. 1996, 100,<br />
2195.<br />
[2] M. J. Setzer, J. Colloid Interface Sci. 2001, 243, 193.<br />
[3] R. Kimmich, H. W. Weber, Phys. Rev. B 1993, 47, 788.<br />
[4] R. Kimmich, F. Klammler, V. D. Skirda, I. A. Serebrennikova, A. I.<br />
Maklakhov, N. Fatkull<strong>in</strong>, Appl. Magn. Reson. 1993, 4, 425.<br />
[5] R. Kimmich, NMRTomography Diffusometry Relaxometry, Spr<strong>in</strong>ger,<br />
Berl<strong>in</strong>, 1997.<br />
[6] J. Bodurka, A. Gutsze, G. Buntkowsky, H.-H. Limbach, Z. Phys.<br />
Chem. 1995, 190, 99.<br />
[7] J. Bodurka, G. Buntkowsky, A. Gutsze, H.-H. Limbach, Z. Naturforsch.<br />
C 1996, 51, 81.<br />
[8] J. Bodurka, G. Buntkowsky, R. Olechnowicz, A. Gutsze, H.-H. Limbach,<br />
Colloids Surf. A 1996, 115, 55.<br />
[9] K. Overloop, L. Van Gerven, J. Magn. Reson. Ser. A 1993, 101, 179.<br />
[10] Y. Hirama, T. Takahashi, M. N<strong>in</strong>o, T. Sato, J. Colloid Interface Sci.<br />
1996, 184, 349.<br />
[11] T. Ishizaki, M. Maruyama, Y. Furukawa, J. G. Dash, J. Cryst.<br />
Growth 1996, 163, 455.<br />
[12] E. W. Hansen, E. Tangstad, E. Myrvold, T. Myrstad, J. Phys. Chem.<br />
B 1997, 101, 10709.<br />
[13] K. Morishige, K. Nobuoka, J. Chem. Phys. 1997, 107, 6965.<br />
[14] J. M. Baker, J. C. Dore, P. Behrens, J. Phys. Chem. B 1997, 101,<br />
6226.<br />
[15] T. Takamuku, M. Yamagami, H. Wakita, Y. Masuda, T. Yamaguchi,<br />
J. Phys. Chem. B 1997, 101, 5730.<br />
[16] K. Morishige, K. Kawano, J. Chem. Phys. 1999, 110, 4867.<br />
[17] C. Faivre, D. Bellet, G. Dol<strong>in</strong>o, Eur. Phys. J. B 1999, 7, 19.<br />
[18] J. Dore, Chem. Phys. 2000, 258, 327.<br />
[19] K. Morishige, H. Iwasaki, Langmuir 2003, 19, 2808.<br />
[20] J. S. Beck, J. C. Vartuli, W. J. Roth, M. E. Leonowicz, C. T. Kresge,<br />
K. D. Schmitt, C. T.-W. Chu, D. H. Olson, E. W. Sheppard, S. B.<br />
Mccullen, J. B. Higg<strong>in</strong>s, J. L. Schlenker, J. Am. Chem. Soc. 1992, 114,<br />
10834.<br />
[21] D. Zhao, J. Feng, Q. Huo, N. Melosh, G. H. Fredrickson, B. F.<br />
Chmelka, G. D. Stucky, Science 1998, 279, 548.<br />
[22] U. Ciesla, F. Schüth, Microporous <strong>Mesoporous</strong> Mater. 1999, 27, 131.<br />
[23] I. Shenderovich, G. Buntkowsky, A. Schreiber, E. Gedat, S. Sharif, J.<br />
Albrecht, N. S. Golubev, G. H. F<strong>in</strong>denegg, H. H. Limbach, J. Phys.<br />
Chem. B 2003, 107, 11924.<br />
[24] E. Gedat, A. Schreiber, G. F<strong>in</strong>denegg, I. Shenderovich, H.-H. Limbach,<br />
G. Buntkowsky, Magn. Reson. Chem. 2001, 39, 149.<br />
[25] E. Gedat, A. Schreiber, J. Albrecht, I. Shenderovich, G. F<strong>in</strong>denegg,<br />
H.-H. Limbach, G. Buntkowsky, J. Phys. Chem. B. 2002, 106, 1977.<br />
[26] R. Anwander, I. Nagl, M. Widenmayer, G. Engelhardt, O. Groeger,<br />
C. Palm, T. Rçser, J. Phys. Chem. B 2000, 104, 3532.<br />
[27] N. T. Whilton, B. Berton, L. Bronste<strong>in</strong>, H.-P. Hentze, M. Antonietti,<br />
Adv. Mater. 1999, 11, 1014.<br />
[28] D. W. Aknes, L. Gjerdaker, J. Mol. Struct. 1999, 27.<br />
[29] F. Courivaud, E. W. Hansen, S. Kolboe, A. Karlsson, M. Stçcker,<br />
Microporous <strong>Mesoporous</strong> Mater. 2000, 37, 223.<br />
[30] Y. B. Mel nichenko, J. Schüller, R. Richert, B. Ewen, C.-K. Loong, J.<br />
Chem. Phys. 1995, 103, 2016.<br />
[31] L. Gjerdaker, G. H. Sorland, D. W. Aknes, Microporous <strong>Mesoporous</strong><br />
Mater. 1999, 32, 305.<br />
[32] H. Jobic, Phys. Chem. Chem. Phys. 1999, 1, 525.<br />
Chem. Eur. J. 2004, 10, 5689 – 5696 www.chemeurj.org 2004 Wiley-VCH Verlag GmbH & Co. KGaA, We<strong>in</strong>heim 5695
FULL PAPER<br />
[33] V. Ladizhansky, G. Hodes, S. Vega, J. Phys. Chem. B 2000, 104,<br />
1939.<br />
[34] E. W. Hansen, R. Schmidt, M. Stçcker, D. Akporiaye, Microporous<br />
Mater. 1995, 5, 143.<br />
[35] M. Grün, K. K. Unger, A. Matsumoto, K. Tsutsumi, Charact. Porous<br />
Solids IV 1997, 81.<br />
5696<br />
G. Buntkowsky, H.-H. Limbach et al.<br />
[36] A. Schreiber, I. Ketelsen, G. H. F<strong>in</strong>denegg, Phys. Chem. Chem.<br />
Phys. 2001, 3, 1185.<br />
[37] D. Dollimore, G. R. Heal, J. Appl. Chem. 1964, 14, 109.<br />
Received: April 8, 2004<br />
Published onl<strong>in</strong>e: October 7, 2004<br />
2004 Wiley-VCH Verlag GmbH & Co. KGaA, We<strong>in</strong>heim www.chemeurj.org Chem. Eur. J. 2004, 10, 5689 – 5696