


Create successful ePaper yourself
Turn your PDF publications into a flip-book with our unique Google optimized e-Paper software.
[SECTION] 8 = MOBILE CONNECTIVITY<br />
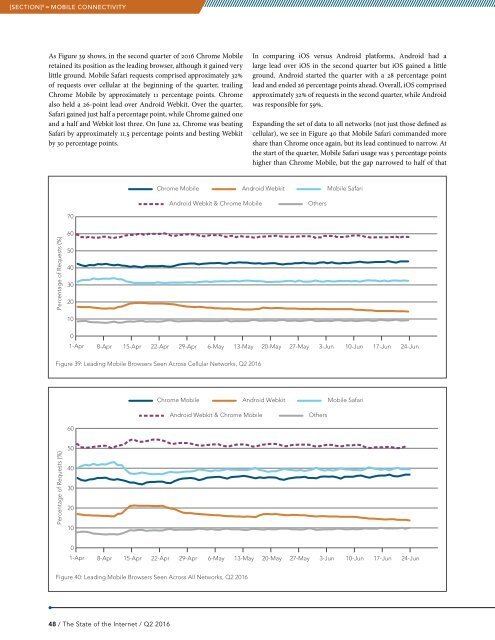
As Figure 39 shows, in the second quarter of 2016 Chrome Mobile<br />
retained its position as the leading browser, although it gained very<br />
little ground. Mobile Safari requests comprised approximately 32%<br />
of requests over cellular at the beginning of the quarter, trailing<br />
Chrome Mobile by approximately 11 percentage points. Chrome<br />
also held a 26-point lead over Android Webkit. Over the quarter,<br />
Safari gained just half a percentage point, while Chrome gained one<br />
and a half and Webkit lost three. On June 22, Chrome was beating<br />
Safari by approximately 11.5 percentage points and besting Webkit<br />
by 30 percentage points.<br />
In comparing iOS versus Android platforms, Android had a<br />
large lead over iOS in the second quarter but iOS gained a little<br />
ground. Android started the quarter with a 28 percentage point<br />
lead and ended 26 percentage points ahead. Overall, iOS comprised<br />
approximately 32% of requests in the second quarter, while Android<br />
was responsible for 59%.<br />
Expanding the set of data to all networks (not just those defined as<br />
cellular), we see in Figure 40 that Mobile Safari commanded more<br />
share than Chrome once again, but its lead continued to narrow. At<br />
the start of the quarter, Mobile Safari usage was 5 percentage points<br />
higher than Chrome Mobile, but the gap narrowed to half of that<br />
Chrome Mobile<br />
Android Webkit<br />
Mobile Safari<br />
Android Webkit & Chrome Mobile<br />
Others<br />
70<br />
Percentage of Requests (%)<br />
60<br />
50<br />
40<br />
30<br />
20<br />
10<br />
0<br />
1-Apr 8-Apr 15-Apr 22-Apr 29-Apr 6-May 13-May 20-May 27-May 3-Jun 10-Jun 17-Jun 24-Jun<br />
Figure 39: Leading Mobile Browsers Seen Across Cellular Networks, Q2 2016<br />
Chrome Mobile Android Webkit Mobile Safari<br />
Android Webkit & Chrome Mobile<br />
Others<br />
60<br />
Percentage of Requests (%)<br />
50<br />
40<br />
30<br />
20<br />
10<br />
0<br />
1-Apr 8-Apr 15-Apr 22-Apr 29-Apr 6-May 13-May 20-May 27-May 3-Jun 10-Jun 17-Jun 24-Jun<br />
Figure 40: Leading Mobile Browsers Seen Across All Networks, Q2 2016<br />
48 / The State of the Internet / Q2 2016