

World Energy Scenarios
b9Sz9NC
b9Sz9NC

You also want an ePaper? Increase the reach of your titles
YUMPU automatically turns print PDFs into web optimized ePapers that Google loves.
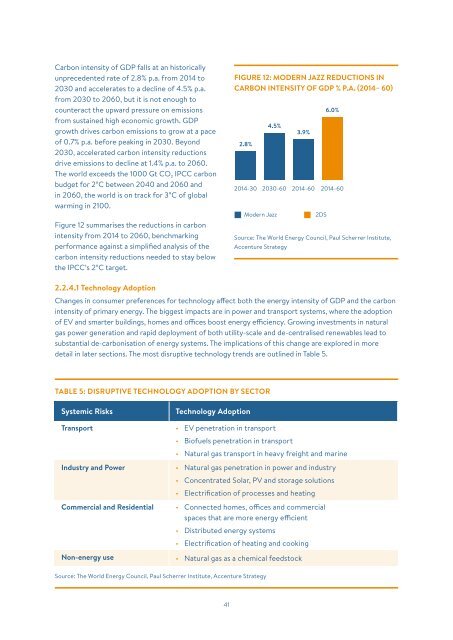
Carbon intensity of GDP falls at an historically<br />
unprecedented rate of 2.8% p.a. from 2014 to<br />
2030 and accelerates to a decline of 4.5% p.a.<br />
from 2030 to 2060, but it is not enough to<br />
counteract the upward pressure on emissions<br />
from sustained high economic growth. GDP<br />
growth drives carbon emissions to grow at a pace<br />
of 0.7% p.a. before peaking in 2030. Beyond<br />
2030, accelerated carbon intensity reductions<br />
drive emissions to decline at 1.4% p.a. to 2060.<br />
The world exceeds the 1000 Gt CO₂ IPCC carbon<br />
budget for 2°C between 2040 and 2060 and<br />
in 2060, the world is on track for 3°C of global<br />
warming in 2100.<br />
Figure 12 summarises the reductions in carbon<br />
intensity from 2014 to 2060, benchmarking<br />
performance against a simplified analysis of the<br />
carbon intensity reductions needed to stay below<br />
the IPCC’s 2°C target.<br />
Figure 12: Modern Jazz Reductions<br />
in FIGURE Carbon 12: MODERN Intensity JAZZ of GDP REDUCTIONS % p.a. IN<br />
(2014 CARBON – 2060) INTENSITY OF GDP % P.A. (2014– 60)<br />
6.0%<br />
4.5%<br />
3.9%<br />
2.8%<br />
2014-30 2030-60 2014-60 2014-60<br />
Modern Jazz<br />
2DS<br />
Source: <strong>World</strong> <strong>Energy</strong> Council, Paul Scherrer Institute,<br />
Source: Accenture The Strategy <strong>World</strong> <strong>Energy</strong> Analysis Council, Paul Scherrer Institute,<br />
Accenture Strategy<br />
2.2.4.1 Technology Adoption<br />
Changes in consumer preferences for technology affect both the energy intensity of GDP and the carbon<br />
intensity of primary energy. The biggest impacts are in power and transport systems, where the adoption<br />
of EV and smarter buildings, homes and offices boost energy efficiency. Growing investments in natural<br />
gas power generation and rapid deployment of both utility-scale and de-centralised renewables lead to<br />
substantial de-carbonisation of energy systems. The implications of this change are explored in more<br />
detail in later sections. The most disruptive technology trends are outlined in Table 5.<br />
TABLE 5: DISRUPTIVE TECHNOLOGY ADOPTION BY SECTOR<br />
Systemic Risks<br />
Technology Adoption<br />
Transport • EV penetration in transport<br />
• Biofuels penetration in transport<br />
• Natural gas transport in heavy freight and marine<br />
Industry and Power • Natural gas penetration in power and industry<br />
• Concentrated Solar, PV and storage solutions<br />
• Electrification of processes and heating<br />
Commercial and Residential • Connected homes, offices and commercial<br />
spaces that are more energy efficient<br />
• Distributed energy systems<br />
• Electrification of heating and cooking<br />
Non-energy use • Natural gas as a chemical feedstock<br />
Source: The <strong>World</strong> <strong>Energy</strong> Council, Paul Scherrer Institute, Accenture Strategy<br />
41