- Page 1 and 2: 5tatistis4.sentltalbyra $ tatistis
- Page 3 and 4: I Statistisk sentralbyrà WStatisti
- Page 6: Contents List of tables and figures
- Page 9 and 10: Table/figure Page Table/figure Page
- Page 11 and 12: 219 Table/figure Page Table/figure
- Page 13 and 14: Table/figure Page Table/figure Page
- Page 15 and 16: Table/figure Page Table/figure Page
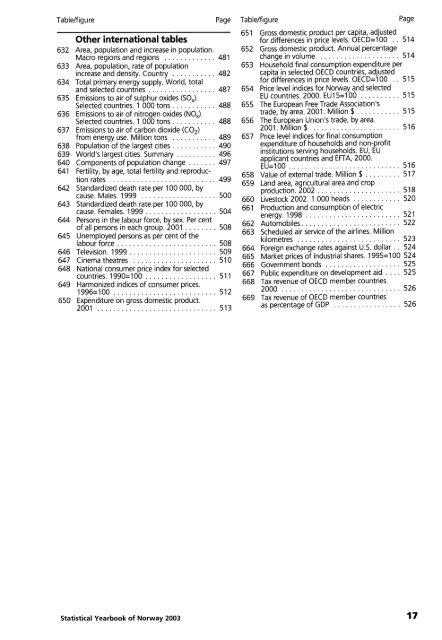
- Page 17: 463 Table/figure Page Table/figure
- Page 21 and 22: Largest islands I-linnøya (Nord/an
- Page 23 and 24: 0 Kviføya 4 verde Tromse Bode Reli
- Page 25 and 26: Settlement The map shows populated
- Page 27: County divisions in Norway The map
- Page 30 and 31: General subjects 2 General civil, e
- Page 32 and 33: - General subjects 5 Storting elect
- Page 34 and 35: General subjects 7 Storting Electio
- Page 36 and 37: 9 1991 1995 1999 General subjects M
- Page 38 and 39: General subjects 1 2 Municipal coun
- Page 40 and 41: General subjects 14 County council
- Page 42 and 43: 16 General subjects The 1972 Refere
- Page 44: General subjects 1 9 Most popular n
- Page 48 and 49: 8829 Environment 21 Total area, dis
- Page 50 and 51: Environment 23 Precipitation Statio
- Page 52 and 53: 25 Environment Petroleum resources
- Page 54 and 55: -8773 28 Direct use of energy goods
- Page 56 and 57: Environment 33 Emissions to air1 19
- Page 58 and 59: Environ ment 36 Emissions to air of
- Page 60 and 61: Environment 38 Emis5ions to air Car
- Page 62 and 63: 41 19921,2 19952 19962 19972 1998 1
- Page 64 and 65: ¿fi s ': : q 'I db 4LtJ .:.; . 'ir
- Page 66 and 67: 46 Population as of 1 January, birt
- Page 68 and 69:
i Population 47 Population and incr
- Page 70 and 71:
Population 51 Urban settlements wit
- Page 72 and 73:
Population 52 (cont.). Population a
- Page 74 and 75:
Population 52 (cont.). Population a
- Page 76 and 77:
Population 52 (cont.). Population a
- Page 78 and 79:
Population 52 (cont.). Population a
- Page 80 and 81:
Population 53 (cont.). Population,
- Page 82 and 83:
Population 55 Population, by sex, a
- Page 84 and 85:
Population 58 Families, by type of
- Page 86 and 87:
. Biologi- 62 Age of child Children
- Page 88 and 89:
Population 64 Components of populat
- Page 90 and 91:
799 Population 66 Components of pop
- Page 92 and 93:
Population 69 Total fertility rate'
- Page 94 and 95:
Population 72 Adopted persons Total
- Page 96 and 97:
Population 76 Life expectancy Sex Y
- Page 98 and 99:
. . . Population 79 InternaI migrat
- Page 100 and 101:
Population 82 Net migration1, by co
- Page 102 and 103:
Population Foreign citizens, by sex
- Page 104 and 105:
86 Population The immigrant populat
- Page 106 and 107:
390 Population 88 Asylum-seekers1,
- Page 108 and 109:
Population 91 Marriages contracted
- Page 110 and 111:
Population 95 Registered partnershi
- Page 112:
Population 1 00 Population, by age
- Page 116 and 117:
1 03 Percentage daily smokers, by s
- Page 118 and 119:
Health and social conditions 1 06 P
- Page 120 and 121:
1 08 Deaths, by age and cause of de
- Page 122 and 123:
1 09 Infant deaths, by age interval
- Page 124 and 125:
I I 2 Health and social conditions
- Page 126 and 127:
1 1 4 Health and social conditions
- Page 128 and 129:
Health and social conditions 115 (c
- Page 130 and 131:
I l 9 Health and social conditions
- Page 132 and 133:
Health and social conditions 1 24 N
- Page 134 and 135:
348 1 29 Reported injuries, by sex
- Page 136 and 137:
Health and social conditions -Physi
- Page 138 and 139:
I 36 Type of institution Health and
- Page 140 and 141:
Health and social conditions I40 Di
- Page 142 and 143:
Health and social conditions 141 Ch
- Page 144 and 145:
Health and social conditions 1 4 Be
- Page 146 and 147:
Health and social conditions Number
- Page 148 and 149:
Health and social conditions 1 51 U
- Page 150 and 151:
I 55 Health and social conditions N
- Page 152 and 153:
I 59 Health and social conditions O
- Page 154 and 155:
434 1 61 Offences reported to the p
- Page 156 and 157:
Health and social conditions 1 62 O
- Page 158 and 159:
Type Df offence Health and social c
- Page 160 and 161:
2813 . I 55 Health and social condi
- Page 162 and 163:
4 Health and social conditions 1 67
- Page 164 and 165:
Health and social conditions 16? (c
- Page 166 and 167:
Health and social conditions 163 (c
- Page 169 and 170:
Education 1 71 Highest education co
- Page 171 and 172:
27216 31893 19375 30099 Education 1
- Page 173 and 174:
Education I77 Pupils and students b
- Page 175 and 176:
Education 1 81 Children 1-5 years o
- Page 177 and 178:
Education I 84. Transition from low
- Page 179 and 180:
Education 1 88 Students at the univ
- Page 181 and 182:
Education 1 92 Students, by sex, ty
- Page 183 and 184:
Education 95 Adult education organi
- Page 185 and 186:
Education I 98 Field of science Sec
- Page 189 and 190:
Personal economy and housing condit
- Page 191 and 192:
Personal economy and housing condit
- Page 193 and 194:
Personal economy and housing condit
- Page 195 and 196:
Personal economy and housing condit
- Page 197 and 198:
Personal economy and housing condit
- Page 199 and 200:
Personal economy and housing condit
- Page 201 and 202:
Personal economy and housing condit
- Page 203 and 204:
Personal economy and housing condit
- Page 205 and 206:
223 Personal economy and housing co
- Page 207 and 208:
Personal economy and housing condit
- Page 209 and 210:
Personal economy and housing condit
- Page 211 and 212:
Labour market 2 32 Socio-economic g
- Page 213 and 214:
Labour market 236 Labour force part
- Page 215 and 216:
Labour market 41 Employed persons,
- Page 217 and 218:
Labour market 2 44 Persons 16-74 ye
- Page 219 and 220:
Labour market 247 Wage earners', by
- Page 221 and 222:
Labour market 251 Unemployed person
- Page 223 and 224:
Labour market 255 Work stoppages1 1
- Page 225 and 226:
Labour market 259 1999 Index on ave
- Page 227 and 228:
Labour market 260 (cont.). Full-tim
- Page 229 and 230:
Labour market 2 64 Occupational gro
- Page 231 and 232:
Labour market 2 69 Service and occu
- Page 233 and 234:
Recreational, cultural and sporting
- Page 235 and 236:
Recreational, cultural and sporting
- Page 237 and 238:
Recreational, cultural and sporting
- Page 239 and 240:
Recreational, cultural and sporting
- Page 241 and 242:
Recreational, cultural and sporting
- Page 245 and 246:
Prices and indices 289 Prices on el
- Page 247 and 248:
Prices and indices 292 Prices recei
- Page 249 and 250:
Prices and indices 295 Consumer pri
- Page 251 and 252:
Prices and indices 297 (cont.). Con
- Page 253 and 254:
Prices and indices 3 01 Price index
- Page 255 and 256:
105.84 Prices and indices 303 Produ
- Page 257 and 258:
Prices and indices 305 Price index
- Page 259 and 260:
Prices and indices 307 (cont.). Com
- Page 261 and 262:
Prices and indices 308 (cont.). Com
- Page 263 and 264:
Prices and indices 311 Construction
- Page 265 and 266:
Prices and indices 314 Price index
- Page 267 and 268:
Prices and indices 31 7 Index numbe
- Page 269 and 270:
Prices and indices 3 1 9 Industrial
- Page 271 and 272:
Prices and indices 3 21 Monthly ind
- Page 273 and 274:
Prices and indices 3 23 Statistics
- Page 275 and 276:
National economy and external trade
- Page 277 and 278:
National economy and external trade
- Page 279 and 280:
39.3 National economy and external
- Page 281 and 282:
National economy and external trade
- Page 283 and 284:
National economy and external trade
- Page 285 and 286:
National economy and external trade
- Page 287 and 288:
National economy and external trade
- Page 289 and 290:
National economy and external trade
- Page 291 and 292:
National economy and external trade
- Page 293 and 294:
National economy and external trade
- Page 295 and 296:
National economy and external trade
- Page 297 and 298:
National economy and external trade
- Page 299 and 300:
National economy and external trade
- Page 301 and 302:
National economy and external trade
- Page 303 and 304:
National economy and external trade
- Page 305 and 306:
155 National economy and external t
- Page 307 and 308:
National economy and external trade
- Page 309 and 310:
J National economy and external tra
- Page 311 and 312:
National economy and external trade
- Page 313 and 314:
National economy and external trade
- Page 315 and 316:
National economy and external trade
- Page 317 and 318:
National economy and external trade
- Page 319 and 320:
National economy and external trade
- Page 321 and 322:
National economy and external trade
- Page 323 and 324:
National economy and external trade
- Page 325 and 326:
2421 Industrial activities 368 Esta
- Page 327 and 328:
Industrial activities 3 71 Selected
- Page 329 and 330:
Industrial activities 3 74 Number o
- Page 331 and 332:
Agriculture, hunting and forestry 3
- Page 333 and 334:
Agriculture, hunting and forestry 3
- Page 335 and 336:
Agriculture, hunting and forestry 3
- Page 337 and 338:
Agriculture, hunting and forestry 3
- Page 339 and 340:
Agriculture, hunting and forestry 3
- Page 341 and 342:
Agriculture, hunting and forestry 3
- Page 343 and 344:
Agriculture, hunting and forestry 4
- Page 345 and 346:
Agriculture, hunting and forestry 4
- Page 347 and 348:
34350 Agriculture, hunting and fore
- Page 349 and 350:
Agriculture, hunting and forestry 4
- Page 351 and 352:
Fishing, sealing and whaling 41 5 Q
- Page 353 and 354:
Fishing, sealing and whaling 41 7 Q
- Page 355 and 356:
Fishing, sealing and whaling 421 Sm
- Page 357 and 358:
Fishing, sealing and whaling 425 Fi
- Page 359 and 360:
Oil extraction, mining, quarrying a
- Page 361 and 362:
Oil extraction, mining, quarrying a
- Page 363 and 364:
Oil extraction, mining, quarrying a
- Page 365 and 366:
Oil extraction, mining, quarrying a
- Page 367 and 368:
Oil extraction, mining, quarrying a
- Page 369 and 370:
Oil extraction, mining, quarrying a
- Page 371 and 372:
Oil extraction, mining, quarrying a
- Page 373 and 374:
Building and construction statistic
- Page 375 and 376:
Building and construction statistic
- Page 377 and 378:
Retail trade 462 Wholesale and reta
- Page 379 and 380:
Retail trade 465 Wholesale and reta
- Page 381 and 382:
Hotels and restaurants 4 69 Hotels
- Page 383 and 384:
Hotels and restaurants 473 Holiday
- Page 385 and 386:
Transport and communication 476 Imp
- Page 387 and 388:
Transport and communication 478 Dom
- Page 389 and 390:
Transport and communication 48 1 No
- Page 391 and 392:
Transport and communication 483 New
- Page 393 and 394:
Transport and communication 187 Roa
- Page 395 and 396:
4814 Transport and communication 49
- Page 397 and 398:
Transport and communication 493 Age
- Page 399 and 400:
Transport and communication 497 Roa
- Page 401 and 402:
Transport and communication 5 00 Ve
- Page 403 and 404:
Transport and communication 505 Ves
- Page 405 and 406:
Transport and communication 510 Ves
- Page 407 and 408:
.. Transport and communication 5 1
- Page 409 and 410:
Transport and communication 51 6 Tr
- Page 411 and 412:
Transport and communication 51 9 Te
- Page 413 and 414:
Transport and communication 5 24 Po
- Page 415 and 416:
Transport and communication S 27 Su
- Page 417 and 418:
Financial intermediation 529 Main f
- Page 419 and 420:
Financial intermediation 5 32 Borro
- Page 421 and 422:
Financial intermediation Commercial
- Page 423 and 424:
Financial intermediation 539 State
- Page 425 and 426:
Financial intermediation 543 Financ
- Page 427 and 428:
Financial intermediation 5 47 Secur
- Page 429 and 430:
Financial intermediation 550 Life i
- Page 431 and 432:
Financial intermediation 553 Non-li
- Page 433 and 434:
Real estate and other service activ
- Page 435 and 436:
Real estate and other service activ
- Page 437:
Real estate and other service activ
- Page 440 and 441:
S 66 Financial markets Issues of bo
- Page 442:
Financial markets 572 Bankruptcy pr
- Page 446 and 447:
Public sector 575 GeneraI governmen
- Page 448 and 449:
Public sector 577 Local government.
- Page 450 and 451:
Public sector 580 Central governmen
- Page 452 and 453:
3830 Public sector 584 Central gove
- Page 454 and 455:
5 88 Public sector Public expenditu
- Page 456 and 457:
Public sector 592 Survey of tax ass
- Page 458 and 459:
Public sector 595 Tax accounts. Dis
- Page 460 and 461:
597 Public sector Municipal and cou
- Page 462 and 463:
Svalbard 6 00 Election for the Coun
- Page 464 and 465:
Svalbard 602 Persons ¡n settlement
- Page 466 and 467:
6 07 1Work including main thesis an
- Page 468 and 469:
Sva Iba rd 611 Employed persons 16-
- Page 470 and 471:
Svalbard 61 5 Aviation. Passengers
- Page 472 and 473:
Nordic countries 61 9 Population, b
- Page 474 and 475:
.. Nordic countries 621 Life expect
- Page 476 and 477:
Nordic countries 625 Employed aged
- Page 478 and 479:
, 448 628 (cont.). Exports from the
- Page 480 and 481:
Nordic countries O_ Social security
- Page 482 and 483:
Other international tables 632 Area
- Page 484 and 485:
Other international tables 633 (con
- Page 486 and 487:
Other international tables 633 (con
- Page 488 and 489:
Other international tables 634 Tota
- Page 490 and 491:
Other international tables 637 Emis
- Page 492 and 493:
Other international tables 638 (con
- Page 494 and 495:
01.05.90 Other internationaTtabIe '
- Page 496 and 497:
Other international tables 638 (con
- Page 498 and 499:
Other international tables 640 Comp
- Page 500 and 501:
IFertility, by age, total fertility
- Page 502 and 503:
9.3 Other international tables 642
- Page 504 and 505:
Other international tables 642 (con
- Page 506 and 507:
Other international tables 643 (can
- Page 508 and 509:
Other international tables 643 (con
- Page 510 and 511:
Other international tables 646 Tele
- Page 512 and 513:
Other international tables 648 Nati
- Page 514 and 515:
649 (cont.). Harmonized indices of
- Page 516 and 517:
653 Source: National Accounts of OE
- Page 518 and 519:
' Other international tables 658 Va
- Page 520 and 521:
Other international tables Agricult
- Page 522 and 523:
30989 661 Production and consumptio
- Page 524 and 525:
Other international tables 663 Sche
- Page 526 and 527:
Other international tables 666 Gove
- Page 528 and 529:
Numbers relate to table number Inde
- Page 530 and 531:
Numbers relate to table number Hens
- Page 532:
Numbers relate to table number Sewa
- Page 536:
Topics 1995 The topic classificatio
- Page 539:
ISBN 825376389 II: 9 788253 763897