

Discussion Paper Series Social Media Use and Children’s Wellbeing
dp10412
dp10412

You also want an ePaper? Increase the reach of your titles
YUMPU automatically turns print PDFs into web optimized ePapers that Google loves.
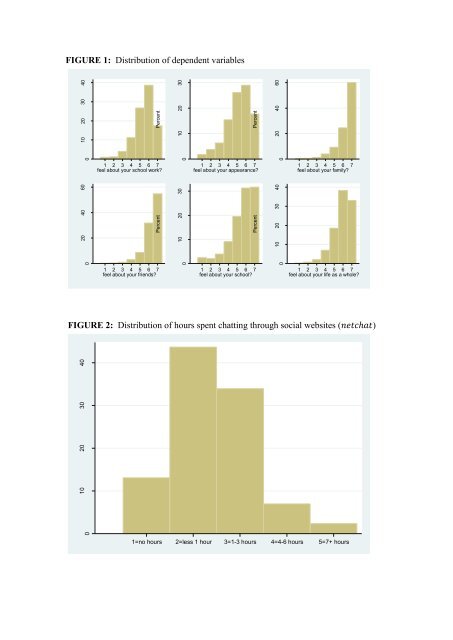
FIGURE 1: Distribution of dependent variables<br />
Percent<br />
10 20 30 40<br />
Percent<br />
10 20 30<br />
Percent<br />
20 40 60<br />
0<br />
1 2 3 4 5 6 7<br />
feel about your school work?<br />
0<br />
1 2 3 4 5 6 7<br />
feel about your appearance?<br />
0<br />
1 2 3 4 5 6 7<br />
feel about your family?<br />
Percent<br />
20 40 60<br />
Percent<br />
10 20 30<br />
Percent<br />
10 20 30 40<br />
0<br />
1 2 3 4 5 6 7<br />
feel about your friends?<br />
0<br />
1 2 3 4 5 6 7<br />
feel about your school?<br />
0<br />
1 2 3 4 5 6 7<br />
feel about your life as a whole?<br />
FIGURE 2: Distribution of hours spent chatting through social websites (netchat)<br />
Percent<br />
10 20 30 40<br />
0<br />
1=no hours 2=less 1 hour 3=1-3 hours 4=4-6 hours 5=7+ hours