

Discussion Paper Series Social Media Use and Children’s Wellbeing
dp10412
dp10412

You also want an ePaper? Increase the reach of your titles
YUMPU automatically turns print PDFs into web optimized ePapers that Google loves.
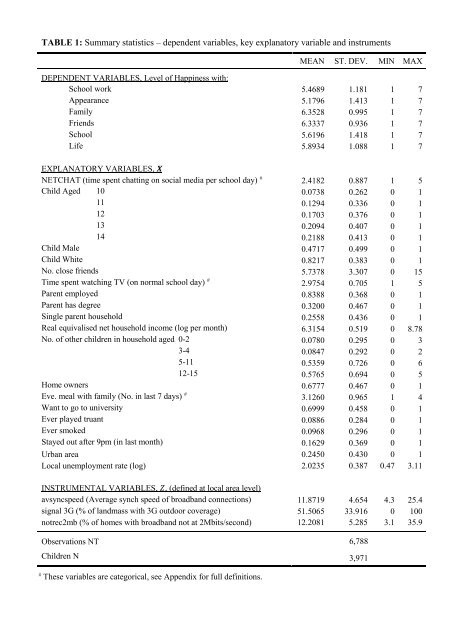
TABLE 1: Summary statistics – dependent variables, key explanatory variable <strong>and</strong> instruments<br />
MEAN ST. DEV. MIN MAX<br />
DEPENDENT VARIABLES, Level of Happiness with:<br />
School work 5.4689 1.181 1 7<br />
Appearance 5.1796 1.413 1 7<br />
Family 6.3528 0.995 1 7<br />
Friends 6.3337 0.936 1 7<br />
School 5.6196 1.418 1 7<br />
Life 5.8934 1.088 1 7<br />
EXPLANATORY VARIABLES, X<br />
NETCHAT (time spent chatting on social media per school day) # 2.4182 0.887 1 5<br />
Child Aged 10 0.0738 0.262 0 1<br />
11 0.1294 0.336 0 1<br />
12 0.1703 0.376 0 1<br />
13 0.2094 0.407 0 1<br />
14 0.2188 0.413 0 1<br />
Child Male 0.4717 0.499 0 1<br />
Child White 0.8217 0.383 0 1<br />
No. close friends 5.7378 3.307 0 15<br />
Time spent watching TV (on normal school day) # 2.9754 0.705 1 5<br />
Parent employed 0.8388 0.368 0 1<br />
Parent has degree 0.3200 0.467 0 1<br />
Single parent household 0.2558 0.436 0 1<br />
Real equivalised net household income (log per month) 6.3154 0.519 0 8.78<br />
No. of other children in household aged 0-2 0.0780 0.295 0 3<br />
3-4 0.0847 0.292 0 2<br />
5-11 0.5359 0.726 0 6<br />
12-15 0.5765 0.694 0 5<br />
Home owners 0.6777 0.467 0 1<br />
Eve. meal with family (No. in last 7 days) # 3.1260 0.965 1 4<br />
Want to go to university 0.6999 0.458 0 1<br />
Ever played truant 0.0886 0.284 0 1<br />
Ever smoked 0.0968 0.296 0 1<br />
Stayed out after 9pm (in last month) 0.1629 0.369 0 1<br />
Urban area 0.2450 0.430 0 1<br />
Local unemployment rate (log) 2.0235 0.387 0.47 3.11<br />
INSTRUMENTAL VARIABLES, Z, (defined at local area level)<br />
avsyncspeed (Average synch speed of broadb<strong>and</strong> connections) 11.8719 4.654 4.3 25.4<br />
signal 3G (% of l<strong>and</strong>mass with 3G outdoor coverage) 51.5065 33.916 0 100<br />
notrec2mb (% of homes with broadb<strong>and</strong> not at 2Mbits/second) 12.2081 5.285 3.1 35.9<br />
Observations NT 6,788<br />
Children N 3,971<br />
#<br />
These variables are categorical, see Appendix for full definitions.