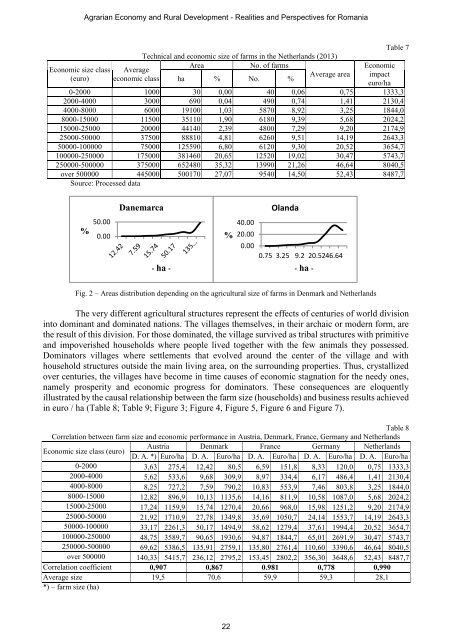
Agrarian Economy and Rural Development - Realities and Perspectives for Romania Economic size class (euro) Average economic class Technical and economic size of farms in the Netherlands (2013) Area No. of farms Average area ha % No. % Economic impact euro/ha Table 7 0-2000 1000 30 0,00 40 0,06 0,75 1333,3 2000-4000 3000 690 0,04 490 0,74 1,41 2130,4 4000-8000 6000 19100 1,03 5870 8,92 3,25 1844,0 8000-15000 11500 35110 1,90 6180 9,39 5,68 2024,2 15000-25000 20000 44140 2,39 4800 7,29 9,20 2174,9 25000-50000 37500 88810 4,81 6260 9,51 14,19 2643,3 50000-100000 75000 125590 6,80 6120 9,30 20,52 3654,7 100000-250000 175000 381460 20,65 12520 19,02 30,47 5743,7 250000-500000 375000 652480 35,32 13990 21,26 46,64 8040,5 over 500000 445000 500170 27,07 9540 14,50 52,43 8487,7 Source: Processed data Danemarca Olanda % 50.00 0.00 % 40.00 20.00 0.00 0.75 3.25 9.2 20.5246.64 - ha - - ha - Fig. 2 – Areas distribution depending on the agricultural size of farms in Denmark and Netherlands The very different agricultural structures represent the effects of centuries of world division into dominant and dominated nations. The villages themselves, in their archaic or modern form, are the result of this division. For those dominated, the village survived as tribal structures with primitive and impoverished households where people lived together with the few animals they possessed. Dominators villages where settlements that evolved around the center of the village and with household structures outside the main living area, on the surrounding properties. Thus, crystallized over centuries, the villages have become in time causes of economic stagnation for the needy ones, namely prosperity and economic progress for dominators. These consequences are eloquently illustrated by the causal relationship between the farm size (households) and business results achieved in euro / ha (Table 8; Table 9; Figure 3; Figure 4, Figure 5, Figure 6 and Figure 7). Table 8 Correlation between farm size and economic performance in Austria, Denmark, France, Germany and Netherlands Economic size class (euro) Austria Denmark France Germany Netherlands D. A. *) Euro/ha D. A. Euro/ha D. A. Euro/ha D. A. Euro/ha D. A. Euro/ha 0-2000 3,63 275,4 12,42 80,5 6,59 151,8 8,33 120,0 0,75 1333,3 2000-4000 5,62 533,6 9,68 309,9 8,97 334,4 6,17 486,4 1,41 2130,4 4000-8000 8,25 727,2 7,59 790,2 10,83 553,9 7,46 803,8 3,25 1844,0 8000-15000 12,82 896,9 10,13 1135,6 14,16 811,9 10,58 1087,0 5,68 2024,2 15000-25000 17,24 1159,9 15,74 1270,4 20,66 968,0 15,98 1251,2 9,20 2174,9 25000-50000 21,92 1710,9 27,78 1349,8 35,69 1050,7 24,14 1553,7 14,19 2643,3 50000-100000 33,17 2261,3 50,17 1494,9 58,62 1279,4 37,61 1994,4 20,52 3654,7 100000-250000 48,75 3589,7 90,65 1930,6 94,87 1844,7 65,01 2691,9 30,47 5743,7 250000-500000 69,62 5386,5 135,91 2759,1 135,80 2761,4 110,60 3390,6 46,64 8040,5 over 500000 140,33 5415,7 236,12 2795,2 153,45 2802,2 356,30 3648,6 52,43 8487,7 Correlation coefficient 0,907 0,867 0.981 0,778 0,990 Average size 19,5 70,6 59,9 59,3 28,1 *) – farm size (ha) 22
Agrarian Economy and Rural Development - Realities and Perspectives for Romania Table 9 Correlation between farm size and economic performance in Bulgaria, Czech Republic, Poland, Romania and Hungary Economic size class (euro) Bulgaria Czech Republic Poland Romania Hungary D. A. *) Euro/ha D. A. Euro/ha D. A. Euro/ha D. A. Euro/ha D. A. Euro/ha 0-2000 0,62 1612,6 3,94 254,1 1,98 506,2 0,83 1198,4 0,46 2193,2 2000-4000 1,53 1962,7 6,08 493,0 3,54 847,5 2,33 1284,9 2,21 1359,5 4000-8000 3,61 1662,4 7,62 787,2 6,00 999,7 3,72 1612,8 5,19 1155,1 8000-15000 9,06 1268,8 13,77 834,9 9,69 1186,7 7,14 1609,9 10,65 1080,2 15000-25000 19,92 1003,9 24,17 827,4 14,00 1428,5 14,13 1415,3 19,85 1007,4 25000-50000 39,99 937,8 44,51 842,5 21,90 1712,2 36,38 1030,8 37,54 998,9 50000-100000 104,04 720,9 79,57 942,5 39,68 1890,2 113,10 663,1 79,31 945,6 100000-250000 288,31 607,0 181,74 962,9 76,77 2279,7 302,04 579,4 179,54 974,7 250000-500000 779,27 481,2 418,17 896,8 170,50 2199,4 682,86 549,2 369,24 1015,6 over 500000 1692,96 472,5 1633,57 918,2 541,00 2218,1 1681,26 550,2 1229,17 1016,9 Correlation coefficient -0,629 0,322 0,583 -0,643 -0,244 Average size 18,9 154,1 10,3 3,6 10,6 *) – farm size (ha) Fig. 3 – Size impact on the economic effect in Romania and Austria Fig. 4 – Size impact on the economic effect in Bulgaria and Denmark Fig. 5 – Size impact on the economic effect in Hungary and the Netherlands Fig. 6 – Size impact on the economic effect in Czech Republic and France 23
- Page 1: MPRA Munich Personal RePEc Archive
- Page 4 and 5: Copyright @ 2016, Research Institut
- Page 6 and 7: SCIENTIFIC COMMITTEE President: ALE
- Page 9 and 10: CONTENTS SECTION 1 “THE CONCEPTS,
- Page 11 and 12: Alin-Angelin IORGA „Legal regleme
- Page 13 and 14: Agrarian Economy and Rural Developm
- Page 15 and 16: Agrarian Economy and Rural Developm
- Page 17 and 18: Agrarian Economy and Rural Developm
- Page 19 and 20: Agrarian Economy and Rural Developm
- Page 21 and 22: Agrarian Economy and Rural Developm
- Page 23 and 24: Agrarian Economy and Rural Developm
- Page 25 and 26: Agrarian Economy and Rural Developm
- Page 27 and 28: Agrarian Economy and Rural Developm
- Page 29 and 30: Agrarian Economy and Rural Developm
- Page 31 and 32: Agrarian Economy and Rural Developm
- Page 33: Agrarian Economy and Rural Developm
- Page 37 and 38: Agrarian Economy and Rural Developm
- Page 39 and 40: Agrarian Economy and Rural Developm
- Page 41 and 42: Agrarian Economy and Rural Developm
- Page 43 and 44: Agrarian Economy and Rural Developm
- Page 45 and 46: Agrarian Economy and Rural Developm
- Page 47 and 48: Agrarian Economy and Rural Developm
- Page 49 and 50: Agrarian Economy and Rural Developm
- Page 51 and 52: Agrarian Economy and Rural Developm
- Page 53 and 54: Italy Bulgaria Hungary Netherlands
- Page 55 and 56: 2002 2003 2004 2005 2006 2007 2008
- Page 57 and 58: Agrarian Economy and Rural Developm
- Page 59 and 60: Agrarian Economy and Rural Developm
- Page 61 and 62: Agrarian Economy and Rural Developm
- Page 63 and 64: Agrarian Economy and Rural Developm
- Page 65 and 66: Agrarian Economy and Rural Developm
- Page 67 and 68: Agrarian Economy and Rural Developm
- Page 69 and 70: Agrarian Economy and Rural Developm
- Page 71 and 72: Agrarian Economy and Rural Developm
- Page 73 and 74: Agrarian Economy and Rural Developm
- Page 75 and 76: Agrarian Economy and Rural Developm
- Page 77 and 78: Agrarian Economy and Rural Developm
- Page 79 and 80: Agrarian Economy and Rural Developm
- Page 81 and 82: Agrarian Economy and Rural Developm
- Page 83 and 84: Agrarian Economy and Rural Developm
- Page 85 and 86:
Agrarian Economy and Rural Developm
- Page 87 and 88:
Agrarian Economy and Rural Developm
- Page 89 and 90:
Agrarian Economy and Rural Developm
- Page 91 and 92:
Agrarian Economy and Rural Developm
- Page 93 and 94:
Agrarian Economy and Rural Developm
- Page 95 and 96:
Agrarian Economy and Rural Developm
- Page 97 and 98:
Agrarian Economy and Rural Developm
- Page 99 and 100:
Agrarian Economy and Rural Developm
- Page 101 and 102:
Agrarian Economy and Rural Developm
- Page 103 and 104:
Agrarian Economy and Rural Developm
- Page 105 and 106:
Agrarian Economy and Rural Developm
- Page 107 and 108:
Agrarian Economy and Rural Developm
- Page 109 and 110:
Agrarian Economy and Rural Developm
- Page 111 and 112:
Agrarian Economy and Rural Developm
- Page 113 and 114:
Agrarian Economy and Rural Developm
- Page 115 and 116:
Agrarian Economy and Rural Developm
- Page 117 and 118:
Agrarian Economy and Rural Developm
- Page 119 and 120:
Agrarian Economy and Rural Developm
- Page 121 and 122:
Agrarian Economy and Rural Developm
- Page 123 and 124:
Agrarian Economy and Rural Developm
- Page 125 and 126:
Agrarian Economy and Rural Developm
- Page 127 and 128:
Agrarian Economy and Rural Developm
- Page 129 and 130:
Agrarian Economy and Rural Developm
- Page 131 and 132:
Agrarian Economy and Rural Developm
- Page 133 and 134:
Agrarian Economy and Rural Developm
- Page 135 and 136:
Agrarian Economy and Rural Developm
- Page 137 and 138:
Agrarian Economy and Rural Developm
- Page 139 and 140:
Agrarian Economy and Rural Developm
- Page 141 and 142:
Agrarian Economy and Rural Developm
- Page 143 and 144:
Agrarian Economy and Rural Developm
- Page 145 and 146:
Agrarian Economy and Rural Developm
- Page 147 and 148:
Agrarian Economy and Rural Developm
- Page 149 and 150:
Agrarian Economy and Rural Developm
- Page 151 and 152:
Agrarian Economy and Rural Developm
- Page 153 and 154:
Agrarian Economy and Rural Developm
- Page 155 and 156:
Agrarian Economy and Rural Developm
- Page 157 and 158:
Agrarian Economy and Rural Developm
- Page 159 and 160:
Agrarian Economy and Rural Developm
- Page 161 and 162:
Agrarian Economy and Rural Developm
- Page 163 and 164:
Agrarian Economy and Rural Developm
- Page 165 and 166:
Agrarian Economy and Rural Developm
- Page 167 and 168:
Agrarian Economy and Rural Developm
- Page 169 and 170:
Agrarian Economy and Rural Developm
- Page 171 and 172:
Agrarian Economy and Rural Developm
- Page 173 and 174:
Agrarian Economy and Rural Developm
- Page 175 and 176:
Agrarian Economy and Rural Developm
- Page 177 and 178:
Agrarian Economy and Rural Developm
- Page 179 and 180:
Agrarian Economy and Rural Developm
- Page 181 and 182:
Agrarian Economy and Rural Developm
- Page 183 and 184:
Agrarian Economy and Rural Developm
- Page 185 and 186:
Agrarian Economy and Rural Developm
- Page 187 and 188:
RESULTS AND DISCUSSIONS According t
- Page 189 and 190:
Table 4. Comparative situation rega
- Page 191 and 192:
Other important areas are cultivate
- Page 193 and 194:
early varieties, with a smaller veg
- Page 195 and 196:
Agrarian Economy and Rural Developm
- Page 197 and 198:
Agrarian Economy and Rural Developm
- Page 199 and 200:
Agrarian Economy and Rural Developm
- Page 201 and 202:
MATERIAL AND METHOD Livestock farmi
- Page 203 and 204:
Luxembourg 205 185 199 188 Malta 19
- Page 205 and 206:
Luxembourg Bulgaria 1,828 2,101 1,4
- Page 207 and 208:
CONCLUSIONS The analysis has shown
- Page 209 and 210:
Agrarian Economy and Rural Developm
- Page 211 and 212:
Agrarian Economy and Rural Developm
- Page 213 and 214:
Agrarian Economy and Rural Developm
- Page 215 and 216:
Agrarian Economy and Rural Developm
- Page 217 and 218:
DEMAND AND SUPPLY OF MILK (THOUSNAD
- Page 219 and 220:
Agrarian Economy and Rural Developm
- Page 221 and 222:
Agrarian Economy and Rural Developm
- Page 223 and 224:
Agrarian Economy and Rural Developm
- Page 225 and 226:
Agrarian Economy and Rural Developm
- Page 227 and 228:
Agrarian Economy and Rural Developm
- Page 229 and 230:
Agrarian Economy and Rural Developm
- Page 231 and 232:
Agrarian Economy and Rural Developm
- Page 233 and 234:
POULTRY MEAT (THOUSAND TONS) Agrari
- Page 235 and 236:
Agrarian Economy and Rural Developm
- Page 237 and 238:
Agrarian Economy and Rural Developm
- Page 239 and 240:
Agrarian Economy and Rural Developm
- Page 241 and 242:
Agrarian Economy and Rural Developm
- Page 243 and 244:
Agrarian Economy and Rural Developm
- Page 245 and 246:
LEGAL REGLEMENTATIONS IN THE EUROPE
- Page 247 and 248:
and Directive 2000/76/EC of the Eur
- Page 249 and 250:
• rural environment - in 2008 the
- Page 251 and 252:
Responsible authorities are the Min
- Page 253 and 254:
Agrarian Economy and Rural Developm
- Page 255 and 256:
Agrarian Economy and Rural Developm
- Page 257 and 258:
Agrarian Economy and Rural Developm
- Page 259 and 260:
Agrarian Economy and Rural Developm
- Page 261 and 262:
Agrarian Economy and Rural Developm
- Page 263 and 264:
Agrarian Economy and Rural Developm
- Page 265 and 266:
Agrarian Economy and Rural Developm
- Page 267 and 268:
Agrarian Economy and Rural Developm
- Page 269 and 270:
Agrarian Economy and Rural Developm
- Page 271 and 272:
Agrarian Economy and Rural Developm
- Page 273 and 274:
Agrarian Economy and Rural Developm
- Page 275 and 276:
Agrarian Economy and Rural Developm
- Page 277 and 278:
Agrarian Economy and Rural Developm
- Page 279 and 280:
Agrarian Economy and Rural Developm
- Page 281 and 282:
Agrarian Economy and Rural Developm
- Page 283 and 284:
Agrarian Economy and Rural Developm
- Page 285 and 286:
Agrarian Economy and Rural Developm
- Page 287 and 288:
Agrarian Economy and Rural Developm
- Page 289 and 290:
Agrarian Economy and Rural Developm
- Page 291 and 292:
Agrarian Economy and Rural Developm
- Page 293 and 294:
Agrarian Economy and Rural Developm
- Page 295 and 296:
Agrarian Economy and Rural Developm
- Page 297 and 298:
Agrarian Economy and Rural Developm
- Page 299 and 300:
Agrarian Economy and Rural Developm
- Page 301 and 302:
Agrarian Economy and Rural Developm
- Page 303 and 304:
Agrarian Economy and Rural Developm
- Page 305 and 306:
Agrarian Economy and Rural Developm
- Page 307 and 308:
Agrarian Economy and Rural Developm
- Page 309 and 310:
Agrarian Economy and Rural Developm
- Page 311 and 312:
Agrarian Economy and Rural Developm
- Page 313 and 314:
Agrarian Economy and Rural Developm
- Page 315 and 316:
Agrarian Economy and Rural Developm
- Page 317 and 318:
Agrarian Economy and Rural Developm
- Page 319 and 320:
Agrarian Economy and Rural Developm
- Page 321 and 322:
Agrarian Economy and Rural Developm
- Page 323 and 324:
Agrarian Economy and Rural Developm
- Page 325 and 326:
Agrarian Economy and Rural Developm
- Page 327 and 328:
Agrarian Economy and Rural Developm
- Page 329 and 330:
Agrarian Economy and Rural Developm
- Page 331 and 332:
Agrarian Economy and Rural Developm
- Page 333 and 334:
Agrarian Economy and Rural Developm
- Page 335 and 336:
Agrarian Economy and Rural Developm
- Page 337 and 338:
Agrarian Economy and Rural Developm
- Page 339 and 340:
Agrarian Economy and Rural Developm
- Page 341 and 342:
Agrarian Economy and Rural Developm
- Page 343 and 344:
Agrarian Economy and Rural Developm
- Page 345 and 346:
Agrarian Economy and Rural Developm
- Page 347 and 348:
Agrarian Economy and Rural Developm
- Page 349 and 350:
Agrarian Economy and Rural Developm
- Page 351 and 352:
Agrarian Economy and Rural Developm
- Page 353 and 354:
Agrarian Economy and Rural Developm
- Page 355 and 356:
Agrarian Economy and Rural Developm
- Page 357 and 358:
Agrarian Economy and Rural Developm
- Page 359 and 360:
Agrarian Economy and Rural Developm
- Page 361 and 362:
Agrarian Economy and Rural Developm
- Page 363 and 364:
Agrarian Economy and Rural Developm
- Page 365 and 366:
Agrarian Economy and Rural Developm
- Page 367 and 368:
Agrarian Economy and Rural Developm
- Page 369 and 370:
Agrarian Economy and Rural Developm
- Page 371 and 372:
Agrarian Economy and Rural Developm
- Page 373 and 374:
Agrarian Economy and Rural Developm
- Page 375 and 376:
Agrarian Economy and Rural Developm
- Page 377 and 378:
Agrarian Economy and Rural Developm
- Page 379 and 380:
Agrarian Economy and Rural Developm
- Page 381 and 382:
Agrarian Economy and Rural Developm
- Page 383 and 384:
Agrarian Economy and Rural Developm
- Page 385 and 386:
Agrarian Economy and Rural Developm
- Page 387 and 388:
Agrarian Economy and Rural Developm
- Page 389 and 390:
Agrarian Economy and Rural Developm
- Page 391 and 392:
Agrarian Economy and Rural Developm
- Page 393 and 394:
Agrarian Economy and Rural Developm
- Page 395 and 396:
Agrarian Economy and Rural Developm
- Page 397 and 398:
Agrarian Economy and Rural Developm
- Page 399 and 400:
Agrarian Economy and Rural Developm
- Page 401 and 402:
Agrarian Economy and Rural Developm
- Page 403 and 404:
Agrarian Economy and Rural Developm
- Page 405 and 406:
Agrarian Economy and Rural Developm
- Page 407 and 408:
Agrarian Economy and Rural Developm
- Page 409 and 410:
MODELS FOR SHORT VEGETABLES’ CHAI
- Page 411 and 412:
Staffs are projected based on coope
- Page 413 and 414:
In the first year of operation of t
- Page 415 and 416:
INVESTMENT MANAGEMENT IN ASSOCIATIV
- Page 417 and 418:
oth and 60.3% tomatoes juice. Other
- Page 419 and 420:
Agrarian Economy and Rural Developm
- Page 421 and 422:
Agrarian Economy and Rural Developm
- Page 423 and 424:
Agrarian Economy and Rural Developm
- Page 425 and 426:
Agrarian Economy and Rural Developm
- Page 427 and 428:
Agrarian Economy and Rural Developm
- Page 429 and 430:
Agrarian Economy and Rural Developm
- Page 431 and 432:
Agrarian Economy and Rural Developm
- Page 433 and 434:
Agrarian Economy and Rural Developm
- Page 435 and 436:
Agrarian Economy and Rural Developm
- Page 437 and 438:
Agrarian Economy and Rural Developm