- Page 1:
MPRA Munich Personal RePEc Archive
- Page 4 and 5:
Copyright @ 2016, Research Institut
- Page 6 and 7:
SCIENTIFIC COMMITTEE President: ALE
- Page 9 and 10:
CONTENTS SECTION 1 “THE CONCEPTS,
- Page 11 and 12:
Alin-Angelin IORGA „Legal regleme
- Page 13 and 14:
Agrarian Economy and Rural Developm
- Page 15 and 16:
Agrarian Economy and Rural Developm
- Page 17 and 18:
Agrarian Economy and Rural Developm
- Page 19 and 20:
Agrarian Economy and Rural Developm
- Page 21 and 22:
Agrarian Economy and Rural Developm
- Page 23 and 24:
Agrarian Economy and Rural Developm
- Page 25 and 26:
Agrarian Economy and Rural Developm
- Page 27 and 28:
Agrarian Economy and Rural Developm
- Page 29 and 30:
Agrarian Economy and Rural Developm
- Page 31 and 32:
Agrarian Economy and Rural Developm
- Page 33 and 34:
Agrarian Economy and Rural Developm
- Page 35 and 36:
Agrarian Economy and Rural Developm
- Page 37 and 38:
Agrarian Economy and Rural Developm
- Page 39 and 40:
Agrarian Economy and Rural Developm
- Page 41 and 42: Agrarian Economy and Rural Developm
- Page 43 and 44: Agrarian Economy and Rural Developm
- Page 45 and 46: Agrarian Economy and Rural Developm
- Page 47 and 48: Agrarian Economy and Rural Developm
- Page 49 and 50: Agrarian Economy and Rural Developm
- Page 51 and 52: Agrarian Economy and Rural Developm
- Page 53 and 54: Italy Bulgaria Hungary Netherlands
- Page 55 and 56: 2002 2003 2004 2005 2006 2007 2008
- Page 57 and 58: Agrarian Economy and Rural Developm
- Page 59 and 60: Agrarian Economy and Rural Developm
- Page 61 and 62: Agrarian Economy and Rural Developm
- Page 63 and 64: Agrarian Economy and Rural Developm
- Page 65 and 66: Agrarian Economy and Rural Developm
- Page 67 and 68: Agrarian Economy and Rural Developm
- Page 69 and 70: Agrarian Economy and Rural Developm
- Page 71 and 72: Agrarian Economy and Rural Developm
- Page 73 and 74: Agrarian Economy and Rural Developm
- Page 75 and 76: Agrarian Economy and Rural Developm
- Page 77 and 78: Agrarian Economy and Rural Developm
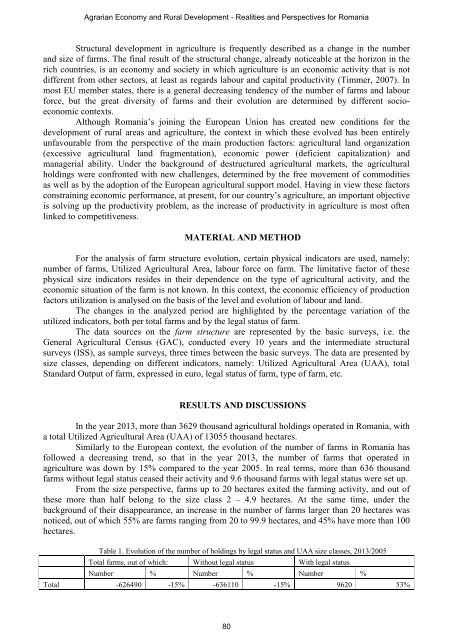
- Page 79 and 80: Agrarian Economy and Rural Developm
- Page 81 and 82: Agrarian Economy and Rural Developm
- Page 83 and 84: Agrarian Economy and Rural Developm
- Page 85 and 86: Agrarian Economy and Rural Developm
- Page 87 and 88: Agrarian Economy and Rural Developm
- Page 89 and 90: Agrarian Economy and Rural Developm
- Page 91: Agrarian Economy and Rural Developm
- Page 95 and 96: Agrarian Economy and Rural Developm
- Page 97 and 98: Agrarian Economy and Rural Developm
- Page 99 and 100: Agrarian Economy and Rural Developm
- Page 101 and 102: Agrarian Economy and Rural Developm
- Page 103 and 104: Agrarian Economy and Rural Developm
- Page 105 and 106: Agrarian Economy and Rural Developm
- Page 107 and 108: Agrarian Economy and Rural Developm
- Page 109 and 110: Agrarian Economy and Rural Developm
- Page 111 and 112: Agrarian Economy and Rural Developm
- Page 113 and 114: Agrarian Economy and Rural Developm
- Page 115 and 116: Agrarian Economy and Rural Developm
- Page 117 and 118: Agrarian Economy and Rural Developm
- Page 119 and 120: Agrarian Economy and Rural Developm
- Page 121 and 122: Agrarian Economy and Rural Developm
- Page 123 and 124: Agrarian Economy and Rural Developm
- Page 125 and 126: Agrarian Economy and Rural Developm
- Page 127 and 128: Agrarian Economy and Rural Developm
- Page 129 and 130: Agrarian Economy and Rural Developm
- Page 131 and 132: Agrarian Economy and Rural Developm
- Page 133 and 134: Agrarian Economy and Rural Developm
- Page 135 and 136: Agrarian Economy and Rural Developm
- Page 137 and 138: Agrarian Economy and Rural Developm
- Page 139 and 140: Agrarian Economy and Rural Developm
- Page 141 and 142: Agrarian Economy and Rural Developm
- Page 143 and 144:
Agrarian Economy and Rural Developm
- Page 145 and 146:
Agrarian Economy and Rural Developm
- Page 147 and 148:
Agrarian Economy and Rural Developm
- Page 149 and 150:
Agrarian Economy and Rural Developm
- Page 151 and 152:
Agrarian Economy and Rural Developm
- Page 153 and 154:
Agrarian Economy and Rural Developm
- Page 155 and 156:
Agrarian Economy and Rural Developm
- Page 157 and 158:
Agrarian Economy and Rural Developm
- Page 159 and 160:
Agrarian Economy and Rural Developm
- Page 161 and 162:
Agrarian Economy and Rural Developm
- Page 163 and 164:
Agrarian Economy and Rural Developm
- Page 165 and 166:
Agrarian Economy and Rural Developm
- Page 167 and 168:
Agrarian Economy and Rural Developm
- Page 169 and 170:
Agrarian Economy and Rural Developm
- Page 171 and 172:
Agrarian Economy and Rural Developm
- Page 173 and 174:
Agrarian Economy and Rural Developm
- Page 175 and 176:
Agrarian Economy and Rural Developm
- Page 177 and 178:
Agrarian Economy and Rural Developm
- Page 179 and 180:
Agrarian Economy and Rural Developm
- Page 181 and 182:
Agrarian Economy and Rural Developm
- Page 183 and 184:
Agrarian Economy and Rural Developm
- Page 185 and 186:
Agrarian Economy and Rural Developm
- Page 187 and 188:
RESULTS AND DISCUSSIONS According t
- Page 189 and 190:
Table 4. Comparative situation rega
- Page 191 and 192:
Other important areas are cultivate
- Page 193 and 194:
early varieties, with a smaller veg
- Page 195 and 196:
Agrarian Economy and Rural Developm
- Page 197 and 198:
Agrarian Economy and Rural Developm
- Page 199 and 200:
Agrarian Economy and Rural Developm
- Page 201 and 202:
MATERIAL AND METHOD Livestock farmi
- Page 203 and 204:
Luxembourg 205 185 199 188 Malta 19
- Page 205 and 206:
Luxembourg Bulgaria 1,828 2,101 1,4
- Page 207 and 208:
CONCLUSIONS The analysis has shown
- Page 209 and 210:
Agrarian Economy and Rural Developm
- Page 211 and 212:
Agrarian Economy and Rural Developm
- Page 213 and 214:
Agrarian Economy and Rural Developm
- Page 215 and 216:
Agrarian Economy and Rural Developm
- Page 217 and 218:
DEMAND AND SUPPLY OF MILK (THOUSNAD
- Page 219 and 220:
Agrarian Economy and Rural Developm
- Page 221 and 222:
Agrarian Economy and Rural Developm
- Page 223 and 224:
Agrarian Economy and Rural Developm
- Page 225 and 226:
Agrarian Economy and Rural Developm
- Page 227 and 228:
Agrarian Economy and Rural Developm
- Page 229 and 230:
Agrarian Economy and Rural Developm
- Page 231 and 232:
Agrarian Economy and Rural Developm
- Page 233 and 234:
POULTRY MEAT (THOUSAND TONS) Agrari
- Page 235 and 236:
Agrarian Economy and Rural Developm
- Page 237 and 238:
Agrarian Economy and Rural Developm
- Page 239 and 240:
Agrarian Economy and Rural Developm
- Page 241 and 242:
Agrarian Economy and Rural Developm
- Page 243 and 244:
Agrarian Economy and Rural Developm
- Page 245 and 246:
LEGAL REGLEMENTATIONS IN THE EUROPE
- Page 247 and 248:
and Directive 2000/76/EC of the Eur
- Page 249 and 250:
• rural environment - in 2008 the
- Page 251 and 252:
Responsible authorities are the Min
- Page 253 and 254:
Agrarian Economy and Rural Developm
- Page 255 and 256:
Agrarian Economy and Rural Developm
- Page 257 and 258:
Agrarian Economy and Rural Developm
- Page 259 and 260:
Agrarian Economy and Rural Developm
- Page 261 and 262:
Agrarian Economy and Rural Developm
- Page 263 and 264:
Agrarian Economy and Rural Developm
- Page 265 and 266:
Agrarian Economy and Rural Developm
- Page 267 and 268:
Agrarian Economy and Rural Developm
- Page 269 and 270:
Agrarian Economy and Rural Developm
- Page 271 and 272:
Agrarian Economy and Rural Developm
- Page 273 and 274:
Agrarian Economy and Rural Developm
- Page 275 and 276:
Agrarian Economy and Rural Developm
- Page 277 and 278:
Agrarian Economy and Rural Developm
- Page 279 and 280:
Agrarian Economy and Rural Developm
- Page 281 and 282:
Agrarian Economy and Rural Developm
- Page 283 and 284:
Agrarian Economy and Rural Developm
- Page 285 and 286:
Agrarian Economy and Rural Developm
- Page 287 and 288:
Agrarian Economy and Rural Developm
- Page 289 and 290:
Agrarian Economy and Rural Developm
- Page 291 and 292:
Agrarian Economy and Rural Developm
- Page 293 and 294:
Agrarian Economy and Rural Developm
- Page 295 and 296:
Agrarian Economy and Rural Developm
- Page 297 and 298:
Agrarian Economy and Rural Developm
- Page 299 and 300:
Agrarian Economy and Rural Developm
- Page 301 and 302:
Agrarian Economy and Rural Developm
- Page 303 and 304:
Agrarian Economy and Rural Developm
- Page 305 and 306:
Agrarian Economy and Rural Developm
- Page 307 and 308:
Agrarian Economy and Rural Developm
- Page 309 and 310:
Agrarian Economy and Rural Developm
- Page 311 and 312:
Agrarian Economy and Rural Developm
- Page 313 and 314:
Agrarian Economy and Rural Developm
- Page 315 and 316:
Agrarian Economy and Rural Developm
- Page 317 and 318:
Agrarian Economy and Rural Developm
- Page 319 and 320:
Agrarian Economy and Rural Developm
- Page 321 and 322:
Agrarian Economy and Rural Developm
- Page 323 and 324:
Agrarian Economy and Rural Developm
- Page 325 and 326:
Agrarian Economy and Rural Developm
- Page 327 and 328:
Agrarian Economy and Rural Developm
- Page 329 and 330:
Agrarian Economy and Rural Developm
- Page 331 and 332:
Agrarian Economy and Rural Developm
- Page 333 and 334:
Agrarian Economy and Rural Developm
- Page 335 and 336:
Agrarian Economy and Rural Developm
- Page 337 and 338:
Agrarian Economy and Rural Developm
- Page 339 and 340:
Agrarian Economy and Rural Developm
- Page 341 and 342:
Agrarian Economy and Rural Developm
- Page 343 and 344:
Agrarian Economy and Rural Developm
- Page 345 and 346:
Agrarian Economy and Rural Developm
- Page 347 and 348:
Agrarian Economy and Rural Developm
- Page 349 and 350:
Agrarian Economy and Rural Developm
- Page 351 and 352:
Agrarian Economy and Rural Developm
- Page 353 and 354:
Agrarian Economy and Rural Developm
- Page 355 and 356:
Agrarian Economy and Rural Developm
- Page 357 and 358:
Agrarian Economy and Rural Developm
- Page 359 and 360:
Agrarian Economy and Rural Developm
- Page 361 and 362:
Agrarian Economy and Rural Developm
- Page 363 and 364:
Agrarian Economy and Rural Developm
- Page 365 and 366:
Agrarian Economy and Rural Developm
- Page 367 and 368:
Agrarian Economy and Rural Developm
- Page 369 and 370:
Agrarian Economy and Rural Developm
- Page 371 and 372:
Agrarian Economy and Rural Developm
- Page 373 and 374:
Agrarian Economy and Rural Developm
- Page 375 and 376:
Agrarian Economy and Rural Developm
- Page 377 and 378:
Agrarian Economy and Rural Developm
- Page 379 and 380:
Agrarian Economy and Rural Developm
- Page 381 and 382:
Agrarian Economy and Rural Developm
- Page 383 and 384:
Agrarian Economy and Rural Developm
- Page 385 and 386:
Agrarian Economy and Rural Developm
- Page 387 and 388:
Agrarian Economy and Rural Developm
- Page 389 and 390:
Agrarian Economy and Rural Developm
- Page 391 and 392:
Agrarian Economy and Rural Developm
- Page 393 and 394:
Agrarian Economy and Rural Developm
- Page 395 and 396:
Agrarian Economy and Rural Developm
- Page 397 and 398:
Agrarian Economy and Rural Developm
- Page 399 and 400:
Agrarian Economy and Rural Developm
- Page 401 and 402:
Agrarian Economy and Rural Developm
- Page 403 and 404:
Agrarian Economy and Rural Developm
- Page 405 and 406:
Agrarian Economy and Rural Developm
- Page 407 and 408:
Agrarian Economy and Rural Developm
- Page 409 and 410:
MODELS FOR SHORT VEGETABLES’ CHAI
- Page 411 and 412:
Staffs are projected based on coope
- Page 413 and 414:
In the first year of operation of t
- Page 415 and 416:
INVESTMENT MANAGEMENT IN ASSOCIATIV
- Page 417 and 418:
oth and 60.3% tomatoes juice. Other
- Page 419 and 420:
Agrarian Economy and Rural Developm
- Page 421 and 422:
Agrarian Economy and Rural Developm
- Page 423 and 424:
Agrarian Economy and Rural Developm
- Page 425 and 426:
Agrarian Economy and Rural Developm
- Page 427 and 428:
Agrarian Economy and Rural Developm
- Page 429 and 430:
Agrarian Economy and Rural Developm
- Page 431 and 432:
Agrarian Economy and Rural Developm
- Page 433 and 434:
Agrarian Economy and Rural Developm
- Page 435 and 436:
Agrarian Economy and Rural Developm
- Page 437 and 438:
Agrarian Economy and Rural Developm