- Page 1 and 2:
2016 Fairfield County Community Hea
- Page 3 and 4:
This report has been funded by: Fai
- Page 5 and 6:
TABLE OF CONTENTS EXECUTIVE SUMMARY
- Page 7 and 8:
SAMPLING | Adolescent Survey A samp
- Page 9 and 10:
Data Summary HEALTH PERCEPTIONS In
- Page 11 and 12:
Fairfield County Adult BMI Classifi
- Page 13 and 14:
WOMEN’S HEALTH In 2016, three-fif
- Page 15 and 16:
YOUTH TOBACCO USE The 2016 Health A
- Page 17 and 18:
YOUTH MENTAL HEALTH AND SUICIDE In
- Page 19 and 20:
Adult І TREND SUMMARY N/A - not av
- Page 21 and 22:
Youth І TREND SUMMARY Youth Variab
- Page 23 and 24:
Child І TREND SUMMARY Child Compar
- Page 25 and 26:
The following graph shows the perce
- Page 27 and 28:
Adult І HEALTH CARE COVERAGE Key F
- Page 29 and 30:
The following chart shows what is i
- Page 31 and 32:
Adult І HEALTH CARE ACCESS AND UTI
- Page 33 and 34:
Availability of Services • Fairfi
- Page 35 and 36:
The following map shows the estimat
- Page 37 and 38:
High Blood Cholesterol • More tha
- Page 39 and 40:
The following graphs show the age-a
- Page 41 and 42:
Adult І CANCER Key Findings In 201
- Page 43 and 44:
Prostate Cancer • More than two-f
- Page 45 and 46:
Fairfield County Incidence of Cance
- Page 47 and 48: The following graphs show prevalenc
- Page 49 and 50: Adult І ARTHRITIS Key Findings Acc
- Page 51 and 52: The following graphs demonstrate th
- Page 53 and 54: Nutrition • In 2016, 6% of adults
- Page 55 and 56: Adult І TOBACCO USE Key Findings I
- Page 57 and 58: The following graph shows Fairfield
- Page 59 and 60: The following graph shows Fairfield
- Page 61 and 62: Adult І ALCOHOL CONSUMPTION Key Fi
- Page 63 and 64: The following graphs show the perce
- Page 65 and 66: Beer, Wine and Liquor Stores, Rate
- Page 67 and 68: Bars and Drinking Establishments, R
- Page 69 and 70: The following graphs are data from
- Page 71 and 72: Prescription Analgesic Doses Per Ca
- Page 73 and 74: Felony Cases and Drug Arrests Janua
- Page 75 and 76: • In 2016, the health assessment
- Page 77 and 78: What Can I Do to Reduce My Risk of
- Page 79 and 80: • From 2012-2014, the leading can
- Page 81 and 82: The following graph shows the Fairf
- Page 83 and 84: N/A - Not Available Adult Compariso
- Page 85 and 86: Adult І SEXUAL BEHAVIOR Key Findin
- Page 87 and 88: The following graphs show Fairfield
- Page 89 and 90: Pregnancy Outcomes *Please note tha
- Page 91 and 92: The following graphs show the perce
- Page 93 and 94: Education • 91% of Fairfield Coun
- Page 95 and 96: The following graph shows the perce
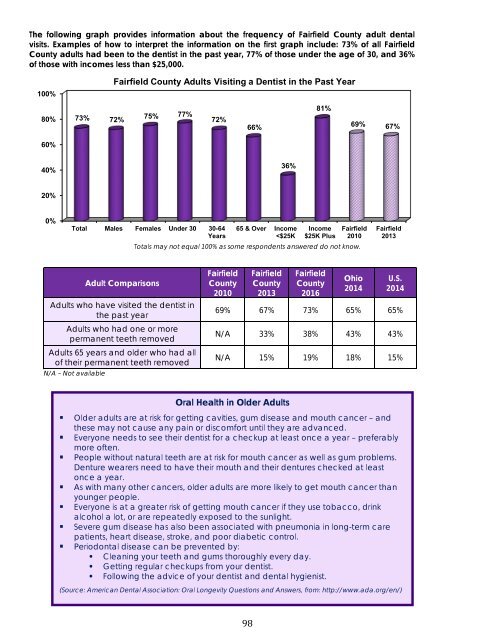
- Page 97: The following graph shows Fairfield
- Page 101 and 102: Youth І WEIGHT STATUS Key Findings
- Page 103 and 104: The following graph shows the perce
- Page 105 and 106: The following graph shows the perce
- Page 107 and 108: Youth І ALCOHOL CONSUMPTION Key Fi
- Page 109 and 110: The following graph shows the perce
- Page 111 and 112: Youth І DRUG USE Key Findings In 2
- Page 113 and 114: Youth Comparisons Fairfield County
- Page 115 and 116: The following graphs show the perce
- Page 117 and 118: Youth Comparisons Fairfield County
- Page 119 and 120: The following graphs show the perce
- Page 121 and 122: Youth І SAFETY Key Findings In 201
- Page 123 and 124: Youth І VIOLENCE ISSUES Key Findin
- Page 125 and 126: The following graph shows Fairfield
- Page 127 and 128: • A doctor told Fairfield County
- Page 129 and 130: Asthma The following graph shows th
- Page 131 and 132: • 10% of parents reported their c
- Page 133 and 134: Breastfeeding The following graph s
- Page 135 and 136: Child І MIDDLE CHILDHOOD (6-11 YEA
- Page 137 and 138: Child І FAMILY FUNCTIONING, NEIGHB
- Page 139 and 140: • Fairfield County parents report
- Page 141 and 142: Child І PARENT HEALTH Key Findings
- Page 143 and 144: Source Data Used Website Caron Penn
- Page 145 and 146: Network of Care Source Data Used We
- Page 147 and 148: Appendix II І FAIRFIELD COUNTY ACR
- Page 149 and 150:
Appendix III І METHODS FOR WEIGHTI
- Page 151 and 152:
Category Fairfield Sample % 2014 Ce
- Page 153 and 154:
Appendix V І FAIRFIELD COUNTY SAMP
- Page 155 and 156:
FAIRFIELD COUNTY PROFILE General De
- Page 157 and 158:
Selected Social Characteristics, Co
- Page 159 and 160:
Selected Economic Characteristics,
- Page 161 and 162:
Age Groups Estimated Poverty Status
- Page 163 and 164:
Fairfield County Ohio U.S Clinical