people and planet
2kNmCFZ
2kNmCFZ

Create successful ePaper yourself
Turn your PDF publications into a flip-book with our unique Google optimized e-Paper software.
GLOBAL EDUCATION MONITORING REPORT<br />
2016<br />
Education for<br />
<strong>people</strong> <strong>and</strong> <strong>planet</strong>:<br />
CREATING SUSTAINABLE FUTURES FOR ALL<br />
United Nations<br />
Educational, Scientific <strong>and</strong><br />
Cultural Organization<br />
Sustainable<br />
Development<br />
Goals
GLOBAL EDUCATION MONITORING REPORT<br />
2016<br />
Education for<br />
<strong>people</strong> <strong>and</strong> <strong>planet</strong>:<br />
CREATING SUSTAINABLE FUTURES FOR ALL<br />
UNESCO<br />
Publishing<br />
United Nations<br />
Educational, Scientific <strong>and</strong><br />
Cultural Organization<br />
Sustainable<br />
Development<br />
Goals
This Report is an independent publication commissioned by UNESCO on behalf of the international<br />
community. It is the product of a collaborative effort involving members of the Report team <strong>and</strong> many<br />
other <strong>people</strong>, agencies, institutions <strong>and</strong> governments.<br />
The designations employed <strong>and</strong> the presentation of the material in this publication do not imply<br />
the expression of any opinion whatsoever on the part of UNESCO concerning the legal status of<br />
any country, territory, city or area, or of its authorities, or concerning the delimitation of its frontiers<br />
or boundaries.<br />
The Global Education Monitoring Report team is responsible for the choice <strong>and</strong> the presentation of the<br />
facts contained in this book <strong>and</strong> for the opinions expressed therein, which are not necessarily those<br />
of UNESCO <strong>and</strong> do not commit the Organization. Overall responsibility for the views <strong>and</strong> opinions<br />
expressed in the Report is taken by its Director.<br />
© UNESCO, 2016<br />
Second edition<br />
Published in 2016 by the United Nations<br />
Educational, Scientific <strong>and</strong> Cultural<br />
Organization<br />
7, Place de Fontenoy, 75352 Paris 07 SP, France<br />
Graphic design by FHI 360<br />
Layout by FHI 360<br />
Cover <strong>and</strong> back cover photos: Fadil Aziz/<br />
Alcibbum Photography<br />
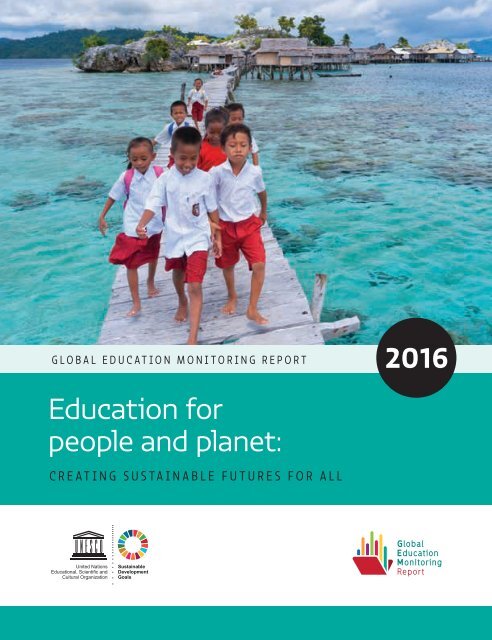
The cover photos are of school children from the<br />
Palau Papan Isl<strong>and</strong> in the archipelago of Togean<br />
in Sulawesi, Indonesia. The children, from the<br />
Bajo tribe, live in stilt houses <strong>and</strong> cross a bridge<br />
spanning 1.8 kilometres to the neighbouring isl<strong>and</strong><br />
of Melange to go to school every day.<br />
This publication is available in Open<br />
Access under the Attribution-ShareAlike<br />
3.0 IGO (CC-BY-SA 3.0 IGO) license<br />
(http://creativecommons.org/licenses/bysa/3.0/igo/).<br />
By using the content of this<br />
publication, the users accept to be bound by<br />
the terms of use of the UNESCO Open Access<br />
Repository (http://www.unesco.org/openaccess/terms-use-ccbysa-en).<br />
The present license applies exclusively to<br />
the text content of the publication. For the<br />
use of any material not clearly identified as<br />
belonging to UNESCO, prior permission shall<br />
be requested from: publication.copyright@<br />
unesco.org or UNESCO Publishing, 7, place de<br />
Fontenoy, 75352 Paris 07 SP France.<br />
Typeset by UNESCO<br />
ISBN: 978-92-3-100167-3
Foreword<br />
In May 2015, the World Education Forum in Incheon (Republic of Korea), brought together 1,600<br />
participants from 160 countries with a single goal in mind: how to ensure inclusive <strong>and</strong> equitable quality<br />
education <strong>and</strong> lifelong learning for all by 2030?<br />
The Incheon Declaration for Education 2030 has been instrumental to shape the Sustainable<br />
Development Goal on Education to “Ensure inclusive <strong>and</strong> equitable quality education <strong>and</strong> promote<br />
lifelong learning opportunities for all”. It entrusts UNESCO with the leadership, coordination <strong>and</strong><br />
monitoring of the Education 2030 agenda. It also calls upon the Global Education Monitoring (GEM)<br />
Report to provide independent monitoring <strong>and</strong> reporting of the Sustainable Development Goal on<br />
education (SDG 4), <strong>and</strong> on education in the other SDGs, for the next fifteen years.<br />
The ultimate goal of this agenda is to leave no one behind. This calls for robust data <strong>and</strong> sound<br />
monitoring. The 2016 edition of the GEM Report provides valuable insight for governments <strong>and</strong> policy<br />
makers to monitor <strong>and</strong> accelerate progress towards SDG 4, building on the indicators <strong>and</strong> targets we<br />
have, with equity <strong>and</strong> inclusion as measures of overall success.<br />
This Report makes three messages starkly clear.<br />
Firstly, the urgent need for new approaches. On current trends only 70% of children in low income<br />
countries will complete primary school in 2030, a goal that should have been achieved in 2015. We need<br />
the political will, the policies, the innovation <strong>and</strong> the resources to buck this trend.<br />
Secondly, if we are serious about SDG4, we must act with a sense of heightened urgency, <strong>and</strong> with longterm<br />
commitment. Failure to do so will not only adversely affect education but will hamper progress<br />
towards each <strong>and</strong> every development goal: poverty reduction, hunger eradication, improved health,<br />
gender equality <strong>and</strong> women’s empowerment, sustainable production <strong>and</strong> consumption, resilient cities,<br />
<strong>and</strong> more equal <strong>and</strong> inclusive societies.<br />
Lastly, we must fundamentally change the way we think about education <strong>and</strong> its role in human wellbeing<br />
<strong>and</strong> global development. Now, more than ever, education has a responsibility to foster the right<br />
type of skills, attitudes <strong>and</strong> behavior that will lead to sustainable <strong>and</strong> inclusive growth.<br />
The 2030 Agenda for Sustainable Development calls on us to develop holistic <strong>and</strong> integrated responses<br />
to the many social, economic <strong>and</strong> environmental challenges we face. This means reaching out beyond<br />
traditional boundaries <strong>and</strong> creating effective, cross-sectoral partnerships.<br />
A sustainable future for all is about human dignity, social inclusion <strong>and</strong> environmental protection. It is<br />
a future where economic growth does not exacerbate inequalities but builds prosperity for all; where<br />
urban areas <strong>and</strong> labour markets are designed to empower everyone <strong>and</strong> economic activities, communal<br />
<strong>and</strong> corporate, are green-oriented. Sustainable development is a belief that human development cannot<br />
happen without a healthy <strong>planet</strong>. Embarking upon the new SDG agenda requires all of us to reflect upon<br />
the ultimate purpose of learning throughout life. Because, if done right, education has the power like<br />
none else to nurture empowered, reflective, engaged <strong>and</strong> skilled citizens who can chart the way towards<br />
a safer, greener <strong>and</strong> fairer <strong>planet</strong> for all. This new report provides relevant evidence to enrich these<br />
discussions <strong>and</strong> craft the policies needed to make it a reality for all.<br />
Irina Bokova<br />
Director-General of UNESCO<br />
2016 • GLOBAL EDUCATION MONITORING REPORT i
Foreword<br />
The 2016 Global Education Monitoring Report (GEM Report) is both masterful <strong>and</strong> disquieting. This is a big<br />
report: comprehensive, in-depth <strong>and</strong> perspicacious. It is also an unnerving report. It establishes that<br />
education is at the heart of sustainable development <strong>and</strong> the Sustainable Development Goals (SDGs),<br />
yet it also makes clear just how far away we are from achieving the SDGs. This report should set off<br />
alarm bells around the world <strong>and</strong> lead to a historic scale-up of actions to achieve SDG 4.<br />
The GEM Report provides an authoritative account of how education is the most vital input for<br />
every dimension of sustainable development. Better education leads to greater prosperity, improved<br />
agriculture, better health outcomes, less violence, more gender equality, higher social capital <strong>and</strong><br />
an improved natural environment. Education is key to helping <strong>people</strong> around the world underst<strong>and</strong><br />
why sustainable development is such a vital concept for our common future. Education gives us the<br />
key tools – economic, social, technological, even ethical – to take on the SDGs <strong>and</strong> to achieve them.<br />
These facts are spelled out in exquisite <strong>and</strong> unusual detail throughout the report. There is a wealth of<br />
information to be mined in the tables, graphs <strong>and</strong> texts.<br />
Yet the report also emphasizes the remarkable gaps between where the world st<strong>and</strong>s today on<br />
education <strong>and</strong> where it has promised to arrive as of 2030. The gaps in educational attainment between<br />
rich <strong>and</strong> poor, within <strong>and</strong> between countries, are simply appalling. In many poor countries, poor children<br />
face nearly insurmountable obstacles under current conditions. They lack books at home; have no<br />
opportunity for pre-primary school; <strong>and</strong> enter facilities without electricity, water, hygiene, qualified<br />
teachers, textbooks <strong>and</strong> the other appurtenances of a basic education, much less a quality education.<br />
The implications are staggering. While SDG 4 calls for universal completion of upper secondary<br />
education by 2030, the current completion rate in low-income countries is a meagre 14% (Table 10.3).<br />
The GEM Report undertakes an important exercise to determine how many countries will reach the<br />
2030 target on the current trajectory, or even on a path that matches the fastest improving country in<br />
the region. The answer is sobering: We need unprecedented progress, starting almost immediately, in<br />
order to have a shot at success with SDG 4.<br />
Cynics might say, ‘We told you, SDG 4 is simply unachievable’, <strong>and</strong> suggest that we accept that ‘reality’.<br />
Yet as the report hammers home in countless ways, such complacency is reckless <strong>and</strong> immoral. If we<br />
leave the current young generation without adequate schooling, we doom them <strong>and</strong> the world to future<br />
poverty, environmental ills, <strong>and</strong> even social violence <strong>and</strong> instability for decades to come. There can<br />
be no excuse for complacency. The message of this report is that we need to get our act together to<br />
accelerate educational attainment in an unprecedented manner.<br />
One of the keys for acceleration is financing. Here again, the report makes for sobering reading.<br />
Development aid for education today is lower than it was in 2009 (Figure 20.7). This is staggeringly<br />
short-sighted of the rich countries. Do these donor countries really believe that they are ‘saving money’<br />
by underinvesting in aid for education in the world’s low-income countries? After reading this report,<br />
the leaders <strong>and</strong> citizens in the high income world will be deeply aware that investing in education is<br />
fundamental for global well-being, <strong>and</strong> that the current level of aid, at around US$5 billion per year<br />
for primary education – just US$5 per person per year in the rich countries! – is a tragically small<br />
investment for the world’s future sustainable development <strong>and</strong> peace.<br />
ii<br />
FOREWORD
The 2016 GEM Report provides a plethora of insights, recommendations <strong>and</strong> st<strong>and</strong>ards for moving<br />
forward. It offers invaluable suggestions on how to monitor <strong>and</strong> measure progress on SDG 4. It<br />
demonstrates by example the feasibility of far more refined measures of education inputs, quality <strong>and</strong><br />
achievement than the often crude measures of enrolment <strong>and</strong> completion that we rely on today. Using<br />
big data, better survey tools, facility monitoring <strong>and</strong> information technology, we can get far more<br />
nuanced measures of the education process <strong>and</strong> outcomes at all levels.<br />
Fifteen years ago the world finally recognized the enormity of the AIDS epidemic <strong>and</strong> other health<br />
emergencies <strong>and</strong> took concrete steps to scale up public health interventions in the context of the<br />
Millennium Development Goals. Thus were born major initiatives such as the Global Fund to Fight AIDS,<br />
Tuberculosis <strong>and</strong> Malaria, the Global Alliance for Vaccines <strong>and</strong> Immunisation (now Gavi, the Vaccine<br />
Alliance) <strong>and</strong> many other examples. These efforts led to a dramatic upturn in public health interventions<br />
<strong>and</strong> funding. While it did not achieve all that was possible (mainly because the 2008 financial crisis ended<br />
the upswing in public health funding) it did lead to many breakthroughs whose effects continue to be<br />
felt today.<br />
The 2016 GEM Report should be read as a similar call to action for education as the core of the SDGs.<br />
My own view, often repeated in the past couple of years, is the urgency of a Global Fund for Education<br />
that builds on the positive lessons of the Global Fund for AIDS, Tuberculosis <strong>and</strong> Malaria. The financing<br />
constraint lies at the very heart of the education challenge, as this report makes vividly clear through<br />
every bit of cross-national <strong>and</strong> household-based data.<br />
This compelling document calls on us to respond to the opportunity, urgency <strong>and</strong> declared global goal<br />
embodied in SDG 4: universal education of good quality for all <strong>and</strong> opportunities for learning throughout<br />
life. I urge <strong>people</strong> everywhere to study this report carefully <strong>and</strong> take its essential messages to heart.<br />
Most importantly, let us act on them at every level, from the local community to the global community.<br />
Jeffrey D. Sachs<br />
Special Adviser to the UN Secretary-General on the<br />
Sustainable Development Goals<br />
2016 • GLOBAL EDUCATION MONITORING REPORT iii
Acknowledgements<br />
This report would not have been possible without the valuable contributions of numerous <strong>people</strong> <strong>and</strong><br />
institutions. The Global Education Monitoring Report (GEM Report) team would like to acknowledge their<br />
support <strong>and</strong> thank them for their time <strong>and</strong> effort.<br />
Invaluable input has been provided by the GEM Report Advisory Board. We specifically wish to<br />
acknowledge the current Chairperson, Professor Jeffrey Sachs, <strong>and</strong> the Vice-Chair, Baela Raza Jamil.<br />
Special thanks also go to our engaged <strong>and</strong> committed funders without whose financial support the<br />
GEM Report would not be possible.<br />
We would like to acknowledge the role of UNESCO, its leadership both at headquarters <strong>and</strong> in the field,<br />
as well as the UNESCO Institutes. We are very grateful to many individuals, divisions <strong>and</strong> units at<br />
UNESCO, notably in the Education Sector <strong>and</strong> the Bureau for the Management of Support Services, for<br />
facilitating our daily work activities. As always, the UNESCO Institute for Statistics has played a key<br />
role <strong>and</strong> we would like to thank its director, Silvia Montoya, <strong>and</strong> her dedicated staff, including among<br />
others Albert Motivans, Patrick Montjouridès, Elise Legault, Simon Ip Cho, Alison Kennedy <strong>and</strong> Pascale<br />
Ratovondrahona, Vong Shian <strong>and</strong> Peter Wallet. Additional thanks to many colleagues at UNESCO’s<br />
Institute for Lifelong Learning, International Bureau of Education, International Institute for Education<br />
Planning <strong>and</strong> the UNESCO Bangkok Office.<br />
An enthusiastic thank you to Radhika Iyengar, our special advisor, who worked with the team as the<br />
report began to take shape. She helped conceptualize key Report themes, emphasized engagement<br />
with other sector experts, <strong>and</strong> later provided extensive input <strong>and</strong> review of chapter drafts.<br />
Several external experts, including Martha Ferede, François Leclercq, Edouard Morena, Fatou Niang,<br />
Ashley Stepanek Lockhart, Rosie Peppin Vaughan, Arjen Wals <strong>and</strong> Samuel Wearne also helped us during<br />
the development <strong>and</strong> drafting phases of this GEM Report <strong>and</strong> we would like to thank them for their<br />
critical contributions.<br />
The GEM Report team would also like to thank the researchers who produced background papers <strong>and</strong><br />
prepared key inputs informing the GEM Report’s analyses: Bassel Akar, S<strong>and</strong>y Balfour, Carol Benson,<br />
Patricia Bromley, Natalie Browes, Kenn Chua, James Cornwell, Luc Gacougnolle, Bryony Hoskins, Jeremy<br />
Jimenez, Julie Lerch, Marlaine Lockheed, Giorgia Magni, Yulia Makarova, Ismailou Maman Keita, Diego<br />
Martino, Dominic Orr, Amlata Persaud, Abbie Raikes, the late Anthony Read, Nicolas Read, Filiberto<br />
Viteri <strong>and</strong> Lisa Zaval.<br />
We are also grateful to several institutions <strong>and</strong> their research staff: the Australian Council of Educational<br />
Research (John Ainley, Wolfram Schulz, Julian Fraillon), the Centre for Environment Education India<br />
Incorporated (Kartikeya Sarabhai, Rixa Schwarz), the Centre for Environment Education Australia<br />
Incorporated (Dr. Prithi Nambiar), Technopolis (Carlos Hinojosa, Annemieke Pickles), the Wittgenstein<br />
Centre for Demography <strong>and</strong> Global Human Capital (Bilal Barakat, Stephanie Bengtsson), Development<br />
Finance International (Jo Walker), the International Council of Adult Education (Katarina Popović),<br />
University of Haifa (Iddo Gal), Research Triangle Institute International (Amber Gove) <strong>and</strong> the Institute<br />
of International Education (Rajika Bh<strong>and</strong>ari).<br />
iv<br />
ACKNOWLEDGEMENTS
Two groups of students from the the MPA programme, London School of Economics also prepared<br />
papers for the Report as part of their Capstone project, <strong>and</strong> are to be thanked as well. The following<br />
individuals also provided valuable inputs: Mo Adefeso-Olateju, Ericka Albaugh, Nadir Altinok, Ian Attfield,<br />
Laura-Ashley Boden, Manuel Cardoso, Daniel Capistrano de Oliveira, Claudia Cappa, Eric Charbonnier,<br />
Christie Chatterley, James Ciera, David Coleman, Arlette Delhaxhe, Marta Encinas-Martin, Jarret<br />
Guajardo, Sonia Guerriero, Hiro Hattori, Fabrice Hénard, Ram Hari Lamichhane, Mitch Loeb, Esperanza<br />
Magpantay, Daniel Mont, Karen Moore, Sarah Pouezevara, Filipa Schmitz Guinote, Mantas Sekmokas,<br />
Tom Slaymaker, Paulo Speller, Andrzej Suchodolski, Susan Teltscher, Jair Torres, Lina Uribe Correa,<br />
Quentin Wodon <strong>and</strong> Gonzalo Zapata.<br />
A group of independent experts also reviewed GEM Report chapters <strong>and</strong> provided valuable feedback.<br />
For their input we thank Farzana Afridi, Monisha Bajaj, Erica Chenoweth, Jessica Fanzo, Lloyd Gruber,<br />
Morgan Bazilian, Diego Martino, Aromar Revi, Guido Schmidt-Traub <strong>and</strong> Patience Stephens.<br />
Special thanks go to Karen Fortuin, Keith Lewin, Mutizwa Mukute <strong>and</strong> Steve Packer who reviewed drafts<br />
of the full report <strong>and</strong> provided useful <strong>and</strong> insightful comments.<br />
The report was edited by Andy Quan, who helped ensure a distinctive voice from the many perspectives<br />
<strong>and</strong> ideas advanced in this ambitious report. Our thanks also go to Andrew Johnston for writing the<br />
summary. Thanks also to Abracadabra for creating the new Global Education Monitoring Report logo <strong>and</strong> to<br />
FHI 360 for the design of the new templates.<br />
We also wish to acknowledge those who worked tirelessly to support the production of the Report,<br />
including Rebecca Brite, Erin Crum, Shannon Dyson, FHI 360, Kristen Garcia, Phoenix Design Aid A/S,<br />
Melanie Tingstrom <strong>and</strong> Jan Worrall.<br />
Many colleagues within <strong>and</strong> outside UNESCO were involved in the translation, design <strong>and</strong> production of<br />
the 2016 GEM Report <strong>and</strong> we would like to extend to them our deep appreciation for their support.<br />
Several <strong>people</strong> provided support to the GEM Report’s communication <strong>and</strong> outreach work, including<br />
Beard & Braid Ltd <strong>and</strong> Blossom snc. Finally, we would like to thank the interns <strong>and</strong> junior consultants<br />
who have supported the GEM Report team in various areas of its work: Farah Altaher, Fatine Guedira,<br />
Mobarak Hossain, Lidia Lozano, Kathleen Ludgate, Manbo Ouyang, Robin Sainsot, Laura Stipanovic,<br />
Ellen Stay <strong>and</strong> Kai Zhou.<br />
2016 • GLOBAL EDUCATION MONITORING REPORT v
The Global Education Monitoring Report team<br />
Director: Aaron Benavot<br />
Manos Antoninis, Madeleine Barry, Nicole Bella, Nihan Köseleci Blanchy, Marcos Delprato,<br />
Glen Hertelendy, Catherine Jere, Priyadarshani Joshi, Katarzyna Kubacka, Leila Loupis,<br />
Kassiani Lythrangomitis, Alasdair McWilliam, Anissa Mechtar, Branwen Millar, Claudine Mukizwa,<br />
Yuki Murakami, Taya Louise Owens, Judith R<strong>and</strong>rianatoavina, Kate Redman, Maria Rojnov,<br />
Anna Ewa Ruszkiewicz, Will Smith, Emily Subden, Rosa Vidarte <strong>and</strong> Asma Zubairi.<br />
The Global Education Monitoring Report (or GEM Report) is an independent annual publication. The<br />
GEM Report is funded by a group of governments, multilateral agencies <strong>and</strong> private foundations <strong>and</strong><br />
facilitated <strong>and</strong> supported by UNESCO.<br />
For more information, please contact:<br />
Global Education Monitoring Report team<br />
c/o UNESCO, 7, place de Fontenoy<br />
75352 Paris 07 SP,<br />
France<br />
Email: gemreport@unesco.org<br />
Tel.: +33 1 45 68 07 41<br />
www.unesco.org/gemreport<br />
New Global Education Monitoring Report series<br />
2016 Education for <strong>people</strong> <strong>and</strong> <strong>planet</strong>:<br />
Creating sustainable futures for all<br />
EFA Global Monitoring Report series<br />
2015 Education for All 2000–2015:<br />
Achievements <strong>and</strong> challenges<br />
2013/4 Teaching <strong>and</strong> learning: Achieving<br />
quality for all<br />
2012 Youth <strong>and</strong> skills: Putting education<br />
to work<br />
2011 The hidden crisis: Armed conflict<br />
<strong>and</strong> education<br />
2010 Reaching the marginalized<br />
2009 Overcoming inequality: Why<br />
governance matters<br />
2008 Education for All by 2015: Will we<br />
make it?<br />
2007 Strong foundations: Early childhood<br />
care <strong>and</strong> education<br />
2006 Literacy for life<br />
2005 Education for All: The quality<br />
imperative<br />
2003/4 Gender <strong>and</strong> Education for All: The<br />
leap to equality<br />
2002 Education for All: Is the world on<br />
track?<br />
Any errors or omissions found subsequent to printing will be corrected in the online version at www.unesco.org/gemreport.<br />
vi<br />
2016 • GLOBAL EDUCATION MONITORING REPORT
Contents<br />
Foreword ........................................................................................................................................................... i<br />
Acknowledgements ...................................................................................................................................iv<br />
Contents .........................................................................................................................................................vii<br />
Highlights......................................................................................................................................................xiv<br />
Monitoring SDG 4......................................................................................................................................xiii<br />
INTRODUCTION • Sustainable development: a strategy for <strong>people</strong>, <strong>planet</strong> <strong>and</strong> prosperity.......................................... 1<br />
The 2030 Agenda unites development <strong>and</strong> environmental sustainability............................................................................ 5<br />
Education within sustainable development...........................................................................................................................................7<br />
Reader’s guide to the report........................................................................................................................................................................12<br />
CHAPTER 1 • Planet: environmental sustainability.............................................................................................................................16<br />
Global environmental challenges are pressing................................................................................................................................... 19<br />
Reversing climate change requires an integrated approach to learning...............................................................................32<br />
To meet these challenges, learning is essential.................................................................................................................................24<br />
Conclusion............................................................................................................................................................................................................35<br />
CHAPTER 2 • Prosperity: sustainable <strong>and</strong> inclusive economies..................................................................................................36<br />
Current models of economic growth cause environmental destruction.............................................................................40<br />
Sustainable transformation will require clean new industries <strong>and</strong> greener existing ones..........................................40<br />
Agricultural practices need transformation....................................................................................................................................... 44<br />
Education <strong>and</strong> lifelong learning contribute to long-term economic growth......................................................................47<br />
Economic growth does not mean prosperity for all........................................................................................................................51<br />
Education can help increase inclusion...................................................................................................................................................53<br />
Education improves labour market <strong>and</strong> decent work outcomes..............................................................................................55<br />
Conclusion............................................................................................................................................................................................................62<br />
CHAPTER 3 • People: inclusive social development.......................................................................................................................... 64<br />
Inclusive social development is critical for sustainable futures for all...................................................................................67<br />
Education improves social development outcomes....................................................................................................................... 77<br />
Social development influences education........................................................................................................................................... 84<br />
Integrated social <strong>and</strong> education interventions are needed........................................................................................................87<br />
Conclusion............................................................................................................................................................................................................93<br />
CHAPTER 4 • Peace: political participation, peace <strong>and</strong> access to juctice.............................................................................. 94<br />
Education <strong>and</strong> literacy contribute to more participatory politics...........................................................................................97<br />
The relationship between education <strong>and</strong> conflict is multifaceted.........................................................................................103<br />
Education can play a key role in building a functioning justice system..............................................................................110<br />
Conclusion............................................................................................................................................................................................................111<br />
CHAPTER 5 • Place: inclusive <strong>and</strong> sustainable cities........................................................................................................................112<br />
Cities affect education planning..............................................................................................................................................................116<br />
Education has a positive influence on cities......................................................................................................................................118<br />
Education <strong>and</strong> knowledge can contribute to inequality in cities.............................................................................................121<br />
Education can influence urban planning.............................................................................................................................................124<br />
A city can transform by placing education <strong>and</strong> lifelong learning at its heart..................................................................126<br />
Conclusion..........................................................................................................................................................................................................129<br />
2016 • GLOBAL EDUCATION MONITORING REPORT vii
CHAPTER 6 • Partnerships: enabling conditions to achieve SDG 4 <strong>and</strong> other SDGs.......................................................130<br />
Finance................................................................................................................................................................................................................. 133<br />
Policy coherence.............................................................................................................................................................................................139<br />
Partnerships......................................................................................................................................................................................................145<br />
Conclusion..........................................................................................................................................................................................................147<br />
CHAPTER 7 • Projections..............................................................................................................................................................................148<br />
Projecting global educational attainment to 2030 <strong>and</strong> beyond..............................................................................................151<br />
Predicting effects of education on development outcomes.................................................................................................... 153<br />
CHAPTER 8 • Education <strong>and</strong> sustainable development: conclusions <strong>and</strong> policy recommendations......................158<br />
Policy recommendations............................................................................................................................................................................163<br />
CHAPTER 9 • The challenges of monitoring education in the Sustainable Development Goals...............................168<br />
Reaching consensus on the post-2015 education targets.......................................................................................................... 172<br />
Opportunities <strong>and</strong> challenges in global education monitoring <strong>and</strong> the role of the GEM Report............................ 175<br />
Outline of the monitoring part.................................................................................................................................................................177<br />
CHAPTER 10 • Target 4.1: Primary <strong>and</strong> secondary education......................................................................................................178<br />
Access, participation <strong>and</strong> completion................................................................................................................................................. 180<br />
Compulsory <strong>and</strong> free education..............................................................................................................................................................185<br />
Quality.................................................................................................................................................................................................................188<br />
Learning outcomes........................................................................................................................................................................................193<br />
CHAPTER 11 • Target 4.2: Early childhood............................................................................................................................................204<br />
Access <strong>and</strong> participation............................................................................................................................................................................206<br />
Quality.................................................................................................................................................................................................................210<br />
Child development outcomes.................................................................................................................................................................. 213<br />
CHAPTER 12 • Target 4.3: Technical, vocational, tertiary <strong>and</strong> adult education..................................................................220<br />
Technical <strong>and</strong> vocational education <strong>and</strong> training.......................................................................................................................... 222<br />
Tertiary education..........................................................................................................................................................................................227<br />
Adult education.............................................................................................................................................................................................. 236<br />
CHAPTER 13 • Target 4.4: Skills for work...............................................................................................................................................242<br />
Cognitive skills................................................................................................................................................................................................244<br />
Non-cognitive skills...................................................................................................................................................................................... 247<br />
Combinations of cognitive <strong>and</strong> non-cognitive skills for work.................................................................................................250<br />
Conclusion......................................................................................................................................................................................................... 253<br />
CHAPTER 14 • Target 4.5: Equity..............................................................................................................................................................254<br />
Inequality measures.....................................................................................................................................................................................257<br />
Gender................................................................................................................................................................................................................. 262<br />
Disability............................................................................................................................................................................................................ 265<br />
Language........................................................................................................................................................................................................... 267<br />
Migration <strong>and</strong> forced displacement...................................................................................................................................................... 271<br />
CHAPTER 15 • Target 4.6: Literacy <strong>and</strong> numeracy........................................................................................................................... 274<br />
Participation in adult literacy programmes............................................................................................................................................277<br />
Literacy rates........................................................................................................................................................................................................ 278<br />
Literacy <strong>and</strong> numeracy proficiency levels..............................................................................................................................................280<br />
Conclusion..............................................................................................................................................................................................................285<br />
viii<br />
2016 • GLOBAL EDUCATION MONITORING REPORT
CHAPTER 16 • Target 4.7: Sustainable development <strong>and</strong> global citizenship.......................................................................286<br />
International st<strong>and</strong>ard-setting instruments...................................................................................................................................289<br />
Curricula.............................................................................................................................................................................................................289<br />
Textbooks..........................................................................................................................................................................................................294<br />
Teacher education.........................................................................................................................................................................................296<br />
Activities outside the classroom............................................................................................................................................................298<br />
Outcomes..........................................................................................................................................................................................................299<br />
CHAPTER 17 • Target 4.A: Education facilities <strong>and</strong> learning environments.........................................................................306<br />
School infrastructure...................................................................................................................................................................................308<br />
Information <strong>and</strong> communication technology in schools............................................................................................................311<br />
Violence <strong>and</strong> attacks in schools..............................................................................................................................................................314<br />
CHAPTER 18 • Target 4.B: Scholarships..................................................................................................................................................318<br />
Number of scholarships...................................................................................................................................................................................320<br />
Aid data on scholarships................................................................................................................................................................................. 324<br />
CHAPTER 19 • Target 4.C: Teachers......................................................................................................................................................... 326<br />
Adequate supply of qualified teachers..................................................................................................................................................... 328<br />
Teacher motivation <strong>and</strong> support..................................................................................................................................................................333<br />
CHAPTER 20 • Finance..................................................................................................................................................................................340<br />
National education accounts................................................................................................................................................................... 342<br />
Improving financial data............................................................................................................................................................................346<br />
CHAPTER 21 • Education systems.......................................................................................................................................................... 358<br />
Diagnostic tools for monitoring education systems....................................................................................................................361<br />
Looking ahead................................................................................................................................................................................................. 365<br />
CHAPTER 22 • Education in the other SDGs.......................................................................................................................................366<br />
Direct references to education in global SDG indicators ..........................................................................................................368<br />
Indirect references to education in global SDG indicators ......................................................................................................369<br />
Lifelong learning as a factor contributing across the SDGs......................................................................................................373<br />
CHAPTER 23 • Priorities for monitoring education in the Sustainable Development Goals.......................................374<br />
Synthesis of monitoring challenges <strong>and</strong> opportunities..............................................................................................................377<br />
Recommendations on monitoring the education agenda........................................................................................................ 379<br />
CHAPTER 24 • Epilogue................................................................................................................................................................................384<br />
The GEM Report as an informed <strong>and</strong> honest broker on issues of education <strong>and</strong> sustainable development........387<br />
Strengthening accountability in the SDG follow-up <strong>and</strong> review architecture – <strong>and</strong> in education........................388<br />
Annex............................................................................................................................................................ 390<br />
Statistical Tables............................................................................................................................................................................................ 401<br />
Aid Tables...........................................................................................................................................................................................................478<br />
Glossary..............................................................................................................................................................................................................493<br />
Abbreviations...................................................................................................................................................................................................497<br />
Index.....................................................................................................................................................................................................................501<br />
The references for the 2016 Global Education Monitoring Report can be downloaded at the following link:<br />
https://en.unesco.org/gem-report/sites/gem-report/files/2016ReportReferences.pdf<br />
2016 • GLOBAL EDUCATION MONITORING REPORT ix
List of figures, tables, <strong>and</strong> text boxes<br />
FIGURES<br />
Figure 0.1: Lifelong learning opportunities for all........................................................................................................................................................................................8<br />
Figure 1.1: Global environmental health faces critical thresholds on several fronts................................................................................................................. 20<br />
Figure 1.2a: High levels of human development have come at an ecological cost.....................................................................................................................22<br />
Figure 1.2b: Some nations have raised the quality of human development while maintaining a low ecological footprint....................................23<br />
Figure 1.3: Poor children in the countries most at risk for climate change disasters are less likely to complete secondary school..................34<br />
Figure 2.1: Employment is being polarized by skill category on the global level............................................................................................................................50<br />
Figure 2.2: Large proportions of workers remain in poverty.................................................................................................................................................................... 52<br />
Figure 2.3: Inequality has grown across rich <strong>and</strong> poor regions...............................................................................................................................................................53<br />
Figure 2.4: Increasing levels of education are associated with lower working poverty...............................................................................................................57<br />
Figure 2.5: Upper secondary attainment can substantially lower the risk of vulnerable <strong>and</strong> informal employment.................................................. 58<br />
Figure 2.6: Tertiary education is largely required for employment in high skill occupations................................................................................................... 59<br />
Figure 3.1: There has been progress in improving basic education <strong>and</strong> health outcomes <strong>and</strong> providing essential basic<br />
services, but major challenges remain...........................................................................................................................................................................................................69<br />
Figure 3.2: Women do more unpaid work than men, <strong>and</strong> often are more likely to be employed in the informal sector............................................70<br />
Figure 3.3: Men <strong>and</strong> women work in different formal occupations.......................................................................................................................................................70<br />
Figure 3.4: Few women hold leadership positions in corporations <strong>and</strong> governments in middle <strong>and</strong> high income countries................................... 71<br />
Figure 3.5: There are large disparities within countries in educational attainment by wealth <strong>and</strong> gender.......................................................................74<br />
Figure 3.6: Many rural areas have low levels of literacy, particularly among poor females.......................................................................................................75<br />
Figure 3.7: Education marginalization is compounded on ethnic <strong>and</strong> regional lines, particularly for women................................................................. 76<br />
Figure 3.8: While being underweight is more common in lower income countries, being overweight is more prevalent in many<br />
upper middle <strong>and</strong> high income countries.....................................................................................................................................................................................................80<br />
Figure 3.9: In most countries, women with secondary <strong>and</strong> higher levels of education are less likely to report having experienced<br />
spousal violence.........................................................................................................................................................................................................................................................81<br />
Figure 3.10: In most countries, women with higher levels of education are less likely to have undergone female genital mutilation............... 82<br />
Figure 3.11: Almost all young children reach the age of 5 in countries where most women are literate............................................................................. 83<br />
Figure 3.12: Many countries with discriminatory social institutions have worse gender gaps in lower secondary completion rates................ 87<br />
Figure 3.13: Women consistently earn less than men in OECD countries, even though gender gaps in secondary attainment vary.................88<br />
Figure 3.14: Growth in female lower secondary completion rates is not always linked to higher female labour force participation...................89<br />
Figure 4.1: In the Philippines, children <strong>and</strong> youth in a conflict-affected region are left behind ........................................................................................... 105<br />
Figure 4.2: Education conditions for refugee children vary widely.....................................................................................................................................................106<br />
Figure 4.3:Violence in school affects students’ ability to achieve minimal numeracy skills..................................................................................................109<br />
Figure 5.1a: We live in an increasingly urban world….................................................................................................................................................................................... 116<br />
Figure 5.1b: … <strong>and</strong> much future urban growth is expected to happen in lower income countries........................................................................................ 116<br />
Figure 5.2: Developing countries have rural–urban disparity but also very high intra-urban disparity............................................................................122<br />
Figure 5.3: In Kisumu, Kenya, the concentration of primary schools, primary school toilets <strong>and</strong> private schools depends on location ........123<br />
Figure 5.4a: In Medellín, Colombia, education reform was targeted to improve inclusion…...................................................................................................128<br />
Figure 5.4b: … <strong>and</strong> linked to crime reduction .................................................................................................................................................................................................128<br />
Figure 5.5: Local government officials view the education sector as led by the national or state level............................................................................129<br />
Figure 6.1: What type of integration <strong>and</strong> support are needed to achieve the sustainable development agenda?.......................................................134<br />
Figure 6.2: Increased allocation to education spending can happen at every level of economic development............................................................136<br />
Figure 6.3: Aid to basic education is not related to need.....................................................................................................................................................................138<br />
Figure 6.4: Inequities in aid to basic education persist........................................................................................................................................................................139<br />
Figure 6.5: Donors prioritize levels of education that are less accessible to the poor................................................................................................................139<br />
Figure 7.1: Not even universal primary completion will be achieved by 2030 in low <strong>and</strong> lower middle income countries, on past trends..... 154<br />
Figure 7.2: Achieving universal secondary completion by 2030 will require unprecedented acceleration...................................................................... 154<br />
Figure 7.3: Achieving the SDG education target would save millions of children’s lives.............................................................................................................156<br />
Figure 7.4: Universal upper secondary completion by 2030 could lift millions out of poverty by 2050 in low income countries.......................157<br />
Figure 10.1: More than 4 in 10 children not in school will never enrol.................................................................................................................................................. 181<br />
Figure 10.2: Almost 30% of the poorest children in low income countries have never been to school............................................................................... 181<br />
Figure 10.3: Over-age attendance especially affects girls <strong>and</strong> the poor in some countries.................................................................................................... 184<br />
Figure 10.4: Universal secondary completion is a distant target for most countries................................................................................................................ 186<br />
x<br />
2016 • GLOBAL EDUCATION MONITORING REPORT
Figure 10.5: In just 2 out of 90 low <strong>and</strong> middle income countries have the poorest young <strong>people</strong> attained at least 12 years<br />
of education.............................................................................................................................................................................................................................................................. 186<br />
Figure 10.6: In almost one-quarter of countries, education is compulsory for fewer than nine years..............................................................................187<br />
Figure 10.7: In some sub-Saharan African countries, few primary school students have personal copies of textbooks.........................................190<br />
Figure 10.8: In northern Nigeria, only one-quarter of time is used for instruction......................................................................................................................192<br />
Figure 10.9: In Latin America, almost 50% of grade 3 <strong>and</strong> 6 students do not reach the minimum proficiency level in mathematics ..............195<br />
Figure 10.10: Early grade reading assessments reveal that many children are unable to read a single word after two or three<br />
years in school ........................................................................................................................................................................................................................................................ 196<br />
Figure 10.11: Whether indicators cover all students or all children can make a huge difference to global reporting....................................................197<br />
Figure 10.12: Most national assessments test learning outcomes in language <strong>and</strong> mathematics...................................................................................... 199<br />
Figure 10.13: Burundi outperformed its peers in terms of learning achievement – but why?............................................................................................... 202<br />
Figure 11.1: Similar indicators of pre-primary education participation give different results in many countries........................................................ 208<br />
Figure 11.2: Accounts of participation in early childhood care <strong>and</strong> education programmes differ between households <strong>and</strong> schools............. 209<br />
Figure 11.3: There is wide disparity in access to early childhood education programmes between <strong>and</strong> within countries...................................... 210<br />
Figure 11.4: Home learning environments differ substantially between countries......................................................................................................................215<br />
Figure 11.5: About three quarters of 3- to 4-year olds are developmentally on track in 56 countries.................................................................................219<br />
Figure 12.1: Only 2% of secondary school students were enrolled in technical <strong>and</strong> vocational programmes in Southern Asia.............................223<br />
Figure 12.2: A broader definition suggests wider youth access to technical-vocational programmes..............................................................................224<br />
Figure 12.3: There are huge disparities across countries in terms of access to tertiary education.....................................................................................228<br />
Figure 12.4: The share of young <strong>people</strong> who graduate with a bachelor’s or master’s degree differs widely between countries.........................229<br />
Figure 12.5: Disparity for men worsens between tertiary education participation <strong>and</strong> completion..................................................................................230<br />
Figure 12.6: There are vast differences in tertiary attainment between the poor <strong>and</strong> the rich..............................................................................................231<br />
Figure 12.7: In Colombia, students with lower admission scores are less likely to graduate..................................................................................................232<br />
Figure 12.8: There are diverse ways of making tertiary education affordable...............................................................................................................................233<br />
Figure 12.9: Research output weighs heavily in global tertiary education ranking systems..................................................................................................235<br />
Figure 12.10: In Bolivia, one in eight adults without secondary school qualifications participated in a second chance programme................ 237<br />
Figure 12.11: Adult education participation rates in Europe are higher among the more educated....................................................................................238<br />
Figure 12.12: Different surveys point to different levels of adult education participation.......................................................................................................239<br />
Figure 13.1: The frequency of computer-related activities varies across countries <strong>and</strong> by task...........................................................................................246<br />
Figure 13.2: There is a large divide in digital literacy skills between poorer <strong>and</strong> richer countries.........................................................................................247<br />
Figure 13.3: Socio-economic disadvantage is negatively associated with perseverance.........................................................................................................249<br />
Figure 13.4: Financial literacy skills are unequally distributed across countries............................................................................................................................251<br />
Figure 14.1: For the same population, different measures can yield opposite conclusions on education inequality.................................................258<br />
Figure 14.2: Inequality measures can be calculated for different education indicators <strong>and</strong> population group characteristics...........................259<br />
Figure 14.3: Gender disparity is higher among the poorest................................................................................................................................................................... 260<br />
Figure 14.4: Education disparity by wealth declined faster in Southern Asia than in sub-Saharan Africa...................................................................... 260<br />
Figure 14.5: The parity index as a measure of education inequality needs to be interpreted cautiously.........................................................................261<br />
Figure 14.6: Much nuance in education inequality is lost using simple measures.......................................................................................................................262<br />
Figure 14.7: What is the primary completion rate in Nigeria?................................................................................................................................................................263<br />
Figure 14.8: Perceptions <strong>and</strong> responses to special educational needs..............................................................................................................................................266<br />
Figure 14.9: Linguistic diversity is greatest in countries in sub-Saharan Africa............................................................................................................................268<br />
Figure 14.10: Use of local languages is rising in sub-Saharan Africa, but most countries are far from nationwide mother<br />
tongue instruction.................................................................................................................................................................................................................................................268<br />
Figure 14.11: In Lao Cai province, Viet Nam, most teachers speak a different language than their students........................................................................269<br />
Figure 14.12: Kenya <strong>and</strong> Ug<strong>and</strong>a followed different routes in implementing their language of instruction policy.....................................................270<br />
Figure 15.1: In poorer countries, less than one in ten adults has ever participated in an adult literacy programme.............................................. 278<br />
Figure 15.2: Fewer adults in rural areas had participated in an adult literacy programme in Niger, but more adults with literacy<br />
skills in rural areas had done so.......................................................................................................................................................................................................................279<br />
Figure 15.3: In many countries, literacy rates differ widely between official <strong>and</strong> household survey sources........................................................................281<br />
Figure 15.4: Assessing literacy on a continuous scale more accurately reflects adult skills...................................................................................................282<br />
Figure 16.1: In 32 countries, only fewer than half of schools provide life skills-based HIV education................................................................................292<br />
Figure 16.2: Human rights is the most prevalent concept in national curricula............................................................................................................................293<br />
Figure 16.3: Prevalence of key terms relating to global citizenship <strong>and</strong> sustainable development varies across countries...................................294<br />
Figure 16.4: Some progress has been achieved in the extent to which textbooks include gender equality...................................................................295<br />
Figure 16.5: Environment is a theme of growing importance in textbooks.....................................................................................................................................296<br />
Figure 16.6: In many countries, no more than two-thirds are familiar with the Universal Declaration of Human Rights......................................300<br />
Figure 16.7: Environmental knowledge varies widely between countries........................................................................................................................................ 301<br />
Figure 17.1: Three in 10 primary schools still lack adequate water supply <strong>and</strong> sanitation....................................................................................................... 309<br />
2016 • GLOBAL EDUCATION MONITORING REPORT xi
Figure 17.2: Most primary schools do not have electricity in some of the poorest countries................................................................................................312<br />
Figure 17.3: Electricity access does not automatically translate to internet access in schools.............................................................................................313<br />
Figure 17.4: In many countries, the pupil/computer ratio is too high to enable meaningful learning...............................................................................314<br />
Figure 17.5: In Latin America, psychological bullying is twice as prevalent as physical bullying..........................................................................................315<br />
Figure 17.6: Many adolescents across the world are involved in physical fights............................................................................................................................316<br />
Figure 18.1: Many students from small isl<strong>and</strong> developing states are studying abroad.............................................................................................................323<br />
Figure 18.2: Half of all aid for scholarships <strong>and</strong> imputed student costs is concentrated in 13 middle income countries ........................................324<br />
Figure 18.3: Most aid to higher education is directed to scholarships <strong>and</strong> imputed student costs....................................................................................325<br />
Figure 19.1: The pupil/teacher ratio is not the same as the number of students in a classroom..........................................................................................329<br />
Figure 19.2: More than half of pre-primary <strong>and</strong> one quarter of secondary school teachers in sub-Saharan Africa are not trained....................331<br />
Figure 19.3: In half of countries, more than one in four pre-primary teachers are not trained..............................................................................................331<br />
Figure 19.4: Teacher motivation results from interaction of external factors with individual traits, values <strong>and</strong> skills..............................................334<br />
Figure 19.5: The percentage of contract teachers varies between <strong>and</strong> within countries......................................................................................................... 337<br />
Figure 19.6: Teachers in Latin America earn less than other professionals......................................................................................................................................338<br />
Figure 20.1: There are multiple sources <strong>and</strong> uses of education financing........................................................................................................................................343<br />
Figure 20.2: Taking household expenditure into account can transform underst<strong>and</strong>ing of national education financing................................... 344<br />
Figure 20.3: One in four countries falls below both international education financing benchmarks.................................................................................347<br />
Figure 20.4: Myanmar is making an effort to reach minimum benchmarks in education financing.................................................................................348<br />
Figure 20.5: Information on even the most basic education financing indicators is often missing..................................................................................349<br />
Figure 20.6: Expenditure on education has increased since 2000......................................................................................................................................................349<br />
Figure 20.7: Aid to education has yet to return to 2010 levels..............................................................................................................................................................353<br />
Figure 20.8: The share of aid to education to low income <strong>and</strong> least developed countries has remained constant...................................................354<br />
Figure 20.9: There are differences in the focus on low income countries across donors <strong>and</strong> over time..........................................................................355<br />
Figure 20.10: Loans are a considerable part of official development assistance, even in education..................................................................................356<br />
Figure 20.11: Education remains an underprioritized <strong>and</strong> underfunded sector of humanitarian aid.................................................................................. 357<br />
Figure 21.1: The SABER programme covers a wide range of aspects of education systems...................................................................................................362<br />
Figure 22.1: Education is positively associated with desirable development outcomes..........................................................................................................370<br />
Figure 22.2: There is vast disparity in the availability of scientific <strong>and</strong> technical personnel.................................................................................................. 372<br />
TABLES<br />
Table 0.1: How education is typically linked with other Sustainable Development Goals.......................................................................................................10<br />
Table 0.2: Sustainable education learning outcomes............................................................................................................................................................................... 11<br />
Table 1.1: Population growth is slowing but will remain a challenge in lower income countries...........................................................................................21<br />
Table 1.2: Environmental education has evolved over the years.........................................................................................................................................................25<br />
Table 7.1: Projection scenarios.................................................................................................................................................................................................................................152<br />
Table 7.2: Projected attainment rates in 2030 <strong>and</strong> year of achieving universal attainment in the trend scenario, by education level.............153<br />
Table 7.3: Percentage of countries that would achieve selected targets at the highest rate of improvement in<br />
education previously achieved in their region..........................................................................................................................................................................................155<br />
Table 10.1: Primary <strong>and</strong> secondary education participation indicators, 2014..................................................................................................................................182<br />
Table 10.2: Countries with the largest out-of-school numbers <strong>and</strong> rates, 2014 or latest available year............................................................................183<br />
Table 10.3: Completion rates by education level, income group, sex <strong>and</strong> wealth, 2008–2014 (%)........................................................................................ 185<br />
Table 10.4: A framework for education quality.............................................................................................................................................................................................. 188<br />
Table 11.1: Distribution of countries by pre-primary education duration <strong>and</strong> starting age, <strong>and</strong> whether it is free <strong>and</strong> compulsory..................207<br />
Table 11.2: Setting <strong>and</strong> enforcing st<strong>and</strong>ards on the pupil/teacher ratio in public early childhood education institutions,<br />
selected countries, 2012–2015...........................................................................................................................................................................................................................213<br />
Table 11.3: Early childhood development tools................................................................................................................................................................................................218<br />
Table 12.1: A typology of technical <strong>and</strong> vocational education <strong>and</strong> training provision.................................................................................................................223<br />
Table 12.2: Indicators of tertiary education....................................................................................................................................................................................................228<br />
Table 12.3: Tertiary education participation indicators..............................................................................................................................................................................229<br />
Table 12.4: Key differences in adult education participation questions in the European Union Labour Force Survey <strong>and</strong> the<br />
Adult Education Survey.......................................................................................................................................................................................................................................238<br />
Table 13.1: Computer-related activities included in the definition of ICT skills..............................................................................................................................245<br />
Table 13.2: Dimensions of entrepreneurial skills............................................................................................................................................................................................252<br />
Table 14.1: Gender parity index, by region <strong>and</strong> country income group, 2014 .................................................................................................................................262<br />
Table 14.2: Potential indicators of gender inequality in education, by domain.............................................................................................................................264<br />
Table 14.3: Selected questions from the Washington Group/UNICEF Survey Module on Child Functioning........................................................................ 267<br />
Table 15.1: Youth <strong>and</strong> adult literacy .................................................................................................................................................................................................................... 280<br />
xii<br />
2016 • GLOBAL EDUCATION MONITORING REPORT
Table 17.1: UIS core indicators on ICT in education.......................................................................................................................................................................................311<br />
Table 19.1: Support opportunities for new primary school teachers, selected countries, 2010–2014.................................................................................335<br />
Table 20.1: Selected education financing indicators based on national education accounts ................................................................................................345<br />
Table 20.2: Public education expenditure, by region <strong>and</strong> country income group, 2014............................................................................................................346<br />
Table 20.3: A framework to assess country commitment to equity through financing............................................................................................................351<br />
Table 20.4: Aid disbursements to education, by region <strong>and</strong> income level, 2010 <strong>and</strong> 2014.......................................................................................................354<br />
Table: Proposed thematic <strong>and</strong> global indicators presented in the statistical tables..................................................................................................................393<br />
TEXT BOXES<br />
Box 0.1: The Millennium Development Goals failed to ensure environmental sustainability......................................................................................................5<br />
Box 0.2: The Sustainable Development Goals.....................................................................................................................................................................................................6<br />
Box 0.3: SDG 4: the education goal <strong>and</strong> targets.................................................................................................................................................................................................7<br />
Box 0.4: Historical international agreements that affirm the right to education.............................................................................................................................8<br />
Box 1.1: Governments have adopted local community practices of buen vivir.................................................................................................................................27<br />
Box 1.2: Leading by example: nudging <strong>people</strong> to act green........................................................................................................................................................................ 31<br />
Box 1.3: Climate change <strong>and</strong> natural disasters severely affect education systems <strong>and</strong> outcomes.......................................................................................33<br />
Box 1.4: Small isl<strong>and</strong> states use the entire education system to prepare for climate change..................................................................................................35<br />
Box 2.1: Green industries dem<strong>and</strong> particular skills......................................................................................................................................................................................... 42<br />
Box 2.2: What is decent work?................................................................................................................................................................................................................................. 55<br />
Box 4.1: Better education <strong>and</strong> women’s involvement in national <strong>and</strong> local decision-making bodies are closely linked.............................................99<br />
Box 5.1: Dealing with declining populations with rural school consolidation...................................................................................................................................117<br />
Box 5.2: Education for awareness <strong>and</strong> consensus-building has been important for smooth adoption of bus rapid transit systems................121<br />
Box 5.3: Education is a critical component of making cycling the norm in urban transport...................................................................................................121<br />
Box 5.4: A cradle-to-career approach can integrate education with community development............................................................................................125<br />
Box 5.5: Better urban planning can foster inclusion of slum dwellers................................................................................................................................................126<br />
Box 5.6: Curitiba used both explicit <strong>and</strong> implicit education initiatives to become a green city............................................................................................127<br />
Box 6.1: School feeding <strong>and</strong> school health as integrated delivery mechanisms...........................................................................................................................140<br />
Box 6.2: The MDG Achievement Fund <strong>and</strong> the SDG Fund........................................................................................................................................................................ 144<br />
Box 7.1: Key considerations in projecting educational attainment .....................................................................................................................................................152<br />
Box 10.1: Monitoring quality in SDG 4................................................................................................................................................................................................................ 188<br />
Box 10.2: Collecting comparable classroom observation data in sub-Saharan Africa................................................................................................................. 191<br />
Box 10.3: A new module on learning outcomes in Multiple Indicator Cluster Surveys...............................................................................................................197<br />
Box 10.4: Assessing learning outcomes in Nigeria....................................................................................................................................................................................... 198<br />
Box 10.5: Multiple assessments but no national learning assessment system in the United Republic of Tanzania ................................................. 201<br />
Box 11.1: Defining positive <strong>and</strong> stimulating home learning environments........................................................................................................................................215<br />
Box 12.1: In Colombia, a strong management information system provides policy-specific data on tertiary education.......................................232<br />
Box 12.2: In Chile, persistent student dem<strong>and</strong>s for affordable higher education triggered reform....................................................................................234<br />
Box 12.3: The adult education system in Portugal supports the more disadvantaged.............................................................................................................238<br />
Box 13.1: The fundamental but elusive skills of creativity, critical thinking <strong>and</strong> collaboration.............................................................................................. 248<br />
Box 13.2: Nurturing entrepreneurship skills in Palestine...........................................................................................................................................................................253<br />
Box 14.1: Different measures can lead to different conclusions on inequality ..............................................................................................................................258<br />
Box 14.2: The Inter-Agency Group on Education Inequality Indicators ..........................................................................................................................................263<br />
Box 15.1: Measuring participation in literacy programmes in Niger....................................................................................................................................................279<br />
Box 15.2: Differences between national <strong>and</strong> international numeracy assessments ..................................................................................................................283<br />
Box 16.1: Monitoring Holocaust education in curricular content......................................................................................................................................................... 290<br />
Box 16.2: Monitoring classroom interactions on sustainable development is challenging.....................................................................................................298<br />
Box 16.3: Assessment of global competence in the 2018 PISA assessment ..................................................................................................................................303<br />
Box 17.1: A school infrastructure index in Paraguay.................................................................................................................................................................................... 308<br />
Box 19.1: Monitoring the preparedness <strong>and</strong> development of school leaders..................................................................................................................................332<br />
Box 19.2: Directly assessing teacher skills....................................................................................................................................................................................................... 333<br />
Box 19.3: Upgrading ‘parents’ teachers’ in Cameroon................................................................................................................................................................................ 337<br />
Box 20.1: Ending a legacy of very low public spending on education in Myanmar.....................................................................................................................348<br />
Box 20.2: Promoting equity through education financing policies in Morocco...........................................................................................................................352<br />
Box 21.1: Engaging in multiple initiatives to diagnose education systems – the case of Brazil............................................................................................364<br />
2016 • GLOBAL EDUCATION MONITORING REPORT xiii
HIGHLIGHTS<br />
Education for <strong>people</strong> <strong>and</strong> <strong>planet</strong>: key facts <strong>and</strong> figures<br />
PLANET<br />
Education is the most effective tool for reducing fertility rates: For example, one<br />
extra year of education in Madagascar increased spaces between births by 0.5 years.<br />
Environmental education can increase green knowledge: 73% of 78 countries’ curricula<br />
mention ‘sustainable development’, 55% mention ‘ecology’ <strong>and</strong> 47% ‘environmental education’.<br />
Sustainability practices continue outside of school: A 2008 survey reported that<br />
over 40% of global executives thought it important for their companies to align<br />
sustainability with their business.<br />
Education is crucial for disaster preparedness: If education progress is stalled, it<br />
could lead to a 20% increase in disaster-related fatalities per decade.<br />
Education systems should not encourage unsustainable lifestyles <strong>and</strong> can learn<br />
much from indigenous communities: They should respect local cultures <strong>and</strong> plural<br />
knowledge systems, <strong>and</strong> provide instruction in local languages.<br />
PROSPERITY<br />
Education can help increase agricultural productivity: Farm output needs to rise by<br />
at least 70% by 2050. Field schools <strong>and</strong> extension education help farmers increase<br />
productivity by 12% <strong>and</strong> net revenue by 19%.<br />
xiv<br />
HIGHLIGHTS
Education can provide skills for green innovation: But sub-Saharan Africa’s share<br />
of global expenditure on public agricultural research declined from 10% in 1960 to<br />
6% in 2009.<br />
Education reduces working poverty: It affects almost 90% of workers in low income<br />
countries. Increasing tertiary education in 10 recent EU member states would reduce<br />
numbers at risk of poverty by 3.7 million.<br />
Tertiary education is required to sustain <strong>and</strong> exp<strong>and</strong> high-skills occupations: In<br />
2015, two-thirds of workers were employed in medium skills occupations.<br />
Education needs to keep up with labour market needs: By 2020 the world could have<br />
40 million too few workers with tertiary education, relative to dem<strong>and</strong>.<br />
PEOPLE<br />
Millions, particularly the marginalized, lack access to basic services: In 2012, in low<br />
income countries, only 28% had access to sanitation facilities <strong>and</strong> 25% to electricity;<br />
67% made it to the last grade of primary education.<br />
Gender equality is a long way off: Only 19% of heads of state or government are<br />
women. Women in many countries do at least twice as much unpaid work as men.<br />
Education improves health <strong>and</strong> reduces fertility rates: Educating mothers increased<br />
reliance on exclusive breastfeeding by 90% for the first six months. Four years more<br />
in school in Nigeria reduced fertility rates by one birth per young girl.<br />
Health <strong>and</strong> nutrition improve education: Female literacy rates were 5% higher for<br />
those with better access to water in India. In Kenya, girls who received deworming<br />
treatment were 25% more likely to pass the primary school exam.<br />
2016 • GLOBAL EDUCATION MONITORING REPORT xv
PLACE<br />
Urbanization puts strain on education systems: In China in 2004, one-fifth of the<br />
120 million internal migrants had less than a primary education. Of the more than<br />
25 million refugees in 2015, 60% live in urban areas <strong>and</strong> half are under age 18. In<br />
Turkey, only 30% of refugees in urban areas were in formal education.<br />
Education helps reduce inequality in cities by giving <strong>people</strong> vital skills for work: Street<br />
vendors make up one-third of urban employment in India <strong>and</strong> one-sixth in South Africa.<br />
Education reduces crime in cities: In the United States, if 5% more men graduated<br />
from high school it would add US$20 billion to the economy via reduced crime <strong>and</strong><br />
higher earnings.<br />
Education improves cities’ prosperity <strong>and</strong> makes them green: Some 18,000 firms<br />
created by Stanford University alumni are based in California, in urban areas. In<br />
countries with cycling cities, such as Denmark, Germany <strong>and</strong> the Netherl<strong>and</strong>s,<br />
children receive safe-cycling training in school from an early age.<br />
PEACE<br />
Education can encourage constructive political participation: In 106 countries, <strong>people</strong><br />
with higher levels of education were more likely to engage in non-violent protests.<br />
In 102 countries, adults with a tertiary education were 60% more likely to request<br />
information from the government than those with a primary education or less.<br />
Education needs to be better recognized in peace agreements: It was mentioned in<br />
only two-thirds of such agreements between 1989 <strong>and</strong> 2005.<br />
Only the right type of education works: In Rw<strong>and</strong>a, curricular content exacerbated<br />
Hutu-Tutsi divisions.<br />
Conflict is destroying education: Of those out of school, 35% of children of primary<br />
school age, 25% of adolescents of lower secondary age <strong>and</strong> 18% of youth of upper<br />
secondary age live in conflict-affected areas.<br />
xvi<br />
HIGHLIGHTS
Education helps <strong>people</strong> get access to justice systems: In 2011, in the former Yugoslav<br />
Republic of Macedonia, 32% of those with primary education understood the judicial<br />
system, compared with 77% with higher education.<br />
PARTNERSHIPS<br />
Aid is not being targeted to those most in need: Education aid received by<br />
170 countries since 2003 has been associated less with need, <strong>and</strong> more with<br />
trade interests.<br />
Poor quality education can decrease tax compliance: Low literacy was associated<br />
with reduced tax revenue in 123 countries between 1996 <strong>and</strong> 2010.<br />
PROJECTIONS<br />
On current trends, universal primary completion will be achieved in 2042, universal<br />
lower secondary completion in 2059 <strong>and</strong> universal upper secondary completion in 2084.<br />
Rich countries are not on course either: Even at the fastest rate of progress ever<br />
seen in the region, 1 in 10 countries in Europe <strong>and</strong> Northern America would still not<br />
achieve universal upper secondary completion by 2030.<br />
Universalizing upper secondary completion for women in sub-Saharan Africa by<br />
2030 would result in 300,000 to 350,000 fewer child deaths per year in 2050.<br />
In low income countries, universalizing upper secondary completion by 2030 would<br />
increase per capita income by 75% by 2050 <strong>and</strong> bring poverty elimination forward by<br />
10 years.<br />
Universal upper secondary completion by 2030 would prevent up to 50,000 disasterrelated<br />
deaths per decade by 2040-2050.<br />
2016 • GLOBAL EDUCATION MONITORING REPORT xvii
Monitoring SDG 4<br />
TARGET 4.1: Primary <strong>and</strong> secondary<br />
education<br />
■■<br />
In 2014, 263 million children, adolescents <strong>and</strong> youth<br />
were out of school.<br />
■■<br />
In 2008–2014, 84% of youth completed upper<br />
secondary school in high income, 43% in upper middle<br />
income, 38% in lower middle income <strong>and</strong> 14% in low<br />
income countries.<br />
TARGET 4.4: Skills for work<br />
■■<br />
In the European Union, in 2014, 65% of adults could<br />
send an email with an attachment <strong>and</strong> 44% could use<br />
basic arithmetic formulas in spreadsheets.<br />
■■<br />
According to one definition, one-third of adults are<br />
financially literate.<br />
■■<br />
Across the 15 countries in the TERCE study in Latin<br />
America, 60% of grade 3 students were at level 2 <strong>and</strong><br />
above in reading.<br />
TARGET 4.2: Early childhood<br />
■■<br />
Pre-primary education is free <strong>and</strong> compulsory for at<br />
least one year in only 38 countries.<br />
■■<br />
Children from the richest households are almost<br />
six times more likely to attend an early childhood<br />
education programme than those from the poorest.<br />
TARGET 4.3: Technical, vocational,<br />
tertiary <strong>and</strong> adult education<br />
■■<br />
About 11% of secondary education students were<br />
enrolled in formal TVET in 2014.<br />
■■<br />
Across 76 countries, 20% of the richest 25- to 29-yearolds<br />
had completed at least four years of tertiary<br />
education, compared with less than 1% of the poorest.<br />
■■<br />
In European Union countries, 37% of adults<br />
participated in non-formal education in 2011.<br />
TARGET 4.5: Equity<br />
■■<br />
In low income countries, for every 100 of the richest<br />
youth who complete upper secondary education,<br />
only 7 do so among the poorest youth.<br />
■■<br />
In 2014, 63% of countries achieved gender parity in<br />
primary, 46% in lower secondary <strong>and</strong> 23% in upper<br />
secondary education.<br />
■■<br />
Across 30 education systems in Europe, 3.7% of pupils<br />
had a special educational need in 2010.<br />
■■<br />
Around 40% of <strong>people</strong> are not taught in a language<br />
they speak or fully underst<strong>and</strong>.<br />
■■<br />
50% of primary school-age <strong>and</strong> 75% of secondary<br />
school-age refugees are out of school.<br />
TARGET 4.6: Literacy <strong>and</strong> numeracy<br />
■■<br />
In 2004–2011, only 6% of adults in 29 poorer countries<br />
had ever participated in a literacy programme.<br />
■■<br />
In 2005–2014, 758 million adults, 114 million of whom<br />
are aged 15 to 24, cannot read or write a simple<br />
sentence; nearly two thirds are women.<br />
xviii MONITORING SDG 4
TARGET 4.7: Sustainable development<br />
<strong>and</strong> global citizenship<br />
■■<br />
Three-quarters of countries emphasized sustainable<br />
development issues in their curricula between<br />
2005 <strong>and</strong> 2015; 15% included key terms related to<br />
gender equality.<br />
■■<br />
Close to 50% of secondary school textbooks<br />
mentioned human rights over 2000–2013.<br />
TARGET 4.A: Education facilities <strong>and</strong><br />
learning environments<br />
■■<br />
In sub-Saharan Africa, less than three-quarters of<br />
pre-primary <strong>and</strong> half of upper secondary school<br />
teachers are trained.<br />
FINANCE:<br />
■■<br />
In at least 35 countries, governments spent less than<br />
4% of GDP <strong>and</strong> less than 15% of their total expenditure<br />
on education.<br />
■ ■ Aid needs to increase at least sixfold to fill the<br />
US$39 billion annual education finance gap, but in<br />
2014, levels were 8% lower than at their peak in 2010.<br />
■■<br />
Three in ten primary schools lacked an adequate water<br />
supply in 2013.<br />
■■<br />
Schools were used for military purposes in<br />
26 countries between 2005 <strong>and</strong> 2015.<br />
TARGET 4.B: Scholarships<br />
■■<br />
An estimated 25,000 scholarships were offered in<br />
2015 by government programmes to students from<br />
developing countries.<br />
TARGET 4.C: Teachers<br />
■■<br />
In 2014, 82% of teachers had the minimum<br />
qualifications required to teach in pre-primary<br />
education, 93% in primary education <strong>and</strong> 91% in<br />
secondary education.<br />
2016 • GLOBAL EDUCATION MONITORING REPORT xix
A young boy takes<br />
part in a reforestation<br />
project in Cape Town,<br />
South Africa, where<br />
children learn to<br />
reconnect with nature.<br />
CREDIT: Sydelle Willow Smith/GEM Report<br />
xx<br />
INTRODUCTION | SUSTAINABLE DEVELOPMENT: A STRATEGY FOR PEOPLE, PLANET AND PROSPERITY
INTRODUCTION<br />
I<br />
Sustainable<br />
development:<br />
a strategy for<br />
<strong>people</strong>, <strong>planet</strong><br />
<strong>and</strong> prosperity<br />
1
I<br />
INTRODUCTION HIGHLIGHTS<br />
Transforming our world: the 2030 Agenda for Sustainable Development<br />
At the 70th Session of the United Nations General Assembly in September 2015, member states adopted a new<br />
global development agenda, Transforming our world: the 2030 Agenda for Sustainable Development.<br />
The new Agenda unites global development <strong>and</strong> environmental goals in one framework.<br />
There is no single definition of sustainable development: Most challenge the status quo, believing that human<br />
development means nothing without a healthy <strong>planet</strong>.<br />
The Global Education Monitoring Report<br />
The Incheon Declaration affirmed the m<strong>and</strong>ate of the GEM Report as the mechanism for monitoring <strong>and</strong><br />
reporting on the fourth global goal on education as well as on education targets in the other Sustainable<br />
Development Goals (SDGs).<br />
The 2016 GEM Report is the first of a new 15-year series. It shows that education will not deliver its full potential<br />
to catapult the world forward unless participation rates dramatically improve, learning becomes a lifelong<br />
pursuit <strong>and</strong> education systems fully embrace sustainable development.<br />
The thematic part of the GEM Report discusses the complex links between SDG 4 on education <strong>and</strong> the other<br />
16 SDGs. It presents compelling arguments as to the types of education <strong>and</strong> learning that are vital for achieving<br />
other SDGs.<br />
Monitoring SDG 4<br />
The success of the SDG framework will rely on national policies, plans <strong>and</strong> programmes. However, the agenda’s<br />
goals <strong>and</strong> targets will be monitored <strong>and</strong> reviewed using global indicators with a framework coordinated by the<br />
Inter-agency <strong>and</strong> Expert Group on SDG Indicators <strong>and</strong> agreed by the UN Statistical Commission.<br />
To support country implementation of SDG 4 <strong>and</strong> its targets, the international education community adopted<br />
the Education 2030 Framework for Action in Paris in November 2015.<br />
An important focus of SDG 4 is ‘lifelong learning opportunities for all’, which is a process that begins at birth<br />
<strong>and</strong> carries through all stages of life.<br />
The SDGs, targets <strong>and</strong> means of implementation are universal, indivisible<br />
<strong>and</strong> interlinked<br />
There is strong evidence of the importance of good quality <strong>and</strong> equitable education <strong>and</strong> learning in supporting<br />
social change, as well as the role of education as a cross-cutting means of advancing the 2030 Agenda.<br />
2<br />
INTRODUCTION | SUSTAINABLE DEVELOPMENT: A STRATEGY FOR PEOPLE, PLANET AND PROSPERITY
I<br />
The 2030 Agenda unites development <strong>and</strong> environmental sustainability.......5<br />
Education within sustainable development....................................................................7<br />
Reader’s guide to the report.................................................................................................. 12<br />
The <strong>planet</strong> Earth is in a dire state. Natural resources<br />
have been overexploited. A significant loss of<br />
biodiversity is occurring while a massive rise of carbon<br />
levels is leading to climate change <strong>and</strong> associated<br />
extreme weather. Toxic substances are increasingly<br />
found in air, water, soil, <strong>and</strong> flora <strong>and</strong> fauna. The <strong>planet</strong><br />
faces desertification, drought <strong>and</strong> l<strong>and</strong> degradation.<br />
Human living conditions have not fared much better.<br />
Even though the number of <strong>people</strong> living in extreme<br />
poverty has declined by over 1 billion (United Nations,<br />
2015a), disparities between rich <strong>and</strong> poor continue to<br />
rise. Oxfam recently reported that the world’s richest 62<br />
<strong>people</strong> possess as much wealth as the poorest 3.6 billion<br />
(Hardoon et al., 2016). Too many <strong>people</strong> are trapped in<br />
poverty, <strong>and</strong> lack clean air <strong>and</strong> drinking water as well as<br />
adequate food <strong>and</strong> nutrition. Many families are forcibly<br />
displaced or on the run due to protracted conflict. Wide<br />
disparities persist in access to education of good quality.<br />
It is out of these concerns that the concept of sustainable<br />
development was born.<br />
WHAT IS SUSTAINABLE DEVELOPMENT?<br />
Sustainable development is an organizing principle for<br />
global development that supports the well-being of both<br />
<strong>people</strong> <strong>and</strong> the <strong>planet</strong>.<br />
Since its emergence,<br />
the concept <strong>and</strong> term<br />
Sustainable development<br />
have exp<strong>and</strong>ed to<br />
is an organizing principle<br />
bridge gaps among<br />
for global development environmental,<br />
economic <strong>and</strong> social<br />
that supports the wellbeing<br />
of both <strong>people</strong><br />
concerns, attempting<br />
to integrate<br />
<strong>and</strong> the <strong>planet</strong><br />
environmental<br />
protection <strong>and</strong><br />
ecological integrity, economic viability, <strong>and</strong> social <strong>and</strong><br />
human development. Intergenerational equity, balancing<br />
the needs of present <strong>and</strong> future generations, is also a<br />
key component.<br />
Sustainable development was advanced in the 1960s<br />
<strong>and</strong> 1970s as a concept linking observed interactions<br />
between humans <strong>and</strong> the environment, as documented<br />
in literature such as Silent Spring (Carson, 1962), The<br />
Population Bomb (Ehrlich, 1968) <strong>and</strong> The Limits to Growth<br />
(Meadows et al., 1972). In 1972, the United Nations (UN)<br />
Conference on the Human Environment in Stockholm<br />
marked the beginning of a global conversation on<br />
sustainable governance, although the term was still in<br />
the making. Experts convened a global symposium in<br />
Mexico two years later <strong>and</strong> signed the 1974 Cocoyoc<br />
Declaration, which advocated harmonizing environment<br />
<strong>and</strong> development strategies through ‘eco-development’<br />
(UNEP <strong>and</strong> UNCTAD, 1974).<br />
The first use of the term ‘sustainable development’ in a<br />
major public document was the 1980 World Conservation<br />
Strategy, which confirmed that conservation of living<br />
resources was essential to sustainable development (IUCN<br />
et al., 1980). At the 1986 Conference on Conservation<br />
<strong>and</strong> Development in Ottawa, sustainable development<br />
was defined as: (a) integration of conservation <strong>and</strong><br />
development, (b) satisfaction of basic human needs, (c)<br />
achievement of equity <strong>and</strong> social justice, (d) provision of<br />
social self-determination <strong>and</strong> cultural diversity, <strong>and</strong> (e)<br />
maintenance of ecological integrity (Lele, 1991).<br />
The most common notion of sustainable development<br />
was popularized in the 1987 Brundtl<strong>and</strong> Report,<br />
Our Common Future, which raised questions about the<br />
consequences of traditional economic growth in terms<br />
2016 • GLOBAL EDUCATION MONITORING REPORT 3
I<br />
of environmental degradation <strong>and</strong> poverty (United<br />
Nations, 1987). The Brundtl<strong>and</strong> Report referred to<br />
‘development which meets the needs of the present<br />
without compromising the ability of future generations<br />
to meet their own needs’ <strong>and</strong> listed critical objectives<br />
for sustainable development: changing the quality of<br />
economic growth; meeting essential needs for jobs, food,<br />
energy, water <strong>and</strong> sanitation; ensuring a sustainable<br />
population level; conserving <strong>and</strong> enhancing natural<br />
resources; reorienting technology <strong>and</strong> managing<br />
risk; linking environmental <strong>and</strong> economic concerns<br />
in decision-making; <strong>and</strong> reorienting international<br />
economic relations to make development more<br />
participatory (Lele, 1991).<br />
Global underst<strong>and</strong>ing of sustainable development<br />
has since evolved into a framework developed over<br />
decades by an international community of member<br />
state governments, UN agencies, multilateral<br />
<strong>and</strong> bilateral development partners, civil society<br />
organizations, researchers <strong>and</strong> scientists. It resulted<br />
in the 2030 Agenda for Sustainable Development,<br />
a value-based framework for action that reflects core<br />
beliefs <strong>and</strong> principles (Sachs, 2015).<br />
Several key terms <strong>and</strong> values are essential to<br />
underst<strong>and</strong>ing the post-2015 agenda:<br />
THERE IS NO SINGLE DEFINITION OF<br />
SUSTAINABLE DEVELOPMENT<br />
The different perspectives of sustainable development<br />
include viewing it as a model to improve current systems<br />
(endorsed by those focusing on viable economic<br />
growth), a call for major reforms (supported by those<br />
who advocate for a green economy <strong>and</strong> technological<br />
innovation) <strong>and</strong> an imperative for a larger transformation<br />
in power structures <strong>and</strong> embedded values of society<br />
(supported by transition movements).<br />
Some ecologists, such as deep ecologists, believe presentday<br />
human development focuses too much on <strong>people</strong><br />
<strong>and</strong> ignores the plant, animal <strong>and</strong> spiritual parts of this<br />
world (Leonard <strong>and</strong> Barry, 2009). They believe humans<br />
must learn to be less self-interested <strong>and</strong> place the needs<br />
of other species alongside their own. Transformation<br />
advocates say societies should go back to ways of living<br />
that are locally sustainable – consuming <strong>and</strong> wasting<br />
less, limiting needs to locally available resources,<br />
treating nature with respect, <strong>and</strong> ab<strong>and</strong>oning polluting<br />
technology that has become an integral part of modern<br />
society. Culture advocates believe sustainable living can<br />
happen only if communities truly embrace it as part of<br />
daily culture (Hawkes, 2001) so that it affects decisions<br />
about what to eat, how to commute to work <strong>and</strong> how to<br />
spend leisure time.<br />
■■<br />
People, Planet <strong>and</strong> Prosperity: The ‘3Ps’ are<br />
interdependent <strong>and</strong> mutually reinforcing pillars that<br />
represent the social, environmental <strong>and</strong> economic<br />
aspects of progress for all life forms on Earth.<br />
■■<br />
Good governance: This dimension supports the<br />
3Ps through responsible leadership <strong>and</strong> active<br />
engagement in both the public <strong>and</strong> private sectors.<br />
Good governance ensures peaceful societies <strong>and</strong><br />
upholds human rights for the good of the <strong>planet</strong>.<br />
■■<br />
Links <strong>and</strong> connections: Sustainable development<br />
works as an organizing principle because it recognizes<br />
that complex natural <strong>and</strong> social systems are linked<br />
<strong>and</strong> interconnected. Changes that occur in one system<br />
may affect others in ways that result in something<br />
more than the sum of the parts.<br />
■■<br />
Intergenerational equity <strong>and</strong> justice: Fairness is<br />
critical to a world fit for future generations, where<br />
children can grow up to be healthy, well nourished,<br />
resilient, well educated, culturally sensitive <strong>and</strong><br />
protected from violence <strong>and</strong> neglect, <strong>and</strong> with<br />
access to safe, unpolluted ecosystems. Equity <strong>and</strong><br />
justice are also required for diverse groups in the<br />
current generation.<br />
The South American buen vivir movement rejects<br />
development as materialistic <strong>and</strong> selfish, implying<br />
that living sustainably means finding alternatives to<br />
development (Gudynas, 2011). The buen vivir belief system<br />
comes directly from traditional values of indigenous<br />
<strong>people</strong>, <strong>and</strong> posits that collective needs are more<br />
important than those of the individual. In Ecuador, this<br />
concept is called sumak kawsay, the Quechua term for<br />
fullness of life in a community. It involves learning to<br />
live within boundaries, finding ways to reduce use or to<br />
do more with less, <strong>and</strong> exploring non-material values.<br />
Ecuador <strong>and</strong> the Plurinational State of Bolivia have<br />
incorporated buen vivir into their constitutions.<br />
Most definitions<br />
of sustainable<br />
development challenge<br />
the status quo, believing<br />
human development<br />
lacks meaning without a<br />
healthy <strong>planet</strong><br />
Most definitions<br />
of sustainable<br />
development<br />
challenge the status<br />
quo, believing<br />
human development<br />
lacks meaning<br />
without a healthy<br />
<strong>planet</strong>. This view<br />
requires <strong>people</strong>,<br />
communities<br />
<strong>and</strong> nations to<br />
4<br />
INTRODUCTION | SUSTAINABLE DEVELOPMENT: A STRATEGY FOR PEOPLE, PLANET AND PROSPERITY
I<br />
reconsider basic values of daily living <strong>and</strong> change the<br />
way they think. Underst<strong>and</strong>ing one’s own values, the<br />
values of one’s community <strong>and</strong> society, <strong>and</strong> those of<br />
others around the world is a central part of educating for<br />
a sustainable future. This means education systems need<br />
to continuously evolve <strong>and</strong> change in order to identify<br />
what practices work best within a given context <strong>and</strong> how<br />
they need to change over time. Indeed, for many of its<br />
advocates in education, sustainable development is best<br />
understood as a journey, rather than a destination.<br />
THE 2030 AGENDA UNITES<br />
DEVELOPMENT AND<br />
ENVIRONMENTAL SUSTAINABILITY<br />
The 2030 Agenda for Sustainable Development unites<br />
global development <strong>and</strong> environmental goals in one<br />
framework. It is the result of decades of collective<br />
progress <strong>and</strong> failure <strong>and</strong> the articulation of future<br />
challenges. Since the Brundtl<strong>and</strong> Report, three<br />
international meetings have played an instrumental<br />
role along the path to the 2030 Agenda: the Rio (1992),<br />
Johannesburg (2002) <strong>and</strong> Rio+20 (2012) Earth summits.<br />
The 1992 UN Conference on Environment <strong>and</strong><br />
Development, also known as the Earth Summit,<br />
established Agenda 21, an action plan intended for<br />
governments <strong>and</strong> other major groups. Participants<br />
at the conference in Rio de Janeiro hoped the plan’s<br />
implementation would result in the widespread changes<br />
needed to integrate environmental sustainability <strong>and</strong><br />
development. Agenda 21 included a special chapter<br />
(Chapter 36) on the need for education, public awarenessraising<br />
<strong>and</strong> training to reorient society towards<br />
sustainable development.<br />
The 2002 World Summit on Sustainable Development<br />
(WSSD) in Johannesburg pledged to strengthen the<br />
mutually reinforcing pillars of sustainable development<br />
at the local, national, regional <strong>and</strong> global levels with<br />
the goal to ‘banish underdevelopment forever’ (United<br />
Nations, 2002). The WSSD agenda included fighting<br />
severe threats to sustainable development, including<br />
chronic hunger, malnutrition, terrorism, corruption,<br />
xenophobia <strong>and</strong> endemic, communicable <strong>and</strong> chronic<br />
diseases. Special emphasis was also placed on women’s<br />
empowerment, emancipation <strong>and</strong> gender equality.<br />
The 2012 UN Conference on Sustainable Development in<br />
Rio de Janeiro, commonly referred to as Rio +20, again<br />
evoked the three pillars – the social, environmental<br />
<strong>and</strong> economic dimensions of sustainability – as guides<br />
for international development (United Nations, 2013).<br />
Importantly, Rio +20 acknowledged a lack of progress<br />
in achieving sustainable development, especially<br />
in integrating the three pillars. Therefore, Rio +20<br />
emphasized the role of good governance <strong>and</strong> integrated<br />
planning in achieving sustainable development.<br />
Despite these global meetings, over the past two<br />
decades the Earth’s biosphere has continued to<br />
deteriorate, poverty has remained widespread <strong>and</strong><br />
social inequality has increased. These harmful trends<br />
accelerated despite efforts to meet the Millennium<br />
Development Goals (MDGs), the 2000–2015 global<br />
development <strong>and</strong> anti-poverty agenda. After Rio +20, an<br />
inclusive intergovernmental process began to formulate<br />
the Sustainable Development Goals (SDGs) to succeed<br />
the MDGs, which were approaching their target date <strong>and</strong><br />
had been subject to criticism (Box 0.1).<br />
BOX 0.1<br />
The Millennium Development Goals failed to ensure<br />
environmental sustainability<br />
The eight MDGs – to eradicate extreme poverty <strong>and</strong> hunger; achieve universal<br />
primary education; promote gender equality; reduce child mortality; improve<br />
maternal health; combat HIV/AIDS, malaria <strong>and</strong> other diseases; ensure<br />
environmental sustainability; <strong>and</strong> develop global partnerships – saved millions<br />
of lives <strong>and</strong> helped improve quality of life for billions. But the final MDG review<br />
acknowledged uneven achievements <strong>and</strong> shortfalls in many areas.<br />
Three critical factors hampered success. First, public agencies <strong>and</strong> private-sector<br />
firms were not held accountable for the environmental damage that economic<br />
growth causes. Rather, the damage was justified as the price of economic<br />
development, <strong>and</strong> the cost of damage was absorbed by society, not by polluters.<br />
Second, the cost to future generations of environmental damage during<br />
development was not evaluated, as it was commonly believed that countries<br />
could grow now <strong>and</strong> clean up later. Finally, the MDGs focused on developing<br />
nations, assigning rich countries the role of financial donors. By artificially<br />
separating rich <strong>and</strong> poor countries, the MDGs failed to recognize how all<br />
societies are interconnected, both reliant on <strong>and</strong> affected by changes to socioeconomic<br />
<strong>and</strong> natural systems on Earth.<br />
However, the experience of the MDGs taught global policy-makers to better<br />
recognize the differences between countries at the start of processes, <strong>and</strong> the<br />
need for context-specific goals, priority-setting <strong>and</strong> policy coherence between<br />
the global, regional, national <strong>and</strong> subnational levels.<br />
Sources: United Nations (2012, 2015a); Zusman et al. (2015).<br />
2016 • GLOBAL EDUCATION MONITORING REPORT 5
I<br />
BOX 0.2<br />
THE SDGS WERE CREATED THROUGH<br />
INCLUSIVE DECISION-MAKING<br />
At the 70th Session of the UN General Assembly in<br />
September 2015, member states adopted a new global<br />
development agenda, Transforming Our World: The 2030<br />
Agenda for Sustainable Development. At its heart are 17<br />
SDGs, including SDG 4 on education. The SDGs establish<br />
development priorities to 2030 <strong>and</strong> succeed the MDGs<br />
<strong>and</strong> the goals of Education for All (EFA) – the global<br />
movement to ensure quality basic education for all<br />
children, youth <strong>and</strong> adults – both of which expired in 2015.<br />
The Sustainable Development Goals<br />
Goal 1: End poverty in all its forms everywhere<br />
Goal 2: End hunger, achieve food security <strong>and</strong> improved nutrition <strong>and</strong> promote<br />
sustainable agriculture<br />
Goal 3: Ensure healthy lives <strong>and</strong> promote well-being for all at all ages<br />
Goal 4: Ensure inclusive <strong>and</strong> equitable quality education <strong>and</strong> promote lifelong<br />
learning opportunities for all<br />
Goal 5: Achieve gender equality <strong>and</strong> empower all women <strong>and</strong> girls<br />
Goal 6: Ensure availability <strong>and</strong> sustainable management of water <strong>and</strong> sanitation for all<br />
Goal 7: Ensure access to affordable, reliable, sustainable <strong>and</strong> modern energy for all<br />
Goal 8: Promote sustained, inclusive <strong>and</strong> sustainable economic growth, full <strong>and</strong><br />
productive employment <strong>and</strong> decent work for all<br />
Goal 9: Build resilient infrastructure, promote inclusive <strong>and</strong> sustainable industrialization<br />
<strong>and</strong> foster innovation<br />
Goal 10: Reduce inequality within <strong>and</strong> among countries<br />
Goal 11: Make cities <strong>and</strong> human settlements inclusive, safe, resilient <strong>and</strong> sustainable<br />
Goal 12: Ensure sustainable consumption <strong>and</strong> production patterns<br />
Goal 13: Take urgent action to combat climate change <strong>and</strong> its impacts<br />
Goal 14: Conserve <strong>and</strong> sustainably use the oceans, seas <strong>and</strong> marine resources for<br />
sustainable development<br />
Goal 15: Protect, restore <strong>and</strong> promote sustainable use of terrestrial ecosystems,<br />
sustainably manage forests, combat desertification, <strong>and</strong> halt <strong>and</strong> reverse l<strong>and</strong><br />
degradation <strong>and</strong> halt biodiversity loss<br />
Goal 16: Promote peaceful <strong>and</strong> inclusive societies for sustainable development,<br />
provide access to justice for all <strong>and</strong> build effective, accountable <strong>and</strong> inclusive institutions<br />
at all levels<br />
Goal 17: Strengthen the means of implementation <strong>and</strong> revitalize the Global Partnership<br />
for Sustainable Development<br />
How did this come about? Almost immediately after<br />
Rio+20, various stakeholders began to plan a new agenda<br />
for sustainable development. With a m<strong>and</strong>ate from the<br />
2010 UN General Assembly, the UN Secretary-General<br />
led the Post-2015 Development Agenda process, which<br />
over three years, involved two main streams to develop<br />
specific goals in a transparent, participatory way – one<br />
more consultative, involving many stakeholders, <strong>and</strong> the<br />
other a more official intergovernmental process.<br />
Among the other many initiatives <strong>and</strong> contributions that<br />
led to the final adopted Agenda 2030, the Sustainable<br />
Development Solutions Network played an important role.<br />
The UN launched it in 2012 to mobilize knowledge <strong>and</strong><br />
help design <strong>and</strong> implement the post-2015 agenda, building<br />
on lessons learned from the MDGs <strong>and</strong> Earth summits. A<br />
2012 report concluded that the MDG framework should<br />
be retained, but reorganized to guide international<br />
<strong>and</strong> national policy-making holistically along four key<br />
dimensions: (a) inclusive social development, (b) inclusive<br />
economic development, (c) environmental sustainability,<br />
<strong>and</strong> (d) peace <strong>and</strong> security (United Nations, 2012).<br />
During the first half of 2013, the UN conducted a series<br />
of ‘global conversations’ that engaged almost 2 million<br />
<strong>people</strong> in 88 countries. They included 11 thematic<br />
consultations including one on education, activities at<br />
the national level <strong>and</strong> door-to-door surveys. The UN<br />
also launched the MY World survey, asking <strong>people</strong> which<br />
of 16 development goals mattered to them the most.<br />
Between July <strong>and</strong> December 2014, more than 7 million<br />
<strong>people</strong> responded online, by ballot or through SMS, of<br />
which over 5 million votes were collected offline via paper<br />
ballots <strong>and</strong> almost 500,000 through mobile phones<br />
(United Nations, 2014). MY World voters overwhelmingly<br />
chose ‘a good education’ <strong>and</strong> ‘better healthcare’ as<br />
top priorities. People chose education as the number<br />
one priority regardless of their gender, age, wealth or<br />
education level.<br />
A concurrent process, involving discussions of the Open<br />
Working Group (OWG), was m<strong>and</strong>ated in the outcome<br />
document of the Rio+20 conference in June 2012, which<br />
affirmed the role <strong>and</strong> authority of the UN General<br />
Assembly to lead the SDG process. In January 2013,<br />
member states established the intergovernmental OWG,<br />
with 70 member states sharing its 30 seats, to propose<br />
SDGs. Recommendations on the vision <strong>and</strong> shape of the<br />
SDG agenda were included in the report of the High-Level<br />
Panel of Eminent Persons on the Post-2015 Development<br />
Agenda, released in mid-2013. After 13 sessions, the OWG<br />
produced a document in July 2014 that put forward<br />
17 goals with 169 targets (Box 0.2).<br />
6<br />
INTRODUCTION | SUSTAINABLE DEVELOPMENT: A STRATEGY FOR PEOPLE, PLANET AND PROSPERITY
I<br />
The two processes merged with the publication of<br />
the Secretary-General’s synthesis report in December<br />
2014, which led to a new intergovernmental process<br />
towards the adoption of the SDGs. Seven more rounds<br />
of negotiations during the first half of 2015 helped refine<br />
<strong>and</strong> finalize the formulation of the goals <strong>and</strong> targets.<br />
The SDGs were designed using principles of good<br />
governance: accountability, transparency, <strong>and</strong> open<br />
participation in decision-making (Sachs, 2015). Overall,<br />
the success of the SDG framework will rely on national<br />
policies, plans <strong>and</strong> programmes. However, the agenda’s<br />
goals <strong>and</strong> targets will be monitored <strong>and</strong> reviewed using<br />
global indicators with a framework coordinated by the<br />
Inter-agency <strong>and</strong> Expert Group on SDG Indicators <strong>and</strong><br />
agreed by the UN Statistical Commission.<br />
The UN Conference on Trade <strong>and</strong> Development estimates<br />
implementation in developing countries will cost US$2.5<br />
trillion per year in public <strong>and</strong> private money over the<br />
next 15 years (UNCTAD, 2014), amounting to roughly 4%<br />
of world GDP. The UN Environment Programme recently<br />
reported that the cost of adapting to climate change in<br />
developing countries could rise to between $280 billion<br />
<strong>and</strong> $500 billion per year by 2050 (UNEP, 2016). But failure<br />
to make substantial progress towards the SDGs would be<br />
much more costly.<br />
EDUCATION WITHIN<br />
SUSTAINABLE DEVELOPMENT<br />
The 2030 Agenda unites global development goals<br />
in one framework. SDG 4 succeeds the MDG <strong>and</strong> EFA<br />
priorities for education. At the World Education Forum in<br />
Incheon, Republic of Korea, in May 2015, representatives<br />
of the global education community signed the Incheon<br />
Declaration, embracing the proposed SDG 4 as the single<br />
universal education goal, which commits countries to<br />
‘[e]nsure inclusive <strong>and</strong> equitable quality education <strong>and</strong><br />
promote lifelong learning opportunities for all’ (Box 0.3).<br />
SDG 4 <strong>and</strong> its targets advance a model where learning,<br />
in all its shapes <strong>and</strong> forms, has the power to influence<br />
<strong>people</strong>’s choices to create more just, inclusive <strong>and</strong><br />
sustainable societies. To advance progress towards SDG4<br />
<strong>and</strong> its targets, the global education community adopted<br />
the Education 2030 Framework for Action in Paris in<br />
November 2015 (UNESCO, 2015a).<br />
Education within the sustainable development<br />
agenda is founded on principles drawn from a rich<br />
history of international instruments <strong>and</strong> agreements<br />
BOX 0.3<br />
SDG 4: the education goal <strong>and</strong> targets<br />
Goal 4: Ensure inclusive <strong>and</strong> equitable quality education <strong>and</strong> promote<br />
lifelong learning opportunities for all<br />
• Target 4.1: By 2030, ensure that all girls <strong>and</strong> boys complete free,<br />
equitable <strong>and</strong> quality primary <strong>and</strong> secondary education leading<br />
to relevant <strong>and</strong> effective learning outcomes<br />
• Target 4.2: By 2030, ensure that all girls <strong>and</strong> boys have access<br />
to quality early childhood development, care <strong>and</strong> pre-primary<br />
education so that they are ready for primary education<br />
• Target 4.3: By 2030, ensure equal access for all women <strong>and</strong><br />
men to affordable <strong>and</strong> quality technical, vocational <strong>and</strong> tertiary<br />
education, including university<br />
• Target 4.4: By 2030, substantially increase the number of<br />
youth <strong>and</strong> adults who have relevant skills, including technical<br />
<strong>and</strong> vocational skills, for employment, decent jobs <strong>and</strong><br />
entrepreneurship<br />
• Target 4.5: By 2030, eliminate gender disparities in education<br />
<strong>and</strong> ensure equal access to all levels of education <strong>and</strong> vocational<br />
training for the vulnerable, including persons with disabilities,<br />
indigenous <strong>people</strong>s <strong>and</strong> children in vulnerable situations<br />
• Target 4.6: By 2030, ensure that all youth <strong>and</strong> a substantial<br />
proportion of adults, both men <strong>and</strong> women, achieve literacy<br />
<strong>and</strong> numeracy<br />
• Target 4.7: By 2030, ensure that all learners acquire the<br />
knowledge <strong>and</strong> skills needed to promote sustainable<br />
development, including, among others, through education for<br />
sustainable development <strong>and</strong> sustainable lifestyles, human<br />
rights, gender equality, promotion of a culture of peace <strong>and</strong> nonviolence,<br />
global citizenship <strong>and</strong> appreciation of cultural diversity<br />
<strong>and</strong> of culture’s contribution to sustainable development<br />
• Target 4.a: Build <strong>and</strong> upgrade education facilities that are child,<br />
disability <strong>and</strong> gender sensitive <strong>and</strong> provide safe, non-violent,<br />
inclusive <strong>and</strong> effective learning environments for all<br />
• Target 4.b: By 2020, substantially exp<strong>and</strong> globally the number of<br />
scholarships available to developing countries, in particular least<br />
developed countries, small isl<strong>and</strong> developing States <strong>and</strong> African<br />
countries, for enrolment in higher education, including vocational<br />
training <strong>and</strong> information <strong>and</strong> communications technology,<br />
technical, engineering <strong>and</strong> scientific programmes, in developed<br />
countries <strong>and</strong> other developing countries<br />
• Target 4.c: By 2030, substantially increase the supply of qualified<br />
teachers, including through international cooperation for teacher<br />
training in developing countries, especially least developed<br />
countries <strong>and</strong> small isl<strong>and</strong> developing States<br />
2016 • GLOBAL EDUCATION MONITORING REPORT 7
I<br />
(Box 0.4). These principles state that education is both<br />
a fundamental human right <strong>and</strong> an enabling right, i.e. it<br />
enables other human rights; that it is a public good <strong>and</strong><br />
a shared societal endeavour, which implies an inclusive<br />
BOX 0.4<br />
Historical international agreements that affirm the right<br />
to education<br />
• Article 26 of the Universal Declaration of Human Rights (1948)<br />
• Convention relating to the Status of Refugees (1951)<br />
• International Covenant on Economic, Social <strong>and</strong> Cultural Rights (1960)<br />
• Convention against Discrimination in Education (1960)<br />
• Convention on the Elimination of All Forms of Discrimination against<br />
Women (1979)<br />
• Convention on the Rights of the Child (1989)<br />
• UN Convention on the Rights of Persons with Disabilities (2006)<br />
• UN General Assembly Resolution on the Right to Education in<br />
Emergency Situations (2010)<br />
Source: UNESCO (2015a).<br />
process of public policy formulation <strong>and</strong> implementation;<br />
<strong>and</strong> that gender equality is inextricably linked to the right<br />
to education for all (UNESCO, 2015a). These principles<br />
are inspired by a humanistic vision of education <strong>and</strong><br />
development based on human rights <strong>and</strong> dignity, justice<br />
<strong>and</strong> shared responsibility.<br />
WHAT IS LIFELONG LEARNING?<br />
One focus of SDG 4 is ‘lifelong learning opportunities<br />
for all’. Lifelong learning comprises all learning activities<br />
undertaken throughout life with the aim of improving<br />
knowledge, skills <strong>and</strong> competencies, within personal,<br />
civic, social <strong>and</strong> employment-related perspectives (UIL,<br />
2015). Lifelong learning has often been more narrowly<br />
associated with adult education, especially training<br />
to help adults compensate for poor quality schooling<br />
(UNESCO, 2000).<br />
The post-2015 development agenda conceives of<br />
lifelong learning as a process, one that begins at birth<br />
<strong>and</strong> carries through all stages of life (Figure 0.1). This<br />
approach to education incorporates multiple <strong>and</strong><br />
flexible learning pathways, entry <strong>and</strong> re-entry points<br />
at all ages, <strong>and</strong> strengthened links between formal <strong>and</strong><br />
FIGURE 0.1:<br />
Lifelong learning opportunities for all<br />
FORMAL:<br />
leads to a<br />
recognized<br />
award, diploma<br />
or certificate<br />
Early<br />
childhood<br />
education<br />
(ISCED 0)<br />
QF: validate<br />
non-formal<br />
<strong>and</strong> informal<br />
learning<br />
Primary<br />
education<br />
(ISCED 1)<br />
Lower<br />
secondary<br />
education<br />
(ISCED 2)<br />
Second chance education<br />
Upper<br />
secondary<br />
education<br />
(ISCED 3)<br />
Post-secondary<br />
non-tertiary<br />
education<br />
(ISCED 4)<br />
Short-cycle<br />
tertiary<br />
education<br />
(ISCED 5)<br />
Bachelor’s or<br />
equivalent<br />
(ISCED 6)<br />
Special needs education, vocational, technical <strong>and</strong> professional education<br />
Master’s or<br />
equivalent<br />
(ISCED 7)<br />
Apprenticeships, practical applied learning, residential practices<br />
Doctoral or<br />
equivalent<br />
(ISCED 8)<br />
Qualifications Framework Level 1 QF Level 2 QF Level 3 QF Level 4 QF Level 5 QF Level 6 QF Level 7 QF Level 8<br />
NON-FORMAL:<br />
leads to a<br />
non-formal<br />
certificate or<br />
none at all<br />
Early<br />
childhood<br />
care<br />
Youth <strong>and</strong> adult literacy programmes<br />
Out-of-school programmes<br />
Work skills training, professional development, internships<br />
Life-skills training, health <strong>and</strong> hygiene, family planning, environmental conservation, computer training<br />
Social or cultural development, organized sport, arts, h<strong>and</strong>icrafts<br />
INFORMAL:<br />
no award<br />
Family-based<br />
child care<br />
Self-directed, family-directed, socially directed learning: workplace, family, local community, daily life<br />
Incidental learning: reading newspapers, listening to radio, visiting museums<br />
Source: GEM Report team.<br />
8<br />
INTRODUCTION | SUSTAINABLE DEVELOPMENT: A STRATEGY FOR PEOPLE, PLANET AND PROSPERITY
I<br />
Lifelong learning is<br />
a process, one that<br />
begins at birth <strong>and</strong><br />
carries through all<br />
stages of life<br />
non-formal structures,<br />
including formal accreditation<br />
of the knowledge, skills <strong>and</strong><br />
competencies acquired<br />
through non-formal <strong>and</strong><br />
informal education.<br />
Formal education occurs<br />
in institutions designed to<br />
provide full-time education<br />
for students in a system organized as a continuous<br />
educational pathway, from pre-primary <strong>and</strong> primary<br />
education to secondary <strong>and</strong> higher education.<br />
International education policy has historically focused<br />
on efforts to ensure the provision of universal primary<br />
education <strong>and</strong> reduce the numbers of out-of-school<br />
children. Non-formal education <strong>and</strong> training occur in<br />
planned learning settings but outside the formal system.<br />
Non-formal learning activities are often job-related but<br />
also provide training in life skills <strong>and</strong> other types of selfdevelopment.<br />
Both formal <strong>and</strong> non-formal education<br />
take place through organized programmes offered at<br />
schools, centres, associations or workplaces. Informal<br />
education takes place outside organized programmes<br />
<strong>and</strong> encompasses everyday activities such as reading a<br />
newspaper or visiting a museum. This kind of learning<br />
also includes intergenerational knowledge <strong>and</strong> skills<br />
passed through families <strong>and</strong> community members<br />
(UNESCO <strong>and</strong> UIS 2012).<br />
SDG 4 is specific about the kind of education needed:<br />
inclusive, equitable <strong>and</strong> of good quality. The lesson that<br />
has emerged over the past 15 years is that progress in<br />
education cannot rest solely on increasing enrolment.<br />
About 38% of children old enough to have finished<br />
primary school have not learned the most basic<br />
skills they need to succeed in life (UNESCO, 2014a).<br />
Education of good quality cultivates the flexible skills<br />
<strong>and</strong> competencies that prepare learners for diverse<br />
challenges. The focus on quality ensures that foundation<br />
skills – literacy <strong>and</strong> numeracy – foster additional higher<br />
order thinking, creativity, problem solving, <strong>and</strong> social <strong>and</strong><br />
emotional skills.<br />
Local context <strong>and</strong> diversity shape both challenges <strong>and</strong><br />
solutions. Rather than pushing individuals into a onesize-fits-all<br />
programme, a lifelong learning approach<br />
incorporates diversity into an inclusive, equitable<br />
system. Education for sustainability reaches out to<br />
serve marginalized communities by using all types of<br />
education, matching learning to context.<br />
While it is a great global accomplishment that 91% of<br />
children are enrolled in school, reaching the last 9%<br />
requires different strategies. The children most likely to<br />
be out of school are those from the poorest households,<br />
ethnic <strong>and</strong> linguistic minorities, working children, those<br />
in nomadic or sparsely populated areas, orphans <strong>and</strong><br />
children affected by HIV <strong>and</strong> AIDS, slum dwellers,<br />
children with disabilities, children displaced by conflict<br />
<strong>and</strong> those living in complex emergencies (UNESCO,<br />
2015b). These groups have particular needs <strong>and</strong> require<br />
unique <strong>and</strong> flexible solutions.<br />
Successful programmes for the marginalized are based<br />
on locally relevant solutions that foster social inclusion.<br />
For example, nomadic <strong>and</strong> pastoralist groups face<br />
challenges getting the basic education they deserve<br />
because their mobile lifestyles conflict with typical<br />
schooling formats. In addition, changes in weather,<br />
storms, droughts <strong>and</strong> conflicts decrease nomadic<br />
children’s chances of staying in school. Governments<br />
<strong>and</strong> civil society have been challenged to underst<strong>and</strong><br />
first who these missing learners are <strong>and</strong> then what<br />
is exceptional about their nomadic livelihoods. Since<br />
2000, nomad-specific education plans have emerged<br />
in Ethiopia, Nigeria, Sudan <strong>and</strong> the United Republic of<br />
Tanzania (UNESCO, 2015b). These programmes not only<br />
help targeted communities but also provide innovative<br />
examples for mainstream schools.<br />
Lifelong learning is more than a longitudinal description<br />
of an education system that runs from cradle to<br />
retirement <strong>and</strong> beyond; it is an organizing principle,<br />
intended to improve <strong>people</strong>’s quality of life.<br />
EDUCATION IS INTERLINKED WITH OTHER SDGS<br />
The SDGs, targets <strong>and</strong> means of implementation are<br />
thought of as universal, indivisible <strong>and</strong> interlinked. Each of<br />
the 17 goals has a set of targets. In each set, at least one<br />
target involves learning, training, educating or at the very<br />
least raising awareness of core sustainable development<br />
issues. Education has long been recognized as a critical<br />
factor in addressing environmental <strong>and</strong> sustainability<br />
issues <strong>and</strong> ensuring human well-being (Table 0.1).<br />
The 2013/14 EFA Global Monitoring Report (GMR) analysed<br />
interdependencies <strong>and</strong> connections between education<br />
<strong>and</strong> other development goals. There is strong evidence of<br />
the importance of education <strong>and</strong> learning in supporting<br />
social change, as well as the role of education as a crosscutting<br />
means of advancing the 2030 Agenda. Increased<br />
2016 • GLOBAL EDUCATION MONITORING REPORT 9
I<br />
TABLE 0.1:<br />
How education is typically linked with other Sustainable Development Goals<br />
Goal 1 Education is critical to lifting <strong>people</strong> out of poverty. Goal 10 Where equally accessible, education makes a proven difference to social <strong>and</strong> economic inequality.<br />
Goal 2<br />
Education plays a key role in helping <strong>people</strong> move towards more sustainable farming<br />
methods, <strong>and</strong> in underst<strong>and</strong>ing nutrition.<br />
Education can make a critical difference to a range of health issues, including early mortality,<br />
reproductive health, spread of disease, healthy lifestyles <strong>and</strong> well-being.<br />
Goal 11<br />
Education can give <strong>people</strong> the skills to participate in shaping <strong>and</strong> maintaining more<br />
sustainable cities, <strong>and</strong> to achieve resilience in disaster situations.<br />
Education can make a critical difference to production patterns (e.g. with regard to the<br />
circular economy) <strong>and</strong> to consumer underst<strong>and</strong>ing of more sustainably produced goods <strong>and</strong><br />
prevention of waste.<br />
Education is key to mass underst<strong>and</strong>ing of the impact of climate change <strong>and</strong> to adaptation<br />
<strong>and</strong> mitigation, particularly at the local level.<br />
Education is important in developing awareness of the marine environment <strong>and</strong> building<br />
proactive consensus regarding wise <strong>and</strong> sustainable use.<br />
Education <strong>and</strong> training increase skills <strong>and</strong> capacity to underpin sustainable livelihoods <strong>and</strong> to<br />
conserve natural resources <strong>and</strong> biodiversity, particularly in threatened environments.<br />
Social learning is vital to facilitate <strong>and</strong> ensure participative, inclusive <strong>and</strong> just societies, as well<br />
as social coherence.<br />
Lifelong learning builds capacity to underst<strong>and</strong> <strong>and</strong> promote sustainable development policies<br />
<strong>and</strong> practices.<br />
Goal 3<br />
Goal 12<br />
Goal 5<br />
Education for women <strong>and</strong> girls is particularly important to achieve basic literacy, improve<br />
participative skills <strong>and</strong> abilities, <strong>and</strong> improve life chances.<br />
Education <strong>and</strong> training increase skills <strong>and</strong> the capacity to use natural resources more<br />
sustainably <strong>and</strong> can promote hygiene.<br />
Educational programmes, particularly non-formal <strong>and</strong> informal, can promote better energy<br />
conservation <strong>and</strong> uptake of renewable energy sources.<br />
There is a direct link among such areas as economic vitality, entrepreneurship, job market<br />
skills <strong>and</strong> levels of education.<br />
Education is necessary to develop the skills required to build more resilient infrastructure <strong>and</strong><br />
more sustainable industrialization.<br />
Goal 13<br />
Goal 6<br />
Goal 14<br />
Goal 7<br />
Goal 15<br />
Goal 8<br />
Goal 16<br />
Goal 9<br />
Goal 17<br />
Source: ICSU <strong>and</strong> ISSC (2015).<br />
educational<br />
Increased educational<br />
attainment helps<br />
transform lives by<br />
attainment helps transform<br />
reducing poverty,<br />
lives by reducing poverty, improving health<br />
improving health outcomes, outcomes,<br />
advancing<br />
advancing technology <strong>and</strong><br />
technology<br />
increasing social cohesion <strong>and</strong> increasing<br />
social cohesion<br />
(UNESCO, 2013,<br />
2014b). It can also enable individuals to better cope with,<br />
<strong>and</strong> reduce their vulnerability to, the dangers associated<br />
with climate change.<br />
Education is associated with increased environmental<br />
awareness, concern <strong>and</strong>, in some contexts, action.<br />
Across the 57 countries participating in the 2006<br />
Programme for International Student Assessment<br />
(PISA) of the Organisation for Economic Co-operation<br />
<strong>and</strong> Development (OECD), students who scored<br />
higher in environmental science reported higher<br />
awareness of complex environmental issues. The more<br />
years of schooling, the more a person’s concern for<br />
environmental protection increases, according to results<br />
from the World Values Surveys. Educated citizens<br />
with greater environmental awareness <strong>and</strong> concern<br />
are more likely to get involved in political action to<br />
protect the environment. Education also gives citizens<br />
skills needed to adapt to the adverse effects of climate<br />
change. Farmers in low income countries are especially<br />
vulnerable to climate change. A survey in Burkina<br />
Faso, Cameroon, Egypt, Ethiopia, Ghana, Kenya, Niger,<br />
Senegal, South Africa <strong>and</strong> Zambia showed that farmers<br />
with more education were more likely to build resilience<br />
through adaptation.<br />
The links go both ways. Children living in poverty are<br />
more likely to have less education <strong>and</strong> less access to basic<br />
services. Access to clean water <strong>and</strong> improved sanitation<br />
is especially important for girls’ education. It influences<br />
their education decisions <strong>and</strong> generates health gains,<br />
time savings <strong>and</strong> privacy. Sustainable consumption<br />
<strong>and</strong> production patterns, such as improvements to the<br />
physical environment, green government regulations <strong>and</strong><br />
changes in consumer dem<strong>and</strong> for greener products <strong>and</strong><br />
services, increase interest in education for sustainable<br />
development. Tackling climate change is essential for<br />
overall progress on the SDGs, including SDG 4. SDG<br />
13 aims to promote urgent action to combat climate<br />
change <strong>and</strong> its impact; sustainable development cannot<br />
be achieved without this.<br />
The reciprocal ties between education <strong>and</strong> many SDGs<br />
have not been the focus of sustained research. A review<br />
of 40 flagship evidence-based UN reports found relatively<br />
weak coverage of links between education <strong>and</strong> SDGs<br />
12 to 15, which address sustainable consumption <strong>and</strong><br />
production, climate change, oceans <strong>and</strong> marine resources,<br />
<strong>and</strong> terrestrial ecosystems (Vladimirova <strong>and</strong> Le Blanc,<br />
2015). Similarly, the evidence base on constraints <strong>and</strong><br />
challenges to synergies between SDGs tends to be<br />
limited or non-existent. This clear gap in knowledge<br />
must be addressed: not only the nexus of links between<br />
development sectors, but also any unintended adverse<br />
effects between them, should be better understood.<br />
10<br />
INTRODUCTION | SUSTAINABLE DEVELOPMENT: A STRATEGY FOR PEOPLE, PLANET AND PROSPERITY
I<br />
WHAT KIND OF EDUCATION IS NECESSARY?<br />
It is taken for granted that education of good quality can<br />
help develop citizens who are capable <strong>and</strong> mindful, which<br />
in turn improves their livelihoods <strong>and</strong> those of others<br />
around them. But the Incheon Declaration makes clear<br />
that certain knowledge <strong>and</strong> skills promote sustainable<br />
development more than<br />
others. Not all education<br />
Not all education<br />
brings the same benefits<br />
to everyone. Time, place,<br />
brings the same<br />
situation <strong>and</strong> context<br />
matter (Harber, 2014).<br />
benefits to everyone.<br />
Time, place, situation<br />
Some scholars suggest<br />
<strong>and</strong> context matter<br />
that education systems<br />
that focus on preparing<br />
young <strong>people</strong> for a<br />
lifetime of work <strong>and</strong> consumption to serve mainly<br />
economic ends have adverse effects (Nussbaum, 2010;<br />
Orr, 1994). They argue that without critical reflection<br />
on the strengths, weaknesses <strong>and</strong> ultimate purpose of<br />
learning, education systems risk becoming an extension<br />
of an unsustainable globalizing economy. This concern is<br />
powerfully expressed by John Evans, General Secretary<br />
of the Trade Union Advisory Committee to the OECD<br />
(2015): ‘There are no jobs on a dead <strong>planet</strong>.’<br />
Education <strong>and</strong> lifelong learning can support the SDGs<br />
with at least two approaches. The first tends to focus<br />
on literacy acquisition <strong>and</strong> retention or on specific<br />
knowledge to generate behavioural change, showing<br />
that education can facilitate changes in values, world<br />
views <strong>and</strong> behaviour at the level of the individual,<br />
the community <strong>and</strong> society as a whole. This works<br />
particularly well when agreement exists on common<br />
values <strong>and</strong> the best <strong>and</strong> most desirable behaviours,<br />
e.g. the idea that reducing food waste <strong>and</strong> energy<br />
consumption is important for sustainability <strong>and</strong><br />
that <strong>people</strong> can reduce food waste <strong>and</strong> conserve<br />
energy at home.<br />
The second approach focuses on the development of<br />
agency, competencies <strong>and</strong> participation, showing that<br />
education can facilitate reflective or critical learning,<br />
knowledge <strong>and</strong> skills acquisition, <strong>and</strong> greater agency<br />
to address complex sustainability issues, e.g. how to<br />
create a sustainable school or a carbon-neutral city.<br />
This is particularly important where uncertainty exists<br />
over what needs to be done or when context-specific<br />
solutions need to be identified through collaborative<br />
<strong>and</strong> iterative processes. Both education approaches are<br />
complementary for engendering critical learning <strong>and</strong><br />
sustainability outcomes (Table 0.2).<br />
The transformation needed for a cleaner, greener <strong>planet</strong><br />
requires integrative, innovative <strong>and</strong> creative thinking,<br />
cultivated jointly by schools, governments, civil society<br />
organizations <strong>and</strong> companies. This collaboration calls for<br />
education that goes beyond the transfer of knowledge<br />
<strong>and</strong> desirable behaviours by focusing on multiple<br />
perspectives – economic, ecological, environmental <strong>and</strong><br />
sociocultural – <strong>and</strong> by developing empowered, critical,<br />
mindful <strong>and</strong> competent citizens. Such education can<br />
contribute to the realization of new forms of citizenship,<br />
entrepreneurship <strong>and</strong> governance that centre on the<br />
current <strong>and</strong> future well-being of <strong>people</strong> <strong>and</strong> the <strong>planet</strong>.<br />
TABLE 0.2:<br />
Learning outcomes in education for sustainability<br />
Dimension of sustainability education<br />
Learning to know<br />
Dynamics <strong>and</strong> content of sustainability<br />
Learning to critique<br />
Critical dimension of sustainability<br />
Learning to bring about change<br />
Change <strong>and</strong> innovation dimension of sustainability<br />
Learning to be, learning to care<br />
Existential <strong>and</strong> normative dimension of sustainability<br />
Associated learning outcomes<br />
Sustainability literacy<br />
Systems thinking<br />
An integral view<br />
Underst<strong>and</strong>ing of <strong>planet</strong>ary boundaries<br />
Questioning of hegemony <strong>and</strong> routines<br />
Analysis of normativity<br />
Disruptiveness, transgression<br />
Leadership <strong>and</strong> entrepreneurship<br />
Unlocking of creativity, use of diversity<br />
Appreciation of complexity<br />
Adaptation, resilience<br />
Empowerment <strong>and</strong> collective change<br />
Connection with <strong>people</strong>, places <strong>and</strong> other species<br />
Passion, values <strong>and</strong> meaning-making<br />
Moral positioning, consideration of ethics, boundaries <strong>and</strong> limits<br />
Source: Wals <strong>and</strong> Lenglet (2016).<br />
2016 • GLOBAL EDUCATION MONITORING REPORT 11
I<br />
The Incheon Declaration affirmed the m<strong>and</strong>ate of the<br />
GEM Report as the mechanism for monitoring <strong>and</strong> reporting<br />
on SDG 4 <strong>and</strong> on education in the other SDGs<br />
“<br />
”<br />
READER’S GUIDE TO<br />
THE REPORT<br />
In the Incheon Declaration, the international education<br />
community affirmed the m<strong>and</strong>ate of the Global Education<br />
Monitoring Report (GEM Report) as an independent,<br />
authoritative report, hosted <strong>and</strong> published by UNESCO,<br />
to serve as ‘the mechanism for monitoring <strong>and</strong> reporting<br />
on … SDG 4 <strong>and</strong> on education in the other SDGs, within<br />
the mechanism to be established to monitor <strong>and</strong> review<br />
the implementation of the proposed SDGs’ (UNESCO,<br />
2015b). Relying on 14 years of monitoring experience<br />
as the GMR, the renamed GEM Report will continue to<br />
provide reliable, rigorous analysis of global progress on<br />
the education agenda through systematic <strong>and</strong> evidencebased<br />
reporting.<br />
The 2016 GEM Report, the first of a new 15 year series,<br />
shows that education will not deliver its full potential<br />
to catapult the world forward unless rates of<br />
improvement dramatically shift, <strong>and</strong> education systems<br />
consider sustainable development in the way services<br />
are delivered.<br />
Commissioned research for this report shows that, for<br />
90% of industrialized countries, <strong>and</strong> for every single<br />
country in Southern Asia <strong>and</strong> sub-Saharan Africa, even<br />
exp<strong>and</strong>ing their education systems at the fastest rates<br />
ever observed in the regions would be too slow to meet<br />
the first target in the global goal on education, SDG 4.<br />
Yet it also shows how crucial it is for education systems<br />
to exp<strong>and</strong> at the rate reflected in the ambition of the<br />
2030 Agenda. If the world were somehow to achieve<br />
universal upper secondary completion by 2030, income<br />
per capita would likely increase by 75% until 2050, <strong>and</strong><br />
bring achievement of the goal of poverty elimination<br />
forward 10 years. Similarly, under-5 mortality rates in<br />
sub-Saharan Africa would drop by 13 deaths for every<br />
1000 live births by 2050, <strong>and</strong> there would be globally up<br />
to 50,000 fewer disaster-related deaths per year.<br />
In the thematic part of this report (Chapters 1-8),<br />
compelling arguments are given for the types of<br />
education that are vital for achieving the goals of poverty<br />
reduction, hunger eradication, improved health, gender<br />
equality <strong>and</strong> empowerment, sustainable agriculture,<br />
resilient cities, <strong>and</strong> more equal, inclusive <strong>and</strong> just<br />
societies. They highlight the evidence, practices <strong>and</strong><br />
policies that demonstrate how education – broadly<br />
defined to include formal, non-formal <strong>and</strong> informal<br />
learning – can serve as a catalyst for the overall<br />
sustainable development agenda. At the same time,<br />
they recognize how other development challenges <strong>and</strong><br />
success affect education systems <strong>and</strong> outcomes.<br />
The many challenges concerning how to assess<br />
progress towards SDG 4 are tackled in the<br />
monitoring part (Chapters 9–23), including concrete<br />
recommendations for policy change in coming years.<br />
The report seeks to contribute to discussions of how<br />
best to respond to the proposed global education<br />
monitoring framework in a way that supports countries<br />
<strong>and</strong> their international partners.<br />
This GEM Report is timed to contribute to the initial<br />
building blocks of the sustainable development agenda.<br />
Its findings show that equitable, good quality education<br />
<strong>and</strong> lifelong learning are vital to securing sustainable<br />
futures for all. How <strong>and</strong> what <strong>people</strong> learn not only<br />
influences their knowledge, skills, attitudes <strong>and</strong> world<br />
views, but also their respect for each other, along with<br />
investment <strong>and</strong> research choices that affect coming<br />
generations. The way education evolves over the next<br />
15 years will have a tremendous impact on whether<br />
the world can achieve the ambitious vision of the<br />
international community of nations. It is necessary to<br />
think critically about education systems so they do<br />
not encourage unsustainable lifestyles but rather build<br />
resilient communities <strong>and</strong> enable individuals to become<br />
agents of change, working cooperatively to address the<br />
great challenges of this era. Humans must imagine, think<br />
<strong>and</strong> act differently in order to mitigate climate change<br />
12<br />
INTRODUCTION | SUSTAINABLE DEVELOPMENT: A STRATEGY FOR PEOPLE, PLANET AND PROSPERITY
I<br />
<strong>and</strong> achieve sustainable development – <strong>and</strong> education<br />
is vital to that.<br />
Since 2000, experience<br />
has shown that only<br />
To achieve the SDGs,<br />
through a combined<br />
it is necessary to effort can humanity<br />
break down silos <strong>and</strong> tackle the challenges<br />
facing it <strong>and</strong> the <strong>planet</strong>.<br />
build cross-sector<br />
To achieve the SDGs, it<br />
collaboration that is necessary to break<br />
contributes to a<br />
down silos <strong>and</strong> build<br />
cross-sector collaboration<br />
shared vision<br />
that contributes to a<br />
shared vision. Leaders in<br />
every area – from health,<br />
education <strong>and</strong> justice to environment, gender <strong>and</strong> urban<br />
development – must work together to create equitable<br />
policies <strong>and</strong> seek out synergies in order to ensure a<br />
decent <strong>and</strong> dignified life for all.<br />
THEMATIC PART<br />
The thematic part of the GEM Report discusses<br />
reciprocal ties between SDG 4 on education <strong>and</strong> the<br />
other 16 SDGs. It reviews education-oriented evidence,<br />
practices <strong>and</strong> policies that demonstrate education’s role<br />
in achieving the overall 2030 Agenda for Sustainable<br />
Development. At the same time, it recognizes that<br />
changing realities in other development sectors affect<br />
education systems <strong>and</strong> outcomes.<br />
The thematic part is made up of eight chapters. Six<br />
investigate the fundamental pillars <strong>and</strong> essential<br />
concepts of sustainable development – Planet,<br />
Prosperity, People, Peace, Place <strong>and</strong> Partnerships. The<br />
final thematic chapter, Projections, discusses how<br />
expected increases in educational attainment by 2030<br />
will affect key development targets by 2050.<br />
Planet focuses on the roles education can play in<br />
transforming society to move towards environmental<br />
sustainability. It discusses evidence on how education<br />
can develop the knowledge, skills <strong>and</strong> solutions to help<br />
increase concern for the environment, build awareness<br />
of climate change <strong>and</strong> other climate risks, <strong>and</strong> change<br />
individual behaviour to become more environmentfriendly.<br />
It also acknowledges the importance of<br />
transforming education systems so that education helps<br />
foster sustainable lifestyles <strong>and</strong> rebalances the focus<br />
on individual economic <strong>and</strong> material gains. It addresses<br />
the need to encourage diverse perspectives so as to<br />
achieve environmental sustainability – for instance, by<br />
learning from the knowledge <strong>and</strong> lifestyles of indigenous<br />
communities – <strong>and</strong> the need to educate <strong>and</strong> engage the<br />
private sector to achieve sustained transformation.<br />
Prosperity explores the roles of education in fostering<br />
environmentally sustainable <strong>and</strong> economically<br />
inclusive development. It provides evidence on links<br />
between education <strong>and</strong> skills acquisition on the one<br />
h<strong>and</strong>, <strong>and</strong> long-term economic growth on the other.<br />
At the same time it discusses the importance of<br />
transforming economic processes to make them more<br />
environmentally sustainable through green industry <strong>and</strong><br />
sustainable agricultural practices. The chapter examines<br />
the role of education in poverty <strong>and</strong> inequality reduction,<br />
making the case for closer integration of education,<br />
economic <strong>and</strong> employment policies to promote inclusion<br />
of all <strong>people</strong> in the economy.<br />
People discusses inclusive social development as an<br />
aspiration to ensure that all women <strong>and</strong> men, girls <strong>and</strong><br />
boys lead healthy, dignified <strong>and</strong> empowered lives. At<br />
a minimum, this implies that all <strong>people</strong> need access<br />
to essential basic services such as education, health,<br />
water, sanitation <strong>and</strong> energy. The chapter also focuses<br />
on the transformative social development needed to<br />
change social structures, institutions <strong>and</strong> relationships.<br />
It highlights the scale of the challenges in providing<br />
essential basic services to all, achieving gender equality<br />
<strong>and</strong> including diverse marginalized populations. It<br />
provides evidence on how education is important<br />
for female empowerment for positive outcomes in<br />
health, nutrition, sanitation <strong>and</strong> energy, <strong>and</strong> between<br />
generations. It also discusses how education as an<br />
institutional sector can improve the way other sectors<br />
function, such as through health-related interventions<br />
in schools. The education system is pivotal to inclusive<br />
social development, since education can equip <strong>people</strong><br />
with knowledge, skills <strong>and</strong> values that can help improve<br />
social outcomes <strong>and</strong> change social norms. At the same<br />
time, ensuring inclusive social development requires<br />
recognizing the limits of education’s role, underst<strong>and</strong>ing<br />
how other institutions <strong>and</strong> sectors affect education, <strong>and</strong><br />
making sure there is integrated action between them.<br />
Peace demonstrates the role of education in fostering<br />
peaceful, just <strong>and</strong> inclusive societies. It argues that<br />
stable peace is more likely in societies with democratic<br />
<strong>and</strong> representative institutions <strong>and</strong> a well-functioning<br />
justice system. Education has a key role in contributing<br />
to the participation <strong>and</strong> inclusion vital to ensure social<br />
cohesion <strong>and</strong> to prevent <strong>and</strong> mitigate societal tensions.<br />
2016 • GLOBAL EDUCATION MONITORING REPORT 13
I<br />
The chapter documents the links between education<br />
<strong>and</strong> politics, showing that education offers possibilities<br />
for participation, inclusion, advocacy <strong>and</strong> democracy.<br />
It also examines the multifaceted relationship between<br />
education <strong>and</strong> conflict <strong>and</strong> violence: if education is<br />
lacking, unequal or biased, it can contribute to conflict,<br />
but effective education can reduce or eliminate conflict.<br />
The chapter also shows how education can play a<br />
transformative role in peace-building <strong>and</strong> the alarming<br />
consequences of its neglect. In addition, it examines<br />
education <strong>and</strong> violence not related to conflict <strong>and</strong> wars,<br />
<strong>and</strong> provides evidence of how education initiatives, in<br />
particular driven by civil society organizations, can help<br />
marginalized populations gain access to justice.<br />
Place highlights cities in discussing spatial dimensions of<br />
development, since urbanization is a defining population<br />
trend. It argues that cities are engines of knowledgebased<br />
innovation <strong>and</strong> growth. Conversely, education<br />
influences cities <strong>and</strong> is key to taking advantage of their<br />
physical <strong>and</strong> social capital. The chapter provides evidence<br />
that education can have positive effects, such as<br />
reducing crime, <strong>and</strong> be used in good urban planning, for<br />
example to encourage sustainable transport. At the same<br />
time, cities can be characterized by massive inequality,<br />
including in education, which can foster disillusionment,<br />
discontent <strong>and</strong> sometimes violence. Education needs to<br />
be viewed as a critical element of urban governance <strong>and</strong><br />
planning arrangements to ensure that the opportunities<br />
of urbanization outweigh the challenges <strong>and</strong> result<br />
in more inclusive, environmentally sustainable <strong>and</strong><br />
prosperous cities.<br />
Partnerships describes how effective implementation<br />
of the SDGs requires integrated plans <strong>and</strong> actions.<br />
All government levels, sectors <strong>and</strong> types of national<br />
<strong>and</strong> international actors need to work together; they<br />
also require adequate financing <strong>and</strong> other enabling<br />
conditions (human capacity, effective institutions <strong>and</strong><br />
political will) to meet the needs of the new agenda.<br />
These issues are addressed from the perspective of<br />
an education sector that must fulfil a much broader<br />
agenda – lifelong learning for all – <strong>and</strong> simultaneously<br />
work towards integration with other development<br />
agendas, given its instrumental role in other aspects<br />
of development. The chapter discusses the availability<br />
of domestic <strong>and</strong> external resources for education;<br />
concepts, evidence <strong>and</strong> implementation of integrated<br />
planning; <strong>and</strong> partnership arrangements.<br />
Projections presents model-based scenarios for education<br />
attainment <strong>and</strong> describes education’s role in attaining<br />
development targets. It projects likely scenarios for the<br />
increase in educational attainment between 2015 <strong>and</strong><br />
2030. Given that quantitative analysis usually views<br />
education as having longer-term intergenerational<br />
effects, it then projects how educational attainment by<br />
2030 will affect key measurable development targets –<br />
infant <strong>and</strong> child mortality, adult life expectancy,<br />
economic growth, poverty rates <strong>and</strong> disaster-related<br />
deaths – by 2050.<br />
MONITORING PART<br />
The monitoring part of the 2016 GEM Report presents<br />
the wide-ranging challenges <strong>and</strong> debates involving<br />
monitoring for the Education 2030 agenda <strong>and</strong> how<br />
countries <strong>and</strong> the international community can move<br />
forward. It is organized into 15 chapters, including the<br />
introduction <strong>and</strong> conclusion.<br />
The first 10 (Chapters 10–19) look separately at each of<br />
the 7 education targets <strong>and</strong> 3 means of implementation.<br />
They identify the concepts that are explicitly or implicitly<br />
embedded in the target formulation. Each chapter<br />
discusses how the concepts are articulated within the<br />
proposed global <strong>and</strong> thematic indicators. They focus<br />
primarily on the extent to which the methodology of<br />
the indicators is established, <strong>and</strong> on identifying tools<br />
currently available to collect relevant data. To the extent<br />
that methodology is established <strong>and</strong> information<br />
available for a sufficient number of countries, indicative<br />
baseline information is presented. Approaches for<br />
monitoring areas not yet covered by the proposed<br />
indicators are also discussed.<br />
The monitoring part of the GEM Report tries not to be<br />
prescriptive but rather to make a timely contribution to<br />
the debate on what should be monitored <strong>and</strong> how. The<br />
state of global education monitoring is in flux. Many<br />
initiatives are under way to respond to the challenges of<br />
the proposed indicator frameworks. Given the time lag<br />
for information becoming available, it is still too early to<br />
provide baseline data for 2015 – or indeed definitive data<br />
for the end of the EFA period.<br />
Chapters 20 to 22 address cross-cutting issues.<br />
Chapter 20 discusses education finance, for which<br />
there is no dedicated SDG target, though the Education<br />
2030 Framework for Action gives a clear set of<br />
recommendations. Using a framework provided by<br />
national education accounts, the chapter discusses<br />
prospects for better data on public spending, aid <strong>and</strong><br />
household expenditure. Chapter 21 reflects on the<br />
14<br />
INTRODUCTION | SUSTAINABLE DEVELOPMENT: A STRATEGY FOR PEOPLE, PLANET AND PROSPERITY
I<br />
fact that some proposed indicators are about neither<br />
inputs nor outcomes but instead relate to growing<br />
interest in the role of education systems. It provides<br />
an overview of available mechanisms <strong>and</strong> the scope<br />
for better coordination, especially at the regional level.<br />
The short Chapter 22 looks at all targets under other<br />
SDG goals, as well as the corresponding global indicators,<br />
to identify those where education is mentioned<br />
directly or indirectly.<br />
This comprehensive overview of the global education<br />
monitoring challenges offers insights, brings together<br />
disparate pieces of information <strong>and</strong> identifies stakeholders<br />
whose work needs recognition <strong>and</strong> coordination. Given<br />
that implementing such an agenda may be daunting<br />
<strong>and</strong> confusing, especially for countries, the GEM Report’s<br />
monitoring part is meant to support countries <strong>and</strong><br />
partners as they discuss <strong>and</strong> determine the best steps<br />
forward in achieving SDG 4. Chapter 23 draws attention<br />
to common themes <strong>and</strong> missing pieces in this discussion<br />
– <strong>and</strong> identifies building blocks <strong>and</strong> potential synergies<br />
for a more effective <strong>and</strong> efficient global education<br />
monitoring agenda over the next 15 years at the national,<br />
regional <strong>and</strong> international levels.<br />
OVERALL CONCLUSION<br />
To conclude, Chapter 24 reflects on the 2030 Agenda<br />
for Sustainable Development as a whole <strong>and</strong> the critical<br />
importance of follow-up <strong>and</strong> review processes. The 2030<br />
Agenda sets out an ambitious collective vision for <strong>people</strong><br />
<strong>and</strong> <strong>planet</strong> that requires political will, resources <strong>and</strong><br />
collaboration. Thematic reports, such as the GEM Report,<br />
serve as a bridge between global dialogue <strong>and</strong> national<br />
initiatives, contributing not only to one sector but to<br />
broader efforts to identify effective policies that reduce<br />
poverty, improve health <strong>and</strong> create more inclusive, just<br />
<strong>and</strong> sustainable communities.<br />
2016 • GLOBAL EDUCATION MONITORING REPORT 15
Here students in<br />
Indonesia learn about<br />
the animals <strong>and</strong> plants<br />
near the beach. The<br />
activity is designed<br />
to encourage the<br />
students to be more<br />
environment friendly.<br />
CREDIT: Nur’aini Yuwanita Wakan/UNESCO<br />
16<br />
CHAPTER 1 | PLANET: ENVIRONMENTAL SUSTAINABILITY
CHAPTER<br />
1<br />
Planet:<br />
environmental<br />
sustainability<br />
We are determined to protect the <strong>planet</strong> from<br />
degradation, including through sustainable<br />
NO<br />
POVERTY<br />
ZERO<br />
HUNGER<br />
consumption <strong>and</strong> production, sustainably managing<br />
its natural resources <strong>and</strong> taking urgent action on<br />
climate change, so that it can support the needs of<br />
the present <strong>and</strong> future generations.<br />
GOOD HEALTH<br />
AND WELL-BEING<br />
QUALITY<br />
EDUCATION<br />
GOOD HEALTH<br />
AND WELL-BEING<br />
QUALITY<br />
EDUCATION<br />
NO GENDER<br />
POVERTY<br />
EQUALITY<br />
ZERO CLEAN WATER<br />
HUNGER<br />
AND SANITATION<br />
GOOD AFFORDABLE HEALTHAND<br />
AND CLEAN WELL-BEING<br />
ENERGY<br />
DECENT QUALITYWORK AND<br />
ECONOMIC EDUCATIONGROWTH<br />
– The 2030 Agenda for Sustainable Development<br />
INDUSTRY, GENDER INNOVATION<br />
AND EQUALITY<br />
INFRASTRUCTURE<br />
CLEAN REDUCED WATER<br />
AND INEQUALITIES<br />
SANITATION<br />
D<br />
TH<br />
INDUSTRY, INNOVATION<br />
AND INFRASTRUCTURE<br />
REDUCED<br />
INEQUALITIES<br />
SUSTAINABLE AFFORDABLE AND CITIES<br />
AND CLEAN COMMUNITIES<br />
ENERGY<br />
DECENT RESPONSIBLE<br />
WORK AND<br />
ECONOMIC CONSUMPTION GROWTH<br />
AND PRODUCTION<br />
INDUSTRY, CLIMATEINNOVATION<br />
AND ACTION INFRASTRUCTURE<br />
REDUCED<br />
LIFE<br />
INEQUALITIES<br />
BELOW WATER<br />
SUSTAINABLE LIFE<br />
CITIES<br />
AND ON COMMUNITIES<br />
LAND<br />
RESPONSIBLE<br />
PEACE, JUSTICE<br />
CONSUMPTION<br />
AND STRONG<br />
AND INSTITUTIONS<br />
PRODUCTION<br />
LIFE<br />
ON LAND<br />
PEACE, JUSTICE<br />
AND STRONG<br />
INSTITUTIONS<br />
CLIMATE<br />
PARTNERSHIPS<br />
ACTION<br />
FOR THE GOALS<br />
LIFE<br />
BELOW WATER<br />
LIFE<br />
ON LAND<br />
PEACE, JUSTICE<br />
AND STRONG<br />
INSTITUTIONS<br />
PARTNERSHIPS<br />
FOR THE GOALS<br />
17
1<br />
KEY MESSAGES<br />
Living sustainably requires a huge shift in mindset.<br />
Education has to be part of that change.<br />
1<br />
Education can help <strong>people</strong> underst<strong>and</strong> <strong>and</strong> respond to environmental issues.<br />
a. It helps develop the right knowledge, skills <strong>and</strong> technical solutions that can change<br />
environmental behaviour.<br />
b. Education is clearly shown to be the best tool for climate change awareness.<br />
c. Education is the most effective means of curtailing population growth.<br />
d. Education improves disaster preparedness <strong>and</strong> reduces vulnerability to climate-related disasters.<br />
e. Green schools, well-designed curricula <strong>and</strong> h<strong>and</strong>s-on learning outside of school can strengthen<br />
<strong>people</strong>’s connection with nature.<br />
2<br />
Outside of school, we must learn through communities <strong>and</strong> throughout our lives.<br />
a. Learning among communities encourages <strong>people</strong> to reflect on their values, <strong>and</strong> participate more<br />
actively in shifts towards sustainable living.<br />
b. Traditional – <strong>and</strong> specifically indigenous – knowledge, passed down through the generations, is a<br />
major resource for adapting to climate change.<br />
c. Providing instruction in local languages in school helps knowledge be shared among generations<br />
<strong>and</strong> communities outside school.<br />
3<br />
Education systems must be careful not to encourage unsustainable lifestyles.<br />
a. Learning for economic growth alone will not bring sustainable solutions.<br />
b. Education systems <strong>and</strong> curricula must reflect the critical basis of indigenous communities’<br />
knowledge, which rests on deep intercultural respect, along with openness to plurality of knowledge<br />
systems <strong>and</strong> cultures.<br />
4<br />
Schools need to take a holistic approach to tackling environmental challenges.<br />
a. Both teachers <strong>and</strong> students need to learn about climate change <strong>and</strong> its underlying causes.<br />
b. Pedagogy needs to encourage collaboration <strong>and</strong> participation.<br />
c. Schools need to engage with their surrounding communities.<br />
d. Green operations <strong>and</strong> facilities need to be built.<br />
5<br />
The private sector must encourage lifelong learning to fight climate change.<br />
a. Efforts could include workplace learning, joining in multistakeholder partnerships to develop<br />
environmental solutions, reducing companies’ ecological footprint, <strong>and</strong> funding greener schools.<br />
18<br />
CHAPTER 1 | PLANET: ENVIRONMENTAL SUSTAINABILITY
1<br />
Global environmental challenges are pressing.............................................................19<br />
To meet these challenges, learning is essential..........................................................24<br />
Reversing climate change requires an integrated approach to learning........ 32<br />
Conclusion..................................................................................................................................... 35<br />
conclusive body of evidence built since the 1972 UN<br />
A Conference on the Human Environment shows that<br />
the actions <strong>and</strong> habits of a single species, Homo sapiens,<br />
are leading to the <strong>planet</strong>’s unprecedented dysfunction.<br />
An increasing part of the world’s population lives beyond<br />
the ecological limits set by earth’s finite natural resources<br />
<strong>and</strong> support systems.<br />
Since human behaviour is clearly the problem, <strong>people</strong> are<br />
responsible for solutions to these <strong>planet</strong>ary challenges.<br />
The 2030 Agenda for Sustainable Development<br />
emphasizes environmental sustainability issues, the<br />
need to transform consumption <strong>and</strong> production to<br />
restore balance to life on l<strong>and</strong> <strong>and</strong> in water, <strong>and</strong> the<br />
need for urgent action on climate change. Furthermore,<br />
environmental sustainability is clearly intertwined with<br />
social <strong>and</strong> economic sustainability, as the challenges<br />
surrounding equitable <strong>and</strong> sustainable use of natural<br />
resources affect <strong>people</strong>’s ability to lead peaceful, stable,<br />
prosperous <strong>and</strong> healthy lives.<br />
The relationship between human development <strong>and</strong><br />
environmental impact is not straightforward. On the<br />
one h<strong>and</strong>, <strong>people</strong> living in wealthy countries with higher<br />
levels of education are more likely to lead lifestyles that<br />
leave a harmful footprint on global ecosystems – from<br />
increased food waste to higher levels of carbon dioxide<br />
from car <strong>and</strong> airplane use. On the other h<strong>and</strong>, increases<br />
in environmental education <strong>and</strong> ecological literacy help<br />
<strong>people</strong> change their personal attitudes <strong>and</strong> behaviour<br />
in everyday ways such as recycling, reducing litter <strong>and</strong><br />
conserving energy, as well as on issues including water<br />
sanitation <strong>and</strong> public health. This means some, if not<br />
most, kinds of education are effective tools in the fight<br />
towards environmental <strong>and</strong> <strong>planet</strong>ary health.<br />
This chapter outlines pressing environmental challenges<br />
<strong>and</strong> the kinds of policies proposed to move towards<br />
environmental sustainability. It explores various ways of<br />
underst<strong>and</strong>ing responsibility for the human behaviour<br />
that has contributed to the looming crisis, then turns to<br />
ways in which education <strong>and</strong> learning can contribute to<br />
solutions. Finally, it explores how integrated approaches<br />
to lifelong learning can help address climate change.<br />
GLOBAL ENVIRONMENTAL<br />
CHALLENGES ARE PRESSING<br />
Many climate scientists believe Earth has entered a new<br />
geological era, the Anthropocene, where human activities<br />
are undermining the <strong>planet</strong>’s capacity to regulate itself.<br />
Until the Industrial Revolution in the late 1700s, global<br />
environmental changes were not strongly linked to<br />
human actions. They were essentially the product of<br />
slow-occurring natural causes, such as variations in<br />
the sun’s energy or volcanic eruptions. But since the<br />
start of modern manufacturing, while humans have<br />
benefited from increased trade, economic growth <strong>and</strong><br />
longer, healthier lives, the natural world has suffered<br />
environmental deterioration (UNEP, 2012).<br />
The scale <strong>and</strong> pace of biodiversity loss, l<strong>and</strong> degradation,<br />
stratospheric ozone depletion <strong>and</strong> climate change<br />
are attributable to human activities. Humans are<br />
responsible for the massive release of carbon dioxide <strong>and</strong><br />
2016 • GLOBAL EDUCATION MONITORING REPORT 19
1<br />
other heat-trapping gases into the atmosphere. Human<br />
behaviour has caused irreversible damage to some plant<br />
<strong>and</strong> animal species. The variety of vertebrates (mammals,<br />
birds, reptiles, amphibians <strong>and</strong> fish) has declined by 52%<br />
since 1970 (McLellan et al., 2014). The largest extinction<br />
is happening among freshwater species, mostly due to<br />
habitat loss <strong>and</strong> extensive hunting <strong>and</strong> fishing.<br />
Experts developed the concept of <strong>planet</strong>ary<br />
boundaries as a useful way to describe <strong>and</strong> measure<br />
the environmental limits within which humanity <strong>and</strong><br />
other living organisms on the <strong>planet</strong> can safely operate<br />
(Rockström et al., 2009). Nine <strong>planet</strong>ary boundaries are<br />
monitored via indicators for climate change, biodiversity<br />
loss, nitrogen <strong>and</strong> phosphorus pollution, stratospheric<br />
ozone depletion, ocean acidification, global freshwater<br />
consumption, change in agricultural l<strong>and</strong> use, air pollution<br />
<strong>and</strong> chemical pollution. Six of the indicators have<br />
increased significantly since the pre-industrial era; five<br />
have remained at or entered high risk zones (Figure 1.1).<br />
Since all <strong>planet</strong>ary boundaries are closely linked, these<br />
trends indicate a threat to the earth’s l<strong>and</strong>, water <strong>and</strong><br />
atmosphere (Steffen et al., 2015).<br />
HUMAN BEHAVIOUR HAS LED TO<br />
ENVIRONMENTAL CRISES<br />
While the general consensus is that humans are<br />
responsible for global environmental crises, views differ<br />
as to the human-related factors most responsible.<br />
Experts have identified interrelated ways in which <strong>people</strong><br />
are pushing <strong>planet</strong>ary boundaries, each associated<br />
with a distinct set of policy options <strong>and</strong> solutions. This<br />
section reviews three of the most common explanations:<br />
overpopulation, modern lifestyles <strong>and</strong> individual behaviour.<br />
The demographic problem<br />
This idea proposes that there are simply too many<br />
<strong>people</strong> on the <strong>planet</strong>. More <strong>people</strong> use more natural<br />
resources, pushing <strong>planet</strong>ary boundaries into risk<br />
zones. The global population tripled between 1950 <strong>and</strong><br />
2015 (United Nations,<br />
2015), mainly due to<br />
The global population improvement in public<br />
tripled between 1950<br />
health, <strong>and</strong> is expected to<br />
grow by another billion<br />
<strong>and</strong> 2015<br />
to 8.5 billion in 2030.<br />
The population is not<br />
FIGURE 1.1:<br />
Global environmental health faces critical thresholds on several fronts<br />
Nine <strong>planet</strong>ary systems, pre-industrial <strong>and</strong> current levels<br />
Pre-Industrial Revolution<br />
Current value<br />
Proposed boundary<br />
LOWER RISK<br />
INCREASING RISK HIGH RISK<br />
Data not available<br />
Freshwater<br />
use<br />
L<strong>and</strong><br />
use<br />
Phosphorous<br />
pollution<br />
Ocean<br />
acidification<br />
Climate<br />
change<br />
Ozone<br />
depletion<br />
Nitrogen<br />
pollution<br />
Biodiversity<br />
loss<br />
Aerosol air<br />
pollution<br />
Chemical<br />
pollution<br />
Note: One of the nine <strong>planet</strong>ary systems, pollution, has two metrics, one for phosphorous pollution <strong>and</strong> the other for nitrogen pollution. This results<br />
in a total of 10 system metrics shown in Figure 1.1.<br />
Source: GEM Report team analysis (2016) of data from Steffen et al. (2011).<br />
20<br />
CHAPTER 1 | PLANET: ENVIRONMENTAL SUSTAINABILITY
1<br />
TABLE 1.1:<br />
Population growth is slowing but will remain a challenge in lower income countries<br />
Total population <strong>and</strong> percentage change, 2000 to 2030 (projected)<br />
Total population<br />
(millions)<br />
Change<br />
2000–2015<br />
2000 2015 2030 % %<br />
World 6 127 7 349 8 501 20 16<br />
Low income 426 639 924 50 45<br />
Lower middle income 2 305 2 916 3 532 27 21<br />
Upper middle income 2 113 2 390 2 567 13 7<br />
High income 1 254 1 373 1 447 10 5<br />
Eastern <strong>and</strong> South-eastern Asia 2 001 2 222 2 352 11 6<br />
China 1 270 1 376 1 416 8 3<br />
Indonesia 212 258 295 22 15<br />
Southern Asia 1 452 1 823 2 147 26 18<br />
India 1 053 1 311 1 528 24 17<br />
Pakistan 138 189 245 37 30<br />
Bangladesh 131 161 186 23 16<br />
Europe <strong>and</strong> Northern America 1 041 1 097 1 131 5 3<br />
United States 283 322 356 14 11<br />
Russian Federation 146 143 139 -2 -3<br />
Sub-Saharan Africa 641 961 1 306 50 36<br />
Nigeria 123 182 263 48 44<br />
Latin America <strong>and</strong> the Caribbean 522 629 716 21 14<br />
Brazil 176 208 229 18 10<br />
Mexico 103 127 148 24 17<br />
Northern Africa <strong>and</strong> Western Asia 340 463 584 36 26<br />
Caucasus <strong>and</strong> Central Asia 71 84 96 18 15<br />
Pacific 30 38 46 27 21<br />
Change<br />
2015–2030<br />
Notes: Data for 2030 are projections based on a median prediction interval. Regions <strong>and</strong> countries are listed by descending order of population in 2015. The countries listed are the ten with the largest<br />
populations in 2015.<br />
Source: United Nations (2015).<br />
evenly distributed: Nearly three-fourths of the increase<br />
will take place in low <strong>and</strong> lower middle income countries,<br />
especially in sub-Saharan Africa <strong>and</strong> Southern Asia<br />
(Table 1.1).<br />
Not only are there more <strong>people</strong>, but they are also on<br />
the move. Two kinds of migration put pressure on the<br />
relationship between population <strong>and</strong> resources: internal<br />
migration from rural to urban areas <strong>and</strong> international<br />
migration from poor to wealthy nations. By 2050, two<br />
out of three <strong>people</strong> on the <strong>planet</strong> will live in urban areas;<br />
a large portion of future urbanization will be caused<br />
by rural–urban migration (Buhaug <strong>and</strong> Urdal, 2013). It<br />
will take place mostly in countries <strong>and</strong> regions where<br />
urbanization may cause serious environmental problems<br />
in cities including water scarcity <strong>and</strong> contamination, l<strong>and</strong><br />
shortage, polluted air <strong>and</strong> insufficient sanitation.<br />
Meanwhile, high income countries received an average<br />
of 4.1 million net migrants annually from poorer<br />
countries between 2000 <strong>and</strong> 2015 (United Nations, 2015),<br />
a trend expected to continue. People living in urban areas<br />
<strong>and</strong> wealthier countries consume more resources per<br />
person (UNEP, 2012), so these trends will put more stress<br />
on environmental systems.<br />
The modern lifestyles problem<br />
This approach focuses on the fact that <strong>people</strong> in urban<br />
areas <strong>and</strong> wealthier countries choose lifestyles entailing<br />
less environment-friendly consumption patterns.<br />
Resource consumption can be measured through the<br />
ecological footprint indicator, a calculation of a country’s<br />
use of l<strong>and</strong> <strong>and</strong> water resources compared to the stock<br />
of those resources (Ewing et al., 2010).<br />
In 2012, most high income countries had an unsustainable<br />
ecological footprint, except those with very low population<br />
density . Most middle income countries of Eastern <strong>and</strong><br />
South-eastern Asia, Northern Africa <strong>and</strong> Western Asia,<br />
<strong>and</strong> Southern Asia also had a deficit, particularly China.<br />
In sub-Saharan Africa, countries with large populations or<br />
middle income levels had a deficit. The only region where<br />
most countries lived within their environmental means was<br />
Latin America, owing to its lower population density <strong>and</strong><br />
large biocapacity. With some exceptions, available natural<br />
resources per capita declined rapidly over 2000–2015,<br />
2016 • GLOBAL EDUCATION MONITORING REPORT 21
1<br />
so that even countries with natural reserves in 2012 are<br />
expected to start running a deficit during 2015–2030<br />
(Ewing et al., 2010; Global Footprint Network, 2016).<br />
There is a clear relationship between modern lifestyles<br />
<strong>and</strong> resource consumption. Countries that perform<br />
better on the Human Development Index, measured<br />
in terms of education, living st<strong>and</strong>ards <strong>and</strong> health, are<br />
much likelier to have a much larger ecological footprint<br />
(Figure 1.2a).<br />
The countries with the largest ecological footprints<br />
are mostly in Europe <strong>and</strong> Northern America. Countries<br />
that have experienced rapid increases in education,<br />
health <strong>and</strong> living st<strong>and</strong>ards, including the Republic<br />
of Korea <strong>and</strong> Singapore, have seen their ecological<br />
footprint nearly double as domestic consumption has<br />
exp<strong>and</strong>ed. In contrast, countries with low levels of<br />
human development, mostly in sub-Saharan Africa, have<br />
smaller ecological footprints. For instance, the ecological<br />
footprints of Eritrea <strong>and</strong> Timor-Leste are less than 5% the<br />
size of the largest footprints.<br />
Countries struggle to find balance between human<br />
development <strong>and</strong> sustainable practices. Some, including<br />
Cuba, Georgia, the Republic of Moldova <strong>and</strong> Sri Lanka,<br />
have begun to find it, managing to keep production <strong>and</strong><br />
consumption within sustainable bounds (Figure 1.2b).<br />
Their citizens have relatively good health prospects, with<br />
life expectancy between 68 <strong>and</strong> 79 years. People go to<br />
school for 10 to 12 years, well above the global average<br />
of 8 years. Yet, their per capita income is less than the<br />
global average, from US$5,200 a year in the Republic of<br />
Moldova to US$9,780 in Sri Lanka (UNDP, 2015b).<br />
It should be noted that the condition of a country’s local<br />
environment is not taken into account in comparisons of<br />
human development <strong>and</strong> ecological footprints. Resources<br />
are not distributed evenly among countries or even<br />
among regions within countries. As a result, it may be<br />
FIGURE 1.2A:<br />
High levels of human development have come at an ecological cost<br />
Total ecological footprint by Human Development Index, by country, 2012<br />
An ecological footprint of less than 1.7<br />
global hectares per person, given current<br />
population <strong>and</strong> available productive l<strong>and</strong><br />
<strong>and</strong> sea area (biocapacity), is sustainable;<br />
the earth can replenish a country’s<br />
resource use.<br />
The Human Development Index (HDI,<br />
by the UN Development Programme)<br />
measures a country’s average<br />
achievements in health, knowledge<br />
<strong>and</strong> st<strong>and</strong>ard of living. An HDI value of<br />
0.8 or more indicates very high human<br />
development.<br />
Singapore’s high HDI (0.91) is associated<br />
with a large ecological footprint per<br />
capita (7.97). This means that <strong>people</strong> in<br />
Singapore, although living a good life,<br />
also have high resource dem<strong>and</strong>.<br />
Ecological footprint (hectares per capita)<br />
10<br />
9<br />
8<br />
7<br />
6<br />
5<br />
4<br />
3<br />
Unsustainable<br />
ecological footprint<br />
World biocapacity per person in 1961<br />
High HDI<br />
Very High HDI<br />
Australia<br />
Singapore<br />
Rep. of Korea<br />
Caucasus <strong>and</strong> Central Asia<br />
Eastern <strong>and</strong> South-eastern Asia<br />
2<br />
World biocapacity per person in 2011<br />
Europe <strong>and</strong> Northern America<br />
Latin America <strong>and</strong> the Caribbean<br />
Northern Africa <strong>and</strong> Western Asia<br />
Pacific<br />
Southern Asia<br />
Sub-Saharan Africa<br />
1<br />
0<br />
0<br />
See Fig. 1.2B<br />
Sustainable<br />
ecological footprint<br />
Eritrea Timor-Leste<br />
0.2 0.4 0.6 0.8 1<br />
Human Development Index<br />
Source: GEM Report team analysis based on data from Global Footprint Network (2016).<br />
22<br />
CHAPTER 1 | PLANET: ENVIRONMENTAL SUSTAINABILITY
1<br />
FIGURE 1.2B:<br />
Some nations have raised the quality of human development while maintaining a low ecological footprint<br />
Total ecological footprint by Human Development Index, by country, 2012<br />
2.5<br />
High HDI<br />
Very High HDI<br />
Ecological footprint (hectares per capita)<br />
2.1<br />
1.7<br />
1.3<br />
0.9<br />
0.5<br />
0.1<br />
-0.3<br />
0.6<br />
Rep. Moldova<br />
World biocapacity<br />
per person in 2011<br />
Philippines<br />
Indonesia<br />
Colombia<br />
Jamaica<br />
Dominican Rep.<br />
0.65 0.7 0.75 0.8 0.85<br />
Human Development Index<br />
Georgia<br />
Sri Lanka<br />
Cuba<br />
Source: GEM Report team analysis based on data from Global Footprint Network (2016).<br />
easier for some countries, such as Colombia <strong>and</strong> Finl<strong>and</strong>,<br />
to stay within the limits of their available resources than<br />
for others, such as Mongolia <strong>and</strong> Sudan.<br />
The individual behaviour problem<br />
A third explanation focuses on individuals as both<br />
the source of environmental problems <strong>and</strong> their<br />
solution. Yet, there is a mismatch between the scale<br />
of environmental problems, usually measured globally,<br />
<strong>and</strong> the scale of solutions, generally discussed at the<br />
individual or community level. While the impact of<br />
human behaviour on the environment can be seen on a<br />
large scale, it is necessary to analyse the individual level<br />
to see how this impact can be reversed through changes<br />
in personal behaviour. More careful analysis at the<br />
individual level can help identify factors that encourage<br />
or discourage particular types of behaviour.<br />
Proponents of this approach believe large-scale change<br />
happens by targeting <strong>and</strong> influencing individual<br />
behaviour – getting individuals to buy fuel-efficient<br />
cars, insulate their homes <strong>and</strong> the like (Swim et al., 2011).<br />
Often, individual actions are interdependent. Adopting<br />
one type of environment-friendly behaviour can prompt<br />
adoption of others or deter negative behaviour, though it<br />
can also increase environmentally harmful behaviour<br />
(e.g. switching to hybrid cars may encourage <strong>people</strong> to<br />
drive more, offsetting emission reductions). Individual<br />
actions can also reflect social norms <strong>and</strong> cultural values.<br />
For example, in a European programme to increase the<br />
use of carpool lanes, those who chose not to carpool<br />
often said they valued flexibility over reduced costs or<br />
emissions per person (van Vugt et al., 1996).<br />
Because individual actions are interdependent <strong>and</strong><br />
because they reflect social context, it is important to<br />
not only encourage behaviour change, but also provide<br />
<strong>people</strong> with the full set of knowledge, skills <strong>and</strong> attitudes<br />
they need to make comprehensive changes.<br />
DIFFERENT PROBLEMS IMPLY DIFFERENT<br />
POLICY SOLUTIONS<br />
The fact that experts emphasize different problems <strong>and</strong><br />
come from varying perspectives affects their views on<br />
the solutions needed to resolve environmental crises.<br />
Some believe technological innovations, such as<br />
renewable energy sources, sustainable infrastructure<br />
<strong>and</strong> cleaner production practices, are the answer. Others<br />
believe that since Western development trajectories<br />
have often caused environmental degradation, lower<br />
income countries need to find ways to avoid such paths<br />
while still improving quality of life. Those who believe<br />
population growth is the major driver of environmental<br />
challenges focus on ways to reduce fertility in poor<br />
countries, especially in sub-Saharan Africa.<br />
There has also been a strong focus on making the<br />
problem an individual one, arguing that societies’ success<br />
2016 • GLOBAL EDUCATION MONITORING REPORT 23
1<br />
in responding to environmental challenges is based<br />
on how individuals act, separately <strong>and</strong> collectively.<br />
Proponents of this view believe that when individuals<br />
gain more knowledge <strong>and</strong> when behaviour change is<br />
in their self-interest, they start using their power as<br />
consumers <strong>and</strong> voters to support behaviour compatible<br />
with sustainable outcomes (Tietenberg <strong>and</strong> Lewis, 2012).<br />
While differing perspectives on the problems lead to a<br />
range of proposed solutions, meeting the Sustainable<br />
Development Goals (SDGs) requires recognizing the need<br />
for cooperation <strong>and</strong> solidarity, despite contextual <strong>and</strong><br />
ideological differences. All <strong>people</strong> in low <strong>and</strong> high income<br />
countries have to contribute in their own ways to ensure<br />
environmental<br />
sustainability<br />
for all. Changing<br />
Meeting the SDGs means<br />
the population<br />
that all <strong>people</strong> in low <strong>and</strong> pressure faced by<br />
high income countries the world requires<br />
significant emphasis<br />
have to contribute<br />
on improving<br />
in their own ways to life chances <strong>and</strong><br />
ensure environmental reducing inequality<br />
between <strong>and</strong><br />
sustainability for all<br />
within countries.<br />
Changing how<br />
economies function,<br />
whether through technological innovation or using local<br />
solutions, requires commitment at the national level,<br />
with global <strong>and</strong> local actors also doing their share. The<br />
most important task is to recognize that revolutionary<br />
changes in lifestyle, not just incremental adjustments,<br />
are required (Senge et al., 2008).<br />
(see Chapter 3). And education not only improves<br />
livelihoods by increasing earnings, but also produces<br />
the literate <strong>and</strong> skilled workers who are essential to<br />
ensure the technological transformation of economies<br />
<strong>and</strong> food systems (see Chapter 2).<br />
This section discusses the ways in which education<br />
can influence individual <strong>and</strong> collective environmental<br />
behaviour through contemporary, traditional <strong>and</strong> lifelong<br />
approaches to learning: formal education, learning within<br />
communities, media <strong>and</strong> public awareness campaigns,<br />
<strong>and</strong> leadership in a wide range of sectors. Also shown is<br />
the need to learn from traditional knowledge systems<br />
<strong>and</strong> local communities.<br />
CONTEMPORARY APPROACH: LEARNING<br />
THROUGH SCHOOLING<br />
The primary contemporary approach to addressing<br />
environmental challenges via education is through<br />
formal schooling. Education helps students underst<strong>and</strong><br />
an environmental problem, its consequences <strong>and</strong> the<br />
types of action required to address it. With improved<br />
environmental <strong>and</strong> ecological literacy, students are more<br />
inclined to change behaviour affecting environmental<br />
issues. Examples include school-led awareness-raising<br />
campaigns <strong>and</strong> programmes on recycling, minimizing<br />
litter, conserving energy <strong>and</strong> improving water, sanitation<br />
<strong>and</strong> public health. Environmentally literate students are<br />
better equipped to see the links between specific issues<br />
<strong>and</strong> global environmental change. Formal education<br />
supplies the knowledge, vocabulary <strong>and</strong> key concepts<br />
required for environmental literacy, as well as the<br />
historical <strong>and</strong> philosophical background.<br />
TO MEET THESE CHALLENGES,<br />
LEARNING IS ESSENTIAL<br />
Education has a key role to play in addressing<br />
environmental challenges, whether their cause is<br />
believed to be economic or demographic, or global,<br />
national or individual actions. Education can be used<br />
to mitigate specific environmental issues <strong>and</strong> respond<br />
to their impact, but also to address the behaviour that<br />
causes them.<br />
For example, education, especially of girls <strong>and</strong> women,<br />
is the single most effective means of curtailing<br />
population growth, by increasing <strong>people</strong>’s autonomy<br />
over fertility-related decisions <strong>and</strong> delaying pregnancy<br />
Three main types of relevant education programmes<br />
have been identified since the 19th century – nature<br />
conservation education, environmental education,<br />
<strong>and</strong> education for sustainable development – each<br />
pointing to the connection between humans <strong>and</strong><br />
the <strong>planet</strong> (Wals, 2012). Each type is associated with<br />
a distinct period <strong>and</strong> focal area – connecting <strong>and</strong><br />
reconnecting <strong>people</strong> with nature, developing ecological<br />
literacy to change environmental behaviour <strong>and</strong><br />
lifestyles, <strong>and</strong> now capacity-building for sustainable<br />
development <strong>and</strong> global citizenship (Table 1.2). The trend<br />
shows increased awareness of the direct links between<br />
the environment, lifestyle <strong>and</strong> livelihoods, <strong>and</strong> a shift<br />
towards incorporating environmental education into<br />
the formal school curricula through education for<br />
sustainable development.<br />
24<br />
CHAPTER 1 | PLANET: ENVIRONMENTAL SUSTAINABILITY
1<br />
TABLE 1.2:<br />
Environmental education has evolved over the years<br />
Three types of contemporary environmental education<br />
Nature conservation education Environmental education Sustainability education<br />
Starting period Late 19th century Late 1960s, early 1970s Early 1990s<br />
Main focus<br />
Connecting with nature, underst<strong>and</strong>ing web of life, protecting<br />
species, raising awareness, knowledge <strong>and</strong> underst<strong>and</strong>ing<br />
Raising environmental awareness about pollution of water,<br />
soil <strong>and</strong> air<br />
Increasing citizen engagement, participation in sustainable<br />
development issues <strong>and</strong> increasing underst<strong>and</strong>ing of<br />
connections between environment, economy, culture <strong>and</strong><br />
ecology, <strong>and</strong> how today’s actions affect future generations<br />
Intended impact<br />
Examples<br />
Ecological literacy, societal support base for nature<br />
conservation through national parks<br />
Visitor centres in national parks, public awareness campaigns,<br />
nature programmes in schools, school gardening<br />
Changing individual environmental behaviour, developing<br />
agency <strong>and</strong> societal support for environmental legislation<br />
Environmental education centres in cities, public awareness<br />
campaigns, school curricula, teacher training<br />
A more holistic or integrated approach of dealing with issues<br />
around water, food, energy, poverty <strong>and</strong> biodiversity, in<br />
governance, education <strong>and</strong> business<br />
Multistakeholder platforms focusing on sustainable<br />
development issues, whole school approaches to<br />
sustainability, corporate social responsibility<br />
Source: Wals (2012).<br />
A Global Education Monitoring Report (GEM Report)<br />
analysis of 78 national curricula shows that topics<br />
associated with sustainable development are<br />
widespread – although sometimes framed <strong>and</strong> defined<br />
differently depending on the country – <strong>and</strong> generally<br />
draw on similar types of content: 73% of countries<br />
mention ‘sustainable development’, 55% use the term<br />
‘ecology’ <strong>and</strong> 47% ‘environmental education’ in their<br />
curricula. These concepts are embedded in various<br />
parts of the curricula.<br />
Some countries have prioritized environmental<br />
education programmes. In India, for example,<br />
environmental education was m<strong>and</strong>ated by the<br />
Supreme Court in 1991, <strong>and</strong> in 2003 the government<br />
directed the National Council of Educational Research<br />
<strong>and</strong> Training to produce extensive content on<br />
environmental education (Centre for Environmental<br />
Education, 2015). As a result, over 300 million school<br />
students in the 1.3 million schools currently receive<br />
some environmental education training (Gardiner, 2015).<br />
Evidence shows that curricular design affects student<br />
knowledge. In the 2006 Organisation for Economic<br />
Co-operation <strong>and</strong> Development (OECD) Programme for<br />
International Student Assessment (PISA) test of ‘science<br />
competencies for tomorrow’s world’, students in Estonia<br />
<strong>and</strong> Sweden – where sustainable development content<br />
is in the curricula – were more likely to answer questions<br />
about environmental science correctly than their peers in<br />
countries at similar development levels (see Chapter 16).<br />
In 62% of 119 countries covered by the Gallup World<br />
Poll conducted in 2007 <strong>and</strong> 2008, education level <strong>and</strong><br />
beliefs about the cause of climate change were often<br />
the top predictors of climate change awareness <strong>and</strong> risk<br />
perception (Lee et al., 2015). People with more schooling<br />
were better able to identify various environmental<br />
issues in 70 out of 119 countries. People with access<br />
to communication tools were also more aware,<br />
demonstrating the growing importance of information <strong>and</strong><br />
communications technology in environmental education.<br />
Schooling improves sustainability-related knowledge,<br />
skills <strong>and</strong> attitudes<br />
Education not only increases knowledge <strong>and</strong> awareness<br />
but also improves skills <strong>and</strong> enables individuals to<br />
make better, more environmentally informed decisions.<br />
Evidence from the 2010<br />
International Social<br />
In 31 countries, more Survey Programme (ISSP)<br />
on 31 mostly high income<br />
education increases<br />
countries shows that each<br />
the chance that step on the education<br />
<strong>people</strong> will express ladder, from primary to<br />
lower secondary, upper<br />
concern for the<br />
secondary <strong>and</strong> tertiary<br />
environment<br />
education, increases the<br />
chance that <strong>people</strong> will<br />
express concern for the<br />
environment, even after taking into account factors<br />
such as wealth, individual characteristics <strong>and</strong> political<br />
affiliation (Franzen <strong>and</strong> Vogl, 2013).<br />
People with more education are also more likely to<br />
follow up environmental concern with activism to<br />
promote <strong>and</strong> support political decisions that protect<br />
the environment. Analysis of the 2010 ISSP finds that<br />
in almost all participating countries, respondents with<br />
more education were more likely to have signed a<br />
2016 • GLOBAL EDUCATION MONITORING REPORT 25
1<br />
petition, given more money or taken part in a protest or<br />
demonstration in relation to the environment over the<br />
previous five years. In the Republic of Korea, one of the<br />
countries with the highest emission levels, the influence<br />
of education is apparent: 19% of respondents with<br />
secondary education had taken such political action, but<br />
30% of those with tertiary education had done so (Clery<br />
<strong>and</strong> Rhead, 2013).<br />
Schooling also teaches values, helping students develop<br />
a sense of place, reconnect with nature <strong>and</strong> build agency<br />
<strong>and</strong> competencies. Place-based experiences such as<br />
school garden programmes can build an emotional<br />
connection with both the urban <strong>and</strong> the natural world<br />
(Anderson, 2013; Gruenewald <strong>and</strong> Smith, 2008; Theimer<br />
<strong>and</strong> Ernst, 2012). Direct contact with the l<strong>and</strong> <strong>and</strong> the<br />
living environment, <strong>and</strong> tangible exposure to the relation<br />
between humanity <strong>and</strong> nature in terms of impact <strong>and</strong><br />
interdependency, have been key to programmes’ success<br />
(Mackenzie et al., 2014; Rickinson et al., 2004). In India<br />
the concept of “h<strong>and</strong>print” was developed to emphasize<br />
positive actions in support of sustainability, in contrast<br />
to traditional environmental discussions on global<br />
footprints. The Paryavaran Mitra programme, launched<br />
in 2010, builds on this concept by promoting the value<br />
of a learning by doing. It developed a network of young<br />
‘friends of the environment’ <strong>and</strong> currently reaches over<br />
220,000 schools as well as government <strong>and</strong> civil society<br />
partners (Centre for Environmental Education, 2015).<br />
In younger age groups, overemphasis on awareness of<br />
global issues can overshadow teaching of knowledge<br />
<strong>and</strong> skills needed to respond to <strong>and</strong> engage with local<br />
environmental issues <strong>and</strong> to maximize personal impact.<br />
PISA 2006 found that while students in OECD countries<br />
had a high sense of personal <strong>and</strong> social responsibility on<br />
environmental issues, they were not optimistic – only<br />
13% to 21% believed the overall situation would improve<br />
in the next 20 years (OECD, 2009). As environmental<br />
problems can easily lead to feelings of apathy <strong>and</strong><br />
powerlessness, it is critical for education to develop<br />
students’ agency, environmental problem-solving abilities<br />
<strong>and</strong> competencies to bring about real change in their own<br />
community <strong>and</strong> everyday lives (Anderson, 2013).<br />
Finally, studies show that engagement in out-ofschool<br />
environmental activities strengthens in-class<br />
performance. The 2009 International Civics <strong>and</strong><br />
Citizen Survey reported that two-thirds of students<br />
in 38 countries had participated in out-of-school<br />
civic activities (Schulz et al., 2010). Environmental<br />
organizations were the most common, involving about<br />
30% of students – <strong>and</strong> more than 50% in Colombia,<br />
the Dominican Republic, Guatemala, Indonesia <strong>and</strong><br />
Thail<strong>and</strong>. In the Republic of Korea, students who studied<br />
<strong>and</strong> tackled real-life environmental issues tended to<br />
perform well upon entering university. And as the<br />
place of learning was shifted out of school, beneficial<br />
partnerships were created between environmental<br />
organizations <strong>and</strong> school education (UNESCO, 2014).<br />
Leading by example: whole schools<br />
As students spend significant time in the classroom,<br />
schools <strong>and</strong> universities are increasingly called upon<br />
to act as role models for sustainable development. The<br />
education sector can set an example in environmental<br />
stewardship. The ‘whole school’ approach to<br />
environmental education incorporates all aspects of a<br />
school: curriculum, extracurricular activities, teacher<br />
training, human resources <strong>and</strong> infrastructure operations<br />
<strong>and</strong> processes (Mcmillin <strong>and</strong> Dyball, 2009). The UNESCO<br />
International Bureau of Education describes the ‘whole<br />
school’ approach as ‘addressing the needs of learners,<br />
staff <strong>and</strong> the wider community, not only within the<br />
curriculum, but across the whole-school <strong>and</strong> learning<br />
environment’ <strong>and</strong> says it ‘implies collective <strong>and</strong><br />
collaborative action in <strong>and</strong> by a school community to<br />
improve student learning, behaviour <strong>and</strong> wellbeing <strong>and</strong><br />
the conditions that support these (UNESCO-IBE, 2013).’<br />
Aiming to make schools safe, climate-compatible <strong>and</strong><br />
sustainable, this approach encourages institutions<br />
to change buildings, grounds <strong>and</strong> school schedules<br />
accordingly, <strong>and</strong> to engage with the local community<br />
(Anderson, 2012). In<br />
addition to rethinking<br />
curricula (are emerging<br />
Whole school<br />
subjects <strong>and</strong> concepts<br />
approaches in Engl<strong>and</strong> covered <strong>and</strong> new<br />
have improved schools’<br />
competencies being<br />
taught?), the ‘whole<br />
ethos <strong>and</strong> students’<br />
school’ approach<br />
health <strong>and</strong> learning, implies reconsidering<br />
<strong>and</strong> reduced schools’<br />
<strong>and</strong> redesigning<br />
schools’ operations<br />
ecological footprints<br />
<strong>and</strong> environmental<br />
management (does the<br />
school conserve water<br />
<strong>and</strong> energy, provide healthy food, minimize waste <strong>and</strong><br />
provide green <strong>and</strong> healthy school grounds?), pedagogy<br />
<strong>and</strong> learning (are teaching, learning <strong>and</strong> participation<br />
in decision-making adequate <strong>and</strong> appropriate?) <strong>and</strong><br />
26<br />
CHAPTER 1 | PLANET: ENVIRONMENTAL SUSTAINABILITY
1<br />
community relationships (does the school connect with<br />
community issues <strong>and</strong> resources?).<br />
Research on the impact of whole school approaches in<br />
Engl<strong>and</strong> (United Kingdom) has shown improvements in<br />
schools’ ethos <strong>and</strong> students’ health <strong>and</strong> learning, <strong>and</strong><br />
reductions in schools’ ecological footprints (Hacking et<br />
al., 2010). Unfortunately, however, while the approach is<br />
growing in popularity, it remains the exception rather<br />
than the rule (Hargreaves, 2008).<br />
At the university level, the International Association<br />
of Universities, through its Higher Education for<br />
Sustainable Development initiative, promotes<br />
sustainability on campuses, including in business<br />
<strong>and</strong> community outreach, student engagement,<br />
management, institutional development, research<br />
<strong>and</strong> curriculum. One member, Ryerson University in<br />
Toronto, Canada, has developed a Campus Facilities<br />
<strong>and</strong> Sustainability programme to refocus the campus’s<br />
efforts on developing sustainable operating practices<br />
<strong>and</strong> capital investment strategies (IAU, 2015).<br />
TRADITIONAL APPROACH: LEARNING<br />
THROUGH COMMUNITY<br />
While schools are one of the main sources of knowledge<br />
on sustainability, formal education does not reach<br />
everyone. Thus, another approach is important:<br />
learning through community, as done traditionally for<br />
generations. Often the groups left behind have the least<br />
access to typical resources. Local communities <strong>and</strong><br />
traditional knowledge hold the key to reaching such<br />
groups. Local communities are much more than towns or<br />
villages; they are living entities that involve interaction of<br />
<strong>people</strong> with their local environment (Noguchi et al., 2015).<br />
Traditional – <strong>and</strong> specifically indigenous – knowledge<br />
plays an important role in environmental sustainability.<br />
Indigenous<br />
knowledge is<br />
local knowledge<br />
Passed from generation that is unique<br />
to a culture or<br />
to generation, traditional<br />
society (Magni,<br />
indigenous knowledge has 2016). 1 Passed<br />
been the basis for activities from generation<br />
to generation,<br />
that sustain societies in<br />
usually by word<br />
much of the world<br />
of mouth <strong>and</strong><br />
rituals, it has been<br />
the basis for agriculture, food preparation, health care,<br />
education, conservation <strong>and</strong> many other activities that<br />
sustain societies in much of the world.<br />
Indigenous <strong>people</strong> are the ‘first’ or ‘original’ <strong>people</strong><br />
belonging to l<strong>and</strong> or territories to which they are historically<br />
<strong>and</strong> culturally tied. About 370 million indigenous <strong>people</strong><br />
live in over 90 countries worldwide (United Nations, 2009).<br />
Indigenous communities are stewards of traditional<br />
environmental knowledge, which sees nature as a living<br />
being <strong>and</strong> describes a reciprocal, interdependent, balanced<br />
<strong>and</strong> complementary relationship between humanity,<br />
nature <strong>and</strong> the universe. Traditional knowledge is dynamic,<br />
representing generations of creativity, innovation, <strong>and</strong><br />
scientific <strong>and</strong> logical validity (Battiste, 2002; Maurial, 2002).<br />
Most indigenous <strong>people</strong>s share norms <strong>and</strong> values that are<br />
central to sustainable livelihoods (Box 1.1). Fundamental<br />
BOX 1.1<br />
Governments have adopted local community practices of buen vivir<br />
In Latin America, the idea of buen vivir (living well) has been considered by academics,<br />
indigenous leaders, communities <strong>and</strong> politicians as a guiding principle for a new<br />
development regimen, incorporating the vision of indigenous <strong>people</strong>s as well as traditional<br />
knowledge, that must be carried out collectively. Indigenous leaders in the region say buen<br />
vivir can be considered ‘a contribution from indigenous populations to the world’.<br />
Among buen vivir principles common to indigenous groups across the region is a<br />
relationship between humans, nature <strong>and</strong> the universe in which nature is considered<br />
a living being <strong>and</strong> has an indissoluble, interdependent, balanced <strong>and</strong> complementary<br />
relationship with the universe <strong>and</strong> with humans. The ideas of community <strong>and</strong><br />
communitarianism are also important. The community, rather than the individual, is the<br />
main reference for natural <strong>and</strong> cultural property. Harmony within indigenous communities<br />
is reached through a system of equality <strong>and</strong> respect for all members but particularly<br />
women <strong>and</strong> elders as the primary holders <strong>and</strong> transmitters of traditional knowledge.<br />
There are unique national <strong>and</strong> local manifestations of buen vivir. Two of the best-known<br />
national approaches are those of the Plurinational State of Bolivia <strong>and</strong> Ecuador. The<br />
Kichwa concept sumak kawsay, adopted in the 2008 Ecuadorian Constitution, <strong>and</strong> the<br />
Aymara concept suma qamaña, adopted in the 2009 Bolivian Constitution, mean living<br />
well, in harmony with nature <strong>and</strong> the universe. The Aymara concept has more emphasis<br />
on communitarian life: living well together. In Panama, at the local level, the Ngobe <strong>people</strong><br />
use the expression ti nûle kûin, which means be happy, live well, with good health, free<br />
from concerns <strong>and</strong> in harmony with nature. In Chile, the Mapuche indigenous group<br />
uses the expression küme mongen, which refers to a good life resulting from a balanced<br />
relationship between a person, the environment <strong>and</strong> the supernatural.<br />
Sources: Cunningham (2010), Gudynas (2011a).<br />
2016 • GLOBAL EDUCATION MONITORING REPORT 27
1<br />
to these values are notions such as community, equality<br />
<strong>and</strong> complementarity (Gudynas, 2011a; Ibañez, 2011),<br />
where the fundamental conditions of well-being are<br />
sufficient food; strong family <strong>and</strong> community values of<br />
caring, reciprocity <strong>and</strong> solidarity; freedom to express<br />
one’s identity <strong>and</strong> practise one’s culture; <strong>and</strong> a safe,<br />
unpolluted environment (Tauli-Corpuz, 2010).<br />
Indigenous <strong>people</strong>s live in some of the most vulnerable<br />
ecosystems. Ranging from the Arctic, high mountains,<br />
floodplains <strong>and</strong> tropical rainforests to desert margins,<br />
small isl<strong>and</strong>s <strong>and</strong> low coastal areas, indigenous territories<br />
are directly affected by the ecological crisis that has<br />
brought climate change <strong>and</strong> loss of biodiversity. Despite<br />
hostile conditions, many indigenous <strong>people</strong>s thrive, finding<br />
ways to resist <strong>and</strong> adapt to environmental changes, mainly<br />
due to their deep knowledge of <strong>and</strong> relationship with the<br />
environment (Nakashima et al., 2012).<br />
Numerous examples of indigenous communities’<br />
traditional l<strong>and</strong> management practices are being<br />
recognized globally for conserving biodiversity <strong>and</strong><br />
maintaining ecosystem processes. Conservationists <strong>and</strong><br />
researchers acknowledge the huge scale of biodiversityrich<br />
terrestrial <strong>and</strong> marine habitats that are successfully<br />
managed outside government-designated protected<br />
areas. Estimated to be roughly equal to the size of total<br />
protected areas, indigenous <strong>and</strong> community-conserved<br />
areas <strong>and</strong> sacred natural sites are often managed as well<br />
as or more effectively than comparable governmentmanaged<br />
areas. For example, research shows that such<br />
sites have been more effective in tackling rainforest<br />
deforestation by reducing logging <strong>and</strong> forest fires,<br />
thus contributing to rainforests’ critical functions as<br />
biodiversity hotspots <strong>and</strong> carbon sinks, places that<br />
absorb more carbon than they release (ICCA, 2015).<br />
The practice of sustainable traditional livelihoods is a<br />
testimony to indigenous <strong>people</strong>s’ resilience <strong>and</strong> their<br />
contribution to mitigating the impact of climate change<br />
(UNPFII, 2008). It was pointed out at the 2009 Asia<br />
Summit on Climate Change <strong>and</strong> Indigenous Peoples that<br />
indigenous groups have applied traditional knowledge to<br />
agriculture, agroforestry, coastal <strong>and</strong> river management,<br />
medicinal plants, water management <strong>and</strong> harvesting, <strong>and</strong><br />
disaster management, among other areas (Tauli-Corpuz<br />
et al., 2009).<br />
Notions like buen vivir offer an important contribution<br />
to today’s world in crucial aspects such as social<br />
organization <strong>and</strong> economic structure. Harmony<br />
between humanity, nature <strong>and</strong> the universe can<br />
be used as a key principle for activities related to<br />
resource production <strong>and</strong> management. However, the<br />
discourse remains philosophical in some countries,<br />
even the Plurinational State of Bolivia <strong>and</strong> Ecuador,<br />
despite inclusion in their constitutions. On the other<br />
h<strong>and</strong>, Colombia’s Council of Sustainable Settlements<br />
of the Americas is putting the concept into practice,<br />
for example in urban eco-barrio projects, transition<br />
towns, traditional sustainable villages, eco-caravans <strong>and</strong><br />
sustainability education centres (Cunningham, 2010;<br />
Gudynas, 2011b; Tauli-Corpuz, 2010).<br />
Traditional, local <strong>and</strong> indigenous knowledge have proved<br />
valuable for the functioning of ecosystems, early warning<br />
systems related to disasters, climate change adaptation,<br />
<strong>and</strong> resilience (Sheil et al., 2015). Integrating place-based<br />
knowledge with scientific climate models is valuable, as<br />
place-based approaches to climate issues can ‘bring another<br />
level of awareness to consumer societies’, <strong>and</strong> make them<br />
more resilient against disasters (Leduc <strong>and</strong> Crate, 2013).<br />
Lessons from culturally integrated schools<br />
The world can learn from indigenous communities’<br />
best practices. The latest Assessment Report of the<br />
Intergovernmental Panel on Climate Change identifies<br />
indigenous <strong>and</strong> traditional knowledge as a major resource<br />
for adapting to climate change. It highlights the need to<br />
integrate such knowledge with existing practices to increase<br />
the effectiveness of adaptation (IPCC, 2014). The success<br />
of many programmes has rested on deep intercultural<br />
respect, along with openness to a plurality of knowledge<br />
systems <strong>and</strong> cultures based on shared fundamental<br />
values (Leduc <strong>and</strong> Crate, 2013; Marika et al., 2009).<br />
Intergenerational learning is critical to integrating<br />
traditional knowledge into contemporary society.<br />
Traditionally, elders are the custodians of indigenous<br />
knowledge <strong>and</strong> consequently the most valuable source<br />
of transmission (Dweba <strong>and</strong> Mearns, 2011). Successful<br />
education initiatives, such as the Alaska Rural Systemic<br />
Initiative in the United States, foster interaction of<br />
students with indigenous elders. For example, elders play<br />
a central role in instructional planning, curriculum design<br />
<strong>and</strong> programme implementation in culturally responsive<br />
schools, <strong>and</strong> lead activities related to knowledge<br />
transmission in cultural camps (Barnhardt, 2008).<br />
One crucial way to incorporate traditional knowledge<br />
into schools is using the local language as the language<br />
of instruction. In Botswana, the Bokamoso preschool<br />
28<br />
CHAPTER 1 | PLANET: ENVIRONMENTAL SUSTAINABILITY
1<br />
programme provides<br />
One crucial way to teacher trainees with<br />
a system of naturebased<br />
educational<br />
incorporate traditional<br />
knowledge into<br />
tools incorporating the<br />
schools is using the traditional knowledge<br />
of the San, a major<br />
local language as the<br />
indigenous group in the<br />
language of instruction region. The curriculum<br />
of Bokamoso Teacher<br />
Training Centre was<br />
developed collaboratively over two years by a team of<br />
parents, community members, curriculum experts <strong>and</strong><br />
members of non-government organizations (NGOs).<br />
The project provides trainees with the tools they need<br />
to teach pre-school in the San language (Batibo, 2013).<br />
Using the mother tongue as the language of instruction<br />
has a positive impact on learning across the curriculum,<br />
not only in languages (UNESCO, 2016).<br />
between indigenous populations, civil society,<br />
government, development partners <strong>and</strong> management<br />
agencies, as well as scholars from a range of disciplines,<br />
to promote conservation of indigenous knowledge <strong>and</strong><br />
its integration in various initiatives (Gorjestani, 2004).<br />
LIFELONG LEARNING APPROACH: LEARNING<br />
THROUGH WORK AND DAILY LIFE<br />
Environmental change requires other types of learning than<br />
formal schooling or traditional education in communities.<br />
People must act <strong>and</strong> contribute to environmental<br />
sustainability at all stages of their lives, so learning that<br />
takes place through work <strong>and</strong> daily life is crucial.<br />
Lifelong learning comprises all learning activities<br />
undertaken throughout life with the aim of improving<br />
knowledge, skills <strong>and</strong> competencies within personal, civic,<br />
social <strong>and</strong> employment-related perspectives (UIL, 2015).<br />
The strong Western focus of education systems <strong>and</strong><br />
institutions around the world impedes meaningful<br />
inclusion of indigenous populations <strong>and</strong> their knowledge<br />
<strong>and</strong> practices within the formal schooling system.<br />
Factors involved include curricula that lack local relevance<br />
<strong>and</strong> devalue indigenous knowledge; use of the dominant<br />
language for instruction instead of the home language<br />
(Batibo, 2009); st<strong>and</strong>ardized assessment strategies<br />
(Barnhardt <strong>and</strong> Kawagley, 2005); <strong>and</strong> faculty attitudes<br />
about curricula (Radoll, 2015). These factors often clash<br />
with traditional teachings (Nakashima et al., 2012).<br />
Research has documented how formal schooling<br />
systems have resulted in the loss of significant<br />
background knowledge about nature, culture <strong>and</strong><br />
values that indigenous children previously acquired in<br />
their communities. Examples from countries including<br />
Australia, Canada <strong>and</strong> the United States show an<br />
unquantifiable loss of indigenous knowledge from<br />
the beginning of the 20th century, when indigenous<br />
children were sent to residential schools or put up<br />
for forced adoption in an attempt to assimilate them<br />
into the dominant society (Reyhner <strong>and</strong> Eder, 2015).<br />
Separating them from their families <strong>and</strong> consequently<br />
from their cultural roots caused ‘irreparable harm<br />
to the survival of indigenous cultures <strong>and</strong> societies’<br />
(Stavenhagen, 2015, p. 255).<br />
However, while education can cause loss of indigenous<br />
knowledge, it can also be a cure (UNESCO, 2009). It is<br />
essential to foster dialogue <strong>and</strong> create partnerships<br />
A lifelong learning approach focuses not only on<br />
curricula but also on intergenerational knowledge <strong>and</strong><br />
values created by the community. It fosters synergy<br />
<strong>and</strong> connections between groups in society to tackle<br />
environmental challenges. Government agencies, faithbased<br />
organizations, non-profit <strong>and</strong> community groups,<br />
labour organizations <strong>and</strong> the private sector can all<br />
contribute to lifelong environmental education.<br />
Governments <strong>and</strong> intergovernmental bodies<br />
Governments have an important role to play in educating<br />
the public about environmental change. Governmentbacked<br />
campaigns raise awareness on an environmental<br />
problem, point to its underlying drivers <strong>and</strong> signal how<br />
stakeholders can address it <strong>and</strong> bring about meaningful<br />
change. Public awareness campaigns are most effective<br />
when they target groups with shared values <strong>and</strong> engage<br />
with community leaders to convey key messages (Stern,<br />
2007). In 2015, for example, the Ethiopian Ministry<br />
of Water, Irrigation <strong>and</strong> Energy <strong>and</strong> other partners<br />
launched a two-year public awareness campaign aimed<br />
at encouraging solar lighting products. Targeting over 12<br />
million Ethiopians, the campaign aimed to discourage<br />
households from using kerosene lamps <strong>and</strong> help them<br />
make informed decisions for purchasing off-grid lighting<br />
(World Bank, 2015).<br />
A related initiative, Lighting Africa, has enabled more<br />
than 35 million <strong>people</strong> across Africa to have clean,<br />
affordable, safe lighting <strong>and</strong> energy. Currently operating<br />
in Burkina Faso, the Democratic Republic of the Congo,<br />
2016 • GLOBAL EDUCATION MONITORING REPORT 29
1<br />
Ethiopia, Kenya, Liberia, Mali, Nigeria, Senegal, South<br />
Sudan, the United Republic of Tanzania <strong>and</strong> Ug<strong>and</strong>a, the<br />
programme addresses the lighting needs of rural, urban<br />
<strong>and</strong> suburban consumers without electricity access –<br />
predominantly low income households <strong>and</strong> businesses.<br />
It offers an alternative to kerosene lamps <strong>and</strong> c<strong>and</strong>les,<br />
the most commonly used lighting sources among those<br />
without grid electricity. The programme has helped<br />
households reduce carbon dioxide emissions by about<br />
700,000 tonnes, the equivalent of getting 147,000 cars<br />
off the road (World Bank, 2016).<br />
The United Nations University Institute for the Advanced<br />
Study of Sustainability launched the first Regional<br />
Centres of Expertise (RCEs) on education for sustainable<br />
development in 2003 (Fadeeva et al., 2014). RCEs bring<br />
together regional <strong>and</strong> local institutions, build innovative<br />
platforms to share information <strong>and</strong> experiences, <strong>and</strong><br />
promote dialogue among regional <strong>and</strong> local stakeholders<br />
through partnerships for sustainable development. By<br />
2015, 138 RCEs around the globe were demonstrating the<br />
potential of multistakeholder learning <strong>and</strong> networking<br />
between schools, universities, local government, civil<br />
society groups <strong>and</strong> the private sector (IAU, 2016).<br />
One example, RCE Minna, is located in Nigeria’s North<br />
Central geopolitical zone, a largely rural <strong>and</strong> agrarian<br />
region with low population density <strong>and</strong> a variable climate.<br />
RCE Minna teaches educators, students, youths <strong>and</strong><br />
community leaders to better manage their natural<br />
environment so as to ensure sustainable development<br />
in Niger state <strong>and</strong> its environs in a context of high<br />
unemployment <strong>and</strong> poverty rates, environmental<br />
degradation, poor sanitation <strong>and</strong> waste management<br />
systems, poor soil management, poor education, flooding,<br />
deforestation <strong>and</strong> declining freshwater resources<br />
(Fadeeva et al., 2014).<br />
Religious <strong>and</strong> cultural leaders<br />
Religious, cultural <strong>and</strong> social leaders can help spread<br />
environmentally sound values <strong>and</strong> behaviour (Zaval <strong>and</strong><br />
Cornwell, 2015). Social<br />
incentives <strong>and</strong> peer<br />
pressure based on shared<br />
Religious, cultural<br />
values <strong>and</strong> norms drive<br />
<strong>and</strong> social leaders consumption choices<br />
can help spread<br />
<strong>and</strong> environmental<br />
behaviour. Leaders <strong>and</strong><br />
environmentally sound<br />
role models can shape<br />
values <strong>and</strong> behaviour social aspirations <strong>and</strong><br />
provide models for<br />
sustainable behaviour.<br />
Religious leaders are often skilled <strong>and</strong> insightful in<br />
using communication techniques to effect behaviour<br />
change, especially at the local level. In the United States,<br />
the Take Charge Challenge encouraged community<br />
members to reduce energy use by making homes more<br />
weather resistant <strong>and</strong> energy efficient. Rather than using<br />
conventional awareness-raising techniques, the initiative<br />
relied on religious leaders to appeal to community<br />
members’ values. Local leaders successfully tied green<br />
initiatives into deeply held spiritual beliefs <strong>and</strong> encouraged<br />
households to make the right moral choice. It is estimated<br />
that communities saved 110.2 billion British thermal<br />
unit (Btu) of gas <strong>and</strong> electricity, about US$2.3 million in<br />
energy savings (Fuller et al., 2011).<br />
Greener businesses <strong>and</strong> workplaces<br />
People spend a great amount of time in the workplace,<br />
making it a useful location for informal <strong>and</strong> non-formal<br />
education. Over the past two to three decades, a series<br />
of corporate initiatives have been launched to reduce<br />
companies’ ecological footprint <strong>and</strong> educate staff <strong>and</strong><br />
the public about environmental protection. In addition<br />
to cutting costs <strong>and</strong> improving a company’s reputation,<br />
initiatives in the realm of corporate social responsibility (CSR)<br />
help raise environmental awareness internally <strong>and</strong> externally.<br />
In a 2008 Economist Intelligence Unit survey, over half<br />
of all the global executives who responded considered<br />
CSR a high or very high priority – up from 34.1% in 2005<br />
(The Economist, 2008). Over 40% said it was important<br />
for their companies to align sustainability with their<br />
overall business goals, mission or values (McKinsey,<br />
2014). Allianz Insurance, an international financial<br />
services group employing over 148,000 <strong>people</strong>, publicly<br />
committed to a 35% reduction of its 2006 carbon<br />
footprint by 2015. To reach its objective, it ‘greened’ its<br />
IT hardware purchasing policy, reduced unnecessary<br />
travel <strong>and</strong> imposed double-sided printing (TUC, 2014).<br />
Unilever developed a plan to improve environmental<br />
impacts throughout the entire supply chain; it reduced<br />
manufacturing carbon emissions by one third while<br />
increasing sustainable agricultural sources from<br />
14% to 48% between 2010 <strong>and</strong> 2014 (The Economist,<br />
2014). Initiatives such as these not only help reduce<br />
a company’s carbon footprint but also encourage<br />
employees to adopt more sustainable practices outside<br />
the workplace.<br />
In addition to preserving the environment, manufacturers’<br />
<strong>and</strong> retailers’ decisions to market organic products,<br />
use environmentally sustainable packaging, ban plastic<br />
bags (Box 1.2) <strong>and</strong> inform consumers about how goods<br />
30<br />
CHAPTER 1 | PLANET: ENVIRONMENTAL SUSTAINABILITY
1<br />
are produced contribute to consumer education <strong>and</strong><br />
subsequent shifts in habits, allowing consumers to make<br />
decisions according to their values <strong>and</strong> preference (BIO<br />
Intelligence Service, 2012; Hertwich, 2003).<br />
Labour organizations can play a key role in<br />
mainstreaming <strong>and</strong> transitioning towards more<br />
sustainable practices in the workplace. At the<br />
international level, the International Labour Organization<br />
(ILO) has an International Training Centre in Turin that<br />
delivers a course for worker representatives called ‘Green<br />
jobs for a just transition to low-carbon <strong>and</strong> climateresilient<br />
development’ (ILO, 2016). Its purpose is<br />
to educate labour representatives from around the<br />
world about the links between environmental challenges<br />
<strong>and</strong> the world of work, distil lessons <strong>and</strong> good practices,<br />
<strong>and</strong> explore ways of promoting environmentally<br />
sustainable policies adapted to be nationally relevant<br />
<strong>and</strong> socially inclusive.<br />
BOX 1.2<br />
Leading by example: nudging <strong>people</strong> to act green<br />
‘Nudging’ is a way of influencing behaviour. In sustainability<br />
nudging, more sustainable behaviour is made the default option.<br />
The government <strong>and</strong> private sector can work together to make<br />
environment-friendly goods <strong>and</strong> services the ‘green default’ for<br />
consumers. Positive trends can rapidly be normalized, shifting<br />
responsibility to those who actively wish to behave unsustainably.<br />
Nudging can also help overcome cognitive bias such as a preference<br />
for the status quo, where any change from baseline is perceived<br />
as a loss. Nudging can be considered educational when there<br />
is transparency <strong>and</strong> when the desired change is supported by<br />
knowledge <strong>and</strong> information about why the change is deemed<br />
important. When there is no transparency, nudging can become<br />
manipulation, which may lead to desirable environmental outcomes<br />
but is not socially sustainable.<br />
For sustainability nudging to work, the government, public <strong>and</strong><br />
private sector have to work well together <strong>and</strong> share a vision of<br />
reducing emissions <strong>and</strong> improving energy efficiency. In Schönau,<br />
Germany, a utility provider made its green energy programme the<br />
default option, resulting in more than 90% enrolment. Residents<br />
could opt out, but few chose to do so. By contrast, participation in<br />
clean energy programmes in other German towns was low: Less<br />
than 1% of customers chose to participate through voluntary means<br />
in 2008, the time of the study.<br />
Source: Zaval <strong>and</strong> Cornwell (2015).<br />
National <strong>and</strong> local trade unions also contribute to<br />
environmental education. In Argentina, the Construction<br />
Workers’ Union provides environmental training courses<br />
to its members on topics such as solar panel installation,<br />
solar cooker construction, <strong>and</strong> waste management<br />
<strong>and</strong> recycling. A certificate is granted upon successful<br />
completion of a course (Fondación UOCRA, 2009).<br />
Non-government organizations<br />
NGOs can mobilize public support for environmental<br />
conservation. In countries with poorly resourced formal<br />
education sectors, they<br />
may be the main source of<br />
NGOs, such<br />
environmental education.<br />
Through public information<br />
as Avaaz, can<br />
campaigns, projects on<br />
effectively mobilize the ground, partnerships<br />
public support for <strong>and</strong> green alliances, NGOs<br />
substantially contribute<br />
environmental<br />
to the shaping of public<br />
conservation.<br />
environment-related<br />
behaviour. Their strength,<br />
compared to other groups<br />
<strong>and</strong> the formal education sector, lies in their ability to<br />
deliver environmental education using more informal<br />
methods <strong>and</strong> channels.<br />
The internet is a crucial, efficient tool for many NGOs<br />
(Brulle, 2010). Web-based campaign groups like Avaaz<br />
help raise awareness <strong>and</strong> mobilize ‘clicktivists’ across<br />
the globe. With 44 million members in 194 countries,<br />
Avaaz is at the centre of many high profile environmental<br />
campaigns. In 2013, for instance, it launched a two-year<br />
campaign to ban bee-killing pesticides in the European<br />
Union. The campaign included a petition with over<br />
2.6 million signatures, media-grabbing protests with<br />
beekeepers, the funding of opinion polls <strong>and</strong> the flooding<br />
of ministers with messages (Avaaz, 2013).<br />
Senegal’s Mekhe Solar Cooker Project, implemented<br />
by the Ndop Women’s Association, is an example<br />
of NGOs’ contribution to environmental education.<br />
From October 2004 to September 2006, it aimed to<br />
reduce environmental degradation by replacing woodburning<br />
stoves with solar cookers. Various modes of<br />
education <strong>and</strong> training were used: Some villagers were<br />
trained to build the cookers, others to promote their<br />
use. A DVD movie <strong>and</strong> visits to nearby communities<br />
were used to engage households. Each family saved, on<br />
average, 3 metric tonnes of carbon dioxide equivalent.<br />
The project created 10 jobs <strong>and</strong> enhanced the capacity<br />
2016 • GLOBAL EDUCATION MONITORING REPORT 31
1<br />
“<br />
If education progress is stalled, it could lead to a 20%<br />
increase in disaster-related fatalities per decade<br />
of 105 women <strong>and</strong> 22 men to use a renewable energy<br />
source (UNDP, 2015a).<br />
Informal coalitions<br />
Informal platforms <strong>and</strong> coalitions are characterized by<br />
interactive forms of learning. They have been described as<br />
participatory, collaborative, social, interactive, experiential<br />
<strong>and</strong> transformative. Examples include community groups<br />
in Detroit, United States, that have self-organized to<br />
develop urban farms that repurpose vacant property <strong>and</strong><br />
strengthen community resilience (Greening of Detroit,<br />
2015); participatory budgeting in Porto Alegre, Brazil<br />
(Touchton <strong>and</strong> Wampler, 2013); <strong>and</strong> urban farming in Hue,<br />
Viet Nam, where this practice by the local community has<br />
reduced the heat-isl<strong>and</strong> effect <strong>and</strong> has been promoted as<br />
an opportunity for ecotourism ventures <strong>and</strong> organic food<br />
production (van Dijk et al., 2012; Phuc et al., 2014).<br />
Promoting sustainable behaviour can also be effective<br />
through one-to-one interactions. In community-based<br />
social marketing approaches, priority behaviour is selected<br />
<strong>and</strong> local solutions designed to overcome barriers to<br />
behaviour change. Programmes are rolled out more widely<br />
throughout community networks. Recognizing the power<br />
of social psychology, programmes – in areas ranging from<br />
promoting reusable mugs <strong>and</strong> water-efficient showerheads<br />
to carpooling <strong>and</strong> purchasing products with recycled<br />
contents – encourage getting public commitment<br />
from individuals during personal interactions, as this is<br />
known to increase the likelihood of following through on<br />
promises (McKinsey-Mohr, 2011).<br />
”<br />
REVERSING CLIMATE CHANGE<br />
REQUIRES AN INTEGRATED<br />
APPROACH TO LEARNING<br />
The challenge of climate change demonstrates the<br />
complexity of, <strong>and</strong> urgent need for, using education<br />
to address environmental crises. All three approaches<br />
described in the sections above are required: learning at<br />
schools, in communities <strong>and</strong> through lifelong learning,<br />
along with integration between types of education <strong>and</strong><br />
collaboration between education <strong>and</strong> other sectors. Thus<br />
deployed, education can contribute to actions to address<br />
climate change, including prevention, mitigation <strong>and</strong><br />
disaster preparedness.<br />
Climate change is by far the biggest environmental<br />
crisis facing humanity. Between 1995 <strong>and</strong> 2014,<br />
15,000 extreme weather events caused more than<br />
525,000 deaths worldwide <strong>and</strong> losses of nearly<br />
US$3 trillion (Kreft et al., 2015). Climate change poses<br />
a fundamental threat to livelihoods. It is directly<br />
responsible for the rise in global temperatures <strong>and</strong><br />
increased frequency <strong>and</strong> scale of extreme weather <strong>and</strong><br />
natural disasters such as droughts, floods, aggravated<br />
desertification <strong>and</strong> biodiversity loss. These in turn have<br />
a direct impact on global food stocks, human health<br />
<strong>and</strong> well-being, human security, economic growth <strong>and</strong><br />
jobs. The effects of climate change also have serious<br />
implications for the functioning of education systems,<br />
<strong>and</strong> require adaptive strategies (Box 1.3).<br />
At COP21 in Paris, the 2015 Convention of the Parties<br />
to the UN Framework Convention on Climate Change,<br />
a record 195 countries adopted the Paris Agreement,<br />
whose signatories agreed, among other things, to keep<br />
temperature rises well below 2 degrees Celsius <strong>and</strong> curb<br />
carbon emissions. Since the consequences of climate<br />
change are so severe, especially for those living in the<br />
areas most sensitive to changes in weather patterns,<br />
temperatures <strong>and</strong> sea levels, it is no surprise there are<br />
efforts worldwide to employ education at all levels to<br />
help citizens tackle the causes of climate change <strong>and</strong> to<br />
respond to its consequences.<br />
32<br />
CHAPTER 1 | PLANET: ENVIRONMENTAL SUSTAINABILITY
1<br />
BOX 1.3<br />
Climate change <strong>and</strong> natural disasters severely affect education systems <strong>and</strong> outcomes<br />
The growing frequency of natural disasters <strong>and</strong> extreme weather increases the vulnerability of many low income countries, <strong>and</strong> such events have multiple<br />
direct <strong>and</strong> indirect effects on education systems <strong>and</strong> outcomes.<br />
Natural disasters interrupt education continuity by damaging or destroying school facilities, <strong>and</strong> they threaten communities’ physical safety <strong>and</strong><br />
psychological well-being. For example, the 2015 earthquakes in Nepal devastated the schooling infrastructure – in 11 of the most affected districts, 34,500<br />
of 55,000 classrooms were assessed as unsafe for use, affecting education for over a million children. Natural disasters are a leading cause of internal <strong>and</strong><br />
external migration globally, affecting both sending-country <strong>and</strong> receiving-country school systems as populations of young migrants change. In 2015,<br />
19.2 million <strong>people</strong> worldwide were displaced internally due to natural disasters; twice as many as were displaced by conflict <strong>and</strong> violence. In addition,<br />
climate change is raising temperatures <strong>and</strong> sea levels, <strong>and</strong> causing loss of agricultural productivity, seriously affecting children’s health, to the detriment of<br />
education outcomes.<br />
Bangladesh is one of the world’s poorest, most populous <strong>and</strong> most flood-prone countries. Climate experts project that by 2050, 27 million <strong>people</strong> there<br />
will be at risk from sea level rise. With increasing frequency of floods, many environmental migrants from rural areas become slum dwellers in Dhaka, the<br />
densely populated capital. Unsurprisingly, the school system is routinely affected by climate-related challenges. For instance, as a result of Cyclone Sidr in<br />
2007, 849 schools were destroyed in 12 districts, affecting the education of over 140,000 students.<br />
The Solar-Powered Floating Schools programme, developed by a Bangladesh NGO, Shidhulai Swanirvar Sangstha, is one example of a locally relevant<br />
education solution developed to adapt to severe weather effects. The “floating schools” (boats) help ensure year-round education <strong>and</strong> educational<br />
resources by collecting students from all over a locality, then docking in one location to provide classes.<br />
Sources: Anderson (2013); Das (2010); Internal Displacement Monitoring Centre (2015); Internal Displacement Monitoring Centre (2016); Save the Children<br />
(2008); UNICEF (2015); Walsham (2010); Wheeler (2011); WISE Initiative (2012).<br />
SCHOOLS, COMMUNITIES AND LIFELONG<br />
LEARNING WORK HAND IN HAND<br />
Formal education has a particularly strong role in<br />
mitigating climate change <strong>and</strong> responding to its<br />
impact. In fact, education expansion is more effective in<br />
combating climate change than conventional investment<br />
in infrastructure such as sea walls <strong>and</strong> irrigation systems.<br />
Research on disaster vulnerability shows that female<br />
education, for instance, is negatively correlated with<br />
disaster fatalities. Projections indicate that universalizing<br />
upper secondary education by 2030 would prevent<br />
200,000 disaster-related deaths in the 20 years that<br />
follow (Lutz et al., 2014).<br />
In countries where access to education is weak, or<br />
education is not of good quality, integrated action is<br />
required to improve the education system as well as use<br />
of education for climate action. Reaching all youth, rich<br />
<strong>and</strong> poor, may require climate change education not only<br />
in classrooms but through additional government, NGO<br />
<strong>and</strong> private sector programmes.<br />
The communities most at risk from climate-related<br />
events are generally situated in low <strong>and</strong> middle<br />
income countries. Of the 10 most affected countries<br />
between 1995 <strong>and</strong> 2014, 9 were in the low or lower<br />
middle income group: Bangladesh, Guatemala, Haiti,<br />
Honduras, Myanmar, Nicaragua, Pakistan, the Philippines<br />
<strong>and</strong> Viet Nam. The remaining one was Thail<strong>and</strong>, an<br />
upper middle income country (Kreft et al., 2015). Several<br />
of the poorer countries have low baseline educational<br />
attainment <strong>and</strong> wide disparity between the poorest <strong>and</strong><br />
wealthiest students (Figure 1.3). In Guatemala, Haiti,<br />
Honduras <strong>and</strong> Pakistan, only about 10% of poor children<br />
complete lower secondary school, compared to 75%<br />
of rich children.<br />
Education can be used to raise awareness of climate<br />
change, reduce vulnerability to it <strong>and</strong> mitigate its<br />
consequences. Schools can increase knowledge <strong>and</strong><br />
awareness of the environment <strong>and</strong> climate change by<br />
incorporating environmental sustainability into classroom<br />
materials <strong>and</strong> curricula. In Bangladesh, after the National<br />
Curriculum <strong>and</strong> Textbook Board prepared <strong>and</strong> endorsed a<br />
school manual on climate change <strong>and</strong> health protection,<br />
1,515 students in 30 schools received classroom training<br />
based on the manual while 1,778 students in 30 control<br />
schools received a leaflet on climate change <strong>and</strong> health<br />
2016 • GLOBAL EDUCATION MONITORING REPORT 33
1<br />
FIGURE 1.3:<br />
Poor children in the countries most at risk for climate change<br />
disasters are less likely to complete secondary school<br />
Lower secondary completion rate, by wealth<br />
Lower secondary completion rate (%)<br />
100<br />
90<br />
80<br />
70<br />
60<br />
50<br />
40<br />
30<br />
20<br />
10<br />
0<br />
Pakistan, 2012<br />
Guatemala, 2011<br />
Wealthiest children<br />
Honduras, 2011<br />
Haiti, 2012<br />
Average<br />
issues instead. Six months later, results of a postintervention<br />
test performed at both schools showed<br />
that the training led to dramatic increases in children’s<br />
knowledge of the topic (Kabir et al., 2015).<br />
Education can reduce vulnerability to climate change.<br />
A comparative study on Cuba, the Dominican Republic<br />
<strong>and</strong> Haiti focused on the role of formal education in<br />
reducing vulnerability, <strong>and</strong> explored education’s potential<br />
impact on disaster management <strong>and</strong> prevention <strong>and</strong><br />
on post-disaster management. It found that a lack of<br />
education <strong>and</strong> low literacy rates prevented <strong>people</strong> from<br />
underst<strong>and</strong>ing warnings. In Cuba, a country with high<br />
literacy <strong>and</strong> enrolment rates, the level of vulnerability<br />
to climate-related disasters was reduced (Pichler <strong>and</strong><br />
Striessnig, 2013).<br />
Education can also help <strong>people</strong> adapt to climate change<br />
effects. In Ethiopia, six years of education increases<br />
by 20% the chance that a farmer will adapt by using<br />
techniques such as soil conservation, varied planting<br />
dates <strong>and</strong> changes in crop varieties (Deressa et al.,<br />
2009). In Ug<strong>and</strong>a, the likelihood that a family will adopt<br />
drought-resistant crop varieties increases when the<br />
father has basic education (Hisali et al., 2011). And a<br />
Bangladesh, 2011<br />
Philippines, 2013<br />
Viet Nam, 2010<br />
Poorest children<br />
Source: GEM Report team analysis (2016) of household survey data.<br />
survey of farmers in Burkina Faso, Cameroon, Egypt,<br />
Ethiopia, Ghana, Kenya, Niger, Senegal, South Africa<br />
<strong>and</strong> Zambia showed that those with education were<br />
more likely to make at least one adaptation: One year of<br />
education reduced the probability of no adaptation by<br />
1.6% (Maddison, 2007).<br />
To achieve all this requires attention to the quality of the<br />
education. Teacher training has been identified as critical in<br />
making education more responsive to climate change <strong>and</strong><br />
related sustainability challenges. Short <strong>and</strong> circular modules<br />
for teacher training appear to hold significant benefits for<br />
teachers’ underst<strong>and</strong>ing <strong>and</strong> confidence on climate change.<br />
In one study, the percentage of prospective teachers<br />
who felt climate change was a conceptually difficult<br />
subject to teach fell from over 21% to about 7% after less<br />
than four hours of training (Anderson, 2013).<br />
As the previous sections showed, formal education is<br />
only one approach. Education can also take place within<br />
communities. A strong example was shown in disaster<br />
preparedness in the Philippines, where partnerships <strong>and</strong><br />
diverse learning approaches were used effectively. Local<br />
communities worked with the Ministry of Education, Plan<br />
International <strong>and</strong> other partners to teach children <strong>and</strong><br />
youth about climate change adaptation <strong>and</strong> preparation<br />
to reduce disaster vulnerability. Children learned to<br />
read rain gauges; undertook disaster simulation <strong>and</strong><br />
drills; carried out risk mapping; <strong>and</strong> learned skills in first<br />
aid, swimming <strong>and</strong> water safety. Through theatre <strong>and</strong><br />
music, children expressed what they had learned, thus<br />
delivering to their communities information on potential<br />
hazards <strong>and</strong> practical solutions. Evidence shows that<br />
these programmes were effective in building resilience in<br />
the community – potentially saving lives. In 2006, after<br />
three days of continuous rain, children <strong>and</strong> adults applied<br />
knowledge gained from the adaptation-focused risk<br />
reduction strategy to evacuate before l<strong>and</strong>slides covered<br />
their homes (Plan International, 2008). Other work<br />
connecting formal schooling with community education<br />
is found in small isl<strong>and</strong> states (Box 1.4).<br />
Lifelong learning programmes delivered by government,<br />
private industry <strong>and</strong> civil society are also critical. Effective<br />
responses to climate change include governance <strong>and</strong><br />
legislation cooperation between the education sector <strong>and</strong><br />
other sectors. National strategies that include awarenessraising<br />
<strong>and</strong> information dissemination on climate<br />
change will allow stakeholders to undertake adaptive <strong>and</strong><br />
mitigating activities. For example, Namibia has produced<br />
Initial Communication Booklets on climate change<br />
34<br />
CHAPTER 1 | PLANET: ENVIRONMENTAL SUSTAINABILITY
1<br />
BOX 1.4<br />
Small isl<strong>and</strong> states use the entire education system to prepare for climate change<br />
The Pacific Isl<strong>and</strong> region will experience some of the most profound negative effects of climate change considerably sooner than other regions. Funded by<br />
the US National Science Foundation, the Pacific Isl<strong>and</strong>s Climate Education Partnership (PCEP) aims to educate the region’s students <strong>and</strong> citizens in ways<br />
that exemplify modern science <strong>and</strong> indigenous environmental knowledge, address the urgency of climate change <strong>and</strong> honour indigenous culture.<br />
Students <strong>and</strong> citizens in the region will have the knowledge <strong>and</strong> skills to advance their underst<strong>and</strong>ing of climate change <strong>and</strong> adapt to its impact.<br />
The PCEP Strategic Plan incorporates a range of interconnected strategic goals, including promotion of indigenous knowledge <strong>and</strong> practices,<br />
enhancement of learning <strong>and</strong> teaching about climate change from kindergarten to teacher training, a community-school partnership programme to<br />
connect school with community climate adaptation partners, <strong>and</strong> a focus on the content <strong>and</strong> skills necessary for students to underst<strong>and</strong> the science<br />
of global <strong>and</strong> Pacific Isl<strong>and</strong>s climates, as well as adaptation to climate change effects.<br />
Current activities include revising state <strong>and</strong> national science education st<strong>and</strong>ards to better incorporate climate change; adapting curricula to a wide<br />
variety of climate <strong>and</strong> education contexts; gathering local indigenous knowledge <strong>and</strong> practices related to climate education <strong>and</strong> adaptation; providing<br />
professional development; <strong>and</strong> supporting local professional learning communities.<br />
Sources: Sussman et al. (2013); Vize (2012).<br />
translated in local languages to empower citizens <strong>and</strong><br />
allow them to make well-informed decisions (Mfune<br />
et al., 2009). The United Kingdom is putting more effort<br />
into communicating, informing <strong>and</strong> educating the public,<br />
such as by promoting energy conservation measures<br />
(DEFRA, 2006). The government is also promoting<br />
<strong>and</strong> funding renewable-based energy technology in<br />
all schools in Engl<strong>and</strong> to reduce carbon emissions <strong>and</strong><br />
use renewables technology as a learning resource<br />
for teaching science, geography, design, technology,<br />
citizenship <strong>and</strong> mathematics (DEFRA, 2006).<br />
CONCLUSION<br />
Education plays a major role in the transformation<br />
towards more environmentally sustainable societies <strong>and</strong><br />
in addressing the impact of environmental crises such<br />
as climate change. The challenges are pressing. Human<br />
behaviour has led to environmental crises, with various<br />
kinds of problems contributing, including overpopulation,<br />
unsustainable lifestyles that consume more resources<br />
than are available <strong>and</strong> individual behaviour that harms the<br />
environment, such as using fossil fuels or l<strong>and</strong>filling waste.<br />
Accordingly, solutions to environmental crises vary, <strong>and</strong><br />
must address issues at all levels: individual, community,<br />
regional, national <strong>and</strong>, cumulatively, global. Approaches<br />
to learning will vary. Formal education can contribute at<br />
the macro level, for example by reducing fertility rates,<br />
<strong>and</strong> at the individual level by building environmental<br />
literacy. Dynamic approaches are being used in<br />
primary, secondary <strong>and</strong> tertiary institutions to improve<br />
sustainable knowledge, skills <strong>and</strong> attitudes.<br />
Yet, formal education does not reach everyone. Learning,<br />
creating awareness <strong>and</strong> building competencies to take<br />
action can take place in communities <strong>and</strong> through<br />
education that is based in the interaction between<br />
<strong>people</strong> <strong>and</strong> their local environments. Indigenous<br />
knowledge <strong>and</strong> belief systems can inspire better<br />
stewardship of the <strong>planet</strong>. Lifelong learning can<br />
help <strong>people</strong> live more sustainably all their lives. A<br />
multistakeholder, collaborative approach should involve<br />
government, civil society <strong>and</strong> the private sector inside<br />
<strong>and</strong> outside schools to shape values <strong>and</strong> perspectives,<br />
<strong>and</strong> contribute to the development of competencies<br />
to reduce or stop unsustainable practices <strong>and</strong> to adapt<br />
to consequences such as climate change due to the<br />
overstepping of <strong>planet</strong>ary boundaries by humankind.<br />
ENDNOTES<br />
1. This section draws extensively on Magni (2016).<br />
2016 • GLOBAL EDUCATION MONITORING REPORT 35
A man st<strong>and</strong>s in a<br />
crop of cassava that<br />
is being cultivated<br />
using an improved<br />
technique in<br />
Boukoko, Central<br />
African Republic.<br />
CREDIT: Riccardo Gangale/FAO<br />
36<br />
CHAPTER 2 | PROSPERITY: SUSTAINABLE AND INCLUSIVE ECONOMIES
CHAPTER<br />
2<br />
Prosperity:<br />
sustainable<br />
<strong>and</strong> inclusive<br />
economies<br />
We are determined to ensure that all human beings<br />
can enjoy prosperous <strong>and</strong> fulfilling lives <strong>and</strong> that<br />
economic, social <strong>and</strong> technological progress occurs in<br />
harmony with nature.<br />
NO<br />
POVERTY<br />
ZERO<br />
HUNGER<br />
– The 2030 Agenda for Sustainable Development<br />
GOOD HEALTH<br />
AND WELL-BEING<br />
QUALITY<br />
EDUCATION<br />
GENDER<br />
EQUALITY<br />
NO<br />
POVERTY<br />
NO ZERO<br />
POVERTY<br />
HUNGER<br />
ZERO GOOD HEALTH<br />
HUNGER<br />
AND WELL-BEING<br />
GOOD NO QUALITY<br />
HEALTH<br />
AND POVERTY<br />
EDUCATION<br />
WELL-BEING<br />
QUALITY<br />
ZERO AFFORDABLE GENDER AND<br />
EDUCATION<br />
HUNGER<br />
CLEAN EQUALITY ENERGY<br />
DECENT GOOD GENDER<br />
CLEAN HEALTH<br />
WATER WORK AND<br />
ECONOMIC EQUALITY<br />
AND WELL-BEING<br />
SANITATION GROWTH<br />
INDUSTRY, QUALITY<br />
CLEAN WATER INNOVATION<br />
EDUCATION<br />
AND INFRASTRUCTURE<br />
SANITATION<br />
GENDER<br />
REDUCED<br />
EQUALITY<br />
INEQUALITIES<br />
SUSTAINABL<br />
CLEAN WATE<br />
AND COMMU<br />
SANITA<br />
AFFORDABLE AND<br />
CLEAN ENERGY<br />
DECENT AFFORDABLE WORK AND<br />
ECONOMIC CLEAN ENERGY GROWTH<br />
INDUSTRY, DECENT WORK INNOVATION<br />
AND<br />
AND ECONOMIC INFRASTRUCTURE<br />
GROWTH<br />
INDUSTRY, AFFORDABLE REDUCED<br />
INNOVATION<br />
AND<br />
AND CLEAN INEQUALITIES<br />
INFRASTRUCTURE<br />
ENERGY<br />
DECENT SUSTAINABLE CLIMATE<br />
REDUCED WORK CITIES AND<br />
ECONOMIC AND ACTION<br />
INEQUALITIES<br />
COMMUNITIES<br />
GROWTH<br />
INDUSTRY, SUSTAINABLE RESPONSIBLE<br />
LIFE INNOVATION<br />
CITIES<br />
AND CONSUMPTION<br />
BELOW INFRASTRUCTURE<br />
COMMUNITIES<br />
WATER<br />
AND PRODUCTION<br />
RESPONSIBLE<br />
LIFE REDUCED<br />
CONSUMPTION<br />
INEQUALITIES<br />
LAND<br />
AND PRODUCTION<br />
SUSTAINABLE PEACE, JUSTICE CITIES<br />
AND COMMUNITIES<br />
STRONG<br />
INSTITUTIONS<br />
PARTNERSH<br />
RESPONSIB<br />
FOR CONSUMPT<br />
THE GO<br />
AND PRODU<br />
CLIMATE<br />
ACTION<br />
CLIMATE<br />
LIFE<br />
ACTION<br />
BELOW WATER<br />
LIFE<br />
ON BELOW LAND<br />
WATER<br />
CLIMATE<br />
LIFE PEACE, JUSTICE<br />
ACTION<br />
AND LAND STRONG<br />
INSTITUTIONS<br />
PEACE, PARTNERSHIPS<br />
LIFE<br />
JUSTICE<br />
AND FOR BELOW THE STRONG WATER GOALS<br />
INSTITUTIONS<br />
PARTNERSHIPS<br />
LIFE<br />
FOR ON LAND<br />
THE GOALS<br />
PEACE, JUSTICE<br />
AND STRONG<br />
INSTITUTIONS<br />
PARTNERSHIPS<br />
FOR THE GOALS<br />
37
2<br />
KEY MESSAGES<br />
Education has a key role to play in moving towards<br />
environmentally sustainable <strong>and</strong> inclusive economic growth.<br />
1<br />
Education <strong>and</strong> lifelong learning are needed to make production <strong>and</strong> consumption sustainable, to provide<br />
green skills for green industries <strong>and</strong> orient research <strong>and</strong> higher education towards green innovation.<br />
a. Creating green industries relies on high-skill workers with specific training.<br />
b. Greening of industries will require continuing training <strong>and</strong> education for low- <strong>and</strong> medium-skill<br />
workers, often on the job.<br />
c. Research can be oriented towards green innovation <strong>and</strong> growth.<br />
2<br />
Education can help food production <strong>and</strong> farming be more sustainable.<br />
a. Agriculture urgently needs to transform to meet environmental <strong>and</strong> global needs: Agriculture<br />
contributes one-third of all greenhouse gas emissions.<br />
b. Primary <strong>and</strong> secondary education give future farmers foundation skills as well as critical knowledge<br />
about sustainability challenges in agriculture.<br />
c. Literacy <strong>and</strong> non-formal education in the form of extension programmes can increase farmer<br />
productivity.<br />
d. Yet many are halting investment in agricultural research at a time when it is urgently needed: In sub-<br />
Saharan Africa, the share in global expenditure on public agricultural research declined from 10% to 6%<br />
from 1960 to 2009.<br />
3<br />
Education contributes to economic growth.<br />
a. Educational attainment explains about half the difference in growth rates between East Asia <strong>and</strong> sub-<br />
Saharan Africa between 1965 <strong>and</strong> 2010.<br />
b. But education must keep up with the changing face of work <strong>and</strong> produce more high-skill workers. By<br />
2020, there could be 40 million too few workers with tertiary education relative to dem<strong>and</strong>.<br />
4<br />
Education of good quality can help ensure economic growth does not leave anyone behind.<br />
a. If 10 recent EU member states met 2020 targets to decrease early school-leaving <strong>and</strong> increase tertiary<br />
participation, they could reduce the numbers of those at risk of poverty by 3.7 million.<br />
b. Secondary <strong>and</strong> tertiary education is far more effective than just primary for helping <strong>people</strong> access<br />
decent work <strong>and</strong> earnings.<br />
5<br />
Education reduces poverty <strong>and</strong> helps close wage gaps.<br />
a. Education helps <strong>people</strong> find work: In South Africa, less than 45% of those with less than upper secondary<br />
education were employed in 2005 compared to roughly 60% who completed upper secondary.<br />
b. If workers from low socio-economic backgrounds had the same education as more advantaged<br />
counterparts, disparity in working poverty between the two groups would shrink by 39%.<br />
c. Education increases earnings by roughly 10% per year of schooling.<br />
d. Meanwhile, policies are needed to meet the increased global dem<strong>and</strong> for skilled <strong>and</strong> qualified labour.<br />
38<br />
CHAPTER 2 | PROSPERITY: SUSTAINABLE AND INCLUSIVE ECONOMIES
2<br />
Current models of economic growth cause environmental destruction.......40<br />
Sustainable transformation will require clean new industries <strong>and</strong><br />
greener existing ones...............................................................................................................40<br />
Agricultural practices need transformation.................................................................44<br />
Education <strong>and</strong> lifelong learning contribute to long-term economic growth.....47<br />
Economic growth does not mean prosperity for all.................................................. 51<br />
Education can help increase inclusion............................................................................. 53<br />
Education improves labour market <strong>and</strong> decent work outcomes....................... 55<br />
Conclusion..................................................................................................................................... 62<br />
The world economy needs deep transformation in<br />
order to implement the Agenda for Sustainable<br />
Development by 2030, to prevent the collapse of the<br />
Earth’s biosphere on which human civilization depends<br />
for survival, <strong>and</strong> to eradicate poverty – the central goal<br />
of the Millennium Development Goals (MDGs) <strong>and</strong> now of<br />
the Sustainable Development Goals (SDGs). This chapter<br />
reflects on the roles of education in this transformation<br />
towards environmentally sustainable <strong>and</strong> economically<br />
inclusive development.<br />
The statement above from the Agenda for Sustainable<br />
Development makes a commitment to human beings<br />
enjoying prosperous <strong>and</strong> fulfilling lives. But as this<br />
chapter will explain, economic growth <strong>and</strong> both national<br />
<strong>and</strong> individual prosperity must occur ‘in harmony with<br />
nature’. This requires fundamental changes in the world<br />
economy to create clean new industries <strong>and</strong> ensure that<br />
existing ones become greener.<br />
Education <strong>and</strong> lifelong learning are needed to make<br />
production <strong>and</strong> consumption sustainable, supply skills<br />
for the creation of green activities <strong>and</strong> orient higher<br />
education <strong>and</strong> research towards green innovation. They<br />
also have a role to play in transforming key economic<br />
sectors, such as agriculture, upon which both rich <strong>and</strong><br />
poor countries <strong>and</strong> households rely.<br />
Education of good quality has been proved to contribute<br />
to long-term economic growth. Curricular contents,<br />
<strong>and</strong> the ways they are embedded in the everyday life<br />
of schools, need to be transformed to sustain a greener<br />
world economy. Investment in education <strong>and</strong> lifelong<br />
learning are also required for countries to adapt to<br />
the rapidly changing world of work, with polarization<br />
between high- <strong>and</strong> low-skill jobs, <strong>and</strong> further shifts to<br />
green industry <strong>and</strong> the service sector.<br />
Just as the economy must become sustainable, so too<br />
must it become inclusive. With widespread poverty<br />
<strong>and</strong> inequality, economic growth has not benefited all<br />
<strong>people</strong>. Prosperity must<br />
be conceived in ways<br />
that leave no one behind.<br />
Education of good quality<br />
A better-educated<br />
can contribute to this labour force is<br />
change as well. A bettereducated<br />
labour force<br />
is essential to inclusive<br />
economic growth<br />
economic growth focused<br />
essential to inclusive<br />
2016 • GLOBAL EDUCATION MONITORING REPORT 39
2<br />
on human welfare. Education helps reduce poverty by<br />
increasing chances of finding decent work <strong>and</strong> improved<br />
earnings, reducing job insecurity.<br />
CURRENT MODELS OF<br />
ECONOMIC GROWTH CAUSE<br />
ENVIRONMENTAL DESTRUCTION<br />
The type of economic growth experienced thus far<br />
could prove unsustainable over 2015–2030 <strong>and</strong> beyond.<br />
Models of economic growth in the 20 th century<br />
emphasized aspects such as intensive production,<br />
industrial advances <strong>and</strong> exploitation of natural resources.<br />
These models legitimized practices <strong>and</strong> policies that<br />
thwart achievement of the environmental SDGs,<br />
causing damage to the Earth’s biosphere <strong>and</strong> hence<br />
threatening civilization in the longer term.<br />
As Chapter 1: Planet notes, all countries that are<br />
ranked very high on the Human Development Index<br />
(above 0.8) <strong>and</strong> have a high per capita income<br />
consume more resources per capita than the Earth<br />
can renew (Global Footprint Network, 2016). This<br />
creates a contradiction. Economic growth is the most<br />
powerful instrument for reducing poverty in developing<br />
countries (DFID, 2008), but if that growth depletes<br />
resources at an unsupportable rate, will it start to<br />
increase poverty? For example, poor <strong>people</strong> suffer the<br />
most from environmental degradation as they often live<br />
in the most vulnerable areas <strong>and</strong> their livelihoods tend to<br />
be linked more directly to access to natural resources.<br />
Climate change is an example of the effects of economic<br />
growth, <strong>and</strong> the reason a transformation of economic<br />
models is necessary. The increased frequency <strong>and</strong><br />
intensity of extreme climate events, reduced productivity<br />
of agriculture <strong>and</strong> natural ecosystems due to changing<br />
temperature <strong>and</strong> rainfall patterns, <strong>and</strong> resulting health<br />
shocks <strong>and</strong> reduced labour productivity may slow, stall<br />
or even reverse the trend towards eradication of extreme<br />
income poverty observed over 2000–2015.<br />
Overall, climate change could cast as many<br />
as 122 million <strong>people</strong> into poverty by 2030, depending<br />
on how ecosystems, the economy <strong>and</strong> geographical<br />
features such as coastal areas <strong>and</strong> glaciers adapt. Climate<br />
change could reduce crop yields by 5% by 2030 <strong>and</strong> 30%<br />
by 2080 – even if agriculture adapts by changing crops<br />
<strong>and</strong> culture practices, extending irrigation <strong>and</strong> developing<br />
higher yield crops (Hallegatte et al., 2016).<br />
SUSTAINABLE TRANSFORMATION<br />
WILL REQUIRE CLEAN NEW<br />
INDUSTRIES AND GREENER<br />
EXISTING ONES<br />
The concepts of sustainable development <strong>and</strong> green<br />
growth are similar, having in common the ideas of<br />
using less resources more efficiently <strong>and</strong> limiting the<br />
harmful impact of economic activity on the environment<br />
by creating green industries <strong>and</strong> ‘greening’ existing<br />
ones (UNIDO, 2011b). They also mean dismantling<br />
the activities that contribute most to environmental<br />
degradation, such as coal-intensive industries, <strong>and</strong><br />
converting them <strong>and</strong> their employees to greener work.<br />
Green industry is defined by the United Nations Industrial<br />
Development Organisations as ‘industrial production<br />
<strong>and</strong> development that does not come at the expense<br />
of the health of natural systems or lead to adverse<br />
human health outcomes’ (UNIDO, 2011b). However, green<br />
industries are difficult to classify statistically, <strong>and</strong> there<br />
is no universally accepted definition.<br />
Estimates suggest that sectors that fall under the<br />
green industry umbrella already employ large numbers<br />
of workers – 3.5 million in Bangladesh, 1.4 million in<br />
Brazil, 2 million in Germany <strong>and</strong>, in the United States,<br />
2.5 million in the private sector <strong>and</strong> almost 900,000 in<br />
the public sector. The net impact of green growth on<br />
employment is usually forecast as positive, though some<br />
industries st<strong>and</strong> to lose jobs. Sectors such as alternative<br />
fuels, building technologies, wind power, alternative<br />
fuel vehicles, geothermal energy, water supply <strong>and</strong><br />
wastewater treatment are expected to drive sustained<br />
expansion in green industries globally in coming decades<br />
(Hinojosa <strong>and</strong> Pickles, 2015). Renewable sources may<br />
account for almost half the total increase in global<br />
electricity generation between 2015 <strong>and</strong> 2040, with<br />
especially large increases predicted in China, India, Latin<br />
America <strong>and</strong> Africa (Hinojosa <strong>and</strong> Pickles, 2015).<br />
The current concentration of green industries in<br />
high income countries, especially in Western Europe,<br />
is expected to wane. In 2009, the European Union<br />
accounted for 50% of recycling worldwide <strong>and</strong> 40% of<br />
the use of renewable energy sources (Hinojosa <strong>and</strong><br />
Pickles, 2015). However, between 2005 <strong>and</strong> 2015, the<br />
share of developing countries in global renewable<br />
energy investment rose from 27% to 55%, reaching<br />
US$156 billion in 2015 to overtake developed economies<br />
(REN21, 2016). Key green businesses, such as producers of<br />
40<br />
CHAPTER 2 | PROSPERITY: SUSTAINABLE AND INCLUSIVE ECONOMIES
2<br />
solar photovoltaic panels, have been moving from high to<br />
middle income countries. Green industries in developing<br />
countries may receive more than US$6.4 trillion in<br />
investment between 2015 <strong>and</strong> 2025, with China <strong>and</strong> Latin<br />
America each receiving nearly one-quarter of the total<br />
(InfoDev, 2014).<br />
Existing industries need to be restructured for<br />
efficiency gains. This greening of industries, by the<br />
UNIDO definition, includes reducing the environmental<br />
impact of processes <strong>and</strong> products by using resources<br />
more efficiently, phasing out toxic substances,<br />
replacing fossil fuels with renewables, improving<br />
occupational health <strong>and</strong> safety, increasing producer<br />
responsibility <strong>and</strong> reducing overall risk (UNIDO, 2011).<br />
There could be significant benefits in terms of<br />
savings: by 2030, an estimated US$3.7 trillion could<br />
be saved annually worldwide from implementation<br />
of 130 resource productivity measures <strong>and</strong> adapted<br />
legislation (MGI Global, 2011).<br />
GREEN SKILLS POLICIES CAN FOSTER<br />
JOB CREATION<br />
Green growth will greatly affect employment. Jobs<br />
will be created in green industries; jobs will be shifted<br />
as industries are greened (e.g. with production-based<br />
renewables instead of fossil fuels); some will be<br />
destroyed; <strong>and</strong> many will be redefined as skills, work<br />
methods <strong>and</strong> job profiles are greened. The hardship<br />
caused by job destruction <strong>and</strong> redefinition should not be<br />
underestimated, as the industries affected – including<br />
fishing, forestry, extractive industries, fossil fuel<br />
generation <strong>and</strong> emission-intensive manufacturing (such<br />
as the cement <strong>and</strong> automotive industries) – employ large<br />
numbers (Hinojosa <strong>and</strong> Pickles, 2015).<br />
However, forecasts indicate the net result should be<br />
positive. A review of cross country <strong>and</strong> national studies 1<br />
by the International Labour Organization (ILO) indicates<br />
that the adoption of environmental reforms leads to<br />
net job gains of 0.5% to 2% of the workforce, translating<br />
to 15 million to 60 million additional jobs globally (ILO,<br />
2012). In South Africa, the potential for new green jobs<br />
was estimated in 2011 at 98,000 in the short term,<br />
255,000 in the medium term <strong>and</strong> 462,000 in the long<br />
term, especially in natural resource management such<br />
as biodiversity conservation, ecosystem restoration, <strong>and</strong><br />
soil <strong>and</strong> l<strong>and</strong> management (Maia et al., 2011).<br />
One reason for the positive impact on employment is<br />
that green industries tend to be more labour-intensive.<br />
For instance, sustainable farming requires more labour<br />
than conventional farming, with more diverse crop<br />
rotation, integration of crops <strong>and</strong> livestock to recycle<br />
organic waste as soil nutrients, <strong>and</strong> reliance on biological<br />
processes for pest <strong>and</strong> weed management. Similarly,<br />
to improve energy efficiency the construction sector<br />
has employed large numbers of workers (Hinojosa <strong>and</strong><br />
Pickles, 2015; Maia et al., 2011).<br />
The changes in employment <strong>and</strong> job definitions<br />
accompanying green growth will create huge dem<strong>and</strong><br />
for skills development. The creation of green industries<br />
will rely on high skill workers with technical training; the<br />
greening of existing industries will require continuing<br />
education <strong>and</strong> training for low <strong>and</strong> medium skill workers,<br />
often on the job (ILO, 2013a; UNIDO, 2011b). The balance<br />
of skills required will<br />
vary across countries<br />
The creation of green <strong>and</strong> industries – but<br />
in every context, skills<br />
industries will rely on<br />
policies can facilitate<br />
high skill workers with this transition.<br />
technical training<br />
It is difficult to define<br />
which skills would be<br />
specifically ‘green’ or ‘non-green’, as both green <strong>and</strong><br />
greening industries use a mix of both. There is therefore<br />
very little evidence quantifying what the ‘green skill<br />
gap’ might be at the global level, although it is possible<br />
to identify skills which green <strong>and</strong> greening industries<br />
dem<strong>and</strong> (Box 2.1).<br />
The implications of green growth for education <strong>and</strong><br />
training policies are complex <strong>and</strong> often industry-specific.<br />
Policy-makers <strong>and</strong> educators face the challenge of<br />
defining which skills to teach, even as the economy<br />
is undergoing rapid change. They must also balance<br />
current <strong>and</strong> long-term priorities, deciding, for example,<br />
how much focus to give to redefining initial education<br />
<strong>and</strong> training as opposed to up-skilling <strong>and</strong> retraining<br />
the current labour force. They need to develop flexible<br />
education <strong>and</strong> training frameworks in line with the<br />
capabilities <strong>and</strong> aspirations of students <strong>and</strong> trainees.<br />
Specific policy recommendations in this area are found<br />
in Chapter 8.<br />
2016 • GLOBAL EDUCATION MONITORING REPORT 41
2<br />
BOX 2.1<br />
Green industries dem<strong>and</strong> particular skills<br />
Green industries dem<strong>and</strong> particular skills, including basic, technical,<br />
<strong>and</strong> transferable <strong>and</strong> managerial skills.<br />
• Basic skills, including literacy <strong>and</strong> numeracy, are indispensable.<br />
Green growth reinforces the need for good quality basic<br />
<strong>and</strong> remedial education, both in countries which have not<br />
yet reached universal enrolment at the primary <strong>and</strong> lower<br />
secondary levels, <strong>and</strong> in countries with low levels of basic skills<br />
in the adult population.<br />
• Technical skills can be specific to green industries (e.g. diagnostic<br />
skills to measure a carbon footprint) or added to existing skills<br />
(e.g. up-to-date training in energy efficiency for construction<br />
workers with st<strong>and</strong>ard skills).<br />
• Transferable <strong>and</strong> managerial skills include leadership, risk<br />
management, design, communication <strong>and</strong> commercial skills<br />
that are necessary to enable firms to make the transition<br />
towards green production. For example, those with<br />
entrepreneurial skills can seize the opportunities presented<br />
by low-carbon technology, <strong>and</strong> consulting skills can be used<br />
to advise consumers about green solutions <strong>and</strong> spread the<br />
use of green technology.<br />
Source: GEM Report team analysis based on Hinojosa <strong>and</strong> Pickles (2015).<br />
INNOVATION DEPENDS ON COOPERATION<br />
IN HIGHER EDUCATION AND R&D BACKED<br />
WITH PUBLIC FUNDING<br />
The transition towards sustainable economies can be<br />
seen as being on a par with the paradigm shifts brought<br />
about by the industrial revolution <strong>and</strong> the advent of<br />
information <strong>and</strong> communication technology (ICT)<br />
(Stern, 2015). Sustainability <strong>and</strong> green growth require<br />
investment in research <strong>and</strong> development (R&D) to<br />
transform production in vast swaths of the economy.<br />
They involve refining existing technology to save energy,<br />
using renewables <strong>and</strong>, above all, introducing technology<br />
that is only just being developed (Aghion et al., 2009a).<br />
In Cuba, the Centre for Research <strong>and</strong> Development<br />
of Structures <strong>and</strong> Construction Materials (CIDEM)<br />
developed alternative ways to solve a building <strong>and</strong><br />
energy crisis. Researchers developed low-energy,<br />
low-carbon building materials <strong>and</strong> worked with<br />
communities, municipalities <strong>and</strong> manufacturers<br />
to get them into use building houses. In addition<br />
to environmental benefits, the project generated<br />
significant socio-economic benefits. In 2010 <strong>and</strong> 2011,<br />
5,300 houses were built using such materials made<br />
by 138 manufacturers, providing livelihoods to many<br />
<strong>people</strong>. Three training centres have been established at<br />
universities <strong>and</strong> this model of developing sustainable<br />
building materials has been adopted by other countries<br />
in Latin America as well as Africa, Asia <strong>and</strong> the Middle<br />
East (Sarabhai <strong>and</strong> Vyas, 2015).<br />
While examples of green innovation practices can<br />
be found around the world, more is needed to turn<br />
practices into a system – that is, an ensemble of actors<br />
<strong>and</strong> conditions that enable the creation <strong>and</strong> flow of<br />
knowledge <strong>and</strong> technology into the economy. For this,<br />
other conditions must be present, such as collaboration<br />
between researchers, funders, manufacturers,<br />
government <strong>and</strong> consumers, in a context of change<br />
in broader macroeconomic, investment <strong>and</strong> policy<br />
environments (Botta et al., 2015).<br />
The role of education in innovation primarily concerns<br />
R&D in new technologies, as well as their dissemination.<br />
For higher education systems to provide enough<br />
researchers <strong>and</strong> developers with specialist knowledge<br />
<strong>and</strong> skills in a wide range of fields, diverse <strong>and</strong> specific<br />
curricula are needed along with cooperative study<br />
programmes across fields. Major emerging economies<br />
such as Brazil <strong>and</strong> China are exp<strong>and</strong>ing their tertiary<br />
education systems with that approach in mind. The<br />
European Commission estimates that at least 1 million<br />
new research jobs will be needed to meet a target of<br />
increasing EU R&D expenditure to 3% of gross domestic<br />
product (GDP) (European Commission, 2011).<br />
Once developed, innovative knowledge <strong>and</strong> technology<br />
need to be introduced into the economy. Scaling up<br />
technology, building capacity <strong>and</strong> developing markets<br />
may require adaptation to local contexts, particularly in<br />
poorer countries, where technological transfer presents a<br />
hosts of challenges. A rigorous review of research reveals<br />
little evidence of the impact of technological transfer<br />
in developing countries, although two cases st<strong>and</strong> out<br />
(Oketch et al., 2014). Large state-run corporations in<br />
Viet Nam are more likely than small <strong>and</strong> medium-sized<br />
enterprises to demonstrate high levels of technological<br />
transfer, probably because of their contact with foreign<br />
firms. However, one of the studies reviewed indicated<br />
that university-generated research had improved<br />
productivity in local agriculture <strong>and</strong> aquaculture<br />
42<br />
CHAPTER 2 | PROSPERITY: SUSTAINABLE AND INCLUSIVE ECONOMIES
2<br />
(Ca, 2006). The small amount of empirical evidence<br />
available related to tech transfer <strong>and</strong> scaling up<br />
highlights the need to better underst<strong>and</strong> the<br />
relationships between innovation, technology <strong>and</strong><br />
economic development in poor countries.<br />
Green innovation systems depend on public funding of<br />
R&D, as the private sector may be unable or unwilling<br />
to invest sufficiently in green technology in the early<br />
stages of development, when costs are high, returns are<br />
uncertain <strong>and</strong> the benefits are social rather than private<br />
(Aghion, 2009a; OECD, 2011). Unfortunately, total public<br />
<strong>and</strong> private R&D expenditure as a share of GDP has<br />
not grown discernibly in the OECD or major emerging<br />
countries since 2007. In 2013, it represented slightly less<br />
than 2.5% of GDP in OECD countries, ranging from less<br />
than 0.5% in Chile to almost 4.5% in the Republic of Korea<br />
(OECD, 2014c).<br />
economy where consumers no longer own products but<br />
lease the services they provide.<br />
Developing, underst<strong>and</strong>ing <strong>and</strong> working with such<br />
approaches requires learning by both consumers <strong>and</strong><br />
producers, which education policies can best address<br />
in a lifelong learning perspective. The United Nations<br />
Environment Programme has identified learning-related<br />
priorities for sustainable consumption <strong>and</strong> production.<br />
These include new forms of (a) education for industry<br />
employees, including sustainability-oriented technical<br />
<strong>and</strong> vocational education <strong>and</strong> training (TVET) <strong>and</strong><br />
ongoing training within companies; (b) learning at all<br />
levels of supply chains, with attention to empowerment<br />
of suppliers <strong>and</strong> customers, rather than compliance<br />
inspections; (c) interdisciplinary scholarship focusing on<br />
altering consumer habits; <strong>and</strong> (d) social learning at the<br />
community level (UNEP, 2015).<br />
Moreover, public R&D spending in energy <strong>and</strong> the<br />
environment is only a small fraction of total public<br />
R&D budgets, averaging less than 12% in OECD<br />
economies, <strong>and</strong> less than 6% in the EU. Moreover,<br />
public R&D budgets for energy <strong>and</strong> the environment<br />
have stalled across the OECD in recent years. OECD<br />
military public R&D was more than double that of<br />
energy <strong>and</strong> environment in 2012, <strong>and</strong> approximately<br />
30 times as large in the United States (OECD, 2014c).<br />
The International Energy Agency estimates that<br />
governments would need to increase annual energy R&D<br />
up to fivefold to significantly reduce carbon emissions<br />
by 2050 (IEA, 2010). Corresponding data on private<br />
R&D expenditure are not available, but the fact that<br />
over 2000–2006 only 2.15% of total patents applied for<br />
worldwide were environment-related indicates that it is<br />
low (Aghion et al., 2009b).<br />
LIFELONG LEARNING ENABLES CONSUMERS<br />
AND PRODUCERS TO CONTRIBUTE TO<br />
SUSTAINABILITY<br />
While green skills <strong>and</strong> green innovation can reduce<br />
environmental destruction caused by economic activity,<br />
the leap towards fully sustainable consumption <strong>and</strong><br />
production requires a deeper transformation of the<br />
economy. The whole life cycle of products needs to be<br />
designed to minimize resource use, waste <strong>and</strong> pollution.<br />
Examples include certification of the entire production<br />
<strong>and</strong> consumption chain, <strong>and</strong> ‘cradle-to-cradle’ design<br />
where all products <strong>and</strong> waste can be used in making<br />
other products. Another approach is the service-based<br />
Relevant international agreements <strong>and</strong> programmes<br />
include the United Nations Decade for Education for<br />
Sustainable Development, with topics such as Education<br />
for Sustainable Consumption, TVET for Sustainable<br />
Development <strong>and</strong> Higher Education for Sustainable<br />
Development. The multistakeholder Marrakesh Process<br />
(2003–2011) led to the adoption of a framework at the<br />
United Nations Conference on Sustainable Development<br />
in 2012 (Rio+20). National sustainable consumption <strong>and</strong><br />
production initiatives have been launched in countries<br />
including Finl<strong>and</strong>, Germany <strong>and</strong> the United Kingdom<br />
(Geels et al., 2015).<br />
Business owners, managers <strong>and</strong> financiers can be<br />
leaders in sustainability. Large <strong>and</strong> small corporations<br />
can develop strategies <strong>and</strong> analyse their business<br />
culture <strong>and</strong> work systems to make them more<br />
sustainable (see Chapter 1: Planet). Studies have shown<br />
that business courses increasingly teach the ‘business<br />
case’ for sustainability, <strong>and</strong> that professional networks<br />
of business leaders increasingly accept the importance,<br />
relevance <strong>and</strong> willingness of action (Sidiropoulos, 2014),<br />
although many of the findings are limited in geographical<br />
coverage <strong>and</strong> trends appear patchy across industries<br />
<strong>and</strong> locations.<br />
Shareholder activism has resulted in movements to<br />
divest from fossil fuels <strong>and</strong> to invest so as to generate<br />
a positive social impact along with financial returns.<br />
Progress in corporate sustainability has seen the<br />
expansion of sustainable finance, with mainstream banks<br />
increasingly integrating environmental <strong>and</strong> social impact<br />
2016 • GLOBAL EDUCATION MONITORING REPORT 43
2<br />
considerations <strong>and</strong> risk management strategies into loan<br />
<strong>and</strong> investment assessment (UNEP, 2012; OECD, 2016b).<br />
AGRICULTURAL PRACTICES<br />
NEED TRANSFORMATION<br />
Focusing on agriculture shows not only the scale of<br />
problems to be tackled but also how an economic sector<br />
can change <strong>and</strong> how education can address the changes.<br />
Globally, some 70% of <strong>people</strong> in extreme poverty live in<br />
rural areas (IFAD, 2011b) where agriculture is the main<br />
source of income <strong>and</strong> employment, <strong>and</strong> access to l<strong>and</strong><br />
serves as a tangible source of security despite natural<br />
disasters <strong>and</strong> weak economic opportunity. Solutions<br />
for global poverty must address the needs of agrarian<br />
societies <strong>and</strong> ensure the sustainability <strong>and</strong> productivity<br />
of agriculture. Agriculture provides the world’s food<br />
supply, <strong>and</strong> major factors affecting it also affect the<br />
world’s economy <strong>and</strong> ecosphere.<br />
Agricultural production is the main emitter of carbon<br />
dioxide in the global food system (Vermeulen et al., 2012).<br />
Increases in carbon dioxide contribute to climate change,<br />
which in turn has a negative effect on crops. Yields of<br />
wheat, rice <strong>and</strong> corn are expected to fall in coming years,<br />
even as growing populations will need more to eat. By<br />
emitting high levels of greenhouse gases, conventional<br />
agricultural practices present a barrier to the main<br />
challenge they seek to address, potentially leading to<br />
food shortages instead of food security.<br />
Education, both formal <strong>and</strong> non-formal, has a clear role<br />
in this context: It is necessary for sustainable food<br />
production <strong>and</strong> vital for the systemic changes required.<br />
Agricultural extension services, training <strong>and</strong> education,<br />
<strong>and</strong> research contribute to sustainable agricultural<br />
production through appropriate <strong>and</strong> affordable<br />
technology (such as efficient irrigation, water harvesting<br />
<strong>and</strong> water storage), increased efficiency of l<strong>and</strong><br />
management <strong>and</strong> reductions to food waste throughout<br />
the food supply<br />
chain. Research<br />
Agricultural extension also helps preserve<br />
sustainable practices<br />
services, training <strong>and</strong><br />
such as traditional<br />
education, <strong>and</strong> research seed supply systems<br />
contribute to sustainable <strong>and</strong> best practices<br />
of indigenous<br />
agricultural production<br />
<strong>people</strong>s <strong>and</strong> local<br />
communities.<br />
Agriculture worldwide faces an unprecedented<br />
challenge over 2015–2030. Of all economic sectors,<br />
it is the most directly affected by environmental<br />
degradation. Cultivated <strong>and</strong> arable l<strong>and</strong> is being lost<br />
to desertification, soil erosion <strong>and</strong> salinization, <strong>and</strong><br />
urbanization. Climate change is altering temperature<br />
<strong>and</strong> rainfall patterns. Extreme weather is causing ever<br />
more frequent <strong>and</strong> intense damage to crops <strong>and</strong> cattle<br />
(Godfray et al., 2010). Groundwater depletion, from<br />
China <strong>and</strong> India to Saudi Arabia <strong>and</strong> the United States,<br />
is affecting harvests <strong>and</strong> could contribute to significant<br />
food scarcity (Wada et al., 2010). These phenomena will<br />
intensify, threatening agricultural productivity.<br />
At the same time, population growth requires a huge<br />
but sustainable increase in food production to ‘end<br />
hunger [<strong>and</strong>] achieve food security <strong>and</strong> improved<br />
nutrition’ (SDG 2). The global population, as Chapter 1:<br />
Planet noted, is expected to reach 8.5 billion in 2030,<br />
with nearly four-fifths of the increase taking place in<br />
low <strong>and</strong> lower middle income countries, especially in<br />
sub-Saharan Africa <strong>and</strong> Southern Asia, where the food<br />
supply is the most fragile. According to various sources,<br />
the productivity of existing crop <strong>and</strong> pasture l<strong>and</strong> would<br />
need to increase by 70% to 100% to feed over 9 billion<br />
<strong>people</strong> by 2050 (Godfray et al., 2010).<br />
Conventional agriculture – the manufacture <strong>and</strong><br />
distribution of seed, feed, fertilizer <strong>and</strong> pesticides;<br />
the growth <strong>and</strong> harvesting of crops, livestock, fish <strong>and</strong><br />
wild foods; <strong>and</strong> along with primary <strong>and</strong> secondary<br />
processing, distribution <strong>and</strong> waste disposal – cannot<br />
respond to these challenges, as it causes environmental<br />
destruction <strong>and</strong> its future productivity is uncertain.<br />
The problem is threefold:<br />
■■<br />
Along with energy <strong>and</strong> transport, agriculture is one<br />
of the sectors that contribute most to environmental<br />
degradation. It occupies 40% of the Earth’s terrestrial<br />
surface, accounts for 33% of greenhouse gas emissions<br />
<strong>and</strong> causes loss of genetic biodiversity <strong>and</strong> functional<br />
ecosystems. The ‘green revolution’ that took place<br />
mainly in Asia in the 1960s <strong>and</strong> 1970s was ‘green’ only<br />
in the sense that it concerned agriculture, not in the<br />
sense of environmental preservation. Future increases<br />
in food production must not entail unsustainable use<br />
of l<strong>and</strong>, water, energy, fertilizer <strong>and</strong> chemicals (Alston<br />
<strong>and</strong> Pardey, 2014; Dobermann <strong>and</strong> Nelson, 2013;<br />
Pretty et al., 2010).<br />
44<br />
CHAPTER 2 | PROSPERITY: SUSTAINABLE AND INCLUSIVE ECONOMIES
2<br />
■■<br />
Conventional agriculture may be reaching a<br />
productivity limit. According to the Food <strong>and</strong><br />
Agriculture Organization (FAO), the index of per capita<br />
net production for agriculture as a whole increased<br />
less rapidly over 2008–2013 than over 2003–2008<br />
in the Americas (4.1% vs 10.3%), Asia (7.9% vs 15.3%)<br />
<strong>and</strong> Europe (3.4% vs 5.5%) (FAO, 2016). Increases<br />
in agricultural productivity were concentrated in<br />
developed countries <strong>and</strong> Asia. In sub-Saharan Africa<br />
<strong>and</strong> in low income countries in other regions, most<br />
growth in production since 2000 was due to use<br />
of new l<strong>and</strong> rather than higher factor productivity<br />
(Dobermann <strong>and</strong> Nelson, 2013). Food prices, which had<br />
mostly declined steadily since the 1960s, started to<br />
increase in the 2000s, <strong>and</strong> have become more volatile<br />
due to speculation on financial markets. Major price<br />
increases in 2007 <strong>and</strong> 2008 especially hit the poor<br />
(IFAD, 2011a).<br />
■■<br />
Food distribution <strong>and</strong> consumption patterns are<br />
compounding the negative impact of food production<br />
on the environment. In developing countries, rising<br />
per capita income has led to tastes shifting away<br />
from cereals, pulses <strong>and</strong> vegetables <strong>and</strong> towards meat<br />
<strong>and</strong> dairy products, whose production is much more<br />
intensive in use of water, fodder <strong>and</strong> chemicals (Pretty<br />
<strong>and</strong> Bharucha, 2014). The major concern, however,<br />
is food waste, which represents 30% to 40% of food<br />
produced globally. In developing countries, most food<br />
waste arises on farms <strong>and</strong> in transport <strong>and</strong> processing<br />
due to deficient food-chain infrastructure. In India,<br />
for example, 35% to 40% of fresh produce is lost.<br />
This waste could be reduced through improved small<br />
storage facilities (Godfray et al., 2010). In developed<br />
countries, food waste takes place mostly in retail, food<br />
services <strong>and</strong> homes due to consumer preferences for<br />
‘foods of the highest cosmetic st<strong>and</strong>ard’ <strong>and</strong> inflexible<br />
adherence to ‘use by’ dates (Godfray et al., 2010).<br />
EDUCATION CAN SUPPORT SUSTAINABLE<br />
FOOD PRODUCTION<br />
Enough food can be produced for the growing<br />
world population over 2015–2030 <strong>and</strong> beyond in an<br />
environmentally sustainable <strong>and</strong> socially inclusive way,<br />
but this will require significant changes in agricultural<br />
production (Godfrey et al., 2010; Pretty <strong>and</strong> Bharucha,<br />
2014). With current food production reaching its<br />
limits, alternatives to conventional farming must be<br />
found. They will involve sustainable intensification of<br />
food production through a combination of innovative<br />
farming methods – including agroforestry, conservation<br />
agriculture, integrated farming, mixed crop <strong>and</strong><br />
livestock systems <strong>and</strong> organic farming – accompanied<br />
by reduction of food waste <strong>and</strong> more equitable food<br />
distribution.<br />
Growth in dem<strong>and</strong> for agricultural products will mainly<br />
occur in emerging economies, particularly the most<br />
populous countries of Eastern <strong>and</strong> South-eastern Asia,<br />
Southern Asia <strong>and</strong> sub-Saharan Africa. The ways in which<br />
these countries, including Bangladesh, China, Ethiopia,<br />
India, Indonesia, Nigeria <strong>and</strong> South Africa, respond to<br />
this growth will be major determinants of environmental<br />
change at a global scale (Sayer <strong>and</strong> Cassman, 2013).<br />
Not only is sustainable farming possible, but education<br />
plays a key role in the transition. Primary <strong>and</strong> secondary<br />
education can provide future farmers foundation skills<br />
as well as critical<br />
knowledge about<br />
sustainability<br />
Vocational training <strong>and</strong><br />
challenges in<br />
skills policies bridge the agriculture. Vocational<br />
gap between farmers<br />
training <strong>and</strong> skills<br />
policies can bridge the<br />
<strong>and</strong> new technology<br />
gap between farmers<br />
<strong>and</strong> new technology.<br />
Literacy <strong>and</strong> nonformal<br />
education in the form of agricultural extension<br />
can help farmers increase crop yields. Agricultural<br />
research connected with tertiary education helps<br />
produce innovation leading to more sustainable systems.<br />
The number of <strong>people</strong> relying on farming is<br />
considerable. In the early 2010s, half the world’s<br />
population lived in rural areas <strong>and</strong> three-quarters of rural<br />
<strong>people</strong> belonged to agriculture-based households: 2.6<br />
billion depended on agriculture for their livelihoods <strong>and</strong><br />
1.3 billion directly engaged in farming. However, value<br />
added in agriculture accounts for just 2.8% of global GDP<br />
(Alston <strong>and</strong> Pardey, 2014). A majority of farmers depend<br />
on farms of less than 2 hectares, of which there are more<br />
than 500 million (Dobermann <strong>and</strong> Nelson, 2013).<br />
Rural development policies which improve agricultural<br />
productivity can have strong effects on poverty<br />
reduction. In China, for example, agricultural growth<br />
is estimated to have been three times more effective<br />
in reducing poverty between 1980 <strong>and</strong> 2011 compared<br />
to growth in other sectors of the economy. Similar<br />
magnitudes are found in studies examining other<br />
2016 • GLOBAL EDUCATION MONITORING REPORT 45
2<br />
developing regions (de Janvry <strong>and</strong> Sadoulet, 2010).<br />
Among several sub-Saharan African countries, estimates<br />
suggest that GDP growth driven by agriculture would<br />
be similarly effective in reducing poverty - three to four<br />
times more than non-agricultural sectors in Rw<strong>and</strong>a <strong>and</strong><br />
Kenya, for example (IFPRI, 2012).<br />
AGRICULTURAL EXTENSION AND RESEARCH<br />
ARE VITAL FOR TRANSFORMING PRODUCTION<br />
Agricultural extension programmes aim to educate<br />
farmers to apply improved technologies <strong>and</strong> farming<br />
practices, helping improve crop yields, increase food<br />
security <strong>and</strong> reduce poverty. They can take the form of<br />
non-formal education <strong>and</strong> advisory services provided<br />
by government,<br />
multinational<br />
agencies <strong>and</strong> other<br />
Literacy <strong>and</strong> non-formal<br />
institutions, such as<br />
education in the form of<br />
research institutes<br />
agricultural extension <strong>and</strong> universities.<br />
International<br />
can help farmers<br />
agricultural<br />
increase crop yields<br />
research centres,<br />
in collaboration<br />
with national public<br />
organisations, were instrumental in the widescale<br />
introduction of new crop varieties which fuelled the<br />
agricultural ‘green revolution’ of the 20th century<br />
(Evenson <strong>and</strong> Gollin, 2003). Bringing new sustainable<br />
technologies to farmers over 2015-2030 calls for similar<br />
international <strong>and</strong> national efforts.<br />
Agricultural extension programmes can significantly<br />
increase farmer productivity. If not designed carefully,<br />
however, they can exacerbate inequality. Research<br />
in Mozambique <strong>and</strong> Ethiopia shows that extension<br />
services tend to target wealthier farms that are more<br />
likely to adopt existing technology, while extension<br />
services that target poor farmers can have a larger<br />
impact on productivity (Cunguara <strong>and</strong> Moder, 2011;<br />
Elias et al., 2013).<br />
Like other development policies, extension programmes<br />
need to be strategically designed in order to be<br />
sustainable. This requires improved links between<br />
agricultural research, extension organisations, business<br />
development services, farmers <strong>and</strong> local communities.<br />
Programmes which are aware <strong>and</strong> responsive to the needs<br />
of resource-poor households are more likely to result in<br />
faster diffusion of innovations (World Bank, 2012).<br />
At the farm level, knowledge <strong>and</strong> skill requirements are<br />
significant. Farming is complex <strong>and</strong> risky. It depends<br />
on the extent <strong>and</strong> quality of the l<strong>and</strong>, as well as<br />
weather, markets, inputs, support services, capital <strong>and</strong><br />
infrastructure (Dobermann <strong>and</strong> Nelson, 2013). Innovative<br />
farming is even more challenging. Extension programmes<br />
thus need to be participatory <strong>and</strong> incorporate local<br />
knowledge. They also need to address their frequent bias<br />
towards male farmers (Pretty et al., 2010). Women form a<br />
significant share of farmers <strong>and</strong> agricultural workers, <strong>and</strong><br />
increasing their productivity could have a large positive<br />
impact on family <strong>and</strong> child nutrition (FAO, 2011).<br />
Farmer field schools are particularly relevant to<br />
sustainable agricultural intensification. They have<br />
spread since the late 1980s as part of a broader shift<br />
away from top-down agricultural extension (Waddington<br />
et al., 2014). They now reach over 12 million farmers in<br />
some 90 countries with a participatory approach to<br />
adult education <strong>and</strong> learning. Their aims are to provide<br />
skills in areas such as cultivation practices <strong>and</strong> pest<br />
management so as to increase yield <strong>and</strong> revenue while<br />
reducing environmental impact (FAO, 2016).<br />
A recent systematic review based on 92 evaluations<br />
found that farmer field schools increased farmers’<br />
knowledge by 0.21 st<strong>and</strong>ard deviation on average,<br />
leading to average increases in yield by 13% <strong>and</strong> net<br />
revenue by 19%. They also reduced environmental impact<br />
(an aggregate index decrease by 39% on average) <strong>and</strong><br />
pesticide use (by 17%). Education quality is vital to this<br />
model: Facilitators with strong literacy <strong>and</strong> numeracy<br />
skills, experience with farming, <strong>and</strong> willingness to use<br />
bottom-up training methods, follow a locally relevant<br />
curriculum <strong>and</strong> use the local language obtain the best<br />
results (Waddington et al., 2014).<br />
Critical questions about how to move agricultural<br />
extension forward remain. For example, how can<br />
extension services reach <strong>and</strong> engage the widest number<br />
of farmers to facilitate institutional change <strong>and</strong> technical<br />
innovation, <strong>and</strong> what are the most effective extension<br />
strategies (Pretty et al., 2010)? Increasing productivity<br />
is necessary but not sufficient to ensure food security,<br />
reduce poverty, improve nutrition <strong>and</strong> maintain the<br />
natural resource base for sustainable development<br />
(Sayer <strong>and</strong> Cassman, 2013). Innovation is needed across a<br />
broad spectrum of policies <strong>and</strong> technologies to confront<br />
the complex array of challenges at the agriculture–<br />
environment nexus.<br />
46<br />
CHAPTER 2 | PROSPERITY: SUSTAINABLE AND INCLUSIVE ECONOMIES
2<br />
In many regions, climate change will result in more<br />
frequent drought <strong>and</strong> low rainfall, making current<br />
farming practices less viable. Such conditions call for<br />
the introduction of new methods <strong>and</strong> technologies.<br />
This could include the application of sustainable<br />
organic farming methods, which have been shown to<br />
produce higher yields than conventional agriculture<br />
under drought conditions, as well as reduce negative<br />
environmental impacts (Reganold <strong>and</strong> Wachter, 2016).<br />
Agricultural research can help answer some of the<br />
dilemmas extension services face. Through a crossdisciplinary<br />
lens vital to the systemic change needed, it<br />
can bring about more sustainable practices. Generally<br />
based at universities <strong>and</strong> technical institutes, agricultural<br />
research includes collaboration by a wide variety of<br />
scientists, industrial partners <strong>and</strong> government agencies.<br />
An analysis of more than 1,000 scientific publications<br />
by France’s National Institute for Agricultural Research<br />
provides insight into the types of research taking place:<br />
methods <strong>and</strong> techniques to improve productivity <strong>and</strong><br />
the environmental, health <strong>and</strong> socio-economic impact<br />
of agriculture, ways to improve coordination between<br />
public research <strong>and</strong> industry, <strong>and</strong> scientific advice to<br />
inform policy-making (Gaun<strong>and</strong> et al., 2015).<br />
Republic of the Congo, Nigeria, Rw<strong>and</strong>a <strong>and</strong> Ug<strong>and</strong>a<br />
show that the IAR4D approach has some benefits<br />
for farmer income compared with conventional<br />
research approaches (Ayanwale et al., 2013; Nkonya<br />
et al., 2013).<br />
Climate change <strong>and</strong> associated food security concerns<br />
are prompting growing calls to reverse reductions<br />
in government investment in agricultural research,<br />
development <strong>and</strong> extension. Many countries have halted<br />
or reduced investment in agricultural research, whether<br />
directly or as donors. The key challenge is in sub-Saharan<br />
Africa, whose share in global expenditure on public<br />
agricultural research declined from 10% in 1960 to<br />
6% in 2009. By comparison, Brazil, China <strong>and</strong> India<br />
together accounted for 31% in 2009. In 2010, public<br />
agricultural <strong>and</strong> food research worldwide received about<br />
US$35 billion, while private research totalled between<br />
US$20 billion <strong>and</strong> US$22 billion, which was heavily<br />
concentrated in high income countries <strong>and</strong> focused on<br />
innovations in off-farm sectors such as food processing<br />
(Alston <strong>and</strong> Pardey, 2014; Mellor, 2014). Much more<br />
investment is justified – the FAO estimates the returns<br />
to public spending on agricultural R&D in Ug<strong>and</strong>a at<br />
more than 12% (Dobermann <strong>and</strong> Nelson, 2013).<br />
Such research highlights a shift from isolated<br />
campus research centres towards active engagement<br />
with farming communities <strong>and</strong> industry partners,<br />
<strong>and</strong> public programmes to encourage experimentation<br />
<strong>and</strong> innovation. New research provides insights from<br />
many areas, including innovation studies, socio-technical<br />
transition studies, rural <strong>and</strong> political geography,<br />
resilience thinking <strong>and</strong> climate risk management<br />
literature (Rickards <strong>and</strong> Howden, 2012).<br />
The Integrated Agricultural Research for Development<br />
(IAR4D) concept is an example of this interdisciplinary<br />
approach. IAR4D is based on a systems science<br />
approach which includes many of the underlying<br />
principles of sustainability science. These include<br />
economic growth by linking farmers to markets,<br />
conservation of natural resources, biodiversity,<br />
limited carbon dioxide production, food security,<br />
<strong>and</strong> social inclusion <strong>and</strong> equity. This integrated<br />
approach to farming facilitates research on rural<br />
services <strong>and</strong> policies in order to underst<strong>and</strong> farmers’<br />
access to markets, credit <strong>and</strong> other key rural services.<br />
Empirical evidence for the integrated approach is<br />
positive, although still sparse <strong>and</strong> weak. Impact<br />
analyses of household surveys in the Democratic<br />
EDUCATION AND LIFELONG<br />
LEARNING CONTRIBUTE TO<br />
LONG-TERM ECONOMIC GROWTH<br />
Mainstream economic analysis has highlighted increased<br />
levels of primary <strong>and</strong> secondary education as a key driver<br />
of long-term economic growth. Data show that initial<br />
levels of educational attainment explain about half the<br />
difference in growth rates between East Asia <strong>and</strong> sub-<br />
Saharan Africa between 1965 <strong>and</strong> 2010 (UNESCO, 2014).<br />
At the individual level, the knowledge <strong>and</strong> skills workers<br />
acquire through education <strong>and</strong> training make them more<br />
productive. Provision of good quality education can<br />
improve the knowledge <strong>and</strong> skills of a whole population<br />
beyond what traditional or informal systems can achieve.<br />
For business, educated <strong>and</strong> highly skilled workers foster<br />
productivity gains <strong>and</strong> technological change, through<br />
either innovation or imitation of processes developed<br />
elsewhere. At the societal level, education expansion<br />
helps build social <strong>and</strong> institutional capital, which<br />
has a strong impact on the investment climate <strong>and</strong><br />
growth; it also helps in building social trust, developing<br />
participatory societies, strengthening the rule of law<br />
2016 • GLOBAL EDUCATION MONITORING REPORT 47
2<br />
<strong>and</strong> supporting good governance (Acemoglu et al., 2014;<br />
Bjørnskov, 2012; Knack <strong>and</strong> Zak, 2003).<br />
For countries to prosper in their participation in the<br />
world economy, investment in education is a must. Low<br />
<strong>and</strong> lower middle income countries need to invest in<br />
secondary <strong>and</strong> tertiary education <strong>and</strong> exp<strong>and</strong> lifelong<br />
learning opportunities to increase high-value added<br />
activities in the industrial <strong>and</strong> service sectors. This is<br />
particularly true of sub-Saharan Africa. By 2014, the<br />
region’s gross enrolment ratio in tertiary education<br />
was 8%, far below<br />
the second-lowest<br />
Increasing tertiary regional average, that of<br />
Southern Asia (23%), <strong>and</strong><br />
attainment by one<br />
the global average (34%).<br />
year on average would<br />
increase sub-Saharan Historically, as the<br />
estimated benefits to<br />
Africa’s long-term<br />
investment in education<br />
GDP level by 16%<br />
were lower for higher<br />
education than for<br />
primary <strong>and</strong> secondary<br />
education, the World Bank <strong>and</strong> others discouraged<br />
investment in the tertiary level (Basset <strong>and</strong> Salmi, 2014).<br />
But recent evidence on the impact of higher educational<br />
attainment on growth, pertaining to 108 countries over<br />
1975–2010, suggests that increasing tertiary attainment<br />
by one year on average would increase sub-Saharan<br />
Africa’s long-term GDP level by 16% <strong>and</strong> increase growth<br />
through technological catch-up by 0.06 percentage<br />
points a year (Bloom et al., 2014).<br />
… BUT THE QUALITY OF EDUCATION IS CRUCIAL<br />
The provision of good quality education is central:<br />
Increasing enrolment rates will not have as much<br />
positive impact on national economic growth if students<br />
do not reach sufficient learning outcomes (Pritchett,<br />
2006). Years of schooling is a problematic indicator of<br />
workers’ actual skills because of differences in school<br />
quality within <strong>and</strong> between countries, in achievement<br />
between students of the same social class <strong>and</strong> in<br />
acquisition of skills through other sources.<br />
While results of the Survey of Adult Skills in the OECD<br />
Programme for the International Assessment of Adult<br />
Competencies (PIAAC) are too recent to correlate with<br />
long-term growth, surveys of student achievement<br />
conducted since the 1960s by the International<br />
Association for the Evaluation of Educational<br />
Achievement (IEA), along with results of the OECD<br />
Programme for International Student Assessment<br />
(PISA), have been used as a proxy for the quality of<br />
education that adults received (Barro, 2013).<br />
This str<strong>and</strong> of research has provided evidence of a<br />
substantive link between skills developed through<br />
education <strong>and</strong> economic growth. It has clearly been<br />
shown in relation to skills in mathematics <strong>and</strong> science.<br />
Across 50 countries, the average of mathematics <strong>and</strong><br />
science test scores available between 1964 <strong>and</strong> 2003 had<br />
a significant <strong>and</strong> positive impact on economic growth<br />
over 1960–2000. A st<strong>and</strong>ard deviation increase in test<br />
scores was associated with a two percentage point<br />
annual increase in GDP growth (OECD, 2015d).<br />
Research also shows that basic <strong>and</strong> advanced skills have<br />
complementary effects on growth. Both the share of<br />
students achieving at least basic skills (ranging from 42%<br />
in low income countries to 80% in high income countries)<br />
<strong>and</strong> the share achieving advanced skills have a positive<br />
impact on growth. However, the impact of the share<br />
of advanced skills is comparatively larger in countries<br />
with more scope to catch up with the most advanced<br />
economies, reflecting the importance of advanced skills<br />
for technological diffusion (OECD, 2015d).<br />
The provision or relative lack of good quality education<br />
helps explain the East Asian ‘miracle’ <strong>and</strong> Latin America’s<br />
‘lost decades’. Despite relatively high average years of<br />
schooling <strong>and</strong> per capita income around 1960, most<br />
Latin American countries have had low test scores in the<br />
decades since, whether measured in international surveys<br />
or in regional assessments conducted by the Latin<br />
American Laboratory for Assessment of the Quality of<br />
Education. By contrast, many East Asian countries have<br />
had higher test scores than could be predicted based on<br />
the same variables. Differences in test scores between<br />
the two regions can explain their different growth<br />
records. Within the regions, countries with higher scores<br />
had more rapid growth, e.g. Brazil <strong>and</strong> Chile compared<br />
with the Plurinational State of Bolivia, Honduras <strong>and</strong> the<br />
Bolivarian Republic of Venezuela, <strong>and</strong> the Republic of<br />
Korea <strong>and</strong> Singapore compared with Indonesia <strong>and</strong> the<br />
Philippines (Hanushek <strong>and</strong> Woessmann, 2012).<br />
Analysis of a sample of lower middle income countries<br />
found that if all children were to acquire basic skills by<br />
2030, GDP would be 28% higher over the following 40<br />
years compared with what would be expected with<br />
current skills levels. The increase in GDP for upper middle<br />
48<br />
CHAPTER 2 | PROSPERITY: SUSTAINABLE AND INCLUSIVE ECONOMIES
2<br />
income countries would be 16% <strong>and</strong> that for non-OECD<br />
high income countries 10%, reflecting higher enrolment<br />
<strong>and</strong> skills levels. Even high income OECD countries would<br />
gain significantly from bringing all students up to basic<br />
skills by 2030, with GDP 3.5% higher than otherwise<br />
(OECD, 2015d).<br />
their creative <strong>and</strong> problem-solving abilities, but has<br />
also displaced workers in medium skill jobs whose<br />
relatively repetitive <strong>and</strong> procedural tasks are more<br />
easily replicated in computer hardware <strong>and</strong> code, <strong>and</strong><br />
overseas (Autor <strong>and</strong> Dorn, 2013; Autor et al., 2006;<br />
Goos et al., 2014; Jaimovich <strong>and</strong> Siu, 2012).<br />
EDUCATION POLICIES WILL HELP COUNTRIES<br />
ADAPT TO A FAST-CHANGING WORLD OF WORK<br />
The world of work has undergone rapid change in<br />
recent decades. ICT has dramatically changed how<br />
we live <strong>and</strong> work <strong>and</strong> how economies are structured.<br />
This change is especially apparent in more developed<br />
regions <strong>and</strong> in urban areas. In poorer countries, there<br />
has been substantial movement from agricultural to<br />
non-farm employment. Moreover, greater integration<br />
of the global economy has opened up economic <strong>and</strong><br />
trade opportunities across the world, enabling rapid<br />
growth in the now major economies of Brazil, China <strong>and</strong><br />
India, while displacing industries <strong>and</strong> occupations in<br />
advanced economies through off shoring, particularly<br />
among less educated workers (Autor et al., 2014).<br />
Evidence suggests that similar processes may also be<br />
under way in other regions, although it is premature to<br />
draw conclusions. The global employment share of high<br />
skill workers has<br />
increased by almost<br />
40% since 1990,<br />
The global employment<br />
<strong>and</strong> is projected to<br />
share of high skill<br />
have accounted for<br />
workers has increased by almost 20% of the<br />
workforce in 2015<br />
almost 40% since 1990<br />
(Figure 2.1). Over the<br />
same period, the<br />
employment share<br />
of medium skill work decreased by almost 10%, while the<br />
share of low skilled work rose correspondingly. These<br />
trends are projected to continue in coming years.<br />
Two trends with profound implications can be<br />
expected to shape labour markets in many countries<br />
in the foreseeable future. First, polarization between<br />
low <strong>and</strong> high skill work <strong>and</strong> reduced dem<strong>and</strong> for medium<br />
skilled employment has been widely documented in<br />
industrialized economies, but can also be observed on<br />
the global level. Second, stagnation in manufacturing<br />
employment makes it uncertain that poor countries<br />
can follow the developmental paths which historically<br />
have greatly improved working conditions among the<br />
poor. These interrelated trends can be expected to<br />
significantly shape the scope for decent employment<br />
across countries, challenging policy-makers to increase<br />
the supply of highly skilled <strong>and</strong> appropriately skilled<br />
workers, while creating conditions in which an educated<br />
workforce can be employed <strong>and</strong> adequately utilized.<br />
Education systems must adapt to job polarization<br />
Recent evidence from high income countries has<br />
led to increasing awareness of polarization between<br />
high <strong>and</strong> low skill work. A resulting proposition is<br />
that technological changes underpin the large<br />
relative drops in medium skill employment <strong>and</strong><br />
corresponding increases in high <strong>and</strong> low skill<br />
employment across Europe <strong>and</strong> Northern America.<br />
Increasingly sophisticated technology has not only<br />
raised dem<strong>and</strong> for high skill workers by complementing<br />
Globally, as in industrialized countries, the majority<br />
of employment remains in medium skill occupations,<br />
which are projected to have made up slightly less<br />
than two-thirds of total employment in 2015 (ILO, 2015c).<br />
However, their share may decline significantly in coming<br />
decades as increasingly cheap <strong>and</strong> capable computer<br />
programs replace clerical workers <strong>and</strong> robots displace<br />
garment makers <strong>and</strong> machine operators 2 . In China, for<br />
example, automation has had a substantial impact on<br />
factory employment, <strong>and</strong> this trend could accelerate<br />
as wages rise <strong>and</strong> automation technology becomes<br />
cheaper. In the context of rising manufacturing wages,<br />
President Xi Jinping in 2014 called for a ‘robot revolution’<br />
(Chan, 2015), which already appears to be under way.<br />
The consumer electronics manufacturer Foxconn, one<br />
of the largest employers in China (<strong>and</strong> the world), plans<br />
to automate about 70% of its factory work by 2018, <strong>and</strong><br />
already has a fully robotic factory in Chengdu (Lin, 2015).<br />
Education systems face the dual challenge of ensuring<br />
that those who enter medium skill work have the skill sets<br />
to avoid obsolescence <strong>and</strong> of meeting the economy’s<br />
increased dem<strong>and</strong> for skilled workers, dem<strong>and</strong> that is likely<br />
to continue in the foreseeable future given that computer<br />
code is no substitute for the creativity <strong>and</strong> cognitive<br />
abilities of high skill workers. Yet evidence suggests that<br />
most education systems are not keeping up.<br />
2016 • GLOBAL EDUCATION MONITORING REPORT 49
2<br />
FIGURE 2.1:<br />
Employment is being polarized by skill category on the global level<br />
Percentage change in global employment shares from 1991, by occupational skill level<br />
50<br />
40<br />
Percentage change since 1991<br />
30<br />
20<br />
10<br />
0<br />
-10<br />
-20<br />
1991<br />
1992<br />
1993<br />
1994<br />
1995<br />
1996<br />
1997<br />
1998<br />
1999<br />
2000<br />
2001<br />
2002<br />
2003<br />
2004<br />
2005<br />
2006<br />
2007<br />
2008<br />
2009<br />
2010<br />
2011<br />
2012<br />
2013<br />
2014e<br />
2015p<br />
2016p<br />
2017p<br />
2018p<br />
2019p<br />
High skill Low skill Medium skill<br />
Notes: Skilled occupations are classified according to one digit ISCO-08 codes, following the ILO Global Employment Trends (GET) Model Extension<br />
(GME) methodology. High skill occupations are those of managers, professionals, technicians <strong>and</strong> associate professionals. Medium skill workers are<br />
clerical support workers, service <strong>and</strong> sales workers, skilled agricultural, forestry <strong>and</strong> fishery workers, craft <strong>and</strong> related trades workers, plant <strong>and</strong> machine<br />
operators, <strong>and</strong> assemblers. Low skill workers are those in elementary occupations. Data for 2014 are estimates (e). Data for 2015–2019 are projections (p).<br />
Source: GEM Report team calculations based on ILO (2015c).<br />
In high income countries such as the United States,<br />
an insufficient supply of tertiary graduates is well<br />
documented, as evidenced by the rising ‘college<br />
premium’ in wages <strong>and</strong> growing inequality (Goldin<br />
<strong>and</strong> Katz, 2010). On the global scale, by 2020 the<br />
world could have 40 million too few workers with<br />
tertiary degrees, relative to dem<strong>and</strong>, <strong>and</strong> up to 95 million<br />
too many low <strong>and</strong> medium educated workers. Advanced<br />
economies could have up to 35 million excess workers<br />
without post-secondary education. In poorer countries<br />
the surplus of workers without secondary education<br />
could be as large as 58 million, combined with<br />
45 million too few workers with secondary education<br />
(MGI Global, 2012).<br />
Beyond the need for greater tertiary enrolment, what<br />
forms of skills development should governments<br />
promote? There is a case for exp<strong>and</strong>ing TVET at<br />
the post-secondary level in middle skill occupations<br />
that are less prone to automation (Autor, 2015).<br />
Investing in job-specific skills is risky given the<br />
uncertainty as to the effects of technological change.<br />
Still, capacities promoted by general <strong>and</strong> comprehensive<br />
education – for example, critical thinking, problem<br />
solving, team <strong>and</strong> project work, <strong>and</strong> solid literacy,<br />
communication <strong>and</strong> presentation skills – are likely to<br />
remain valued in the labour market, including in green<br />
jobs, <strong>and</strong> throughout life.<br />
In addition, education systems could do more to<br />
promote high value skills not easily replicated by<br />
machines or software. Studies based on analysis of<br />
job tasks in the UK <strong>and</strong> US labour markets show that<br />
two attributes in particular are the least likely to be<br />
replaced by machines: originality <strong>and</strong> social intelligence.<br />
The former – <strong>and</strong> most important – attribute refers to<br />
creative problem-solving <strong>and</strong> the generation of unusual<br />
or clever ideas about a given topic or situation. The latter<br />
entails tacit knowledge of social <strong>and</strong> cultural contexts<br />
enabling one to perform tasks such as negotiation,<br />
coordination, teaching <strong>and</strong> mentoring (Citi GPS, 2016;<br />
Frey <strong>and</strong> Osborne, 2013). Acquiring a wide range of<br />
transferable <strong>and</strong> foundation skills is therefore extremely<br />
important for future employment. The challenge for<br />
education systems is to discover how to most effectively<br />
impart them to students.<br />
Countries need to make the leap to the high skill<br />
service sector<br />
The decline of medium skill work, particularly<br />
manufacturing employment, has strong implications<br />
for lower income economies. In almost every country<br />
50<br />
CHAPTER 2 | PROSPERITY: SUSTAINABLE AND INCLUSIVE ECONOMIES
2<br />
“<br />
By 2020, the world could have 40 million too few<br />
workers with tertiary degrees, relative to dem<strong>and</strong><br />
that has moved from low to high income status,<br />
manufacturing jobs provided the route by which poor<br />
agrarian workers moved into comparatively stable <strong>and</strong><br />
better paid work. However, automation <strong>and</strong> technological<br />
developments are reducing dem<strong>and</strong> for manufacturing<br />
workers, a trend expected to continue. Without<br />
growing manufacturing employment, the challenge of<br />
‘leapfrogging’ from low skill agrarian to high skill servicesector<br />
economies is daunting for poorer countries <strong>and</strong><br />
regions in which the majority of employment is still<br />
agricultural, such as sub-Saharan Africa <strong>and</strong> Southern<br />
Asia (World Bank, 2015).<br />
Over the course of the 20th century, peak manufacturing<br />
employment in emerging economies has declined,<br />
relative to the historical experience of more advanced<br />
economies. Manufacturing employment in the United<br />
Kingdom peaked at 45% of total employment, while<br />
emerging economies such as Brazil <strong>and</strong> India saw<br />
manufacturing employment peak at no more than 15%.<br />
In sub-Saharan Africa, manufacturing employment<br />
has stagnated at around 6% for three decades<br />
(Citi GPS, 2016).<br />
Countries which have not already developed a strong<br />
manufacturing sector face significant barriers. The<br />
decreasing cost of automation technology means that<br />
the abundance of cheap labour in, for example, sub-<br />
Saharan Africa is unlikely to provide sufficient incentive<br />
for manufacturing firms to invest (Citi GPS, 2016). So, as<br />
a form of ‘premature deindustrialization’, such nations<br />
are transforming into service economies without prior<br />
development of an industrial sector (Felipe et al., 2014;<br />
Rodrik, 2015).<br />
This is already evident on a global scale: Employment<br />
in the service sector has grown substantially (ILO,<br />
2015b). However, many of these jobs are characterized<br />
by low productivity <strong>and</strong> poor working conditions. In<br />
Latin America, work in the informal sector 3 has grown;<br />
in sub-Saharan Africa, urban migrants are crowding into<br />
subsistence employment in the informal service sector<br />
as well (Rodrik, 2015).<br />
”<br />
High productivity tradable service industries such as<br />
ICT <strong>and</strong> finance could provide an alternative means of<br />
growth in the absence of a manufacturing sector (Rodrik,<br />
2015). So could jobs in growing green industries. But the<br />
highly educated <strong>and</strong> skilled workers upon which these<br />
sectors rely are typically in short supply in lower income<br />
countries. Nor is the shift to high value services such<br />
as ICT automatically positive, as it can have negative<br />
effects such as social exclusion <strong>and</strong> job insecurity (see<br />
Chapter 5: Place).<br />
Policy-makers need to extend provision of education<br />
<strong>and</strong> skills beyond the basic literacy <strong>and</strong> numeracy that<br />
were valued in 20th century industry. The extent to<br />
which countries create conditions in which services <strong>and</strong><br />
green industries can productively employ large numbers<br />
of workers will largely determine whether governments<br />
meet commitments to provide work for all. Countries<br />
hoping to emulate the export-led manufacturing growth<br />
of ‘Asian miracle’ economies may need to accept that<br />
this model now offers limited guidance.<br />
ECONOMIC GROWTH DOES NOT<br />
MEAN PROSPERITY FOR ALL<br />
Achieving a higher level of development has historically<br />
been linked with industrialization. But as the Agenda<br />
for Sustainable Development was being defined for<br />
2015–2030 <strong>and</strong> the evidence of prior decades was<br />
considered, fundamental flaws became visible in the logic<br />
of economic growth reliant on the 20th century model<br />
of industrialization. These flaws concerned not only<br />
the impact on the environment but also the fact that<br />
such models of economic growth have failed to produce<br />
development that is inclusive of all (Sachs, 2015).<br />
The previous sections presented evidence that investing<br />
in education <strong>and</strong> lifelong learning contributes to longterm<br />
economic growth <strong>and</strong> that education (<strong>and</strong> policies<br />
on education <strong>and</strong> skills development) can facilitate<br />
countries’ ability to exp<strong>and</strong> the higher skill service<br />
sector <strong>and</strong> provide decent work for all. But economic<br />
2016 • GLOBAL EDUCATION MONITORING REPORT 51
2<br />
growth does not necessarily mean prosperity for all, in<br />
spite of the great strides made to improve the quality<br />
of life around the globe <strong>and</strong> reduce extreme poverty.<br />
The benefits of growth have been unevenly spread.<br />
The effects on the environment have meant a poorer<br />
quality of life for many, <strong>and</strong> thus a lack of prosperity. In<br />
addition, poverty remains prevalent in many countries.<br />
While the incidence of extreme poverty declined rapidly<br />
over 2000–2015, the challenge is far from over. Almost<br />
900 million <strong>people</strong> lived in extreme poverty in 2012. The<br />
share of <strong>people</strong> living on less than US$1.90 a day declined<br />
globally from 29% in 1999 to 13% in 2012, partly because<br />
of rapid economic development in China. Extreme<br />
poverty is now concentrated in Southern Asia<br />
(19% of the population) <strong>and</strong> sub-Saharan Africa (43%)<br />
(World Bank, 2016).<br />
For those who are in work, earnings are often not<br />
sufficient to escape either extreme poverty or more<br />
moderate levels. In low income countries, largely in<br />
sub-Saharan Africa, 37% of workers are extremely poor<br />
<strong>and</strong> a further 32% moderately poor. More broadly, almost<br />
90% of workers are either poor or close to poverty in low<br />
income countries, <strong>and</strong> nearly 70% in lower middle income<br />
countries. Among all developing regions, almost half<br />
of workers are poor or near poverty (Figure 2.2).<br />
Inequality, as measured by the Gini coefficient, has<br />
persisted at an extremely high level globally, <strong>and</strong> has<br />
increased markedly in most countries <strong>and</strong> regions.<br />
The Gini index measures per capita income equality:<br />
The closer the coefficient is to zero, the less the<br />
inequality, <strong>and</strong> the closer it is to one, the greater. The<br />
global Gini coefficient was 0.715 in 1998 <strong>and</strong> had not<br />
changed significantly by 2008, at 0.705 (Lakner <strong>and</strong><br />
Milanovic, 2015).<br />
Between 1993 <strong>and</strong> 2008, the poor did not benefit<br />
from growth as much as the rest of the population:<br />
The average per capita income of the world’s poorest<br />
decile increased by 25%, but the income of the middle<br />
deciles grew roughly twice as fast, by over 50%, while<br />
the income of the richest 1% grew by 62% (Lakner <strong>and</strong><br />
Milanovic, 2015).<br />
Within countries, increases in inequality were more<br />
pronounced. By income group, average inequality<br />
increased significantly between the early 1990s <strong>and</strong><br />
late 2000s: by 9% for high income countries <strong>and</strong><br />
11% for low <strong>and</strong> middle income countries (Figure 2.3).<br />
Over 1988–2008, inequality increased rapidly in China<br />
(Lakner <strong>and</strong> Milanovic, 2015).<br />
The evidence on poverty <strong>and</strong> inequality shows that<br />
economic growth has not been equally shared <strong>and</strong><br />
that the conventional development paradigm needs<br />
rethinking. The growth model of the past century is not<br />
suited for 21st century sustainability, even if it does<br />
include the aim of reducing extreme income poverty by<br />
raising GDP. A new concept of prosperity must include<br />
social inclusiveness of economic institutions <strong>and</strong> overall<br />
FIGURE 2.2:<br />
Large proportions of workers remain in poverty<br />
Share of workforce living in or near poverty, 2015<br />
%<br />
100<br />
90<br />
80<br />
70<br />
60<br />
50<br />
40<br />
30<br />
20<br />
10<br />
0<br />
High income<br />
Upper middle income Lower middle income Low income All developing regions<br />
Extremely poor (less than US$1.90/day) Moderately poor (between US$1.90 <strong>and</strong> US$3.10/day) Near poor (between US$3.10 <strong>and</strong> US$5/day)<br />
Notes: Excludes North America, Western Europe <strong>and</strong> the European Union, Australia <strong>and</strong> New Zeal<strong>and</strong>. Economic classes are defined by estimated per<br />
capita per day consumption levels in US$, 2011 Purchasing Power Parity (PPP).<br />
Source: ILO (2016).<br />
52<br />
CHAPTER 2 | PROSPERITY: SUSTAINABLE AND INCLUSIVE ECONOMIES
2<br />
well-being, along with environmental sustainability of<br />
production <strong>and</strong> consumption. A strong economy does<br />
not just grow but is also inclusive <strong>and</strong> sustainable.<br />
In the past, growth has been tracked through gross<br />
measures such as increases in domestic product, without<br />
careful examination of its impact on the environment<br />
or the extent to which the vital economic activities of<br />
marginalized groups, such the poor <strong>and</strong> women, are<br />
included. Looking beyond a nation’s averages is critical<br />
to underst<strong>and</strong> how all citizens contribute to <strong>and</strong> are<br />
affected by economic growth; doing so helps keep<br />
poverty <strong>and</strong> inequality from persisting at levels that<br />
undermine social cohesion (Ravallion, 2015).<br />
In fact, high <strong>and</strong> rising inequality has stalled progress<br />
in much of the world. Drawing on data from OECD<br />
countries over the past 30 years, analysis suggests that<br />
in relatively rich countries, the single biggest negative<br />
impact on economic growth was made by the widening<br />
gap in income between the lower middle class <strong>and</strong> poor<br />
households, on one h<strong>and</strong>, <strong>and</strong> the rest of society on the<br />
other (Cingano, 2014).<br />
EDUCATION CAN HELP<br />
INCREASE INCLUSION<br />
Education has an important role in creating a<br />
stronger relationship between exp<strong>and</strong>ing valued<br />
economic activities <strong>and</strong> promoting social inclusion<br />
as part of the process of transition to a sustainable<br />
<strong>and</strong> inclusive economy.<br />
Education drives growth, increases the incomes of the<br />
poorest <strong>and</strong>, if equitably distributed, mitigates inequality.<br />
Making primary <strong>and</strong> secondary education of good quality<br />
widely accessible can enable large numbers of individuals<br />
<strong>and</strong> their families to increase their incomes above the<br />
poverty line. In lower income countries, achievement of<br />
basic education is associated with increased earnings <strong>and</strong><br />
consumption among rural <strong>and</strong> informal sector workers.<br />
Calculations for the 2013/14 EFA Global Monitoring Report<br />
showed that if all students in low income countries left<br />
school with basic reading skills, 171 million <strong>people</strong> could<br />
be lifted out of extreme poverty, equivalent to a 12%<br />
reduction in the world total (UNESCO, 2014).<br />
Higher levels of education reduce the likelihood of<br />
households experiencing long periods of chronic poverty<br />
or transmitting poverty between generations. If 10<br />
FIGURE 2.3:<br />
Inequality has grown across rich <strong>and</strong> poor regions<br />
Change in Gini coefficient between early 1990s <strong>and</strong> late 2000s<br />
Gini coefficient<br />
0.46<br />
0.44<br />
0.42<br />
0.40<br />
0.38<br />
0.36<br />
0.34<br />
High income countries<br />
Early 1990s<br />
Low <strong>and</strong> middle income countries<br />
Late 2000s<br />
Notes: Household income inequality was measured by the<br />
population-weighted average for a sample of 116 countries.<br />
Source: UNDP (2013).<br />
recent EU member states 4 met 2020 targets to decrease<br />
early school leaving <strong>and</strong> increase tertiary participation,<br />
they could reduce the numbers of those at risk of<br />
poverty by 3.7 million (Ajwad et al., 2015). Education<br />
can also help make the labour market more inclusive by<br />
facilitating labour force participation <strong>and</strong> employment,<br />
<strong>and</strong> reduce working poverty as well.<br />
However, assumptions on the role of education in<br />
economic development can often be overly reductive.<br />
The term ‘education’ encompasses a wide range<br />
of programmes, with differing levels of quality <strong>and</strong><br />
objectives. The effects of a particular education<br />
investment in terms of desirable outcomes will<br />
accordingly vary in magnitude. Moreover, these effects<br />
will in turn vary across countries, depending on broader<br />
economic <strong>and</strong> labour market contexts. Looking more<br />
closely at the effects of levels <strong>and</strong> types of education<br />
across a range of outcomes can therefore be instructive<br />
in helping promote more participation in the economy,<br />
<strong>and</strong> more inclusion in its benefits.<br />
EDUCATION’S IMPACT ON INEQUALITY<br />
MAY BE MIXED<br />
While exp<strong>and</strong>ing education is indispensable to the<br />
fight against poverty, its impact on inequality is mixed.<br />
Increases in training <strong>and</strong> skills have not translated<br />
evenly into improved prospects for long-term economic<br />
growth or reduced social inequality. The impact of<br />
education varies by country context. Secondary or<br />
tertiary education is becoming key to obtaining decent<br />
2016 • GLOBAL EDUCATION MONITORING REPORT 53
2<br />
jobs <strong>and</strong> decent earnings, even in low <strong>and</strong> middle income<br />
countries This trend is reinforced by job polarization <strong>and</strong><br />
by the rise of the service sector in the context of rapid<br />
technological change <strong>and</strong> continued globalization.<br />
Equitable education expansion over 2015–2030,<br />
especially at the secondary <strong>and</strong> post-secondary levels<br />
could help reverse the trend of widening income<br />
inequality within countries. Educated <strong>people</strong>, at all levels<br />
of education, receive a substantial payoff in individual<br />
earnings (Montenegro <strong>and</strong> Patrinos, 2014), meaning<br />
education reforms can be important in reducing income<br />
inequality <strong>and</strong> earnings disparities between groups.<br />
Furthermore, improving education outcomes among<br />
disadvantaged groups can improve intergenerational<br />
social <strong>and</strong> income mobility (OECD, 2012).<br />
Generally, to tackle income inequality, education should<br />
be exp<strong>and</strong>ed <strong>and</strong> its provision equally distributed.<br />
Historical evidence suggests unequal distribution in<br />
educational attainment contributes to unequal income<br />
distribution (Birdsall <strong>and</strong> Londoño, 1997; Gregorio <strong>and</strong><br />
Lee, 2002; Lundberg <strong>and</strong> Squire, 2003), while higher levels<br />
of education, in terms of both quality <strong>and</strong> quantity,<br />
positively affect growth in the income share of the poor<br />
(Gundlach et al., 2004). A meta-analysis of 64 empirical<br />
studies found that education – based on measures such<br />
as years of schooling <strong>and</strong> education expenditure – is<br />
significantly associated with an increased income share<br />
of the poor <strong>and</strong> a reduced income share of the rich.<br />
Effects were particularly strong for secondary school<br />
expansion, <strong>and</strong> for education expansion generally in<br />
Africa (Abdullah et al., 2015).<br />
While reporting an overall positive effect, the metaanalysis<br />
cited above found that education was associated<br />
with increased inequality in a large number of studies<br />
(Abdullah et al., 2015). In the United States, it is estimated<br />
that moving 10% of non-college-educated males to a<br />
degree-level education<br />
would have little impact<br />
on overall inequality 5 ,<br />
Where education is mainly because many<br />
unequally distributed benefits would shift to<br />
the upper end of the<br />
<strong>and</strong> not effectively<br />
income distribution<br />
aligned with labour (Hershbein et al., 2015).<br />
market designs, it can<br />
reinforce inequality<br />
The overall effect of<br />
education expansion<br />
on income inequality<br />
(before taxes <strong>and</strong> transfers) is ultimately determined by<br />
changes in the education distribution between levels of<br />
education; differences in labour market returns between<br />
(<strong>and</strong> within) these levels; 6 <strong>and</strong> whether the education<br />
expansion reduces differences in wages between<br />
education levels.<br />
The dynamics of education expansion are commonly<br />
understood in terms of two sometimes contradictory<br />
processes – the composition effect <strong>and</strong> the compression<br />
effect (Gregorio <strong>and</strong> Lee, 2002; Knight <strong>and</strong> Sabot,<br />
1983). The former, through increases in the incomes of<br />
beneficiaries, changes income distribution, <strong>and</strong> in theory<br />
can either increase or decrease inequality. For example,<br />
on this basis, education expansion in which beneficiaries<br />
increase their incomes significantly above average wages<br />
(e.g. exp<strong>and</strong>ing tertiary education in a country in which<br />
only a small proportion of the population has tertiary<br />
education) can be expected to increase inequality, all else<br />
being equal. On the other h<strong>and</strong>, education expansion in<br />
which a disadvantaged group increases its income to<br />
closer to the national average (e.g. moving to universal<br />
secondary attainment where attainment is relatively<br />
widespread) can be expected to lower inequality. Hence,<br />
the composition effect of education expansion at a given<br />
level of education tends to increase inequality initially,<br />
as more <strong>people</strong> attain higher income, then lower it over<br />
time, as fewer low income <strong>people</strong> remain.<br />
At the same time, a compression effect takes place when<br />
the increased supply of workers with a given level of<br />
education exceeds the dem<strong>and</strong> for them. This pushes<br />
wages down relative to the less educated. So while<br />
the composition effect can work to either increase<br />
or decrease inequality, the compression effect works<br />
to lower inequality. All else being equal, the effect of<br />
education expansion on earnings inequality depends<br />
on the net composition <strong>and</strong> compression effect. If,<br />
for example, a higher education expansion led to a<br />
compositional change – which would in theory widen the<br />
income distribution – this would have to be outweighed<br />
by a subsequent compression effect across higher<br />
education graduates in order to decrease inequality.<br />
Given uncertainty of the future returns between <strong>and</strong> within<br />
various levels of education <strong>and</strong> labour market dem<strong>and</strong>,<br />
accurately estimating the net composition <strong>and</strong> compression<br />
effects of an education reform in advance is challenging.<br />
Education should therefore be viewed as a potential<br />
equalizing mechanism, but not as the sole solution to<br />
54<br />
CHAPTER 2 | PROSPERITY: SUSTAINABLE AND INCLUSIVE ECONOMIES
2<br />
inequality. The degree to which education can decrease<br />
income inequality within countries over 2015–2030 will<br />
vary by countries, depending on context. Opportunities<br />
for large expansion of secondary education that could<br />
equalize income exist in many low income countries.<br />
Yet many countries, including in poor regions, will<br />
likely experience ever-increasing dem<strong>and</strong> for tertiary<br />
education, both as a result of larger numbers graduating<br />
from secondary school <strong>and</strong> from employers wanting<br />
skilled workers (Altbach et al., 2011). If changes in the<br />
economy raise the pay-off to tertiary education,<br />
while tertiary graduation increases alongside, income<br />
inequality could widen in many countries.<br />
Governments have an obligation to provide universal<br />
primary <strong>and</strong> secondary education <strong>and</strong> basic skills to<br />
all. But whether increased access to tertiary education<br />
improves income distribution over the short <strong>and</strong> medium<br />
term should not ultimately determine its desirability.<br />
Education is not the only tool available to policy-makers<br />
wishing to tackle inequality. Counteracting inequality<br />
with taxes <strong>and</strong> transfers between those on high <strong>and</strong> low<br />
incomes remains a necessary <strong>and</strong> often more effective<br />
method than education reform alone (Hershbein et al.,<br />
2015). Better access to education (leading to declining<br />
education inequality), combined with improved health<br />
outcomes <strong>and</strong> redistributive social policies, have been<br />
cited as three interventions that help raise the income<br />
share of the poor <strong>and</strong> middle class regardless of the level<br />
of economic development (Dabla-Norris et al., 2015).<br />
EDUCATION IMPROVES<br />
LABOUR MARKET AND DECENT<br />
WORK OUTCOMES<br />
The primary way education promotes economic inclusion is<br />
by exp<strong>and</strong>ing <strong>people</strong>’s ability to participate productively in<br />
the economy on favourable terms. This objective, implicitly<br />
including poverty reduction <strong>and</strong> greater income equality, is<br />
encapsulated in SDG 8: promoting inclusive <strong>and</strong> sustainable<br />
economic growth, employment <strong>and</strong> decent work for all.<br />
Decent work is both an aspiration <strong>and</strong> an expectation for<br />
the vast majority of working age adults, who depend on<br />
a decent wage for their labour (Box 2.2). However, widely<br />
available measures make clear that decent work remains<br />
out of reach for much of the global working population.<br />
Education is widely considered one of the best<br />
investments to exp<strong>and</strong> prospects of skilled <strong>and</strong><br />
BOX 2.2<br />
What is decent work?<br />
The ILO concept of decent work describes it as work that is<br />
‘productive <strong>and</strong> delivers a fair income, security in the workplace <strong>and</strong><br />
social protection for families. Decent work means better prospects<br />
for personal development <strong>and</strong> social integration, <strong>and</strong> freedom for<br />
<strong>people</strong> to express their concerns, organize <strong>and</strong> participate in the<br />
decisions that affect their lives. It entails equality of opportunity <strong>and</strong><br />
treatment for all women <strong>and</strong> men’.<br />
Education primarily promotes decent work by enabling<br />
individuals with skills <strong>and</strong> knowledge to become more productive. 7<br />
More specifically, it enables individuals to acquire a stock of<br />
capabilities (knowledge <strong>and</strong> skills) necessary to perform certain<br />
tasks effectively. Workers apply their skills to bundles of tasks<br />
(occupations) in order to produce output. Skilled workers can<br />
perform a variety of complex tasks more effectively, thereby<br />
producing more value <strong>and</strong> receiving higher earnings. Due to their<br />
relative scarcity, higher skill workers are more employable <strong>and</strong><br />
dem<strong>and</strong> not only higher earnings in the labour market, but also<br />
better working conditions. Higher skill work is often intrinsically<br />
more rewarding because of the freedom <strong>and</strong> creativity often<br />
inherent to higher skill occupations.<br />
Sources: Acemoglu <strong>and</strong> Autor (2011); ILO (2007).<br />
adequately paid employment. But while most policymakers<br />
are aware of the importance of education for<br />
productive <strong>and</strong> decent work, it is less clear what forms of<br />
education expansion should be promoted to maximize<br />
better job opportunities. In addition, following the earlier<br />
discussion, it will be important for education to equip<br />
workers with green skills, for the new green economy.<br />
EDUCATION CAN FACILITATE LABOUR FORCE<br />
PARTICIPATION AND ACCESS TO EMPLOYMENT<br />
Globally, many individuals remain unable to secure work,<br />
or do not participate in the labour market. The share of<br />
the population in employment varies significantly across<br />
regions. It is systematically lower among women than<br />
men, particularly in Northern Africa <strong>and</strong> Western Asia<br />
<strong>and</strong> Southern Asia (ILO, 2015b).<br />
In 2014, 201 million <strong>people</strong> globally were considered<br />
unemployed: that is, without work, though available<br />
for <strong>and</strong> seeking employment. Youth continue to be<br />
2016 • GLOBAL EDUCATION MONITORING REPORT 55
2<br />
disproportionately affected, accounting for over onethird<br />
of the unemployed globally (ILO, 2015b). Some<br />
regions display considerable gender disparity, including<br />
Latin America <strong>and</strong> the Caribbean, sub-Saharan Africa <strong>and</strong>,<br />
in particular, Northern Africa <strong>and</strong> Western Asia, where<br />
21% of women are unemployed – almost double the share<br />
of men. Underemployment is also significant. In the<br />
European Union, 10 million are underemployed, twothirds<br />
of them women (Eurostat, 2015). Unemployment<br />
figures exclude those who have stopped actively seeking<br />
work, often because they cannot find employment or<br />
have given up. In 2013, the number of these ‘discouraged<br />
workers’ was estimated at 23 million globally (ILO, 2014).<br />
Education can have a significant role in facilitating<br />
employment, as reflected in lower unemployment rates<br />
among the comparatively educated, particularly in richer<br />
countries. However, in poorer countries this relationship<br />
often breaks down, suggesting both that dem<strong>and</strong> for<br />
skilled labour is limited <strong>and</strong> that education systems<br />
are not enabling students to acquire relevant skills<br />
(ILO, 2015a; Sparreboom <strong>and</strong> Staneva, 2014).<br />
In richer countries, low educational attainment has a<br />
strong association with unemployment <strong>and</strong> inactivity.<br />
In the OECD, only 55% of adults aged 25 to 64 with less<br />
than an upper secondary education were employed<br />
in 2013, compared with 73% of those with an upper<br />
secondary or non-tertiary education <strong>and</strong> 83% with a<br />
tertiary qualification (OECD, 2015c). 8 The corresponding<br />
rates among those aged 15 to 29 who were not in<br />
education were 49%, 73% <strong>and</strong> 83% (OECD, 2015b).<br />
Evidence across 11 EU countries shows that the<br />
probability of long-term unemployment decreases<br />
with higher educational attainment (Garrouste et al.,<br />
2010). In emerging economies such as South Africa<br />
<strong>and</strong> Turkey, there are large differences in employment<br />
rates by educational attainment. In South Africa, less<br />
than 45% of the adult<br />
population with less<br />
than upper secondary<br />
Evidence across 11<br />
education were<br />
EU countries shows employed in 2005,<br />
compared to over 60%<br />
that long-term<br />
who completed upper<br />
unemployment<br />
secondary, <strong>and</strong> over<br />
decreases with higher 80% with a tertiary<br />
qualification (Quintini<br />
educational attainment<br />
<strong>and</strong> Martin, 2013). In<br />
the United States, high<br />
school <strong>and</strong> university completion significantly increases<br />
the chance of unemployed workers finding work within a<br />
year (Riddell <strong>and</strong> Song, 2011).<br />
By contrast, unemployment in non-OECD countries is<br />
often associated with higher levels of education. In Asia<br />
<strong>and</strong> the Pacific, North Africa <strong>and</strong> Western Asia, <strong>and</strong> sub-<br />
Saharan Africa the youth unemployment rate increases<br />
with the level of education. Youth with tertiary education<br />
in these regions are two to three times more likely to be<br />
unemployed than youth with primary education or less<br />
(ILO, 2015a). In several sub-Saharan African countries,<br />
differences are especially large among young adults aged<br />
25-34. In the United Republic of Tanzania, for example,<br />
unemployment is almost negligible among those with<br />
primary education or less, but almost 17% for those<br />
with tertiary education (UCW, 2013). Such outcomes<br />
are partly due to the more educated coming from<br />
wealthier backgrounds <strong>and</strong> thus able to sustain periods<br />
of unemployment, whereas employment is necessary for<br />
survival among the poorer <strong>and</strong> less educated (UCW, 2013).<br />
High unemployment rates among the relatively<br />
educated – particularly among youth – also reflect low<br />
education quality, weak skills acquisition <strong>and</strong> limited<br />
labour dem<strong>and</strong>. In Northern Africa <strong>and</strong> Western Asia,<br />
where youth unemployment is pervasive, education<br />
quality is low, as indicated by the fact that some 75% of<br />
eighth grade students scored poorly on international<br />
mathematics tests. Tertiary enrolment is also weighted<br />
towards subjects with relatively low labour market<br />
dem<strong>and</strong> (particularly law, the humanities <strong>and</strong> business/<br />
commerce). These factors may explain why almost<br />
40% of firms in Northern Africa <strong>and</strong> Western Asia – the<br />
highest share of any region – identified an inadequately<br />
educated workforce as a major constraint to growth<br />
(Gatti et al., 2013).<br />
TVET is often promoted as a potential solution to youth<br />
unemployment, facilitating school-to-work transition<br />
by providing skills more relevant to the labour market.<br />
However, the evidence is mixed: While some studies<br />
indicate that vocational education increases youth<br />
employment, the consistency of the finding in different<br />
settings <strong>and</strong> over the life course varies (Hanushek et al.,<br />
2011; OECD, 2015b).<br />
There is a limit to the extent countries can educate<br />
themselves out of unemployment. In poorer countries,<br />
high unemployment rates among the educated likely<br />
reflects limited dem<strong>and</strong> for skilled labour, amplified by<br />
56<br />
CHAPTER 2 | PROSPERITY: SUSTAINABLE AND INCLUSIVE ECONOMIES
2<br />
large <strong>and</strong> growing youth populations (ILO, 2015a). In<br />
advanced economies, unemployment has always been<br />
a feature to various degrees; all else being equal, it is<br />
questionable whether educating the unemployed to<br />
minimum st<strong>and</strong>ards would lead to full employment.<br />
So it is important for education interventions to be<br />
accompanied by economic policies that aim to increase<br />
dem<strong>and</strong> for skilled labour.<br />
EDUCATION, ESPECIALLY SECONDARY<br />
AND TERTIARY, CAN ADDRESS PERVASIVE<br />
WORKING POVERTY AND JOB INSTABILITY<br />
This chapter has already described how working <strong>people</strong>’s<br />
earnings often do not allow them to escape poverty.<br />
Almost half of workers in developing regions are in or<br />
near poverty, with considerably higher proportions in low<br />
<strong>and</strong> lower middle income countries (Figure 2.2).<br />
Even higher shares of workers are in ‘vulnerable<br />
employment’: they work on their own account or<br />
with one or more partners, or they are unpaid family<br />
workers. Beyond low income, vulnerable employment is<br />
associated with a lack of social protection <strong>and</strong> unstable<br />
working conditions. It was estimated to account for<br />
45% of global employment in 2014 (ILO, 2015c), <strong>and</strong><br />
75% of workers in sub-Saharan Africa <strong>and</strong> Southern<br />
Asia. Women tend to be over-represented in vulnerable<br />
employment in most regions. Even higher proportions<br />
of workers are estimated to work informally, operating<br />
outside legislative frameworks <strong>and</strong> lacking employment<br />
protection. Evidence suggests that in many low <strong>and</strong><br />
middle income countries, over half of non-agricultural<br />
employment is informal, particularly in sub-Saharan<br />
Africa <strong>and</strong> Southern Asia, as well as many Latin American<br />
countries (ILO, 2013b).<br />
Increasing levels of education are progressively<br />
associated with lower working poverty rates, as<br />
illustrated by analysis of twelve low <strong>and</strong> lower middle<br />
income countries surveyed in the Skills Towards<br />
Employment <strong>and</strong> Productivity (STEP) programme<br />
(Figure 2.4) 9 . Attainment of upper secondary education10<br />
considerably reduces the likelihood of working in<br />
poverty compared to lower levels of education. Indeed,<br />
this advantage appears clear in comparison to lowersecondary<br />
attainment in most countries sampled. Those<br />
with tertiary education are least likely to be working in<br />
poverty, by a substantial margin.<br />
FIGURE 2.4:<br />
Increasing levels of education are associated with lower working poverty<br />
Working poverty (below 50% of median weekly earnings) by education level in 12 low <strong>and</strong> middle income countries<br />
Working poverty (%)<br />
45<br />
40<br />
35<br />
30<br />
25<br />
20<br />
15<br />
10<br />
5<br />
0<br />
Primary or less<br />
Lower secondary<br />
Upper secondary/<br />
post-secondary non-tertiary<br />
Tertiary<br />
Yunnan province<br />
(China)<br />
Kenya<br />
Ukraine*<br />
Viet Nam<br />
TFYR Macedonia*<br />
Sri Lanka<br />
Lao PDR<br />
Armenia*<br />
Bolivia<br />
Ghana<br />
Colombia<br />
Georgia*<br />
Pooled<br />
Notes: Sample is for urban areas. Sample restricted to full-time workers (at least 30 hours per week) aged 15–64. *Levels of education were excluded due to<br />
low number of observations.<br />
Source: GEM Report team calculations based on World Bank STEP Skills Measurement Surveys (2012–2013).<br />
2016 • GLOBAL EDUCATION MONITORING REPORT 57
2<br />
Globally, earnings increase by approximately<br />
10% for each additional year of schooling<br />
“<br />
”<br />
The benefits of upper secondary attainment <strong>and</strong> the<br />
equivalent are even more apparent when examining<br />
other measures of poor working conditions in low<br />
<strong>and</strong> middle income countries (Figure 2.5). Those with<br />
upper secondary education are significantly less likely<br />
than workers with lower secondary to be in vulnerable<br />
employment or to work informally without a contract or<br />
social benefits. This would suggest that upper secondary<br />
education can increase access to more productive<br />
occupations with decent working conditions. For this<br />
to hold true, any future increases in upper secondary<br />
attainment should be accompanied by growing<br />
opportunities in the labour market to productively utilize<br />
these skills.<br />
However, vulnerable <strong>and</strong> informal employment remains<br />
sizeable in the low income countries of the sample,<br />
even among workers with upper secondary education.<br />
In the Plurinational State of Bolivia <strong>and</strong> Colombia,<br />
informality <strong>and</strong> own-account employment remain<br />
relatively widespread even among workers with tertiary<br />
education. Informality is partly driven by efforts to avoid<br />
taxes <strong>and</strong> regulations. But widespread employment in<br />
low productivity small <strong>and</strong> micro-enterprises, largely<br />
reflects limited employment opportunities in larger<br />
formal sector firms (La Porta <strong>and</strong> Shleifer, 2014). Unless<br />
measures are taken to promote the growth of larger,<br />
higher productivity firms (which in addition to offering<br />
better working conditions are more likely to comply with<br />
regulations), the effects of education expansion may be<br />
muted in some countries (Herrera-Idárraga et al., 2015).<br />
However, since vulnerable employment has been growing<br />
in recent years, including in OECD countries (ILO, 2015b;<br />
Jütting <strong>and</strong> Laiglesia, 2009), it is questionable whether<br />
employment can be significantly ‘formalised’ by 2030.<br />
EDUCATION SIGNIFICANTLY INCREASES<br />
EARNINGS AND EMPLOYMENT<br />
Beyond reducing poverty, education has a wellestablished<br />
effect on earnings across the income<br />
distribution. Globally, in 139 countries, the private return 11<br />
per additional year of schooling is 10%. Rates of return<br />
are highest in poorer regions such as sub-Saharan Africa,<br />
FIGURE 2.5:<br />
Upper secondary attainment can substantially lower the risk of vulnerable <strong>and</strong> informal employment<br />
Vulnerable <strong>and</strong> informal employment in urban areas by educational attainment<br />
%<br />
100<br />
90<br />
80<br />
70<br />
60<br />
50<br />
40<br />
30<br />
20<br />
10<br />
0<br />
Vulnerable<br />
employment<br />
Working without<br />
a contract<br />
Working without<br />
social security benefits<br />
Primary or less<br />
Lower secondary<br />
Upper secondary/<br />
post-secondary non-tertiary<br />
Tertiary<br />
Notes: For urban areas of Armenia, the Plurinational State of Bolivia, Colombia, Georgia, Ghana, Kenya, the Lao People’s Democratic Republic, Sri<br />
Lanka, the former Yugoslav Republic of Macedonia, Ukraine, Viet Nam <strong>and</strong> China (Yunnan province). Vulnerable employment is defined as the sum of<br />
own-account workers <strong>and</strong> contributing family workers. Data are for 2012–2013, weighted by population.<br />
Source: GEM Report team calculations based on World Bank STEP Skills Measurement Surveys (2012–2013).<br />
58<br />
CHAPTER 2 | PROSPERITY: SUSTAINABLE AND INCLUSIVE ECONOMIES
2<br />
reflecting the scarcity of skilled workers (Montenegro<br />
<strong>and</strong> Patrinos, 2014).<br />
In recent years, international surveys directly measuring<br />
skills among youth <strong>and</strong> adults have shown that<br />
literacy, numeracy <strong>and</strong> problem-solving abilities have a<br />
significant impact on earnings. For example, in 22 OECD<br />
countries, a st<strong>and</strong>ard deviation increase in literacy <strong>and</strong><br />
numeracy skills is associated with an average increase<br />
in hourly wages of 17% <strong>and</strong> 18%, respectively 12 (Hanushek<br />
et al., 2013). Among urban populations in eight low <strong>and</strong><br />
middle income countries, the increase in hourly earnings<br />
associated with a st<strong>and</strong>ard deviation increase in literacy<br />
scores ranges from 9 percentage points in Ukraine to<br />
about 25 percentage points in Ghana <strong>and</strong> Kenya (Valerio<br />
et al., 2015). 13 In both OECD <strong>and</strong> lower income countries,<br />
returns are highest among prime-age workers (35 to 54),<br />
who presumably are more able to apply their skills in<br />
employment (Chua, 2015; Hanushek et al., 2013).<br />
Differences in returns to literacy skills on earnings<br />
between richer <strong>and</strong> poorer countries suggest their<br />
relative scarcity in the latter. For example, in the<br />
Plurinational State of Bolivia, Ghana <strong>and</strong> Kenya, the<br />
returns to literacy are the highest in the World Bank<br />
STEP Skills Measurement Survey sample, but the literacy<br />
scores are the lowest, with the majority of adults<br />
possessing not even basic literacy skills of at least level 2<br />
(Valerio et al., 2015). Nevertheless, there is considerable<br />
scope to improve literacy even in OECD countries,<br />
where large proportions of adults do not possess more<br />
developed skills above level 2 (OECD, 2015a).<br />
Facilitating employment in higher skill occupations is<br />
an important route through which education increases<br />
earnings. It enables workers to perform a range of<br />
complex tasks inherent to higher skill work. In OECD<br />
economies, workers in managerial, professional <strong>and</strong><br />
technical occupations have, unsurprisingly, the highest<br />
earnings by some margin compared to those in lesser<br />
skilled occupations (De La Rica <strong>and</strong> Gortazar, 2016).<br />
Analysis of STEP survey data shows similar patterns for<br />
the low <strong>and</strong> middle income countries sampled.<br />
However, upper secondary education on its own does<br />
not appear to facilitate access to high skill occupations;<br />
instead tertiary education is likely a necessity. The<br />
education profiles between those in high skill <strong>and</strong> lower<br />
skill work are strikingly different (Figure 2.6). High skill<br />
employment largely remains the preserve of those<br />
FIGURE 2.6:<br />
Tertiary education is largely required for employment in high skill occupations<br />
Occupational skill by educational attainment<br />
%<br />
100<br />
90<br />
80<br />
70<br />
60<br />
50<br />
40<br />
30<br />
20<br />
10<br />
0<br />
High income<br />
Low <strong>and</strong> middle<br />
income<br />
High income<br />
Low <strong>and</strong> middle<br />
income<br />
High income<br />
Low <strong>and</strong> middle<br />
income<br />
High skill occupations Medium skill occupations Low skill occupations<br />
Primary or less Lower secondary Upper-secondary/post-secondary non-tertiary Tertiary<br />
Notes: Low <strong>and</strong> middle income countries are Armenia, the Plurinational State of Bolivia, China (Yunnan province), Colombia, Georgia, Ghana, Kenya,<br />
the Lao People’s Democratic Republic, Sri Lanka, the former Yugoslav Republic of Macedonia, Ukraine <strong>and</strong> Viet Nam. High income countries are<br />
Germany, the Republic of Korea <strong>and</strong> the United States. Data are weighted by sample target population. Only urban areas are covered in low <strong>and</strong><br />
middle income countries. Skilled occupations are classified according to 1 digit ISCO-08 codes, following the ILO Global Employment Trends (GET)<br />
Model Extension (GME) methodology. High skill occupations are those of managers, professionals, technicians <strong>and</strong> associate professionals. Medium<br />
skill workers are clerical support workers, service <strong>and</strong> sales workers, skilled agricultural, forestry <strong>and</strong> fishery workers, craft <strong>and</strong> related trades<br />
workers, plant <strong>and</strong> machine operators <strong>and</strong> assemblers. Low skill workers are those in elementary occupations, such as cleaners, street vendors <strong>and</strong><br />
labourers in mining, construction, manufacturing <strong>and</strong> transport.<br />
Source: GEM Report team calculations based on World Bank STEP Skills Measurement Surveys (2012–2013) <strong>and</strong> OECD PIAAC Survey of Adult Skills.<br />
2016 • GLOBAL EDUCATION MONITORING REPORT 59
2<br />
with tertiary education, while those in medium <strong>and</strong> low<br />
skill jobs are largely educated to the secondary level or<br />
below. 15 These patterns are more or less replicated across<br />
the sample of poorer <strong>and</strong> richer countries, suggesting<br />
that the education segmentation of high <strong>and</strong> medium/<br />
low skill work may be a general feature of economies<br />
regardless of income.<br />
Educational attainment is associated with higher<br />
earnings within occupational categories, however.<br />
Analysis of prime-aged workers in full-time employment<br />
in the STEP countries shows that hourly earnings for<br />
low skill work increase with educational attainment.<br />
Among medium skill workers, educational attainment<br />
is associated with an even greater increase in earnings.<br />
High skill workers with tertiary education also earn<br />
substantially more than those with upper secondary<br />
attainment. On this basis, education expansion should<br />
lead to increases in earnings across all occupational<br />
groups regardless, but to a greater degree if it facilitates<br />
access to higher skill occupations.<br />
The case for exp<strong>and</strong>ing tertiary education in developing<br />
countries is supported by recent evidence on labour<br />
market returns to education. In contrast to earlier<br />
research which found that the return to earnings was<br />
highest for a year of primary schooling, more recent<br />
global estimates show that the private returns to tertiary<br />
education exceed those to both primary <strong>and</strong> secondary<br />
education (Montenegro <strong>and</strong> Patrinos, 2014). This finding<br />
is confirmed in a smaller sample of 25 low <strong>and</strong> middle<br />
income countries (Fink <strong>and</strong> Peet, 2014).<br />
EDUCATION CLOSES GENDER AND<br />
SOCIO-ECONOMIC EMPLOYMENT DISPARITY<br />
In many countries, labour market outcomes are<br />
generally, <strong>and</strong> often significantly, worse among<br />
women <strong>and</strong> those with disadvantaged socio-economic<br />
backgrounds. Among the urban population of STEP<br />
countries, working poverty among women is on average<br />
double that of men, <strong>and</strong> in most countries is significantly<br />
higher for those of low-socio-economic background<br />
compared to more advantaged counterparts. Large<br />
disparities are also found in many OECD countries, such<br />
as Austria, Finl<strong>and</strong>, the Republic of Korea <strong>and</strong> Switzerl<strong>and</strong>,<br />
where the incidence of low pay among women is<br />
more than double that of men (OECD, 2016b). Wages<br />
among those with low socio-economic background are<br />
significantly below more advantaged counterparts in a<br />
majority of OECD countries (OECD, 2015c).<br />
Gender disparity in vulnerable employment <strong>and</strong><br />
informality, however, tends to differ by country <strong>and</strong><br />
region. Among Eastern European <strong>and</strong> Central Asian<br />
countries of the STEP survey, informality is highest<br />
among men, but is higher among women in Latin<br />
American <strong>and</strong> sub-Saharan African countries. 16 In the<br />
majority of countries, workers from disadvantaged<br />
socio-economic backgrounds are more likely to work<br />
informally (Chua, 2015).<br />
Differences in education <strong>and</strong> skills can be a significant<br />
source of disparity among disadvantaged groups.<br />
In STEP countries, workers of low socio-economic<br />
background on average have two years fewer of<br />
education than those from a middle socio-economic<br />
background, <strong>and</strong> three years less than those from a<br />
high background. Literacy skills are also significantly<br />
lower than advantaged socio-economic groups in most<br />
countries (Chua, 2015).<br />
Gender disparity in educational attainment <strong>and</strong> literacy<br />
tends to vary by country. Among urban areas in the<br />
STEP sample, female workers in Eastern Europe <strong>and</strong><br />
Central Asia tend to have both higher educational<br />
attainment <strong>and</strong> literacy levels than their male<br />
counterparts, while the opposite is true in Latin America<br />
<strong>and</strong> sub-Saharan Africa. 17 In Ghana, for example, men<br />
have over two more years of education than women, <strong>and</strong><br />
score over 40 points higher on a 500 point literacy scale.<br />
More broadly, disparities in advanced economies across<br />
the world are lower, with men averaging 0.25 years<br />
more of education, compared to one year more among<br />
developing countries (Barro <strong>and</strong> Lee, 2013). Among the<br />
22 PIAAC countries, differences in literacy between the<br />
genders are marginal, although men have slightly higher<br />
numeracy scores (OECD, 2013).<br />
Given the influence of education <strong>and</strong> skills on labour<br />
market outcomes, closing education disparities can<br />
increase access to decent work among disadvantaged<br />
groups. For the STEP countries, analysis conducted for<br />
this report suggests that if workers from low socioeconomic<br />
backgrounds had the same education as<br />
more advantaged counterparts, disparity in informal<br />
employment between the two groups could shrink<br />
by 37% <strong>and</strong> that in working poverty by 39%. 18 Within<br />
countries where group differences in employment<br />
outcomes are statistically significant, the effect of<br />
equalizing education outcomes is even stronger. In<br />
Colombia, Ghana, Kenya <strong>and</strong> Viet Nam, educational<br />
attainment explains nearly all the disparity in informal<br />
60<br />
CHAPTER 2 | PROSPERITY: SUSTAINABLE AND INCLUSIVE ECONOMIES
2<br />
“<br />
If workers from poor <strong>and</strong> rich backgrounds<br />
received the same education, disparity between<br />
the two in working poverty could shrink by 39%<br />
”<br />
employment between workers from low <strong>and</strong> high<br />
socio-economic backgrounds (Chua, 2015).<br />
In the 22 PIAAC countries, skills account for 83% of the<br />
wage gap between low <strong>and</strong> high socio-economic status<br />
groups, 19 <strong>and</strong> 72% of the gap between foreign <strong>and</strong> nativeborn<br />
workers (OECD, 2015c). This analysis does not,<br />
however, control for educational attainment.<br />
In STEP countries, analysis indicates that literacy does<br />
not have a strong effect on some indicators of decent<br />
work, independent of educational attainment. Here,<br />
differences in literacy explain 16% of the disparity in<br />
informal employment by socioeconomic status, reduced<br />
to 6% when controlling for educational attainment, while<br />
there is no statistically significant impact on disparity in<br />
working poverty (Chua, 2015). 20<br />
Regarding gender, marked differences in labour market<br />
outcomes, such as employment rates <strong>and</strong> wages, tend<br />
to decrease among more highly <strong>and</strong> similarly educated<br />
men <strong>and</strong> women (Ñopo et al., 2012; UNESCO, 2014). In<br />
the OECD, differences in cognitive skills account for<br />
23% of the gender gap in wages (OECD, 2015c). However,<br />
differences in education <strong>and</strong> skills between men <strong>and</strong><br />
women have comparatively limited explanatory power<br />
regarding labour market inequality in the low <strong>and</strong> middle<br />
income STEP countries, where closing gaps in either<br />
educational attainment or literacy would not have a<br />
statistically significant effect on gender disparity in<br />
informal employment <strong>and</strong> working poverty across the<br />
pooled sample (Chua, 2015).<br />
Nevertheless, differences in educational attainment<br />
account for a significant proportion of employment<br />
disparity in the STEP countries where women are<br />
most educationally disadvantaged. Analysis suggests<br />
that equalizing educational attainment would reduce<br />
disparity in informal employment by 50% for Ghana <strong>and</strong><br />
35% for Kenya, with working poverty dropping by 14%<br />
<strong>and</strong> 7%, respectively (Chua, 2015).<br />
Other factors affecting labour market outcomes are<br />
thus likely to have a far larger effect on gender disparity<br />
in many countries. For example, women are more<br />
likely to work in part-time employment due to<br />
child care responsibilities, or enter industries <strong>and</strong><br />
occupations which are less well remunerated.<br />
Cultural norms <strong>and</strong> discrimination also limit the<br />
extent to which well-qualified women can get access<br />
to better-paid occupations <strong>and</strong> rise within work<br />
hierarchies (World Bank, 2011). It is telling that<br />
women in high skill occupations in STEP countries<br />
commonly have equivalent or higher literacy skills<br />
than their male counterparts, yet on average earn<br />
substantially less.<br />
While education <strong>and</strong> skills policies can help reduce<br />
differences in wages between men <strong>and</strong> women, other<br />
policy interventions are required. For example, as<br />
noted above, the poor are often disproportionally<br />
employed in less secure jobs, often in the informal<br />
sector. Hence, they tend to benefit more from labour<br />
market regulations such as minimum wages <strong>and</strong><br />
firing restrictions. Labour market deregulation <strong>and</strong><br />
technological progress thus dampen the income share<br />
of the poor. In this context, while policy has a role in<br />
making education more accessible, it must also ensure<br />
that changes in labour market institutions do not<br />
excessively penalize lower income individuals (Dabla-<br />
Norris et al., 2015).<br />
EDUCATION POLICIES CAN HELP ENSURE<br />
A SOCIALLY INCLUSIVE TRANSITION TO<br />
GREENER ECONOMIES<br />
While green growth offers many opportunities for<br />
exp<strong>and</strong>ing employment, a degree of displacement is<br />
inevitable in environmentally unsustainable industries<br />
(Bowen <strong>and</strong> Kuralbayeva, 2015). Exp<strong>and</strong>ed lifelong<br />
learning policies are needed to promote education <strong>and</strong><br />
training programmes that enable displaced workers to<br />
shift into new jobs without long spells of unemployment<br />
or inactivity.<br />
2016 • GLOBAL EDUCATION MONITORING REPORT 61
2<br />
In many countries, green growth may result in<br />
increased dem<strong>and</strong> for low skill work. While in some<br />
contexts such employment may provide a route out<br />
of poverty, it will not necessarily be decent work. For<br />
example, some waste disposal <strong>and</strong> recycling work is<br />
precarious <strong>and</strong> hazardous, often taking place in the<br />
informal sector (ILO, 2013a). In such cases, national<br />
legislation <strong>and</strong> industrial policies have an important role<br />
in enforcing acceptable working conditions. At the same<br />
time, education policies should equip individuals with<br />
the skills to move into more favourable occupations<br />
considered of higher value to society.<br />
The transition to more environmentally sustainable<br />
economies will also likely increase the dem<strong>and</strong> for high<br />
skill technical, managerial <strong>and</strong> scientific occupations,<br />
potentially increasing wage inequality <strong>and</strong> job<br />
polarization. 21 An analysis of the US labour market<br />
indicates that occupations in green industries are biased<br />
towards higher skills levels than ‘brown’ industries such<br />
as coal <strong>and</strong> other mining, with work disproportionally<br />
made up of higher skill tasks (Vona et al., 2015). Thus, a<br />
concerted effort towards green growth may substantially<br />
increase dem<strong>and</strong> for high skill workers. Unless education<br />
systems adapt to provide the required technical, analytic<br />
<strong>and</strong> managerial skills, wage inequality could increase.<br />
CONCLUSION<br />
Implementing the SDG agenda to 2030 means<br />
reorienting education vis-à-vis a fast-changing world<br />
economy. It means exp<strong>and</strong>ing, interrogating <strong>and</strong><br />
exploiting education’s complex relationship with the<br />
economy. For education to contribute most effectively<br />
to reductions in poverty <strong>and</strong> inequality <strong>and</strong> to better<br />
jobs, investments should be made with careful<br />
consideration of national contexts, <strong>and</strong> in combination<br />
with wider economic <strong>and</strong> social policies.<br />
Education <strong>and</strong> lifelong learning will also play a central<br />
part in the creation of a green <strong>and</strong> inclusive economy<br />
with sustainable models of production <strong>and</strong> consumption,<br />
<strong>and</strong> new <strong>and</strong> retooled sectors, industries <strong>and</strong> jobs. It is<br />
difficult to predict precisely what education can achieve<br />
over the next 15 years, given the uncertainties in the<br />
transition towards sustainable economies <strong>and</strong> major<br />
shifts in the world of work. Yet it is clear that education<br />
will play a critical dual role of addressing poverty <strong>and</strong><br />
inequality while supporting the transition to a new model<br />
of sustainable development.<br />
For this to occur, all stakeholders, from civil society<br />
<strong>and</strong> non-government organizations – often at the<br />
forefront of the fight for sustainability <strong>and</strong> inclusion – to<br />
multilateral organizations, bilateral aid agencies <strong>and</strong> all<br />
levels of government, will need to make concerted efforts<br />
to reorient systems of education, skills development, <strong>and</strong><br />
research <strong>and</strong> innovation.<br />
Education will remain a central component of prosperous<br />
societies. Yet its reorientation <strong>and</strong> transformation<br />
will be necessary to create green industries, to match<br />
the massive changes expected in the labour market<br />
<strong>and</strong> to ensure social inclusion. Whether defined as<br />
knowledge transmission <strong>and</strong> skills formation, as research<br />
<strong>and</strong> innovation, or as social <strong>and</strong> institutional capital,<br />
education will largely determine the ability of countries,<br />
firms <strong>and</strong> citizens to transform the economy.<br />
ENDNOTES<br />
1. The countries <strong>and</strong> regional groupings covered included Australia, Brazil,<br />
China, Germany, Indonesia, Norway, Mauritius, the Republic of Korea, South<br />
Africa <strong>and</strong> the United States, as well as the European Union.<br />
2. It is predicted that the decline in medium skill employment will level off at some<br />
point, as many of these jobs depend on uniquely human interaction. Displaced<br />
medium skill workers can also move into similar level jobs in the same industry.<br />
The impact of automatic teller machines (ATMs) in US banking is illustrative:<br />
While ATM numbers grew substantially, the number of tellers actually increased<br />
slightly as reduced branch costs allowed branches to proliferate <strong>and</strong> tellers<br />
moved into sales <strong>and</strong> ‘relationship banking’ roles (Autor, 2015).<br />
3. The World Bank describes the informal economy as activities <strong>and</strong> income<br />
that are completely or partly outside of government regulation <strong>and</strong> taxation.<br />
4. Bulgaria, the Czech Republic, Estonia, Hungary, Latvia, Lithuania, Pol<strong>and</strong>,<br />
Romania, Slovakia <strong>and</strong> Slovenia.<br />
5. However, the bottom quartile of income distribution would receive an<br />
increased share of income.<br />
6. For example, a society which hypothetically shifted from universal<br />
secondary education (but no more) to universal tertiary education would likely<br />
be more unequal due to the larger variance of wages among those with<br />
tertiary education.<br />
7. Education attainment also acts as a signal of ability to employers, opening<br />
the door to more productive (<strong>and</strong> decent) work irrespective of the actual<br />
knowledge acquired during study.<br />
8. The corresponding unemployment rates were 13.7%, 8.1% <strong>and</strong> 5.3%.<br />
9. Poverty is defined relative to the median as a more comparable measure of<br />
economic contexts.<br />
10. In GEM Report analysis of STEP/PIAAC data, upper secondary <strong>and</strong> postsecondary<br />
non-tertiary programmes are merged into a single category, <strong>and</strong><br />
referred to as ‘upper secondary’ for brevity.<br />
11. Latest available year, including foregone earnings <strong>and</strong> excluding income taxes.<br />
12. The effect of problem-solving abilities is slightly lower at 14.3%.<br />
13. This may underestimate the returns relative to PIAAC countries given that<br />
STEP data for waged workers are after tax <strong>and</strong> transfers, while in PIAAC<br />
countries they are before.<br />
62<br />
CHAPTER 2 | PROSPERITY: SUSTAINABLE AND INCLUSIVE ECONOMIES
2<br />
14. Across the STEP sample, relative to full-time, low skill workers, hourly<br />
earnings are 50% higher among medium skill employees on average, <strong>and</strong><br />
over twice as high among high skill workers. These figures underestimate<br />
productivity, as earnings from self-employment, which tends to be higher<br />
in lower skill occupations, are reported before tax, whereas earnings from<br />
employees are after tax.<br />
15. The value of tertiary education is reinforced by the observation that 65% of<br />
those with tertiary education in the low/middle income countries <strong>and</strong> 74%<br />
in the high income countries had high skill employment, compared with 18%<br />
<strong>and</strong> 25%, respectively, of those with upper secondary education.<br />
16. Informal sector workers are defined here as either wage workers without<br />
social benefits, unpaid family workers or self-employed workers in an<br />
establishment with only one employee.<br />
17. Note that in the developing world, men have on average over a year more of<br />
educational attainment (Barro <strong>and</strong> Lee, 2013).<br />
18. Controlling for experience, gender, literacy <strong>and</strong> country effects.<br />
19. Parental educational attainment is used here as a proxy for socio-economic<br />
status.<br />
20. Relative to educational attainment, skills generally have less (although often<br />
significant) power to explain wages among STEP countries, while in PIAAC<br />
countries the opposite is true (Hanushek et al., 2013; Valerio et al., 2015).<br />
21. Evidence suggests that the onset of a new wave of technological change<br />
initially creates a surge in dem<strong>and</strong> for new skills, which later dissipates as<br />
codification <strong>and</strong> st<strong>and</strong>ardization facilitate diffusion of new best practices.<br />
2016 • GLOBAL EDUCATION MONITORING REPORT 63
Selina Akter, second<br />
year midwifery<br />
student, plays the<br />
role of a mother as<br />
students practise<br />
postnatal care<br />
at the Dinajpur<br />
nursing institute in<br />
Bangladesh.<br />
CREDIT: Nicolas Axelrod/Ruom<br />
64<br />
CHAPTER 3 | PEOPLE: INCLUSIVE SOCIAL DEVELOPMENT
CHAPTER<br />
3<br />
People:<br />
inclusive social<br />
development<br />
We are determined to end poverty <strong>and</strong> hunger, in all<br />
their forms <strong>and</strong> dimensions, <strong>and</strong> to ensure that all<br />
human beings can fulfil their potential in dignity <strong>and</strong><br />
equality <strong>and</strong> in a healthy environment.<br />
– The 2030 Agenda for Sustainable Development<br />
NO<br />
POVERTY<br />
NO ZERO<br />
POVERTY<br />
HUNGER<br />
ZERO GOOD HEALTH<br />
HUNGER<br />
AND WELL-BEING<br />
NO GOOD QUALITY HEALTH<br />
POVERTY<br />
AND EDUCATION<br />
WELL-BEING<br />
ZERO QUALITY<br />
GENDER<br />
HUNGER<br />
EDUCATION<br />
EQUALITY<br />
GOOD GENDER<br />
CLEAN HEALTH<br />
WATER<br />
AND EQUALITY<br />
WELL-BEING<br />
SANITATION<br />
QUALITY<br />
CLEAN WATER<br />
EDUCATION<br />
AND SANITATION<br />
GENDER<br />
EQUALITY<br />
OOD HEALTH<br />
ND WELL-BEING<br />
QUALITY<br />
AFFORDABLE AND<br />
EDUCATION<br />
CLEAN ENERGY<br />
DECENT GENDER<br />
AFFORDABLE WORK AND<br />
ECONOMIC EQUALITY<br />
CLEAN ENERGY GROWTH<br />
INDUSTRY, DECENT CLEAN WATER WORK INNOVATION AND<br />
ECONOMIC AND INFRASTRUCTURE<br />
SANITATION GROWTH<br />
INDUSTRY, AFFORDABLE REDUCED INNOVATION<br />
AND<br />
AND CLEAN INEQUALITIES<br />
INFRASTRUCTURE<br />
ENERGY<br />
DECENT SUSTAINABLE REDUCED WORK CITIES AND<br />
ECONOMIC AND INEQUALITIES<br />
COMMUNITIES<br />
GROWTH<br />
INDUSTRY, SUSTAINABLE RESPONSIBLE INNOVATION<br />
CITIES<br />
AND CONSUMPTION<br />
INFRASTRUCTURE<br />
COMMUNITIES<br />
AND PRODUCTION<br />
RESPONSIBLE<br />
REDUCED<br />
CONSUMPTION<br />
INEQUALITIES<br />
AND PRODUCTION<br />
SUSTAINABL<br />
AND COMMUN<br />
DUSTRY, INNOVATION<br />
D INFRASTRUCTURE<br />
CLIMATE<br />
REDUCED<br />
ACTION<br />
INEQUALITIES<br />
SUSTAINABLE CLIMATE<br />
LIFE<br />
CITIES<br />
AND ACTION<br />
BELOW COMMUNITIES<br />
WATER<br />
RESPONSIBLE<br />
LIFE<br />
CONSUMPTION<br />
BELOW LANDWATER<br />
AND PRODUCTION<br />
CLIMATE<br />
PEACE, LIFE JUSTICE<br />
ACTION<br />
AND LAND STRONG<br />
INSTITUTIONS<br />
PEACE, PARTNERSHIPS<br />
LIFE JUSTICE<br />
AND FOR BELOW THE STRONG WATER GOALS<br />
INSTITUTIONS<br />
PARTNERSHIPS<br />
LIFE<br />
FOR ON LAND THE GOALS<br />
PEACE, JUSTICE<br />
AND STRONG<br />
INSTITUTIONS<br />
65<br />
PARTNERSH<br />
FOR THE GO
3<br />
KEY MESSAGES<br />
Progress in health, nutrition <strong>and</strong> gender equality is<br />
inextricably linked with progress in education.<br />
1<br />
Substantive gender equality is far from being achieved.<br />
a. Gender gaps still exist in pay, work conditions <strong>and</strong> leadership roles, even among similarly qualified<br />
men <strong>and</strong> women.<br />
b. Gender-based violence continues to be a major issue.<br />
2<br />
Millions of <strong>people</strong> – particularly the marginalized – are still denied their right to education.<br />
a. Poverty, gender, location, disability <strong>and</strong> immigrant status all pose barriers to the completion<br />
of basic education of good quality.<br />
3<br />
Education improves health by giving <strong>people</strong> relevant knowledge <strong>and</strong> skills.<br />
a. There is huge potential for delivering health <strong>and</strong> nutrition interventions through schools, which<br />
subsequently also increase school attendance <strong>and</strong> learning.<br />
b. Innovative education programmes can improve sanitation practices.<br />
4<br />
Educating women is at the heart of social development.<br />
a. Gender gaps in education <strong>and</strong> health are key drivers of income inequality in low <strong>and</strong> middle<br />
income countries.<br />
b. Learning to read <strong>and</strong> write helps women challenge practices that perpetuate their low social<br />
status, including by making their participation in politics more likely.<br />
c. Female literacy helps reduce child <strong>and</strong> maternal mortality <strong>and</strong> reduce high fertility levels.<br />
5<br />
Children need to be healthy <strong>and</strong> well-nourished in order to attend school <strong>and</strong> learn.<br />
a. Health <strong>and</strong> nutrition infrastructure can be used to deliver education.<br />
b. Disease causes teacher absenteeism <strong>and</strong> attrition.<br />
c. Access to water, sanitation, hygiene <strong>and</strong> energy have an impact on education outcomes.<br />
5<br />
Education on its own is not enough to achieve equality in society; the health, gender <strong>and</strong> education<br />
sectors must work together.<br />
a. Equal numbers of boys <strong>and</strong> girls in school has not yet resulted in gender-equal societies because<br />
of persistent discrimination.<br />
b. Education needs to work with other sectors to change daily <strong>and</strong> community behaviours.<br />
c. Men <strong>and</strong> women need to be engaged through comprehensive education <strong>and</strong> empowerment<br />
approaches to improve gendered attitudes <strong>and</strong> behaviours.<br />
66<br />
CHAPTER 3 | PEOPLE: INCLUSIVE SOCIAL DEVELOPMENT
3<br />
Inclusive social development is critical for sustainable futures for all............ 67<br />
Education improves social development outcomes..................................................77<br />
Social development influences education.....................................................................84<br />
Integrated social <strong>and</strong> education interventions are needed.................................. 87<br />
Conclusion..................................................................................................................................... 93<br />
broad concept of social development is expressed in<br />
A the 2030 Agenda for Sustainable Development, as<br />
cited above. Social development has also been described<br />
as ‘a process of change that leads to improvements in<br />
human well-being <strong>and</strong> social relations that are equitable<br />
<strong>and</strong> compatible with principles of democratic governance<br />
<strong>and</strong> justice’ (UNRISD, 2015 p. 4).<br />
Achieving sustainable development implies that all<br />
women <strong>and</strong> men, girls <strong>and</strong> boys have access to essential<br />
basic services required for decent, dignified living. It also<br />
implies that <strong>people</strong> can participate in their daily lives <strong>and</strong><br />
relationships free of discrimination <strong>and</strong> disadvantage.<br />
Social development has been achieved for some, but not<br />
for all. Social development needs to be inclusive.<br />
Social development should be not only inclusive, but<br />
also transformative, which means it ‘must involve<br />
changes in social structures, institutions <strong>and</strong> relations,<br />
including patterns of stratification’ (UNRISD, 2015, p. 4).<br />
So, besides improving specific measurable outcomes,<br />
society needs to change legislation, political processes,<br />
<strong>and</strong> social <strong>and</strong> economic policies.<br />
This chapter suggests why inclusive social development<br />
is important <strong>and</strong> assesses progress. It views education as<br />
a key dimension of social development that also enables<br />
other social objectives <strong>and</strong> can transform societies.<br />
Education can equip <strong>people</strong> with knowledge, skills <strong>and</strong><br />
values that help improve social outcomes <strong>and</strong> change<br />
social norms. Moreover, the education sector can improve<br />
how other sectors function. As examples, the chapter<br />
looks at education’s effects on health <strong>and</strong> gender issues.<br />
At the same time, social development has various effects<br />
on education. What is needed, therefore, is integrating<br />
social <strong>and</strong> education interventions, which requires<br />
underst<strong>and</strong>ing how other institutions <strong>and</strong> sectors affect<br />
education, recognizing the limits of education’s role<br />
<strong>and</strong> ensuring integrated commitments <strong>and</strong> actions.<br />
The chapter concludes by examining how participatory,<br />
inclusive approaches can sustain transformation.<br />
INCLUSIVE SOCIAL DEVELOPMENT<br />
IS CRITICAL FOR SUSTAINABLE<br />
FUTURES FOR ALL<br />
To examine whether social development is inclusive<br />
globally, this section analyses service provision, gender<br />
inequality <strong>and</strong> other marginalization.<br />
Ending poverty is not only<br />
about income, but also<br />
concerns critical services<br />
such as education, health,<br />
water, sanitation, energy,<br />
housing <strong>and</strong> transport<br />
Inclusive social<br />
development<br />
requires universal<br />
provision of<br />
services. Ending<br />
poverty is not only<br />
about income,<br />
but also concerns<br />
critical services<br />
such as education,<br />
2016 • GLOBAL EDUCATION MONITORING REPORT 67
3<br />
health, water, sanitation, energy, housing <strong>and</strong> transport.<br />
In addition, assessing if social development is inclusive<br />
requires statistics disaggregated by gender, ethnicity,<br />
location, immigrant <strong>and</strong> refugee status <strong>and</strong> other<br />
context-relevant types of marginality to underst<strong>and</strong><br />
whether these services are available to all.<br />
At the same time, inclusive social development requires<br />
more than providing services. Social structures must be<br />
changed to ensure that all women <strong>and</strong> girls, men <strong>and</strong><br />
boys have a measure of equality between them, <strong>and</strong> that<br />
one’s gender does not adversely affect opportunities in<br />
life <strong>and</strong> work. Gender equality remains elusive but is a<br />
key requirement.<br />
Inequality must be addressed. To achieve inclusive<br />
social development, entrenched marginalization <strong>and</strong><br />
discriminatory attitudes towards women, <strong>people</strong> with<br />
disabilities, indigenous populations, ethnic <strong>and</strong> linguistic<br />
minorities, refugees <strong>and</strong> displaced <strong>people</strong>, among other<br />
vulnerable groups, have to be challenged. Changing<br />
discriminatory norms <strong>and</strong> empowering women <strong>and</strong><br />
men requires improving knowledge <strong>and</strong> influencing<br />
values <strong>and</strong> attitudes.<br />
Lack of clean water, sanitation <strong>and</strong> energy can have a<br />
long-term impact on health. Water-related ailments,<br />
such as diarrhoea, worm infestations <strong>and</strong> dehydration,<br />
result from poor water, sanitation <strong>and</strong> hygiene, <strong>and</strong> are<br />
well documented as key causes of under-5 mortality.<br />
They also have long-term effects on neurological<br />
development, lowering IQ <strong>and</strong> learning performance<br />
(Joshi <strong>and</strong> Amadi, 2013). Extreme consequences of<br />
malnutrition, such as stunting (low height for age), which<br />
also severely affects brain development, are not just a<br />
result of nutrition deficiency but also poor sanitation<br />
<strong>and</strong> hygiene (Chambers <strong>and</strong> Von Medeazza, 2013). High<br />
use of biomass, coal <strong>and</strong> kerosene has dramatic negative<br />
health effects, especially for women <strong>and</strong> children; lower<br />
respiratory infections are a leading cause of under-5<br />
mortality (WHO, 2014).<br />
The Millennium Development Goals (MDGs) emphasized<br />
poverty reduction in poorer countries, so indicators<br />
on education, health, water <strong>and</strong> sanitation, <strong>and</strong> energy<br />
access have been systematically monitored. Data show<br />
progress, with major improvements over 2000–2015 in<br />
primary education enrolment, basic health delivery <strong>and</strong><br />
under-5 mortality rates.<br />
THE WORLD IS FAR FROM UNIVERSAL<br />
PROVISION OF MOST ESSENTIAL SERVICES<br />
The essential services for a dignified life <strong>and</strong> healthy<br />
environment can be defined widely. Income is not the<br />
only necessity to escape poverty. World Development<br />
Report 2004: Making Services Work for Poor People viewed<br />
‘freedom from illiteracy’ <strong>and</strong> ‘freedom from illness’ as key<br />
to escaping poverty, with water, sanitation, transport<br />
<strong>and</strong> energy as important services for achieving good<br />
education <strong>and</strong> health outcomes (World Bank, 2003).<br />
Others have argued for water <strong>and</strong> sanitation, waste<br />
collection <strong>and</strong> management, transport <strong>and</strong> energy as<br />
fundamental needs; as one report notes, ‘Everyone needs<br />
water, a toilet, energy, a way to dispose of household<br />
waste <strong>and</strong> the ability to get from place to place’ (United<br />
Cities <strong>and</strong> Local Governments, 2014 p. 13).<br />
The Sustainable Development Goals (SDGs) contain<br />
ambitious goals <strong>and</strong> targets for universal access to<br />
lifelong learning, health care, good nutrition, water<br />
<strong>and</strong> sanitation, <strong>and</strong> energy (United Nations, 2015a). It is<br />
important to make progress on all these complementary<br />
outcomes at once, as they are interconnected <strong>and</strong><br />
neglecting any of them has compound negative effects.<br />
However, below the global level, basic service provision<br />
varies tremendously. Problems remain particularly<br />
acute in low income countries (Figure 3.1), <strong>and</strong><br />
there is substantial inequality within countries. For<br />
instance, water <strong>and</strong> energy scarcity, conservation<br />
<strong>and</strong> management have become pressing global<br />
environmental, social <strong>and</strong> economic problems, but lack<br />
of access to clean energy <strong>and</strong> sanitation services is<br />
particularly dire in low income countries in Southern<br />
Asia <strong>and</strong> sub-Saharan Africa, in rural areas <strong>and</strong> among<br />
the urban poor (International Energy Agency <strong>and</strong> World<br />
Bank, 2015; WHO <strong>and</strong> UN Water, 2014).<br />
The SDGs on service provision are more ambitious than<br />
those of the MDGs <strong>and</strong> intend to be universally relevant,<br />
not only focused on poorer countries. The vast majority<br />
of the world’s <strong>people</strong><br />
lack access to the kinds<br />
The vast majority of<br />
of services implicit<br />
in SDG targets. For<br />
the world’s <strong>people</strong> lack<br />
example, while access to<br />
access to the kinds of primary education has<br />
basic services implicit<br />
increased tremendously,<br />
the world is far from<br />
in SDG targets<br />
providing all girls <strong>and</strong><br />
boys free, high quality<br />
68<br />
CHAPTER 3 | PEOPLE: INCLUSIVE SOCIAL DEVELOPMENT
3<br />
FIGURE 3.1:<br />
There has been progress in improving basic education <strong>and</strong><br />
health outcomes <strong>and</strong> providing essential basic services,<br />
but major challenges remain<br />
Access to basic services, <strong>and</strong> health <strong>and</strong> education outcome<br />
improvements, 2000 <strong>and</strong> latest year<br />
Gross intake<br />
ratio to the<br />
last grade<br />
of primary<br />
school (%)<br />
Under-5<br />
mortality rate<br />
(per 1,000)<br />
Population<br />
with access<br />
to non-solid<br />
fuel (%)<br />
Population<br />
with access<br />
to electricity<br />
(%)<br />
Population<br />
with access<br />
to improved<br />
water source<br />
(%)<br />
Population<br />
with access<br />
to improved<br />
sanitation<br />
facilities (%)<br />
Low income<br />
Lower middle income<br />
Upper middle income<br />
High income<br />
Low income<br />
Lower middle income<br />
Upper middle income<br />
High income<br />
Low income<br />
Lower middle income<br />
Upper middle income<br />
High income<br />
Low income<br />
Lower middle income<br />
Upper middle income<br />
High income<br />
Low income<br />
Lower middle income<br />
Upper middle income<br />
High income<br />
Low income<br />
Lower middle income<br />
Upper middle income<br />
High income<br />
0<br />
2000<br />
latest year<br />
20 40 60 80 100 120 140 160<br />
Notes: The ‘latest year’ is 2012 for access to non-solid fuels <strong>and</strong> access<br />
to electricity, 2014 for gross intake ratio to the last grade of primary<br />
education, <strong>and</strong> 2015 for under-5 mortality rate <strong>and</strong> access to water <strong>and</strong><br />
sanitation facilities.<br />
Sources: UIS database <strong>and</strong> World Bank (2016).<br />
relationships of well-being they value, without<br />
penalties associated with their gender (Robeyns,<br />
2007; Sen, 1999, 2011).<br />
While the concept of equality between women <strong>and</strong><br />
men was set out in the Universal Declaration of Human<br />
Rights in 1948, SDG 5 still aims to ‘Achieve gender<br />
equality <strong>and</strong> empower all women <strong>and</strong> girls’ by 2030.<br />
Clearly, gender inequality has persisted in all countries,<br />
in a variety of forms, despite the long-st<strong>and</strong>ing<br />
recognition that resolving gender inequality is important<br />
for all other human <strong>and</strong> social development indicators<br />
(Aguirre et al., 2012; Amin et al., 2015; Klasen <strong>and</strong><br />
Lamanna, 2009).<br />
There has been progress. In the past 70 years, myriad<br />
efforts have focused on improving women’s access<br />
to social <strong>and</strong> legal institutions <strong>and</strong> services through<br />
international agreements, such as the Convention on<br />
the Elimination of All Forms of Discrimination Against<br />
Women (CEDAW) in 1979, <strong>and</strong> national reforms, such<br />
as the 2016 ruling in India by the High Court of Delhi<br />
that the eldest woman in a Hindu family can be the<br />
head of the family (Garg, 2016). With more women<br />
in the workforce, an increasing number of countries<br />
have introduced laws <strong>and</strong> policies to equalize women’s<br />
status at work <strong>and</strong> provide maternity leave <strong>and</strong> child<br />
care services (UN Women, 2015). National <strong>and</strong> global<br />
commitment <strong>and</strong> advocacy have led to improvement in<br />
girls’ access to education <strong>and</strong> in reduced gender gaps<br />
(UNESCO, 2015).<br />
secondary education, which is part of just<br />
one of the seven targets under SDG 4 on education<br />
(Chapter 10). Similarly, while health outcomes have<br />
improved, most of the world’s <strong>people</strong> lack access to<br />
universal health coverage <strong>and</strong> to sexual <strong>and</strong> reproductive<br />
health services, which are some of the targets under<br />
SDG 3 on health (WHO, 2016). Nor is the availability<br />
of services the only issue; access to them <strong>and</strong><br />
who benefits from them are equally important, <strong>and</strong><br />
affected by diverse factors.<br />
SUBSTANTIVE GENDER EQUALITY<br />
REMAINS ELUSIVE<br />
Inclusive social development means access not only to<br />
services, but also to participation in processes, along<br />
with freedom from discrimination. 1 For gender equality,<br />
individuals <strong>and</strong> groups should have equal opportunity<br />
to choose <strong>and</strong> realize the actions, attributes <strong>and</strong><br />
Nevertheless, participation in key economic, political<br />
<strong>and</strong> social activities remains highly gendered. Men <strong>and</strong><br />
women work in different sectors, with unequal pay <strong>and</strong><br />
work conditions. Significant pay gaps exist between<br />
men <strong>and</strong> women doing the same job in virtually all<br />
occupations (UN Women, 2015). Within institutions,<br />
women face difficulty in moving to more senior positions<br />
(the ‘glass ceiling’) <strong>and</strong> are over-represented in low paid,<br />
insecure <strong>and</strong> low status positions (ILO, 2012). Women in<br />
many countries do at least twice as much unpaid work<br />
as men, <strong>and</strong> work longer hours than men if paid <strong>and</strong><br />
unpaid work is combined (UN Women, 2015). Women<br />
disproportionately work in the informal economy in<br />
countries with high informality, <strong>and</strong> in the agricultural<br />
workforce without l<strong>and</strong> <strong>and</strong> asset ownership (UN<br />
Women, 2015) (Figure 3.2).<br />
Analysis of occupation <strong>and</strong> education trends shows<br />
that men <strong>and</strong> women continue to be concentrated in<br />
2016 • GLOBAL EDUCATION MONITORING REPORT 69
3<br />
FIGURE 3.2:<br />
Women do more unpaid work than men, <strong>and</strong> often are more likely to be employed in the informal sector<br />
a. Time spent on unpaid work by men <strong>and</strong> women b. Men’s <strong>and</strong> women’s share of informal work in total employment<br />
400<br />
100<br />
Unpaid work by men (number of minutes)<br />
350<br />
300<br />
250<br />
200<br />
150<br />
100<br />
50<br />
0<br />
0<br />
Men do more unpaid<br />
work than women<br />
Ug<strong>and</strong>a<br />
Sweden<br />
Women do 1 to<br />
2 times as much<br />
unpaid work<br />
Mexico<br />
Women do more<br />
Italy<br />
than twice as<br />
much unpaid work<br />
Japan<br />
Pakistan<br />
50 100 150 200 250 300 350 400<br />
Men in informal employment (%)<br />
90<br />
80<br />
70<br />
60<br />
50<br />
40<br />
30<br />
20<br />
10<br />
0<br />
0<br />
A greater share of men are<br />
in informal employment<br />
than women<br />
Armenia<br />
A greater share of<br />
women are in informal<br />
employment than men<br />
10 20 30 40 50 60 70 80<br />
Bolivia<br />
Liberia<br />
90 100<br />
Unpaid work by women (number of minutes)<br />
Women in informal employment (%)<br />
Notes: Data for Figure 3.2a range from 1999 to 2013. Data for Figure 3.2b range from 2004 to 2010.<br />
Sources: ILO <strong>and</strong> WIEGO (2014); United Nations (2015b).<br />
FIGURE 3.3:<br />
Men <strong>and</strong> women work in different formal occupations<br />
Female share of total professionals in information <strong>and</strong> communication<br />
technology (ICT) <strong>and</strong> in teaching<br />
100<br />
Female share of total ICT professionals<br />
90<br />
80<br />
70<br />
60<br />
50<br />
40<br />
30<br />
20<br />
10<br />
0<br />
0<br />
Liberia<br />
Cambodia<br />
Algeria<br />
Switzerl<strong>and</strong><br />
10 20 30 40 50 60 70 80<br />
Female shares of total teaching professionals<br />
Note: Latest year of available data ranges from 2009 to 2014.<br />
Source: ILO (2016a).<br />
Estonia<br />
90 100<br />
different labour market sectors, often with different<br />
levels of status, pay <strong>and</strong> security (Figure 3.3). Figures<br />
from the International Labour Organization (ILO) show<br />
such occupational segregation decreasing until the<br />
1990s, but rising since then (ILO, 2012, 2016c). Even<br />
in the Organisation for Economic Co-operation <strong>and</strong><br />
Development (OECD) countries, where gender parity in<br />
education was achieved decades ago, only 14% of women<br />
entering higher education for the first time in 2012 chose<br />
science-related fields, compared to 39% of men. Girls<br />
are much less likely than boys to consider a career in<br />
computing or engineering, which are key sectors in the<br />
knowledge economy (OECD, 2015).<br />
Relatively few women are in political <strong>and</strong> other<br />
leadership positions (Figure 3.4). Only 20% of members<br />
of lower or single legislative bodies, 19% of heads of<br />
state or government <strong>and</strong> 18% of ministers are women<br />
(in the last case, usually assigned to social issues). The<br />
gender balance of private company executive boards<br />
is even further from parity. Among 43 countries with<br />
data, women hold over 25% of the seats on executive<br />
boards nowhere but in Finl<strong>and</strong>, Norway <strong>and</strong> Sweden;<br />
the share is below 2% in 8 countries from Western Asia<br />
<strong>and</strong> Eastern Asia (United Nations, 2015b). Women are<br />
often absent from decision-making in cultural <strong>and</strong><br />
70<br />
CHAPTER 3 | PEOPLE: INCLUSIVE SOCIAL DEVELOPMENT
3<br />
FIGURE 3.4:<br />
Few women hold leadership positions in corporations <strong>and</strong> governments in middle <strong>and</strong> high income countries<br />
Percentage of women on executive boards <strong>and</strong> legislative bodies<br />
50<br />
45<br />
40<br />
35<br />
Executive boards<br />
Legislative bodies<br />
Percentage of women<br />
30<br />
25<br />
20<br />
15<br />
10<br />
5<br />
0<br />
Qatar<br />
Oman<br />
Kuwait<br />
Thail<strong>and</strong><br />
Bahrain<br />
Brazil<br />
Japan<br />
Malaysia<br />
India<br />
Russian Fed.<br />
Turkey<br />
Chile<br />
Rep. of Korea<br />
Irel<strong>and</strong><br />
Indonesia<br />
U. A. Emirates<br />
United States<br />
Saudi Arabia<br />
Israel<br />
United Kingdom<br />
Greece<br />
China<br />
Pol<strong>and</strong><br />
Canada<br />
Singapore<br />
France<br />
Australia<br />
Switzerl<strong>and</strong><br />
Austria<br />
Italy<br />
Portugal<br />
New Zeal<strong>and</strong><br />
Gemany<br />
Netherl<strong>and</strong>s<br />
Mexico<br />
Denmark<br />
Belgium<br />
Norway<br />
Spain<br />
South Africa<br />
Finl<strong>and</strong><br />
Sweden<br />
Note: Data for female share in parliament are from 2015. Data for female share in executive boards comes from sources between 2010 <strong>and</strong> 2014.<br />
Source: United Nations (2015b).<br />
social organizations, including those of major religions<br />
(Domingo et al., 2015). Formal requirements for women’s<br />
representation in local government, such as reservation<br />
schemes in India <strong>and</strong> municipal representation in<br />
South Africa, may increase women’s visibility <strong>and</strong><br />
some economic outcomes (Deininger et al., 2011), but<br />
their impact on underlying power dynamics is unclear<br />
(Beall, 2010).<br />
Gender-based violence is a significant global issue.<br />
Recent conflict, instability <strong>and</strong> migration have been<br />
associated with particularly high levels of sexual <strong>and</strong><br />
gender-based violence. In many countries, social media<br />
are creating new spaces for sexual harassment (Parkes<br />
<strong>and</strong> Unterhalter, 2015). Around one-third of women<br />
worldwide have experienced physical <strong>and</strong>/or sexual<br />
violence from an intimate partner, or sexual violence<br />
by a non-partner, at some point in their lives; in most<br />
countries less than 40% of them sought help at any point<br />
(United Nations, 2015b).<br />
Due to a combination of biological <strong>and</strong> social factors,<br />
many health challenges have a gendered dimension.<br />
In low income countries, a woman living in a rural<br />
area is 38% less likely to give birth with a skilled health<br />
professional than her urban counterpart (UN Women,<br />
2015). In some countries, limited reproductive rights<br />
mean that maternal conditions <strong>and</strong> AIDS are the leading<br />
causes of death for young women; the right to abortion<br />
is selectively available <strong>and</strong> frequently challenged,<br />
including in the United States. More than 200 million<br />
girls <strong>and</strong> women alive today have been subject to female<br />
genital mutilation (UNICEF, 2016). Men, meanwhile,<br />
experience a higher burden of disease <strong>and</strong> have higher<br />
risk behaviour <strong>and</strong> lower life expectancy than women<br />
(Hawkes <strong>and</strong> Buse, 2013).<br />
Legal rights for women have not translated into gender<br />
equality. Therefore, to clarify the issue <strong>and</strong> motivate<br />
responses, UN Women has defined ‘substantive equality<br />
for women’ as encompassing ‘three interconnected<br />
dimensions along which actions need to be taken’<br />
to develop real equality: redressing women’s socioeconomic<br />
disadvantage, addressing stereotyping, stigma<br />
<strong>and</strong> violence, <strong>and</strong> strengthening agency, voice <strong>and</strong><br />
participation (UN Women, 2015). A holistic approach is<br />
2016 • GLOBAL EDUCATION MONITORING REPORT 71
3<br />
called for. Women’s empowerment <strong>and</strong> overall economic<br />
development are strongly interrelated (Duflo, 2012). Legal<br />
reforms complemented by economic <strong>and</strong> social policies<br />
are needed to undo past inequality <strong>and</strong> create conditions<br />
in which women’s rights are respected <strong>and</strong> much more<br />
equitable conditions supported.<br />
Finally, to address gender inequality, critics advocate a<br />
more nuanced, holistic underst<strong>and</strong>ing of the concept of<br />
gender in which, for example, ‘gender’ is not equivalent to<br />
‘girls <strong>and</strong> women’ but it is understood that unequal gender<br />
relations <strong>and</strong> gendered preconceptions also harm men <strong>and</strong><br />
boys, <strong>and</strong> that the involvement of men <strong>and</strong> boys is integral<br />
to improving gender-related power relations (Edström<br />
et al., 2015). At the same time, efforts to remedy gender<br />
imbalances need to recognize how societies create <strong>and</strong><br />
enforce notions of gender, <strong>and</strong> how power relations <strong>and</strong><br />
conceptions of feminine <strong>and</strong> masculine roles translate to<br />
institutional practices <strong>and</strong> norms (Connell, 2009).<br />
Indigenous populations are often among the most<br />
disadvantaged groups. A global analysis of key education,<br />
health <strong>and</strong> poverty indicators of populations who<br />
met literature-based ethnic or linguistic definitions of<br />
indigeneity found that for nomadic or semi-nomadic<br />
pastoralists in Africa, education indicators were much<br />
worse than the national average, <strong>and</strong> the education<br />
gap was much higher than gaps in health <strong>and</strong> other<br />
indicators. In Latin America, stunting, water deprivation<br />
<strong>and</strong> primary enrolment rates were worse among<br />
indigenous populations. In some countries in Asia, the<br />
well-being of some indigenous groups was found to lag<br />
behind national averages, while others performed just as<br />
well on multiple indicators (Macdonald, 2012). Yet despite<br />
vulnerability based on socio-economic status <strong>and</strong> health<br />
outcomes, many indigenous communities maintain<br />
lifestyles <strong>and</strong> engage in practices that contribute to the<br />
sustainability aspirations of the new SDG agenda (see<br />
Chapter 1: Planet).<br />
VULNERABLE POPULATIONS REMAIN ON<br />
THE MARGINS OF SOCIETY AND LACK EQUAL<br />
ACCESS TO SOCIO-ECONOMIC OPPORTUNITY<br />
Inequality is the result of both income disparity (see<br />
Chapter 2: Prosperity) <strong>and</strong> the marginalization of groups<br />
that experience intersecting disadvantages relating<br />
to factors such as poverty, ethnicity, gender, disability<br />
<strong>and</strong> location.<br />
For instance, <strong>people</strong> with disabilities are significantly<br />
more likely to be poor <strong>and</strong> less likely to be employed.<br />
An analysis of 15 lower<br />
income countries in<br />
Asia, Latin America<br />
People with disabilities<br />
<strong>and</strong> Africa using<br />
are significantly<br />
2002–2003 data found<br />
more likely to be poor that in a majority of the<br />
countries, disability was<br />
<strong>and</strong> less likely to be<br />
significantly associated<br />
employed<br />
with lack of primary<br />
school completion<br />
<strong>and</strong> employment, <strong>and</strong><br />
higher health expenditure (Mitra et al., 2013). Also with<br />
regards to health, for example, a qualitative analysis of<br />
the experience of pregnancy among disabled women<br />
in Nepal suggested a need to improve health worker<br />
training; health workers felt unprepared to meet the<br />
needs of disabled married women who were pregnant or<br />
considering pregnancy (Morrison et al., 2014).<br />
Caste <strong>and</strong> religious minority status continue to determine<br />
disadvantage on various indicators of health, inequality,<br />
poverty, education, employment, wages, gender<br />
empowerment <strong>and</strong> access to public goods. For example,<br />
in India higher caste Hindu households hold distinct<br />
advantages in these areas over scheduled caste, scheduled<br />
tribe <strong>and</strong> Muslim households (Borooah et al., 2015).<br />
Many other large subgroups remain at the fringe of<br />
society <strong>and</strong> legality, such as child labourers <strong>and</strong> orphans,<br />
<strong>and</strong> the growing numbers of refugees <strong>and</strong> forcibly<br />
displaced populations affected by conflict <strong>and</strong> climate<br />
change (see Chapters 4: Peace <strong>and</strong> 5: Place). Moreover, the<br />
extent of marginalization may be underestimated: some<br />
recent studies suggest that 250 million to 350 million<br />
<strong>people</strong> may be missing from global estimates because<br />
they are undercounted or omitted from household<br />
surveys (Carr-Hill, 2013; Villegas <strong>and</strong> Samman, 2015).<br />
The extent of persistent discrimination by race,<br />
religion <strong>and</strong> ethnicity is confirmed by a growing body<br />
of field experiments. In some studies, real or fictitious<br />
individuals are matched on all relevant characteristics<br />
except those presumed to lead to discrimination, such<br />
as race, ethnicity <strong>and</strong> gender. How they fare in job or<br />
housing applications or purchases of goods is then<br />
compared. A seminal field experiment in the United<br />
States found that white c<strong>and</strong>idates were called back far<br />
more than black c<strong>and</strong>idates with otherwise identical<br />
CVs, <strong>and</strong> that the better the CVs, the more the race gap<br />
widened (Bertr<strong>and</strong> <strong>and</strong> Mullainathan, 2004). Evidence<br />
72<br />
CHAPTER 3 | PEOPLE: INCLUSIVE SOCIAL DEVELOPMENT
3<br />
from India suggests that formal education for Dalit<br />
populations has not led to commensurate increases<br />
in life chances, due to severe economic discrimination<br />
(Thorat <strong>and</strong> Neuman, 2007). In a range of countries in<br />
Eastern <strong>and</strong> South-eastern Asia, Europe, Latin America<br />
<strong>and</strong> the Caribbean, the Pacific <strong>and</strong> Southern Asia, there<br />
is consistent evidence of discrimination based on race<br />
or ethnicity affecting <strong>people</strong>’s labour market outcomes<br />
(Bertr<strong>and</strong> <strong>and</strong> Duflo, 2016).<br />
WHO ARE THE MOST MARGINALIZED<br />
IN EDUCATION?<br />
The discussion above outlines the scale of the challenge<br />
to provide universal services, achieve gender equality<br />
<strong>and</strong> address discrimination against marginalized groups.<br />
This section describes marginalization in education,<br />
identifies the most marginalized groups, defines barriers<br />
to inclusive social development <strong>and</strong> shows who must be<br />
reached to achieve it.<br />
Access to education is a powerful means of<br />
mitigating disadvantage, ending poverty <strong>and</strong><br />
reducing inequality, which are core goals of the SDG<br />
agenda. However, many overlapping disadvantages<br />
limit education outcomes as a result of serious<br />
marginalization <strong>and</strong> inequality (UNESCO, 2010). As<br />
the Education for All Global Monitoring Reports (GMRs)<br />
point out, the groups most marginalized in terms of<br />
education access <strong>and</strong> quality vary substantially; they<br />
include racial, ethnic <strong>and</strong> linguistic minorities, <strong>people</strong><br />
with disabilities, pastoralists, slum dwellers, children<br />
with HIV, ‘unregistered’ children, <strong>and</strong> orphans (UNESCO,<br />
2010, 2015). Improved data <strong>and</strong> monitoring efforts are<br />
needed to better identify marginalized children, youth<br />
<strong>and</strong> adults <strong>and</strong> to develop policy solutions to combat<br />
marginalization (see Chapter 14: Equity).<br />
Universal access to primary <strong>and</strong> secondary education<br />
implies leaving no one behind, including members of<br />
marginalized groups (see<br />
Chapter 10). In the school<br />
year ending in 2014,<br />
In 2014, nearly 61<br />
nearly 61 million children<br />
million children of of primary school age <strong>and</strong><br />
primary school age 202 million adolescents<br />
of secondary school<br />
<strong>and</strong> 202 million<br />
age were out of school.<br />
adolescents of<br />
In addition, country<br />
secondary school age commitments to halve<br />
adult illiteracy levels by<br />
were out of school<br />
2015 remain unfulfilled<br />
despite much progress.<br />
Worldwide, some 758 million adults, 63% of them women,<br />
have not attained even minimal literacy skills.<br />
Within countries <strong>and</strong> at all levels of development,<br />
education marginalization is most acute among<br />
disadvantaged subpopulations – distinguished typically<br />
by wealth, gender, ethnicity <strong>and</strong> migration status – who<br />
face persistently low educational opportunities <strong>and</strong><br />
poor quality provision. Even as countries make overall<br />
progress on various education outcomes, such groups<br />
are much more likely to be left behind.<br />
Poverty continues to be the largest determinant of<br />
education deprivation <strong>and</strong> inequality. For example, based<br />
on GEM Report team calculations, among youth aged<br />
20 to 24 in 101 low <strong>and</strong> middle income countries, those in<br />
the poorest quintile average 5 fewer years of schooling<br />
than those in the richest quintile, compared with a<br />
2.6 year difference between those from rural <strong>and</strong> urban<br />
locations, <strong>and</strong> a 1.1 year difference between females<br />
<strong>and</strong> males.<br />
However, different characteristics tend to overlap <strong>and</strong><br />
compound deprivation. For example, females from poor,<br />
ethnically or spatially marginalized backgrounds often<br />
fare substantially worse than their male counterparts,<br />
<strong>and</strong> gender gaps in disadvantaged groups may be larger<br />
than in more advantaged groups. In all aspects of lifelong<br />
learning – access <strong>and</strong> completion of formal education,<br />
post-school training <strong>and</strong> adult education – gender<br />
compounds disadvantages related to socio-economic<br />
status, ethnicity, location, religion, sexuality, disability,<br />
age <strong>and</strong> race (Kabeer, 2015). For example, the UN has<br />
identified poverty <strong>and</strong> location as the factors most<br />
likely to determine whether girls participate in school<br />
(UN Women, 2014). And in Latin America, illiteracy<br />
rates among indigenous women are often more than<br />
double those of non-indigenous women (Vinding <strong>and</strong><br />
Kampbel, 2012).<br />
Wide disparity in educational attainment is clearly<br />
evident where wealth <strong>and</strong> gender intersect. GEM<br />
Report team calculations show that in almost every<br />
country, but particularly those with low average<br />
educational attainment, youth in the richest quintile<br />
have substantially more years of education than those<br />
in the poorest quintile. Extreme disparity in attainment<br />
is found in countries including Nigeria <strong>and</strong> Pakistan,<br />
where the wealthiest quintiles have more than 8 years<br />
more than the poorest. Education disparity between rich<br />
<strong>and</strong> poor tends to decrease in richer countries, but often<br />
remains significant. In Argentina, an example of a high<br />
income country, the wealthiest have three more years<br />
2016 • GLOBAL EDUCATION MONITORING REPORT 73
3<br />
FIGURE 3.5:<br />
There are large disparities within countries in educational attainment by wealth <strong>and</strong> gender<br />
Years of schooling attained in low <strong>and</strong> middle income countries by 20- to 24-year-olds, selected countries<br />
16<br />
14<br />
12<br />
Years of schooling<br />
10<br />
8<br />
6<br />
4<br />
2<br />
0<br />
Niger 2012<br />
South Sudan 2010<br />
Burkina Faso 2010<br />
Afghanistan 2010<br />
Mali 2012<br />
Chad 2010<br />
Senegal 2010<br />
Madagascar 2008<br />
Burundi 2010<br />
Ethiopia 2011<br />
C. A. R. 2010<br />
Côte d’Ivoire 2011<br />
Rw<strong>and</strong>a 2010<br />
Guinea 2012<br />
Sudan 2010<br />
Benin 2011<br />
Sierra Leone 2013<br />
Mozambique 2011<br />
Mauritania 2011<br />
S. Tome/Principe 2008<br />
Morocco 2009<br />
Bangladesh 2011<br />
Gambia 2013<br />
Djibouti 2006<br />
Ug<strong>and</strong>a 2011<br />
India 2005<br />
Togo 2013<br />
Guatemala 2011<br />
Lao PDR 2011<br />
Nigeria 2013<br />
Haiti 2012<br />
D. R. Congo 2013<br />
Timor-Leste 2009<br />
Comoros 2012<br />
Nicaragua 2009<br />
Belize 2011<br />
Syrian A.R. 2006<br />
Congo 2011<br />
Zambia 2013<br />
Viet Nam 2010<br />
Ghana 2011<br />
Kenya 2008<br />
Swazil<strong>and</strong> 2010<br />
Suriname 2010<br />
Gabon 2012<br />
Namibia 2013<br />
Zimbabwe 2014<br />
Guyana 2009<br />
Brazil 2011<br />
Maldives 2009<br />
Costa Rica 2011<br />
Colombia 2010<br />
Indonesia 2012<br />
South Africa 2013<br />
Philippines 2013<br />
Dominican Rep. 2013<br />
Tajikistan 2012<br />
Albania 2008<br />
Bolivia 2008<br />
Mexico 2010<br />
Tunisia 2011<br />
Peru 2012<br />
Richest males<br />
Richest females Average Poorest females Poorest males<br />
Note: Data range from 2005 to 2014.<br />
Source: GEM Report team analysis (2016) based on Demographic <strong>and</strong> Health Survey, Multiple Indicator Cluster Survey <strong>and</strong> national household survey data.<br />
of education than the poorest, on average. Large gaps in<br />
other education outcomes exist in OECD countries. In a<br />
sample of 24 countries, the average difference in adult<br />
literacy skills between low <strong>and</strong> high socio-economic<br />
backgrounds is 15.7%, <strong>and</strong> in the United States it is 24.5%<br />
(OECD, 2014a).<br />
Disparities in wealth are often magnified by gender<br />
(Figure 3.5). The poorest females are the worst off in<br />
the majority of countries, often substantially so in<br />
comparison to the poorest males. In countries including<br />
Afghanistan, Benin, Chad, Ethiopia, Guinea, <strong>and</strong> South<br />
Sudan, the poorest female youth have attained less<br />
than a single year of schooling, on average, compared to<br />
about two years or more for the poorest males.<br />
Disadvantage, however, is not uniformly against girls<br />
<strong>and</strong> women. Males attain fewer years of education on<br />
average than females in many countries in the Caribbean<br />
<strong>and</strong> in Europe <strong>and</strong> Northern America, where average<br />
years of schooling are relatively high. The poorest boys<br />
have less schooling than the poorest girls in almost twothirds<br />
of the countries where average attainment is at<br />
least 9 years, compared to just 6 out of the 57 countries<br />
with an average of less than 9 years.<br />
Overlapping disparity in youth literacy between <strong>and</strong><br />
within urban <strong>and</strong> rural populations is also evident. Youth<br />
in rural areas generally have significantly lower levels of<br />
literacy than urban youth (Figure 3.6). Poor rural female<br />
youth tend to have significantly lower literacy rates in<br />
relation not only to the rural average, but also to their<br />
male counterparts. In the majority of countries with<br />
available data, less than half of poor rural females have<br />
basic literacy skills. In some countries, including Burkina<br />
Faso, Guinea, Mali <strong>and</strong> Nigeria, less than 10% can read;<br />
in Niger, the rate is 2%. Literacy rates of the poorest<br />
rural males, by contrast, are much closer to the rural<br />
average. In Pakistan, for example, the literacy rate of<br />
poor rural males is 64%, compared to 14% for their female<br />
counterparts. Very large gaps can also be observed<br />
in Cameroon, Congo, the Democratic Republic of the<br />
Congo, Liberia, Sierra Leone <strong>and</strong> Togo.<br />
74<br />
CHAPTER 3 | PEOPLE: INCLUSIVE SOCIAL DEVELOPMENT
3<br />
FIGURE 3.6:<br />
Many rural areas have low levels of literacy, particularly among poor females<br />
Youth literacy (ages 15 to 24) by location, gender <strong>and</strong> wealth<br />
Youth literacy rate (%)<br />
100<br />
90<br />
80<br />
70<br />
60<br />
50<br />
40<br />
30<br />
20<br />
10<br />
0<br />
Niger<br />
Guinea<br />
Burkina Faso<br />
Nigeria<br />
Mali<br />
Mozambique<br />
Senegal<br />
Pakistan<br />
Cameroon<br />
Benin<br />
Ethiopia<br />
Liberia<br />
Sierra Leone<br />
Ug<strong>and</strong>a<br />
Togo<br />
Gambia<br />
Comoros<br />
Zambia<br />
Bangladesh<br />
Cambodia<br />
D. R. Congo<br />
Burundi<br />
U. R. Tanzania<br />
Malawi<br />
Congo<br />
Haiti<br />
Nepal<br />
Rw<strong>and</strong>a<br />
Gabon<br />
Dominican Rep.<br />
Honduras<br />
Namibia<br />
Indonesia<br />
Armenia<br />
Kyrgyzstan<br />
Egypt 2014<br />
Azerbaijan 2006<br />
Mongolia 2010<br />
China 2009<br />
Ecuador 2013<br />
Jamaica 2011<br />
Jordan 2012<br />
Trinidad/Tobago 2006<br />
Argentina 2012<br />
Armenia 2010<br />
Rep. Moldova 2012<br />
Barbados 2012<br />
Thail<strong>and</strong> 2005<br />
Palestine 2010<br />
Bosnia/Herzeg. 2011<br />
Kyrgyzstan 2012<br />
TFYR Macedonia 2011<br />
Montenegro 2013<br />
Serbia 2014<br />
Belarus 2012<br />
Chile 2011<br />
Kazakhstan 2010<br />
Georgia 2005<br />
Ukraine 2012<br />
In many countries, particular regions or ethnic groups<br />
may face significant education disadvantage relative to<br />
the population as a whole. Young adults in the Extreme<br />
North region of Cameroon <strong>and</strong> Karamoja region of Ug<strong>and</strong>a<br />
have less than half the national average for educational<br />
attainment. In the Alibori department of Benin, they have<br />
1.5 years of schooling, on average – less than one-third of<br />
the national average (Figure 3.7). Gaps are also often evident<br />
according to ethnicity. In Serbia, the Roma population<br />
has less than half the national average, as do the Hausa<br />
in the Central African Republic.<br />
Within disadvantaged regions <strong>and</strong> ethnic groups, malefemale<br />
disparity also tends to be comparatively greater.<br />
In Cameroon, where young adults in the Extreme North<br />
average 3.2 years of education, young women have<br />
less than half the attainment of young men, compared<br />
to a gender parity ratio of 0.8 at the national level.<br />
In Serbia, young Roma women have two-thirds the<br />
educational attainment of their male counterparts,<br />
while at the national level, young women on average<br />
Urban Rural Poorest rural females Poorest rural males<br />
Note: Data range from 2010 to 2014.<br />
Source: GEM Report team analysis (2016) based on Demographic <strong>and</strong> Health Survey, Multiple<br />
Indicator Cluster Survey <strong>and</strong> national household survey data.<br />
have more education than men. But gender disparity<br />
against women among marginalized regional <strong>and</strong> ethnic<br />
populations is not always found. In Brazil, for example,<br />
indigenous young men have less attainment than their<br />
female counterparts, reflecting national patterns.<br />
Disparities in educational attainment <strong>and</strong> performance<br />
by income, race, ethnicity <strong>and</strong> immigrant status are also<br />
prevalent in higher income countries. For instance, in a<br />
sample of 24 OECD countries, literacy skills of foreignborn<br />
adults were 10% lower, on average, than those of<br />
the native born, <strong>and</strong> as much as 18% lower in Finl<strong>and</strong> <strong>and</strong><br />
Sweden (OECD, 2014a).<br />
An extensive analysis of low performing students from the<br />
2012 Programme for International Student Assessment<br />
(PISA) in OECD countries finds that ‘a socio-economically<br />
disadvantaged girl who lives in a single-parent family in a<br />
rural area, has an immigrant background, speaks a different<br />
language at home from the language of instruction, had<br />
not attended pre-primary school, had repeated a grade,<br />
<strong>and</strong> is enrolled in a vocational track has an 83% probability<br />
of being a low performer’ (OECD, 2016a, pp. 13-14). Boys<br />
were found to be more likely to be less engaged, repeat<br />
classes <strong>and</strong> get lower grades while girls were found<br />
to be less likely to believe that they will do well on<br />
mathematics <strong>and</strong> science tasks.<br />
2016 • GLOBAL EDUCATION MONITORING REPORT 75
3<br />
FIGURE 3.7:<br />
Education marginalization is compounded on ethnic <strong>and</strong> regional lines, particularly for women<br />
Years of schooling among young adults (ages 20 to 24) <strong>and</strong> gender parity index (GPI)<br />
14<br />
1.4<br />
12<br />
1.2<br />
10<br />
1.0<br />
Years of schooling<br />
8<br />
6<br />
0.8<br />
0.6<br />
Gender parity index<br />
4<br />
0.4<br />
2<br />
Saravane<br />
Karamoja<br />
Extreme North<br />
Alibori<br />
North West<br />
Roma<br />
Gruma<br />
Hausa<br />
Q’eqchi<br />
Indigenous<br />
0.2<br />
0<br />
Lao PDR<br />
2011<br />
Ug<strong>and</strong>a<br />
2011<br />
Cameroon<br />
2011<br />
Region<br />
Benin<br />
2011<br />
Nigeria<br />
2013<br />
Serbia<br />
2014<br />
Ghana<br />
2011<br />
C. A. R.<br />
2010<br />
Ethnicity<br />
Guatemala<br />
2011<br />
Brazil<br />
2011<br />
0.0<br />
National<br />
Group National GPI Group GPI<br />
Note: A GPI below 0.97 denotes disparity at the expense of females while one above 1.03 denotes disparity at the expense of males.<br />
Source: GEM Report team analysis (2016) based on Demographic <strong>and</strong> Health Survey, Multiple Indicator Cluster Survey <strong>and</strong> national household<br />
survey data.<br />
The proportion of students who come from immigrant<br />
backgrounds varies considerably across OECD countries,<br />
but in 32 of 57 countries <strong>and</strong> economies, low performers<br />
in mathematics are a higher share of immigrant<br />
students than of non-immigrants. In other countries,<br />
including Qatar <strong>and</strong> the United Arab Emirates, immigrant<br />
students are far less likely than non-immigrants to be<br />
low performers. In 14 countries <strong>and</strong> Hong Kong (China),<br />
Shanghai (China) <strong>and</strong> Taiwan Province of China, not<br />
speaking the dominant language at home increased the<br />
probability of low performance, even after controlling for<br />
other factors (OECD, 2016a).<br />
In addition, wide disparity is evident in dimensions not<br />
captured by conventional demographic disaggregation.<br />
Disability is one such factor. Although measuring<br />
disability precisely is challenging due to wide differences<br />
in various forms of disability <strong>and</strong> their magnitudes,<br />
available evidence suggests disability is a significant<br />
barrier to participation in education. For example, an<br />
estimated one-third of all out-of-school children at the<br />
primary level have a disability (Sæbønes et al., 2015).<br />
Overall, evidence shows that the demographic<br />
markers of income, location, ethnicity <strong>and</strong> gender<br />
reliably account for major patterns of education<br />
marginalization within countries. These factors often<br />
overlap, so certain subgroups often have substantially<br />
lower education outcomes than more advantaged<br />
groups or the national average, sometimes by an<br />
order of magnitude. The extent of disparity can vary<br />
dramatically between countries. In poorer countries,<br />
where average educational attainment is low, inequality<br />
is comparatively larger. In richer countries, variance in<br />
education outcomes is generally lower, but may also<br />
differ in other aspects; for example, boys <strong>and</strong> young men<br />
are often at a disadvantage compared to females on<br />
various education outcomes, while the reverse is true in<br />
poorer countries. Policies responding to such inequity,<br />
therefore, have to account for specific contextual<br />
factors – political, cultural <strong>and</strong> economic – underlying<br />
disadvantage not only in a given country, but also in the<br />
subpopulation in question.<br />
76<br />
CHAPTER 3 | PEOPLE: INCLUSIVE SOCIAL DEVELOPMENT
3<br />
FORMAL EDUCATION SYSTEMS MAY NOT<br />
BE RELEVANT FOR SOME VULNERABLE<br />
POPULATIONS<br />
Marginalization in education is not an issue simply of<br />
access <strong>and</strong> attainment, but also of content. Officially<br />
sanctioned content, conveyed through curricula,<br />
syllabuses, textbooks <strong>and</strong> assessment, may privilege the<br />
language, knowledge, history <strong>and</strong> culture of some groups<br />
<strong>and</strong> not others. This is especially true for indigenous<br />
groups, for whom education is seen as both the reason<br />
indigenous knowledge is lost <strong>and</strong> a potential way to<br />
restore it (UNESCO, 2009).<br />
EDUCATION IMPROVES SOCIAL<br />
DEVELOPMENT OUTCOMES<br />
Having established ways in which social development is<br />
not inclusive, this chapter points to a solution: education<br />
can improve social development outcomes across a<br />
range of areas. The following section focuses on how<br />
education interventions, at school <strong>and</strong> in the home, can<br />
facilitate better health, improve the status of women<br />
<strong>and</strong> contribute to other social development outcomes.<br />
Examples will be also shown of the interaction between<br />
good health <strong>and</strong> better gender equality.<br />
Formal education systems, conceptualized under<br />
Western or national norms, have often promoted<br />
homogenization rather than plurality, which has led to<br />
denial <strong>and</strong> destruction<br />
of indigenous<br />
knowledge (Mato,<br />
Formal education<br />
2015; Stavenhagen,<br />
systems, conceptualized 2015). They can be<br />
under Western or<br />
disempowering <strong>and</strong><br />
run counter to a<br />
national norms, have<br />
lifestyle <strong>and</strong> culture.<br />
often led to denial<br />
For example, there<br />
<strong>and</strong> destruction of<br />
is evidence that<br />
formal education<br />
indigenous knowledge<br />
initiatives that lack<br />
an underst<strong>and</strong>ing<br />
of pastoralists’<br />
traditional way of living have been used to transform<br />
pastoralists into settled farmers <strong>and</strong> wage labourers<br />
(Kratli <strong>and</strong> Dyer, 2006).<br />
Besides issues related to language of instruction, barriers<br />
to meaningful inclusion of indigenous populations<br />
include lack of contextual relevance, devaluing of<br />
indigenous knowledge <strong>and</strong> reduction of the time spent<br />
with indigenous communities gaining traditional<br />
knowledge (Magni, 2016). Processes through which<br />
education disadvantage is created or sustained need to<br />
be examined, as do ways in which classroom <strong>and</strong> school<br />
life may contribute to further marginalization.<br />
Attempts to include indigenous knowledge <strong>and</strong> practices<br />
in formal schooling have had mixed success. One<br />
project aimed to address issues of school attendance,<br />
achievement <strong>and</strong> well-being of Yolngu youth in Australia<br />
while maintaining their cultural integrity. It was never<br />
implemented because the indigenous community was<br />
not involved in decision-making. School staff were to be<br />
imposed by the territory government without consulting<br />
Yolngu elders, who wanted the right to choose staff with<br />
good attitudes towards their <strong>people</strong> (Marika et al., 2009).<br />
EDUCATION HELPS PEOPLE AND THEIR FAMILIES<br />
MAINTAIN OR IMPROVE THEIR HEALTH<br />
Education can help <strong>people</strong> <strong>and</strong> their families keep in good<br />
health, or improve their health, in terms of nutrition,<br />
disease prevention, better relations with healthcare<br />
professionals <strong>and</strong> improved provider accountability, <strong>and</strong><br />
making choices in the home that affect health, such as<br />
reducing pollution or contaminants. General knowledge<br />
<strong>and</strong> skills acquired through education facilitate access<br />
to specific knowledge on health <strong>and</strong> nutrition issues,<br />
helping <strong>people</strong> process information on prevention <strong>and</strong><br />
treatment, <strong>and</strong> change their behaviour in healthful ways.<br />
Education is closely associated with health <strong>and</strong> nutrition.<br />
Individuals who receive more education are more likely<br />
to be in good health <strong>and</strong> well fed. Among women aged<br />
15 to 49, household survey data in 61 low, middle or<br />
high income countries between 2004 <strong>and</strong> 2009 found<br />
that, within each country, educational attainment was<br />
significantly correlated with indicators of height, weight,<br />
haemoglobin levels, sexually transmitted infections <strong>and</strong><br />
smoking (Cutler <strong>and</strong> Lleras-Muney, 2014).<br />
More educated individuals are likelier to know about<br />
disease, seek medical advice <strong>and</strong> follow treatment. They<br />
are the first to adopt medical innovations (Lleras-Muney<br />
<strong>and</strong> Lichtenberg, 2002). In low <strong>and</strong> middle income<br />
countries, where morbidity in general <strong>and</strong> from disease<br />
is high, information campaigns have proved effective in<br />
fostering adoption of simple measures such as sleeping<br />
under insecticide-treated nets to prevent malaria,<br />
purifying water against waterborne diseases <strong>and</strong> using<br />
oral rehydration to treat diarrhoea. There is growing<br />
evidence that more educated heads of families are more<br />
responsive to such campaigns (Dupas, 2011b).<br />
Education can lead to a better-functioning health<br />
sector in terms of patient relationships with healthcare<br />
providers <strong>and</strong> improved accountability. Observations in<br />
India, Indonesia, Paraguay <strong>and</strong> the United Republic of<br />
2016 • GLOBAL EDUCATION MONITORING REPORT 77
3<br />
Tanzania revealed that many doctors had insufficient<br />
medical knowledge <strong>and</strong> provided low st<strong>and</strong>ards of care to<br />
their patients. Poor patients had access to less competent<br />
doctors who exerted even less effort with them than with<br />
other patients (Das et al., 2008). A review of 122 studies on<br />
informal healthcare providers in low <strong>and</strong> middle income<br />
countries found they accounted for a highly variable<br />
share of health interactions (ranging from 9% to 90%) <strong>and</strong><br />
followed poor practices (Sudhinaraset et al., 2013).<br />
But patients with higher education engage differently<br />
with doctors. Owing to their better mastery of health<br />
knowledge <strong>and</strong> ability to locate medical information,<br />
educated patients often seek to become ‘co-producers’<br />
of their health. They perceive themselves as sharing<br />
decision-making <strong>and</strong> responsibility, which can lead to<br />
better treatment adherence <strong>and</strong> reduced costs (Crisp<br />
<strong>and</strong> Chen, 2014).<br />
As regards accountability, a synthesis of 71 articles on<br />
doctor–patient relationships in low <strong>and</strong> middle income<br />
countries confirmed that many healthcare providers<br />
did not listen carefully to their patients’ preferences,<br />
facilitate their access to care, offer them detailed<br />
information or treat them with respect. But education<br />
can help facilitate measures to enforce accountability<br />
by, for instance, ‘creating official community<br />
participation mechanisms in the context of health<br />
service decentralization; enhancing the quality of health<br />
information that consumers receive; [<strong>and</strong>] establishing<br />
community groups that empower consumers to take<br />
action’ (Berlan <strong>and</strong> Shiffman, 2012, p. 272).<br />
Education levels also matter in adopting healthier <strong>and</strong><br />
more environment-friendly energy options. Female<br />
education is strongly associated with choosing modern<br />
energy sources <strong>and</strong> technology (Ekouevi <strong>and</strong> Tuntivate,<br />
2011). Meta-analytic reviews confirm that education<br />
levels matter in improving take-up of cleaner cook<br />
stoves <strong>and</strong> fuels (Lewis <strong>and</strong> Pattanayak, 2012; Malla <strong>and</strong><br />
Timilsina, 2014). In Ethiopia, households with higher<br />
levels of education were more likely to use non-solid<br />
fuels (Mekonnen <strong>and</strong> Köhlin, 2009). In rural China,<br />
several studies have linked education levels with the<br />
adoption of cleaner fuels, such as biogas. A study<br />
by Zhang <strong>and</strong> colleagues of nine Chinese provinces<br />
found that the probability of adopting cleaner fuels<br />
increased by 0.66% for every year of education (Shen<br />
et al., 2014). Analysis of the household energy mix in<br />
Ug<strong>and</strong>a indicates that education is critical in increasing<br />
consumption of cleaner fuels (Lee, 2013).<br />
SCHOOLS CAN DELIVER KEY HEALTH<br />
INTERVENTIONS THAT MAY INFLUENCE<br />
OUTCOMES AND BEHAVIOUR<br />
Health <strong>and</strong> nutrition interventions<br />
As access to education continues to exp<strong>and</strong>, <strong>and</strong> school<br />
systems reach an unprecedented global share of the<br />
child <strong>and</strong> adolescent population, the potential for<br />
delivering health <strong>and</strong> nutrition interventions through the<br />
education sector has never been so great.<br />
School-based interventions, such as meals <strong>and</strong> health<br />
campaigns, can have an immediate impact on students’<br />
health <strong>and</strong> nutrition status. School meals provided at the<br />
primary <strong>and</strong> secondary levels may increase attendance,<br />
alleviate short-term hunger <strong>and</strong> improve nutrition status,<br />
<strong>and</strong> are a key multisector intervention (see Chapter 6:<br />
Partnerships). Programmes often target locations with<br />
high poverty or schools with low attendance. Meals<br />
may be served at breakfast or lunch, <strong>and</strong> be pre-cooked<br />
or cooked in the school. Take-home rations, such as a<br />
monthly portion of cereals <strong>and</strong> oil, are sometimes made<br />
conditional on attendance. A study in northern rural<br />
Burkina Faso showed that daily school lunches <strong>and</strong> a<br />
monthly take-home<br />
ration of 10 kilograms<br />
School feeding<br />
of flour (conditional on<br />
girls attending at least<br />
programmes in Burkina<br />
90% of class hours)<br />
Faso increased female increased female<br />
enrolment by 5 to 6 enrolment by 5 to 6<br />
percentage points after<br />
percentage points<br />
one year. Take-home<br />
after one year<br />
rations also improved<br />
the nutritional status<br />
of beneficiaries’<br />
younger siblings (aged 1 to 5) (Kazianga et al., 2012).<br />
A systematic review of 26 studies conducted mostly<br />
in countries of sub-Saharan Africa, South-eastern Asia,<br />
Southern Asia, <strong>and</strong> Latin America <strong>and</strong> the Caribbean<br />
found that school meals consistently improved health<br />
<strong>and</strong> nutrition outcomes, including anaemia, nutrient<br />
levels <strong>and</strong> morbidity. Some of the programmes also<br />
improved students’ growth, but many did not reduce<br />
the prevalence of stunting or wasting, as meals served<br />
in primary <strong>and</strong> secondary school are too late to<br />
compensate for these results of chronic early childhood<br />
malnutrition (Lawson, 2012).<br />
In higher income countries, school meal policies are<br />
78<br />
CHAPTER 3 | PEOPLE: INCLUSIVE SOCIAL DEVELOPMENT
3<br />
varied <strong>and</strong> often used to achieve multiple policy goals.<br />
Alongside measures to prevent the rising challenge<br />
of childhood obesity, discussed later, school feeding<br />
programmes have been used to foster lifelong nutrition<br />
<strong>and</strong> well-being <strong>and</strong> to compensate for household<br />
poverty. Finl<strong>and</strong> was the first country to serve free<br />
school meals to all, viewing them as an investment in<br />
learning. The goals of the Finnish system are not only<br />
to improve nutrition but also to teach long-lasting<br />
eating habits <strong>and</strong> promote awareness of the importance<br />
of food choices (Tikkanen <strong>and</strong> Urho, 2009). In Japan,<br />
school meals <strong>and</strong> dieticians are used to inculcate<br />
healthy nutrition practices <strong>and</strong> combat lifestyle-related<br />
ailments such as eating disorders <strong>and</strong> obesity (Tanaka<br />
<strong>and</strong> Miyoshi, 2012). In the United States, free or reducedprice<br />
school meals are provided to lower income students<br />
using income eligibility criteria. In the 2012/13 school<br />
year, the National School Lunch Program provided<br />
daily meals to nearly 31 million children in nearly<br />
100,000 schools, with over 21 million receiving free or<br />
reduced-price lunches (Food Research <strong>and</strong> Action Center,<br />
2015). Analysis of the programme’s impact found shorterterm<br />
health effects but a major positive impact on adult<br />
educational attainment (Hinrichs, 2010).<br />
School-based deworming campaigns could address some<br />
of the most prevalent neglected tropical diseases: infection<br />
with soil-transmitted helminths <strong>and</strong> schistosomiasis.<br />
These diseases, which particularly affect children in<br />
sub-Saharan Africa, can be easily treated with safe, low<br />
cost drugs. Free provision through schools could reach a<br />
large share of children, with benefits extending to out-ofschool<br />
children through reduced risk of transmission.<br />
This could also be used as part of the response to<br />
World Health Organization (WHO) recommendations of<br />
mass treatment once a year in regions with infection<br />
prevalence above 20%, <strong>and</strong> twice a year in regions with<br />
prevalence above 50% (Ahuja et al., 2015).<br />
Curricular interventions<br />
School-based interventions can also provide information<br />
on health <strong>and</strong> improve knowledge <strong>and</strong> behaviour in<br />
the long term. The effectiveness of such interventions<br />
depends on the quality <strong>and</strong> relevance of the information.<br />
Sexual <strong>and</strong> reproductive health education needs to<br />
acknowledge that some students are sexually active<br />
<strong>and</strong> rely on a risk reduction strategy. Many sub-Saharan<br />
African countries have introduced HIV education in<br />
their curricula, but promote abstinence until marriage<br />
instead of providing information on how to reduce<br />
the risk of HIV transmission during sex. In Kenya, an<br />
experiment showed that the official curriculum made no<br />
difference to the sexual behaviour of adolescent girls.<br />
Yet information on the fact that HIV prevalence was<br />
much higher among adult men than among boys of their<br />
age led girls to switch from unprotected sex with older<br />
partners to condom-protected sex with partners of their<br />
age (Dupas, 2011a).<br />
Childhood obesity is a rising concern. While its prevalence<br />
is much more common in higher income countries<br />
(Figure 3.8), it is also a rapidly increasing challenge in<br />
lower income ones (Bhurosy <strong>and</strong> Jeewon, 2014; Popkin et<br />
al., 2012). A systematic review of 24 studies pertaining to<br />
students aged 5 to 18 in countries of North America <strong>and</strong><br />
Western Europe as well as Brazil, China <strong>and</strong> New Zeal<strong>and</strong><br />
found that obesity prevention – mostly using a mix of<br />
classroom activities, provision of fruit <strong>and</strong> vegetables<br />
in school meals, <strong>and</strong> parental involvement – could<br />
reduce students’ body mass index <strong>and</strong> increase their<br />
consumption of fruit <strong>and</strong> vegetables. A larger impact<br />
was found for interventions that lasted at least one year<br />
<strong>and</strong> were integrated into the regular curriculum <strong>and</strong><br />
school activities (Silveira et al., 2011). Yet, the potential<br />
of school-based prevention, especially through early<br />
childhood interventions, has not been fully exploited<br />
(World Obesity Foundation, 2014). A systematic review of<br />
26 early childhood studies revealed a paucity of properly<br />
designed <strong>and</strong> evaluated interventions, especially in low<br />
<strong>and</strong> middle income countries (Mikkelsen et al., 2014).<br />
Water, sanitation <strong>and</strong> hygiene in schools<br />
In the past 40 years, water, sanitation <strong>and</strong> hygiene<br />
programmes have evolved from purely infrastructural<br />
interventions, such as building latrines <strong>and</strong> h<strong>and</strong>washing<br />
facilities, towards more comprehensive interventions<br />
incorporating elements of hygiene education, awareness<br />
<strong>and</strong> promotion. Hygiene promotion in schools became<br />
increasingly common after 2000, based on the belief<br />
that children can be influenced to not only improve<br />
their health, but also be agents of change in their<br />
communities (UNICEF, 2006).<br />
School-based interventions have a demonstrated impact<br />
on health, education, economic <strong>and</strong> gender-equity<br />
outcomes. For instance, a comprehensive, integrated<br />
programme to improve school water, sanitation <strong>and</strong><br />
hygiene in Kenya resulted in a nearly 50% reduction in<br />
girls’ absence (Freeman et al., 2012), <strong>and</strong> was especially<br />
important for schools that had had poor water<br />
2016 • GLOBAL EDUCATION MONITORING REPORT 79
3<br />
FIGURE 3.8:<br />
While being underweight is more common in lower income countries, being overweight is more prevalent in many<br />
upper middle <strong>and</strong> high income countries<br />
Percentage of overweight <strong>and</strong> underweight children under age 5, selected countries<br />
45<br />
Overweight <strong>and</strong> underweight children under age 5 (%)<br />
40<br />
35<br />
30<br />
25<br />
20<br />
15<br />
10<br />
5<br />
Overweight<br />
Underweight<br />
0<br />
Eritrea<br />
Sudan<br />
Bangladesh<br />
Pakistan<br />
Nepal<br />
Papua N. Guinea<br />
Sri Lanka<br />
Ethiopia<br />
Cambodia<br />
D. R. Congo<br />
Indonesia<br />
Philippines<br />
Nigeria<br />
Tajikistan<br />
Viet Nam<br />
Haiti<br />
Kenya<br />
Vanuatu<br />
Thail<strong>and</strong><br />
Iraq<br />
Egypt<br />
Azerbaijan<br />
Algeria<br />
Krygyzstan<br />
Mexico<br />
Rep. Moldova<br />
Tonga<br />
Turkey<br />
Serbia<br />
Mongolia<br />
Bosnia/Herzeg.<br />
Montenegro<br />
Chile<br />
United States<br />
Note: Data are for the most recent year available between 2010 <strong>and</strong> 2015.<br />
Source: UNICEF (2016).<br />
availability (Garn et al., 2013).<br />
But policy-makers need to show more leadership. In a<br />
2014 survey of 94 countries, just over one-fifth of water,<br />
sanitation <strong>and</strong> hygiene measures in national plans had<br />
been fully implemented, funded <strong>and</strong> regularly reviewed;<br />
just over one-third of countries included specific targets<br />
to reach universal access to water <strong>and</strong> sanitation in<br />
schools, <strong>and</strong> less than 30% of countries aspired to<br />
universal coverage for hygiene promotion in schools in<br />
the next decade (WHO <strong>and</strong> UN Water, 2014).<br />
Similarly, leadership is needed to promote schoolbased<br />
interventions <strong>and</strong> facilities for better menstrual<br />
hygiene management. A recent systematic review of<br />
three studies, conducted in urban schools in Egypt, India<br />
<strong>and</strong> Saudi Arabia, showed that providing multiple hour<br />
sessions led to stronger knowledge of menstrual hygiene<br />
<strong>and</strong> better practices (such as using, changing, washing<br />
<strong>and</strong> drying sanitary pads) (Sumpter <strong>and</strong> Torondel, 2013).<br />
In Uttar Pradesh, India, an intervention begun in 2011<br />
targeted men <strong>and</strong> boys to support menstrual hygiene<br />
through focus group discussions, games, media tools<br />
<strong>and</strong> regular meetings. Better management can be<br />
complemented by needed infrastructure. As the 2015<br />
GMR confirmed, access to better facilities for girls is<br />
likely to have positive effects on their dignity <strong>and</strong> the<br />
quality of their schooling experience (UNESCO, 2015).<br />
EDUCATION OPENS OPPORTUNITIES<br />
FOR WOMEN<br />
A wealth of studies <strong>and</strong> global <strong>and</strong> national reports have<br />
documented the variety of ways in which individuals<br />
<strong>and</strong> societies benefit from providing better education to<br />
women <strong>and</strong> girls (UNESCO, 2014), although content <strong>and</strong><br />
processes determine how they derive the benefits.<br />
The link between education <strong>and</strong> earning prospects<br />
is well documented. Education helps widen women’s<br />
employment opportunities beyond low skill work (see<br />
Chapter 2: Prosperity). The socio-economic benefits<br />
of educating women, both for individual <strong>and</strong> family<br />
outcomes <strong>and</strong> for national <strong>and</strong> global economic growth,<br />
have long been used to advocate for more investment in<br />
girls’ education (Mir<strong>and</strong>a, 2015; Murphy et al., 2009; Wils<br />
80<br />
CHAPTER 3 | PEOPLE: INCLUSIVE SOCIAL DEVELOPMENT
3<br />
<strong>and</strong> Bonnet, 2015). Gender disparity also affects overall<br />
income inequality, not just employment prospects,<br />
for women <strong>and</strong> girls; education <strong>and</strong> health disparity<br />
are key drivers of overall income inequality in low <strong>and</strong><br />
middle income countries, <strong>and</strong> lower female labour force<br />
participation is associated with higher income inequality<br />
in higher income countries (Gonzales et al., 2015).<br />
Tropical Medicine, 2010). Data from recent Demographic<br />
<strong>and</strong> Health Surveys (DHS) show that in most countries<br />
with data, women with secondary <strong>and</strong> tertiary education<br />
are less likely to report having experienced physical<br />
or sexual violence from their spouses (Figure 3.9), <strong>and</strong><br />
less likely to have undergone female genital mutilation<br />
(Figure 3.10).<br />
By imparting core skills such as literacy, education<br />
facilitates women’s access to information about social<br />
<strong>and</strong> legal rights <strong>and</strong> welfare services. Learning to read<br />
<strong>and</strong> write can bring greater confidence <strong>and</strong> agency to<br />
identify <strong>and</strong> challenge inequality, unjust traditions,<br />
<strong>and</strong> norms <strong>and</strong> practices that perpetuate women’s<br />
low status. For instance, low levels of education are a<br />
significant risk factor in perpetuating <strong>and</strong> experiencing<br />
intimate partner violence (Capaldi et al., 2012; United<br />
Nations, 2015b; WHO <strong>and</strong> London School of Hygiene <strong>and</strong><br />
Gender-based violence is not just an issue in low income<br />
countries. Over 23% of women were found to have<br />
experienced physical or sexual intimate partner violence<br />
in high income countries (WHO, 2013). In Engl<strong>and</strong> (United<br />
Kingdom), economically deprived <strong>and</strong> less educated<br />
women were more likely to have experienced such<br />
violence (Khalifeh et al., 2013).<br />
Gender-based power relations can have complex links with<br />
education. For instance, in Norway, women in relationships<br />
FIGURE 3.9:<br />
In most countries, women with secondary <strong>and</strong> higher levels of education are less likely to report having experienced<br />
spousal violence<br />
Percentage of ever-married women who have ever experienced physical or sexual violence committed by their husb<strong>and</strong> or partner,<br />
selected countries<br />
65<br />
Women who have ever been married who have experienced physical or<br />
sexual violence committed by their husb<strong>and</strong> or partner (%)<br />
60 No education<br />
55 Primary<br />
50 Secondary<br />
45<br />
Higher<br />
Average<br />
40<br />
35<br />
30<br />
25<br />
20<br />
15<br />
10<br />
5<br />
0<br />
Comoros 2012<br />
Burkina Faso 2010<br />
Azerbaijan 2006<br />
Philippines 2013<br />
Nigeria 2013<br />
Cambodia 2014<br />
Gambia 2013<br />
Tajikistan 2012<br />
Dominican Rep. 2013<br />
Haiti 2012<br />
Honduras 2011<br />
Togo 2013<br />
Ghana 2008<br />
Jordan 2012<br />
Rep. Moldova 2005<br />
Namibia 2013<br />
Côte d’Ivoire 2011<br />
S. Tome/Principe 2008<br />
Nepal 2011<br />
Malawi 2010<br />
Mozambique 2011<br />
Timor-Leste 2009<br />
Mali 2012<br />
Zimbabwe 2010<br />
India 2005<br />
Peru 2012<br />
Colombia 2010<br />
Liberia 2007<br />
Kenya 2014<br />
U. R. Tanzania 2010<br />
Zambia 2013<br />
Sierra Leone 2013<br />
Cameroon 2011<br />
Gabon 2012<br />
Ug<strong>and</strong>a 2011<br />
D. R. Congo 2013<br />
Bangladesh 2007<br />
Rw<strong>and</strong>a 2010<br />
Source: The DHS Program (2016).<br />
2016 • GLOBAL EDUCATION MONITORING REPORT 81
3<br />
FIGURE 3.10:<br />
In most countries, women with higher levels of education are less likely<br />
to have undergone female genital mutilation<br />
Percentage of women who have experienced female genital cutting (FGC),<br />
selected countries<br />
Women who have undergone female<br />
genital mutilation (%)<br />
100<br />
90<br />
80<br />
70<br />
60<br />
50<br />
40<br />
30<br />
20<br />
10<br />
0<br />
Ug<strong>and</strong>a 2011<br />
No education<br />
Primary<br />
Secondary<br />
Higher<br />
Average<br />
Niger 2012<br />
Togo 2013<br />
Ghana 2003<br />
Benin 2011<br />
Source: The DHS Program (2016).<br />
U. R. Tanzania 2010<br />
Yemen 2013<br />
Kenya 2014<br />
Senegal 2014<br />
Nigeria 2013<br />
Côte d’Ivoire 2011<br />
with less educated men were found to be more likely to suffer<br />
from psychological <strong>and</strong> physical violence (Bjell<strong>and</strong>, 2014).<br />
Education can affect women’s political participation<br />
<strong>and</strong> engagement by imparting skills which enable them<br />
to participate in democratic processes (see Chapter 4:<br />
Peace). Educated women are more likely to participate<br />
in civic life <strong>and</strong> advocate for community improvements.<br />
Numeracy enables individuals to question <strong>and</strong> critique<br />
government data, strengthening accountability.<br />
Conversely, low education levels, negative attitudes<br />
<strong>and</strong> stereotypes, <strong>and</strong> lack of strong role models, as in<br />
Ethiopia, all contribute to women’s ability to participate<br />
in decision-making positions (Kassa, 2015).<br />
EDUCATION CAN HAVE SIMULTANEOUS<br />
BENEFITS ON HEALTH AND GENDER ISSUES<br />
The effects of education, whether formal, non-formal or<br />
informal, are not simple or linear. Not only can education<br />
have powerful outcomes for health <strong>and</strong> gender equality<br />
separately, but as this section shows, education can<br />
support gendered areas of health, <strong>and</strong> health aspects<br />
of gender. First, maternal education can have powerful<br />
Gambia 2013<br />
Burkina Faso 2010<br />
Sierra Leone 2013<br />
Mali 2012<br />
Egypt 2008<br />
Guinea 2012<br />
intergenerational effects which can transform societies.<br />
Second, because gender is often erroneously associated<br />
only with women, examples will be given of the effects of<br />
education on the health of men <strong>and</strong> boys.<br />
Education has large intergenerational benefits in many<br />
areas of children’s lives, <strong>and</strong> these payoffs persist over<br />
time (UNESCO, 2014). Educated parents – mothers in<br />
particular – are better able to feed their children well<br />
(from exclusive breastfeeding in the first few months of<br />
life to a good quality, diversified diet later) <strong>and</strong> to keep<br />
them in good health.<br />
Maternal education has long been identified as a major<br />
determinant of child mortality, independently of income<br />
(Smith-Greenaway, 2013). Mothers with more education<br />
are more likely to seek prenatal care, birth attendance<br />
by trained medical personnel, immunization <strong>and</strong> modern<br />
medical care for their young children. They are also more<br />
likely to protect their young children from health risks,<br />
for instance by boiling water <strong>and</strong> avoiding unsafe food.<br />
Evidence from Guatemala, Mexico, Nepal, the Bolivarian<br />
Republic of Venezuela <strong>and</strong> Zambia showed that literacy<br />
predicted mothers’ ability to read printed health<br />
messages, underst<strong>and</strong> radio messages <strong>and</strong> explain<br />
their child’s condition to a health professional, <strong>and</strong> was<br />
associated with health-seeking behaviour (LeVine <strong>and</strong><br />
Rowe, 2009). Higher maternal education was found to<br />
improve infant health in the United States, a finding linked<br />
to the fact that more educated women were more likely<br />
to be married, use prenatal care <strong>and</strong> reduce smoking<br />
(Currie <strong>and</strong> Moretti, 2003).<br />
Short-term education programmes that support mothers<br />
of young children can have a significant impact on<br />
health <strong>and</strong> nutrition outcomes. They can help promote<br />
exclusive breastfeeding for infants aged less than 6<br />
months, as recommended by WHO to achieve optimum<br />
growth; the most recent data indicate that only 47% of<br />
infants in least developed countries were exclusively<br />
breastfed (UNICEF, 2016). A systematic review of 66<br />
studies (including 27 in lower income countries) showed<br />
that short-term breastfeeding education increased the<br />
average share of mothers exclusively breastfeeding by<br />
43% on the day of birth, 30% during the first month<br />
<strong>and</strong> 90% during the second to sixth months, with the<br />
largest increases in lower income countries. Programmes<br />
combining individual <strong>and</strong> group counselling appeared<br />
to be most effective, whether facility- or communitybased<br />
(Haroon et al., 2013). Short-term programmes also<br />
can reduce the prevalence of stunting in lower income<br />
82<br />
CHAPTER 3 | PEOPLE: INCLUSIVE SOCIAL DEVELOPMENT
3<br />
countries. According to a systematic review of 17 articles,<br />
the provision of complimentary food (either coupled with<br />
nutritional counselling or not) to mothers of babies aged<br />
6 to 24 months led to significant gains in their weight<br />
<strong>and</strong> height (Imdad et al., 2011).<br />
births per year of increase in female attainment (Osili <strong>and</strong><br />
Long, 2008). Over 2015–2030, continued efforts towards<br />
universal basic education of good quality will be decisive<br />
in countries that still have very high fertility, increasingly<br />
concentrated in sub-Saharan Africa.<br />
A positive long-term relationship has been shown<br />
between maternal education <strong>and</strong> child health <strong>and</strong> basic<br />
education. The extension of compulsory education from<br />
5 to 8 years in Turkey in 1997 increased by 32 percentage<br />
points the likelihood that mothers of young children in<br />
2008 had completed at least 8 years of education, <strong>and</strong><br />
improved child health as measured by the share with<br />
very low birth weight, height for age <strong>and</strong> weight for age<br />
(Güneş, 2015). As a result, at the country level, simple<br />
indicators of education development among women,<br />
such as literacy, are strong predictors of key infant<br />
health outcomes (Figure 3.11).<br />
Education can lead to reductions in fertility in various<br />
ways. Educated women may feel confident their children<br />
will survive to adulthood <strong>and</strong> so have fewer. They may<br />
have greater bargaining power as well as improved access<br />
to <strong>and</strong> use of contraceptive methods to achieve a desired<br />
number of births <strong>and</strong> to space consecutive births, with<br />
benefits for their own <strong>and</strong> their children’s health. At the<br />
family <strong>and</strong> community levels, educated young adults <strong>and</strong><br />
their parents – who remain key decision-makers in many<br />
societal contexts – may have a preference for those who<br />
marry to be educated, delay marriage <strong>and</strong> first birth, <strong>and</strong><br />
have spaced births <strong>and</strong> smaller families (Basu, 2002).<br />
The spread of education transforms societies by<br />
changing family preferences, social norms <strong>and</strong> cultural<br />
practices. This is central to the demographic transition<br />
towards low fertility levels that facilitate investment in<br />
children’s health, nutrition <strong>and</strong> education. EFA policies<br />
implemented to 2015 accelerated fertility decline. For<br />
instance, Nigeria’s universal primary education policy<br />
was estimated to have reduced early fertility by 0.26<br />
In Ethiopia, Malawi <strong>and</strong> Ug<strong>and</strong>a, the transition to<br />
universal primary education from the mid-1990s led to<br />
a decline in women’s ideal family size <strong>and</strong> their desire<br />
for very high fertility (Behrman, 2015). In Bangladesh,<br />
the rise in female educational attainment may have<br />
accelerated the country’s remarkable fertility decline,<br />
including by lengthening the interval between births.<br />
The median interval increased by 26% between 1991 <strong>and</strong><br />
FIGURE 3.11:<br />
Almost all young children reach the age of 5 in countries where most women are literate<br />
Under-5 child mortality rate <strong>and</strong> female literacy rate, circa 2015<br />
180<br />
High income<br />
Under-5 mortality rate (per 1,000 live births)<br />
160<br />
140<br />
120<br />
100<br />
80<br />
60<br />
40<br />
20<br />
Chad<br />
Mali<br />
Côte d’Ivoire<br />
Afghanistan<br />
Togo<br />
U. R. Tanzania<br />
Upper middle income<br />
Lower middle income<br />
Low income<br />
0<br />
0<br />
Rw<strong>and</strong>a<br />
Nepal<br />
Morocco<br />
El Salvador<br />
10 20 30 40 50 60 70 80 90 100<br />
Female literacy rate (ages 15 to 24)<br />
Sources: World Bank (2016) <strong>and</strong> the UIS database.<br />
2016 • GLOBAL EDUCATION MONITORING REPORT 83
3<br />
2007, to 44 months. By 2007, birth intervals were about<br />
40% longer among women with secondary or higher<br />
education than among illiterate women (Rabbi et al.,<br />
2013). In Madagascar, 1 year of additional attainment<br />
among women aged 12 to 25 delayed marriage by 1.5<br />
years, <strong>and</strong> delaying marriage by 1 year delayed age at<br />
first birth by 0.5 years (Glick et al., 2015).<br />
In the short term, targeted, specific non-formal education<br />
programmes may be effective in helping women plan<br />
childbirth. Counselling women who had recently given<br />
birth about family planning led to better contraceptive<br />
use <strong>and</strong> fewer unplanned pregnancies, especially among<br />
adolescents, in countries as diverse as Australia, Nepal,<br />
Pakistan <strong>and</strong> the United States (Lopez et al., 2010).<br />
Education can reduce maternal mortality, which is<br />
caused by pregnancy complications such as preeclampsia,<br />
bleeding <strong>and</strong> infections, <strong>and</strong> by unsafe<br />
abortion. Despite a global 44% decrease in maternal<br />
mortality between 1990 <strong>and</strong> 2015, it remains a significant<br />
threat, especially in sub-Saharan Africa (546 deaths per<br />
100,000 births in 2013) <strong>and</strong> Southern Asia (182 deaths)<br />
(UNICEF, 2016). Education helps women underst<strong>and</strong><br />
information about hygiene <strong>and</strong> early symptoms of<br />
pregnancy complications, gain access to treatment <strong>and</strong><br />
birth attendance, <strong>and</strong> avoid unsafe abortion. Analysis of<br />
data on 108 countries<br />
over 1990–2010<br />
finds that an initial<br />
The impact of exp<strong>and</strong>ing increase in female<br />
attainment from 0 to<br />
women’s education<br />
1 year of education<br />
might be as large as that would reduce<br />
of broadening access to maternal mortality<br />
by 174 deaths per<br />
skilled birth attendants<br />
100,000 births,<br />
<strong>and</strong> an increase<br />
from 7 to 8 years<br />
would bring a reduction by 15 deaths. The impact of<br />
exp<strong>and</strong>ing women’s education might be as large as that<br />
of broadening access to skilled birth attendants (Bhalotra<br />
<strong>and</strong> Clarke, 2013).<br />
Education can also have positive outcomes for men’s<br />
health, as behaviour relating to health <strong>and</strong> mortality<br />
can be highly gendered, <strong>and</strong> is often linked to gender<br />
socialization norms. In a number of countries, men have<br />
been shown to be more at risk of poor mental health <strong>and</strong><br />
suicide, traffic injuries <strong>and</strong> hazardous work, <strong>and</strong> violence<br />
<strong>and</strong> homicide as both victims <strong>and</strong> perpetrators (Barker,<br />
2005; Hawkes <strong>and</strong> Buse, 2013; Kato-Wallace et al., 2016).<br />
In Brazil, rates of violence <strong>and</strong> violent death are especially<br />
high for young men, particularly in urban areas, where<br />
lack of education <strong>and</strong> employment opportunities may<br />
lead them to adopt risky lifestyles associated with gangs<br />
<strong>and</strong> work in the drug trade (Imbusch et al., 2011). Harmful<br />
stereotypes of masculinity <strong>and</strong> manhood can lead men<br />
to tend to be worse at seeking help on mental health,<br />
consume excessive amounts of drugs <strong>and</strong> alcohol, <strong>and</strong> be<br />
more prone to aggressive <strong>and</strong> risky behaviour. Education<br />
can address the perpetuation of such stereotypes.<br />
A study of mortality data by education level in 16<br />
European countries found higher mortality among less<br />
educated populations, especially for preventable deaths<br />
(Mackenbach et al., 2015). A study of road traffic injuries<br />
in Europe found education inequality among men over<br />
age 30, but not among women (Borrell et al., 2005).<br />
SOCIAL DEVELOPMENT<br />
INFLUENCES EDUCATION<br />
Education helps make social development more inclusive<br />
by supporting health outcomes, gender equality<br />
<strong>and</strong> areas where health <strong>and</strong> gender intersect. Social<br />
development, in turn, has an impact on education, both<br />
positive <strong>and</strong>, if lacking in inclusivity, negative.<br />
HEALTH AND NUTRITION FORM A FOUNDATION<br />
FOR EDUCATION SYSTEMS<br />
The causal impact of education on health <strong>and</strong> nutrition<br />
is mirrored by the causal impact of health <strong>and</strong> nutrition<br />
on education. A large body of literature documents the<br />
latter, arguing that health <strong>and</strong> nutrition condition the<br />
ability of children to attend school <strong>and</strong> learn, <strong>and</strong> the<br />
ability of their families to support them.<br />
Living conditions in early childhood set the stage for<br />
learning. Shocks suffered in utero by babies whose<br />
mothers contracted diseases such as influenza or<br />
malaria, or were malnourished due to famine or drought,<br />
were found to cause lower attainment in a variety of<br />
country contexts from the early 20th century to recent<br />
years. Chronic malnutrition in early childhood is known<br />
to impair the development of cognitive, socio-emotional<br />
<strong>and</strong> physical skills. Public health policies such as malaria<br />
eradication can thus accelerate education expansion, <strong>and</strong><br />
nutrition interventions for pregnant women <strong>and</strong> young<br />
children should also be viewed as an education policy<br />
priority (Cutler <strong>and</strong> Lleras-Muney, 2014).<br />
84<br />
CHAPTER 3 | PEOPLE: INCLUSIVE SOCIAL DEVELOPMENT
3<br />
Improvements in child health <strong>and</strong> nutrition can boost<br />
attendance <strong>and</strong> achievement. Short-term hunger <strong>and</strong><br />
intestinal worm infection weaken children, making<br />
it more difficult for them to travel to school <strong>and</strong> to<br />
concentrate on learning. The benefits of school meals<br />
<strong>and</strong> deworming thus extend to education outcomes. In<br />
experiments in areas of Kenya <strong>and</strong> Ug<strong>and</strong>a with high<br />
rates of worm infection, deworming had a dramatic<br />
impact on school attendance in the short term, <strong>and</strong> on<br />
test scores <strong>and</strong> employment in the long term. In Kenya,<br />
girls who received the treatment were 25% more likely to<br />
pass the national primary school exit exam, <strong>and</strong> as adults<br />
were more likely to grow cash crops <strong>and</strong> reallocate time<br />
from agriculture to entrepreneurship (Ahuja et al., 2015).<br />
Parental health has a critical impact on children’s<br />
education. Disease weakens parents’ ability to educate<br />
their children <strong>and</strong> support them through schooling.<br />
Children suffer emotional<br />
distress <strong>and</strong> may need to<br />
take on parental roles at<br />
In Kenya, girls who<br />
home, such as taking care<br />
received deworming of younger siblings, to the<br />
treatment were 25% detriment of learning. In<br />
countries without effective<br />
more likely to pass<br />
social welfare systems,<br />
the national primary the loss of income caused<br />
school exit exam by parental disease<br />
<strong>and</strong> the cost of medical<br />
care may impoverish<br />
families, making schooling unaffordable. Parental death<br />
is particularly devastating. Evidence from the AIDS<br />
epidemic in sub-Saharan Africa <strong>and</strong> from Indonesia<br />
shows that the timing of parental death is associated<br />
with the timing of school dropout, <strong>and</strong> orphans are<br />
less likely to attend school than the children of their<br />
caretakers (Vogl, 2014).<br />
Health <strong>and</strong> nutrition infrastructure can be used to deliver<br />
education interventions. Care programmes for infants<br />
<strong>and</strong> toddlers up to age 3 can complement medical<br />
care <strong>and</strong> food supplementation with child stimulation<br />
<strong>and</strong> parenting education. Home visits by community<br />
health workers can include sessions in which mothers<br />
learn how to stimulate their children by playing with<br />
them, using positive feedback <strong>and</strong> avoiding physical<br />
punishment. Longitudinal evidence from a series of<br />
experiments targeting stunted children, run in Jamaica<br />
since the 1980s, shows long-term benefits including<br />
higher cognitive skills at ages 7 <strong>and</strong> 11; improved reading<br />
achievement, attention, behaviour <strong>and</strong> self-esteem at<br />
age 17; <strong>and</strong> higher earnings at age 22. More recent trials<br />
in Bangladesh, Brazil, India, Pakistan, Saint Lucia <strong>and</strong><br />
South Africa tend to confirm these results, which depend<br />
on the quality of the training received by community<br />
health workers (Leclercq, 2015). Short-term health<br />
education programmes, such as nutritional counselling<br />
<strong>and</strong> contraceptive education, are usually delivered by<br />
health professionals or community health workers.<br />
Access to quality health care for teachers <strong>and</strong> students is<br />
indispensable to the functioning of the education sector.<br />
Disease is a cause of teacher absenteeism <strong>and</strong> attrition<br />
(Ejere, 2010; Herrmann <strong>and</strong> Rockoff, 2010). Teachers<br />
in rural areas, in particular, face shortages of qualified<br />
health professionals, <strong>and</strong> when unwell may be absent<br />
for longer than if medical care were readily available.<br />
The impact of disease <strong>and</strong> treatment availability on the<br />
education sector has been particularly strong in the case<br />
of the AIDS epidemic in the worst affected countries<br />
of sub-Saharan Africa. Without antiretroviral therapy,<br />
infected teachers are increasingly absent <strong>and</strong> eventually<br />
die. Other teachers may be absent to take care of<br />
infected family members. Teachers who are infected or<br />
suspected of being infected may face discrimination<br />
<strong>and</strong> stigma from colleagues, parents or the community<br />
(World Bank, 2009). In that respect, the advent <strong>and</strong><br />
spread of antiretroviral therapy has contributed to the<br />
sustainability of education systems.<br />
ACCESS TO WATER, SANITATION AND ENERGY<br />
AFFECTS EDUCATION OUTCOMES<br />
Just as health services <strong>and</strong> interventions can support<br />
education, so can access to water, sanitation <strong>and</strong> energy.<br />
For example, reducing the time it takes to collect water<br />
<strong>and</strong> firewood can improve education outcomes by<br />
freeing time for educational activities, especially for<br />
women <strong>and</strong> girls (UNESCO, 2015). In Ghana, research<br />
using four rounds of DHS (1993/94 to 2008) found that<br />
halving water fetching time increased school attendance<br />
by 2.4 percentage points, on average, among girls aged 5<br />
to 15, <strong>and</strong> the impact was stronger in rural areas (Nauges<br />
<strong>and</strong> Str<strong>and</strong>, 2013). In 2001, female literacy rates were<br />
found to be almost 5% higher for women in villages with<br />
better water access in Uttar Pradesh, India (Sekhri, 2013).<br />
Similarly, electricity availability can improve study time<br />
<strong>and</strong> education outcomes via means such as night-time<br />
studying, access to technology <strong>and</strong>, when dem<strong>and</strong> is<br />
great, use of double shifts. Access to electricity has<br />
been shown to have a positive impact on education<br />
2016 • GLOBAL EDUCATION MONITORING REPORT 85
3<br />
outcomes in many countries, including Bangladesh,<br />
India, Ethiopia, Kenya <strong>and</strong> South Sudan (UNESCO, 2015).<br />
A comprehensive review of studies discussing pro-poor<br />
electricity provision in 74 developing countries, mostly<br />
from sub-Saharan Africa, <strong>and</strong> South <strong>and</strong> East Asia,<br />
found consistent positive impacts of electrification<br />
on education in terms of improvements in study time,<br />
enrolment <strong>and</strong> years of schooling (Pueyo et al., 2013).<br />
A variety of examples across world regions demonstrate<br />
this effect. An analysis of the impact of rural hydroelectrification<br />
between 1960 <strong>and</strong> 2000 in Brazil showed<br />
large positive effects on literacy <strong>and</strong> enrolment<br />
rates. Counties that went from no electricity to full<br />
electrification saw drops of 8% in illiteracy <strong>and</strong> 21% in the<br />
population with less than four years of education, <strong>and</strong><br />
a two-year increase in school completion (Lipscomb et<br />
al., 2013). In rural Peru, the number of households with<br />
access to electricity increased from 7.7% in 1993 to 70% in<br />
2013, with much of the expansion happening after 2006.<br />
Providing access to electricity led to children studying an<br />
extra 93 minutes a day (Aguirre, 2014). In another study<br />
on rural Peru’s electrification, conducted using household<br />
survey panel data from 2007 to 2010, girls living in<br />
districts that received electricity access were found more<br />
likely to be enrolled in school, though increased access<br />
to electricity did not lead to improved attendance <strong>and</strong><br />
was associated with a short-term reduction in learning<br />
outcomes (Dasso et al., 2015).<br />
The source of electricity does not seem to matter.<br />
Children in households with solar home systems in<br />
Bangladesh <strong>and</strong> community micro hydro in Nepal were<br />
shown to spend more time studying than households<br />
without any electricity (Banerjee et al., 2011; Samad<br />
et al., 2013).<br />
benefit women. In six states in India, analysis using 1996<br />
survey data found that in households with electricity,<br />
even poor women read more than women in wealthier<br />
households without electricity (World Bank, 2002).<br />
Furthermore, since electricity greatly increases access<br />
to modern media, it may provide the opportunity to<br />
gain <strong>and</strong> practice literacy <strong>and</strong> expose women to nontraditional<br />
lifestyles, which can in turn affect women’s<br />
st<strong>and</strong>ing <strong>and</strong> education (Köhlin et al., 2011).<br />
Basic access to electricity alone is not sufficient to<br />
improve education. Electricity access can also increase<br />
opportunities for child employment or free time for other<br />
pursuits, such as television watching <strong>and</strong> digital game<br />
playing. Access to electrification in Honduras between 1992<br />
<strong>and</strong> 2005 was found to reduce educational attainment<br />
<strong>and</strong> attendance, <strong>and</strong> increase childhood employment.<br />
To curb perverse effects of electricity on education,<br />
awareness of them needs to be raised (Squires, 2015).<br />
Other electricity-related challenges can<br />
disproportionately affect the poor <strong>and</strong> their education<br />
outcomes. Despite huge investments <strong>and</strong> the<br />
development of grid infrastructure in Kenya, a lack<br />
of mass connection <strong>and</strong> credit access has prevented<br />
significant progress in electrification rates for the poor<br />
(Lee et al., 2014). Quality of electrification is as important<br />
as connection. Kinshasa, Democratic Republic of the<br />
Congo, reported a 90% access rate to electricity, but<br />
received only 30 points out of 100 on a newer metric<br />
that factored in reliability, quality, affordability, legality<br />
<strong>and</strong> other aspects (International Energy Agency<br />
<strong>and</strong> World Bank, 2015). Research is needed on the<br />
relationship between access <strong>and</strong> quality of electrification<br />
<strong>and</strong> education outcomes, as well as a more nuanced<br />
definition of electricity access.<br />
Electrification can improve indoor air quality <strong>and</strong><br />
reduce health challenges (Torero, 2014), which can in<br />
turn positively affect education. In a causal analysis<br />
of a grid extension <strong>and</strong> intensification programme in<br />
El Salvador, household electrification was shown to<br />
reduce indoor air pollution by reducing use of traditional<br />
light sources. School-age children from households<br />
that received discount vouchers increased their time<br />
studying at home in less polluted environments, <strong>and</strong> saw<br />
improvements in math skills (Barron <strong>and</strong> Torero, 2014).<br />
DISCRIMINATORY INSTITUTIONS AND SOCIAL<br />
STRUCTURES AFFECT EDUCATION OUTCOMES<br />
The impact of social development on education is not<br />
always positive. It is well known that social institutions<br />
have gendered dimensions with implications for education<br />
outcomes. This is the backdrop of much programming to<br />
support girls’ education in recent decades, including raising<br />
awareness of the need to educate girls <strong>and</strong> providing<br />
stipends as encouragement (UNESCO, 2015).<br />
While home electrification does not seem to have a<br />
consistently greater impact on girls’ education, it can<br />
have other education benefits which may especially<br />
Among countries with relevant data, there was a negative<br />
association between discriminatory legal institutions<br />
<strong>and</strong> the gap between girls <strong>and</strong> boys in lower secondary<br />
86<br />
CHAPTER 3 | PEOPLE: INCLUSIVE SOCIAL DEVELOPMENT
3<br />
completion rates in 2014. Girls were often found to attend<br />
school longer in countries with less discriminatory social<br />
institutions, <strong>and</strong> the reverse was true in countries with<br />
more discriminatory institutions. But the relationship<br />
was not always straightforward: in more economically<br />
advanced countries such as Kuwait, more women than<br />
men completed lower secondary education despite<br />
discriminatory legal <strong>and</strong> social practices (Figure 3.12).<br />
But the removal of discriminatory legislation does not<br />
eliminate discrimination. People continue to be oppressed<br />
because of race, caste <strong>and</strong> ethnicity, including in education<br />
systems (Krieger, 2014; Siddique, 2011). For instance, in the<br />
United States, racial discrimination continues through<br />
unequal distribution of education financing, strong<br />
residential segregation <strong>and</strong> a ‘school to prison’ pipeline<br />
affecting African Americans (see Chapter 5: Place).<br />
INTEGRATED SOCIAL AND<br />
EDUCATION INTERVENTIONS<br />
ARE NEEDED<br />
Inclusive social development will not be achieved by<br />
interventions only in one sector. There is a lack of<br />
evidence on sustained health-related behaviour change<br />
through education. Similarly, the fact that progress<br />
in gender parity in education has not systematically<br />
translated to gender equality points to a need for<br />
broader interventions <strong>and</strong> policies that integrate<br />
education with actions such as legislative change <strong>and</strong><br />
workforce policies. More is needed to remedy social<br />
challenges than single sector-focused interventions.<br />
What are some possible solutions? Social protection<br />
programmes can influence multiple outcomes at once,<br />
including education. Gender-balanced lives can be<br />
facilitated through integrated, comprehensive measures.<br />
Education can contribute to innovation in the delivery<br />
of essential services. Water, sanitation <strong>and</strong> hygiene can<br />
be improved in communities, combining training with<br />
community-building <strong>and</strong> improvements in governance.<br />
EVIDENCE OF SUSTAINED HEALTH-RELATED<br />
BEHAVIOUR CHANGE THROUGH EDUCATION<br />
IS LACKING<br />
While education helps <strong>people</strong> acquire knowledge, it does<br />
not always lead to substantive long-term behavioural<br />
change. People with education may know more about<br />
the health risks they take but without developing<br />
FIGURE 3.12:<br />
Many countries with discriminatory social institutions have worse<br />
gender gaps in lower secondary completion rates<br />
Discriminatory family code subindex, 2014; <strong>and</strong> gender gap in lower<br />
secondary enrolment rates, circa 2014<br />
Discriminatory family code subindex<br />
1<br />
0.9<br />
0.8<br />
0.7<br />
0.6<br />
0.5<br />
0.4<br />
0.3<br />
0.2<br />
More girls enrolled<br />
than boys<br />
Kuwait<br />
Bolivia<br />
More boys enrolled<br />
than girls<br />
Guinea<br />
0.1<br />
New Zeal<strong>and</strong><br />
0<br />
-15 -10 -5 0 5 10 15 20 25<br />
Gender gaps in lower secondary enrolment rates<br />
Afghanistan<br />
critical thinking <strong>and</strong> decision-making skills may engage<br />
in risky behaviour. In a survey in Zimbabwe, persons<br />
with secondary education were 30% more likely to have<br />
comprehensive knowledge of HIV, yet there was no<br />
evidence that they were more likely to get tested for<br />
HIV or be HIV negative (Agüero <strong>and</strong> Bharadwaj, 2014).<br />
In fact, the quality of the information provided is a<br />
critical factor in ensuring education can play a positive<br />
role in influencing behaviours, since educated <strong>people</strong><br />
are better able to critically process information. For<br />
instance, early in the HIV p<strong>and</strong>emic in sub-Saharan<br />
Africa more educated, wealthier individuals were more<br />
likely to have multiple partners <strong>and</strong> unprotected sex. As<br />
information on HIV transmission improved over time,<br />
the more educated were better able to interpret the<br />
information <strong>and</strong> change their behaviour. In recent years,<br />
more education is associated with a lower likelihood of<br />
HIV prevalence in many countries in sub-Saharan Africa,<br />
including Cameroon, Ghana, Kenya <strong>and</strong> Tanzania (Smith<br />
et al., 2012).<br />
Similarly, systematic reviews of hygiene-focused<br />
interventions, which include school-based, household <strong>and</strong><br />
community-level interventions, have often concluded<br />
30 35<br />
Notes: The discriminatory family code subindex of the 2014 Social Institutions<br />
<strong>and</strong> Gender Index (SIGI) is composed of formal <strong>and</strong> informal laws, social norms<br />
<strong>and</strong> practices such as legal age of marriage, early marriage, parental authority<br />
<strong>and</strong> inheritance laws. The SIGI <strong>and</strong> subindex values are between 0 <strong>and</strong> 1, with 0<br />
indicating no inequality <strong>and</strong> 1 indicating complete inequality.<br />
Sources: OECD (2014b) <strong>and</strong> UIS database.<br />
2016 • GLOBAL EDUCATION MONITORING REPORT 87
3<br />
that most behaviour changes are not sustained. A review<br />
of 27 h<strong>and</strong>washing studies yielded no single instance of<br />
definitive, long-term behavioural change (Vindigni et al.,<br />
2011). Part of the problem has been providing resources<br />
to sustain the behaviour. The state of Lagos, Nigeria,<br />
included in its curriculum programmes promoting<br />
hygiene knowledge <strong>and</strong> practices. They appeared to<br />
improve student knowledge of the importance of such<br />
practices, but primary <strong>and</strong> secondary school pupils were<br />
found to lack adequate access to facilities to practise<br />
their knowledge (Babalobi, 2013; Olukanni, 2013).<br />
Education <strong>and</strong> sensitization campaigns can encourage the<br />
adoption of cleaner fuel. Household energy programmes<br />
involve awareness-raising, education <strong>and</strong> information<br />
on inefficient <strong>and</strong> unhealthy cooking stoves <strong>and</strong> fuels.<br />
Education <strong>and</strong> media campaigns are critical to ensure that<br />
families underst<strong>and</strong> the challenges <strong>and</strong> make the transition<br />
(Halff et al., 2014). But there has been limited analysis on<br />
whether improved cooking stoves translates into sustained<br />
use over time or leads to full adoption of clean fuel (Lewis<br />
<strong>and</strong> Pattanayak, 2012). Households may switch back to<br />
traditional fuel due to factors such as fuel prices, reliability<br />
<strong>and</strong> availability of fuel supply, <strong>and</strong> lifestyles <strong>and</strong> tastes<br />
(Malla <strong>and</strong> Timilsina, 2014).<br />
PROGRESS IN GENDER PARITY IN EDUCATION<br />
FIGURE 3.13:<br />
Women consistently earn less than men in OECD countries, even<br />
though gender gaps in secondary attainment vary<br />
Gender gaps in upper secondary attainment <strong>and</strong> formal employment<br />
wages, circa 2014<br />
Gender gap in upper secondary attainment,<br />
25- to 64-year-olds (%)<br />
40<br />
30<br />
20<br />
10<br />
0<br />
-10<br />
-20<br />
0<br />
Hungary<br />
Norway<br />
Source: OECD (2016b).<br />
Portugal<br />
Turkey<br />
United States<br />
More men have attained secondary<br />
education than women<br />
Estonia<br />
Rep. of Korea<br />
More women have attained<br />
secondary education than men<br />
5 10 15 20 25 30 35<br />
Gender wage gap in formal employment (%)<br />
40<br />
HAS NOT SYSTEMATICALLY TRANSLATED TO<br />
GENDER EQUALITY<br />
Just as knowledge acquisition does not always lead to<br />
behavioural change, ensuring gender parity in school<br />
does not necessarily result in longer-term equality<br />
between the sexes. EFA <strong>and</strong> the MDGs promoted gender<br />
parity, <strong>and</strong> in recent decades the overall numbers of<br />
girls <strong>and</strong> women enrolling in all levels of education have<br />
increased substantially (UNESCO, 2015). But there are<br />
many indications that improving education access <strong>and</strong><br />
gender parity are not sufficient to empower women in<br />
society. Ensuring greater equality in outcomes such as<br />
literacy, numeracy, soft skills <strong>and</strong> entering work-related<br />
training or higher education does not clearly translate<br />
to greater equality in economic activity or employment<br />
on equal terms with men. For instance, women’s<br />
secondary attainment is now higher than men’s in many<br />
OECD countries, yet the gender pay gap favouring men<br />
remains substantial (Figure 3.13).<br />
Female labour force participation is determined by many<br />
policy, family <strong>and</strong> individual factors (Mincer, 1962), <strong>and</strong><br />
by levels of national economic development (Elborgh-<br />
Woytek et al., 2013). Factors influencing women’s entry<br />
into the market include wages, types of available jobs,<br />
access to resources <strong>and</strong> bias in markets <strong>and</strong> institutions<br />
(ILO, 2016c; World Bank, 2012).<br />
Perhaps not surprisingly, then, the links between<br />
women’s education <strong>and</strong> employment are not<br />
straightforward (Figure 3.14). For instance, while girls’<br />
education at all levels has been a significant factor<br />
in rising labour market involvement in Latin America<br />
<strong>and</strong> the Caribbean, only tertiary education has had a<br />
significant employment effect in the Middle East <strong>and</strong><br />
North Africa (ILO, 2012).<br />
Countries that have seen rapid growth in education<br />
attainment among girls have not seen a commensurate<br />
increase in decent work or changes in gendered social<br />
norms. In India, the female employment rates have<br />
decreased while female education increased, partly due<br />
to how labour force participation is measured (Bhalla<br />
<strong>and</strong> Kaur, 2011). Furthermore, while the levels of girls’<br />
<strong>and</strong> women’s enrolment in all levels of education is<br />
rising in the country, the female-to-male infant ratio is<br />
simultaneously dropping, especially among more urban<br />
populations, with gender-discriminatory views leading<br />
to sex-selective abortion <strong>and</strong> gender-discriminatory<br />
child-rearing practices (Jha et al., 2011; Patel, 2007). In<br />
Sri Lanka, significant improvement in female enrolment<br />
88<br />
CHAPTER 3 | PEOPLE: INCLUSIVE SOCIAL DEVELOPMENT
3<br />
FIGURE 3.14:<br />
Growth in female lower secondary completion rates is not<br />
always linked to higher female labour force participation<br />
Change in the female labour force participation rates <strong>and</strong> female<br />
lower secondary completion rates, circa 2000 <strong>and</strong> 2014<br />
Change in female labour force participation rates 2000–2014<br />
(percentage points)<br />
20<br />
15<br />
10<br />
5<br />
0<br />
-5<br />
-10<br />
-15<br />
-20<br />
-20<br />
-10 0 10 20 30 40 50 60<br />
Change in female lower secondary completion rates,<br />
2000–2014 (percentage points)<br />
Sources: ILO (2016b) <strong>and</strong> UIS database.<br />
Mali<br />
Ghana<br />
Morocco<br />
India<br />
<strong>and</strong> completion has not translated into workforce<br />
advantages, <strong>and</strong> instead has been accompanied by<br />
low <strong>and</strong> stagnant female labour force participation<br />
(Gunewardena, 2015).<br />
Bhutan<br />
Rising levels of women’s education have also seemed to<br />
have little impact on patterns of unpaid domestic <strong>and</strong><br />
care work. A study examining rising school enrolments<br />
for girls in Bangladesh <strong>and</strong> Malawi found no impact<br />
on the imbalance in girls’ <strong>and</strong> boys’ domestic work<br />
(Chisamya et al., 2012). In Ghana, despite increases in<br />
women’s education <strong>and</strong> female labour force participation<br />
overall, women’s wage employment stagnated.<br />
Unemployment for women rose, as did informal<br />
economic activity <strong>and</strong> self-employment, although<br />
more years of education increased chances of wage<br />
employment (Sackey, 2005). One study argues that<br />
education increases labour force participation when<br />
decent work in the public sector is available. However, in<br />
recent decades, public sector employment in Ghana has<br />
declined while education levels have risen. As a result,<br />
women above 50 in the formal sector worked in public<br />
sector jobs that provide more pay, but half of women<br />
aged 18 to 29 worked in the private informal sector<br />
with insecure incomes. This suggests that to empower<br />
70<br />
women, education reforms must be matched with better<br />
access to public sector jobs or laws ensuring that private<br />
formal <strong>and</strong> informal sector employers provide decent<br />
work (Darkwah, 2010).<br />
Analysis for this report using World Bank STEP data (see<br />
Chapter 2: Prosperity) found that women were more likely<br />
to work in the informal sector in countries including the<br />
Plurinational State of Bolivia, Colombia, Ghana <strong>and</strong> Kenya,<br />
while the reverse was true in Armenia, Georgia <strong>and</strong> Ukraine.<br />
Across all low <strong>and</strong> middle income countries, women were<br />
more likely than men to be classified as working <strong>and</strong> poor.<br />
However, as analysis showed the gap in educational<br />
attainment was not a strong explanatory factor, other<br />
reasons for women not having equitable access to stable,<br />
decent work should be examined (Chua, 2016).<br />
The lack of a clear positive link between education <strong>and</strong><br />
employment is also an issue for countries that have had<br />
persistently high levels of girls’ education attainment.<br />
For instance, in the United States, there continue to<br />
be low political participation, highly segregated labour<br />
markets <strong>and</strong> human rights concerns such as genderbased<br />
violence <strong>and</strong> the right to reproductive health<br />
services (Goetz, 2003; McBride <strong>and</strong> Parry, 2014). Similarly,<br />
high income Asian countries such as Japan <strong>and</strong> the<br />
Republic of Korea are famous for limited female labour<br />
force participation despite high levels of education <strong>and</strong><br />
the acknowledged need for more female labour force<br />
participation as the population ages. A simulation-based<br />
analysis comparing the experiences of Finl<strong>and</strong> <strong>and</strong><br />
Norway to Japan <strong>and</strong> the Republic of Korea showed that<br />
family-friendly policies <strong>and</strong> flexible work arrangements<br />
could enable more women <strong>and</strong> men to balance their<br />
work <strong>and</strong> family lives, promote fertility <strong>and</strong> encourage<br />
continued female labour force participation (Kinoshita<br />
<strong>and</strong> Guo, 2015).<br />
As Chapter 4: Peace shows education can improve<br />
women’s political participation. However, higher levels<br />
of women’s education do not necessarily translate to<br />
greater participation. Malaysia has seen increasing<br />
female enrolment, particularly in tertiary education, but<br />
women’s political participation has remained steady<br />
in the last 10 years (Salleh, 2012; World Bank, 2015b).<br />
Some countries with historically high levels of girls’ <strong>and</strong><br />
women’s education, such as the United Kingdom <strong>and</strong><br />
United States, have fewer women in senior political posts<br />
than some countries with fewer girls in school. Where<br />
women reach higher levels, they are often responsible<br />
for social, education <strong>and</strong> health portfolios – in 2010,<br />
2016 • GLOBAL EDUCATION MONITORING REPORT 89
3<br />
they were twice as likely to hold a social portfolio as an<br />
economic one (World Bank, 2011).<br />
towards working women, which influences female labour<br />
market decisions (Farré <strong>and</strong> Vella, 2013).<br />
Similarly, gender-based violence can continue in spite<br />
of high levels of education. Kerala state, India, has a<br />
high level of women’s education <strong>and</strong> literacy, yet rates<br />
of domestic violence <strong>and</strong> dowry-related crimes have<br />
been increasing. Furthermore, women’s levels of mental<br />
ill-health, <strong>and</strong> changes in marriage, inheritance <strong>and</strong><br />
succession practices have weakened women’s access<br />
to <strong>and</strong> control over inherited resources (Eapen <strong>and</strong><br />
Kodoth, 2003). 2<br />
Attitudes towards normative gender roles persist. One<br />
reason is they are transmitted across generations.<br />
Using data from the 1970 British Cohort Study, a study<br />
found that mothers’ <strong>and</strong> children’s gender role attitudes,<br />
measured 25 years apart, were strongly correlated, for<br />
both sons <strong>and</strong> daughters. Daughters <strong>and</strong> sons’ wives had<br />
greater levels of education <strong>and</strong> labour force participation<br />
if their mothers had non-traditional gender attitudes<br />
(Johnston et al., 2014). Analysis from high income countries<br />
including Australia<br />
<strong>and</strong> the United<br />
States found that<br />
A study in the United parents’ gender<br />
States found that<br />
attitudes <strong>and</strong><br />
behaviour had a<br />
women’s attitudes have<br />
significant impact<br />
a significant effect on on children’s fertility<br />
their children’s views choices, household<br />
division of labour<br />
towards working women,<br />
<strong>and</strong> women’s labour<br />
which influences female market participation<br />
labour market decisions (Fernández <strong>and</strong> Fogli,<br />
2006; Grosjean <strong>and</strong><br />
Khattar, 2015).<br />
A survey-based analysis of intergenerational transmission<br />
of gender attitudes in India finds strong positive<br />
correlations between parent <strong>and</strong> child attitudes, with<br />
mothers having greater influence than fathers. On<br />
average, when a parent holds a discriminatory gender<br />
attitude, their child is 15 percentage points more likely to<br />
hold that attitude; the effect is 50% larger for mothers<br />
than for fathers. Girls with more gender-discriminatory<br />
parents tend to drop out of school earlier than those with<br />
more gender-progressive parents (Dhar et al., 2015). A<br />
longitudinal analysis based on linked mother-child pairs<br />
in the United States finds that women’s attitudes have<br />
a statistically significant effect on their children’s views<br />
INTERVENTIONS WITH MULTIPLE<br />
PERSPECTIVES ARE NEEDED TO CREATE<br />
MORE EQUAL SOCIETIES<br />
Multiple stakeholders from multiple sectors can work<br />
together to create innovative interventions that<br />
integrate education in a central role, achieve more<br />
equitable delivery of services to society <strong>and</strong> build<br />
more equitable power structures. Both processes<br />
<strong>and</strong> outcomes require multiple perspectives <strong>and</strong><br />
underst<strong>and</strong>ings. Integrating complex approaches <strong>and</strong><br />
viewpoints, with education at the centre, is needed<br />
for overall social inclusion <strong>and</strong> participation. Examples<br />
discussed below include social protection <strong>and</strong> rural<br />
sanitation programmes. They show the need to tackle<br />
gender inequality <strong>and</strong> ways to do it. They show how<br />
education can encourage innovative service delivery,<br />
with positive results for participation <strong>and</strong> inclusion.<br />
Social protection programmes can have multiple,<br />
simultaneous outcomes, including on education<br />
Social protection programmes that seek to reduce<br />
risk <strong>and</strong> vulnerability – such as pensions, employment<br />
initiatives, social security <strong>and</strong> programmes targeting<br />
the poor, such as cash transfers <strong>and</strong> microfinance – can<br />
have outcomes in multiple areas, from lessening income<br />
poverty to improving educational access (UNESCO, 2015).<br />
Traditional social protection regimes such as pensions,<br />
social security <strong>and</strong> other employment insurance<br />
represent large shares of government spending <strong>and</strong> can<br />
have remarkable impact. For instance, in South Africa, the<br />
pension programme was exp<strong>and</strong>ed to the black population<br />
in the early 1990s, leading to a sudden large increase<br />
for many in household income. Evidence suggests<br />
pensions received by women had a systematic positive<br />
impact on young girls living with them: girls’ height for<br />
age <strong>and</strong> weight for height improved (Duflo, 2003), <strong>and</strong><br />
girls were significantly more likely to be in school (Case<br />
<strong>and</strong> Menendez, 2007). Studies found no effects when<br />
pensions were received by men; women were evidently<br />
more likely to use additional resources productively.<br />
Microfinance is an example of why more research is<br />
needed on the multiple effects of social interventions.<br />
Often taking the form of small loans <strong>and</strong> savings plans,<br />
it has been used as a key tool to empower poor women,<br />
aiming to improve decision-making power <strong>and</strong> overall<br />
90<br />
CHAPTER 3 | PEOPLE: INCLUSIVE SOCIAL DEVELOPMENT
3<br />
socio-economic status, <strong>and</strong> better risk management.<br />
But despite anecdotal evidence on multiple benefits, few<br />
analyses exist (Duvendack et al., 2011). What evidence<br />
does exist is mixed. For instance, providing savings to<br />
AIDS-orphaned young <strong>people</strong> in Ug<strong>and</strong>a helped increase<br />
their aspirations for secondary schooling <strong>and</strong> primary<br />
examination results (Curley et al., 2010). But data from<br />
Malawi showed that microcredit decreased primary<br />
school attendance among borrowers’ female children<br />
(Shimamura <strong>and</strong> Lastarria-Cornhiel, 2010).<br />
A key challenge in assessing the impact of social<br />
protection programmes is to look at the collective impact<br />
of integrated efforts, not isolating the impact of separate<br />
outcomes (see Chapter 6: Partnerships). For example,<br />
evidence suggests that cash transfer programmes in low<br />
<strong>and</strong> middle income countries, especially in Latin America,<br />
have had an impact on education access, especially for<br />
primary schooling, but more underst<strong>and</strong>ing is needed<br />
of their impact on education persistence <strong>and</strong> learning<br />
outcomes (UNESCO, 2015).<br />
Gender bias can be addressed by working together<br />
As gender equality in education cannot work in<br />
isolation, <strong>and</strong> achieving gender parity in education<br />
will not necessarily have direct consequences for<br />
women’s empowerment <strong>and</strong> economic freedom, more<br />
holistic engagement is needed at the community level,<br />
recognizing institutionalized <strong>and</strong> cultural biases <strong>and</strong><br />
ensuring that men are included in the process.<br />
Reducing gender bias by using behavioural insights in policymaking.<br />
Since behaviour is often deeply embedded,<br />
recognizing subconscious, automatic biases can help in<br />
designing more effective strategies at the institutional<br />
level to help reduce the<br />
negative consequences of<br />
The presence of gender bias (see Chapter<br />
1: Planet) (Bohnet, 2016).<br />
female leaders in<br />
The introduction of cable<br />
India was found television in rural India, which<br />
to narrow the led to increased information<br />
on alternative ways of living,<br />
gender gap in girls’<br />
led to improvement in gender<br />
aspirations <strong>and</strong> attitudes <strong>and</strong> behaviour<br />
advancement in between 2001 <strong>and</strong> 2003<br />
(Jensen <strong>and</strong> Oster, 2009).<br />
education<br />
Analysis of the US Scholastic<br />
Aptitude Test found that<br />
women were less likely to take risks <strong>and</strong> guess in these<br />
tests (Baldiga, 2014); <strong>and</strong> led to the test being redesigned<br />
to remove the penalty for wrong answers in order to<br />
reduce gender bias (Bohnet, 2016).<br />
Studies confirm the importance of female role models.<br />
The presence of female leaders in India was found<br />
to narrow the gender gap in girls’ aspirations <strong>and</strong><br />
advancement in education (Beaman et al., 2012). Female<br />
students were found to perform better in introductory<br />
math <strong>and</strong> science courses if taught by female faculty,<br />
<strong>and</strong> more likely to pursue careers in science, technology,<br />
engineering <strong>and</strong> mathematics (STEM) (Carrell et al.,<br />
2009). Observing <strong>and</strong> interacting with female experts in<br />
STEM fields improved female students’ attitudes about<br />
the fields (Stout et al., 2011).<br />
Men <strong>and</strong> women working together. Focusing on women’s<br />
initiatives is not enough. Men <strong>and</strong> women have to work<br />
together to achieve gender-balanced lives. Analysis of<br />
results of the International Men <strong>and</strong> Gender Equality<br />
Survey from 10,490 men aged 18 to 59 in 8 countries<br />
(Bosnia <strong>and</strong> Herzegovina, Brazil, Chile, Croatia, the<br />
Democratic Republic of the Congo, India, Mexico <strong>and</strong><br />
Rw<strong>and</strong>a) found that men’s education <strong>and</strong> income,<br />
<strong>and</strong> equitable practices in men’s childhood homes,<br />
were associated with their attitudes to equity. Men’s<br />
equitable attitudes were reflected in practices such as<br />
more participation in the home, reduced use of violence<br />
<strong>and</strong> higher relationship <strong>and</strong> sexual satisfaction; men’s<br />
education <strong>and</strong> their mother’s education were found to<br />
be positively associated with progress towards gender<br />
equality, except in India. An argument can be made<br />
for the importance of intergenerational learning in the<br />
childhood home, where fathers who participate more<br />
equally can help encourage less stereotypical role models<br />
(Levtov et al., 2014).<br />
Using survey-based research on gender-equitable<br />
attitudes, Instituto Promundo developed Program H/M<br />
in Brazil. Program H included group education sessions,<br />
youth-led campaigns <strong>and</strong> activism to transform gender<br />
stereotypes among young men. Program M aided<br />
young women to challenge deeply held stereotypes.<br />
Now adopted in over 20 countries, it has been lauded as<br />
best practice in promoting gender equality. Evaluations<br />
of Instituto Promundo educational workshops with<br />
young men to prevent gender-based violence <strong>and</strong><br />
promote gender equality in Brazil, Chile, India <strong>and</strong><br />
Rw<strong>and</strong>a found they led to significant changes in genderequitable<br />
attitudes, <strong>and</strong> significant decreases in selfreported<br />
violence against female partners (Instituto<br />
Promundo, 2012). Promundo’s MenCare campaign in<br />
2016 • GLOBAL EDUCATION MONITORING REPORT 91
3<br />
Brazil, Indonesia, Rw<strong>and</strong>a <strong>and</strong> South Africa aims to<br />
conduct group education sessions <strong>and</strong> focus on men’s<br />
roles in active fatherhood <strong>and</strong> caregiving, since fathers’<br />
involvement supports children’s development, fosters<br />
positive gender role models for the next generation,<br />
<strong>and</strong> benefits men <strong>and</strong> women’s health <strong>and</strong> economic<br />
outcomes (Levtov et al., 2015).<br />
Many community-based projects with integrated<br />
interventions target men <strong>and</strong> women working together<br />
for more equitable gender relations. In South Africa,<br />
Stepping Stones involved young men <strong>and</strong> women in<br />
a combined sexual health <strong>and</strong> gender <strong>and</strong> economic<br />
empowerment intervention, <strong>and</strong> demonstrated positive<br />
results in increasing women’s <strong>and</strong> men’s earnings,<br />
reducing intimate partner violence <strong>and</strong> creating more<br />
equitable gender attitudes (Jewkes et al., 2014). Senegal’s<br />
Tostan project encourages women <strong>and</strong> men to discuss<br />
human rights together <strong>and</strong> to develop new social norms<br />
around equality for men <strong>and</strong> women (Gillespie <strong>and</strong><br />
Melching, 2010). An adult literacy programme in rural<br />
Nepal employed a participatory <strong>and</strong> social empowerment<br />
approach to increase family <strong>and</strong> community recognition<br />
of women’s unpaid work by engaging marginalized<br />
women <strong>and</strong> some men in collecting data on their<br />
time use. The programme achieved a more equitable<br />
distribution of women’s unpaid care work in rural Nepal,<br />
<strong>and</strong> helped make women more active agents in public<br />
spaces (Marphatia <strong>and</strong> Moussié, 2013).<br />
Education can facilitate efforts to innovate in<br />
service delivery<br />
Various studies suggest that education <strong>and</strong> information<br />
can be combined with other strategies for improved<br />
service delivery. For instance, low income citizens who<br />
applied for food ration cards were often ignored in<br />
India, but those who filed official information requests<br />
about the status of their application <strong>and</strong> districtlevel<br />
processing times, bolstered by the 2010 Right to<br />
Information Act, were successful in obtaining the cards<br />
(Peisakhin <strong>and</strong> Pinto, 2010). Awareness-raising (of official<br />
information requests) was combined with capacitybuilding<br />
(to make the requests) <strong>and</strong> an enabling legal<br />
environment to improve access to services.<br />
ICT can be used for innovative interventions <strong>and</strong><br />
initiatives that equip citizens to improve the delivery of<br />
public services <strong>and</strong> enhance democratic participation.<br />
For example, relying more on technology such as mobile<br />
phones <strong>and</strong> e-governance platforms can help address a<br />
lack of administrative capacity (United Nations, 2014).<br />
Success depends on how well public <strong>and</strong> private sector<br />
providers develop the systems, <strong>and</strong> how <strong>and</strong> which<br />
citizens access the tools.<br />
Social accountability initiatives can improve service<br />
provision, increasing transparency <strong>and</strong> accountability,<br />
as well as the voice of citizens in decision-making (Fox,<br />
2015). For example, participatory budgeting is now used<br />
in over 1,500 cities worldwide, where citizens participate<br />
in decisions on how a portion of the municipal or local<br />
budget is spent (Dias et al., 2014).<br />
Low education levels, however, will impede effective<br />
use of innovative technology or interventions. In low<br />
income countries, low adult literacy rates <strong>and</strong> levels<br />
of educational attainment limit access to ICT-based<br />
government initiatives <strong>and</strong> services (United Nations,<br />
2014). The digital divide is linked to availability of<br />
infrastructure <strong>and</strong> tools, but also disparity in the<br />
education <strong>and</strong> skills to use the technology (OECD, 2001).<br />
Citizens need to be trained <strong>and</strong> educated to use ICT<br />
services, <strong>and</strong> computer literacy is pivotal in ensuring<br />
citizens’ acceptance <strong>and</strong> usage. In sub-Saharan Africa,<br />
the most common challenges to implementation of<br />
e-government initiatives include issues of language,<br />
literacy <strong>and</strong> human capacity, alongside infrastructure,<br />
legal frameworks <strong>and</strong> internet access (Nkohkwo <strong>and</strong><br />
Islam, 2013).<br />
Similarly, participatory budgeting was found in Peru<br />
to be less effective <strong>and</strong> susceptible to takeover by<br />
elites when populations were less literate <strong>and</strong> lacked<br />
access to information in local languages (Dias et al.,<br />
2014). Participants with higher levels of education are<br />
shown to have<br />
higher influence<br />
Training <strong>and</strong> development<br />
on participatory<br />
meetings (Ganuza<br />
of facilitators, called<br />
<strong>and</strong> Francés, 2012).<br />
‘natural leaders’, is the key Participatory<br />
way education has helped<br />
budgeting in La<br />
Serena, Chile,<br />
influence community<br />
was considered<br />
members <strong>and</strong> facilitate successful because<br />
sanitation improvements<br />
the mayor<br />
emphasized<br />
education for civil<br />
society (Cabannes, 2014).<br />
Community ownership <strong>and</strong> training achieved sustained<br />
changes in rural sanitation<br />
92<br />
CHAPTER 3 | PEOPLE: INCLUSIVE SOCIAL DEVELOPMENT
3<br />
While it is hard to change ingrained behaviour such<br />
as sanitation practices, community-level ownership,<br />
through committed community facilitators, has led<br />
to significant, sustained success in rural sanitation.<br />
Changing sanitation practices, such as open defecation,<br />
has been difficult; their link with cultural norms <strong>and</strong><br />
mindsets requires community-wide systematic changes.<br />
The most significant success in changing rural sanitation<br />
practices in recent decades is the community-led<br />
total sanitation (CLTS) programme, which has been<br />
implemented in over 60 countries <strong>and</strong> incorporated into<br />
national plans in over 20 (World Bank, 2015a).<br />
What makes this programme different from other<br />
interventions is using the community to shape norms.<br />
The intervention’s goal is to change community norms<br />
by triggering shame <strong>and</strong> disgust for open defecation.<br />
It relies strongly on key community facilitators,<br />
<strong>and</strong> culminates in a celebration of a village free from<br />
open defecation. Community members with minimal<br />
specialized training have been exceptionally important<br />
in educating <strong>and</strong> influencing sanitation-related<br />
change. Training <strong>and</strong> development of facilitators,<br />
called ‘natural leaders’, is the key way education has<br />
helped influence community members <strong>and</strong> facilitate<br />
sanitation improvements. The natural leaders <strong>and</strong><br />
community consultants have been institutionalized<br />
into local government in many countries. Experts have<br />
argued that this mainstreaming has been a significant<br />
innovation in helping scale up CLTS. The programme has<br />
led to profound change in sanitation practice <strong>and</strong> policy,<br />
though experts warn not to link success to specific<br />
tools <strong>and</strong> indicators rather than the empowerment <strong>and</strong><br />
education of community members (Cavill et al., 2015;<br />
Kar, 2014).<br />
<strong>and</strong> women.<br />
The evidence also makes it clear that education systems<br />
<strong>and</strong> outcomes are interlinked with other sectors. The<br />
availability of health systems <strong>and</strong> adequate nutrition,<br />
water <strong>and</strong> energy sources are central to education: the<br />
health status of infants <strong>and</strong> children determines their<br />
ability to learn, health infrastructure can be used to<br />
deliver education interventions, <strong>and</strong> access of teachers<br />
to good health care is indispensable to the functioning of<br />
the education sector. Ultimately, convergence between<br />
education policy planning <strong>and</strong> that concerning health,<br />
nutrition, water <strong>and</strong> sanitation, <strong>and</strong> energy is required to<br />
promote a holistic approach to human development <strong>and</strong><br />
address multidimensional poverty challenges.<br />
At the same time, education progress is not enough<br />
to combat social development challenges. There is a<br />
strong persistence of marginalization, discrimination<br />
<strong>and</strong> disadvantage of various vulnerable groups in most<br />
societies. Nor has major progress in increasing girls’<br />
educational attainment had a straightforward effect on<br />
their economic <strong>and</strong> life chances. Achieving substantive<br />
gender equality, reducing inequality <strong>and</strong> influencing<br />
behaviour related to health <strong>and</strong> well-being requires<br />
multifaceted strategies that involve <strong>and</strong> engage sectors<br />
beyond education.<br />
ENDNOTES<br />
1. The gender equality related discussion in this section <strong>and</strong> the rest of the<br />
chapter draws extensively on Peppin Vaughan (2016).<br />
2. It is important to note that higher levels of education may also encourage a<br />
higher level of reporting violence.<br />
CONCLUSION<br />
If social development is viewed as the right to healthy,<br />
empowered lives, then it is clear that education<br />
is a powerful enabler, <strong>and</strong> a key aspect, of social<br />
development. Whether understood as knowledge <strong>and</strong><br />
skills which young <strong>people</strong> acquire at school or as an<br />
infrastructure that can be used to deliver interventions,<br />
education is central to ensuring that <strong>people</strong> can<br />
live healthy lives <strong>and</strong> improve their children’s lives.<br />
Education can also have powerful transformative<br />
effects in enhancing gender equality in society <strong>and</strong><br />
improving agency, voice <strong>and</strong> participation for vulnerable<br />
populations, a majority of whom are adolescent girls<br />
2016 • GLOBAL EDUCATION MONITORING REPORT 93
Children look through<br />
a destroyed classroom<br />
window at Yerwa Primary<br />
School, Maiduguri, Borno<br />
state, damaged by Boko<br />
Haram during attacks in<br />
2010 <strong>and</strong> 2013. The school,<br />
established in 1915, was<br />
the first primary school in<br />
northeast Nigeria.<br />
CREDIT: Bede Sheppard/Human Rights Watch<br />
94<br />
CHAPTER 4 | PEACE: POLITICAL PARTICIPATION, PEACE AND ACCESS TO JUSTICE
CHAPTER<br />
4<br />
Peace: political<br />
participation,<br />
peace <strong>and</strong> access<br />
to justice<br />
NO<br />
POVERTY<br />
ZERO<br />
HUNGER<br />
We are determined to foster peaceful, just <strong>and</strong><br />
inclusive societies which are free from fear <strong>and</strong><br />
GOOD HEALTH<br />
QUALITY<br />
GENDER<br />
violence. There AND WELL-BEING can be no EDUCATION sustainable development<br />
EQUALITY<br />
without peace <strong>and</strong> no peace without sustainable<br />
development.<br />
CLEAN WATER<br />
AND SANITATION<br />
AFFORDABLE AND<br />
CLEAN ENERGY<br />
DECENT WORK AND<br />
ECONOMIC GROWTH<br />
– INDUSTRY, The INNOVATION 2030 Agenda REDUCED for Sustainable SUSTAINABLE Development<br />
CITIES<br />
AND INFRASTRUCTURE<br />
INEQUALITIES<br />
AND COMMUNITIES<br />
RESPONSIBLE<br />
CONSUMPTION<br />
AND PRODUCTION<br />
CLIMATE<br />
ACTION<br />
LIFE<br />
BELOW WATER<br />
LIFE<br />
ON LAND<br />
PEACE, JUSTICE<br />
AND STRONG<br />
INSTITUTIONS<br />
PARTNERSHIPS<br />
FOR THE GOALS<br />
95
4<br />
KEY MESSAGES<br />
Getting children into school doesn’t result in more peace,<br />
but the right type of education can help.<br />
Conflict <strong>and</strong> violence are meanwhile destroying<br />
education systems.<br />
1<br />
Education makes <strong>people</strong> more likely to participate in political processes constructively<br />
<strong>and</strong> non-violently.<br />
a. Education <strong>and</strong> communication campaigns can teach <strong>people</strong> how to participate in politics <strong>and</strong><br />
access political information.<br />
b. The right type of education <strong>and</strong> teaching promotes the transition to more participatory political systems.<br />
c. Democratic regimes tend to result in more <strong>and</strong> better quality education.<br />
2<br />
Better education is clearly linked to more women in political leadership.<br />
a. Gender equality in politics is far from being achieved.<br />
b. Women with more education possess more skills to take up leadership roles.<br />
c. When there are more women in politics, gender gaps in education shrink.<br />
3<br />
An education that is provided equally, with inclusive teaching <strong>and</strong> learning materials, is a powerful<br />
preventive tool <strong>and</strong> antidote for conflict.<br />
4<br />
Conflict is taking an increasingly large toll on education systems.<br />
a. Children, teachers <strong>and</strong> schools are frequently under attack.<br />
b. Forcibly displaced <strong>people</strong>, especially children <strong>and</strong> youth, are in dire need of access to education.<br />
c. Other forms of violence, including school-based bullying <strong>and</strong> sexual violence, are of concern.<br />
5<br />
Education should be better recognized in peacebuilding agendas for its role in helping with<br />
conflict resolution.<br />
6<br />
Education can reduce crime <strong>and</strong> violence against children <strong>and</strong> youth.<br />
7<br />
Educational programmes help marginalized <strong>people</strong> access justice <strong>and</strong> legal protection.<br />
96<br />
CHAPTER 4 | PEACE: POLITICAL PARTICIPATION, PEACE AND ACCESS TO JUSTICE
4<br />
Education <strong>and</strong> literacy contribute to more participatory politics.................... 97<br />
The relationship between education <strong>and</strong> conflict is multifaceted.................. 103<br />
Education can play a key role in building a functioning justice system.......110<br />
Conclusion..................................................................................................................................... 111<br />
Violence can be prevented <strong>and</strong> stable peace is more<br />
likely in societies where institutions are democratic<br />
<strong>and</strong> representative – of women as well as minorities, of<br />
the poorest as well as the most affluent. Marginalized<br />
groups may resort to conflict <strong>and</strong> violence if there are<br />
no peaceful alternatives for resolving their grievances.<br />
It is projected that by 2030 up to 62% of <strong>people</strong> living in<br />
extreme poverty will be in countries at risk of high levels<br />
of violence (OECD, 2015).<br />
Education has a key role in contributing to the political<br />
participation <strong>and</strong> inclusion vital to ensure social<br />
cohesion, <strong>and</strong> to prevent <strong>and</strong> mitigate tensions in<br />
societies that are – as described in the statement above<br />
from the preamble to the 2030 Sustainable Development<br />
Goals (SDGs) – ‘peaceful, just <strong>and</strong> inclusive’ <strong>and</strong> ‘free from<br />
fear <strong>and</strong> violence’.<br />
Sustainable peace also requires a well-functioning justice<br />
system that offers citizens, regardless of social status,<br />
a more attractive alternative to violence to resolve<br />
personal <strong>and</strong> political disputes. If <strong>people</strong> feel they have<br />
no access to justice to address their legal needs <strong>and</strong> to<br />
assert <strong>and</strong> protect their rights, they are more likely to<br />
resort to violent means, undermining the establishment<br />
<strong>and</strong> consolidation of peace.<br />
This chapter is divided into three sections. It starts<br />
by documenting links between education <strong>and</strong> politics,<br />
showing that education offers transformative<br />
possibilities for participation, inclusion, advocacy<br />
<strong>and</strong> democracy. It then examines the multifaceted<br />
relationship between education <strong>and</strong> conflict <strong>and</strong><br />
violence, especially<br />
Education is a key<br />
in contexts where<br />
education is lacking,<br />
ingredient for acquiring<br />
unequal or biased. It<br />
political knowledge shows that education<br />
can contribute to<br />
conflict, but can<br />
also reduce or eliminate it. The chapter also shows how<br />
education can play a crucial role in peacebuilding <strong>and</strong><br />
help address the alarming consequences of its neglect.<br />
It examines education <strong>and</strong> violence unrelated to conflict<br />
<strong>and</strong> war. The final section provides evidence of how<br />
education initiatives, in particular driven by civil society<br />
organizations, can help marginalized populations gain<br />
access to justice.<br />
EDUCATION AND LITERACY<br />
CONTRIBUTE TO MORE<br />
PARTICIPATORY POLITICS<br />
Political inclusion is about facilitating participation<br />
throughout the political cycle, not just at elections.<br />
Active participation in political processes enables <strong>people</strong><br />
to underst<strong>and</strong> <strong>and</strong> engage with the underlying causes<br />
of social problems at the local <strong>and</strong> global levels. It also<br />
makes the electorate <strong>and</strong> polity more representative of<br />
society, holds governments more effectively to account<br />
<strong>and</strong> helps enforce constitutionally guaranteed rights.<br />
Education is a key ingredient for acquiring political<br />
knowledge, though opportunities to learn are determined<br />
by the availability of information, free from restrictions<br />
or censorship.<br />
2016 • GLOBAL EDUCATION MONITORING REPORT 97
4<br />
EDUCATION MATTERS IN INCREASING<br />
POLITICAL KNOWLEDGE<br />
Political participation requires knowledge <strong>and</strong><br />
underst<strong>and</strong>ing. Educated <strong>people</strong> are more likely to<br />
know facts related to the key players <strong>and</strong> workings<br />
of their political system. In the county of Busia in<br />
the former Western Province of Kenya, a scholarship<br />
programme targeting girls from politically marginalized<br />
ethnic groups led to their increased participation<br />
in secondary schooling <strong>and</strong> boosted their political<br />
knowledge. Girls who benefited from the programme<br />
were 14% more likely to read newspapers that reported<br />
extensively on national politics. Political knowledge also<br />
went up – for instance, those who received scholarships<br />
were much more likely to be able to name the president<br />
<strong>and</strong> the health minister of Ug<strong>and</strong>a (Friedman et al., 2011).<br />
In countries where the predominant administrative<br />
language is spoken by a minority of the population,<br />
underst<strong>and</strong>ing this language gives individuals access to<br />
a wider range of political knowledge. In Mali, secondary<br />
or tertiary education attainment was the factor with the<br />
greatest effect on respondents’ ability to name the heads<br />
of the assembly <strong>and</strong> of the majority party (Bleck, 2015).<br />
Beyond formal schooling, civic education can instil<br />
specific political knowledge. In the Democratic Republic<br />
of the Congo, the Voter Opinion <strong>and</strong> Involvement through<br />
Civic Education programme, implemented in 2010/11,<br />
increased participation in the political decentralization<br />
process m<strong>and</strong>ated by a 2007 law. Adult literacy was low,<br />
so a key strategy was to organize community education<br />
sessions using simple drawings <strong>and</strong> other images,<br />
resulting in significant gains in knowledge – by a full three<br />
correct answers out of the six questions asked about<br />
decentralization. The greatest impact was among the<br />
participants who had the least information before the<br />
programme began (Finkel <strong>and</strong> Rojo-Mendoza, 2013).<br />
EDUCATION HELPS SHAPE ELECTORAL<br />
PARTICIPATION<br />
Voting is generally considered one of the less<br />
dem<strong>and</strong>ing forms of political participation, <strong>and</strong> can<br />
provide equal opportunities for all to participate. But<br />
individuals need knowledge <strong>and</strong> skills to register to<br />
vote, underst<strong>and</strong> the stakes <strong>and</strong> take an interest in<br />
the outcomes of an election.<br />
In many North American <strong>and</strong> Western European<br />
democracies, formal education has been shown to have<br />
an impact on the probability that an individual will vote. 1<br />
In the United States, for instance, studies showed that<br />
students receiving more educational interventions, such<br />
as being taught in smaller classes, getting extra mentoring<br />
<strong>and</strong> taking part in pre-school activities, participated in<br />
elections at higher rates (Sondheimer <strong>and</strong> Green, 2010).<br />
In some developing countries, providing citizens with<br />
specific information affected voter turnout. In Mozambique,<br />
right before the 2009 elections, a voter education campaign<br />
was conducted with support <strong>and</strong> collaboration by a<br />
newspaper <strong>and</strong> a consortium of eight non-government<br />
organizations (NGOs). Three interventions provided<br />
information to voters <strong>and</strong> called for electoral participation<br />
– an SMS-based information campaign conveying neutral<br />
information about the elections, an SMS hotline receiving<br />
<strong>and</strong> disseminating information about electoral misconduct,<br />
<strong>and</strong> a free newspaper focusing on civic education. The<br />
three together increased official voter turnout by close to<br />
five percentage points (Aker et al., 2013).<br />
In several young democracies, women are less likely to<br />
vote than men <strong>and</strong>, when they do vote, are more likely to<br />
follow the preferences of household males. In Pakistan, just<br />
before the 2008 national elections, a non-partisan, doorto-door<br />
voter awareness campaign provided information<br />
to women on the importance of voting <strong>and</strong> the secrecy<br />
of the ballot. Women who received this information were<br />
found to be 12 percentage points more likely to vote than<br />
those who did not, <strong>and</strong> significantly more likely to choose<br />
a c<strong>and</strong>idate independently (Giné <strong>and</strong> Mansuri, 2011).<br />
Yet, whether better-educated citizens decide to use<br />
their capabilities or deliberately disengage may depend<br />
on the political context. When electoral participation<br />
does not provide genuine input into a political process<br />
– because opposition parties are harassed, for example,<br />
or judicial institutions<br />
are biased – voters can<br />
express displeasure<br />
In Pakistan, a<br />
by withdrawing from<br />
voter-awareness politics. In Zimbabwe,<br />
campaign before the 2002 <strong>and</strong> 2005<br />
elections were marked<br />
the 2008 elections<br />
by severe repression of<br />
made women<br />
the opposition; bettereducated<br />
individuals<br />
12 percentage<br />
deliberately chose to<br />
points more likely<br />
reduce their electoral<br />
to vote<br />
participation, possibly<br />
believing that voting<br />
98<br />
CHAPTER 4 | PEACE: POLITICAL PARTICIPATION, PEACE AND ACCESS TO JUSTICE
4<br />
would legitimize the regime in power. This negative<br />
effect of education on electoral participation dissipated<br />
following 2008’s relatively more competitive election,<br />
which initiated a power-sharing arrangement. Bettereducated<br />
<strong>people</strong> re-engaged with politics when political<br />
conditions allowed them to reflect their political<br />
preferences more meaningfully (Croke et al., 2015).<br />
Voter education campaigns can respond to<br />
electoral misconduct<br />
In newly democratic low income countries, elections<br />
sometimes increase the propensity for civil conflict.<br />
Kenya, Nigeria <strong>and</strong> Zimbabwe provide examples of<br />
election cycles marked by thous<strong>and</strong>s of deaths.<br />
Politicians may secure votes by stirring up greed,<br />
rivalry <strong>and</strong> fear. Well-designed voter education campaigns<br />
can reduce such behaviour. In Nigeria, an anti-violence<br />
campaign, conducted in the run-up to the national <strong>and</strong><br />
state elections in 2007, involved town meetings, popular<br />
theatre <strong>and</strong> door-to-door distribution of materials.<br />
It reduced intimidation, voter turnout was nearly<br />
10% higher where the campaign was implemented,<br />
<strong>and</strong> independent journalists reported a decrease in<br />
the intensity of violence (Collier <strong>and</strong> Vicente, 2014).<br />
In New Delhi slums, in India, during the run-up to<br />
the 2008 state legislature elections, door-to-door<br />
distribution of newspapers provided information about<br />
the performance <strong>and</strong> qualifications of the incumbent<br />
<strong>and</strong> the two other c<strong>and</strong>idates. The campaign not only<br />
increased the average voter turnout by 4% but also<br />
decreased by almost 20% the use of vote-buying as an<br />
electoral strategy (Banerjee et al., 2011).<br />
EDUCATION CAN HELP PEOPLE MAKE THEIR<br />
VOICES HEARD<br />
While voting is a pivotal form of political participation,<br />
elections are not the only type of political or civic<br />
participation in which citizens can exercise regular<br />
control <strong>and</strong> influence on government actors <strong>and</strong><br />
hold them accountable. A wide array of political<br />
activities can convey more precise dem<strong>and</strong>s <strong>and</strong><br />
generate more pressure than a single vote. Better<br />
education can help <strong>people</strong> be more critically minded<br />
<strong>and</strong> politically engaged in such activities. It can also<br />
increase representation by marginalized groups, such<br />
as women (Box 4.1).<br />
BOX 4.1<br />
Better education <strong>and</strong> women’s involvement in national <strong>and</strong> local decision-making bodies are closely linked<br />
Recent years have seen a rising tide of women’s political representation. For example, more women than ever before are being elected to national assemblies, including in<br />
Argentina, Portugal <strong>and</strong> Rw<strong>and</strong>a. The global average has been climbing <strong>and</strong> in 2014 was close to 22% – far from equality but an improvement over 14% in 2000. The adoption of<br />
affirmative action measures – such as quotas on party electoral lists or reserved seats – has been critical in facilitating women’s entry into national assemblies.<br />
Yet, in local governance, women remain under-represented. According to one estimate, just 16% of mayors of capital cities across the world were women in 2015. In<br />
executive positions in governments, too, women continue to be very much in a minority <strong>and</strong> confined mainly to gender-stereotyped portfolios.<br />
Structural barriers to women’s involvement <strong>and</strong> advancement in formal representative politics include their relative lack of material resources to support their move<br />
into politics; their additional work burden, which denies them the time necessary to engage in politics; the prevalence of masculine models of political life <strong>and</strong> elected<br />
government bodies; <strong>and</strong> cultural values such as those barring women from the public sphere.<br />
But girls’ education helps give women the skills they need to take on leadership roles in public life – on community councils, in national office <strong>and</strong> on international bodies.<br />
In many countries, such as Sierra Leone, women who consider entering politics often feel disadvantaged by a lack of education <strong>and</strong> of the experience of campaigning <strong>and</strong><br />
public speaking. A study drawing on the life histories of women leaders at various levels of government in eight countries, including Brazil, Egypt <strong>and</strong> Ghana, found that<br />
those with higher educational levels held office in higher tiers of government.<br />
Greater representation of women in politics <strong>and</strong> public office can also reduce gender disparities in education <strong>and</strong> provide positive role models for other women, increasing<br />
their educational aspirations <strong>and</strong> achievements, <strong>and</strong> thereby improving female educational attainment levels. Across the 16 biggest states in India, a 10% increase in the<br />
number of women involved in district politics would lead to an increase of nearly 6% in primary school completion, with a larger impact on girls’ education. Similarly, in<br />
villages assigned a female leader for two election cycles, the gender gap in career aspirations shrank by 25% in parents <strong>and</strong> 32% in adolescents.<br />
Sources: Beaman et al. (2012); Burchi (2013); Castillejo (2009); Domingo et al. (2015); Monteiro (2012); Powley (2005); Tadros (2014); UCLG (2015);<br />
UN Women (2011, 2015).<br />
2016 • GLOBAL EDUCATION MONITORING REPORT 99
4<br />
One direct form of political participation is contacting a<br />
public representative to request information or express<br />
an opinion. Across 102 countries, adults with a tertiary<br />
education were 60% more likely to request information<br />
from the government than those with a primary<br />
education or less – <strong>and</strong> 84% more likely in developing<br />
countries (World Justice Project, 2015). In Côte d’Ivoire<br />
<strong>and</strong> Ghana, higher levels of formal education were<br />
associated with a greater likelihood of contacting an<br />
elected official (MacLean, 2011).<br />
Better-educated <strong>people</strong> are also more likely to make<br />
their voices heard by participating in political <strong>and</strong><br />
community meetings <strong>and</strong> processes. An analysis<br />
drawing on recent data from over 27,000 respondents<br />
in 20 emerging sub-Saharan African democracies<br />
found that <strong>people</strong> with primary schooling were three<br />
percentage points more likely to attend community<br />
meetings than those with no education. For <strong>people</strong> with<br />
secondary or post-secondary education, the impact<br />
was about twice that (Isaksson, 2014). In Benin,<br />
adults who had attended the first elementary schools<br />
established by the French were 32% more likely to be<br />
party members <strong>and</strong> 34% more likely to campaign for<br />
parties, <strong>and</strong> made up the majority of the few <strong>people</strong><br />
who stood for election to political office (Wantchekon<br />
et al., 2015).<br />
Schools are not the only locus for political socialization.<br />
Civil society plays an important role in educating adults<br />
<strong>and</strong> increasing their political participation, especially at<br />
the local level. In rural Senegal, a study of 1,484 votingage<br />
individuals found that beneficiaries of NGO-run,<br />
non-formal education programmes were more likely to<br />
contact a political official or influential person to obtain<br />
help resolving community <strong>and</strong> personal problems.<br />
Furthermore, such programmes increased political<br />
participation even more than formal education did, a<br />
finding partly attributed to their being conducted in local<br />
languages (Kuenzi, 2006, 2011).<br />
Well-designed civic education programmes can<br />
increase political participation<br />
In many countries, youth involvement in political<br />
processes is low. Across 38 countries taking part in the<br />
2009 International Civic <strong>and</strong> Citizenship Education<br />
Study (ICCS), only a small minority of 14-year-old<br />
students reported participating in organizations<br />
such as party youth groups, unions, environmental<br />
groups <strong>and</strong> human rights organizations (Schulz et<br />
al., 2010).<br />
Students who attend schools that provide well-designed<br />
civics education are more likely to be actively<br />
involved in politics. Most teachers from the European<br />
countries participating in the 1999 International<br />
Association for the Evaluation of Educational<br />
Achievement (IEA) Civic Education Study agreed that<br />
teaching civic education could make a difference<br />
for students’ political <strong>and</strong> civic development: the<br />
percentages agreeing ranged from 53% in the Czech<br />
Republic <strong>and</strong> 65% in Cyprus to over 80% elsewhere<br />
(Torney-Purta, 2002). Moreover, civic education can<br />
have long-lasting effects. A study drawing on data from<br />
eight European countries, including Denmark, Pol<strong>and</strong><br />
<strong>and</strong> Slovenia, showed that some civic skills <strong>and</strong> political<br />
values acquired in school were retained into adulthood<br />
(Hooghe <strong>and</strong> Wilkenfeld, 2008).<br />
In many countries,<br />
citizenship<br />
Student-centred<br />
education is part<br />
activities such as mock of the compulsory<br />
elections <strong>and</strong> discussion curriculum, whether<br />
delivered in discrete<br />
boards result in more<br />
lessons, integrated<br />
political participation into other disciplines<br />
or taught in a crosscurricular<br />
approach<br />
(Eurydice, 2012). Yet, the impact of civic education<br />
critically depends on how programmes are designed, the<br />
kinds of teaching methods employed <strong>and</strong> the quality of<br />
facilitators or trainers. In the United States, the Student<br />
Voices in the Campaign curriculum educated high school<br />
students on national <strong>and</strong> local elections during the<br />
2002/03 school year. The curriculum included studentcentred<br />
activities such as mock elections, meetings<br />
with those campaigning for local political office, letterwriting,<br />
<strong>and</strong> online polls <strong>and</strong> discussion boards. A followup<br />
evaluation with students after the 2004 elections<br />
found the curriculum led to increased <strong>and</strong> sustained<br />
interest in formal types of political engagement such<br />
as volunteering for a campaign (Pasek et al., 2008;<br />
Syvertsen et al., 2009).<br />
In the Dominican Republic, Pol<strong>and</strong> <strong>and</strong> South Africa,<br />
adults who were exposed to civic education programmes<br />
conducted by NGOs were significantly more active in<br />
local politics, for example attending municipal meetings<br />
or participating in community problem-solving activities.<br />
The impact was greater when individuals received more<br />
frequent exposure to civic education; when messages<br />
were taught through active <strong>and</strong> participatory methods;<br />
100<br />
CHAPTER 4 | PEACE: POLITICAL PARTICIPATION, PEACE AND ACCESS TO JUSTICE
4<br />
<strong>and</strong> when individuals had sufficient prior political<br />
resources to act on messages received through training<br />
(Finkel, 2002, 2003).<br />
EDUCATION CAN CHANNEL DISCONTENT INTO<br />
NON-VIOLENT CIVIL MOVEMENTS<br />
From the Occupy movement to the Arab Spring <strong>and</strong><br />
mass protests on the streets of Brazil <strong>and</strong> Turkey, <strong>people</strong><br />
around the world are increasingly using unarmed tactics<br />
to challenge oppressive, corrupt <strong>and</strong> unfair political <strong>and</strong><br />
economic systems. Education makes it more likely that<br />
discontented citizens will channel their concerns through<br />
non-violent civil movements, such as protests, boycotts,<br />
strikes, rallies, political demonstrations <strong>and</strong> social noncooperation<br />
<strong>and</strong> resistance. In China, citizens with a<br />
college degree not only agreed on the need to improve<br />
democracy, but supported various types of political<br />
participation, such as mass demonstrations <strong>and</strong> political<br />
rallies, <strong>and</strong> resisted the official government petitioning<br />
system (Wang et al., 2015).<br />
Such non-violent actions take place outside traditional<br />
political channels, making them distinct from other<br />
non-violent political processes such as lobbying,<br />
electioneering <strong>and</strong><br />
legislating. For those<br />
Studies from 106<br />
who fail to get what they<br />
need from the political<br />
states show that<br />
system through the<br />
groups with higher electoral system or by<br />
education are less<br />
direct communication<br />
or negotiations, nonviolent<br />
civil actions offer<br />
likely to engage in<br />
violent protests the potential for issues<br />
to be heard <strong>and</strong> possibly<br />
addressed. Using data on<br />
238 ethnic groups in 106 states from 1945 to 2000, a<br />
study found that ethnic groups with higher levels of<br />
educational attainment were more likely to engage in<br />
non-violent protests than those with lower levels of<br />
education (Shaykhutdinov, 2011).<br />
authoritarian regimes fall to non-violent uprisings<br />
are much more likely to transition to democracy <strong>and</strong><br />
experience civil peace than if regimes fall to armed<br />
uprisings (Chenoweth <strong>and</strong> Stephan, 2011). Non-violent<br />
action was a central component of 50 out of 67<br />
democratic transitions from 1973 to 2005 (Johnstad,<br />
2010; Karatnycky <strong>and</strong> Ackerman, 2005).<br />
In some countries, protest has arisen from higher<br />
educated individuals lacking suitable jobs. In the<br />
years leading up to the Arab Spring, the expansion<br />
of schooling in the Arab world increased the pool of<br />
individuals who had completed primary school <strong>and</strong><br />
attained some secondary schooling (<strong>and</strong> beyond) but<br />
had not seen that education rewarded in the labour<br />
market. According to one study drawing on the World<br />
Values Survey from 2005–2007, in many countries<br />
in the Middle East marked by the Arab Spring, more<br />
educated individuals were more likely to engage in<br />
demonstrations, boycotts <strong>and</strong> strikes; the link between<br />
education <strong>and</strong> political protest was stronger among<br />
individuals who had poor outcomes in the labour<br />
market (Campante <strong>and</strong> Chor, 2012).<br />
INVESTMENTS IN EDUCATION AND<br />
DEMOCRACY CAN BE MUTUALLY SUPPORTIVE<br />
Broad <strong>and</strong> equitable access to good quality education<br />
plays an important role in sustaining democratic practices<br />
<strong>and</strong> institutions. Higher literacy levels, induced by the<br />
expansion of mass primary schooling, accounted for half the<br />
regime transitions towards higher levels of democracy over<br />
1870–2000 (Murtin <strong>and</strong> Wacziarg, 2014). The likelihood of a<br />
country establishing <strong>and</strong> maintaining a democratic regime<br />
is higher the more educated its population. Oligarchic<br />
societies that started with a more equal distribution<br />
of education would be expected to democratize<br />
sooner (Bourguignon <strong>and</strong> Verdier, 2000). A study of<br />
104 countries over 1965–2000 found that, even after<br />
controlling for country-specific effects, a more equal<br />
distribution of education was the main determinant for<br />
the transition to democracy (Castelló-Climent, 2008).<br />
Not all non-violent actions succeed, but such activities<br />
are effective means of achieving significant social<br />
<strong>and</strong> political change. An analysis of 323 non-violent<br />
<strong>and</strong> violent resistance campaigns for regime change,<br />
anti-occupation <strong>and</strong> secession from 1900 to 2006<br />
showed that non-violent resistance was nearly twice as<br />
effective as violent resistance in removing incumbent<br />
governments from power. Moreover, countries where<br />
In many countries, greater access to tertiary education<br />
has played a critical role in promoting the transition<br />
to democracy <strong>and</strong> sustaining democratic regimes.<br />
University students were a driving force behind the<br />
popular protests that brought down many authoritarian<br />
regimes in sub-Saharan Africa in the early 1990s (Bratton<br />
<strong>and</strong> Walle, 1997). A study on Benin, Ghana, Kenya <strong>and</strong><br />
Senegal showed that elected representatives with<br />
2016 • GLOBAL EDUCATION MONITORING REPORT 101
4<br />
tertiary education formed the core of cross-party<br />
coalitions that initiated recent reforms (Barkan<br />
et al., 2004).<br />
Just as equal education opportunities for all can facilitate<br />
democratic regimes, democratic governance tends<br />
to result in more <strong>and</strong> better education. The success<br />
of the Universal Primary Education programme in<br />
Ug<strong>and</strong>a was heavily influenced by Ug<strong>and</strong>a’s return to<br />
multic<strong>and</strong>idate – if not multiparty – political competition<br />
in 1996. It increased the incentive for the government<br />
to successfully implement the programme because of<br />
perceptions that the government’s performance would<br />
be judged accordingly. Ug<strong>and</strong>an voters indeed evaluated<br />
their president’s overall performance highly, <strong>and</strong> the<br />
Universal Primary Education programme was one of the<br />
major reasons (Stasavage, 2005).<br />
HOW TEACHING IS DONE MATTERS FOR THE<br />
POLITICAL OUTCOMES OF EDUCATION<br />
An open learning environment that supports discussion<br />
of controversial political <strong>and</strong> social issues, <strong>and</strong> allows<br />
students to hear <strong>and</strong> express differing opinions,<br />
has been shown to lead to better political outcomes<br />
(Davies, 2009). Through interactions with peers, teachers<br />
<strong>and</strong> political leaders, students gain knowledge about<br />
the political process, engage in careful reasoning about<br />
policy issues <strong>and</strong> practise how to argue <strong>and</strong> debate.<br />
Similarly, active <strong>and</strong> participatory teaching methods,<br />
such as role playing, dramatizations <strong>and</strong> group decisionmaking,<br />
have a greater effect on individual political<br />
orientation than more traditional rote learning does<br />
(Harber <strong>and</strong> Mncube, 2012).<br />
Drawing on data from 35 countries participating in<br />
the 2009 ICCS, a recent study showed that openness<br />
in classroom discussions, with students having the<br />
opportunity to discuss <strong>and</strong> give their opinion on<br />
political <strong>and</strong> social issues, was positively associated<br />
with individuals’ future intention to participate in civic<br />
<strong>and</strong> political engagement (Quintelier <strong>and</strong> Hooghe, 2013).<br />
In Israel <strong>and</strong> Italy, an open <strong>and</strong> democratic classroom<br />
climate has been shown to help students become<br />
civically <strong>and</strong> politically involved by fostering citizenship<br />
self-efficacy (Ichilov, 2007; Manganelli et al., 2015).<br />
More specifically, an open classroom climate can foster<br />
political participation by students from disadvantaged<br />
socio-economic backgrounds, as a study in the United<br />
States showed (Campbell, 2008).<br />
In South Africa, since the early 1990s, Street Law’s<br />
Democracy for All programme has provided civic<br />
education in grades 11 <strong>and</strong> 12, including participatory<br />
activities such as case studies, role playing <strong>and</strong> mock<br />
trials. Students exposed to this programme at least<br />
weekly were found far more likely to correctly identify<br />
names of key South African political leaders <strong>and</strong> possess<br />
basic knowledge of the constitutional structure than<br />
students who received civics instruction less often or not<br />
at all (Finkel <strong>and</strong> Ernst, 2005).<br />
In Guatemala, the Nueva Escuela Unitaria model’s active<br />
participatory learning approach in rural <strong>and</strong> indigenous<br />
schools included self-instructional workbooks <strong>and</strong><br />
teacher guides, an integrated active pedagogy, the<br />
development of pedagogical materials, <strong>and</strong> extensive<br />
community involvement. First <strong>and</strong> second graders<br />
attending these schools showed significantly more<br />
democratic behaviours (including turn-taking, expressing<br />
opinions, assisting others <strong>and</strong> leading) than their<br />
counterparts in traditional schools (De Baessa et al.,<br />
2002; Mogollón <strong>and</strong> Solano, 2011).<br />
Implementing learner-centred pedagogy is not<br />
without challenges<br />
The implementation of learner-centred pedagogy<br />
in classrooms can admittedly be difficult, especially<br />
in contexts with few textbooks <strong>and</strong> teaching<br />
materials, large class sizes <strong>and</strong> inappropriate furniture<br />
(Schweisfurth, 2011). It can also be challenging because<br />
pedagogy ultimately relates to power relations<br />
within classrooms <strong>and</strong> beyond (Altinyelken, 2015). In<br />
Ethiopia <strong>and</strong> Namibia, the basic tenets of studentcentred<br />
pedagogy sometimes conflicted with local<br />
underst<strong>and</strong>ings of authority structures, obedience<br />
<strong>and</strong> teacher– student relationships (O’Sullivan, 2004;<br />
Serbessa, 2006). In some East Asian countries, teacherdominated<br />
pedagogy prevails; it is considered more<br />
compatible with societies that value high stakes testing<br />
<strong>and</strong> show deference to teachers (Nguyen et al., 2006).<br />
The external political environment can also shape the<br />
internal characteristics of classrooms. Interviews with<br />
teachers <strong>and</strong> school management in Ankara, Turkey,<br />
found that the authoritarian nature of political <strong>and</strong> social<br />
environments, combined with increasing limitations<br />
on freedom of speech, gave children a strong message<br />
that dissenting voices were not welcome <strong>and</strong>, worse, not<br />
tolerated (Altinyelken, 2015).<br />
102<br />
CHAPTER 4 | PEACE: POLITICAL PARTICIPATION, PEACE AND ACCESS TO JUSTICE
4<br />
THE RELATIONSHIP BETWEEN<br />
EDUCATION AND CONFLICT IS<br />
MULTIFACETED<br />
It is estimated that well over 100,000 <strong>people</strong> were<br />
killed in armed conflict in 2014 – the highest annual<br />
fatality count in 20 years. There were important regional<br />
variations. The Middle East was the most violence-prone<br />
region, with developments in Iraq <strong>and</strong> the Syrian Arab<br />
Republic mainly responsible for driving up the death toll<br />
(Mel<strong>and</strong>er, 2015). The underlying causes of armed conflict<br />
are multiple <strong>and</strong> complex; lack of good quality education<br />
is seldom, if ever, the primary precipitating factor. But<br />
under certain conditions, it can exacerbate the wider<br />
grievances, social tensions <strong>and</strong> inequalities that drive<br />
societies towards armed conflict.<br />
TOO LITTLE EDUCATION OR UNEQUAL<br />
EDUCATIONAL OPPORTUNITIES CAN MAKE<br />
SOCIETIES MORE PRONE TO CONFLICT<br />
When large numbers of young <strong>people</strong> are denied access<br />
to a good quality education, the resulting poverty,<br />
unemployment <strong>and</strong> hopelessness can act as recruiting<br />
agents for armed militia. An analysis of 120 countries<br />
over 30 years found that countries with large numbers of<br />
young men were less likely to experience violent conflict<br />
if their populations had higher levels of education<br />
(Barakat <strong>and</strong> Urdal, 2009). In Sierra Leone, young <strong>people</strong><br />
who had no education were nine times as likely to join<br />
rebel groups as those with at least secondary education<br />
(Humphreys <strong>and</strong> Weinstein, 2008).<br />
both students <strong>and</strong> teachers (Comisión de la Verdad y<br />
Reconciliación de Peru, 2003).<br />
Inequality in education,<br />
interacting with wider<br />
An analysis of 120<br />
disparity, heightens the<br />
countries over 30 risk of conflict. A recent<br />
years found that<br />
study drawing on data<br />
from 100 countries over<br />
conflict was less<br />
50 years found that<br />
likely when education countries with higher<br />
inequality is lower levels of inequality in<br />
schooling due to ethnic<br />
<strong>and</strong> religious differences<br />
were much more likely to experience conflict (FHI 360<br />
Education Policy <strong>and</strong> Data Center, 2015). Across 22<br />
countries in sub-Saharan Africa, sub-national regions<br />
with very low average education had a 50% probability of<br />
experiencing the onset of conflict within 21 years, while<br />
the corresponding interval for regions with very high<br />
average education was 346 years (Østby et al., 2009).<br />
A striking body of evidence suggests that <strong>people</strong> willing<br />
to use violence to pursue political ends are more likely to<br />
come from higher educated sections of society. Drawing<br />
on public opinion polls, a study found that, among<br />
Palestinians in Gaza <strong>and</strong> the West Bank in the 1980s,<br />
higher levels of education did not necessarily decrease<br />
support for violent attacks. In Lebanon, Hezbollah<br />
combatants who were killed during paramilitary<br />
operations had more education than non-combatants of<br />
the same age group <strong>and</strong> regional background (Krueger<br />
<strong>and</strong> Maleckova, 2003).<br />
Yet, more education is not automatically a panacea for the<br />
threat posed by the combination of mass unemployment<br />
<strong>and</strong> a high proportion of youth to adults. As was noted<br />
above, when education levels rise but labour markets are<br />
stagnant, the result can be a rapid increase in the number<br />
of better-educated unemployed young <strong>people</strong> resentful<br />
over their lack of prospects.<br />
In Uttar Pradesh state, India, the disillusionment of<br />
educated youth (usually young men) who were unable<br />
to secure jobs was seen as undermining social cohesion<br />
<strong>and</strong> political stability (Jeffrey et al., 2007). In Peru, largescale<br />
qualitative research identified dissatisfaction with<br />
public education, corruption in the education sector <strong>and</strong><br />
a lack of mobility associated with education (particularly<br />
outside the capital) as key causes for the growth of<br />
armed factions, as these grievances were used to recruit<br />
CONTENT AND PEDAGOGY CAN MAKE<br />
SOCIETIES MORE OR LESS PRONE TO<br />
VIOLENT CONFLICT<br />
Why does access to formal education not always<br />
keep <strong>people</strong> from participating in violence, particularly<br />
in the context of violent extremism? Part of the answer<br />
lies not in the amount of education but in what <strong>and</strong><br />
how students are taught. When sites of learning are<br />
used not to nurture minds, by teaching learners to think<br />
critically, but to inculcate prejudice, intolerance <strong>and</strong> a<br />
distorted view of history, they can become breeding<br />
grounds for violence.<br />
In many countries, curricula <strong>and</strong> learning materials<br />
have been shown to reinforce stereotypes <strong>and</strong><br />
exacerbate political <strong>and</strong> social grievances. In Rw<strong>and</strong>a,<br />
2016 • GLOBAL EDUCATION MONITORING REPORT 103
4<br />
“<br />
35% of out-of-school children live in<br />
conflict-affected countries<br />
a review of major education policies <strong>and</strong> programmes<br />
implemented between 1962 <strong>and</strong> 1994 argued that the<br />
content of education reflected <strong>and</strong> amplified ethnic<br />
inequality in society <strong>and</strong> contributed to categorizing,<br />
collectivizing <strong>and</strong> stigmatizing Hutu <strong>and</strong> Tutsi into<br />
exclusive groups (King, 2014). In India <strong>and</strong> Pakistan,<br />
textbooks <strong>and</strong> curricula have perpetuated images of<br />
the rival nation to suit their adversarial relationship<br />
<strong>and</strong> political goals (Lall, 2008).<br />
Disputes over curricular contents have sometimes<br />
directly spilled over into violent conflict. In 2000,<br />
when overtly Sunni textbooks were introduced in<br />
Pakistan’s Federally Administered Northern Areas,<br />
the local Shia population began to agitate for equal<br />
representation in textbook discussions of Islam.<br />
The conflict became acute in 2004–2005 as violent<br />
confrontations took place between Shia <strong>and</strong> Sunni<br />
communities, with the resulting curfews closing down<br />
schools for almost a year (Ali, 2008).<br />
”<br />
Language in education policies can be a source of<br />
wider grievances. In multi-ethnic countries, the<br />
imposition of a single dominant language as<br />
the language of instruction in schools, while<br />
sometimes a necessity, has been a frequent source<br />
of grievance linked to wider issues of social <strong>and</strong><br />
cultural inequality (UNESCO, 2016). By one estimate,<br />
over half the countries affected by armed conflict were<br />
highly diverse linguistically, making decisions over the<br />
language of instruction a potentially divisive political<br />
issue (Pinnock, 2009).<br />
Violent conflict has often followed group-based<br />
inequality exacerbated by language policies in education.<br />
In Nepal, the imposition of Nepali as the language of<br />
instruction fed into broader grievances among non-<br />
Nepali-speaking groups that drove the civil war (Murshed<br />
<strong>and</strong> Gates, 2005). Guatemala’s imposition of Spanish<br />
in schools was seen by indigenous <strong>people</strong> as part of a<br />
broader pattern of social discrimination. Armed groups<br />
representing indigenous <strong>people</strong> dem<strong>and</strong>ed bilingual <strong>and</strong><br />
intercultural education during negotiations on a peace<br />
agreement, leading to a constitutional commitment<br />
(Marques <strong>and</strong> Bannon, 2003).<br />
ARMED CONFLICT PLACES A HEAVY BURDEN<br />
ON EDUCATION SYSTEMS<br />
Armed conflict is one of the greatest obstacles to progress<br />
in education. In conflict-affected countries, almost<br />
21.5 million children of primary school age <strong>and</strong> almost<br />
15 million adolescents of lower secondary school age are<br />
out of school. Over the last decade, the problem of outof-school<br />
children has been increasingly concentrated<br />
in conflict-affected countries, where the proportion<br />
increased from 29% in 1999 to 35% in 2014. This trend is<br />
especially marked in Northern Africa <strong>and</strong> Western Asia<br />
where the share increased from 63% to 91% (UNESCO,<br />
2016). Recent estimates indicated that surging conflict<br />
<strong>and</strong> political upheaval across the Middle East <strong>and</strong> North<br />
Africa prevent more than 13 million children from going to<br />
school (UNICEF, 2015).<br />
The experience of the Syrian Arab Republic provides a<br />
stark example of how conflict can reverse achievements<br />
in education. According to data from the UNESCO<br />
Institute for Statistics (UIS), by 2001 the country had<br />
achieved universal primary enrolment <strong>and</strong> relatively high<br />
secondary enrolment. Yet, as the civil war spread, the<br />
primary net enrolment ratio, which was still at 98.9% in<br />
2009, declined to under 71% in 2013, with the number<br />
of primary school-age children out of school increasing<br />
from 21,000 to 563,000.<br />
Armed conflict also interrupts progress in education. Two<br />
decades of conflict in Afghanistan up to 2001 resulted in<br />
a loss of 5.5 years on the total average years of national<br />
schooling; Burundi’s civil war cost the country over 3<br />
years (UIS, 2010). Similarly, the 1992–1998 civil conflict<br />
in Tajikistan resulted in a decrease in school attainment<br />
for girls. Girls exposed to conflict were 12% less likely<br />
to complete compulsory schooling than older cohorts<br />
who completed their schooling before the conflict<br />
(Shemyakina, 2011).<br />
In addition, armed conflict exacerbates inequality.<br />
Conflict-affected areas are often marked by extreme<br />
disadvantage in education, with the poor typically faring<br />
worst. 2 Young adults in the Autonomous Region in<br />
Muslim Mindanao in the Philippines are four times more<br />
likely than the national average to have fewer than four<br />
104<br />
CHAPTER 4 | PEACE: POLITICAL PARTICIPATION, PEACE AND ACCESS TO JUSTICE
4<br />
years of education – <strong>and</strong> six times more likely for poor<br />
males (Figure 4.1).<br />
When Guatemala’s civil war started in 1965, indigenous<br />
<strong>people</strong> averaged three years fewer in school than<br />
the average. By the start of the 1991 peace talks,<br />
indigenous <strong>people</strong> in areas not affected by the conflict<br />
had gained 3.1 years in education while for those in<br />
conflict-affected areas, the education gap with the rest<br />
of the indigenous population had increased from 0.4 to<br />
1.7 years (UIS, 2010).<br />
CHILDREN, TEACHERS AND SCHOOLS ARE<br />
INCREASINGLY ON THE FRONT LINE OF CONFLICT<br />
Children, teachers <strong>and</strong> schools are on the front line of<br />
conflict <strong>and</strong> many have been deliberately targeted.<br />
State <strong>and</strong> non-state actors alike often blur the line<br />
between combatants <strong>and</strong> civilians. In the majority<br />
of countries with armed conflicts – including at least<br />
26 between 2005 <strong>and</strong> 2015 – government armed forces<br />
<strong>and</strong> non-state armed groups have used schools <strong>and</strong><br />
other education institutions for military purposes.<br />
In addition to risking students’ <strong>and</strong> teachers’ lives<br />
<strong>and</strong> safety, the military use of education institutions<br />
impinges upon access to education, decreases the<br />
quality of education <strong>and</strong> compromises efforts to<br />
create safe learning spaces (Global Coalition to Protect<br />
Education from Attack, 2015).<br />
Deliberate destruction of education facilities is a longst<strong>and</strong>ing<br />
practice in armed conflicts (UNESCO, 2011).<br />
Most of Timor-Leste’s education infrastructure was<br />
destroyed in the 1998–1999 war, <strong>and</strong> 95% of schools<br />
required rehabilitation. In Iraq, 85% of schools were<br />
damaged or destroyed by fighting during the conflict of<br />
2003–2004 (Buckl<strong>and</strong>, 2005). Between 2009 <strong>and</strong> 2015,<br />
attacks in north-eastern Nigeria destroyed more than<br />
910 schools <strong>and</strong> forced at least 1,500 to close. By early<br />
2016, an estimated 952,029 school-age children had<br />
fled the violence (HRW, 2016). By 2016, the Syrian Arab<br />
Republic had lost more than one-quarter of its schools<br />
– more than 6,000 damaged by the violence, forced<br />
to close, or used for fighting or sheltering hundreds of<br />
displaced families (UNICEF, 2016).<br />
Teachers are at risk. During the Rw<strong>and</strong>an genocide, more<br />
than two-thirds of the teaching force in primary <strong>and</strong><br />
secondary schools was killed or fled (Buckl<strong>and</strong>, 2005).<br />
In Colombia, 140 teachers were killed over 2009–2013,<br />
around 1,100 received death threats <strong>and</strong> 305 were forced<br />
to leave their homes because their lives were at risk<br />
(Global Coalition to Protect Education from Attack, 2015).<br />
As of 2015, in Nigeria, where Boko Haram has targeted<br />
education workers <strong>and</strong> students, at least 611 teachers had<br />
been deliberately killed <strong>and</strong> 19,000 forced to flee since<br />
2009 (HRW, 2016).<br />
The forced recruitment of children into armed forces,<br />
often through abduction, is widespread. It is an immense<br />
barrier to education, not just because child soldiers<br />
receive no formal education, but also because abductions<br />
<strong>and</strong> trauma have far wider effects on the children<br />
themselves <strong>and</strong> their home communities. Reliable <strong>and</strong><br />
recent data on the global number of child soldiers are<br />
not available.<br />
FIGURE 4.1:<br />
In the Philippines, children <strong>and</strong> youth in a conflict-affected region are left behind<br />
Percentage of children who had never been to school <strong>and</strong> of 20- to 24-year-olds with fewer than four years of education, conflict-affected region <strong>and</strong><br />
other regions, 2013<br />
% with no<br />
education<br />
National average<br />
Regional average<br />
National average<br />
Regional average<br />
Poorest 20%<br />
% with fewer<br />
than four years<br />
of education<br />
Poorest 20% female<br />
Poorest 20% male<br />
0 2 4 6 8 10 12<br />
14 16<br />
18 20 22 24<br />
26<br />
28<br />
%<br />
Autonomous Region in Muslim Mindanao Other regions<br />
Source: GEM Report team analysis (2016) based on 2013 data from Demographic <strong>and</strong> Health Survey.<br />
In the Autonomous Region in Muslim<br />
Mindanao, the percentage of children<br />
who had never been in school reaches<br />
13%, more than four times the average.<br />
Within the Autonomous Region in<br />
Muslim Mindanao, poorest males are the<br />
most disadvantaged – the percentage of<br />
young men with fewer than four years of<br />
education reaches 25%.<br />
2016 • GLOBAL EDUCATION MONITORING REPORT 105
4<br />
“<br />
Refugee children <strong>and</strong> adolescents are five times<br />
more likely to be out of school than others<br />
”<br />
Refugees are a huge challenge<br />
for education systems<br />
Almost 60 million <strong>people</strong> were in forced displacement<br />
in 2015, the highest number since 1945 (UNHCR, 2015).<br />
They include internally displaced <strong>people</strong> (IDPs), asylum<br />
seekers <strong>and</strong> refugees, a small percentage of whom are<br />
resettled. Moreover, <strong>people</strong> are spending longer <strong>and</strong><br />
longer time in displacement <strong>and</strong> refuge, compromising<br />
prospects of durable solutions <strong>and</strong> reinforcing the<br />
urgency of a sustainable, comprehensive response by<br />
the international community.<br />
Data remain limited for many refugee situations, but<br />
the most recent data from the United Nations High<br />
Commissioner for Refugees estimate that, worldwide, 50%<br />
of primary school-age refugee children are out of school<br />
<strong>and</strong> 75% of adolescent refugees at secondary level are out<br />
FIGURE 4.2:<br />
Education conditions for refugee children vary widely<br />
Primary <strong>and</strong> secondary enrolment rates, selected refugee sites in<br />
selected countries, 2014<br />
Enrolment rates (%)<br />
100<br />
90<br />
80<br />
70<br />
60<br />
50<br />
40<br />
30<br />
20<br />
10<br />
0<br />
Kenya<br />
Pakistan<br />
Bangladesh<br />
Chad<br />
Malaysia<br />
Sudan<br />
Ug<strong>and</strong>a<br />
Ethiopia<br />
Rw<strong>and</strong>a<br />
South Sudan<br />
Iran, Isl. Rep<br />
Primary<br />
Secondary<br />
Source: GEM Report team analysis (2016) based on 2014 UNHCR data.<br />
Yemen<br />
Egypt<br />
of school. Refugee children <strong>and</strong> adolescents are five times<br />
more likely to be out of school than their non-refugee peers.<br />
However, this average obscures significant differences<br />
across countries. Primary enrolment rates among the<br />
displaced are 80% in Egypt <strong>and</strong> Yemen but 40% at refugee<br />
sites in Pakistan. Enrolment rates are substantially lower<br />
at the secondary level: only 4% of 12- to 17-year-old refugees<br />
were enrolled in school in Kenya <strong>and</strong> Pakistan (Figure 4.2).<br />
The provision <strong>and</strong> quality of education in some refugee<br />
settings are limited, with shortages of qualified teachers<br />
proficient in an appropriate language, pupil/teacher<br />
ratios as high as 70:1 <strong>and</strong> high proportions of unqualified<br />
teachers. Official learning validation <strong>and</strong> certification,<br />
which are important for the effective education of refugee<br />
children, are often ignored (UNESCO <strong>and</strong> UNHCR, 2016).<br />
EDUCATION CAN HELP BUILD SOCIETIES<br />
AFTER CONFLICT<br />
Segregation is a common legacy of conflict. Institutional<br />
environments play an important role in reintegrating<br />
post-conflict communities <strong>and</strong> can address differences<br />
between ethnic <strong>and</strong> religious groups (Alex<strong>and</strong>er <strong>and</strong><br />
Christia, 2011). On the other h<strong>and</strong>, where schools<br />
maintain the status quo, they can predispose young<br />
<strong>people</strong> towards segregation <strong>and</strong> engrain discriminatory<br />
attitudes, leading them to believe intolerance is socially<br />
acceptable (Ramirez-Barat <strong>and</strong> Duthie, 2015).<br />
Integrated schools have been found to positively<br />
influence minority group identity, prevailing attitudes<br />
towards inclusion <strong>and</strong> exclusion, <strong>and</strong> a sense of<br />
forgiveness, with the potential to heal division <strong>and</strong><br />
promote less sectarian perspectives (McGlynn, 2004).<br />
Members of communities educated together may<br />
develop more tolerance (Hansson et al., 2013).<br />
In Bosnia <strong>and</strong> Herzegovina, schools have been<br />
segregated along linguistic <strong>and</strong> ethnic lines since the<br />
end of the war in 1996. In some cases, students from<br />
different ethnic groups attend the same school but are<br />
106<br />
CHAPTER 4 | PEACE: POLITICAL PARTICIPATION, PEACE AND ACCESS TO JUSTICE
4<br />
physically separated, are taught in different languages<br />
<strong>and</strong> follow specific ethnic curricula. An interim measure<br />
meant to facilitate the return of refugees immediately<br />
after the war became an entrenched practice that<br />
impedes younger generations’ learning to live together<br />
(Ramirez-Barat <strong>and</strong> Duthie, 2015).<br />
In Northern Irel<strong>and</strong> in 2013, 15 years after the Belfast<br />
Agreement, 93% of children <strong>and</strong> youth attended schools<br />
segregated by religion. A bottom-up movement for<br />
integrated cross-community schools began in the late<br />
1970s, largely because of a campaigning group of parents<br />
known as All Children Together. As of 2008, 61 integrated<br />
schools had been created, where children from both<br />
communities are brought together daily to interact in<br />
the classroom <strong>and</strong> during extracurricular activities. The<br />
schools include training programmes to prepare teachers<br />
for cross-community settings, as well as a curriculum<br />
that includes opportunities to discuss potentially<br />
contentious aspects of the country’s cultural traditions<br />
<strong>and</strong> sectarian conflict (Aiken, 2013).<br />
In Israel, there are six Arab-Jewish bilingual schools,<br />
where mixed classrooms are a central aspect, reflecting<br />
the schools’ commitment to strengthening group<br />
identity while encouraging tolerance <strong>and</strong> respect for<br />
pluralism (Bekerman, 2016). These schools have had some<br />
success in mediating conflicting national narratives,<br />
creating opportunities to talk about the conflict <strong>and</strong><br />
recognizing ethnic, religious <strong>and</strong> other differences<br />
(Bekerman, 2012).<br />
Curricular content can help or harm inter-group relations<br />
after conflict. Developing curricula about the recent<br />
past is difficult <strong>and</strong> may be contested. In Bosnia <strong>and</strong><br />
Herzegovina three parallel education systems, each with<br />
distinct historical narratives, were created; in Rw<strong>and</strong>a<br />
the teaching of history was postponed for 10 years<br />
following the genocide (Freedman et al., 2008; Jones,<br />
2012). In Guatemala, Peru <strong>and</strong> South Africa, while history<br />
education teaches about recent conflicts, it does not<br />
engage substantively with the causes of conflict <strong>and</strong><br />
past injustices. Conflict is presented as exceptional,<br />
an aberration overcome by what is believed to be the<br />
present’s democracy, active citizenship <strong>and</strong> a culture of<br />
peace (Paulson, 2015).<br />
Education’s contribution to peacebuilding also depends<br />
on the sensitivity of reforms <strong>and</strong> programmes to the<br />
legacies of past injustice. Transitional justice promotes<br />
accountability <strong>and</strong> the redressing of major violations<br />
of human rights. It is increasingly recognized as a<br />
fundamental part of peacebuilding efforts, helping to<br />
strengthen the rule of law, address grievances among<br />
affected communities <strong>and</strong> prevent the recurrence of<br />
violations. Adding a dimension of transitional justice<br />
to the reconstruction of education after conflict is<br />
challenging, yet measures can be designed to establish<br />
links with <strong>and</strong> catalyse change in education (Ramirez-<br />
Barat <strong>and</strong> Duthie, 2015).<br />
The success of any curricular reform or innovation<br />
in learning materials depends on the availability of<br />
motivated, engaged <strong>and</strong> trained teachers. Teaching<br />
in ways that encourage critical thinking <strong>and</strong> embrace<br />
complexity is difficult, all the more so in conflict-ridden<br />
countries, such as Bosnia <strong>and</strong> Herzegovina <strong>and</strong> Rw<strong>and</strong>a,<br />
where teachers may be reluctant or ill-prepared to<br />
discuss contentious issues, fear engaging with political<br />
issues or have been socialized to accept one-sided<br />
narratives. In Lebanon,<br />
teachers chose to avoid<br />
To ensure the best contentious historical<br />
issues in lessons, partly<br />
results from peace<br />
because their training had<br />
education, we need failed to equip them with<br />
to train teachers skills to manage, contain<br />
or solve classroom<br />
how to discuss<br />
conflicts (van Ommering,<br />
contentious history 2015). In Guatemala,<br />
teachers believed it<br />
was important to teach<br />
about the civil war but often felt unprepared to facilitate<br />
discussions for lack of appropriate training <strong>and</strong> learning<br />
materials (Bellino, 2014).<br />
In Kenya, a review of peace education programmes in<br />
refugee camps <strong>and</strong> nationwide highlighted challenges<br />
for teachers in embracing learner-centred pedagogy<br />
such as participatory <strong>and</strong> interactive approaches.<br />
For example, classroom observations in Dadaab <strong>and</strong><br />
Kakuma refugee camps showed that most teachers had<br />
poor questioning skills (Mendenhall <strong>and</strong> Chopra, 2016;<br />
Obura, 2002).<br />
Peace education can offer a response to direct violence<br />
<strong>and</strong> help prevent further violence<br />
In many countries, thous<strong>and</strong>s of children are being<br />
taught by educators using peace education curricula<br />
involving methods <strong>and</strong> learning processes that include<br />
inquiry, critical thinking, <strong>and</strong> dialogue towards greater<br />
equity <strong>and</strong> social justice. The scope of peace education<br />
2016 • GLOBAL EDUCATION MONITORING REPORT 107
4<br />
has exp<strong>and</strong>ed in recent years to become more inclusive<br />
of areas such as human rights education, citizenship<br />
education, multicultural education, environmental<br />
education <strong>and</strong> social justice education (Bajaj, 2008;<br />
Bajaj <strong>and</strong> Hantzopoulos, 2016).<br />
Although well-designed peace education interventions<br />
are rarely subjected to rigorous scrutiny, studies show<br />
they can reduce student aggression, bullying <strong>and</strong><br />
participation in violent conflict, <strong>and</strong> increase the chances<br />
that students will work to prevent conflict (Barakat et al.,<br />
2008; Barakat et al., 2013; Davies, 2005).<br />
Many NGOs have contributed to peace education. In<br />
Gujarat state, India, the NGO Navsarjan focuses on the<br />
rights of Dalits (formerly called ‘untouchables’), who<br />
make up around 16% of India’s population (HRW, 2014). To<br />
address widespread caste discrimination in schools <strong>and</strong><br />
the high dropout rate of Dalit students, Navsarjan set up<br />
several schools that specially cater to Dalit children living<br />
in the surrounding communities. Classes <strong>and</strong> assemblies<br />
reiterate messages about caste equality to eradicate<br />
the notion that Dalit children are less worthy than their<br />
higher caste peers. Students are also encouraged to<br />
critically analyse their society <strong>and</strong> become active in their<br />
communities by spreading awareness, joining campaigns<br />
for equality <strong>and</strong> fighting for justice (Bajaj, 2012, 2014).<br />
EDUCATION NEEDS MORE EMPHASIS ON<br />
INTERNATIONAL PEACEBUILDING AGENDAS<br />
Building sustainable peace is a major challenge.<br />
A 2009 study estimated that 40% of all conflicts<br />
reignited within the first decade of peace, highlighting<br />
the need for concerted international effort focused<br />
not just on ending conflict but on post-conflict<br />
peacebuilding (World Bank, 2009). Despite growing<br />
evidence of the role of education in peacebuilding,<br />
international actors have prioritized security issues -<br />
such as spending in military <strong>and</strong> securiy personnel - as<br />
in Lebanon, Nepal <strong>and</strong> Sierra Leone (Novelli et al., 2015).<br />
Of 37 publicly available full peace agreements signed<br />
between 1989 <strong>and</strong> 2005, 11 do not mention education at<br />
all. Even in those that do, education is addressed with<br />
great variation (Dupuy, 2008). Moreover, education<br />
stakeholders often lack skills <strong>and</strong> knowledge to integrate<br />
peacebuilding measures into education programmes<br />
or sector plans, or to lobby for education’s role in<br />
peacebuilding frameworks (Novelli et al., 2015).<br />
VIOLENCE IS A CHALLENGE FOR ALL, NOT ONLY<br />
FOR CONFLICT-AFFECTED COUNTRIES<br />
The costs of interpersonal violence are far higher than<br />
those of armed conflict. The death toll of disputes<br />
between individuals, including domestic <strong>and</strong> family<br />
violence, is estimated at nine times that of war <strong>and</strong><br />
other such conflict (Hoeffler <strong>and</strong> Fearon, 2014). Could<br />
education make a difference? Policies designed to<br />
increase educational attainment can significantly reduce<br />
crime rates. In Italy, more than 75% of convicted persons<br />
had not completed<br />
high school in 2001,<br />
while United Kingdom<br />
In Sweden, each incarceration rates<br />
additional year of among men aged 21 to<br />
25 were more than eight<br />
schooling decreased<br />
times higher for those<br />
the likelihood of with no qualifications<br />
a conviction for a than for those with some<br />
qualification (Buonanno<br />
violent crime by 10%<br />
<strong>and</strong> Leonida, 2006;<br />
Machin et al., 2011). In<br />
Sweden, each additional<br />
year of schooling decreased the likelihood of a conviction<br />
for a violent crime by 10%, for property crime by 14% <strong>and</strong><br />
for other crimes by almost 6% (Hjalmarsson et al., 2015).<br />
Education can be used to reduce violence against children<br />
A prominent share of violence against children occurs<br />
within their own households. Around 6 in 10 children<br />
between the ages of 2 <strong>and</strong> 14 are regularly subjected to<br />
physical punishment by their caregivers (UNICEF, 2014).<br />
Action from the education sector can make a difference.<br />
For instance, parental <strong>and</strong> family-based skill-building<br />
initiatives on child protection <strong>and</strong> early childhood<br />
development can lead to behavioural change. In Liberia,<br />
the Parents Make the Difference programme involved<br />
a ten week parenting intervention including training<br />
in positive parenting <strong>and</strong> non-violent behaviour. When<br />
asked later about the last time their child misbehaved,<br />
only 9% of those who had participated reported beating<br />
their child, compared with 45% of those who had not.<br />
Participants replaced harsh punishment with non-violent<br />
discipline strategies using newly acquired knowledge <strong>and</strong><br />
skills (Sim et al., 2014).<br />
Around 120 million girls under the age of 20 have been<br />
subjected to forced sexual acts, including intercourse,<br />
at some point in their lives (UNICEF, 2014). A Ug<strong>and</strong>an<br />
programme provided life skills to build knowledge<br />
108<br />
CHAPTER 4 | PEACE: POLITICAL PARTICIPATION, PEACE AND ACCESS TO JUSTICE
4<br />
<strong>and</strong> reduce risky behaviour, combined with vocational<br />
training to enable girls who had been forced into sexual<br />
acts to establish small enterprises. The programme<br />
reduced the incidence of girls who unwillingly had sex<br />
during the previous year by 83%, an impact largely<br />
attributed to life skills sessions <strong>and</strong> to discussion on<br />
negotiation, rape, legal rights <strong>and</strong> preventive measures<br />
(B<strong>and</strong>iera et al., 2014).<br />
All kinds of violence against children affect schooling,<br />
leading to lower educational attainment <strong>and</strong> poor<br />
employment prospects. Across 18 sub-Saharan African<br />
countries, gender-based violence – as measured by<br />
intimate partner violence, early marriage <strong>and</strong> female<br />
genital mutilation – had a negative impact on girls’<br />
schooling. In Comoros, Mozambique <strong>and</strong> Sierra Leone,<br />
the probability of attending school is, respectively, 42%,<br />
25% <strong>and</strong> 15% lower for girls whose mothers justified<br />
intimate partner violence than for those whose mothers<br />
did not (Koissy-Kpein, 2015) – thus showing a crossgenerational<br />
impact.<br />
Schools are exposed to many forms of violence<br />
To help sustain peaceful societies, schools must<br />
offer children a non-violent environment providing<br />
appropriate skills <strong>and</strong> practices for school <strong>and</strong> home.<br />
Recent estimates from Plan International, based<br />
on the numbers of those affected by verbal bullying,<br />
a common form of violence in school, indicate that<br />
246 million children suffer school-related violence<br />
every year (Greene et al., 2013). This violence <strong>and</strong> abuse<br />
can seriously harm children’s health, well-being <strong>and</strong><br />
ability to learn to their full potential, reducing school<br />
participation, learning levels <strong>and</strong> completion rates. In<br />
Brazil, Ghana <strong>and</strong> the United States, bullying has been<br />
shown to increase absenteeism (Abramovay <strong>and</strong> Rua,<br />
2005; Dunne et al., 2006; Kosciw et al., 2013).<br />
A study drawing on data from the 2011 Trends in<br />
International Mathematics <strong>and</strong> Science Study<br />
(TIMSS) from 48 countries showed that grade<br />
4 students who reported being bullied weekly at<br />
school scored 32 points lower in mathematics than<br />
those who reported they had almost never been<br />
bullied (Mullis et al., 2012). New analysis of the same<br />
data shows that in many countries students in grade<br />
8 who had reported being involved in physical fights<br />
in school scored lower in mathematics than those<br />
who had not. In Australia <strong>and</strong> Chile, the learning gap<br />
between students who were involved in physical fights<br />
in school <strong>and</strong> those who were not was almost 30<br />
percentage points (Figure 4.3).<br />
FIGURE 4.3:<br />
Violence in school affects students’ ability to achieve minimal numeracy skills<br />
Percentage of grade 8 students scoring above the low international benchmark in mathematics, by their involvement in physical fights<br />
in school, selected countries, 2011 TIMSS<br />
100<br />
Ghana<br />
Chile<br />
Indonesia<br />
Bahrain<br />
Romania<br />
Malaysia<br />
TFYR<br />
Macedonia<br />
Australia<br />
Lebanon<br />
Israel<br />
Hungary<br />
Norway<br />
Grade 8 students (%)<br />
80<br />
60<br />
40<br />
20<br />
Involved in physical fights<br />
Not involved in physical fights<br />
0<br />
Source: GEM Report team analysis (2016) based on 2011 TIMSS data.<br />
2016 • GLOBAL EDUCATION MONITORING REPORT 109
4<br />
Lack of knowledge <strong>and</strong> education severely<br />
hampers citizens’ ability to interact with<br />
the justice system<br />
“<br />
”<br />
EDUCATION CAN PLAY A<br />
KEY ROLE IN BUILDING A<br />
FUNCTIONING JUSTICE SYSTEM<br />
A functioning justice system that upholds the rule<br />
of law is considered critical for sustaining peaceful<br />
societies. Lack of knowledge <strong>and</strong> education, however,<br />
severely hampers citizens’ ability to interact with the<br />
justice system. In 2011, according to court user survey<br />
results in the Former Yugoslav Republic of Macedonia,<br />
only 32% of individuals with primary education were<br />
‘well or partially informed’ about the judicial system <strong>and</strong><br />
its reforms, compared with 77% of those with higher<br />
education (World Bank, 2011). In Bangkok, many female<br />
victims of violence were unaware of the laws <strong>and</strong> legal<br />
procedures in place to protect them from, or redress,<br />
gender-based violence. Thus, even when financial<br />
resources were not a problem, they did not seek legal<br />
protection or justice (International Commission of<br />
Jurists, 2012).<br />
CIVIL SOCIETY IS INCREASINGLY FILLING THE<br />
WIDE GAP IN LEGAL EDUCATION PROVISION<br />
Increased awareness <strong>and</strong> underst<strong>and</strong>ing of legal rights<br />
can address many daily problems faced by the most<br />
marginalized populations. One promising mechanism<br />
is community-based education programmes, typically<br />
designed to advocate for the poor <strong>and</strong> enhance the legal<br />
empowerment of marginalized groups.<br />
In Bangladesh, the Human Rights <strong>and</strong> Legal Aid<br />
Services (HRLS) programme of BRAC had provided<br />
rights-based legal education to over 3.8 million <strong>people</strong><br />
as of 2013. The HRLS model is based on legal education,<br />
legal aid <strong>and</strong> community mobilization. Women learn<br />
about their legal rights through legal education<br />
classes that aim to empower them with a basic<br />
underst<strong>and</strong>ing of their rights <strong>and</strong> the laws, the first<br />
step in seeking justice. The programme also uses<br />
street theatre, a popular community outreach tool,<br />
to promote behavioural change <strong>and</strong> create community<br />
acceptance of access to property rights for the poor<br />
(Kolisetty, 2014).<br />
In Sierra Leone, over half of all <strong>people</strong> behind bars<br />
have not been convicted of any crime but are<br />
awaiting trial. Timap for Justice, an NGO, recruits <strong>and</strong><br />
hires local community members, who receive basic<br />
legal training as paralegals. As a result of Timap’s<br />
intervention, paralegals have succeeded in getting<br />
inappropriate charges dropped in 28% of cases, <strong>and</strong><br />
secured bail for an additional 55% of suspects (Open<br />
Society Justice Initiative, 2015).<br />
BUILDING THE CAPACITY OF JUDICIAL AND<br />
LAW ENFORCEMENT OFFICERS IS CRITICAL<br />
Insufficient training <strong>and</strong> capacity-building for judicial<br />
<strong>and</strong> law enforcement officers hinders the carrying<br />
out of justice <strong>and</strong> can result in delays, flawed or<br />
insufficient evidence-gathering, lack of enforcement,<br />
<strong>and</strong> abuse. Many countries have critical shortages of<br />
trained police, legal <strong>and</strong> forensic staff. Only one doctor<br />
in Timor-Leste has reportedly been trained to collect<br />
evidence in sexual violence cases. Sierra Leone has just<br />
100 trained lawyers, 90 of whom are based in the capital,<br />
Freetown, serving a population of more than 5 million<br />
(UN Women, 2011). In Rajasthan state, India, lack of skills<br />
has been identified as a barrier to effective policing.<br />
Training police officers in behavioural skills has had<br />
significant positive effects on the quality of police work<br />
<strong>and</strong> public satisfaction. In police stations where<br />
all staff were trained, victim satisfaction increased<br />
by 30%, while fear of the police was reduced by 17%<br />
(Banerjee et al., 2012).<br />
Capacity problems are especially marked in postconflict<br />
settings or in the aftermath of crises, when<br />
levels of violence are exceptionally high. In Haiti, the<br />
national police went from being the least to the most<br />
trusted institution of the state over five years through a<br />
110<br />
CHAPTER 4 | PEACE: POLITICAL PARTICIPATION, PEACE AND ACCESS TO JUSTICE
4<br />
training programme established by the United Nations<br />
Stabilization Mission in Haiti. The mission provided a<br />
seven month initial recruit training programme, rather<br />
than the typical two to three weeks often seen in<br />
post-conflict environments, alongside other specialized<br />
training programmes. When Haitian citizens were asked<br />
in 2009 whether they had seen a change in police work<br />
over the past year, 72% reported a positive change, <strong>and</strong><br />
83% reported that the security situation in the country<br />
was either a lot or at least a little better than in the<br />
previous year (UNDPKO, 2010).<br />
CONCLUSION<br />
What makes a peaceful <strong>and</strong> non-violent society? How<br />
can development be made sustainable in conditions of<br />
violent conflict <strong>and</strong> insecurity? The answers are complex,<br />
yet education’s role, though multifaceted, is crucial,<br />
whether it involves encouraging <strong>people</strong>, particularly<br />
the young, to vote, or supports participation in political<br />
processes <strong>and</strong> becoming politically active. What<br />
students are taught <strong>and</strong> how teaching is conducted are<br />
cornerstones of the relationship between education,<br />
conflict <strong>and</strong> peacebuilding. Peace <strong>and</strong> non-violence are<br />
not promoted simply by the virtue of children <strong>and</strong> youth<br />
attending school, but by teachers enabling students to<br />
acquire useful skills when confronted with circumstances<br />
that may lead to conflict or violence.<br />
Education reflects social tensions, including conflictrelated<br />
ideologies <strong>and</strong> stereotypes, so the relationship<br />
between education, peace <strong>and</strong> conflict deserves far<br />
more attention to enable the promotion of positive<br />
contributions to peacebuilding, access to justice <strong>and</strong><br />
protection from violence, whether large-scale or intimate.<br />
ENDNOTES<br />
1. The institutional contexts in which voting decisions are made also matter.<br />
In countries where voter registration is undertaken by local authorities <strong>and</strong><br />
is compulsory (e.g. the United Kingdom), the impact of education on voting<br />
behaviour can be largely muted (Milligan et al., 2004).<br />
2. Intra-country comparisons should be treated with caution. It cannot<br />
automatically be assumed that conflict is the main source of educational<br />
disparity. Inequality associated with wider social, economic <strong>and</strong> political<br />
factors in conflict zones also influences opportunities for education.<br />
2016 • GLOBAL EDUCATION MONITORING REPORT 111
Favelas in Rio de<br />
Janeiro, which formed<br />
when lots of <strong>people</strong><br />
moved from the<br />
Brazilian countryside<br />
to the city.<br />
CREDIT: Anna Spysz/GEM Report<br />
112<br />
CHAPTER 5 | PLACE: INCLUSIVE AND SUSTAINABLE CITIES
CHAPTER<br />
5<br />
Place: inclusive<br />
<strong>and</strong> sustainable<br />
cities<br />
We recognize that sustainable urban development<br />
<strong>and</strong> management are crucial to the quality of life of<br />
our <strong>people</strong>.<br />
– The 2030 Agenda for Sustainable Development<br />
NO<br />
POVERTY<br />
ZERO<br />
HUNGER<br />
GOOD HEALTH<br />
AND WELL-BEING<br />
QUALITY<br />
EDUCATION<br />
GENDER<br />
EQUALITY<br />
CLEAN WATER<br />
AND SANITATION<br />
AFFORDABLE AND<br />
CLEAN ENERGY<br />
DECENT WORK AND<br />
ECONOMIC GROWTH<br />
INDUSTRY, INNOVATION<br />
AND INFRASTRUCTURE<br />
REDUCED<br />
INEQUALITIES<br />
SUSTAINABLE CITIES<br />
AND COMMUNITIES<br />
RESPONSIBLE<br />
CONSUMPTION<br />
AND PRODUCTION<br />
CLIMATE<br />
ACTION<br />
LIFE<br />
BELOW WATER<br />
LIFE<br />
ON LAND<br />
PEACE, JUSTICE<br />
AND STRONG<br />
INSTITUTIONS<br />
PARTNERSHIPS<br />
FOR THE GOALS<br />
113
5<br />
KEY MESSAGES<br />
Education must be integrated into urban planning to create<br />
sustainable cities.<br />
1<br />
Cities are growing fast, putting strain on education systems.<br />
a. There are significant education gaps within urban areas.<br />
b. There is a lack of access to public education in urban slums <strong>and</strong> peri-urban areas.<br />
c. Half of the world’s refugees are children <strong>and</strong> youth, many of whom end up in cities.<br />
d. Ethnic <strong>and</strong> racial segregation in schools can exacerbate broader inequalities.<br />
e. Migrants to cities, <strong>and</strong> especially female migrants, urgently need skills for work.<br />
2<br />
Until education is part of urban planning, urban challenges, such as unequal provision of services <strong>and</strong><br />
discrimination, will never be fixed.<br />
a. By improving skills, education can foster more inclusive economies.<br />
b. Policies for urban education must reduce unequal access to quality public schools <strong>and</strong> teachers.<br />
c. Teacher training can reduce prejudice <strong>and</strong> discrimination.<br />
3<br />
Education reduces crime in cities.<br />
a. Education increases job opportunities, <strong>and</strong> makes <strong>people</strong> more averse to risks, such as punishment<br />
for crimes.<br />
b. Early childhood interventions <strong>and</strong> a focus on high school graduation can reduce crime.<br />
4<br />
Education can propel cities’ competitiveness <strong>and</strong> productivity.<br />
a. Investing in research <strong>and</strong> innovation, <strong>and</strong> fostering ties between universities <strong>and</strong> industry,<br />
can transform a city into a prosperous knowledge-based economy.<br />
b. But attention is needed to ensure that knowledge-driven economic development does not<br />
increase inequality.<br />
5<br />
Including education in urban planning makes environmental sustainability more likely.<br />
a. Communication strategies <strong>and</strong> school-based interventions teach <strong>people</strong> the importance of<br />
environmental approaches to planning, <strong>and</strong> encourage sustainable transportation.<br />
6<br />
Education efforts alone will not lead to inclusive <strong>and</strong> safe cities.<br />
a. Urban planners need training in integrating education into urban planning <strong>and</strong> strategies.<br />
b. Communities affected by urban development must be included in renewal initiatives <strong>and</strong> plans<br />
for change.<br />
7<br />
Urban governance must include education in its approach.<br />
a. Informed city leaders can use education <strong>and</strong> lifelong learning to transform their cities.<br />
b. Strengthened global networks of leaders of cities can solve urban challenges, including<br />
education gaps.<br />
114<br />
CHAPTER 5 | PLACE: INCLUSIVE AND SUSTAINABLE CITIES
5<br />
Cities affect education planning....................................................................................... 116<br />
Education has a positive influence on cities............................................................... 118<br />
Education <strong>and</strong> knowledge can contribute to inequality in cities...................... 121<br />
Education can influence urban planning...................................................................... 124<br />
A city can transform by placing education <strong>and</strong> lifelong learning at its heart....126<br />
Conclusion................................................................................................................................... 129<br />
In addition to the areas highlighted in the preamble to<br />
the Sustainable Development Goals (SDGs) – <strong>people</strong>,<br />
<strong>planet</strong>, prosperity, peace <strong>and</strong> partnership – the GEM<br />
Report 2016 also looks at ‘place’ with a focus on cities.<br />
Urbanization is one of today’s defining trends – more<br />
than half the global population lives in cities <strong>and</strong> urban<br />
areas. The concentration of productive activity, the<br />
availability of large markets <strong>and</strong> the promise of better<br />
living st<strong>and</strong>ards all draw <strong>people</strong> <strong>and</strong> commerce to cities.<br />
Global projections of urbanization indicate the majority<br />
of future urban population growth will take place in lower<br />
income countries (Figure 5.1).<br />
This chapter presents evidence of how cities <strong>and</strong><br />
urbanization affect education, <strong>and</strong> how education<br />
affects urban issues. Population growth, migration <strong>and</strong><br />
the refugee crisis all have particular consequences for<br />
education. Cities – with their concentration of universities,<br />
research institutions, high skill industries <strong>and</strong> informal<br />
knowledge – are engines of knowledge-based innovation<br />
<strong>and</strong> growth. The scale <strong>and</strong> speed of urban change<br />
will require good governance, including flexibility <strong>and</strong><br />
innovation, with multiple stakeholders <strong>and</strong> an adaptive<br />
approach (Jones et al., 2014; Wild et al., 2015), all of which<br />
will benefit from citizens engaging in lifelong learning.<br />
Education <strong>and</strong> lifelong learning also influence cities<br />
<strong>and</strong> are key to taking advantage of cities’ physical <strong>and</strong><br />
social capital. They can have positive effects, such as<br />
reducing crime, <strong>and</strong> be used in good urban planning, for<br />
example to encourage<br />
sustainable transport.<br />
Education <strong>and</strong> lifelong<br />
Education can also<br />
help address urban learning are key to<br />
challenges. Cities are taking advantage of<br />
the sites of massive<br />
cities’ physical <strong>and</strong><br />
inequality. Vulnerable<br />
populations in cities social capital<br />
in both low <strong>and</strong> high<br />
income countries suffer<br />
from poor access to basic services – such as education,<br />
housing <strong>and</strong> transport – which fosters disillusion,<br />
discontent <strong>and</strong> sometimes violence. Education can play<br />
a crucial role in tackling inequality <strong>and</strong> discrimination in<br />
urban areas.<br />
Improvements in planning are crucial for ensuring<br />
that the opportunities of urbanization outweigh the<br />
challenges <strong>and</strong> result in more inclusive, environmentally<br />
sustainable <strong>and</strong> prosperous cities. And education can play<br />
a crucial role in urban planning at the local level as well as<br />
in tackling related regional <strong>and</strong> global policy issues.<br />
While most of the SDG agenda is driven by action at<br />
the level of member states, integrated policy-making<br />
is also required at the subnational level. Cities are both<br />
incubators <strong>and</strong> locations of change, <strong>and</strong> their importance<br />
to the world means the relationships between space<br />
<strong>and</strong> sectors such as the economy <strong>and</strong> education must<br />
be better understood. Such underst<strong>and</strong>ing would<br />
facilitate a comprehensive, contemporary perception of<br />
2016 • GLOBAL EDUCATION MONITORING REPORT 115
5<br />
FIGURE 5.1A:<br />
We live in an increasingly urban world …<br />
Population in urban areas, projections to 2050 (%)<br />
how humanity can tackle poverty, create inclusive <strong>and</strong><br />
sustainable economic growth, protect the <strong>planet</strong> from<br />
degradation <strong>and</strong> destruction, <strong>and</strong> fulfil SDG 4 by ensuring<br />
inclusive <strong>and</strong> equitable education <strong>and</strong> promoting lifelong<br />
learning opportunities for all.<br />
Population in urban areas (%)<br />
100<br />
90<br />
80<br />
70<br />
60<br />
50<br />
40<br />
30<br />
20<br />
10<br />
0<br />
Upper middle<br />
income<br />
Lower middle income<br />
High income<br />
World<br />
Low income<br />
1950<br />
1955<br />
1960<br />
1965<br />
1970<br />
1975<br />
1980<br />
1985<br />
1990<br />
1995<br />
2000<br />
2005<br />
2010<br />
2015<br />
2020<br />
2025<br />
2030<br />
2035<br />
2040<br />
2045<br />
2050<br />
CITIES AFFECT EDUCATION<br />
PLANNING<br />
Education must be integrated in urban planning<br />
to address the consequences on education of<br />
characteristics <strong>and</strong> processes related to urbanization,<br />
for example the need for education for refugee, migrant<br />
<strong>and</strong> slum-dwelling populations.<br />
POPULATION CHANGE AFFECTS<br />
EDUCATION PLANNING<br />
FIGURE 5.1B:<br />
… <strong>and</strong> much future urban growth is expected to<br />
happen in lower income countries<br />
Projected annual city population growth rates (%),<br />
2015–2030<br />
Projected annual city population growth rates, 2015–2030 (%)<br />
6<br />
5<br />
4<br />
3<br />
2<br />
1<br />
0<br />
-1<br />
-2<br />
Low <strong>and</strong> lower<br />
middle income<br />
Upper<br />
middle income<br />
5 million or more<br />
1 to 5 million<br />
less than 1 million<br />
High<br />
income<br />
Notes: For Figure 5.1b, the size of the bubble represents the size of<br />
the cities in 2014.<br />
Source: UNDESA (2014).<br />
The continued growth of urban areas has implications<br />
for education system planning. While urbanization<br />
is a global trend, considerable variation exists in how<br />
urban populations grow, whether through natural<br />
population increases, migration or the reclassification<br />
of rural settlements. Globally, about half of urban<br />
growth is due to natural population growth <strong>and</strong><br />
half to migration from rural areas (McGranahan <strong>and</strong><br />
Satterthwaite, 2014). In China, 56% of urban population<br />
growth between 2000 <strong>and</strong> 2010 was a result of rural-tourban<br />
migration despite strong disincentives such as<br />
rural residents being prevented access to education <strong>and</strong><br />
health benefits once in cities (Bosker et al., 2015; World<br />
Bank <strong>and</strong> China Development Research Center of the<br />
State Council, 2014). In India, the reclassification of<br />
rural settlements into towns was responsible for 30% of<br />
urban population growth between 2001 <strong>and</strong> 2011; 44%<br />
of the growth was due to natural population increases<br />
(Ellis <strong>and</strong> Roberts, 2016).<br />
Growth in cities, mostly unplanned, not only is the<br />
primary challenge for urban education systems but also<br />
has effects in rural areas (Box 5.1). The flow of migrants<br />
within <strong>and</strong> between countries, combined with continued<br />
growth in local populations, can raise dem<strong>and</strong> for basic<br />
education access, skills development <strong>and</strong> more teachers,<br />
<strong>and</strong> increase the need to foster social cohesion <strong>and</strong><br />
tolerance of cultural diversity through education.<br />
116<br />
CHAPTER 5 | PLACE: INCLUSIVE AND SUSTAINABLE CITIES
5<br />
BOX 5.1<br />
Dealing with declining populations with rural<br />
school consolidation<br />
Population increases in cities as a result of rural–urban migration<br />
has the converse effect of a declining population in rural <strong>and</strong><br />
remote areas, with implications for rural education planning. Rural<br />
consolidation policies have been implemented in China <strong>and</strong> the<br />
United States to address the loss of students in rural schools.<br />
However, such policies need to be carefully planned <strong>and</strong> crafted.<br />
Recent reviews of the policy in China have deemed it to be largely<br />
unsuccessful, leading to increased dropouts, overcrowding in town<br />
schools, more teacher burden <strong>and</strong> higher financial pressures on the<br />
rural poor. The policy was suspended by the Ministry of Education in<br />
2012. In the United States, there has been long-st<strong>and</strong>ing resistance<br />
to rural school consolidation, which historically was part of the<br />
Progressive movement’s effort to make school districts more<br />
efficient. However, studies showed that school consolidation<br />
without adequate community involvement increased student<br />
absenteeism, led to community disintegration <strong>and</strong> hardships for<br />
families, <strong>and</strong> did little to improve fiscal efficiency.<br />
Sources: Bard et al. (2006); Howley et al. (2011); Mei et al. (2015);<br />
Strang (1987); Tyack <strong>and</strong> Hansot (1982).<br />
Urban refugees <strong>and</strong> displaced populations need<br />
access to education<br />
The refugee crisis is deepening. The crisis is also<br />
more prevalent in <strong>and</strong> around cities. Analysis based<br />
on 12.2 million refugees finds that by late 2014, 6 out<br />
of 10 lived in urban areas. Globally, the number of<br />
forcibly displaced <strong>people</strong> increased by over 40% between<br />
2011 <strong>and</strong> 2014, to 59.5 million (UNHCR, 2015). Refugees may<br />
not be formally registered in camps, which can limit their<br />
access to basic services <strong>and</strong> to employment authorization<br />
<strong>and</strong> access (UNESCO <strong>and</strong> UNHCR, 2016). It can also make<br />
it hard to get accurate counts of the number of refugees<br />
<strong>and</strong> internally displaced <strong>people</strong> in urban areas.<br />
Globally, education systems are substantially affected<br />
by this crisis, since more than half the world’s refugees<br />
are under 18. Given the long-term nature of displacement<br />
<strong>and</strong> the magnitude of the challenge in some countries,<br />
national <strong>and</strong> urban education systems that receive<br />
forcibly displaced children <strong>and</strong> youth need to adapt to<br />
support their long-term integration.<br />
Turkey is host to almost 3 million registered Syrian<br />
refugees. As of late 2015, almost 700,000 Syrian refugee<br />
children <strong>and</strong> adolescents aged 6 to 17 needed access to<br />
education (3RP, 2016). Around 85% were scattered outside<br />
camps in towns <strong>and</strong> cities. The percentage of refugee<br />
children enrolled in formal education was over 85% in camp<br />
settings but only 30% in urban areas. Overall, enrolment<br />
rates were 7% in pre-primary education, 52% in primary<br />
education, 31% in lower secondary education, <strong>and</strong> 10% in<br />
upper secondary education (UNESCO <strong>and</strong> UNHCR, 2016).<br />
Along with economic constraints, a major barrier to<br />
education is the language of instruction. The acquisition<br />
of a second language can be especially challenging for<br />
children who have fallen behind academically due to<br />
school interruptions, which is the case for many Syrian<br />
refugee children. In addition to the language barrier,<br />
teachers are not trained to address the emotional<br />
trauma experienced by many refugee children (Sirin<br />
<strong>and</strong> Rogers-Sirin, 2015).<br />
The skills of migrant workers must be<br />
retained <strong>and</strong> improved<br />
Migrants to cities face a number of challenges while<br />
trying to gain employment, such as discrimination,<br />
language barriers, unemployment, <strong>and</strong> exploitation<br />
in the informal economy. Addressing these requires,<br />
among other interventions, a focus on skills development<br />
(International Organization for Migration, 2015).<br />
For example, China’s unprecedented economic growth<br />
was accompanied by a tremendous wave of internal<br />
migration. In 2004, there were 120 million migrants,<br />
of whom 18% had primary education or less <strong>and</strong> 65%<br />
had completed lower secondary education (nine years<br />
of schooling). Migrant workers have very limited job<br />
security: a survey of 40 Chinese cities found that only<br />
12.5% of workers had written contracts (Shi, 2008). An<br />
integrated skills development <strong>and</strong> employment training<br />
project conducted between 2007 <strong>and</strong> 2014 focused on<br />
improving training available to rural migrants, enhancing<br />
access to employment services <strong>and</strong> raising awareness of<br />
worker protections (World Bank, 2015).<br />
A parallel problem is the deskilling of migrants, which<br />
has a gendered dimension. Women from the Philippines<br />
who hold university degrees travel to the Middle East<br />
to work as housemaids, <strong>and</strong> Eastern European women<br />
work in low skill jobs in wealthier EU countries (Kofman<br />
<strong>and</strong> Raghuram, 2009). Global research also indicates that<br />
a longer period in the host country did not significantly<br />
improve migrants’ opportunities. Some highly skilled<br />
women could not continue in their professions despite<br />
2016 • GLOBAL EDUCATION MONITORING REPORT 117
5<br />
adequate knowledge of the local language (International<br />
Organization for Migration, 2013).<br />
Education for slum dwellers is a challenge<br />
More than one-third of all urban residents in many<br />
developing countries live in slums or shanty towns in<br />
city centres or urban peripheries. Slums’ conditions<br />
vary greatly within <strong>and</strong><br />
between countries, but<br />
many are characterized by<br />
There is a distinct<br />
poor <strong>and</strong> crowded housing<br />
lack of access to conditions, insecurity of<br />
public education l<strong>and</strong> <strong>and</strong> housing, <strong>and</strong> poor<br />
access to basic services,<br />
in urban slums <strong>and</strong><br />
including education (UN<br />
peri-urban areas Habitat, 2009a). There has<br />
been increased recognition<br />
of the need to improve<br />
their liveability since the Millennium Development Goals,<br />
culminating in a strong focus on the issue in SDG 11.<br />
Major collective efforts, such as by the Shack/Slum<br />
Dwellers International (SDI) network, have involved<br />
documenting inequality in services <strong>and</strong> advocating<br />
for change in government policy by empowering<br />
communities to participate in data collection <strong>and</strong><br />
decision-making processes (Patel et al., 2012).<br />
However, the focus is on basic services, such as<br />
housing, water <strong>and</strong> sanitation, with the situation of<br />
education often unclear (Kiell<strong>and</strong>, 2015). Yet, education<br />
remains a priority for communities. For instance, new<br />
data compiled for the GEM Report 2016 collected from<br />
130 slum settlement profiles in 12 cities <strong>and</strong> towns<br />
of Ug<strong>and</strong>a to identify community needs indicated<br />
that, while most settlement respondents agreed that<br />
students had access to pre-primary, primary <strong>and</strong><br />
secondary schooling, in their qualitative responses they<br />
still highlighted the need to increase the number of<br />
schools, especially public schools (Shack/Slum Dwellers<br />
International et al., 2016).<br />
Private school growth is an urban planning issue<br />
The prevalence of private schools, especially in major<br />
cities, is often underestimated or disregarded in<br />
discussions of public education systems. In India,<br />
studies of two major cities, Mumbai <strong>and</strong> Patna,<br />
suggest that private schools serve over 75% of the<br />
children there (Ernst <strong>and</strong> Young LLP, 2014). The 2010/11<br />
private school census of Lagos state, Nigeria revealed<br />
that over 85% of pre-primary <strong>and</strong> 60% of primary<br />
students were enrolled in private schools. Overall, the<br />
survey identified 12,098 private schools while there were<br />
only 1,606 government schools (Härmä, 2011, 2013).<br />
Private schools play a crucial role in education in<br />
peri-urban areas (on the periphery of cities). Growth in<br />
such areas is mostly informal, often not captured in official<br />
statistics, <strong>and</strong> critically neglected (Ellis <strong>and</strong> Roberts, 2016).<br />
For example, satellite imagery shows that for many of<br />
the 12 largest Indian cities, the proportion of population<br />
outside the official boundaries exceeds that within (Ellis<br />
<strong>and</strong> Roberts, 2016). Evidence on peri-urban schooling<br />
suggests that private schools dominate provision, as in<br />
informal urban settlements <strong>and</strong> slums. A study of periurban<br />
areas in four sub-Saharan African countries found<br />
the majority of pre-primary schools were private. Given<br />
the strong dem<strong>and</strong> for pre-primary education, the growth<br />
of private schools is likely the result of a lack of good<br />
quality public schools (Bidwell <strong>and</strong> Watine, 2014).<br />
EDUCATION HAS A POSITIVE<br />
INFLUENCE ON CITIES<br />
Education <strong>and</strong> lifelong learning need to be integrated<br />
in urban planning to take advantage of their positive<br />
effects on cities in economic <strong>and</strong> social terms. Education<br />
encourages productivity <strong>and</strong> innovation in cities, <strong>and</strong><br />
can transform them into knowledge economies. It can<br />
also support a more prosperous city that accurately<br />
reflects its economic activities, for example by including<br />
the dynamic informal economy. Education can have<br />
positive social effects, such as crime reduction. It can<br />
be a primary tool for environmental initiatives, such as<br />
sustainable transport.<br />
HIGHLY SKILLED WORKERS ARE CRITICAL FOR<br />
INNOVATION AND GROWTH<br />
Economic growth is highly concentrated in urban areas<br />
– half of the world’s population lives in cities, which<br />
generate more than 80% of global gross domestic<br />
product (GDP). Only 600 urban centres, with one-fifth<br />
of the world’s population, generate 60% of global gross<br />
domestic product (GDP). By 2025, new smaller cities,<br />
mostly in China <strong>and</strong> India, are expected to replace many<br />
developed country cities in the list of top 600 cities<br />
(Dobbs et al., 2011). Urban economic growth is strongly<br />
linked to the extent of agglomeration, where firms <strong>and</strong><br />
<strong>people</strong> are located closer together in cities <strong>and</strong> clusters,<br />
attracting higher investment, skilled workers <strong>and</strong><br />
talented graduates.<br />
118<br />
CHAPTER 5 | PLACE: INCLUSIVE AND SUSTAINABLE CITIES
5<br />
“<br />
Education can propel cities’ competitiveness <strong>and</strong> productivity<br />
”<br />
Education propels innovation <strong>and</strong> productivity-led<br />
economic growth, <strong>and</strong> provides <strong>and</strong> improves human capital<br />
(Mankiw et al., 1992). Good quality primary <strong>and</strong> secondary<br />
education <strong>and</strong> high enrolment rates in tertiary education<br />
are fundamental for fostering innovation <strong>and</strong> increasing<br />
productivity in knowledge economies (World Economic<br />
Forum, 2014). Talent <strong>and</strong> creativity are decisive factors in<br />
shaping economic opportunity <strong>and</strong> knowledge-based urban<br />
development (Carillo et al., 2014; Yigitcanlar et al., 2007).<br />
City’s authorities recognize this <strong>and</strong> seek to attract talent<br />
as a way to be competitive in the global economy <strong>and</strong> to<br />
develop a knowledge economy. A city’s competitiveness<br />
is determined by its ability to retain graduates of local<br />
higher education institutions <strong>and</strong> attract highly qualified<br />
graduates from the rest of the country (A.T. Kearney,<br />
2015; The Economist Intelligence Unit, 2012).<br />
Cities attract talent in different ways. Because of their<br />
scale, larger cities, such as megacities with populations<br />
of over 10 million <strong>people</strong>, have an advantage over smaller<br />
ones in attracting human capital. Shanghai, a megacity<br />
in China, is located within a network of smaller cities <strong>and</strong><br />
attracts a wide range of talent, including from overseas.<br />
It has access to over 100,000 graduates from 60 higher<br />
education institutions every year. More than one-quarter<br />
of the labour force is college-educated, double the<br />
proportion of a decade ago (Dobbs et al., 2011). Some<br />
secondary cities have tried to promote themselves as<br />
alternatives to larger cities by touting their clean air,<br />
good public services <strong>and</strong> health benefits.<br />
The development of technology clusters has invigorated<br />
some smaller cities. Recent data indicate that the Indian<br />
state of Karnataka, which includes the elite Bangalore<br />
technology innovation cluster, attracts a higher<br />
proportion of highly educated internal migrants than the<br />
states that include the megacities of Delhi <strong>and</strong> Mumbai<br />
(Ch<strong>and</strong>rashekhar <strong>and</strong> Sharma, 2014). Hyderabad, hailed<br />
as India’s most competitive city in 2013, developed<br />
services related to information <strong>and</strong> communication<br />
technologies (ICT) <strong>and</strong> a special enclave for ICT firms,<br />
research institutions <strong>and</strong> similar services called the<br />
Cyberabad Development Authority (Das, 2015). Such new<br />
investments <strong>and</strong> city–industry links have facilitated a<br />
brain gain or reverse migration in India (Chacko, 2007).<br />
CITIES INCREASE COMPETITIVENESS WITH A<br />
FOCUS ON EDUCATION AND RESEARCH<br />
Countries (or cities or zones) aim to attract human<br />
capital <strong>and</strong> foreign direct investment by positioning<br />
themselves as global hubs for higher education, skills,<br />
talent, knowledge <strong>and</strong> innovation. Qatar has focused<br />
on becoming a regional hub to reduce its dependence<br />
on natural resources <strong>and</strong> move towards a knowledge<br />
economy. Singapore aimed to become the ‘Boston of<br />
the East’ with its Global Schoolhouse strategy to attract<br />
students <strong>and</strong> executives, <strong>and</strong> become a 21st century<br />
knowledge hub (Knight, 2014).<br />
In analyses of urban competitiveness, the San Francisco<br />
Bay Area in the United States <strong>and</strong> Tokyo are regularly<br />
near the top (A.T. Kearney, 2015), with synergistic<br />
collaborations between higher education, government<br />
<strong>and</strong> industry, referred to as the Triple Helix model of<br />
innovation (Etzkowitz, 2003). Stanford University has<br />
served as an anchor for talent <strong>and</strong> innovation – the<br />
university has reportedly had significant global economic<br />
impact, <strong>and</strong> 18,000 firms created by its alumni are based<br />
in California (Eesley <strong>and</strong> Miller, 2012).<br />
Governments can also take the lead. Tsukuba Science<br />
City in Japan was established near Tokyo in the 1970s. Its<br />
cluster of universities, publicly funded scientific research<br />
laboratories <strong>and</strong> national research institutes has received<br />
about half of Japan’s public research <strong>and</strong> development<br />
budget <strong>and</strong> become an important global site for<br />
government–industry research collaborations (Mega, 2013).<br />
THE EDUCATION SECTOR CAN PROMOTE BETTER<br />
INCLUSION OF INFORMAL SECTOR ACTIVITY<br />
The informal sector is well recognized as a major,<br />
heterogeneous source of employment <strong>and</strong> income in<br />
developing countries, <strong>and</strong> as an important stop gap<br />
employer or buffer in higher income economies during<br />
recessions or economic crises. Recognizing <strong>and</strong> including<br />
2016 • GLOBAL EDUCATION MONITORING REPORT 119
5<br />
it in urban economies is important for a city’s prosperity,<br />
an accurate underst<strong>and</strong>ing of its economy <strong>and</strong> the social<br />
inclusion of those involved in the sector.<br />
Targeted analyses of informal employment by type of<br />
occupation show that in 2013, domestic workers, homebased<br />
workers <strong>and</strong> street vendors accounted for about<br />
one-third of urban employment in India, <strong>and</strong> that street<br />
vendors alone accounted for 15% of the urban workforce<br />
in South Africa. In China,<br />
analysis of an urban labour<br />
survey of six cities found<br />
Improving basic<br />
informal employment<br />
education levels <strong>and</strong> fairly high at 33%,<br />
skills development especially for women<br />
(ILO <strong>and</strong> WIEGO, 2014).<br />
fosters more<br />
inclusive economies<br />
Since education is<br />
inextricably tied to<br />
employment prospects,<br />
continuous improvement in basic education levels <strong>and</strong><br />
skills development is needed to foster more inclusive<br />
economies (UNESCO, 2012). For example, based on data<br />
on Mumbai, India, from the 2011 Indian Census, the GEM<br />
Report team calculated that adult women who were<br />
not fully employed had a higher level of illiteracy (19.2%)<br />
compared to fully employed women (13.5%).<br />
Education institutions can play an important role in<br />
improving working conditions in the informal sector. For<br />
instance, in a project in Chicago, the Institute for Justice<br />
<strong>and</strong> the University of Chicago Law School partnered with<br />
informal sector workers to improve their legal st<strong>and</strong>ing,<br />
helping around 2,000 street food vendors sell their<br />
products legally. They set up a legal clinic to empower the<br />
vendors <strong>and</strong> provide them with legal services, education,<br />
outreach <strong>and</strong> advocacy. An ordinance drafted in the project<br />
was used to change local regulation (Carrera et al., 2016).<br />
EDUCATION HAS A POSITIVE SOCIAL IMPACT,<br />
PARTICULARLY IN REDUCING CRIME<br />
Education is well documented to have a positive social<br />
impact, particularly in reducing crime. It does this by<br />
increasing the potential for certain types of employment<br />
opportunities, thus creating less incentive for crime, which<br />
is often more prevalent in urban areas. Education may also<br />
teach individuals to be more patient <strong>and</strong> to be more averse<br />
to risks such as punishment for crimes, <strong>and</strong> increase their<br />
interactions with more educated persons. Going to school in<br />
<strong>and</strong> of itself reduces the incidence of crime (Lochner, 2011).<br />
Global empirical evidence confirms that educational<br />
attainment is strongly negatively associated with crime<br />
indicators, especially when contrasting populations with<br />
<strong>and</strong> without high school diplomas (Lochner, 2011). Using<br />
2007/08 data, a study calculated that a 5 percentage point<br />
increase in male high school graduation rates would have<br />
nearly US$20 billion in total benefit to the US economy via<br />
reduced crime <strong>and</strong> higher earnings (DeBaun <strong>and</strong> Roc, 2013).<br />
Similar crime-reducing effects are shown in Europe. In<br />
Norway, <strong>people</strong> who complete upper secondary education<br />
enjoy better labour market prospects <strong>and</strong> are less apt to<br />
use public welfare benefits <strong>and</strong> less likely to be charged with<br />
a crime (Falch et al., 2010). In Engl<strong>and</strong> <strong>and</strong> Wales (United<br />
Kingdom), prolonging compulsory schooling led to a major<br />
reduction in crime <strong>and</strong> violence (Machin et al., 2011).<br />
A similar trend is found in middle income countries.<br />
A city-level analysis of seven Colombian cities found<br />
that a higher level of human capital in a city (education<br />
levels, primary <strong>and</strong> secondary education coverage) was<br />
associated with a lower homicide rate (Poveda, 2012). Being<br />
educated to grade 12 or higher in South Africa decreases<br />
the likelihood of being incarcerated (Jonck et al., 2015).<br />
In the United States, strong evidence has been found of<br />
the long-term effects of early childhood education on<br />
crime in adulthood. An analysis of Chicago’s governmentfunded<br />
Child-Parent Centers found that children who did<br />
not go to the pre-school programme at age 3 to 4 were<br />
70% more likely to be arrested for a violent crime by age<br />
18 (Lochner, 2011).<br />
EDUCATION IS KEY FOR WIDESPREAD<br />
ADOPTION OF MORE SUSTAINABLE TRANSPORT<br />
Education should be integrated into urban planning as a tool<br />
to achieve social <strong>and</strong> environmental aims. One example is<br />
the widespread adoption of more sustainable transport.<br />
Current trends show that cities consume the vast<br />
majority of natural resources <strong>and</strong> are responsible for<br />
most greenhouse gas emissions. Education can improve<br />
awareness of environmental challenges <strong>and</strong> individual<br />
<strong>and</strong> communal responsibilities to address them (see<br />
Chapter 1: Planet). For example, it can support more<br />
sustainable transport within cities. Many rapidly growing<br />
cities will become unsustainable in relation to space <strong>and</strong><br />
transport (Pucher et al., 2007). Increased acceptability of<br />
public transport is clearly needed (UN Habitat, 2013), as<br />
is a re-envisioning of urban space <strong>and</strong> promotion of non-<br />
120<br />
CHAPTER 5 | PLACE: INCLUSIVE AND SUSTAINABLE CITIES
5<br />
motorized transport (Clean Air Asia, 2013). Educational<br />
tools have been important in the mass adoption of two<br />
forms of more sustainable transport: bus rapid transit<br />
(Box 5.2) <strong>and</strong> cycling (Box 5.3).<br />
EDUCATION AND KNOWLEDGE<br />
CAN CONTRIBUTE TO<br />
INEQUALITY IN CITIES<br />
Education is not invariably a positive influence in urban<br />
areas. It can both embody <strong>and</strong> reflect existing inequity,<br />
<strong>and</strong> can contribute to or cause inequality. Knowledgedriven<br />
economic development has been a factor in rising<br />
inequality <strong>and</strong> vanishing middle skill jobs (see Chapter 2:<br />
Prosperity). To ensure that education does not exacerbate<br />
unequal patterns of social stratification, governments<br />
need to acknowledge the relationship between education<br />
<strong>and</strong> inequality, <strong>and</strong> balance education-related activities<br />
that can improve the competitiveness of a city with<br />
those that can improve social inclusion.<br />
BOX 5.2<br />
Education for awareness <strong>and</strong> consensus-building has been<br />
important for smooth adoption of bus rapid transit systems<br />
Bus rapid transit (BRT) is a high capacity mass transit system with features such<br />
as dedicated bus lanes <strong>and</strong> off-board fare collection, which improve efficiency <strong>and</strong><br />
reduce traffic congestion. The BRT model is a key component of the concept of global<br />
sustainable urban mobility. Two hundred <strong>and</strong> three cities around the world have BRT<br />
systems, partly due to advocacy by mayors.<br />
Experience with BRT systems shows that information <strong>and</strong> communication strategies<br />
are especially important to engage stakeholders who may be adversely affected by<br />
introduction of the system, such as other transit operators <strong>and</strong> private vehicle users.<br />
In Johannesburg, South Africa, inadequate communication among stakeholders (local<br />
government <strong>and</strong> two private taxi organizations) at an early stage of the discussion led to<br />
lack of trust among parties, severely delaying implementation of the system. By contrast,<br />
in Lagos, Nigeria, local government engaged stakeholders in a communication programme<br />
from the beginning, including in planning <strong>and</strong> implementation. This helped Lagos avoid<br />
deadlock with stakeholders <strong>and</strong> the project was implemented relatively quickly.<br />
Sources: Allen (2013); EMBARQ (2015); Kumar et al. (2012).<br />
INEQUALITY IN EDUCATION IS RELATED TO<br />
LOCATION, WEALTH AND OTHER FACTORS<br />
Location <strong>and</strong> wealth<br />
There is substantial inequality in education between rural<br />
<strong>and</strong> urban areas (see Chapter 3: People). In-depth data<br />
also suggest strong intra-urban inequality. According to<br />
GEM Report team calculations, while urban areas often<br />
provide greater access to education, the urban poor have<br />
worse primary completion rates than the average rural<br />
household in 26 out of the 35 countries with available<br />
data. In the case of lower secondary completion rates,<br />
which entail a more select group of households <strong>and</strong><br />
students, the urban poor disadvantage is even more<br />
pronounced: Outcomes among the urban poor are much<br />
worse than those of the rural poor in many lower income<br />
countries. This is likely attributable to factors such as<br />
the opportunity cost of forgoing paid employment <strong>and</strong><br />
difficulty affording education (Figure 5.2).<br />
Thus, the potential positive benefits of being located in<br />
an urban area can be undermined by a lack of policies<br />
that address inequity.<br />
Various spatial <strong>and</strong> social patterns in most major cities –<br />
gentrification, slums, urban sprawl, housing discrimination,<br />
immigrant enclaves – separate residents in terms of<br />
wealth, access <strong>and</strong> privilege (UN Habitat, 2009a). These<br />
BOX 5.3<br />
Education is a critical component of making cycling the norm<br />
in urban transport<br />
In countries with best-practice cities, such as Denmark, Germany <strong>and</strong> the Netherl<strong>and</strong>s,<br />
cycling became the norm for transport as a result of both urban planning <strong>and</strong> education,<br />
with right of way for cyclists, bike parking, comprehensive traffic education <strong>and</strong> training for<br />
cyclists <strong>and</strong> motorists, <strong>and</strong> a range of promotional events to generate support. Education<br />
is woven into an integrated approach in which Danish, Dutch <strong>and</strong> German children from<br />
an early age receive extensive training in safe <strong>and</strong> effective cycling – in classrooms <strong>and</strong><br />
on the road – as part of their curriculum by the fourth grade. Police officers test children,<br />
who receive official certificates <strong>and</strong> stickers for their bikes once they pass the test.<br />
Starting early ensures that children begin cycling when they are young. A<br />
comprehensive approach provides greater impact than individual, uncoordinated<br />
measures. Policies also de-incentivized driving through taxes <strong>and</strong> restrictions on car<br />
ownership <strong>and</strong> use, while education shifted public opinion in favour of walking, cycling<br />
<strong>and</strong> public transport in reaction to the negative impact of car use.<br />
Paris’s bike-sharing or ‘public bicycle’ system, Vélib, has reduced traffic in private<br />
vehicles <strong>and</strong> increased daily bicycle trips enormously. Similar systems have been<br />
adopted in over 50 countries <strong>and</strong> over 700 cities. Education is important to promote<br />
public underst<strong>and</strong>ing <strong>and</strong> frequent use of such systems. Bike-sharing programmes<br />
are being widely adopted in Latin American cities, including Buenos Aires, Mexico City<br />
<strong>and</strong> Rio de Janeiro.<br />
Sources: Ferreiro (2015); Godefrooij et al. (2009); Pucher et al. (2010); Pucher <strong>and</strong> Buehler (2008).<br />
2016 • GLOBAL EDUCATION MONITORING REPORT 121
5<br />
“<br />
Education gaps are often wider within urban<br />
areas, than between urban <strong>and</strong> rural<br />
”<br />
FIGURE 5.2:<br />
Developing countries have rural–urban disparity but also very high<br />
intra-urban disparity<br />
Disparity based on location (rural–urban) <strong>and</strong> wealth (bottom <strong>and</strong> top<br />
quintile) in lower secondary completion rates<br />
Lower secondary completion rate (%)<br />
100<br />
90<br />
80<br />
70<br />
60<br />
50<br />
40<br />
30<br />
20<br />
10<br />
0<br />
Cambodia<br />
Pakistan<br />
Honduras<br />
Nepal<br />
India<br />
Sudan<br />
Syrian A. R.<br />
Philippines<br />
Thail<strong>and</strong><br />
Egypt<br />
Viet Nam<br />
Jordan<br />
Palestine<br />
Urban rich<br />
Rural rich<br />
National<br />
Rural poor<br />
Urban poor<br />
region, especially with regard to access to good quality<br />
schooling (De la Fuente et al., 2013). Similarly, district-level<br />
analysis in São Paulo, Brazil, found that public services<br />
<strong>and</strong> utilities, including education, were more intensively<br />
allocated to districts with higher levels of human<br />
development (Haddad <strong>and</strong> Nedovic-Budic, 2006). In the<br />
province of Free State, South Africa, high crime rates were<br />
associated with a bifurcated society <strong>and</strong> with high levels<br />
of social exclusion <strong>and</strong> marginalization, including through<br />
segregated, marginalized schools (Jonck et al., 2015).<br />
Within cities, the distribution of amenities can vary.<br />
Important amenities are usually concentrated in city<br />
centres. For instance, 2007 data from Kisumu, Kenya,<br />
showed the city centre had far more primary schools than<br />
the rest of the city, schools with lower pupil/teacher ratios,<br />
<strong>and</strong> a high number of primary school toilets, as well as most<br />
of the private schools (Figure 5.3). The more populated<br />
central district, Kibuye, had 31 primary schools while the<br />
remaining districts averaged 7 primary schools each.<br />
Source: GEM Report team analysis (2016) based on Demographic <strong>and</strong> Health<br />
Surveys, Multiple Indicator Cluster Surveys <strong>and</strong> national household survey data.<br />
types of inequality are linked to income levels, the location<br />
of employers, transport options <strong>and</strong> spending policies<br />
(Kilroy, 2007), as well as current <strong>and</strong> historical legislation<br />
that institutionalizes ethnic <strong>and</strong> racial discrimination <strong>and</strong><br />
segregation (Rothstein <strong>and</strong> Santow, 2012). Pockets of<br />
poverty in cities can evolve into persistent disadvantage as<br />
their populations become isolated from job opportunities,<br />
experience crime <strong>and</strong> violence more frequently <strong>and</strong> are<br />
physically separated from other income groups. In recent<br />
years, growing fears for personal safety from crime <strong>and</strong><br />
violence have led to a proliferation of gated communities,<br />
some of which have even exp<strong>and</strong>ed to become gated cities<br />
(Borsdorf <strong>and</strong> Hidalgo, 2008; UN Habitat, 2009a).<br />
Policy<br />
Discriminatory policies <strong>and</strong> practices exacerbate inequality<br />
in education. An in-depth analysis of Chile’s second-largest<br />
urban region, the Concepción metropolitan area, found<br />
major differences in the distribution of schools in the<br />
Inequitable distribution of good teachers can exacerbate<br />
educational inequality. It is well documented that<br />
qualified teachers, especially women, are less likely to<br />
transfer to <strong>and</strong> stay in rural areas or low income schools<br />
in inner cities (Chudgar <strong>and</strong> Luschei, 2015; UNESCO, 2014,<br />
2015). Countries have used payment- <strong>and</strong> accountabilitybased<br />
teacher recruitment <strong>and</strong> retention policies to<br />
counter this bias (Chudgar <strong>and</strong> Luschei, 2015). However,<br />
policies to redistribute teachers to rural areas or low<br />
performing schools can be difficult to implement due<br />
to teacher preferences, as well as the role of political<br />
influence in teacher placement. For instance, research<br />
on teachers in India revealed a clear patronage-based<br />
relationship between teachers <strong>and</strong> politicians; the teacher<br />
transfer system was not based on objective criteria such<br />
as the needs of schools or regions (Beteille, 2009).<br />
Private schools can both alleviate <strong>and</strong> cause inequality.<br />
In many countries, private schools address the needs of<br />
increased urban populations <strong>and</strong> serve the entire socioeconomic<br />
spectrum to provide a perceived or actual<br />
higher quality of education than the public system,<br />
122<br />
CHAPTER 5 | PLACE: INCLUSIVE AND SUSTAINABLE CITIES
5<br />
<strong>and</strong> deliver education services when the public system<br />
has not exp<strong>and</strong>ed to meet the population’s needs (Day<br />
Ashley et al., 2014).<br />
School choice – allowing parents to choose between the<br />
public system <strong>and</strong> private, charter or other non-state<br />
institutions, usually in search of better quality education<br />
– is often both a cause <strong>and</strong> consequence of demographic<br />
stratification. National education plans have facilitated school<br />
choice in contexts as diverse as Chile (Hsieh <strong>and</strong> Urquiola,<br />
2006), Nepal (Joshi, 2016) <strong>and</strong> Sweden (Bunar, 2010). The<br />
empirical literature has shown that a consistent result<br />
is greater stratification. The evidence on the benefits of<br />
school choice in terms of quality has been mixed <strong>and</strong><br />
heavily debated (Day Ashley et al., 2014; Härmä, 2015).<br />
FIGURE 5.3:<br />
In Kisumu, Kenya, the concentration of primary schools, primary<br />
school toilets <strong>and</strong> private schools depends on location<br />
Distribution of schools, toilets <strong>and</strong> pupil/teacher ratios, 2007<br />
a. Differences in pupil/teacher ratios<br />
Average primary school pupil to teacher ratios<br />
Proportional symbols representing student to teacher ratio<br />
1<br />
5<br />
10<br />
50<br />
100<br />
Attitude <strong>and</strong> school environment<br />
Inequality in education can also be perpetuated by<br />
attitude. Teachers routinely exhibit discriminatory attitudes<br />
towards children of migrants <strong>and</strong> minorities, which can<br />
contribute to their social marginalization. A recent study<br />
using the 2014 China Child Well-Being Survey found that<br />
teachers of first-graders in Shanghai were likely to report<br />
that migrant students performed further below their grade<br />
level in language than local peers, even after controlling<br />
for background characteristics (Cherng <strong>and</strong> Han, 2016).<br />
Similarly, a r<strong>and</strong>omized evaluation which assigned children’s<br />
characteristics to examination cover sheets in India found<br />
that teachers gave worse scores to lower caste than higher<br />
caste children, suggesting that 20% of the performance gap<br />
between higher <strong>and</strong> lower caste students was attributable<br />
to caste-based discrimination (Hanna <strong>and</strong> Linden, 2012).<br />
b. Distribution of primary school toilets<br />
Density of constructed primary school toilets<br />
Number of constructed toilets in primary schools by municipality<br />
Primary school location<br />
0–10<br />
11–15<br />
16–25<br />
26–30<br />
31–50<br />
51–100<br />
101–200<br />
201–400<br />
Education can also perpetuate social exclusion where<br />
schools that serve the disadvantaged are violent. In 2011/12,<br />
10% of US public school teachers reported being threatened<br />
with injury (Robers et al., 2015). In Latin America, where<br />
crime <strong>and</strong> violence are the number one concern of the<br />
public (Corbacho et al., 2015), crime has been shown to deter<br />
participation in formal schooling (Leeds, 2006). In addition,<br />
without appropriate targeted interventions schools can<br />
become spaces where gender-based violence is perpetuated<br />
(see the discussion on gender in Chapter 17: Target 4.a).<br />
c. Locations of public <strong>and</strong> private schools<br />
Primary school ownership<br />
Kisumu primary schools designated as either publicly or privately owned<br />
Privately owned primary school (59 total)<br />
Publicly owned primary school (123 total)<br />
Racial <strong>and</strong> ethnic segregation<br />
Segregation by ethnicity, social class or race has been<br />
well documented. It is a near-permanent feature of the<br />
socio-economic <strong>and</strong> education l<strong>and</strong>scape in cities in<br />
the United States, much of Europe, <strong>and</strong> countries with<br />
legacies of troubled race relations, such as South Africa<br />
(Icel<strong>and</strong>, 2014; Massey <strong>and</strong> Denton, 1993).<br />
Source: Viteri (2016).<br />
2016 • GLOBAL EDUCATION MONITORING REPORT 123
5<br />
In the United States, the 1954 Supreme Court decision<br />
Brown v. Board of Education of Topeka was meant to<br />
desegregate ‘separate <strong>and</strong> unequal’ schools. A study of<br />
the lives of children born between 1945 <strong>and</strong> 1968, following<br />
them up to 2013, found that the desegregation effort had<br />
a significant long-term impact. For African-Americans,<br />
attending a desegregated school improved educational<br />
<strong>and</strong> occupational attainment, college quality <strong>and</strong> earnings;<br />
lowered the probability of incarceration; <strong>and</strong> improved<br />
adult health status. In these schools, students benefited<br />
from improved access to school resources, reduced class<br />
size <strong>and</strong> increased per-pupil spending (Johnson, 2011).<br />
However, recent data suggest that racial segregation in<br />
education has persisted, with white Americans fleeing<br />
city schools to suburban <strong>and</strong> private ones (Rothstein,<br />
2015). Legislation in the early 2000s released hundreds<br />
of US school districts from court-enforced integration.<br />
As a result, by 2011, in districts released from the<br />
desegregation order, 53% of black students attended<br />
so-called ‘apartheid schools’ where less than 1% of the<br />
student body was white (Hannah-Jones, 2014).<br />
In developed countries, especially in Europe <strong>and</strong><br />
North America, ethnic immigrant enclaves in cities are<br />
prevalent (International Organization for Migration,<br />
2015) <strong>and</strong> can have detrimental effects on educational<br />
outcomes <strong>and</strong> employment (Heath et al., 2008; Musterd,<br />
2005). Analysis of ethnic segregation in Sweden from 1998<br />
<strong>and</strong> 1999 showed that attending schools with very high<br />
concentrations of immigrants (over 40%) was associated<br />
with lower test scores, a result that affected relatively few<br />
schools but 14% of immigrant children (Szulkin <strong>and</strong> Jonsson,<br />
2007). But evidence also suggests that living in some ethnic<br />
enclaves can have positive effects on education. In the<br />
United States, analysis of 2005–2012 community surveys<br />
shows that nearly 35% of all foreign-born residents live in<br />
ethnic enclaves; while South American <strong>and</strong> sub-Saharan<br />
African immigrants living in enclaves performed worse than<br />
their counterparts outside them, the situation was reversed<br />
for Korean <strong>and</strong> South Asian immigrants (Foad, 2014).<br />
THE KNOWLEDGE ECONOMY IS LINKED WITH<br />
INCOME INEQUALITY IN CITIES<br />
Not only education but also knowledge more broadly can<br />
be linked to inequality. Chapter 2: Prosperity notes that, as<br />
economic growth from manufacturing becomes limited or<br />
stagnates, some countries will shift to high skill economies<br />
based on services, including ICT. Knowledge-based<br />
urban development is reputed to balance all dimensions<br />
of development – economic, social, environmental <strong>and</strong><br />
institutional (Yigitcanlar, 2014). Yet, evidence suggests<br />
that cities with a strong focus on knowledge industries<br />
have experienced rising income inequality.<br />
The gap between rich <strong>and</strong> poor has been growing in the<br />
United States, <strong>and</strong> is reflected in geographical divisions<br />
– 27 of the country’s 30 largest metropolitan areas show<br />
an increase in the segregation between upper <strong>and</strong> lower<br />
income households (Florida <strong>and</strong> Mell<strong>and</strong>er, 2015).<br />
Education-based segregation is greater in high tech,<br />
knowledge-based metropolitan areas. Populations where<br />
college graduates dominate are more segregated than<br />
those of <strong>people</strong> without high school degrees (Florida<br />
<strong>and</strong> Mell<strong>and</strong>er, 2015). Recent research from 13 major<br />
European cities similarly indicates that socio-economic<br />
<strong>and</strong> spatial segregation is rising as more educated<br />
populations fuel the growth of knowledge-intensive<br />
industries (Marcinczak et al., 2016).<br />
While knowledge workers appear to value <strong>and</strong> favour<br />
diversity <strong>and</strong> openness, they have been found to favour<br />
only particular types of diversity (Florida, 2002). And<br />
knowledge workers in highly competitive cities were<br />
found to be interested in, <strong>and</strong> more likely to use, private<br />
health <strong>and</strong> education services, thus fostering social<br />
inequality (Yigitcanlar et al., 2007).<br />
EDUCATION CAN INFLUENCE<br />
URBAN PLANNING<br />
While urban development influences education planning,<br />
education also has the potential to influence urban<br />
planning. However, realizing this potential will require<br />
change: more integration in interventions, better training<br />
for urban planners, <strong>and</strong> deeper involvement from<br />
the education sector in providing leadership for city<br />
initiatives <strong>and</strong> urban planning.<br />
SUSTAINED IMPROVEMENT IN INCLUSION<br />
REQUIRES INTEGRATED EFFORTS<br />
Education <strong>and</strong> lifelong learning can contribute to<br />
urban planning, including for better social inclusion,<br />
but they need to be part of integrated efforts.<br />
Education alone cannot lead to enhanced social inclusion<br />
(see Chapter 3: People) but must be integrated with<br />
economic <strong>and</strong> social initiatives related to urban planning<br />
<strong>and</strong> sustainable development.<br />
124<br />
CHAPTER 5 | PLACE: INCLUSIVE AND SUSTAINABLE CITIES
5<br />
Urban planners need training in integrating education<br />
<strong>and</strong> lifelong learning into urban development<br />
“<br />
”<br />
For example, integration of migrants requires a broad<br />
range of policies relating to community-building <strong>and</strong><br />
public participation. Higher income cities sometimes<br />
focus on language acquisition for migrant workers.<br />
Due to a growing influx of foreign migrant workers in<br />
key manufacturing-based municipalities in Japan, a<br />
committee was formed in 2001 to develop policies <strong>and</strong><br />
programmes to facilitate their integration, including<br />
a focus on job security <strong>and</strong> special language classes<br />
(International Organization for Migration, 2015).<br />
Another approach to social inclusion is found in Berlin’s<br />
attempt to create a ‘socially integrative city’ through<br />
activities, education <strong>and</strong> employment opportunities.<br />
Neighbourhood management projects are launched in<br />
communities that require special attention. The approach<br />
has reached 34 neighbourhoods in Berlin, <strong>and</strong> seeks<br />
active participation from key partners in local businesses,<br />
schools, housing companies <strong>and</strong> neighbourhood centres<br />
to curb social disintegration (Berlin Senate Department<br />
for Urban Development <strong>and</strong> the Environment, 2010).<br />
Another example of an integrated intervention is the<br />
Harlem Children’s Zone (Box 5.4).<br />
BETTER URBAN PLANNING REQUIRES A<br />
MULTIDISCIPLINARY APPROACH<br />
For urban planning to achieve sustainable <strong>and</strong> inclusive<br />
cities, better training is needed, particularly in developing<br />
countries, to ensure that planners adopt approaches that<br />
integrate education <strong>and</strong> learning. Key examples from<br />
around the world show that education <strong>and</strong> knowledge<br />
generation incorporated into urban planning can engage<br />
<strong>and</strong> build consensus among diverse stakeholders <strong>and</strong><br />
improve the lives of the disadvantaged, particularly<br />
through participatory approaches (Box 5.5).<br />
A global overview finds education on urban planning has<br />
evolved significantly from its initial focus on architectural<br />
design to better incorporation of social <strong>and</strong> scientific<br />
approaches (UN Habitat, 2009a). Especially in Europe,<br />
urban planning is part of a sound policy environment<br />
BOX 5.4<br />
A cradle-to-career approach can integrate education with<br />
community development<br />
The socio-economic situation of the Harlem district in New York City in the United States<br />
is dire. In 2014, 65% of children were born into poverty <strong>and</strong> 54% to single mothers; 30% of<br />
middle-schoolers <strong>and</strong> high-schoolers had lost a family member to violence.<br />
The Harlem Children’s Zone is a community-based initiative that seeks to break<br />
cycles of intergenerational poverty, primarily through education. Since 1997, it has<br />
provided children with comprehensive educational assistance at each development<br />
stage, culminating in college graduation. Acting on a belief that children’s success<br />
requires community strengthening, the project complements educational assistance<br />
with programmes addressing drug use, violent crime <strong>and</strong> chronic health problems.<br />
Research suggests that its Promise Academy charter schools <strong>and</strong> support services have<br />
reversed the gap in achievement between white Americans <strong>and</strong> African-Americans in<br />
mathematics <strong>and</strong> reduced it in English language arts.<br />
Educational programmes are administered in collaboration with other institutions,<br />
including schools, universities, other non-profit organizations, foundations, businesses<br />
<strong>and</strong> government. Government funders from the city, state <strong>and</strong> federal levels <strong>and</strong><br />
departments of education <strong>and</strong> other social protection services contribute about 8% of<br />
the budget. The initiative has inspired a national programme that currently reaches 48<br />
communities. For holistic change, the long-term impact will need to be evaluated more<br />
robustly, not only through specific education measures such as test scores or college<br />
acceptance rates, but also through broader indicators.<br />
This example raises important questions. How can the determination <strong>and</strong> leadership<br />
needed for the initiative’s success be sustained? How can these capacities be<br />
constrained or supported in other contexts?<br />
Sources: Dobbie <strong>and</strong> Fryer Jr. (2009); Hanson (2013); Harlem Children’s Zone (2015).<br />
that synergizes research, knowledge <strong>and</strong> capacity. For<br />
instance, city planning in Maastricht, the Netherl<strong>and</strong>s,<br />
uses a tool that combines information systems, allowing<br />
systematic analysis of interactions among sociocultural,<br />
economic <strong>and</strong> environmental developments (Rotmans<br />
et al., 2000). However, most urban planning schools <strong>and</strong><br />
local governments need to greatly improve their capacity<br />
to plan <strong>and</strong> implement, engage with professional <strong>and</strong><br />
2016 • GLOBAL EDUCATION MONITORING REPORT 125
5<br />
BOX 5.5<br />
Better urban planning can foster inclusion of slum dwellers<br />
Slum rehabilitation is a main point of action for the SDG urban agenda. Yet, decades of<br />
experience have shown that major urban planning experiences, including ‘master plans’,<br />
have resulted in exclusion, not inclusion. Delhi’s efforts to become a ‘world-class city’ in<br />
advance of the 2010 Commonwealth Games included the demolition <strong>and</strong> rehabilitation of<br />
many slums. Investigation of the ‘clean-up’ drive showed that, of the 56 demolished sites,<br />
16 had been rebuilt or were under construction, but only one of the new sites had a school.<br />
Sustainable development requires the involvement of communities affected by urban<br />
planning. Participatory processes, such as participatory budgeting, decentralized planning <strong>and</strong><br />
systematic community development of the types initiated by the anti-poverty Cities Alliance<br />
partnership can empower communities <strong>and</strong> build social capital, especially for women.<br />
The approach of SDI is another example. The project that led to its establishment<br />
was linked to the World Bank-funded Mumbai Urban Transport Project, which aimed<br />
to upgrade the city’s rail infrastructure. A large-scale enumeration process in 1986<br />
documented residents living close to the proposed railway lines. This led to a communitybased<br />
strategy for planning the upgraded lines <strong>and</strong> relocating residents. The community<br />
mapping made informal, illegal settlements ‘visible’. After the map was validated by<br />
the local government, it paved the way for legal recognition of l<strong>and</strong> tenure <strong>and</strong> postrelocation<br />
compensation. Community involvement has remained a key part of SDI’s<br />
methodology <strong>and</strong> philosophy.<br />
The Association of African Planning Schools (AAPS) was established in 1999 in Dar es Salaam,<br />
in the United Republic of Tanzania, as a peer-to-peer network of planning schools. Since<br />
2008, with funding from donors <strong>and</strong> non-government organizations (NGOs), AAPS has<br />
identified a disconnect between technocratic, conservative, colonial-era planning education<br />
<strong>and</strong> the issues planners face upon graduation. It has therefore assessed <strong>and</strong> developed<br />
more relevant curricula. In 2008, at its first all-school meeting, AAPS identified five key<br />
issues for urban planning in Africa: actor collaboration, climate change, spatial planning<br />
<strong>and</strong> infrastructure, informality, <strong>and</strong> access to l<strong>and</strong>. A 2010 initiative between SDI <strong>and</strong> AAPS<br />
recognized the need for urban planning to address informal settlements. It fostered learning<br />
approaches that give students direct experience of projects in informal settlements <strong>and</strong><br />
enable them to apply this to advocacy, for example to change national planning legislation.<br />
Sources: Dupont (2008); UN Habitat (2009b); Watson (2011); Watson <strong>and</strong> Odendaal (2012);<br />
Patel et al. (2012); Patel <strong>and</strong> Mitlin (2010).<br />
academic networks, <strong>and</strong> educate professionals, elected<br />
officials <strong>and</strong> citizens (UN Habitat, 2009a).<br />
More planning schools are needed, particularly in lower<br />
income countries. Of 550 planning schools documented<br />
worldwide, only 69 are in sub-Saharan Africa. Of these,<br />
39 are in Nigeria (UN Habitat, 2009a). In India, some<br />
3,000 planners are registered with the Institute of Town<br />
Planners, 1 planner for every 100,000 urban residents, far<br />
less than the average of 1 planner for every 5,000 residents<br />
in Canada <strong>and</strong> the United States (Ramanathan, 2013).<br />
Planning for sustainability requires working across<br />
disciplines <strong>and</strong> sectors, but many urban planners lack<br />
the training <strong>and</strong> the collaboration mechanisms to do so<br />
(Corburn, 2004; Martino, 2016). A review of nine visions<br />
for urban sustainability from Australia, Canada, Germany,<br />
Irel<strong>and</strong>, Sweden <strong>and</strong> the United States found they were<br />
not aligned with robust sustainability principles <strong>and</strong> instead<br />
focused narrowly on the built environment (John et al.,<br />
2015). In Peru, analysis from a management education<br />
programme indicated architects in charge of urban planning<br />
often lacked adequate education <strong>and</strong> overemphasized<br />
physical interventions instead of considering the<br />
integrated social, political <strong>and</strong> economic needs of urban<br />
management (Steinberg <strong>and</strong> Mir<strong>and</strong>a Sara, 2000).<br />
A CITY CAN TRANSFORM BY<br />
PLACING EDUCATION AND<br />
LIFELONG LEARNING AT ITS HEART<br />
More <strong>and</strong> more cities have been putting education <strong>and</strong><br />
lifelong learning at the heart of their development. To<br />
promote sustainable economic, social <strong>and</strong> environmental<br />
development, cities from Amman (Jordan) <strong>and</strong> Balange<br />
(the Philippines) to Bahir Dar (Ethiopia) <strong>and</strong> Ybycuí<br />
(Paraguay) are turning themselves into learning cities<br />
(Valdes-Cotera et al., 2015).<br />
The UNESCO Global Network of Learning Cities (GNLC)<br />
connects cities with global actors to promote education<br />
<strong>and</strong> lifelong learning at the local level. The GNLC defines<br />
‘learning cities’ as those that promote inclusive learning,<br />
from basic to higher education; revitalize learning in<br />
families <strong>and</strong> communities; facilitate learning for <strong>and</strong><br />
in the workplace; extend the use of modern learning<br />
technology; enhance quality <strong>and</strong> excellence in learning;<br />
<strong>and</strong> nurture a culture of learning throughout life. All this<br />
creates <strong>and</strong> reinforces individual empowerment <strong>and</strong><br />
social cohesion, economic <strong>and</strong> cultural prosperity, <strong>and</strong><br />
sustainable development (UNESCO Institute for Lifelong<br />
Learning, 2015). Learning cities contribute to SDG 4,<br />
promoting ‘inclusive <strong>and</strong> equitable quality education’,<br />
<strong>and</strong> SDG 11 on improving urban life by making ‘cities<br />
<strong>and</strong> human settlements inclusive, safe, resilient <strong>and</strong><br />
sustainable’ (United Nations, 2015).<br />
This section describes two initiatives, both from<br />
Latin America, where cities integrated education<br />
into urban planning with successful results. The<br />
transformation of Curitiba, Brazil (Box 5.6), <strong>and</strong> Medellín,<br />
Colombia, demonstrated dramatic improvement in<br />
126<br />
CHAPTER 5 | PLACE: INCLUSIVE AND SUSTAINABLE CITIES
5<br />
the environmental, economic <strong>and</strong> social dimensions<br />
of sustainable development. Both had strategies that<br />
valued education’s role in the transformation <strong>and</strong> viewed<br />
education holistically as an integral part of cities that<br />
were both educating <strong>and</strong> learning. They exemplify the<br />
concept of learning cities.<br />
The success of such initiatives is often attributed to<br />
visionary mayoral leadership. But also particularly<br />
important was an enabling environment in which<br />
successive mayors had the political autonomy <strong>and</strong><br />
authority to envision <strong>and</strong> carry out major transformations.<br />
In the 1980s, Medellín was the headquarters of<br />
Pablo Escobar’s drug cartel <strong>and</strong> a hub of trafficking,<br />
narcoterrorism <strong>and</strong> corruption. After Escobar’s death in<br />
1993, the city established a progressive agenda, which<br />
included involving communities in the expansion of public<br />
spaces <strong>and</strong> services such as schools <strong>and</strong> libraries. As a<br />
result it became one of the most innovative <strong>and</strong> equityoriented<br />
cities in the world, leading international rankings<br />
in health <strong>and</strong> public investment (Bomberg, 2014).<br />
Medellín’s transformation from one of the world’s most<br />
violent cities to one of its most innovative was explicitly<br />
based on education-led social change. Mayor Sergio<br />
Fajardo’s 2004 strategy Medellín, la más educada (the<br />
most educated) involved the community in planning<br />
<strong>and</strong> designing investment <strong>and</strong> allocating funds. The<br />
Medellín public utilities company has been a key source<br />
of sustainable financing (Cadena et al., 2011; The Lauder<br />
Institute, 2014), used to build schools, public plazas,<br />
parks <strong>and</strong> a metro (Kimmelman, 2012) <strong>and</strong> has continued<br />
to fund the city’s reforms under successive mayors.<br />
The investment programme targeted crime <strong>and</strong> violence<br />
in the poorest <strong>and</strong> most violent areas via integrated<br />
urban planning, which included transport systems,<br />
innovative buildings as learning spaces <strong>and</strong>, significantly,<br />
the construction of 120 new public schools <strong>and</strong> 9 library<br />
parks (Nolen, 2014). The incidence of crime <strong>and</strong> violence<br />
has fallen dramatically over the past two decades as a<br />
result of city reforms (Cerdá et al., 2012) (Figure 5.4).<br />
To reduce inequality, Fajardo focused on improving public<br />
education, rather than supporting private education,<br />
believing that ‘public education must be the motor<br />
of social transformation’. The government mobilized<br />
businesses, universities <strong>and</strong> private schools to improve<br />
the public education system, <strong>and</strong> allocated up to 40% of<br />
its municipal budget to education (Kurtz-Phelan, 2007).<br />
BOX 5.6<br />
Curitiba used both explicit <strong>and</strong> implicit education initiatives to<br />
become a green city<br />
Curitiba is renowned as a highly planned city, <strong>and</strong> its decades-old planning institute<br />
has always invested in interdisciplinary teams to develop urban solutions. Curitiba’s<br />
urban transformation was started in the mid-1960s by a visionary architect, Jaime<br />
Lerner, who argued for cities as <strong>people</strong>-centric spaces where all systems <strong>and</strong> initiatives<br />
work together cohesively. The city <strong>and</strong> its mayor are lauded for their BRT system,<br />
development of green spaces <strong>and</strong> recycling strategy, which transformed the city<br />
economically, socially <strong>and</strong> environmentally. As a result of decades of improvement,<br />
Curitiba is considered one of the most environment-friendly cities in the world <strong>and</strong> is a<br />
leader in green technology innovation.<br />
The Curitiba education system was one of the key systems that Lerner holistically<br />
transformed <strong>and</strong> used in the process of urban transformation. A central characteristic of<br />
the strategy was synergy, the idea that comprehensive planning could cope with several<br />
problems simultaneously. The city was turned into a learning institution, promoting<br />
educational processes <strong>and</strong> environmental awareness using formal <strong>and</strong> informal frameworks.<br />
Noteworthy interventions included:<br />
• Construction of lighthouse towers that both provided lookout facilities for security<br />
guards <strong>and</strong> incorporated new libraries, thus reinforcing civic identity by providing<br />
beacons of knowledge <strong>and</strong> security.<br />
• Use of schools as a starting point for urban change through a citywide recycling<br />
campaign involving elementary schools. Children learned about garbage separation,<br />
<strong>and</strong> as they became enthusiastic about recycling in schools, they convinced parents to<br />
sort garbage at home. The ‘garbage that is not garbage’ programme gave marginalized<br />
citizens food in return for trash collection, leading to income opportunities in the<br />
recycling sector <strong>and</strong> changing the perception of garbage in the city.<br />
• Use of retired buses as mobile training centres <strong>and</strong> free transport to parks <strong>and</strong> open<br />
spaces. Buses were also sent on certain days to slums to teach adults basic literacy<br />
skills, combining literacy studies with health education.<br />
• Establishment of the Open University, in the ruins of an old mine, to facilitate<br />
formal learning for citizens on sustainability. It also offered in-service training for<br />
professionals who wanted to learn about the environmental aspects of their jobs.<br />
Sources: Arbel (2014), Carvalho et al. (2012); Graham <strong>and</strong> Booth (2010); Macedo (2013).<br />
The city developed a library network to promote<br />
social interaction <strong>and</strong> inclusion <strong>and</strong> bring education to<br />
marginalized communities. Libraries became beautiful,<br />
symbolic community centres to raise the self-esteem<br />
of poor children <strong>and</strong> curb violence (Castro <strong>and</strong> Echeverri,<br />
2011). The Spain Library, strategically located atop a<br />
hill, became a l<strong>and</strong>mark, conveying a message of public<br />
domain <strong>and</strong> presence in a place once belonging to crime<br />
gangs (Kimmelman, 2012).<br />
2016 • GLOBAL EDUCATION MONITORING REPORT 127
5<br />
FIGURE 5.4A:<br />
In Medellín, Colombia, education reform was targeted to improve inclusion …<br />
Location <strong>and</strong> type of libraries in 2009, <strong>and</strong> socio-economic index for Medellín’s 16 communes, 2010<br />
Location <strong>and</strong> types of libraries<br />
Socio-economic index<br />
Public Library Park<br />
Municipal Public Library<br />
Pilot Public Library<br />
Public Library “Caja de Compensacion”<br />
REBIPOA Public Library<br />
6 (high)<br />
5 (medium high)<br />
4 (medium)<br />
3 (medium low)<br />
2 (low)<br />
Source: Viteri (2016).<br />
FIGURE 5.4B:<br />
… <strong>and</strong> linked to crime reduction<br />
Homicide rate per 100,000 inhabitants, 1998–2014, Medellín, Colombia<br />
Homicide rate per 100,000 inhabitants<br />
200<br />
180<br />
160<br />
140<br />
120<br />
100<br />
80<br />
60<br />
40<br />
20<br />
0<br />
1998<br />
1999<br />
2000<br />
2001<br />
2002<br />
2003<br />
2004<br />
2005<br />
2006<br />
Source: Giraldo-Ramírez <strong>and</strong> Preciado-Restrepo (2015).<br />
2007<br />
Since 2012, the public utilities company has been<br />
required to assign 7% of its annual profits to support the<br />
city’s science, technology <strong>and</strong> innovation plan (OECD,<br />
2015). Medellín is the only Latin American city with such<br />
a plan, <strong>and</strong> has a strong foundation to develop health,<br />
energy, <strong>and</strong> ICT clusters (Bomberg, 2014).<br />
URBAN PLANNING BENEFITS FROM<br />
CITY-LEVEL LEADERSHIP<br />
The role of city-level leadership is important both for<br />
urban planning in general <strong>and</strong> for integrated urban<br />
planning that addresses education. As the previous<br />
2008<br />
2009<br />
2010<br />
2011<br />
2012<br />
2013<br />
2014<br />
section shows, a degree of autonomy is an important<br />
condition for strong city-level ownership of urban reform.<br />
City-level leadership can also have a positive impact at<br />
the global <strong>and</strong> regional levels. As cities have grown in<br />
size <strong>and</strong> political importance, their role in local <strong>and</strong> global<br />
governance has grown. Global networks of city governance<br />
can provide urban solutions. Mayors are linked through<br />
long-term global–local (‘glocal’) initiatives such as Local<br />
Governments for Sustainability (ICLEI), United Cities<br />
<strong>and</strong> Local Governments (UCLG), <strong>and</strong> the GNLC.<br />
Efforts to address climate change benefit from citylevel<br />
leadership. The climate leadership group C40<br />
involves many major cities working with international<br />
actors, such as the World Bank, the Organisation for<br />
Economic Co-operation <strong>and</strong> Development (OECD) <strong>and</strong><br />
the Clinton Foundation. It promotes the leadership<br />
of mayors in global governance (Acuto, 2013; Barber,<br />
2013). Transnational municipal networks have also been<br />
instrumental in advancing knowledge <strong>and</strong> methods for<br />
addressing climate change at the local level (Bouteligier,<br />
2012; Fünfgeld, 2015).<br />
To solve pressing urban challenges, however, many<br />
governance challenges in these networks of knowledge<br />
exchange <strong>and</strong> generation need to be addressed to realize<br />
their potential. Even as expectations of city governments<br />
are growing, action at the city level in service delivery<br />
<strong>and</strong> collaboration can be hampered by poor data, lack of<br />
technical capacity, unclear jurisdiction <strong>and</strong> lack of fiscal<br />
128<br />
CHAPTER 5 | PLACE: INCLUSIVE AND SUSTAINABLE CITIES
5<br />
Education is largely absent in discussions of<br />
implementing SDG 11 on cities <strong>and</strong> human settlements<br />
“<br />
”<br />
decentralization. In a survey of 50 cities in 30 primarily<br />
middle income <strong>and</strong> high income countries, many city<br />
representatives said lack of local government capacity<br />
<strong>and</strong> public funding, <strong>and</strong> unpredictability of resources,<br />
were key governance constraints (LSE, 2014).<br />
Meanwhile, education as a sector is largely absent in<br />
discussions of implementing SDG 11 on cities <strong>and</strong> human<br />
settlements. For instance, it is rarely mentioned when<br />
considering how urban areas should respond to climate<br />
change, disaster preparedness or urban sprawl. The role<br />
of schools is mostly missing from debates on urban<br />
priorities such as slum upgrading (Minnery et al., 2013).<br />
A relative lack of local government jurisdiction in<br />
education provision also limits education’s inclusion in<br />
an integrated urban planning agenda. City governments<br />
in many high <strong>and</strong> middle income countries are far less<br />
engaged in the provision of education services than in<br />
other sectors (Figure 5.5).<br />
While local autonomy does not guarantee positive<br />
changes, greater city-level autonomy is a prerequisite<br />
for strong city level ownership of urban reforms that<br />
incorporate education strategies, as was shown in<br />
the case of Curitiba <strong>and</strong> Medellín. Similarly, a recent<br />
investigation of five cities (Dubai in the United Arab<br />
Emirates, Ho Chi Minh City in Viet Nam, London,<br />
New York City <strong>and</strong> Rio de Janeiro in Brazil), which<br />
were assessed because their learning outcomes were<br />
improving or high, argued that effective leadership<br />
at all levels, but particularly inspirational education<br />
leadership at the city level, was key to the effectiveness<br />
of education reform (Elwick <strong>and</strong> McAleavy, 2015).<br />
CONCLUSION<br />
Given the complex <strong>and</strong> holistic nature of urban<br />
challenges, education <strong>and</strong> lifelong learning need to be<br />
embedded <strong>and</strong> integrated in urban planning. They form a<br />
critical instrument for sustainable urban development. In<br />
turn, urbanization <strong>and</strong> other processes related to cities<br />
FIGURE 5.5:<br />
Local government officials view the education sector as<br />
led by the national or state level<br />
Local government responses to a survey question on who leads<br />
various sectors<br />
Spatial planning<br />
Urban transport<br />
Housing<br />
Social services<br />
Policing <strong>and</strong> security<br />
Education<br />
Health<br />
0% 20% 40% 60% 80% 100%<br />
Below city<br />
State<br />
create a need for education system planning. Education<br />
is pivotal to ensure economic growth, innovation, <strong>and</strong><br />
improvement in economic inclusion; formal <strong>and</strong> nonformal<br />
education must also be monitored to ensure that<br />
they help reduce inequality, not exacerbate it.<br />
The broad education sector is largely missing from key<br />
urban development discussions on social inclusion <strong>and</strong><br />
environmental sustainability. These aims will very likely<br />
not be achieved unless education is integrated in their<br />
planning. At the same time, stronger advocacy <strong>and</strong><br />
leadership by education stakeholders <strong>and</strong> urban leaders,<br />
such as mayors, are needed if education is to gain a seat<br />
in discussions on the future of cities. Moreover, there<br />
needs to be far more appreciation of education’s role<br />
in transformative urban development, regarding both<br />
formal schooling <strong>and</strong> beyond.<br />
City<br />
National<br />
Metropolitan<br />
Other<br />
Note: The analysis is based on responses from 50 cities in 30 mostly<br />
high <strong>and</strong> middle income countries.<br />
Source: LSE (2014).<br />
2016 • GLOBAL EDUCATION MONITORING REPORT 129
5<br />
130<br />
CHAPTER 5 | PLACE: INCLUSIVE AND SUSTAINABLE CITIES
Young <strong>people</strong> in<br />
El Savador take part<br />
in an activity with the<br />
Asociación SERES.<br />
CREDIT: Ben Rosenzweig on behalf of<br />
SERES/Play for Peace<br />
130<br />
CHAPTER 6 | PARTNERSHIPS: ENABLING CONDITIONS TO ACHIEVE SDG 4 AND THE OTHER SDGS
CHAPTER<br />
6<br />
Partnerships:<br />
enabling conditions<br />
to achieve SDG 4<br />
<strong>and</strong> the other SDGs<br />
We are determined to mobilize the means required to<br />
implement this Agenda through a revitalized Global<br />
Partnership for Sustainable Development, based on a spirit<br />
of strengthened global solidarity, focused in particular on<br />
the needs of the poorest <strong>and</strong> most vulnerable <strong>and</strong> with the<br />
participation of all countries, all stakeholders <strong>and</strong> all <strong>people</strong>.<br />
O<br />
OVERTY<br />
FFORDABLE AND<br />
LEAN ENERGY<br />
ZERO<br />
HUNGER<br />
DECENT WORK AND<br />
ECONOMIC GROWTH<br />
The interlinkages QUALITY<strong>and</strong> integrated GENDER nature of the CLEAN WATER Sustainable<br />
EDUCATION<br />
EQUALITY<br />
AND SANITATION<br />
Development Goals are of crucial importance in ensuring that<br />
the purpose of the new Agenda is realized. If we realize our<br />
ambitions across the full extent of the Agenda, the lives of all<br />
will be profoundly improved <strong>and</strong> our world will be transformed<br />
REDUCED<br />
SUSTAINABLE CITIES<br />
for the better. INEQUALITIES<br />
AND COMMUNITIES<br />
GOOD HEALTH<br />
AND WELL-BEING<br />
INDUSTRY, INNOVATION<br />
AND INFRASTRUCTURE<br />
RESPONSIBLE<br />
CONSUMPTION<br />
AND PRODUCTION<br />
– The 2030 Agenda for Sustainable Development<br />
CLIMATE<br />
ACTION<br />
LIFE<br />
BELOW WATER<br />
LIFE<br />
ON LAND<br />
PEACE, JUSTICE<br />
AND STRONG<br />
INSTITUTIONS<br />
PARTNERSHIPS<br />
FOR THE GOALS<br />
131
6<br />
KEY MESSAGES<br />
The world must pull together to overcome barriers to<br />
achieving the 2030 Agenda for Sustainable Development<br />
1<br />
More domestic resources are needed to achieve the Sustainable Development Goals (SDGs).<br />
a. Many poorer countries still collect less than 15% of their national income in tax (compared with 26% in<br />
richer countries).<br />
b. Domestic <strong>and</strong> international efforts on tax evasion <strong>and</strong> avoidance are needed for countries to get the<br />
tax revenues they are owed.<br />
c. Resources can be channelled to education spending by reducing fossil fuel subsidies <strong>and</strong> earmarking<br />
funds for education expenditure.<br />
d. Aid can play a catalytic role in increasing domestic resources.<br />
e. Education can improve taxpayer behaviour <strong>and</strong> increase tax compliance.<br />
2<br />
Aid must increase to achieve the Education 2030 targets, but is declining.<br />
a. Even with substantial increases in domestic resources, there will be an annual finance gap of<br />
US$21 billion in low income countries to achieve the Education 2030 targets.<br />
b. The education finance gap could be filled if select donors allocated 0.7% of GNI to aid, <strong>and</strong> 10% of<br />
that to education.<br />
c. But overall aid to education is on the decline: It fell by US$1.2 billion in 2014 relative to its peak in 2010.<br />
3<br />
Aid to education is not effectively targeted to those most in need.<br />
a. Poor <strong>and</strong> conflict-affected countries are not adequately prioritized in aid allocations.<br />
b. Early childhood care <strong>and</strong> education can significantly benefit disadvantaged children but received less<br />
than 3% of the aid that goes to post-secondary education.<br />
4<br />
Governments <strong>and</strong> international agencies must work together to achieve the sustainable<br />
development agenda.<br />
a. The broad SDG agenda requires multisector approaches.<br />
b. Successful national efforts to improve multisector planning, while rare, usually have strong political<br />
commitment, institutional <strong>and</strong> financial support, <strong>and</strong> strong capacity.<br />
c. Aid agencies often lack a coherent vision of development <strong>and</strong> do not always prioritize poverty reduction.<br />
5<br />
The ambition of the SDGs requires partnerships if it is to be achieved.<br />
a. Civil society <strong>and</strong> the private sector have to play important roles in financing, implementing <strong>and</strong><br />
ensuring mutual accountability of the new agenda.<br />
b. International coordination <strong>and</strong> financing bodies are critical to support countries, review progress,<br />
encourage coordination of partner activities, <strong>and</strong> leverage funds.<br />
132<br />
CHAPTER 6 | PARTNERSHIPS: ENABLING CONDITIONS TO ACHIEVE SDG 4 AND THE OTHER SDGS
6<br />
Finance...........................................................................................................................................133<br />
Policy coherence.......................................................................................................................139<br />
Partnerships............................................................................................................................... 145<br />
Conclusion....................................................................................................................................147<br />
The 2030 Agenda for Sustainable Development views<br />
the social, economic <strong>and</strong> environmental challenges of<br />
our time as indivisible, meaning that responses must<br />
be integrated. Sustainable Development Goal (SDG)<br />
17, which articulates the ‘means of implementation’<br />
for achieving the goals, calls for a revitalized global<br />
partnership. The targets under SDG 17 highlight the need<br />
for cooperation – to ensure adequate financing, develop<br />
<strong>and</strong> diffuse technological innovation, <strong>and</strong> build capacity<br />
to implement national plans; systemic improvements –<br />
to enhance policy coherence, build multistakeholder<br />
partnerships, <strong>and</strong> improve data, monitoring <strong>and</strong><br />
accountability; <strong>and</strong> favourable macroeconomic<br />
conditions – including inclusive trade, debt sustainability<br />
<strong>and</strong> healthy investment (United Nations, 2015c).<br />
Fulfilling the SDGs requires integrated plans <strong>and</strong> actions<br />
where diverse sectors, levels of government <strong>and</strong> types<br />
of actors have to work together. Adequate financing as<br />
well as other enabling conditions – particularly, human<br />
capacity, effective institutions <strong>and</strong> political will – are<br />
critical if the new agenda is to succeed (Figure 6.1). This<br />
chapter examines what changes to current financing,<br />
policy <strong>and</strong> partnership arrangements are needed within<br />
education <strong>and</strong> in its interactions with other sectors for<br />
progress to be realized.<br />
FINANCE<br />
No plan or strategy can be implemented without adequate<br />
financial resources. Major financing shortfalls were a key<br />
reason for the lack of sufficient progress towards the<br />
Education for All (EFA) goals between 2000 <strong>and</strong> 2015<br />
(UNESCO, 2015a). The focus of this section is primarily on<br />
financing to achieve SDG 4 in lower income countries.<br />
There have been several approaches to underst<strong>and</strong>ing<br />
what it will cost to achieve the SDGs <strong>and</strong> who should<br />
provide financing. A recent estimate suggests that an<br />
additional 1.5% to 2.5% of global gross domestic product<br />
(GDP) will need to be invested each year from the<br />
public <strong>and</strong> private sectors to achieve the SDGs by 2030.<br />
Low <strong>and</strong> lower middle income countries will need to<br />
increase expenditure by about 4% of their projected GDP<br />
(Schmidt-Traub, 2015). The Addis Ababa Action Agenda<br />
that came out of the 2015 Third International Conference<br />
on Financing for Development acknowledges that all<br />
The 2030 Agenda for Sustainable Development<br />
views the social, economic <strong>and</strong> environmental<br />
challenges of our time as indivisible<br />
“<br />
”<br />
2016 • GLOBAL EDUCATION MONITORING REPORT 133
6<br />
“<br />
There is an annual finance gap of at least US$39 billion<br />
per year for providing quality education from pre-primary<br />
through to upper secondary education<br />
”<br />
FIGURE 6.1:<br />
What type of integration <strong>and</strong> support are needed to achieve the sustainable development agenda?<br />
A conceptual framework for integrated planning<br />
Education Social protection Others Health<br />
Horizontal<br />
The education sector’s plans<br />
<strong>and</strong> actions reflect <strong>and</strong><br />
respond to these relationships<br />
<strong>and</strong> conditions<br />
SECTORS<br />
International<br />
ACTORS<br />
DIMENSIONS OF<br />
INTEGRATION<br />
LEVELS<br />
National<br />
Regional<br />
Provincial<br />
Vertical<br />
State<br />
Private<br />
Civil society<br />
Multilateral<br />
Local<br />
Community<br />
Source: Based on Persaud (2016).<br />
FINANCING, HUMAN CAPACITIES, EFFECTIVE INSTITUTIONS, POLITICAL WILL<br />
sources of finance (public <strong>and</strong> private, domestic <strong>and</strong><br />
international) <strong>and</strong> a long-term investment perspective<br />
will be needed (United Nations, 2015a). This is in contrast<br />
to the emphasis given to official development assistance<br />
(ODA) during the Millennium Development Goal (MDG)<br />
era (Fehling et al., 2013).<br />
In the education sector, the 2015 EFA Global Monitoring<br />
Report estimated the cost of ensuring that every child<br />
<strong>and</strong> adolescent in low <strong>and</strong> lower middle income countries<br />
accessed good quality education from the pre-primary to<br />
upper secondary level. The total annual cost is projected<br />
to increase from US$149 billion, based on 2012 estimates,<br />
to US$340 billion over the next 15 years. Even after<br />
improvements in domestic revenue mobilization are<br />
taken into account this leaves an annual US$39 billion<br />
financing gap (UNESCO, 2015b).<br />
To identify measures to address this funding gap, the<br />
high level International Commission on the Financing of<br />
Global Education Opportunities was announced at the<br />
Oslo Summit in July 2015 (Oslo Summit on Education for<br />
Development, 2015). Co-convened by the prime minister<br />
of Norway; the presidents of Chile, Indonesia <strong>and</strong> Malawi;<br />
<strong>and</strong> the Director-General of UNESCO, it is chaired by the<br />
UN Special Envoy for Global Education, with political<br />
leaders, policy-makers <strong>and</strong> researchers making up the<br />
members.<br />
Its purpose is to make a strong case for investment in<br />
education <strong>and</strong> provide recommendations for deploying<br />
resources in more effective, accountable <strong>and</strong> coordinated<br />
ways, especially in determining budget allocations. It<br />
will look at a wide range of financing sources, including<br />
increased domestic resource mobilization through more<br />
134<br />
CHAPTER 6 | PARTNERSHIPS: ENABLING CONDITIONS TO ACHIEVE SDG 4 AND THE OTHER SDGS
6<br />
strategic aid, non-traditional partnerships, innovative<br />
finance <strong>and</strong> the private sector.<br />
The commission is expected to submit its report to the<br />
UN Secretary-General in September 2016. In view of its<br />
highly anticipated recommendations, which will also<br />
draw on an expert panel on education financing, this<br />
section focuses on a more select set of domestic <strong>and</strong><br />
international financing issues.<br />
DOMESTIC RESOURCES<br />
Mobilizing more domestic resources will be critical for<br />
fulfilling the SDGs. Domestic resources funded 71% of<br />
public expenditure on MDG-related sectors in 66 low <strong>and</strong><br />
lower middle income countries in 2014 (Development<br />
Finance International <strong>and</strong> Oxfam, 2015). For education,<br />
the share was 86% (Action Aid, 2016).<br />
The Education 2030 Framework for Action set two<br />
benchmarks on domestic financing for education: 4%<br />
to 6% of GDP <strong>and</strong> 15% to 20% of public expenditure. As<br />
the 2015 EFA Global Monitoring Report showed, poorer<br />
countries have made considerable efforts to prioritize<br />
education in their budgets but are more likely to miss<br />
spending targets because their overall budgets are small<br />
due to lack of domestic revenue (UNESCO, 2015a). The<br />
key question, then, is how to mobilize revenue.<br />
Raising more domestic resources<br />
In about half of all developing countries, tax ratios are<br />
below 15% of GDP, compared with 18% in emerging<br />
economies <strong>and</strong> 26% in<br />
advanced economies<br />
(Lagarde, 2016). Raising<br />
In about half of all<br />
the ratio in poorer<br />
developing countries, countries requires global<br />
tax ratios are below<br />
<strong>and</strong> domestic efforts.<br />
15% of GDP<br />
Addressing tax evasion<br />
<strong>and</strong> avoidance is a global<br />
responsibility. Many<br />
challenges in tax collection faced by poorer countries<br />
are global in nature. The pervasiveness of secret<br />
offshore companies that hide wealth <strong>and</strong> the use of<br />
taxes as a competitive advantage in global competition<br />
for investment are among the significant factors<br />
limiting countries’ ability to raise domestic resources<br />
through taxation (Sachs <strong>and</strong> Schmidt-Traub, 2014). Tax<br />
incentives to attract multinational companies have often<br />
disadvantaged developing countries. Corporate income<br />
tax exemptions have led to estimated losses of US$139<br />
billion a year in developing countries (Action Aid, 2013).<br />
Similarly, tax treaties often put poorer countries at a<br />
disadvantage; it is estimated that non-Organisation<br />
for Economic Co-operation <strong>and</strong> Development (OECD)<br />
countries lost US$1.6 billion in 2010 as a result of US<br />
treaty provisions (IMF, 2014).<br />
Recent estimates suggest that developing countries<br />
lose about US$100 billion annually in revenue from<br />
multinational tax avoidance through offshore<br />
investments (UNCTAD, 2015). Illicit financial flows,<br />
defined as illegal movements of money or capital<br />
between countries, are symptoms of governance failures,<br />
weak institutions <strong>and</strong> corruption (OECD, 2015f). Lower<br />
income countries lost over US$1 trillion in such flows in<br />
2013 – over 10 times the amount of ODA received that<br />
year (Kar <strong>and</strong> Spanjers, 2015). Coordinated domestic<br />
<strong>and</strong> international action on tax incentives, treaties <strong>and</strong><br />
harmful corporate decisions is needed for countries to<br />
get tax revenue they are owed (Action Aid, 2016).<br />
Education can influence taxpayer behaviour <strong>and</strong> increase<br />
compliance. While important taxation-related challenges<br />
are global, the fact that in many poorer countries taxes<br />
account for less than 15% of the national income also<br />
reflects on an inability to broaden the tax base <strong>and</strong><br />
collect income, property <strong>and</strong> other progressive taxes<br />
(IMF, 2013a).<br />
Taxpayer behaviour is influenced by factors outside<br />
the tax system, such as how tax revenue is spent<br />
<strong>and</strong> the extent to which taxation mobilizes citizens’<br />
political engagement (Fjeldstad <strong>and</strong> Heggstad, 2012;<br />
OECD, 2015a). Those who avoid paying taxes are often<br />
highly educated elites within countries <strong>and</strong> within<br />
multinational corporations. But it is also true that<br />
educational attainment <strong>and</strong> tax knowledge are positively<br />
associated with tax-related attitudes. Data from the<br />
2005 World Values Survey on 55 countries indicate that<br />
more educated individuals had more positive attitudes<br />
towards paying taxes (OECD, 2013b). Data from the same<br />
survey in India over 1990–2006 showed that university<br />
education was associated with decreasing tolerance for<br />
tax evasion <strong>and</strong> bribery (Shafiq, 2015).<br />
Education also has an effect on tax-related behaviour.<br />
Income <strong>and</strong> sales taxes in 100 countries increased<br />
with educational attainment, which allowed the use of<br />
newer types of taxes that rely on widespread literacy<br />
(Kenny <strong>and</strong> Winer, 2006). An analysis of 123 countries<br />
2016 • GLOBAL EDUCATION MONITORING REPORT 135
6<br />
over 1996–2010 associated very low literacy levels with<br />
reduced tax revenue (Mutascu <strong>and</strong> Danuletiu, 2013).<br />
Nevertheless, the effect has been found to be stronger in<br />
some regions, such as Latin America, than in others, such<br />
as Asia (Profeta <strong>and</strong> Scabrosetti, 2010).<br />
Some countries have used taxpayer education<br />
programmes to improve compliance <strong>and</strong> instil a culture of<br />
paying taxes, thus increasing revenue <strong>and</strong> strengthening<br />
the compact between citizens <strong>and</strong> government, while<br />
others have incorporated tax education in their school<br />
curriculum. In Latin America, nine countries have included<br />
tax education in their curricula <strong>and</strong> developed materials<br />
jointly between education ministries <strong>and</strong> tax authorities.<br />
The government of Jamaica extended the Schools Tax<br />
Education Programme down to primary schools. Studies<br />
indicate that influencing tax culture requires education<br />
from an early age (OECD, 2015a).<br />
Channelling more resources towards education spending<br />
Collecting more revenue is an important starting point<br />
for ensuring that education receives adequate funding.<br />
But there is also scope in many countries to reallocate<br />
expenditure for the benefit of education.<br />
Countries at similar levels of economic development have<br />
had very different trajectories in terms of prioritizing<br />
education. Among low income countries, Ethiopia almost<br />
doubled the share of its budget allocated to education,<br />
from 15% in 2000 to 27% in 2013, while Guinea, from the<br />
same starting point, slightly reduced its commitment to<br />
education. Among lower middle income countries in 2014,<br />
Kyrgyzstan <strong>and</strong> the Lao People’s Democratic Republic<br />
reached the recommended minimum benchmark of 15%,<br />
while Pakistan only allocated 11.3% (Figure 6.2).<br />
Two ways to prioritize spending for education are to remove<br />
fossil fuel subsidies <strong>and</strong> to earmark education funds.<br />
Redirecting fossil fuel subsidies can boost education spending.<br />
A major source of potential revenue for education is<br />
the reform of fossil fuel subsidy regimes, which keep<br />
prices for certain energy goods lower than market prices<br />
(IMF, 2013b). Fossil fuel subsidies are well documented<br />
to be inefficient <strong>and</strong> inequitable because mostly richer<br />
families benefit while funds that could be used for propoor<br />
expenditure are limited (An<strong>and</strong> et al., 2013; Arze del<br />
Granado et al., 2012; Clements et al., 2013).<br />
The most recent International Monetary Fund (IMF)<br />
analysis suggests that global energy subsidies could<br />
reach $US5.3 trillion in 2015, or 6.5% of global GDP<br />
(Coady et al., 2015). This estimate incorporates the high<br />
environmental <strong>and</strong> health costs of fuel consumption to<br />
calculate other subsidies implicit in existing fuel prices.<br />
Redirecting explicit <strong>and</strong> implicit fuel subsidies would be<br />
a useful way to fund the SDGs (Merrill <strong>and</strong> Chung, 2014),<br />
including education (Steer <strong>and</strong> Smith, 2015). In Indonesia,<br />
public expenditure on education increased by over 60%<br />
between 2005 <strong>and</strong> 2009, largely due to fuel subsidy<br />
reform (Tobias et al., 2014).<br />
Governments have earmarked funds to increase education<br />
expenditure. Some governments have earmarked taxes<br />
for education expenditure. Knowledge that a tax will be<br />
used for social purposes can reduce resistance to paying<br />
it. Taxpayers may also like the accountability they believe<br />
earmarking provides regarding how their tax money is<br />
spent (Prichard, 2010). Earmarked taxes have been used<br />
to support primary <strong>and</strong> secondary education in Brazil<br />
<strong>and</strong> India, <strong>and</strong> tertiary education in Ghana <strong>and</strong> Nigeria<br />
(Action Aid, 2016).<br />
Some fear that earmarking may dissuade other sources<br />
of funding <strong>and</strong> leave total revenue unchanged, lead to<br />
misallocation of resources within a sector <strong>and</strong> between<br />
FIGURE 6.2:<br />
Increased allocation to education spending can happen at<br />
every level of economic development<br />
Education as a share of total government expenditure, selected<br />
countries, 2000 <strong>and</strong> 2014 or most recent year<br />
Education as a share of total<br />
government expenditure (%)<br />
30<br />
25<br />
20<br />
15<br />
10<br />
5<br />
0<br />
Guinea<br />
Burundi<br />
Low income<br />
countries<br />
Source: UIS database.<br />
Ethiopia<br />
Kyrgyzstan<br />
Pakistan<br />
Lao PDR<br />
Poorer lower middle<br />
income countries<br />
Rep. Moldova<br />
Indonesia<br />
2014<br />
2000<br />
Guyana<br />
Richer lower middle<br />
income countries<br />
136<br />
CHAPTER 6 | PARTNERSHIPS: ENABLING CONDITIONS TO ACHIEVE SDG 4 AND THE OTHER SDGS
6<br />
Even with substantial increases in domestic resources,<br />
there is still an annual finance gap of US$21 billion that<br />
external aid must fill<br />
“<br />
”<br />
sectors, <strong>and</strong> reduce flexibility in managing fiscal<br />
policy (Welham et al., 2015). However, such concerns<br />
are minor compared to the size of the need for<br />
financing to ensure education <strong>and</strong> lifelong learning<br />
opportunities for all.<br />
EXTERNAL RESOURCES<br />
Even if low income countries intensify domestic resource<br />
mobilization, the annual financing gap is estimated at<br />
US$21 billion, the equivalent of 42% of the projected total<br />
annual cost of achieving universal pre-primary, primary<br />
<strong>and</strong> secondary education by 2030 (UNESCO, 2015b). Aid<br />
will therefore continue to be a necessity for many low<br />
income countries. Among low income countries with<br />
data, three-quarters received direct aid to education<br />
that exceeded 10% of their total public expenditure on<br />
education (UNESCO, 2015a).<br />
Total aid averages 0.31% of gross national income among<br />
member countries of the OECD Development Assistance<br />
Committee (DAC), having been more or less constant<br />
for 10 years. This is well below the 2005 pledge by 15 EU<br />
countries to allocate 0.7% to aid; in 2014, only Denmark,<br />
Luxembourg, Sweden <strong>and</strong> the United Kingdom did so. If<br />
DAC members <strong>and</strong> selected non-DAC donors reached the<br />
0.7% pledge <strong>and</strong> committed to spend 10% of that on basic<br />
<strong>and</strong> secondary education, that alone would raise enough<br />
funds to close the entire US$39 billion financing gap of<br />
low <strong>and</strong> lower middle income countries (OECD-DAC, 2016).<br />
Instead, the volume of aid to education fell by about<br />
US$600 million from 2013 to 2014 <strong>and</strong> by US$1.2 billion<br />
relative to its peak in 2010 (see Chapter 20). In the<br />
context of a negative outlook for aid to education,<br />
this section discusses three options: the potential<br />
for earmarking more funds for education through<br />
multilateral mechanisms; the prospect of using more aid<br />
to build national authorities’ capacity to raise domestic<br />
resources; <strong>and</strong> the gains that could be made by targeting<br />
aid to the countries <strong>and</strong> education levels most in need.<br />
Multilateral mechanisms can help mobilize additional funds<br />
Donors can provide aid through bilateral mechanisms,<br />
directly engaging with governments or non-government<br />
organizations (NGOs), or through multilateral<br />
mechanisms, channelling funds through international<br />
institutions. Multilateral channels appear less politicized,<br />
more responsive to recipient countries, more likely to<br />
target countries based on poverty, less fragmented,<br />
more flexible <strong>and</strong> better for delivery of global public<br />
goods in areas such as health <strong>and</strong> climate change. On<br />
the other h<strong>and</strong>, there is no clear consensus as to whether<br />
multilateral channels are more efficient than bilateral<br />
channels (Gulrajani, 2016).<br />
It has become more common for donors to earmark<br />
the funds they provide to multilateral agencies<br />
through trust funds specific to sectors or issues.<br />
A survey of DAC members attributed this trend to<br />
donors’ desire for visibility <strong>and</strong> influence (Reinsberg<br />
et al., 2015). However, more multilateral earmarking can<br />
create challenges if earmarking increases fragmentation<br />
within multilateral organizations (Gulrajani, 2016; Killen<br />
<strong>and</strong> Rogerson, 2010).<br />
Still, earmarking has been used extensively to increase<br />
funding to the health sector. Between 2006 <strong>and</strong> 2014,<br />
aid disbursed to health by multilateral organizations<br />
increased by US$2.6 billion due to issue-specific funds<br />
such as the GAVI, the Vaccine Alliance. In education the<br />
corresponding increase was only US$952 million. It is<br />
vital for the education sector to improve its use of such<br />
mechanisms to raise additional funds (OECD-DAC, 2016).<br />
Aid can play a catalytic role in increasing<br />
domestic resources<br />
Given limited political will to exp<strong>and</strong> aid resources,<br />
how can existing aid be better used to support domestic<br />
resource mobilization? In 2013, only US$96 million,<br />
less than 0.07% of total development assistance, was<br />
allocated to projects supporting domestic revenue<br />
mobilization in low income countries. Afghanistan,<br />
2016 • GLOBAL EDUCATION MONITORING REPORT 137
6<br />
Mozambique <strong>and</strong> the United Republic of Tanzania<br />
collectively received one-third of the total.<br />
In Mozambique, a revenue authority was created in<br />
2006. A pool of donors provides direct support in a<br />
partnership arrangement with the authority. As a result,<br />
tax collection doubled between 2008 <strong>and</strong> 2013, <strong>and</strong> the<br />
contribution of more progressive direct taxes tripled<br />
(Strawson <strong>and</strong> Ifan, 2016).<br />
The role of aid in catalysing domestic resources was<br />
endorsed as a key aspect of international cooperation<br />
under the Addis Tax Initiative at the Third International<br />
Conference on Financing for Development in July 2015.<br />
Donors committed to double technical cooperation for<br />
domestic resource mobilization by 2020 (Strawson <strong>and</strong><br />
Ifan, 2016). In recent years, more funds are being channelled<br />
to international initiatives such as the IMF Tax Policy <strong>and</strong><br />
Administration Topical Trust Fund (Strawson <strong>and</strong> Ifan, 2016).<br />
In the case of health, the United States has announced<br />
that US$63.5 million previously allocated to the<br />
President’s Emergency Plan for AIDS Relief (PEPFAR)<br />
would be retargeted to domestic resource mobilization<br />
initiatives in Kenya, Nigeria, the United Republic of<br />
Tanzania, Viet Nam <strong>and</strong> Zambia, with the express<br />
FIGURE 6.3:<br />
Aid to basic education is not related to need<br />
Total aid to basic education per primary school-age child (2014) <strong>and</strong><br />
primary completion rate (2008–2014)<br />
Total aid to basic education per primary school-age child<br />
(constant 2014 US$)<br />
80<br />
70<br />
60<br />
50<br />
40<br />
30<br />
20<br />
10<br />
0<br />
0<br />
Niger<br />
Senegal<br />
Afghanistan<br />
Haiti<br />
Liberia<br />
Timor-Leste<br />
Namibia<br />
Mongolia<br />
Chad<br />
Ug<strong>and</strong>a<br />
Mauritania<br />
25 50 75 100<br />
Primary completion rate (%)<br />
Sources: GEM Report team analysis based on OECD Creditor Reporting System<br />
data (OECD-DAC, 2016); World Inequality Database on Education.<br />
intention of raising US$1 billion for public health-related<br />
activities (Runde et al., 2014).<br />
Aid to education is not effectively targeted where<br />
it is most needed<br />
One of the main aims of development assistance is to<br />
benefit those in need. Mapping the m<strong>and</strong>ates of 50 aid<br />
agencies indicates that 6 include a legal act requiring<br />
them to make poverty reduction a goal of development<br />
cooperation, 21 view poverty reduction as a primary goal,<br />
10 view it as a joint goal <strong>and</strong> 13 have no specific goal for<br />
poverty reduction. Among agencies with a legal m<strong>and</strong>ate<br />
to end poverty, over 80% of their development assistance<br />
is allocated to countries with a higher than average<br />
poverty rate. Agencies with no explicit poverty reduction<br />
goal allocate only 31% of their development assistance to<br />
such countries (Strawson et al., 2015).<br />
Economic <strong>and</strong> political interests are key aspects of<br />
donors’ funding decisions (Alesina <strong>and</strong> Dollar, 2000;<br />
Claessens et al., 2009). An analysis of 170 recipient<br />
countries found that aid allocation to basic education<br />
since 2003 reflected donor trade-related interests more<br />
than receiving country needs as measured by enrolment<br />
or completion rates (Sumida, 2016).<br />
The percentage of children completing primary school is<br />
a potential measure of country need. The average child<br />
in Mongolia received US$45 in aid to basic education in<br />
2014 even though the primary completion rate was 97%<br />
in 2010 (UNESCO, 2016a). By contrast, Chad, where the<br />
primary completion rate was 28% in 2010, received US$3<br />
per primary school age child in 2014 (Figure 6.3). In Liberia<br />
<strong>and</strong> Mauritania, about half the children complete primary<br />
school, but Liberia receives 10 times the amount of aid to<br />
basic education per school-age child.<br />
While per capita allocations of aid to basic education<br />
to Afghanistan <strong>and</strong> Liberia have generally increased in<br />
recent years, they have remained essentially flat in Chad<br />
<strong>and</strong> have been decreasing in Mauritania (Figure 6.4).<br />
Donors need to address such disparities if they are to<br />
help to achieve ambitious targets <strong>and</strong> ensure equity.<br />
Aid to education should also be spent where it has the<br />
highest potential to improve equity. Public spending for<br />
higher education benefits the wealthy most (Lustig, 2015)<br />
while early investment in education has strong benefits<br />
for disadvantaged children (UNESCO, 2015a). Yet, early<br />
childhood care <strong>and</strong> education received only US$106 million<br />
in 2014, less than 3% of disbursements for post-secondary<br />
138<br />
CHAPTER 6 | PARTNERSHIPS: ENABLING CONDITIONS TO ACHIEVE SDG 4 AND THE OTHER SDGS
6<br />
FIGURE 6.4:<br />
Inequities in aid to basic education persist<br />
Total aid to basic education per primary school-age child, selected<br />
countries, 2002–2014<br />
100<br />
FIGURE 6.5:<br />
Donors prioritize levels of education that are less accessible<br />
to the poor<br />
Direct aid to (a) early childhood care <strong>and</strong> education <strong>and</strong> (b) postsecondary<br />
education, 2002–2014<br />
90<br />
5,000<br />
Constant 2014 US$<br />
80<br />
70<br />
60<br />
50<br />
40<br />
30<br />
20<br />
10<br />
0<br />
2002<br />
2003<br />
2004<br />
2005<br />
2006<br />
2007<br />
2008<br />
2009<br />
2010<br />
2011<br />
2012<br />
2013<br />
2014<br />
Afghanistan<br />
Liberia<br />
Mauritania<br />
Chad<br />
Constant 2014 US$<br />
4,000<br />
3,000<br />
2,000<br />
1,000<br />
0<br />
2002<br />
2004<br />
2006<br />
2008<br />
2010<br />
2012<br />
2014<br />
Post-secondary<br />
education<br />
Early childhood<br />
education<br />
Source: OECD-DAC (2016).<br />
Source: OECD-DAC (2016).<br />
education (Figure 6.5). Most aid to post-secondary<br />
education, moreover, largely supports students coming to<br />
study in the donor countries. Thus, a substantial portion of it<br />
does not even reach developing countries (UNESCO, 2015a).<br />
POLICY COHERENCE<br />
In the SDG era, sector-specific approaches are insufficient<br />
to meet the cross-cutting, interdependent challenges<br />
of sustainable development (Le Blanc, 2015). Instead,<br />
the context is more favourable to concepts such as<br />
‘collective impact’ (Kania <strong>and</strong> Kramer, 2011), which suggests<br />
intentional, structural coordination of efforts to meet<br />
broader outcomes; ‘systems thinking’ (Chapman, 2004), or<br />
viewing the integrated whole as greater than the sum of<br />
its parts; <strong>and</strong> ‘whole-of-government’ approaches (United<br />
Nations, 2014), which require ministries to work together.<br />
From a policy perspective, multisector approaches can<br />
prevent competition for scarce resources <strong>and</strong> help use<br />
existing resources more efficiently. Integrated service<br />
provision can be a means of reaching the most vulnerable,<br />
addressing their multiple needs simultaneously <strong>and</strong><br />
reducing the cost of service duplication (OECD, 2015d).<br />
Since diverse perspectives are needed for improved<br />
integration <strong>and</strong> problem solving (Hong <strong>and</strong> Page, 2004),<br />
education planning may also benefit from a range of<br />
expertise beyond education ministries (Jacobs, 1964). For<br />
instance, an education ministry that aims to mitigate<br />
gender disparity in school enrolment <strong>and</strong> attainment<br />
would need to be aware of the non-education structural<br />
barriers to girls’ <strong>and</strong> boys’ schooling, which require a greater<br />
underst<strong>and</strong>ing of social development <strong>and</strong> the labour sector.<br />
SDG-related development efforts require such horizontally<br />
integrated action (Le Blanc, 2015). There is also a strong need<br />
for vertical integration, i.e. coordination <strong>and</strong> collaboration<br />
between levels of government, with clarity in their roles<br />
<strong>and</strong> responsibilities (OECD, 2013a). Figure 6.1 illustrates<br />
these horizontal <strong>and</strong> vertical relationships.<br />
The broad SDG agenda with its multisector dem<strong>and</strong>s<br />
requires good local planning linked with coherent, nationally<br />
relevant vision <strong>and</strong> support (Antonio et al., 2014; Urama<br />
et al., 2014). This section looks at examples of national<br />
efforts to improve coherence, effective multisector<br />
planning, <strong>and</strong> challenges in integrated planning.<br />
POLICY COHERENCE IN GOVERNMENTS<br />
Integrated planning has gained prominence in post-2015<br />
development discussions. However, multisector planning<br />
initiatives, especially those that focus on integrated basic<br />
service delivery for the poor, are not new. Integrated<br />
approaches to development have been carried out since<br />
2016 • GLOBAL EDUCATION MONITORING REPORT 139
6<br />
the 1970s <strong>and</strong> 1980s, such as strategies that couple loans<br />
for rural economic development with those to address<br />
basic needs in health, sanitation <strong>and</strong> education, to jointly<br />
address rural poverty (Belgian Survival Fund <strong>and</strong> IFAD,<br />
2009; Bovill, 2009).<br />
A meta-analysis of literature on interventions that<br />
combined health with other sectors (education, economic<br />
development, nutrition, environment) found that 13<br />
BOX 6.1<br />
School feeding <strong>and</strong> school health as integrated<br />
delivery mechanisms<br />
School feeding programmes are among the most widespread social<br />
protection programmes. Providing food in schools can improve<br />
some of the education, health <strong>and</strong> nutrition outcomes of schoolage<br />
children while supporting the agricultural sector <strong>and</strong> benefiting<br />
the community. As a result, these programmes are often jointly<br />
coordinated by ministries of health, agriculture <strong>and</strong> education. It is<br />
estimated that every dollar spent on school feeding brings three<br />
dollars in economic returns.<br />
International cross-institutional collaboration includes the<br />
Nourishing Bodies, Nourishing Minds initiative, established in 2013<br />
by the World Food Programme, UNICEF <strong>and</strong> UNESCO to work with<br />
governments <strong>and</strong> the private sector in Haiti, Mozambique, Niger<br />
<strong>and</strong> Pakistan, taking advantage of the synergy inherent in nutrition<br />
<strong>and</strong> education. Additionally, funding from the Bill <strong>and</strong> Melinda<br />
Gates Foundation for local agriculture has focused on connections<br />
between smallholder farm production <strong>and</strong> school feeding.<br />
School provision of health services such as deworming <strong>and</strong> sexual<br />
<strong>and</strong> reproductive health education is also efficient. FRESH (Focusing<br />
Resources on Effective School Health), an initiative of UNESCO,<br />
UNICEF, the World Health Organization <strong>and</strong> the World Bank, argues<br />
that multiple strategies, including health-related school policies,<br />
safe water <strong>and</strong> sanitation, skills-based health education <strong>and</strong> schoolbased<br />
health <strong>and</strong> nutrition services, should be used in schools.<br />
School feeding <strong>and</strong> health interventions appear to be cost-effective<br />
compared to other means of delivery, though evidence is limited.<br />
In low income countries, there are typically more teachers<br />
than nurses <strong>and</strong> more schools than clinics. Employing teachers<br />
to deliver simple interventions, such as pills or micronutrient<br />
supplements, may cost one-tenth as much as delivery through<br />
traditional mobile health teams, although additional teacher<br />
training costs need to be considered.<br />
Sources: Guyatt (2003); Krishnaratne et al. (2013); UNESCO (2002);<br />
UNESCO (2015a); UNESCO et al. (2013); World Food Programme<br />
(2009); World Food Programme (2013).<br />
of the 25 interventions assessed produced mostly<br />
positive findings, 9 produced mostly mixed findings <strong>and</strong><br />
3 had a neutral or unknown effect. School feeding <strong>and</strong><br />
deworming programmes, obesity interventions in schools<br />
<strong>and</strong> integrated early childhood development initiatives<br />
were some of the multisector education-relevant<br />
interventions found to yield mostly positive outcomes<br />
(FHI 360, 2015).<br />
A research study of an integrated programme to<br />
improve self-employment among the very poor<br />
entailed 6 r<strong>and</strong>omized control trials in Ethiopia,<br />
Ghana, Honduras, India, Pakistan <strong>and</strong> Peru, <strong>and</strong><br />
assessed progress on 10 welfare outcomes or indices<br />
(consumption, food security, productive <strong>and</strong> household<br />
assets, financial inclusion, time use, income <strong>and</strong> revenue,<br />
physical health, mental health, political involvement <strong>and</strong><br />
women’s empowerment). The integrated interventions<br />
included skills training on running a business <strong>and</strong><br />
choosing livelihoods, <strong>and</strong> health, nutrition <strong>and</strong> hygiene<br />
training. The evaluation found a significant impact on<br />
all 10 outcomes, with gains sustained in 8 of the 10, a<br />
year after programme completion. The evaluation also<br />
conducted a cost–benefit analysis, <strong>and</strong> estimated that<br />
benefits were higher than costs in all countries except<br />
Honduras (Banerjee et al., 2015).<br />
Multisector interventions can also provide arguments<br />
for investment in interventions that do not appear<br />
cost-effective if evaluated from the perspective of only<br />
one sector. In Senegal, it was estimated that addressing<br />
literacy, health <strong>and</strong> nutrition challenges simultaneously<br />
would be more likely to break the intergenerational cycle<br />
of poverty (Nordtveit, 2008). While a cost-effectiveness<br />
analysis of a cash transfer programme in Zomba,<br />
Malawi, found that the cost per prevented HIV infection<br />
was prohibitive at US$5,000 to US$12,500 (Baird et al.,<br />
2012), a co-financing, cross-sector approach could help<br />
secure funding because of the multiple benefits of such<br />
programmes (Remme et al., 2012). School feeding <strong>and</strong><br />
school health interventions are important examples<br />
indicating that addressing child health <strong>and</strong> nutrition<br />
through the school system is cost-effective (Box 6.1).<br />
There are good examples of integrated planning …<br />
While there is a robust rationale for integrated planning<br />
<strong>and</strong> some credible evidence in its favour, successful<br />
implementation requires political commitment, an<br />
appropriate institutional environment, financial <strong>and</strong><br />
technical know-how, <strong>and</strong> an appreciation of power<br />
dynamics (Persaud, 2016). This section discusses three<br />
140<br />
CHAPTER 6 | PARTNERSHIPS: ENABLING CONDITIONS TO ACHIEVE SDG 4 AND THE OTHER SDGS
6<br />
instructive examples of national efforts to improve<br />
multisector planning. They reflect the importance of<br />
political will, institutional support, adequate capacity <strong>and</strong><br />
available data to support the integration process.<br />
Nigeria: large-scale, local implementation to meet the MDGs.<br />
Nigeria used US$18 billion from debt relief in the 2005<br />
Heavily Indebted Poor Countries initiative to launch its<br />
Office of the Senior<br />
Special Assistant<br />
to the President<br />
Nigeria established<br />
on the Millennium<br />
a grants scheme<br />
Development Goals.<br />
integrating responses Between 2007 <strong>and</strong><br />
2009, it provided<br />
for health, education,<br />
conditional grants<br />
<strong>and</strong> water <strong>and</strong> sanitation at the state level<br />
targeting health,<br />
water <strong>and</strong> sanitation,<br />
electricity, <strong>and</strong> poverty alleviation (Phillips, 2009;<br />
Zamba <strong>and</strong> Oboh, 2013). In 2010, the office established<br />
the Conditional Grants Scheme to Local Government<br />
Areas (CGS-LGA) Track to more effectively reach local<br />
governments, strengthen primary health <strong>and</strong> education<br />
systems, <strong>and</strong> help them provide priority services through<br />
a strong emphasis on local, data-driven planning (Iyengar<br />
et al., 2015).<br />
The CGS-LGA Track had significant political support,<br />
including a high powered steering committee <strong>and</strong> a<br />
special MDG adviser from an associated presidential<br />
office. Since the funds were provided under a debt relief<br />
initiative, the Ministry of Finance was able to tag funds<br />
for pro-poor investment (Persaud, 2016).<br />
The design <strong>and</strong> implementation of the CGS-LGA Track<br />
demonstrated strong horizontal <strong>and</strong> vertical integration,<br />
prioritizing health, education, <strong>and</strong> water <strong>and</strong> sanitation.<br />
Local project priorities were discussed in joint meetings<br />
of the planning unit <strong>and</strong> the other sectors. A joint<br />
federal, state <strong>and</strong> local financing arrangement motivated<br />
commitment at all levels (Persaud, 2016). Local officials had<br />
to develop proposals that identified priority local needs<br />
using the Nigeria MDG system of indicators <strong>and</strong> inputs,<br />
which was developed for this project (Iyengar et al., 2014;<br />
Iyengar et al., 2015). This use of data-driven decisionmaking<br />
eventually led to the first common database on<br />
health <strong>and</strong> education facilities, which eventually became<br />
available to all government programmes, development<br />
partners <strong>and</strong> civil society groups.<br />
The focus was on filling financial gaps where sectorspecific<br />
funding was inadequate <strong>and</strong> avoiding duplication<br />
of line ministries’ projects. In some cases, such as drilling<br />
boreholes at schools or in communities, water <strong>and</strong><br />
education officials had to agree on detailed joint plans<br />
(Persaud, 2016).<br />
According to a report, by 2014, the project had disbursed<br />
more than US$300 million towards strengthening<br />
MDG-focused health <strong>and</strong> education interventions in<br />
one-third of the country, <strong>and</strong> efforts were being made<br />
to scale up nationwide. Over 90% of the funds were<br />
used for infrastructure projects in the three sectors. An<br />
independent assessment of progress from the first round<br />
of grants found that over 80% of the more than 5,000<br />
projects could be sustained through community efforts<br />
(Earth Institute, 2015).<br />
Colombia: a pioneer of SDG implementation. Colombia’s<br />
government has been instrumental in developing the<br />
post-2015 agenda <strong>and</strong> proposing an integrated approach<br />
to development (Development Finance International,<br />
2016; OECD, 2015f). It is also active in global efforts to<br />
underst<strong>and</strong> how to incorporate the SDG agenda into<br />
national development plans.<br />
In February 2015, even before the SDGs were agreed, the<br />
government established an inter-agency commission<br />
on preparation <strong>and</strong> implementation of the post-<br />
2015 development agenda <strong>and</strong> SDGs (Lucci et al.,<br />
2015). It is composed of ministers <strong>and</strong> vice-ministers,<br />
signalling strong political commitment to cross-sector<br />
implementation (Persaud, 2016).<br />
There is clear vertical integration of the national<br />
development plan. Once consensus was reached at the<br />
national level, the government encouraged governors <strong>and</strong><br />
mayors to include the SDGs in their development plans,<br />
which define the main local development priorities for<br />
2014–2018 (Development Finance International, 2016).<br />
The three core pillars are education, peace <strong>and</strong> equity,<br />
<strong>and</strong> are considered to be presidential priorities. The<br />
new agenda also aims at a lifelong learning perspective<br />
that defines targets for all education levels <strong>and</strong> ages.<br />
The national development plan aims to make Colombia<br />
the most educated country in Latin America by 2025<br />
(Development Finance International, 2016).<br />
Colombia was one of the first countries in Latin America<br />
to decentralize its education system to tackle inequitable<br />
2016 • GLOBAL EDUCATION MONITORING REPORT 141
6<br />
spending across regions. The Ministry of Education<br />
formulates policy <strong>and</strong> objectives, <strong>and</strong> monitors the<br />
system, while municipalities manage <strong>and</strong> plan the<br />
use of physical, human <strong>and</strong> financial resources <strong>and</strong><br />
are responsible for education outcomes. The ministry<br />
introduced a project in 2004 to provide technical<br />
assistance to local governments based on their needs,<br />
recognizing that effective service provision depends on<br />
local financial <strong>and</strong> human capacity (Development Finance<br />
International, 2016).<br />
While the national education plan is developed at<br />
the national level, there are also regional development<br />
plans <strong>and</strong> municipal education plans. Multilevel planning is<br />
accompanied by a decentralized budget system,<br />
with a mechanism to redistribute national funds to the<br />
main social sectors: education receives 58.5%. There is<br />
also an equity-based formula to distribute funding across<br />
territorial entities (Development Finance International, 2016).<br />
Malaysia: integrating the technical <strong>and</strong> vocational education<br />
strategy. Technical <strong>and</strong> vocational education can be<br />
key for workforce development. The sectors typically<br />
involved are education,<br />
labour, youth <strong>and</strong><br />
economic development.<br />
Malaysia works across<br />
In Malaysia, there is<br />
education, labour,<br />
political support to<br />
youth <strong>and</strong> economic improve workforce<br />
development in the<br />
development in order<br />
interest of national<br />
to help with workforce<br />
economic development.<br />
development<br />
The Tenth Malaysia<br />
Plan 2011–2015<br />
<strong>and</strong> accompanying<br />
Education Blueprint 2013–2025 project are being<br />
used to overhaul educational <strong>and</strong> training systems. A<br />
primary objective is to raise the workforce’s skills <strong>and</strong><br />
employability so Malaysia can compete with more<br />
advanced economies in the region <strong>and</strong> become a high<br />
income nation by 2020 (Malaysia Economic Planning<br />
Unit, 2009; S<strong>and</strong>er et al., 2013).<br />
A key emphasis has been on ensuring that technical <strong>and</strong><br />
vocational education, delivered by multiple ministries, is<br />
better harmonized <strong>and</strong> in line with industry requirements.<br />
The establishment of a national qualifications framework<br />
helped significantly broaden, unify <strong>and</strong> streamline<br />
the qualifications system. Between 2000 <strong>and</strong> 2010,<br />
the number of occupations covered by the national<br />
occupational skills st<strong>and</strong>ards increased from 500 to 1,585<br />
(World Bank, 2013).<br />
The development of competency st<strong>and</strong>ards is<br />
participatory <strong>and</strong> includes representation from women’s<br />
organizations <strong>and</strong> private industry. A common set<br />
of st<strong>and</strong>ards <strong>and</strong> testing has effectively unified the<br />
substance of training, despite the fact that it is spread<br />
across ministries. Since 2000, several governmentsponsored<br />
incentive programmes have aimed to foster<br />
links between education institutions <strong>and</strong> industry<br />
to improve employability <strong>and</strong> enhance workforce<br />
qualifications with on-the-job training (World Bank, 2013).<br />
… but planning <strong>and</strong> financing processes remain fragmented<br />
Despite such positive examples, governments typically<br />
define m<strong>and</strong>ates, priorities, budgets, administrative<br />
<strong>and</strong> planning processes, <strong>and</strong> monitoring <strong>and</strong> evaluation<br />
in ways that are at odds with integration (Persaud,<br />
2016). Government agencies tend to focus on policy<br />
formulation <strong>and</strong> implementation in their respective<br />
sectors, hampering coordination <strong>and</strong> collaboration, within<br />
the context of a myriad of bureaucratic <strong>and</strong> political<br />
structures that influence decision-making.<br />
An analysis of 76 low <strong>and</strong> middle income countries for<br />
the GEM Report indicates that well-developed national<br />
plans that are linked to good education financing plans<br />
<strong>and</strong> decentralized planning <strong>and</strong> financing systems,<br />
<strong>and</strong> that lead to good cross-sector integration, are the<br />
exception rather than the rule in most poorer countries<br />
(Development Finance International, 2016).<br />
National plans need to coordinate sectors horizontally.<br />
Yet, out of 27 countries with survey-based information<br />
on coordination mechanisms for early childhood<br />
development, for instance, while 17 had a nationallevel,<br />
explicitly stated multisector strategy, only 8 had<br />
established processes to coordinate budget-setting<br />
across ministries (World Bank, 2016).<br />
Similarly, the lack of a unified, coordinated approach<br />
has been identified as a major challenge in technical <strong>and</strong><br />
vocational education policy (Marope et al., 2015). In Ghana,<br />
institutional training, employment opportunities <strong>and</strong><br />
industry needs are reportedly mismatched. Parliament<br />
established a council for technical <strong>and</strong> vocational education<br />
in 2006 to reform the sector, with representation from nine<br />
ministries <strong>and</strong> state partners. However, the council was<br />
placed under Ministry of Education control, which led to<br />
rivalries <strong>and</strong> hindered collaboration (Ansah <strong>and</strong> Ernest, 2013).<br />
National plans need to be well coordinated vertically with<br />
local implementation strategies. Where local planning is<br />
done well, sector silos can be broken down. Success in<br />
142<br />
CHAPTER 6 | PARTNERSHIPS: ENABLING CONDITIONS TO ACHIEVE SDG 4 AND THE OTHER SDGS
6<br />
vertical integration is often contingent on subnational<br />
governments having the capacity to plan, budget,<br />
coordinate, implement <strong>and</strong> oversee processes between<br />
sectors – <strong>and</strong> the authority to do so. At the same time,<br />
good central planning that provides the flexibility for local<br />
adaptation is also important (OECD, 2013a).<br />
Ethiopia has a sophisticated set of horizontal <strong>and</strong> vertical<br />
planning strategies. A robust federal <strong>and</strong> regional process<br />
is in place for planning, coordination <strong>and</strong> integrated<br />
budgeting in education. Regional education ministries are<br />
responsible for some oversight <strong>and</strong> spending but most<br />
decisions are taken at the<br />
local (woreda) level. Local plans<br />
take a multisector approach,<br />
In Ethiopia, local<br />
e.g. health clinics <strong>and</strong> centres<br />
education plans being planned alongside<br />
take a multisector<br />
schools. However, there have<br />
been some challenges. Local<br />
approach<br />
education offices reportedly<br />
feel more accountable to<br />
local councils, which provided<br />
their budget, than to regional education bureaus. This<br />
hampered regional-level monitoring (Development<br />
Finance International, 2016).<br />
education accountability with lines of responsibility<br />
from state to classroom (South Africa National Planning<br />
Commission, 2012).<br />
POLICY COHERENCE IN AID AGENCIES<br />
Agencies that provide overseas development assistance,<br />
like all government agencies, face two challenges in<br />
delivering programmes that are consistent with the<br />
integrated planning needs of the SDGs: they may lack a<br />
coherent vision of their approach to development, <strong>and</strong><br />
they face difficulties in coordinating programmes that<br />
span different sectors.<br />
Achieving policy coherence for development<br />
The concept of policy coherence for development aid<br />
emerged in the 1990s with growing concern over aid<br />
effectiveness. At that time, donors committed to increase<br />
coherence between aid <strong>and</strong> other policies affecting lower<br />
income countries (OECD, 2015c). For instance, Policy<br />
Coherence for Development was a tool intended to ensure<br />
that EU policies supported lower income countries’ needs<br />
<strong>and</strong> the MDGs, <strong>and</strong> at the very least did not contradict<br />
aims of poverty eradication. All EU countries are legally<br />
obliged to follow this approach (Latek, 2015; Trocaire, 2013).<br />
In South Africa, the 1996 Constitution pertained to the<br />
national <strong>and</strong> provincial levels of government. Financing<br />
decentralization was the key measure used to address<br />
historical spatial inequality. Education had high political<br />
priority. In provincial budgets, education received the<br />
largest portion of the funding reserved to enhance<br />
equity. There were also grant programmes available for<br />
education infrastructure <strong>and</strong> other projects.<br />
However, the system hindered cross-sector planning.<br />
More than 20 agencies <strong>and</strong> structures provided<br />
education, contributing to very slow delivery <strong>and</strong> even<br />
litigation against the government. When provinces<br />
could not deliver school infrastructure, some of the<br />
management was reinstated at the national level. A<br />
review of a national integrated plan for early childhood<br />
development between 2005 <strong>and</strong> 2010 showed that it<br />
was extremely difficult to coordinate <strong>and</strong> integrate the<br />
services offered by the several departments involved<br />
(Development Finance International, 2016).<br />
Nevertheless, some improvement has been seen. With<br />
the adoption in 2012 of the National Development Plan<br />
2030, which sets forth outcomes <strong>and</strong> roles for various<br />
sectors, <strong>and</strong> a dedicated monitoring <strong>and</strong> evaluation<br />
department, South Africa has created a chain of<br />
Many donors recognize the importance of addressing<br />
development challenges more holistically. For instance,<br />
EU allocation of at least 20% of the development budget<br />
to social protection, health, education <strong>and</strong> jobs suggests<br />
recognition of the need for integrated planning across<br />
SDG sectors, including education (Mercer, 2014). The most<br />
effective education-aided activities are those that target<br />
issues beyond schools, such as community participation<br />
<strong>and</strong> costs for families, <strong>and</strong> engage with actors beyond<br />
education ministries (Samoff et al., 2016).<br />
Germany has long advocated policy coherence in<br />
development. Its Coalition Treaty committed to improve<br />
coordination to make policy more development oriented.<br />
This support of policy coherence for development has<br />
translated into a holistic approach to the SDG agenda<br />
(OECD, 2015e). Its education aid strategy emphasizes that<br />
it addresses every level of education from early childhood<br />
to tertiary education; the transition phases between<br />
levels; <strong>and</strong> formal, non-formal <strong>and</strong> informal education<br />
with a view to encourage lifelong learning (Mercer, 2014).<br />
The United States, which issued a Global Directive on<br />
Development Policy in 2010, has historically lacked a<br />
coherent set of policies. Efforts to promote a whole-ofgovernment<br />
approach have also largely failed in recent<br />
2016 • GLOBAL EDUCATION MONITORING REPORT 143
6<br />
years, since the administration promoted development<br />
to the level of diplomacy <strong>and</strong> defence but did not give<br />
the US Agency for International Development the tools<br />
necessary to act at this level (Gavas et al., 2015).<br />
Implementing multisector aid programmes<br />
Even if an agency has a coherent vision of development,<br />
implementing multisector programmes is a major task.<br />
UNICEF’s social protection strategy takes a<br />
multipronged, systematic <strong>and</strong> coordinated approach<br />
to reduce social <strong>and</strong> economic vulnerability faced by<br />
children <strong>and</strong> their families. It tries to address multiple<br />
factors <strong>and</strong> maximize effectiveness <strong>and</strong> impact across<br />
sectors (UNICEF, 2012). In Ghana, UNICEF has supported a<br />
cross-sector integrated approach through the Livelihood<br />
Empowerment Against Poverty programme. While overall<br />
coordination is the responsibility of the Department<br />
of Social Welfare, participation by other line ministries,<br />
such as Education, Health <strong>and</strong> Labour, is facilitated by an<br />
interministerial committee (UNICEF, 2012). Similarly, with<br />
regard to education outcomes, UNICEF highlights the<br />
value <strong>and</strong> impact of other sectors’ actions on education,<br />
including water <strong>and</strong> sanitation, public works, health, child<br />
protection, social development, welfare <strong>and</strong> protection,<br />
<strong>and</strong> employment (UNICEF, 2012).<br />
Other examples of multisector aid programmes, such as<br />
the Millennium Development Goals Achievement Fund<br />
<strong>and</strong> its successor, the Sustainable Development Goals<br />
Fund, suggest growing acceptance of the integrated<br />
planning discourse within the United Nations (Box 6.2).<br />
The World Bank has adopted sector-wide approaches<br />
across multiple sectors to facilitate an integrated<br />
approach to development (Independent Evaluation<br />
Group, 2010). In 2005, its Ceará Multi-Sector Social<br />
Inclusion Development Project in Brazil integrated<br />
education, health, water <strong>and</strong> sanitation, water source<br />
management, <strong>and</strong> environment. It promoted multisector<br />
policy coordination <strong>and</strong> applied a result-based<br />
management approach: failure to meet performance<br />
indicators affected the release of resources from the<br />
Treasury. For instance, when a target on hospital<br />
admissions was missed, a multisector study was required<br />
to determine the reason; it led to a strong demonstration<br />
of the need for intersector coordination, since failure to<br />
meet the target resulted from issues beyond the health<br />
sector (Batley et al., 2007; Persaud, 2016).<br />
Experience from other World Bank programmes, however,<br />
indicates that despite the logic of multisector projects,<br />
BOX 6.2<br />
The MDG Achievement Fund <strong>and</strong> the SDG Fund<br />
The Millennium Development Goals Achievement Fund was the<br />
first significant UN initiative to support inter-agency work <strong>and</strong><br />
integrated, multidimensional joint programmes on the MDGs. The fund<br />
also aimed to promote system-wide coherence across UN agencies.<br />
Established in 2006 through an over US$840 million deal between<br />
Spain <strong>and</strong> the UN system, it has financed 130 joint programmes<br />
in 50 countries on 8 thematic areas, such as youth employment <strong>and</strong><br />
migration. Country-specific evaluations have found that the multisector<br />
approach helped avoid or reduce overlap between development<br />
programmes, <strong>and</strong> increased coordination <strong>and</strong> collaboration within<br />
<strong>and</strong> between governments <strong>and</strong> development partners.<br />
Its successor, the Sustainable Development Goals Fund (SDG<br />
Fund), was created in 2014 <strong>and</strong> has programmes in 21 countries on<br />
3 thematic areas – inclusive growth for poverty eradication, food<br />
security <strong>and</strong> nutrition, <strong>and</strong> water <strong>and</strong> sanitation – <strong>and</strong> 3 crosscutting<br />
issues: sustainability, gender equality <strong>and</strong> public–private<br />
partnerships. At least three UN agencies, on average, are engaged in<br />
each joint programme. The thematic areas were those identified as<br />
key areas requiring integrated action to improve outcomes. The SDG<br />
Fund has established an advisory group to engage more proactively<br />
with the private sector.<br />
Sources: Capra International Inc. (2014); ILO (2013); UNDP (2013);<br />
Sustainable Development Goals Fund (2016).<br />
it is often difficult to execute them. In an evaluation<br />
of World Bank health, nutrition <strong>and</strong> population sector<br />
activities, three-quarters of the country assistance<br />
strategies acknowledged the importance of other<br />
sectors for health, nutrition <strong>and</strong> population outcomes.<br />
Education was the second most cited sector, after water<br />
<strong>and</strong> sanitation, in regard to its impact on health, nutrition<br />
<strong>and</strong> population. Two multisector lending strategies<br />
were implemented to improve health outcomes: one on<br />
projects in complementary sectors to health <strong>and</strong> the<br />
other on multisector projects linking actions in many<br />
sectors through a single loan (Independent Evaluation<br />
Group, 2009).<br />
An evaluation of the two strategies concluded that<br />
multisector projects, which mostly took place in low<br />
income countries <strong>and</strong> focused on HIV <strong>and</strong> AIDS, were<br />
dem<strong>and</strong>ing to implement due to the number of agencies<br />
involved. Countries often had limited capacity to deal<br />
with this complexity. As a result, while about two-thirds<br />
of single-sector projects were deemed to have<br />
performed satisfactorily, less than half the multisector<br />
144<br />
CHAPTER 6 | PARTNERSHIPS: ENABLING CONDITIONS TO ACHIEVE SDG 4 AND THE OTHER SDGS
6<br />
projects had satisfactory outcomes (Independent<br />
Evaluation Group, 2009).<br />
<strong>and</strong> raising awareness <strong>and</strong> empowering communities to<br />
reform corrupt practices.<br />
PARTNERSHIPS<br />
Local <strong>and</strong> national government authorities, civil society,<br />
academics, the scientific community, the private sector<br />
<strong>and</strong> global multistakeholder partnerships are some of<br />
the important partners that have helped implement<br />
global agendas such as the MDGs (United Nations,<br />
2015b). A recent analysis highlights 10 factors in making<br />
development partnerships effective. They include<br />
securing high level leadership, ensuring context-specific<br />
<strong>and</strong> country-led partnerships, clarifying roles <strong>and</strong><br />
responsibilities, <strong>and</strong> focusing on financing, results <strong>and</strong><br />
accountability<br />
(OECD, 2015b).<br />
The ambition of the SDGs<br />
The ambition of<br />
the SDGs points to<br />
calls for partnerships<br />
potential roles for<br />
between civil society, civil society, the<br />
the private sector<br />
private sector <strong>and</strong><br />
multistakeholder<br />
<strong>and</strong> multistakeholder<br />
partnerships<br />
partnerships, such as GPE in financing,<br />
implementing <strong>and</strong><br />
ensuring mutual<br />
accountability of<br />
a new agenda that is expected to be driven by national<br />
governments (Hazlewood, 2015; UNIDO <strong>and</strong> UN Global<br />
Compact, 2014; World Economic Forum, 2014). This<br />
section examines some of the global discussions<br />
of the roles of civil society, the private sector <strong>and</strong><br />
multistakeholder partnerships in the SDG agenda.<br />
National civil society activity has been supported by<br />
global efforts, such as the Global Campaign for Education<br />
<strong>and</strong> the Civil Society Education Fund, which have<br />
helped build networks <strong>and</strong> national capacity to improve<br />
advocacy <strong>and</strong> monitor progress (UNESCO, 2015a). Some<br />
large international NGOs are significant funders of<br />
education in lower income countries, <strong>and</strong> their financing<br />
<strong>and</strong> programming support better prioritizes basic<br />
education <strong>and</strong> humanitarian aid to education than do<br />
donor countries (Naylor <strong>and</strong> Ndarhutse, 2015).<br />
But there are challenges in designing civil society<br />
partnerships more productively in relation to the SDG<br />
agenda. How can organizations heavily dependent on<br />
donor funding maintain an independent voice (UNESCO,<br />
2015a)? Another challenge is the enormous variety of<br />
disparate actors with differing priorities <strong>and</strong> influence<br />
under the civil society umbrella (Moksnes <strong>and</strong> Melin, 2012).<br />
Whose voices are being captured at the global <strong>and</strong> national<br />
levels? These questions need careful consideration.<br />
THE ROLE OF THE PRIVATE SECTOR IS VIEWED<br />
WITH AMBIVALENCE<br />
While the MDGs made only limited reference to<br />
the private sector, the 2030 Agenda more explicitly<br />
recognizes its importance, particularly regarding<br />
involvement in mobilizing the funds required to meet the<br />
SDGs. The dynamism <strong>and</strong> funding the private sector can<br />
bring to the SDGs is reason for optimism (UNIDO <strong>and</strong> UN<br />
Global Compact, 2014). But there are also strong concerns<br />
about the role of corporate practices in fostering<br />
unsustainable behaviour (Pingeot, 2014).<br />
CIVIL SOCIETY IS A KEY PARTNER WITH<br />
DIVERSE INTERESTS<br />
In 1996, the UN Economic <strong>and</strong> Social Council established<br />
consultative status for NGOs <strong>and</strong> civil society<br />
organizations (CSOs). The 2030 Agenda for Sustainable<br />
Development has provided a new platform for them to<br />
participate in the global follow-up <strong>and</strong> review process for<br />
the SDGs (United Nations, 2015b).<br />
In the education sector, increased civil society activity<br />
was a key achievement of the EFA agenda <strong>and</strong> Dakar<br />
Framework after 2000 (UNESCO, 2015a). CSOs became<br />
more active in tracking budgets to increase transparency,<br />
advocating for more funding for marginalized groups,<br />
Within the education sector, views are divided on<br />
public–private arrangements to finance <strong>and</strong> manage<br />
education delivery, which are becoming more common<br />
in much of the world (Ginsburg, 2012). In richer countries,<br />
governments have entered into elaborate funding <strong>and</strong><br />
monitoring arrangements with private actors. But in<br />
poorer countries, the private sector is loosely regulated.<br />
While some hail the growth of private involvement as<br />
bringing financing, flexibility, innovation <strong>and</strong> improved<br />
learning outcomes (Patrinos et al., 2009), sceptics, who<br />
view the private sector’s growing role as a result of the<br />
public sector retreating from its responsibility to provide<br />
education, see a potential for undue market influences<br />
in schooling <strong>and</strong> widening inequality (Robertson <strong>and</strong><br />
Verger, 2012).<br />
2016 • GLOBAL EDUCATION MONITORING REPORT 145
6<br />
Perhaps as a result of this debate, the Education<br />
2030 Framework for Action, while calling for private<br />
involvement in mobilizing additional resources <strong>and</strong><br />
aiding school-to-work transition, also stresses respecting<br />
education as a human right <strong>and</strong> ensuring that private<br />
efforts do not increase inequality (UNESCO, 2016b).<br />
GLOBAL MULTISTAKEHOLDER PARTNERSHIPS<br />
IN EDUCATION<br />
If global aspirations for SDG 4 are to be fulfilled, the<br />
role of coordination <strong>and</strong> financing bodies is critical. The<br />
formation of a steering committee, led by UNESCO, is<br />
expected to bring coherence in Education 2030 activities.<br />
The Global Partnership for Education (GPE) is the main<br />
multistakeholder financing partnership in education,<br />
<strong>and</strong> better leveraging it will be key to meeting financing<br />
requirements. A new fund for education in crises is being<br />
added to the global architecture to improve links between<br />
development <strong>and</strong> humanitarian aid.<br />
Education 2030 coordination structures<br />
The Education 2030 Framework for Action specifies<br />
that the global coordination mechanism includes the<br />
SDG-Education 2030 Steering Committee, Global<br />
Education Meetings, regional meetings <strong>and</strong> the Collective<br />
Consultation of NGOs on Education for All. Preparation<br />
for the mechanism is informed by the results of the<br />
internal evaluation of UNESCO’s role in global EFA<br />
coordination, which recognized that its task was made<br />
more difficult by the varying level of engagement of<br />
the other four convening partners. The evaluation also<br />
called for UNESCO to strengthen coordination through<br />
a strategic approach that is results-oriented <strong>and</strong> closely<br />
monitored (UNESCO, 2016c).<br />
The SDG-Education 2030 Steering Committee, which<br />
met for the first time in May 2016, is expected to be<br />
the main mechanism to support countries, review<br />
progress (drawing on the GEM Report) <strong>and</strong> encourage<br />
harmonization <strong>and</strong> coordination of partner activities.<br />
The committee is made up of representatives of member<br />
states from six regions, the E9 forum (nine countries<br />
committed to achieving EFA), the three key convening<br />
agencies (UNESCO, UNICEF <strong>and</strong> the World Bank),<br />
<strong>and</strong> representation from another agency (rotating<br />
between United Nations Development Programme,<br />
United Nations High Commissioner for Refugees, United<br />
Nations Fund for Population Activities, UN Women <strong>and</strong><br />
the International Labour Office), the GPE <strong>and</strong> the OECD,<br />
as well as from NGOs, teacher organizations <strong>and</strong> regional<br />
organizations (UNESCO, 2016b).<br />
The steering committee is to act as the voice of the<br />
international education community in SDG agenda<br />
implementation. An important consideration, therefore,<br />
is what it will say in global SDG ‘follow-up <strong>and</strong> review’<br />
structures, especially the High-Level Political Forum<br />
for Sustainable Development <strong>and</strong> its thematic reviews<br />
(see Chapter 9).<br />
Global Partnership for Education<br />
Global financing partnerships target particular sectors, as<br />
in the case of GAVI <strong>and</strong> the Global Fund for Tuberculosis,<br />
AIDS <strong>and</strong> Malaria, or have cross-sector m<strong>and</strong>ates, such<br />
as those of the Urban Poor Fund International <strong>and</strong> the<br />
Global Alliance for Improved Nutrition. They can serve<br />
a variety of purposes, from improving collaboration<br />
among stakeholders in a given sector to catalysing<br />
new investment, raising national <strong>and</strong> local funds,<br />
<strong>and</strong> fostering public–private collaboration. Pooled<br />
mechanisms such as these can reduce fragmentation<br />
as well as transaction costs for donors <strong>and</strong> receiving<br />
countries. Since the SDG agenda is more integrated <strong>and</strong><br />
universal than that of the MDGs, more significant crosssector<br />
collaboration <strong>and</strong> learning are needed to achieve<br />
system-wide impact (Hazlewood, 2015).<br />
The GPE, established in 2002 as the EFA Fast<br />
Track Initiative, is the education sector’s principal<br />
multistakeholder partnership. Its broad mission, according<br />
to its 2016–2020 Strategic Plan, is ‘to mobilize global<br />
<strong>and</strong> national efforts to contribute to the achievement of<br />
equitable, quality education <strong>and</strong> learning for all, through<br />
inclusive partnership, a focus on effective <strong>and</strong> efficient<br />
education systems <strong>and</strong> increased financing’ (GPE, 2016).<br />
Since its first external evaluation in 2010, the GPE has<br />
made many strategic <strong>and</strong> operational changes, such as<br />
better targeting fragile contexts, helping build national<br />
capacity for education planning <strong>and</strong> revamping its<br />
board of directors. Its second evaluation stressed that<br />
the GPE needed to improve its approach for evaluating<br />
success, as it had not introduced a theory of change or<br />
a result framework, features that have been added in its<br />
new strategic plan. The evaluation also noted the GPE’s<br />
limited ability to raise additional education financing,<br />
despite an increasingly ambitious mission. About US$2.1<br />
billion in aid was pledged to the GPE Fund in the 2015–<br />
2018 replenishment round, the equivalent of US$525<br />
million disbursed per year (Results for Development<br />
<strong>and</strong> Universalia, 2015).<br />
By contrast, the health sector’s multistakeholder<br />
partnerships are believed to have leveraged substantial<br />
146<br />
CHAPTER 6 | PARTNERSHIPS: ENABLING CONDITIONS TO ACHIEVE SDG 4 AND THE OTHER SDGS
6<br />
funds; mobilized civil society <strong>and</strong> business partners;<br />
improved the allocation, predictability <strong>and</strong> transparency<br />
of funds; <strong>and</strong> facilitated knowledge transfers (Sachs<br />
<strong>and</strong> Schmidt-Traub, 2014). While health <strong>and</strong> education<br />
are fundamentally different sectors in terms of their<br />
objectives <strong>and</strong> functioning (Chabbott, 2014; de Moura<br />
Castro <strong>and</strong> Musgrove, 2007), learning from health<br />
partnerships could be especially important for education.<br />
In addition, to improve education response capacities,<br />
the fund’s Acceleration Facility will invest in existing<br />
initiatives such as the Education Cluster, the UN Refugee<br />
Agency <strong>and</strong> the Inter-Agency Network for Education<br />
in Emergencies.<br />
CONCLUSION<br />
Education Cannot Wait fund for education in crises<br />
Education Cannot Wait, a new fund for education in<br />
crises, was launched at the World Humanitarian S ummit<br />
in May 2016. It aims, by 2020, to raise up to US$3.85<br />
billion <strong>and</strong> reach 18% of children <strong>and</strong> youth whose<br />
education is affected by conflict, natural disasters <strong>and</strong><br />
disease outbreaks. It will work to address the challenges<br />
of the field <strong>and</strong> raise the profile of education in crises (see<br />
Chapter 20) (ODI, 2016).<br />
Its main component, the Breakthrough Fund, will serve<br />
three functions. First, it will channel immediate support<br />
in a crisis through existing agencies. Grants will be given<br />
to consolidated appeals, which already meet a certain<br />
The Education Cannot Wait fund aims, by<br />
2020, to reach 18% of children <strong>and</strong> youth<br />
whose education is affected by conflict,<br />
natural disasters <strong>and</strong> disease outbreaks<br />
There is growing recognition that stakeholders need to<br />
plan together, act together <strong>and</strong> commit to equity <strong>and</strong><br />
sustainability. Some countries have made significant<br />
strides in increasing financing <strong>and</strong> engaging in more<br />
integrated planning across sectors <strong>and</strong> levels of<br />
government. Calls for multistakeholder partnerships<br />
firmly recognize the importance of non-state actors.<br />
However, the status of financing, planning <strong>and</strong><br />
implementation arrangements shows that the current<br />
environment is very far from what is needed to achieve<br />
the aspirational goals of the 2030 Agenda for Sustainable<br />
Development. From the perspective of the education<br />
sector, the vast majority of government action still<br />
takes place in sector or subsector silos constrained by a<br />
narrowly focused administrative structure. It is difficult<br />
to identify instances in which planning <strong>and</strong> financing is<br />
well coordinated across levels of government. Education<br />
funding from the private sector <strong>and</strong> multilateral institutions<br />
is limited. Moreover, from the broader perspective of all<br />
sectors involved in the SDG agenda, integration is also<br />
lacking. And incentives <strong>and</strong> administrative tools to link<br />
activities across sectors are underdeveloped.<br />
benchmark of funding. This rapid response mechanism<br />
could finance temporary access, essential supplies or<br />
back-to-school campaigns.<br />
Second, it will facilitate engagement at the country<br />
level for up to five years, based on a country plan to be<br />
devised within three months of the onset of a crisis to<br />
bridge <strong>and</strong> consolidate existing plans. The plan is to be<br />
informed by a joint comprehensive need assessment <strong>and</strong><br />
integrated into existing national planning processes <strong>and</strong><br />
aid flows, such as those provided by the GPE.<br />
This state of affairs provides a useful reference point<br />
for assessing future progress as well as anticipating<br />
challenges in achieving the global education goal. There<br />
is a clear need to keep correcting inefficiency in financing<br />
<strong>and</strong> advocating for more funds for education. Political<br />
commitment <strong>and</strong> administrative capacity are key to<br />
ensure successful multisector, multilevel government<br />
arrangements. Finally, it is necessary to keep pressuring<br />
donors to fulfil their most relevant role for education<br />
funding: ensuring that the holistic agenda of SDG 4 <strong>and</strong><br />
the other SDGs is achieved.<br />
Third, it will aim to attract non-traditional donors,<br />
philanthropists <strong>and</strong> the private sector, which may not<br />
be able to provide contributions directly to a general<br />
purpose fund.<br />
2016 • GLOBAL EDUCATION MONITORING REPORT 147
A young Chinese<br />
boy examines the<br />
nature around him.<br />
CREDIT: Fotolia<br />
148<br />
CHAPTER 7 | PROJECTIONS: FORECASTING THE EFFECTS OF EDUCATION EXPANSION ON SUSTAINABLE DEVELOPMENT OUTCOMES
CHAPTER<br />
7<br />
Projections:<br />
forecasting<br />
the effects<br />
of education<br />
expansion on<br />
sustainable<br />
development<br />
outcomes<br />
149
7<br />
KEY MESSAGES<br />
The world will be 50 years late in achieving its global education commitments: On current trends, universal<br />
primary completion will be achieved in 2042; universal lower secondary completion in 2059; <strong>and</strong> universal<br />
upper secondary completion in 2084.<br />
The poorest countries will achieve universal primary education over 100 years later than the richest.<br />
The poorest countries will not achieve universal lower secondary completion until the end of the century.<br />
The richest countries are also not on track to achieve global education commitments: Even at the fastest rate<br />
of progress ever seen in the region, 1 in 10 countries in Europe <strong>and</strong> Northern America would still not achieve<br />
universal upper secondary completion by 2030.<br />
The projections show that universal secondary completion requires an unprecedented <strong>and</strong> immediate break<br />
with past trends.<br />
And yet even if key provisions of the global education goal will not be met in time, modest progress can make<br />
a big difference to other development outcomes.<br />
Achieving universal lower secondary education for women by 2030 in sub-Saharan Africa would prevent up<br />
to 3.5 million child deaths from 2050-2060.<br />
Universalising upper secondary education in low income countries could increase per capita earnings by<br />
75% <strong>and</strong> lift 60 million <strong>people</strong> out of poverty.<br />
Universal upper secondary completion by 2030 would prevent up to 50,000 disaster-related deaths per decade<br />
by 2040-2050.<br />
150<br />
CHAPTER 7 | PROJECTIONS: FORECASTING THE EFFECTS OF EDUCATION EXPANSION ON SUSTAINABLE DEVELOPMENT OUTCOMES
7<br />
Projecting global educational attainment to 2030 <strong>and</strong> beyond....................... 151<br />
Predicting effects of education on development outcomes...............................153<br />
Previous chapters of the Global Education Monitoring<br />
(GEM) Report have introduced ways in which<br />
education can unlock the global potential for sustainable<br />
development. They have also examined how the<br />
2030 Agenda for Sustainable Development requires<br />
reconsidering how education of good quality can address<br />
pressing social, economic <strong>and</strong> environmental challenges.<br />
This chapter looks at ways in which likely scenarios of<br />
education progress might shift development outcomes<br />
in the next 15 years.<br />
The GEM Report commissioned the Wittgenstein Centre<br />
for Demography <strong>and</strong> Global Human Capital, a specialized,<br />
multidisciplinary research centre, to analyse the impact<br />
of education dynamics on selected social, economic <strong>and</strong><br />
environmental outcomes (Barakat et al., 2016). On the basis<br />
of this analysis, the chapter discusses two questions.<br />
First, what do past rates of education expansion indicate<br />
about the prospects of achieving the ambitious new<br />
education goal? The news is not good. Unless there is<br />
rapid acceleration unlike any observed to date, there is<br />
no chance of achieving the target of universal secondary<br />
completion by 2030. Instead, it is projected that<br />
69% of those aged 15 to 19 in 2030 will complete upper<br />
secondary education <strong>and</strong> 84% will complete lower<br />
secondary education. Not even the Education for All (EFA)<br />
goal of universal primary<br />
completion will be achieved;<br />
in low income countries, less<br />
It is projected than 70% of children will<br />
that less than 70%<br />
complete primary school<br />
in 2030.<br />
of children will<br />
complete primary<br />
school in 2030<br />
in low income<br />
countries<br />
Second, what would different<br />
rates of progress in education<br />
mean for development<br />
in other sectors such as<br />
health, the economy <strong>and</strong> the<br />
environment? This chapter’s<br />
analysis considers the impact<br />
of education improving at the speed of past trends, as<br />
well as three more optimistic pathways, on three sets<br />
of outcomes: social (health, including child mortality<br />
<strong>and</strong> life expectancy), economic (poverty <strong>and</strong> economic<br />
growth) <strong>and</strong> environmental (disaster-related deaths).<br />
As the effects of any social change, <strong>and</strong> especially<br />
education, take a long time to reach fruition – sometimes<br />
generations – the impact on these outcomes is explored<br />
at both 2030 <strong>and</strong> 2050.<br />
PROJECTING GLOBAL<br />
EDUCATIONAL ATTAINMENT<br />
TO 2030 AND BEYOND<br />
For the World Education Forum in May 2015, the GEM<br />
Report team published projections of whether the goal<br />
of universal secondary completion, set in the Education<br />
2030 Framework for Action, would be achieved by 2030<br />
(UNESCO, 2015). The conclusion was stark: progressing at<br />
past expansion rates, not even the EFA goal of universal<br />
primary completion will be achieved by 2030 in low <strong>and</strong><br />
middle income countries.<br />
The new projections for this report have been updated<br />
in two ways. First, a larger set of data is used, covering<br />
163 countries that account for the vast majority of the<br />
global population. A potential disadvantage of this wider<br />
coverage is that data sometimes draw on censuses, which<br />
are conducted every 10 years, so the impact of recent<br />
changes in enrolment <strong>and</strong> attainment may be missed.<br />
Second, a more sophisticated methodology is applied<br />
to project the share of the population that will attain a<br />
given level of education, by country <strong>and</strong> gender. Yet, the<br />
approach shares some of the limitations of other global<br />
projections (Box 7.1).<br />
By calling for universal secondary education, the<br />
Sustainable Development Goals (SDGs) agenda entered<br />
uncharted territory. It is unknown whether the future<br />
2016 • GLOBAL EDUCATION MONITORING REPORT 151
7<br />
BOX 7.1<br />
Key considerations in projecting educational attainment<br />
Attainment histories, reconstructed from the most recent censuses or<br />
household surveys, are the basis for the new projections. Data were projected<br />
backwards. For example, the share of 40- to 44-year-olds with at least upper<br />
secondary education in 2000 indicates the likely share of 30- to 34-year-olds<br />
with that level of education in 1990.<br />
These backwards projections account for differences in mortality between<br />
education groups. Where possible, they have been validated using<br />
contemporary data sources. They are disaggregated by country, gender, fiveyear<br />
periods between 1970 <strong>and</strong> 2010, five-year age groups, <strong>and</strong> six education<br />
levels: none, incomplete primary, primary, lower secondary, upper secondary<br />
<strong>and</strong> post-secondary.<br />
Using these attainment rates, the new projections aim to predict the probability<br />
that, in a given country, a particular share of the population will have attained at<br />
least a specified education level.<br />
To make these predictions more realistic, several assumptions are made. When<br />
a country’s attainment rate slows or even reverses in one period, because of<br />
economic recession or political conflict, it is not expected to bounce back in the<br />
following period. This makes it necessary to limit, to some extent, the degree of<br />
deviation from the long-term trend.<br />
Another issue in extrapolating past trends is that short-term declines may lead<br />
one to project that a country’s education system will collapse. Many countries<br />
experience setbacks in their history of education development – one recent<br />
example being the Syrian Arab Republic – but no precedent exists for a country<br />
moving along a long-term reverse trajectory. The model therefore assumes<br />
that such countries’ attainment rate will move towards the regional average<br />
after a setback, albeit more slowly.<br />
Given the continuing large gaps between male <strong>and</strong> female attainment levels<br />
in some countries, <strong>and</strong> the differences in how fast countries converge to<br />
parity, additional assumptions are needed to project attainment by gender. In<br />
particular, it is assumed that in each period, gender-specific attainment rates<br />
converge towards the average for both males <strong>and</strong> females at a rate that differs<br />
across education levels <strong>and</strong> countries but is constant over time.<br />
The scenarios also make explicit assumptions about how accelerating<br />
expansion at one level of the education system affects higher levels. When<br />
more members of a cohort complete a given education level, dem<strong>and</strong> for access<br />
to the next level increases too. This is particularly noticeable in the transition to<br />
post-secondary education: increases in the pool of upper secondary graduates<br />
will raise participation rates in post-secondary education.<br />
Finally, it is assumed, as in the 2015 projections, that the attainment level for<br />
considering a target achieved is 97%. While this is unavoidable, because of the<br />
requirements of the statistical model, it should by no means be interpreted as<br />
meaning that the hardest to reach do not count.<br />
Sources: Barakat et al. (2016); Lutz et al. (2014).<br />
trajectory of upper secondary (<strong>and</strong> higher) education<br />
will resemble the historical trajectory of basic education,<br />
which has become universal in many countries. As of<br />
2010, nearly 80% of 20- to 24-year-olds in the European<br />
Union had completed upper secondary school. Even the<br />
countries with the highest attainment rates, such as the<br />
Republic of Korea, stood at 95%. With no country having<br />
yet achieved universal upper secondary attainment, it is<br />
difficult to assume all countries will converge to universal<br />
completion. Thus, assumptions for secondary education<br />
growth are driven more by statistics than by experience.<br />
The projections reported here focus on the cohort that<br />
will be aged 15 to 19 in 2030. The aspiration of countries<br />
<strong>and</strong> others in the international community is that<br />
this group will ultimately achieve universal secondary<br />
completion.<br />
ATTAINMENT RATE PROJECTIONS FOR<br />
FOUR SCENARIOS<br />
In this chapter, results for the attainment rates, or the<br />
highest level of education completed, of 15- to 19-yearolds<br />
by 2030 are presented for four scenarios (Table 7.1).<br />
The analysis confirms the earlier GEM Report projection<br />
that, on past trends, not even the Millennium<br />
Development Goal (MDG) <strong>and</strong> EFA goal of universal<br />
primary completion is likely to be achieved by 2030.<br />
The target of universal secondary completion is clearly<br />
beyond reach. Under the scenario that past growth<br />
rates will continue, 84% of 15- to 19-year-olds in 2030 are<br />
projected to complete lower secondary education, <strong>and</strong><br />
only 69% upper secondary. On these trends, universal<br />
lower secondary completion would be achieved in 2059,<br />
<strong>and</strong> universal upper secondary completion only in 2084<br />
(Table 7.2).<br />
The challenge for low income countries is particularly<br />
salient. At past rates, half of 15- to 19-year-olds in<br />
2030 will complete lower secondary education <strong>and</strong><br />
less than 30% will complete upper secondary. Low<br />
TABLE 7.1:<br />
Projection scenarios<br />
Scenarios Description<br />
Trend Past progress rates will continue into the future (‘business as usual’) …<br />
… or the cohort of those aged 15 to 19 in 2030 will attain:<br />
Low Universal lower secondary by 2030<br />
Slow Universal upper secondary by 2040<br />
(i.e. all transitions up to upper secondary will be universal by 2030; universal upper<br />
secondary will be completed for the cohort entering school in 2030)<br />
SDG 4.1 Universal upper secondary by 2030 (= target 4.1)<br />
152<br />
CHAPTER 7 | PROJECTIONS: FORECASTING THE EFFECTS OF EDUCATION EXPANSION ON SUSTAINABLE DEVELOPMENT OUTCOMES
7<br />
TABLE 7.2:<br />
Projected attainment rates in 2030 <strong>and</strong> year of achieving universal attainment in the trend scenario, by education level<br />
Primary attainment<br />
rate (%)<br />
(2030)<br />
Projected year of universal<br />
primary attainment<br />
Lower secondary<br />
attainment rate (%)<br />
(2030)<br />
Projected year of<br />
universal lower secondary<br />
attainment<br />
Upper secondary<br />
attainment rate (%)<br />
(2030)<br />
Projected year of<br />
universal upper secondary<br />
attainment<br />
World 91.5 2042 84.4 2059 68.6 2084<br />
Low income 69.6 2088 50.0 2096 29.0 After 2100<br />
Lower middle income 93.2 2054 86.8 2066 71.8 2088<br />
Upper middle income 99.1 2020 96.1 2045 75.2 2087<br />
High income 99.6 Achieved 98.7 2017 94.9 2048<br />
Caucasus <strong>and</strong> Central Asia 99.8 Achieved 99.4 Achieved 96.4 2044<br />
Eastern <strong>and</strong> South-eastern Asia 99.3 2015 96.9 2040 76.5 2080<br />
Europe <strong>and</strong> Northern America 99.7 Achieved 99.5 Achieved 96.8 2044<br />
Latin America <strong>and</strong> the Caribbean 96.6 2042 90.0 2066 72.7 2095<br />
Northern Africa <strong>and</strong> Western Asia 92.3 2048 87.0 2062 77.1 2082<br />
Pacific 99.7 Achieved 99.3 2020 96.8 2045<br />
Southern Asia 95.1 2051 89.0 2062 73.5 2087<br />
Sub-Saharan Africa 77.1 2080 62.1 2089 42.4 After 2100<br />
Source: Barakat et al. (2016).<br />
income countries, in this scenario, would only achieve<br />
Target 4.1 at the end of the century. Middle income<br />
countries would meet the target in the late 2080s. Thus,<br />
achieving universal secondary completion requires an<br />
unprecedented <strong>and</strong> immediate break with past trends<br />
(Figure 7.1).<br />
Among world regions, only Europe <strong>and</strong> Northern America<br />
<strong>and</strong> Caucasus <strong>and</strong> Central Asia have achieved universal<br />
lower secondary completion. They will be very close to<br />
universal upper secondary education in 2030 but are not<br />
expected to reach it. The region of Eastern <strong>and</strong> Southeastern<br />
Asia is likely to come close to universal lower<br />
secondary completion by 2030, but not achieve universal<br />
upper secondary for at least another 30 years.<br />
The new projections indicate that three regions will not<br />
even achieve universal primary completion by 2030.<br />
Northern Africa <strong>and</strong> Western Asia is expected to come<br />
very close, as is Southern Asia. Sub-Saharan Africa will<br />
likely lag behind considerably <strong>and</strong> is expected to have a<br />
completion rate of 77% in primary education, 62% in lower<br />
secondary <strong>and</strong> 42% in upper secondary (Figure 7.2).<br />
How much progress is required? It is useful to look at<br />
whether a country would achieve universal secondary<br />
“<br />
Universal secondary completion<br />
requires an unprecedented <strong>and</strong><br />
immediate break with past trends<br />
”<br />
completion by 2030 if it exp<strong>and</strong>ed at the fastest rate ever<br />
observed in its region. For the vast majority of countries,<br />
this would still not be sufficient – even for 1 in 10<br />
countries in Europe <strong>and</strong> Northern America, <strong>and</strong> for every<br />
country in Southern Asia <strong>and</strong> sub-Saharan Africa (Table 7.3).<br />
This scenario shows that the speed in education<br />
progress required to meet the SDG target would be<br />
unprecedented. Even disregarding differences in income,<br />
institutions, tradition, governance <strong>and</strong> policy between<br />
countries, <strong>and</strong> the fact that what works in one country<br />
may not be successfully replicated elsewhere, analysis<br />
shows the ambition of SDG target 4.1 to be unrealistic.<br />
PREDICTING EFFECTS OF<br />
EDUCATION ON DEVELOPMENT<br />
OUTCOMES<br />
While projections suggest that target 4.1 is not likely to<br />
be met, even modest acceleration of education progress<br />
could make a big difference to other SDGs. However,<br />
there are limitations to underst<strong>and</strong>ing the complex<br />
relationships between education <strong>and</strong> sustainable<br />
development outcomes. In many instances, insufficiencies<br />
of data <strong>and</strong> research mean some relationships cannot<br />
be analysed. St<strong>and</strong>ardized cross-country information<br />
permits examination only of the effects of educational<br />
attainment. Even then, most studies have looked at<br />
relationships for particular populations, which cannot<br />
necessarily be projected to a global scale.<br />
As this report maintains, while educational attainment<br />
matters for development, so do education quality <strong>and</strong><br />
learning outcomes. Yet, widely shared definitions of quality<br />
2016 • GLOBAL EDUCATION MONITORING REPORT 153
7<br />
FIGURE 7.1:<br />
Not even universal primary completion will be achieved by 2030 in low <strong>and</strong> lower middle income countries, on past trends<br />
Projected attainment rates of 15- to 19-year-olds by education level <strong>and</strong> country income group, 2010–2080<br />
Primary education<br />
Lower secondary education<br />
Upper secondary education<br />
100<br />
100<br />
100<br />
Primary attainment rate (%)<br />
75<br />
50<br />
25<br />
Low income<br />
Lower middle income<br />
Upper middle income<br />
High income<br />
Lower secondary attainment rate (%)<br />
75<br />
50<br />
25<br />
Upper secondary attainment rate (%)<br />
75<br />
50<br />
25<br />
0<br />
2010 2020 2030 2040 2050 2060 2070 2080<br />
0<br />
2010 2020 2030 2040 2050 2060 2070 2080<br />
0<br />
2010 2020 2030 2040 2050 2060 2070 2080<br />
Source: Barakat et al. (2016).<br />
FIGURE 7.2:<br />
Achieving universal secondary completion by 2030 will require unprecedented acceleration<br />
Projected attainment rates of 15- to 19-year-olds by education level <strong>and</strong> region, based on past trends <strong>and</strong> SDG 4.1 scenario for universal upper secondary completion by<br />
2030, 2000–2080<br />
Sub-Saharan Africa<br />
Southern Asia<br />
Northern Africa <strong>and</strong> Western Asia<br />
100<br />
100<br />
100<br />
75<br />
75<br />
75<br />
Attainment rate (%)<br />
50<br />
25<br />
Primary<br />
Lower secondary<br />
Upper secondary<br />
Target, upper secondary<br />
Attainment rate (%)<br />
50<br />
25<br />
Attainment rate (%)<br />
50<br />
25<br />
0<br />
2000<br />
2010<br />
2020<br />
2030<br />
2040<br />
2050<br />
2060<br />
2070<br />
2080<br />
0<br />
2000<br />
2010<br />
2020<br />
2030<br />
2040<br />
2050<br />
2060<br />
2070<br />
2080<br />
0<br />
2000<br />
2010<br />
2020<br />
2030<br />
2040<br />
2050<br />
2060<br />
2070<br />
2080<br />
Latin America <strong>and</strong> the Caribbean<br />
Eastern <strong>and</strong> South-eastern Asia<br />
Europe <strong>and</strong> Northern America<br />
100<br />
100<br />
100<br />
75<br />
75<br />
75<br />
Attainment rate (%)<br />
50<br />
Attainment rate (%)<br />
50<br />
Attainment rate (%)<br />
50<br />
25<br />
25<br />
25<br />
0<br />
2000<br />
2010<br />
2020<br />
2030<br />
2040<br />
2050<br />
2060<br />
2070<br />
2080<br />
0<br />
2000<br />
2010<br />
2020<br />
2030<br />
2040<br />
2050<br />
2060<br />
2070<br />
2080<br />
0<br />
2000<br />
2010<br />
2020<br />
2030<br />
2040<br />
2050<br />
2060<br />
2070<br />
2080<br />
Source: Barakat et al. (2016).<br />
154<br />
CHAPTER 7 | PROJECTIONS: FORECASTING THE EFFECTS OF EDUCATION EXPANSION ON SUSTAINABLE DEVELOPMENT OUTCOMES
7<br />
TABLE 7.3:<br />
Percentage of countries that would achieve selected targets<br />
at the highest rate of improvement in education previously<br />
achieved in their region<br />
Universal lower<br />
secondary by 2030<br />
Universal upper<br />
secondary by 2040<br />
<strong>and</strong> learning outcomes are lacking, <strong>and</strong> data coverage across<br />
countries <strong>and</strong> over time is limited. Some research has used<br />
learning outcome data from international assessments.<br />
But the conclusions so far are tentative <strong>and</strong> only relevant<br />
for a limited set of outcomes, such as economic growth.<br />
If, for example, education helps <strong>people</strong> live longer, then<br />
better education is likely to have an even larger effect on<br />
life expectancy. However, there is insufficient evidence to<br />
quantify the effect of improved education quality on other<br />
outcomes. The results presented below should therefore be<br />
seen as representing a lower limit of the potential effects,<br />
which assumes that current education quality levels will<br />
continue. If quality improves, as the 2030 Agenda intends,<br />
the effects could be stronger.<br />
This section examines the effects of education in three sets<br />
of relationships: with infant <strong>and</strong> child mortality (SDG 3.2)<br />
<strong>and</strong> adult life expectancy (related to SDG 3.3 <strong>and</strong> SDG<br />
3.4); with aggregate national economic growth (related to<br />
SDG 8.1 <strong>and</strong> SDG 8.2) <strong>and</strong> extreme poverty (SDG 1.1); <strong>and</strong><br />
with disaster vulnerability (related to SDG 1.5, SDG 11.5 <strong>and</strong><br />
SDG 13.1). Yet, it is clear these analyses form a small part of<br />
a larger sustainability picture.<br />
EDUCATION CAN HELP SAVE MILLIONS OF<br />
CHILDREN’S LIVES<br />
Universal upper<br />
secondary by 2030<br />
Caucasus <strong>and</strong> Central Asia 100 100 86<br />
Eastern <strong>and</strong> South-eastern Asia 76 35 35<br />
Europe <strong>and</strong> Northern America 100 95 90<br />
Latin America <strong>and</strong> the Caribbean 62 10 3<br />
Northern Africa <strong>and</strong> Western Asia 81 69 19<br />
Southern Asia 71 0 0<br />
Sub-Saharan Africa 8 0 0<br />
Source: Barakat et al. (2016).<br />
Health targets are prominent among the SDGs. Their<br />
relationship with education is known to be robust <strong>and</strong> is<br />
relatively well studied (e.g. UNESCO, 2014, <strong>and</strong>, especially,<br />
Lutz et al., 2014, on which the following model is based).<br />
To underst<strong>and</strong> how increased education could reduce<br />
infant <strong>and</strong> child mortality, this analysis looks at the<br />
education of women of child-bearing age in 2030 with<br />
progress continuing on past trends (‘trend scenario’) <strong>and</strong><br />
with SDG target 4.1 being met (‘SDG 4.1 scenario’) (Table<br />
7.1). To isolate the potential additional contribution of<br />
education, the analysis assumes that current fertility <strong>and</strong><br />
mortality trends continue.<br />
In the SDG 4.1 scenario, very few women of child-bearing<br />
age with low education would be left at the end of the<br />
next 15 years. The effects are studied for 2030 <strong>and</strong> 2050,<br />
since women who complete their schooling in about<br />
2030 will have most of their children in the following two<br />
decades. Indeed, the education effect will continue to<br />
grow between 2030 <strong>and</strong> 2050, even in absolute terms,<br />
despite the fact that overall mortality levels will be<br />
significantly lower towards the end of this period.<br />
Achieving universal secondary schooling would make<br />
a meaningful contribution to reducing infant <strong>and</strong> child<br />
mortality. In particular, achieving universal lower secondary<br />
education by 2030 would reduce the under-5 mortality<br />
rate in sub-Saharan Africa from 68 to 62 deaths per 1,000<br />
live births by 2030 <strong>and</strong> from 51 to 44 by 2050. Achieving<br />
universal upper secondary education by 2030 would lower<br />
the under-5 mortality rate further to 54 deaths by 2030<br />
<strong>and</strong> to 38 deaths by 2050 (Figure 7.3). With an estimated<br />
25 million children expected to be born in the region in<br />
2050 under the SDG scenario, this would be equivalent<br />
to 300,000–350,000 fewer child deaths per year in 2050.<br />
Without additional education expansion, as according to<br />
the trend scenario, however, the decline in child mortality in<br />
sub-Saharan Africa may well begin to slow.<br />
Some evidence shows that children’s health can benefit<br />
from community-level effects <strong>and</strong> the general diffusion<br />
of healthy practices <strong>and</strong> behaviour, which in turn<br />
suggests that improvements in child mortality would<br />
be greater than those suggested by simply improving<br />
women’s education.<br />
While these effects appear moderate, it should not<br />
be forgotten that the trend scenario, which assumes<br />
education attainment continues to grow at past rates,<br />
already entails significant education expansion. Moreover,<br />
much of the additional expansion implied by the SDG<br />
target scenario occurs at the upper secondary <strong>and</strong> postsecondary<br />
levels, while the largest gains in terms of child<br />
health come with increases in the primary <strong>and</strong> lower<br />
secondary attainment rates, which are already high in<br />
most regions. Therefore, much of the global benefit of<br />
education with relation to child mortality has already<br />
taken effect, with most of the remaining benefit expected<br />
in sub-Saharan Africa.<br />
Another potential health contribution of achieving<br />
target 4.1 is to raise the average life expectancy at age<br />
15 between 2030 <strong>and</strong> 2050. Yet, despite significant<br />
2016 • GLOBAL EDUCATION MONITORING REPORT 155
7<br />
variance in life expectancy at different education levels,<br />
even in high income countries, the change to overall life<br />
expectancy would be marginal in most regions due to the<br />
short time horizon <strong>and</strong> modest increases in a population<br />
with a given level of educational attainment. Even in<br />
sub-Saharan Africa, the cohort that would benefit from<br />
universal secondary education will not have reached<br />
ages of high mortality even by 2050. Indeed, robust<br />
studies highlighting the strong impact of education<br />
on life expectancy have used cohorts in high income<br />
countries born in the 1940s (Lager <strong>and</strong> Torss<strong>and</strong>er, 2012),<br />
underlining the long time-frame needed to demonstrate<br />
an education effect on life expectancy.<br />
EDUCATION CAN CHANGE THE COURSE<br />
OF ECONOMIC DEVELOPMENT IN POOR<br />
COUNTRIES<br />
The economic effects of education have been among<br />
the most widely studied (Krueger <strong>and</strong> Lindahl, 2001). Of<br />
particular interest in connection with the SDGs is the role<br />
of education in increasing aggregate economic growth<br />
<strong>and</strong> reducing extreme poverty.<br />
FIGURE 7.3:<br />
Achieving the SDG education target would save millions of<br />
children’s lives<br />
Under-5 mortality rates in the ‘trend’, ‘low’ <strong>and</strong> ‘SDG 4.1’ scenarios, by<br />
region, 2030 <strong>and</strong> 2050<br />
Deaths of children under 5 for every 1,000 live births<br />
70<br />
60<br />
50<br />
40<br />
30<br />
20<br />
10<br />
0<br />
Sub-Saharan Africa<br />
Southern Asia<br />
Caucasus/C. Asia<br />
Northern Africa/W. Asia<br />
Source: Barakat et al. (2016).<br />
Trend scenario: education exp<strong>and</strong>ing at past trends<br />
Low scenario: universal lower secondary completion by 2030<br />
SDG 4.1 scenario: universal upper secondary completion by 2030<br />
2030<br />
Eastern/South-east. Asia<br />
Latin America/Caribbean<br />
Europe/N. America<br />
Sub-Saharan Africa<br />
Southern Asia<br />
Caucasus/C. Asia<br />
Northern Africa/W. Asia<br />
2050<br />
Eastern/South-east. Asia<br />
Latin America/Caribbean<br />
Europe/N. America<br />
Economic growth gains can be enormous in<br />
low income countries<br />
Improvement in human capital is assumed to have two<br />
distinct effects on income per capita. First, it increases<br />
labour productivity. Second, it spurs technological<br />
development <strong>and</strong> adoption, which in turn increases the<br />
productivity of all factors of production.<br />
Yet, as with health effects, the effects of education on<br />
the economy take time to materialize. Young <strong>people</strong> who<br />
benefit from education expansion in the next 15 years<br />
need to enter the labour force in significant numbers<br />
before their additional human capital can make an<br />
impact. This will occur long after 2030. In middle income<br />
countries, the additional growth from achieving universal<br />
secondary education by 2030 would likely be small,<br />
because many of these countries already have relatively<br />
high <strong>and</strong> increasing levels of participation in secondary<br />
education – even under the trend scenario.<br />
In low income countries, though, universalizing upper<br />
secondary completion would lead to an increase in per<br />
capita income of 75% by 2050. Universal lower secondary<br />
completion would account for about half of the gain.<br />
However, this again understates the contribution of<br />
education expansion, as significant education growth is<br />
expected in the baseline trend scenario.<br />
Exp<strong>and</strong>ing education can have a drastic effect on<br />
poverty reduction<br />
To estimate the impact of increased educational<br />
attainment on poverty reduction as achieved through<br />
national economic growth, assumptions are necessary<br />
on how sensitive poverty rates are to growth rates<br />
(Ravallion, 2012).<br />
While accelerated education expansion can make<br />
a sizeable contribution to overall growth, meeting<br />
target 4.1 might not contribute much to eliminating<br />
extreme poverty. In the poorest countries, however,<br />
achieving universal secondary education by 2030<br />
could bring poverty elimination forward by 10 years,<br />
even if it is insufficient to eliminate extreme poverty<br />
altogether by 2030. In particular, the poverty headcount<br />
rate in low income countries – the proportion of the<br />
population living below the poverty line of US$1.25 at<br />
2005 purchasing power parity – would be 24% in the<br />
SDG 4.1 scenario instead of 28% in the trend scenario<br />
by 2030, <strong>and</strong> 2% instead of 9% by 2050 (Figure 7.4).<br />
With 875 million <strong>people</strong> expected to be living in low<br />
income countries in 2050 under the SDG scenario this<br />
would correspond to more than 60 million fewer million<br />
156<br />
CHAPTER 7 | PROJECTIONS: FORECASTING THE EFFECTS OF EDUCATION EXPANSION ON SUSTAINABLE DEVELOPMENT OUTCOMES
7<br />
FIGURE 7.4:<br />
Universal upper secondary completion by 2030 could lift millions<br />
out of poverty by 2050 in low income countries<br />
Poverty headcount rate in low income countries under four education<br />
expansion scenarios, 2030 <strong>and</strong> 2050<br />
Poverty headcount rate (%)<br />
45<br />
40<br />
35<br />
30<br />
25<br />
20<br />
15<br />
10<br />
5<br />
24<br />
28<br />
0<br />
2020 2030<br />
Source: Barakat et al. (2016).<br />
Trend scenario: education exp<strong>and</strong>ing at past trends<br />
Low scenario: universal lower secondary completion by 2030<br />
Slow scenario: universal upper secondary completion by 2040<br />
SDG 4.1 scenario: universal upper secondary completion by 2030<br />
2040 2050<br />
<strong>people</strong> in poverty. Most of the difference is accounted<br />
for by increases in secondary rather than postsecondary<br />
attainment.<br />
EDUCATION’S EFFECTS ON<br />
CLIMATE CHANGE ADAPTATION CAN<br />
REDUCE DISASTER-RELATED DEATHS<br />
There are various links between education <strong>and</strong> climate<br />
change. On the one h<strong>and</strong>, while the more educated<br />
may be more supportive of institutional reforms <strong>and</strong><br />
interventions aimed at climate change mitigation,<br />
educated <strong>people</strong> tend to have higher incomes <strong>and</strong><br />
consume more resources, which is likely to increase<br />
emissions <strong>and</strong> global warming. Estimating these<br />
relationships using current models is not possible.<br />
2<br />
9<br />
2060<br />
the more educated tend to exhibit greater awareness<br />
of risks, a higher degree of preparation <strong>and</strong> appropriate<br />
responses, <strong>and</strong> smaller average losses when disaster<br />
does strike. Although it is argued that natural disasters<br />
strike indiscriminately, disaster risk reduction assumes<br />
that information <strong>and</strong> preparedness can make a<br />
difference to the survival <strong>and</strong> livelihoods of individuals<br />
<strong>and</strong> communities.<br />
Human-induced climate change is likely to increase the<br />
frequency, intensity <strong>and</strong> severity of extreme climate<br />
events such as heat waves <strong>and</strong> heavy precipitation, <strong>and</strong><br />
cause rising sea levels (IPCC, 2014). Analyses carried<br />
out for the GEM Report examine how different rates of<br />
progress in education affect the numbers of deaths from<br />
extreme climate events <strong>and</strong> other natural catastrophes,<br />
including storms, floods, droughts <strong>and</strong> l<strong>and</strong>slides (Lutz<br />
et al., 2014) The model uses past information on the<br />
relationship between education <strong>and</strong> disaster deaths<br />
(from the Emergency Events Database EM 2010) as<br />
a basis for forecasts of changes in disaster deaths in<br />
coming decades.<br />
The findings show, for example, about 250,000 disasterrelated<br />
deaths over 2000–2010. If trends in education<br />
continue at the current pace (which will reduce disaster<br />
deaths), but the frequency of natural disasters increases<br />
by 20%, the number of disaster-related deaths will remain<br />
at this high level to mid-century <strong>and</strong> beyond. If, however,<br />
the pace of education expansion quickens, <strong>and</strong> universal<br />
secondary education is achieved by 2030, then by<br />
2040–2050 there will be 10,000 to 20,000 fewer disasterrelated<br />
deaths per decade at constant disaster frequency,<br />
<strong>and</strong> 30,000 to 50,000 fewer deaths in a scenario of<br />
increased disaster frequency. Increased secondary<br />
education in Asia would have an especially strong impact<br />
on the predicted global pattern, as the continent is home<br />
to some of the largest populations, many of whom<br />
reside in coastal areas where most disasters occur. In<br />
short, meeting the SDG 4.1 challenge to achieve universal<br />
primary <strong>and</strong> secondary education could significantly help<br />
countries combat climate change <strong>and</strong> its impact (SDG 13).<br />
On the other h<strong>and</strong>, evidence shows that those with<br />
higher education levels are less vulnerable <strong>and</strong> more<br />
resilient to natural disasters. While comprehensive<br />
data on <strong>people</strong>’s education levels in disaster-prone<br />
situations are rare, current information suggests that<br />
2016 • GLOBAL EDUCATION MONITORING REPORT 157
Girls wash their h<strong>and</strong>s<br />
outside their classroom<br />
in the government-run<br />
United Methodist School<br />
in Freetown, Sierra Leone.<br />
Schools throughout Sierra<br />
Leone, including this one,<br />
were closed for eight<br />
months at the height of<br />
the Ebola crisis.<br />
CREDIT: Kate Holt/GEM Report<br />
158<br />
CHAPTER 8 | EDUCATION AND SUSTAINABLE DEVELOPMENT: CONCLUSIONS AND POLICY RECOMMENDATIONS
CHAPTER<br />
8<br />
Education <strong>and</strong><br />
sustainable<br />
development:<br />
conclusions<br />
<strong>and</strong> policy<br />
recommendations<br />
159
8<br />
KEY MESSAGES<br />
For education to be transformative in support of the<br />
new sustainable development agenda, ‘education as usual’<br />
will not suffice.<br />
Collaborate across sectors: Include ministries, civil society, the private sector, at the local <strong>and</strong> national level.<br />
Use education as a capacity-building tool in all sectors. Invest in integrated interventions that will have<br />
multiplier effects for several development outcomes.<br />
Education cannot fight inequality on its own. Labour markets <strong>and</strong> governments must not excessively penalize<br />
lower income individuals. Cross sectoral cooperation can reduce barriers to gender equality.<br />
Education funding needs to be both adequate <strong>and</strong> predictable to ensure the provision of good quality<br />
education, especially to marginalized groups.<br />
PLANET: A whole-school approach is needed to build green skills <strong>and</strong> awareness. Campaigns, companies, as<br />
well as community <strong>and</strong> religious leaders must advocate for sustainability practices. Non-formal education <strong>and</strong><br />
research <strong>and</strong> development should also help solve global environmental challenges.<br />
PROSPERITY: Invest in teaching green <strong>and</strong> transferable skills in school <strong>and</strong> the workplace. Incentivize<br />
universities <strong>and</strong> agricultural extension to focus on green economic growth <strong>and</strong> sustainable agricultural<br />
production. Promote cooperation across all sectors to encourage full economic participation by women or<br />
minority groups.<br />
PEOPLE: Ensure universal access to basic services. , Support the integration of marginalized groups by<br />
investing in early childhood care <strong>and</strong> education, social protection programmes <strong>and</strong> awareness campaigns.<br />
Fund integrated delivery of basic services in schools.<br />
PEACE: Exp<strong>and</strong> education on global citizenship, peace, inclusion <strong>and</strong> resilience to conflict. Emphasize participatory<br />
teaching <strong>and</strong> learning especially in civic education. Invest in qualified teachers for refugees <strong>and</strong> displaced<br />
<strong>people</strong>, <strong>and</strong> teach children in their mother language. Incorporate education into the peacebuilding agenda.<br />
PLACE: Distribute public resources equitably in urban areas, involving the community in education planning.<br />
Include education in all discussions on urban development. Improve <strong>and</strong> fund urban planning programmes <strong>and</strong><br />
curricula to include cross-sector engagement <strong>and</strong> develop locally-relevant solutions.<br />
PARTNERSHIPS: Develop equitable funding mechanisms. Use progressive public finance policies to fund lower<br />
levels of education; combine grants <strong>and</strong> loans to finance upper levels of education. Increase multilateral aid<br />
mechanisms <strong>and</strong> engagement with the private sector. Mobilize domestic resources by improving knowledge<br />
about tax systems, halting tax evasion, <strong>and</strong> eliminating fossil fuel subsidies.<br />
160<br />
CHAPTER 8 | EDUCATION AND SUSTAINABLE DEVELOPMENT: CONCLUSIONS AND POLICY RECOMMENDATIONS
8<br />
Policy recommendations......................................................................................................163<br />
Planet...................................................................................................................................... 164<br />
Prosperity............................................................................................................................... 165<br />
People...................................................................................................................................... 165<br />
Peace....................................................................................................................................... 166<br />
Place........................................................................................................................................ 166<br />
Partnerships...........................................................................................................................167<br />
The 2030 Agenda for Sustainable Development grew out<br />
of intensifying concerns over the health of the <strong>planet</strong> <strong>and</strong><br />
the prosperity of all its inhabitants. Clearly, education<br />
matters for <strong>people</strong> <strong>and</strong> <strong>planet</strong>. It transforms the lives<br />
of children, youth <strong>and</strong> adults. The fact that education is<br />
a positive force for social, economic <strong>and</strong> environmental<br />
change – that it can significantly influence how we think,<br />
perceive <strong>and</strong> act – is neither new nor revolutionary. And<br />
yet important questions remain: How does education<br />
function to create societal change? In what contexts does<br />
it matter more or less? Which types of education have<br />
lasting impact on sustainability issues? Answers to these<br />
questions are critical as concrete proposals for improving<br />
economic, social <strong>and</strong> environmental sustainability are<br />
being considered.<br />
There are concerns<br />
that evolving global<br />
conditions may<br />
weaken the impact<br />
They are particularly salient<br />
in places where widespread<br />
access to schooling is a<br />
recent achievement or<br />
remains an ambition.<br />
The preceding chapters –<br />
of education<br />
Planet, Prosperity, People,<br />
Peace <strong>and</strong> Place – have<br />
showcased evidence about<br />
the many <strong>and</strong> varied<br />
effects of education. The benefits of completing primary<br />
<strong>and</strong> secondary education are substantial, not only<br />
for the individuals involved but also for their families,<br />
communities <strong>and</strong> workplaces. Adult men <strong>and</strong> women<br />
who have completed some secondary education tend<br />
to be more environmentally aware, more resilient to the<br />
impact of climate change, more productive <strong>and</strong> able to<br />
generate income, <strong>and</strong> more likely to live healthier lives,<br />
be politically engaged <strong>and</strong> exercise greater control over<br />
their lives. The effects of broadening access to girls <strong>and</strong><br />
women, in particular, are numerous <strong>and</strong> intergenerational.<br />
The Projections chapter goes one step further <strong>and</strong><br />
underscores the stakes involved in universalizing primary<br />
<strong>and</strong> secondary education by 2030. Enabling every child<br />
in the world to complete 12 years of schooling would<br />
not only catalyse education progress more broadly<br />
(e.g. in many targets of the education goal, Sustainable<br />
Development Goal 4), but would also help save millions<br />
of lives among children who might not otherwise reach<br />
age 5 <strong>and</strong> among those residing in disaster-prone areas.<br />
It would also improve overall worker productivity <strong>and</strong><br />
economic growth.<br />
Concern exists, however, that evolving global conditions<br />
– social, economic, political <strong>and</strong> environmental – may<br />
weaken the impact of education. Over the past two<br />
centuries, the world economy has been massively<br />
transformed through industrialization, mechanization,<br />
computerization, innovation <strong>and</strong> globalization, the latest<br />
iteration resulting in today’s ‘knowledge economies’.<br />
These transformations have created enormous wealth<br />
for some <strong>and</strong>, in many instances, helped exp<strong>and</strong> sizeable<br />
middle classes. At the same time, huge populations<br />
2016 • GLOBAL EDUCATION MONITORING REPORT 161
8<br />
throughout the world have been left behind, their<br />
lives <strong>and</strong> livelihoods remaining vulnerable to economic<br />
dislocation or persistent poverty or both. The vicissitudes<br />
of economic cycles, which often exacerbate political<br />
insecurity <strong>and</strong> violent conflict, have forced millions of<br />
families <strong>and</strong> even whole communities to relocate under<br />
difficult circumstances.<br />
Despite challenges, the worldwide movement to<br />
universalize a long cycle of education <strong>and</strong> improve<br />
learning levels gathers steam. These aspirations are<br />
deeply embedded in the aims, policies <strong>and</strong> plans of<br />
almost all countries, regardless of population, location<br />
<strong>and</strong> degree of development. Education, which historically<br />
served elite interests, has been made more accessible,<br />
exp<strong>and</strong>ed into national systems that seek to provide<br />
all students, even those in hard-to-reach locations<br />
<strong>and</strong> marginalized groups, with the opportunity to<br />
become educated <strong>and</strong> skilled. The aim of good quality<br />
education for all has become the norm, driving national<br />
commitments <strong>and</strong> the activities of international<br />
agencies <strong>and</strong> external donors, bolstered by human<br />
rights conventions.<br />
If it were to be achieved, the new global education goal<br />
would mean that each <strong>and</strong> every child, regardless of birth<br />
circumstances, would have a chance to acquire valuable<br />
knowledge, skills <strong>and</strong> attitudes that could improve the<br />
quality of their lives from personal, civic, social <strong>and</strong><br />
employment-related perspectives. But the scale of<br />
the challenge is pronounced: 263 million children <strong>and</strong><br />
adolescents are currently excluded from primary <strong>and</strong><br />
secondary education <strong>and</strong> unable to acquire relevant skills<br />
<strong>and</strong> competencies for life <strong>and</strong> work. Education’s many<br />
benefits now go disproportionately to some individuals<br />
at the expense of others. The ones who are far less likely<br />
to reap them include <strong>people</strong> who face discrimination, are<br />
unhealthy, lack access to basic services <strong>and</strong> live in remote<br />
or sparsely populated areas.<br />
The Global Education Monitoring Report (GEM Report)<br />
emphasizes the inequity <strong>and</strong> unsustainability of global<br />
<strong>and</strong> national economies, <strong>and</strong> the various roles education<br />
plays in this respect. Modern economic systems have<br />
increased the value of <strong>and</strong> dem<strong>and</strong> for educated labour,<br />
especially as a source of innovation-led economic growth.<br />
Economic benefits <strong>and</strong> social status accrue to those<br />
with credentialed knowledge <strong>and</strong> skills, leaving behind<br />
huge numbers of <strong>people</strong> who may never have had access<br />
to school or to lifelong learning opportunities <strong>and</strong> who<br />
therefore face persistent obstacles in obtaining decent<br />
work or escaping from working poverty.<br />
From a sustainability perspective, the world’s wealthy,<br />
with their high levels of education <strong>and</strong> st<strong>and</strong>ards of living,<br />
leave large ecological footprints <strong>and</strong> make the <strong>planet</strong><br />
less sustainable. Educated <strong>people</strong> may have considerable<br />
knowledge about environmental <strong>and</strong> other progressive<br />
issues, but do not always act on it. Education <strong>and</strong><br />
qualifications do not necessarily translate into desirable<br />
outcomes, such as greater tolerance for diversity, respect<br />
for women <strong>and</strong> men, less risky health behaviour, waste<br />
prevention, more balanced diets <strong>and</strong> a commitment to<br />
social justice. At the same time, the least educated <strong>and</strong><br />
most vulnerable contribute little to the <strong>planet</strong>’s burdens.<br />
And yet they are most exposed to the impact of climate<br />
change <strong>and</strong> increasingly frequent <strong>and</strong> severe natural<br />
disasters. Inequality in opportunity <strong>and</strong> living conditions,<br />
including in access to education of good quality, are<br />
especially visible in our growing cities <strong>and</strong> urban areas,<br />
which has often led to civil unrest <strong>and</strong> discontent.<br />
Education cannot serve as a cure-all for society’s<br />
problems. Global social <strong>and</strong> economic challenges are<br />
interdependent, involving sectors beyond education, <strong>and</strong><br />
education is provided within the context of entrenched<br />
social <strong>and</strong> political institutions that are resistant to<br />
change. Radical transformation of how <strong>and</strong> what we<br />
consume <strong>and</strong> produce, <strong>and</strong> of the basis for sharing<br />
economic rewards, requires commitments that must<br />
cross economic sectors <strong>and</strong> political boundaries. At<br />
the same time, education reforms are no quick fix if<br />
not reinforced by changes in the home, workplace<br />
<strong>and</strong> community that result in altering, for example,<br />
stereotypical gender roles or attitudes towards <strong>people</strong><br />
who face discrimination on any grounds, from ethnicity<br />
to disability.<br />
Politics, economics, health, water, sanitation, energy,<br />
migration, conflict <strong>and</strong> climate have direct effects on<br />
education systems. Poor air quality or extreme weather<br />
can destroy schools, force them to close or make learning<br />
nearly impossible. Groups such as <strong>people</strong> displaced by<br />
climate change or conflict, economic migrants <strong>and</strong> poor<br />
slum dwellers can place enormous pressure on education<br />
systems. Education is much affected by the context in<br />
which it operates.<br />
Yet formal, non-formal <strong>and</strong> informal education can lay<br />
the groundwork for transforming institutions <strong>and</strong> norms<br />
to address today’s pressing challenges in tangible ways.<br />
Schools can deliver knowledge on sustainability issues<br />
<strong>and</strong> promote good environmental, health <strong>and</strong> sanitation<br />
practices. When designed smartly, <strong>and</strong> conveyed by<br />
well-prepared teachers, school-based programmes can<br />
inculcate values of tolerance <strong>and</strong> equality.<br />
162<br />
CHAPTER 8 | EDUCATION AND SUSTAINABLE DEVELOPMENT: CONCLUSIONS AND POLICY RECOMMENDATIONS
8<br />
Evidence gathered for this report suggests that<br />
education systems do not change quickly, despite wellarticulated<br />
intentions, since content <strong>and</strong> pedagogy often<br />
reflect deeply set social, economic <strong>and</strong> environmental<br />
norms. And in many instances, schools lack adequate<br />
financing for transformation, even if school leaders are<br />
committed to this aim.<br />
Several of the GEM Report chapters document a wide<br />
range of non-formal <strong>and</strong> informal learning initiatives,<br />
especially targeting girls <strong>and</strong> women, that fill gaps in<br />
useful knowledge – such as how to dem<strong>and</strong> local services<br />
or fight for justice – <strong>and</strong> equip learners for stronger<br />
economic <strong>and</strong> political participation. The report also<br />
highlights learning-focused actions by national <strong>and</strong> local<br />
governments, civil society organizations <strong>and</strong> private<br />
companies, recognizing the ways in which education<br />
<strong>and</strong> lifelong learning matter for reducing inequality,<br />
encouraging sustainable transport <strong>and</strong> waste prevention,<br />
<strong>and</strong> both preventing conflict <strong>and</strong> natural disasters <strong>and</strong><br />
recuperating from them.<br />
The GEM Report also pays special attention to the<br />
importance of developing integrated approaches to solve<br />
complex, collective problems. Such strategies align well<br />
with key points made in the 2030 Agenda for Sustainable<br />
Development. However, the Partnerships chapter finds<br />
that the notion of integrated planning, though part of the<br />
post-2015 development discourse, still exists mostly on<br />
paper <strong>and</strong> there is limited evidence of its benefits, partly<br />
because there is little appetite for difficult collaborative<br />
arrangements. Few countries have genuinely pushed<br />
for integrated actions to provide, for instance, early<br />
childhood development or joint basic services. Without<br />
strong political incentives <strong>and</strong> adequate financial<br />
backing, planning <strong>and</strong> implementation in most contexts<br />
will remain in silos. We know the many ways education<br />
matters for shaping knowledge, values <strong>and</strong> attitudes;<br />
education <strong>and</strong> lifelong learning policies targeting<br />
all learners of all ages must be given their rightful<br />
priority <strong>and</strong> embedded in integrated national <strong>and</strong> local<br />
planning efforts.<br />
For education to truly be transformative, ‘education as<br />
usual’ will not suffice. Schools need to become exemplary<br />
places that breathe sustainability, finding ways to be<br />
more inclusive, participatory <strong>and</strong> healthy, as well as<br />
carbon-neutral <strong>and</strong> producing no waste <strong>and</strong> pollution.<br />
Formal <strong>and</strong> non-formal learning needs to foster thinking<br />
that is more relational, integrative, empathic, anticipatory<br />
<strong>and</strong> systemic.<br />
POLICY RECOMMENDATIONS<br />
Keeping all of the above discussion in mind, the<br />
GEM Report presents general <strong>and</strong> specific policy<br />
recommendations for how education systems can more<br />
effectively contribute to sustainable development:<br />
■■<br />
Support collaborations <strong>and</strong> synergies across all<br />
sectors <strong>and</strong> partners. Since systemic problems require<br />
multiple actors <strong>and</strong> diverse perspectives, stronger<br />
efforts are needed to involve all partners at the local<br />
<strong>and</strong> national level <strong>and</strong> across sectors. Finance <strong>and</strong><br />
planning ministries need to engage in more systemic<br />
planning. Education ministries should be better<br />
linked with ministries of health, gender, environment<br />
<strong>and</strong> labour. Education experts need to learn from<br />
<strong>and</strong> work with civil society <strong>and</strong> communities, which<br />
already carry out an impressive array of education<br />
<strong>and</strong> training. Stronger focus is required on crosssector<br />
collaboration <strong>and</strong> integrated perspectives in the<br />
activities of civil society <strong>and</strong> the private sector, as well<br />
as in urban planning <strong>and</strong> research <strong>and</strong> development<br />
strategies. The private sector, civil society, multiple<br />
sectors of government activity <strong>and</strong> international<br />
actors should work together to fund various facets of<br />
education, since education matters for all aspects of<br />
sustainable development.<br />
■■<br />
Integrate formal <strong>and</strong> non-formal education <strong>and</strong><br />
training into government efforts to tackle complex<br />
problems. Education can be an important tool for<br />
capacity-building in all public sectors. Many of the<br />
Sustainable Development Goal targets will require the<br />
specialized skills <strong>and</strong> expertise education can provide,<br />
for instance in water management or addressing<br />
global health <strong>and</strong> climate risks. The case for education<br />
interventions should focus on both immediate <strong>and</strong><br />
longer-term cross-sector benefits that education<br />
solutions can provide, so that funds additional to<br />
those traditionally targeted for education can be used.<br />
Governments <strong>and</strong> other<br />
stakeholders also need<br />
to better investigate <strong>and</strong><br />
invest in combinations of For education<br />
integrated interventions<br />
to truly be<br />
that are likely to have<br />
multiplier effects for<br />
transformative,<br />
several development ‘education as usual’<br />
outcomes, including<br />
will not suffice<br />
education. Investment<br />
is particularly needed<br />
2016 • GLOBAL EDUCATION MONITORING REPORT 163
8<br />
in low income countries so they can build their<br />
own expertise by improving higher education <strong>and</strong><br />
vocational institutions, as well as informal adult<br />
learning initiatives.<br />
More specifically, stakeholders working to promote the<br />
sustainable development agenda should consider the<br />
following actions to exp<strong>and</strong> education’s focus <strong>and</strong> create<br />
more equitable opportunities for all:<br />
■■<br />
Education can be an important means of reducing<br />
inequality but cannot be seen as the sole solution.<br />
Making primary <strong>and</strong> secondary education of good<br />
quality widely accessible can enable large numbers<br />
of individuals <strong>and</strong> their families to raise their incomes<br />
above the poverty line. Exp<strong>and</strong>ing educational<br />
opportunities to marginalized groups <strong>and</strong> further<br />
reducing gender inequality in the school system are<br />
crucial to reduce disparity in labour market outcomes,<br />
much of which is accounted for by lower levels of<br />
attainment. Policy-makers must ensure that changes<br />
in labour market institutions, such as technological<br />
progress <strong>and</strong> easing of labour market restrictions, do<br />
not excessively penalize lower income individuals, who<br />
are disproportionally employed in lower paying <strong>and</strong><br />
less secure jobs, often in the informal sector. At the<br />
same time, cooperation across all sectors of society<br />
<strong>and</strong> the economy is needed to reduce prejudice<br />
<strong>and</strong> any policy-related obstacles to full economic<br />
participation by women <strong>and</strong> minority groups.<br />
■■<br />
Increase the level <strong>and</strong> predictability of education<br />
system financing. Education funding needs to be both<br />
adequate <strong>and</strong> predictable to ensure the provision<br />
of good quality primary <strong>and</strong> secondary education,<br />
especially to marginalized groups. This would entail<br />
ensuring appropriate inputs <strong>and</strong> teachers, <strong>and</strong><br />
transforming school systems to better inculcate<br />
values of social <strong>and</strong> environmental sustainability in<br />
addition to a specific set of cognitive skills. Improved<br />
financing is also critical to support non-formal <strong>and</strong><br />
informal learning initiatives<br />
instead of waiting for<br />
the longer-term effects<br />
Education can be an of formal systems. Such<br />
important means of initiatives are often<br />
innovative, localized,<br />
reducing inequality<br />
targeted to adults <strong>and</strong><br />
but cannot be seen capable of helping address<br />
as the sole solution pressing issues such as<br />
disaster risk resilience <strong>and</strong><br />
conflict prevention.<br />
PLANET<br />
In order to lessen environmental degradation <strong>and</strong> the<br />
impact of climate change:<br />
■■<br />
Develop whole-school approaches that promote<br />
environmental teaching, learning, planning <strong>and</strong><br />
operations by drawing attention to the ties between<br />
the environment, economy <strong>and</strong> culture.<br />
■■<br />
Provide disaster risk-resilience training in schools<br />
<strong>and</strong> equip learners with the means to support<br />
communities in times of disasters.<br />
■■<br />
Fund efforts to ensure that education infrastructure is<br />
resilient to climate change.<br />
■■<br />
Engage community elders in curricular development<br />
<strong>and</strong> school governance, produce appropriate<br />
learning materials <strong>and</strong> prepare teachers to teach in<br />
mother languages.<br />
■■<br />
Promote the value of indigenous livelihoods,<br />
traditional knowledge <strong>and</strong> community-managed<br />
or -owned l<strong>and</strong> through actions such as l<strong>and</strong><br />
conservation <strong>and</strong> locally relevant research.<br />
■■<br />
Initiate large-scale awareness campaigns that<br />
‘nudge’ <strong>people</strong> to engage in sustainability practices<br />
<strong>and</strong> behaviour.<br />
■■<br />
Work with community <strong>and</strong> religious leaders to<br />
spread ideas about environmental stewardship, <strong>and</strong><br />
incentivize companies that incorporate sustainability<br />
into workplace practices.<br />
■■<br />
Scale up non-formal education initiatives promoting<br />
family planning <strong>and</strong> maternal well-being.<br />
■■<br />
Increase funding of research <strong>and</strong> development<br />
that promote technological innovations in energy,<br />
agriculture <strong>and</strong> food systems.<br />
164<br />
CHAPTER 8 | EDUCATION AND SUSTAINABLE DEVELOPMENT: CONCLUSIONS AND POLICY RECOMMENDATIONS
8<br />
PROSPERITY<br />
In order to reduce poverty <strong>and</strong> stimulate green <strong>and</strong><br />
inclusive economies:<br />
■■<br />
Invest in teaching green skills in formal <strong>and</strong> non-formal<br />
programmes. Coordinate green-focused curricula<br />
through cooperation between education <strong>and</strong> training<br />
systems, policy-makers <strong>and</strong> industry.<br />
■■<br />
Train <strong>and</strong> support teachers <strong>and</strong> instructors at all<br />
education levels <strong>and</strong> in the workplace to enable<br />
learners to acquire green skills.<br />
■■<br />
Ensure universal access to good quality education<br />
that emphasizes skills <strong>and</strong> competencies for entry<br />
into economically productive, environmentally<br />
sustainable industries.<br />
■■<br />
Develop short-term strategies focused on workforce<br />
retraining <strong>and</strong> upskilling, together with longerterm<br />
strategies to improve or revise curricula in<br />
secondary education, initial higher education <strong>and</strong><br />
vocational training.<br />
■■<br />
Incentivize universities to produce graduates <strong>and</strong><br />
researchers who address large-scale systemic<br />
challenges through creative thinking <strong>and</strong><br />
problem-solving.<br />
■■<br />
Promote cooperation across all sectors to<br />
reduce policy-related obstacles to full economic<br />
participation by women or minority groups, as well as<br />
discrimination <strong>and</strong> prejudice that also act as barriers.<br />
PEOPLE<br />
In order to ensure that all human beings can fulfil<br />
their potential in dignity <strong>and</strong> equality <strong>and</strong> in a healthy<br />
environment:<br />
■■<br />
Target marginalized groups consistently left behind<br />
by adequately redistributing existing resources<br />
<strong>and</strong> ramping up funds to improve access to good<br />
quality education.<br />
■■<br />
Support strong investment in early childhood care<br />
<strong>and</strong> education, especially for infants <strong>and</strong> toddlers, who<br />
gain lifelong benefits from participation in integrated<br />
interventions combining stimulation with health care<br />
<strong>and</strong> nutrition supplementation.<br />
■■<br />
Promote partnerships<br />
between education<br />
ministries <strong>and</strong><br />
ministries responsible<br />
for health, water<br />
<strong>and</strong> sanitation, <strong>and</strong><br />
gender issues, to help<br />
simultaneously improve<br />
multiple, linked <strong>and</strong><br />
connected outcomes.<br />
All schools should<br />
provide meals,<br />
access to water <strong>and</strong><br />
sanitation, adequate<br />
gender-specific<br />
toilets <strong>and</strong> childfriendly<br />
spaces<br />
■■<br />
Fund integrated<br />
delivery of basic<br />
services in schools. Ensure that all schools provide<br />
meals, access to water <strong>and</strong> sanitation, adequate<br />
gender-specific toilets <strong>and</strong> child-friendly spaces,<br />
<strong>and</strong> can deliver curricular interventions focused on<br />
behavioural change, such as hygiene education,<br />
sexual <strong>and</strong> reproductive health education, <strong>and</strong> obesity<br />
prevention education.<br />
■■<br />
Provide awareness campaigns <strong>and</strong> training to boost<br />
innovation in service delivery, such as e-government<br />
<strong>and</strong> participatory budgeting.<br />
■■<br />
Fund community-oriented education <strong>and</strong> training<br />
programmes in relation to health <strong>and</strong> sanitation.<br />
■■<br />
Ensure all girls complete primary <strong>and</strong> secondary<br />
education to promote their autonomy <strong>and</strong> decisionmaking<br />
abilities.<br />
■■<br />
Invest in programmes that address gender<br />
stereotypes <strong>and</strong> roles by engaging men <strong>and</strong> women<br />
in group education sessions, youth-led campaigns <strong>and</strong><br />
multipronged empowerment approaches.<br />
■■<br />
Support media-based awareness campaigns, the<br />
development of positive role models <strong>and</strong> other<br />
initiatives to change gender norms inside <strong>and</strong> outside<br />
the education system.<br />
■■<br />
Support efforts to improve participation of girls <strong>and</strong><br />
women in science, technology, arts <strong>and</strong> design, <strong>and</strong><br />
mathematics so as to improve employment prospects.<br />
■■<br />
Support social protection programmes, health<br />
policies <strong>and</strong> child-care support that improve<br />
maternal education <strong>and</strong> facilitate men’s <strong>and</strong> women’s<br />
employment-related decision-making.<br />
2016 • GLOBAL EDUCATION MONITORING REPORT 165
8<br />
PEACE<br />
In order to foster peaceful, just <strong>and</strong> inclusive societies that<br />
are free from fear <strong>and</strong> violence:<br />
■■<br />
Take steps to halt segregation stemming from<br />
increased opportunities to choose between public <strong>and</strong><br />
private schools.<br />
■■<br />
Exp<strong>and</strong> the emphasis on global citizenship <strong>and</strong> peace<br />
education in curricula.<br />
■■<br />
Invest in civic education programmes that contribute<br />
to a functioning justice system, including participation<br />
<strong>and</strong> access for marginalized communities.<br />
■■<br />
Promote learning emphasizing the values of tolerance<br />
<strong>and</strong> peace education to help build less violent <strong>and</strong><br />
more constructive societies.<br />
■■<br />
Teach in children’s mother languages. Countries<br />
with high proportions of minorities should consider<br />
training teachers in methods for teaching secondlanguage<br />
learners, in both initial teacher training <strong>and</strong><br />
professional development.<br />
■■<br />
For refugees <strong>and</strong> internally displaced persons,<br />
implement policies that exp<strong>and</strong> the pool of qualified<br />
teachers proficient in their languages, <strong>and</strong> address the<br />
issue of official validation <strong>and</strong> certification of learning<br />
by refugees. Refugees who were teachers in their<br />
home countries could be an important resource.<br />
■■<br />
Work to reduce school-based violence, including<br />
gender violence, <strong>and</strong> discriminatory attitudes<br />
among teachers.<br />
■■<br />
Develop local autonomy <strong>and</strong> localized system-wide<br />
education planning, especially in populous African <strong>and</strong><br />
Asian cities, considering education as a local as well as<br />
national issue.<br />
■■<br />
Better incorporate education into local, national <strong>and</strong><br />
global agendas focused on improving cities <strong>and</strong> other<br />
human settlements.<br />
■■<br />
Educate <strong>and</strong> engage with those who are<br />
disenfranchised, include them in planning,<br />
<strong>and</strong> collaborate with civil society actors who<br />
work with them.<br />
■■<br />
Fund schools <strong>and</strong> training programmes for slum<br />
dwellers <strong>and</strong> other disadvantaged groups who live in<br />
absolute poverty, so that assistance for them is not<br />
limited to basic services such as housing <strong>and</strong> water<br />
<strong>and</strong> sanitation.<br />
■■<br />
Incorporate education into official foreign policy,<br />
transitional justice efforts <strong>and</strong> the peacebuilding<br />
agenda when trying to prevent <strong>and</strong> recover from<br />
conflict situations.<br />
■■<br />
Ensure curricula <strong>and</strong> learning materials are not biased<br />
or prejudiced against ethnic <strong>and</strong> minority groups.<br />
Engender resilience in students <strong>and</strong> communities<br />
in post-conflict societies through curricula, teacher<br />
training, transitional justice programmes <strong>and</strong><br />
supporting integrated schools.<br />
■■<br />
Fund civil society organizations <strong>and</strong> other<br />
institutions that provide legal <strong>and</strong> political education<br />
in communities.<br />
PLACE<br />
In order to foster sustainable, inclusive <strong>and</strong> prosperous<br />
cities <strong>and</strong> other human settlements:<br />
■■<br />
Ensure urban areas distribute public resources<br />
equitably, including amenities <strong>and</strong> good quality<br />
teachers, so as to promote social inclusion <strong>and</strong> reduce<br />
inequality resulting from education disparity.<br />
■■<br />
Fund urban planning education to increase the<br />
numbers of planners, <strong>and</strong> promote integration of<br />
education as well as multidisciplinary approaches.<br />
■■<br />
Improve urban planning curricula to include crosssector<br />
engagement, community engagement,<br />
learning by doing <strong>and</strong> the development of locally<br />
relevant solutions.<br />
■■<br />
Involve communities in any processes to consolidate<br />
<strong>and</strong> improve schools in rural <strong>and</strong> other areas affected<br />
by population declines due to migration.<br />
■■<br />
Monitor <strong>and</strong> address<br />
any unintended<br />
consequences of the<br />
growth of knowledge<br />
economies, such as<br />
gentrification <strong>and</strong><br />
middle class flight, with<br />
strong economic <strong>and</strong><br />
housing policies to limit<br />
social segregation <strong>and</strong><br />
societal discontent.<br />
We should educate<br />
<strong>and</strong> engage with<br />
those who are<br />
disenfranchised,<br />
<strong>and</strong> include them in<br />
urban planning<br />
166<br />
CHAPTER 8 | EDUCATION AND SUSTAINABLE DEVELOPMENT: CONCLUSIONS AND POLICY RECOMMENDATIONS
8<br />
PARTNERSHIPS<br />
In order to ensure adequate financing, policy coherence<br />
<strong>and</strong> multisector capacity:<br />
■■<br />
Make links with tax authorities <strong>and</strong> others to improve<br />
tax-related knowledge through formal education.<br />
■■<br />
Develop equitable funding mechanisms to address<br />
in-country disparities in education funding.<br />
■■<br />
Use progressive public finance policies to ensure<br />
adequate funding of lower levels of education, <strong>and</strong><br />
combine public allocations <strong>and</strong> a well-designed system<br />
of student grants <strong>and</strong> loans to finance upper levels of<br />
technical, vocational <strong>and</strong> tertiary education.<br />
■■<br />
Increase multilateral aid mechanisms <strong>and</strong> engagement<br />
with the private sector, learning from health sector<br />
efforts to increase <strong>and</strong> diversify funding.<br />
■■<br />
Mobilize domestic resources, stop corporate tax<br />
evasion <strong>and</strong> eliminate fossil fuel subsidies to generate<br />
government revenue for fundamental needs such as<br />
education <strong>and</strong> health.<br />
■■<br />
Provide political <strong>and</strong> financial support for planning <strong>and</strong><br />
implementation of education <strong>and</strong> other activities to be<br />
carried out with an integrated approach to policy <strong>and</strong><br />
development at the national <strong>and</strong> local levels. Develop<br />
knowledge exchange programmes to learn from<br />
successful integrated policies involving education.<br />
■ ■ Support multistakeholder governance for the<br />
sustainable management of natural resources<br />
<strong>and</strong> of public <strong>and</strong> semi-public rural, urban <strong>and</strong><br />
peri-urban spaces.<br />
2016 • GLOBAL EDUCATION MONITORING REPORT 167
Vang Seo Phu, a<br />
9-year-old Hmong,<br />
during a math<br />
class at PS La Pan<br />
Tẩn, Viet Nam.<br />
CREDIT: Nguyen Thanh Tuan/UNESCO<br />
168<br />
CHAPTER 9 | THE CHALLENGES OF MONITORING EDUCATION IN THE SUSTAINABLE DEVELOPMENT GOALS
CHAPTER<br />
9<br />
The challenges<br />
of monitoring<br />
education in<br />
the Sustainable<br />
Development<br />
Goals<br />
Ensure inclusive <strong>and</strong> equitable quality education <strong>and</strong><br />
promote lifelong learning opportunities for all<br />
169
9<br />
KEY MESSAGES<br />
Sustainable Development Goal 4 (SDG 4) <strong>and</strong> its 10 targets represent the vision <strong>and</strong> aspirations<br />
of the global education community for 2030. Their ambition goes beyond any previous global<br />
education agreement.<br />
Monitoring progress towards SDG 4 is critical to show what needs to be done, by when <strong>and</strong> by whom.<br />
The Global Education Monitoring Report has a m<strong>and</strong>ate outlined in the Incheon Declaration <strong>and</strong> the<br />
Education 2030 Framework for Action to monitor <strong>and</strong> report on SDG 4 <strong>and</strong> on education in<br />
the other SDGs.<br />
Many important concepts in the 10 SDG 4 targets are not yet covered by any proposed indicator.<br />
Among those that are covered, several details remain to be fixed in the indicators, <strong>and</strong> this report<br />
aims to inform the debate.<br />
The ambition of SDG 4 is reflected in its focus on improvements in education outcomes, such as<br />
learning achievement; access at post-basic education levels, including upper secondary <strong>and</strong> tertiary<br />
education; its lifelong learning perspective, including adult education; the reduction of disparity in<br />
education based on factors such as wealth, gender <strong>and</strong> location; <strong>and</strong> changes in the content of<br />
education to better align it with the challenges of sustainable development.<br />
There is a huge task ahead for national statistical systems to monitor progress towards SDG 4 <strong>and</strong><br />
for education ministries to make effective use of the new information.<br />
170<br />
CHAPTER 9 | THE CHALLENGES OF MONITORING EDUCATION IN THE SUSTAINABLE DEVELOPMENT GOALS
9<br />
Reaching consensus on the post-2015 education targets....................................172<br />
Opportunities <strong>and</strong> challenges in global education monitoring <strong>and</strong><br />
the role of the GEM Report..................................................................................................175<br />
Outline of the monitoring part..........................................................................................177<br />
The 17 Sustainable Development Goals (SDGs) reflect<br />
the heart of the 2030 Agenda for Sustainable<br />
Development. Goal 4, which focuses on education within<br />
a lifelong learning perspective, represents the vision<br />
<strong>and</strong> aspirations of the global education community<br />
for 2030. With its seven targets <strong>and</strong> three means of<br />
implementation, the fourth SDG represents a level of<br />
ambition for the next 15 years that goes beyond any<br />
previous global education agreement. Education is also<br />
part of all the other SDGs to some extent.<br />
Developing a solid platform for reviewing <strong>and</strong><br />
monitoring progress on the SDGs is crucial to their<br />
success. It will help inform national governments<br />
where headway has been made <strong>and</strong> where more<br />
attention is needed. It will also help intergovernmental<br />
<strong>and</strong> non-government organizations (NGOs) underst<strong>and</strong><br />
what actions should be taken at the global, regional<br />
<strong>and</strong> national levels. It is worth noting, however, that<br />
the very concept of monitoring the SDGs is more<br />
strongly contested than was the case for the Millennium<br />
Development Goals (MDGs), which were perceived to be<br />
more top-down. Finalizing the overall architecture for<br />
monitoring all 17 goals <strong>and</strong> 169 targets with measurable<br />
indicators will take time.<br />
This part of the 2016 Global Education Monitoring<br />
Report presents the challenges of monitoring progress<br />
on education in the 2030 agenda with a particular<br />
focus on SDG 4 <strong>and</strong> its targets. It critically analyses<br />
each target <strong>and</strong> the respective indicators. What concepts<br />
are to be monitored in each target? What indicators<br />
are best suited to the task? Are the indicators already<br />
being measured? If so, what baselines can<br />
be determined? If indicators are not yet measured<br />
or defined, what are the technical challenges <strong>and</strong><br />
steps needed to develop measurement tools? The<br />
discussion<br />
also provides<br />
critical analysis<br />
The monitoring part of<br />
of both the<br />
this Report presents the broad technical<br />
challenges of tracking challenges of<br />
monitoring 10<br />
progress on education in<br />
sometimes poorly<br />
the 2030 Agenda<br />
formulated,<br />
targets, <strong>and</strong><br />
the specific<br />
dem<strong>and</strong>s of developing valid, reliable <strong>and</strong> comparable<br />
measurement tools for new indicators. It also<br />
examines the policy implications of choosing particular<br />
measurement tools.<br />
Against this background, the following chapters ask<br />
what the priorities are for global education monitoring,<br />
<strong>and</strong> where countries <strong>and</strong> organizations need to focus<br />
resources. They examine the institutional, political<br />
<strong>and</strong> technical context within which indicators will be<br />
measured. They also analyse the tools <strong>and</strong> mechanisms<br />
necessary to monitor the components of the agenda,<br />
both looking at existing ones to ask whether they can<br />
be made more efficient or used more effectively, <strong>and</strong><br />
identifying the scope for new ones. These chapters aim<br />
to facilitate the discussions needed to reach consensus,<br />
as a broader agenda means more issues to resolve <strong>and</strong><br />
stakeholders to involve.<br />
2016 • GLOBAL EDUCATION MONITORING REPORT 171
9<br />
REACHING CONSENSUS ON THE<br />
POST-2015 EDUCATION TARGETS<br />
In the years <strong>and</strong> months leading up to the UN General<br />
Assembly decision on the post-2015 development<br />
agenda, it was not known that a st<strong>and</strong>alone global<br />
education goal would be proposed <strong>and</strong> adopted. Some<br />
countries <strong>and</strong> development experts preferred to see<br />
education combined with or subsumed under other goals<br />
in the interest of a more concise agenda.<br />
Yet, the EFA Global Monitoring Report had shown that<br />
education is necessary for the achievement of other<br />
development outcomes (UNESCO, 2014a). And education<br />
had considerable popular support around the world.<br />
It emerged as the top priority among the more than<br />
7 million <strong>people</strong> who contributed to the United Nations’<br />
MY World survey of 2015.<br />
Since 2000, the international education agenda had<br />
been split into two processes: the Education for All<br />
(EFA) goals <strong>and</strong> the MDG agenda. The EFA goals were<br />
broader in scope, covered most education levels <strong>and</strong> had<br />
participatory mechanisms. The narrower MDG agenda<br />
focused on universal primary completion <strong>and</strong> gender<br />
parity in education, <strong>and</strong> was characterized by relatively<br />
top-down governance arrangements. It was not clear<br />
whether these approaches would merge after 2015 or<br />
remain distinct.<br />
Initially, there were concerns that the SDG education<br />
agenda would be as narrow as its MDG predecessor.<br />
In November 2012, the Global EFA Meeting in Paris<br />
emphasized the importance of ‘ensuring that EFA <strong>and</strong><br />
the international development goals are coherent <strong>and</strong><br />
mutually reinforcing’ (UNESCO, 2012a; p.4). This assumed<br />
that two parallel agendas would continue to exist; it was<br />
not then evident that EFA would be subsumed under the<br />
SDGs. The main EFA coordination body, the EFA<br />
Steering Committee, therefore worked towards a set<br />
of targets, which education ministries of a large number<br />
of countries endorsed through the Muscat Declaration<br />
at the Global EFA Meeting in Muscat in May 2014<br />
(UNESCO, 2014b).<br />
Concurrently, the intergovernmental Open Working<br />
Group (OWG) process in New York, which member states<br />
had established in January 2013 to propose the SDGs,<br />
was advancing (see Introduction). UNESCO <strong>and</strong> its EFA<br />
partners had to draw member states’ attention to the<br />
targets in the Muscat Declaration, which eventually was<br />
just one input (albeit timely <strong>and</strong> influential) into the OWG<br />
process that helped determine the formulation of targets<br />
in the OWG outcome document (United Nations, 2014a).<br />
This cumbersome process meant the OWG outcome<br />
document, a product of delicate political negotiations,<br />
was written in language that was sometimes unclear<br />
<strong>and</strong> ambiguous. Member states did not want to disrupt<br />
the balance, so at<br />
the World Education<br />
The Open Working Forum in Incheon,<br />
Republic of Korea,<br />
Group outcome<br />
in May 2015, they<br />
document was written simply approved the<br />
OWG targets.<br />
in a language that was<br />
sometimes unclear<br />
The forum opened<br />
<strong>and</strong> ambiguous<br />
the discussion on<br />
the Education 2030<br />
Framework for Action,<br />
the document that elaborates key concepts <strong>and</strong> outlines<br />
implementation strategies for SDG 4. The framework<br />
was officially endorsed in November 2015 in Paris. Its<br />
extended commentary on issues ranging from teachers<br />
<strong>and</strong> finance to monitoring indicators <strong>and</strong> mechanisms<br />
is the basis upon which much of this report is built<br />
(UNESCO, 2015b).<br />
DIFFERENCES BETWEEN THE EFA GOALS,<br />
THE MDGS AND THE SDGS<br />
The SDGs, unlike the MDGs, bring the four pillars<br />
of sustainable development (economic, social,<br />
environmental <strong>and</strong> institutional) under an integrated<br />
framework. The process that resulted in the SDGs was<br />
more transparent <strong>and</strong> open. Countries, rather than UN<br />
agencies, led the negotiations. The consensus meant<br />
the final product was less elegant <strong>and</strong> concise, having<br />
to accommodate many interests. But there is a stronger<br />
sense that the SDGs apply to all countries <strong>and</strong> are not<br />
being dictated by rich countries to poor countries. The<br />
MDGs were focused on developing countries exclusively,<br />
whereas the SDGs are universally applicable.<br />
The SDG education targets are stronger than the MDGs<br />
in various ways. They draw upon the comprehensive <strong>and</strong><br />
holistic vision of the EFA movement. They recognize<br />
that different levels of education cannot be addressed in<br />
isolation from one another. While the EFA goals sought<br />
to ensure equal access to good quality basic education,<br />
the SDG targets shift attention to higher levels<br />
(e.g. universal secondary completion, equal access<br />
to tertiary education) <strong>and</strong> broader content, such as<br />
172<br />
CHAPTER 9 | THE CHALLENGES OF MONITORING EDUCATION IN THE SUSTAINABLE DEVELOPMENT GOALS
9<br />
skills in information<br />
<strong>and</strong> communication<br />
The SDG education<br />
technology<br />
targets are stronger <strong>and</strong> education<br />
than the Millennium for sustainable<br />
development <strong>and</strong> global<br />
Development Goals in<br />
citizenship. There is<br />
various ways<br />
also a separate target<br />
on ensuring teachers<br />
are well qualified, a key<br />
condition for quality education <strong>and</strong> learning outcomes.<br />
The SDG education targets are also more oriented to<br />
outcomes <strong>and</strong> more closely aligned with a lifelong<br />
learning framework.<br />
On the other h<strong>and</strong>, they are more ambitious, some would<br />
say too much so. For example, it was generally expected<br />
that target 4.1 would focus on universal lower secondary<br />
education, but instead it extended to upper secondary.<br />
While there are strong reasons to raise aspirations, this<br />
report shows that the exp<strong>and</strong>ed target is unattainable.<br />
At past rates of progress, even universal primary<br />
completion is not guaranteed by 2030.<br />
■■<br />
Thematic: The scope of a set of global indicators that<br />
aims to capture the entire development agenda will<br />
be unlikely to fully satisfy the needs of communities<br />
interested in specific goals <strong>and</strong> themes. An additional<br />
set of globally comparable indicators is therefore<br />
needed for individual targets within goals such<br />
as education.<br />
■■<br />
Regional: Some indicators may not be globally<br />
relevant but are essential for regional constituencies<br />
to respond to specific contexts <strong>and</strong> policy priorities.<br />
■■<br />
National: Every country has its own context <strong>and</strong><br />
priorities, which call for tailored monitoring <strong>and</strong><br />
reporting mechanisms.<br />
The UN Statistical Commission established the Interagency<br />
<strong>and</strong> Expert Group on SDG Indicators (IAEG-SDGs)<br />
in March 2015 to develop global indicators for monitoring<br />
the new goals <strong>and</strong> targets. The commission agreed a<br />
list of indicators in March 2016 as a first step before<br />
endorsement by the Economic <strong>and</strong> Social Council in July<br />
2016 <strong>and</strong> adoption by the General Assembly in September.<br />
REACHING CONSENSUS ON EDUCATION<br />
MONITORING INDICATORS AND MECHANISMS<br />
Monitoring progress towards achievement of the targets<br />
is critical to provide guidance for what needs to be done,<br />
by when <strong>and</strong> by whom. However, the SDG process for<br />
determining monitoring indicators <strong>and</strong> mechanisms is<br />
complex <strong>and</strong> political. This is unsurprising given the large<br />
number of targets, the ambiguities in their formulation<br />
<strong>and</strong> the diversity of stakeholders. To better underst<strong>and</strong> the<br />
proposed education monitoring indicators <strong>and</strong> mechanisms,<br />
the process through which the overall SDG monitoring<br />
indicators <strong>and</strong> mechanisms were adopted is described below.<br />
Indicators<br />
The Synthesis Report of the UN Secretary-General on the<br />
Post-2015 Agenda, released in December 2014, offers a<br />
useful framework to underst<strong>and</strong> the layers of monitoring<br />
required (United Nations, 2014b). The report identified<br />
four levels, each of which has distinct implications for<br />
indicator selection:<br />
■■<br />
Global: To monitor the 17 goals <strong>and</strong> 169 targets,<br />
globally comparable indicators are needed. Countries<br />
would commit to report on them <strong>and</strong> the results<br />
would appear in an annual SDG Report that would<br />
succeed the MDG Report.<br />
However, it is widely recognized that further<br />
methodological work is needed. The expert group has<br />
classified the proposed indicators into three tiers,<br />
depending on whether established methodology <strong>and</strong><br />
sufficient data coverage exist. It will work until March<br />
2017 on a plan for further development of indicators<br />
without established methodology. It will also agree on<br />
a global reporting mechanism <strong>and</strong> identify the entities<br />
to be responsible for compiling data for reporting on<br />
individual indicators.<br />
For the education goal, 11 global indicators have been<br />
agreed, based on an original submission by UNESCO<br />
<strong>and</strong> UNICEF, co-chairs of the Technical Support Team<br />
for SDG 4. There is one indicator per target except in the<br />
case of Target 4.2, for which two are proposed. Four are<br />
identified as tier I indicators (‘established methodology<br />
… <strong>and</strong> data regularly produced by countries’), three as<br />
tier II indicators (‘established methodology … but data<br />
are not regularly produced by countries’), two as tier III<br />
indicators (‘no established methodology’) <strong>and</strong> two have<br />
been classified at multiple levels (IAEG-SDGs, 2016).<br />
The 11 global indicators do not by any means capture<br />
the full scope of the agenda. Hence UNESCO set up<br />
a Technical Advisory Group on post-2015 education<br />
indicators to prepare consolidated recommendations<br />
on measurement of an education goal, targets <strong>and</strong><br />
2016 • GLOBAL EDUCATION MONITORING REPORT 173
9<br />
indicators. Its proposed 43 thematic indicators, which<br />
include the 11 global indicators, were incorporated in the<br />
Education 2030 Framework for Action as an annex.<br />
In order to implement <strong>and</strong> develop the thematic<br />
monitoring framework, the Technical Advisory Group has<br />
become the Technical Cooperation Group (TCG) on the<br />
Indicators for SDG4-Education 2030, co-convened by the<br />
UNESCO Institute for Statistics (UIS) <strong>and</strong> the UNESCO<br />
Division of Education 2030 Support <strong>and</strong> Coordination.<br />
Its objective is to promote the production of necessary<br />
data at the country level to enable the reporting of crossnationally<br />
comparable measures.<br />
The TCG mimics some of the features of the IAEG-SDGs.<br />
For example, it includes the 28 countries of the IAEG-<br />
SDGs as members. In addition, at its first meeting in May<br />
2016, the TCG discussed a classification of indicators like<br />
the one used by the IAEG-SDGs. As part of this process,<br />
it identified eight tier III indicators that need further<br />
work, either because they are not sufficiently aligned<br />
with the concept or because implementation challenges<br />
are envisaged (UIS, 2016d).<br />
Mechanisms<br />
Transforming Our World: The 2030 Agenda for Sustainable<br />
Development, the foundation document of the post-<br />
2015 era, expresses member states’ clear intention to<br />
take a stronger role in monitoring mechanisms. This<br />
accountability for achievement of international goals is<br />
built on a commitment to a ‘robust, voluntary, effective,<br />
participatory, transparent <strong>and</strong> integrated follow-up <strong>and</strong><br />
review framework’ to ‘track progress in implementing<br />
this Agenda’ (United Nations, 2015c; §72). Details of<br />
these mechanisms were spelled out in the UN Secretary-<br />
General’s report on ‘critical milestones’ in January 2016<br />
(United Nations, 2016) <strong>and</strong> are expected to be adopted<br />
through a General Assembly resolution.<br />
At the global level, the High-Level Political Forum<br />
(HLPF) on Sustainable Development is the UN platform<br />
for follow-up <strong>and</strong> review of the 2030 agenda. It will<br />
be held every four years under the auspices of the<br />
General Assembly <strong>and</strong> in the intervening years under<br />
the auspices of the Economic <strong>and</strong> Social Council. Its<br />
m<strong>and</strong>ate is to provide political leadership, guidance <strong>and</strong><br />
recommendations on implementation <strong>and</strong> follow-up,<br />
keep track of progress <strong>and</strong> encourage coherent policies<br />
informed by evidence, science <strong>and</strong> country experiences,<br />
as well as address new <strong>and</strong> emerging issues.<br />
Two documents will support the HLPF global follow-up<br />
<strong>and</strong> review process. First, the annual SDG Report will<br />
be prepared by the Secretary-General, in cooperation<br />
with the UN system <strong>and</strong> based on the global indicator<br />
framework. A glossy variant for the wider public follows<br />
the model of the MDG Report prepared by the UN<br />
Department of Economic <strong>and</strong> Social Affairs since 2005.<br />
UNESCO is the reporting agency for SDG 4.<br />
Second, a Global Sustainable Development Report will<br />
provide ‘a strong evidence-based instrument to support<br />
policymakers in promoting poverty eradication <strong>and</strong><br />
sustainable development’ (United Nations, 2015c; §83).<br />
A first edition was published in July 2015. Originally<br />
conceived as an annual document, it is now expected<br />
to be published every four years, when the HLPF is held<br />
under General Assembly auspices.<br />
Each year, the HLPF is expected to carry out at least two<br />
sets of reviews. First, there will be voluntary national<br />
reviews of countries’ contributions to the agenda, <strong>and</strong><br />
for the first time a platform will be offered to other<br />
stakeholders, such as NGOs, to do the same. Second,<br />
there will be thematic reviews of progress. In the July<br />
2016 HLPF, the selected cross-cutting theme was<br />
‘Ensuring that no one is left behind’. In each of the next<br />
three years, the theme will be linked to a set of goals,<br />
ensuring that all goals are reviewed over the course of<br />
a four-year cycle. Education is scheduled for review in<br />
2019 under the theme ‘Empowering <strong>people</strong> <strong>and</strong> ensuring<br />
inclusiveness’; health, gender, inequality, <strong>and</strong> peaceful<br />
<strong>and</strong> inclusive societies will also be covered then.<br />
At the thematic level, it is envisaged that global follow-up<br />
<strong>and</strong> review mechanisms will ‘build on existing platforms<br />
<strong>and</strong> processes, where these exist’ (United Nations, 2015c;<br />
§74f). The HLPF is the apex of a network of follow-up<br />
<strong>and</strong> review processes <strong>and</strong> its thematic reviews should<br />
be supported by intergovernmental bodies <strong>and</strong> forums,<br />
‘where much of the real discussion, analysis <strong>and</strong> eventual<br />
follow-up must take place’ (Halle <strong>and</strong> Wolfe, 2016, p.3).<br />
In the case of education, the Secretary-General’s January<br />
2016 report identified the World Education Forum as one<br />
intergovernmental mechanism upon which the global<br />
follow-up <strong>and</strong> review process should build. The forum,<br />
in its Incheon Declaration, requested ‘an independent<br />
Global Education Monitoring Report (GEMR), hosted <strong>and</strong><br />
published by UNESCO, as the mechanism for monitoring<br />
<strong>and</strong> reporting on the proposed SDG 4 <strong>and</strong> on education<br />
174<br />
CHAPTER 9 | THE CHALLENGES OF MONITORING EDUCATION IN THE SUSTAINABLE DEVELOPMENT GOALS
9<br />
The Incheon Declaration requested an independent<br />
Global Education Monitoring Report, hosted <strong>and</strong><br />
published by UNESCO, for monitoring SDG 4<br />
“<br />
”<br />
in the other proposed SDGs, within the mechanism to be<br />
established to monitor <strong>and</strong> review the implementation<br />
of the proposed SDGs’ (UNESCO, 2015b; §18). The report<br />
had already been identified as a follow up <strong>and</strong> review<br />
mechanism in a United Nations Technical Support Team<br />
inventory (United Nations, 2015b).<br />
As the World Education Forum was convened only<br />
three times between 1990 <strong>and</strong> 2015, the Education<br />
2030 Framework for Action identified the SDG4–<br />
Education 2030 Steering Committee as the main global<br />
coordination body supporting member states <strong>and</strong><br />
partners in achieving Education 2030. The committee will<br />
‘provide strategic guidance, review progress drawing on<br />
the GEMR, <strong>and</strong> make recommendations to the education<br />
community on key priorities <strong>and</strong> catalytic actions to<br />
achieve the new agenda; monitor <strong>and</strong> advocate for<br />
adequate financing; <strong>and</strong> encourage harmonization <strong>and</strong><br />
coordination of partner activities’ (UNESCO, 2015b;<br />
§94). The framework also reiterates the m<strong>and</strong>ate of the<br />
report, including as a mechanism for monitoring ‘the<br />
implementation of national <strong>and</strong> international strategies<br />
to help hold all relevant partners to account for their<br />
commitments’ (UNESCO, 2015b; §101).<br />
OPPORTUNITIES AND<br />
CHALLENGES IN GLOBAL<br />
EDUCATION MONITORING AND<br />
THE ROLE OF THE GEM REPORT<br />
The global follow-up <strong>and</strong> review, together with the<br />
thematic, education-specific monitoring <strong>and</strong> reporting<br />
mechanisms, are an elaborate set of new processes<br />
that will be developed in coming years. The Global<br />
Education Monitoring Report (GEM Report) has a<br />
recognized m<strong>and</strong>ate to help the international<br />
community, through established structures <strong>and</strong><br />
channels, to underst<strong>and</strong> whether <strong>and</strong> how the world<br />
is making progress in education. But while the report<br />
is seen as having fulfilled its m<strong>and</strong>ate during the EFA<br />
period, the more complex new agenda will require<br />
adjustments (UNESCO, 2016c).<br />
The global education monitoring l<strong>and</strong>scape is rapidly<br />
changing with the exp<strong>and</strong>ed scope of the sustainable<br />
development agenda. While a set of monitoring<br />
indicators has been formulated, the methodology for<br />
measuring many of them is yet to be developed. In<br />
addition, many indicators only partly cover the concepts<br />
that feature in each target. Alternative ways to measure<br />
<strong>and</strong> monitor at the national <strong>and</strong> regional levels can,<br />
<strong>and</strong> should, also be explored. There is a need for open<br />
discussion <strong>and</strong> debate to help stakeholders move to<br />
consensus on establishing a monitoring approach.<br />
The role of the GEM Report is crucial in that respect.<br />
Between 2002 <strong>and</strong> 2015, as the EFA Global Monitoring<br />
Report, it took a critical look at global progress in<br />
education <strong>and</strong> lifelong learning, using available indicators,<br />
questioning their usefulness, reflecting on the quality of<br />
sources <strong>and</strong> introducing new ways of looking at evidence<br />
<strong>and</strong> advocating for improvement. These are functions the<br />
new series will continue to carry out in coming years.<br />
The GEM Report recognizes the strengths of measurement<br />
<strong>and</strong> the dem<strong>and</strong> for it – as well as its limits – but also the<br />
need for transparency. Indeed, the report team is aware<br />
that indicators are not merely technical constructions<br />
but also reflect overlapping interests, often of a political<br />
nature. Given their potential influence on country efforts,<br />
donor assessments <strong>and</strong> civil society advocacy, the report<br />
will carefully scrutinize what indicators are reported <strong>and</strong><br />
how they are interpreted.<br />
Finally, the monitoring part of this report has<br />
acknowledged limitations. While it tries to address<br />
the full spectrum of education provision from a global<br />
perspective, many, if not most, major issues in education<br />
2016 • GLOBAL EDUCATION MONITORING REPORT 175
9<br />
are context-specific <strong>and</strong> difficult to generalize or<br />
compare. Nor is it known to what extent the results<br />
of monitoring exercises will help schools facilitate<br />
learning environments <strong>and</strong> teachers improve teaching<br />
<strong>and</strong> learning processes in classrooms. These <strong>and</strong> related<br />
issues cannot be addressed through statistical tables,<br />
however well aligned with SDG 4 targets. The GEM<br />
Report is intended to provide readers with ways to<br />
frame <strong>and</strong> interpret quantitative evidence supplemented<br />
with policy analysis <strong>and</strong> in-depth exploration of<br />
annual themes.<br />
THE LEVEL OF AMBITION IS HIGH, BUT<br />
CAUTION IS NEEDED<br />
Overall, the SDG 4 global indicators match the ambition<br />
of the agenda <strong>and</strong> greatly exp<strong>and</strong> the scope of education<br />
monitoring. The MDG indicators were narrower,<br />
measuring the primary enrolment rate, the survival rate<br />
to the last grade of primary school, the adult literacy rate<br />
<strong>and</strong> gender parity.<br />
need resolution, from defining the ‘participation rate<br />
in technical-vocational education programmes’ to<br />
demonstrating what are ‘relevant <strong>and</strong> effective learning<br />
outcomes’ in primary <strong>and</strong> secondary education <strong>and</strong><br />
an ‘adequate underst<strong>and</strong>ing of issues relating to<br />
global citizenship<br />
<strong>and</strong> sustainability’.<br />
Organizational<br />
There will be a gap mechanisms need<br />
of quite a few years to be established to<br />
address such questions<br />
during which there<br />
<strong>and</strong> develop tools for<br />
may be no or limited measurement. Even<br />
reporting on several as countries begin to<br />
agree on definitions<br />
global indicators<br />
<strong>and</strong> methods, <strong>and</strong><br />
invest in monitoring<br />
capacity, there will<br />
be a gap of quite a few years during which there may<br />
be no reporting on several global indicators, or limited<br />
reporting in terms of country coverage.<br />
There is a distinct emphasis in the SDG indicators on<br />
outcomes – in other words, the consequences of the<br />
experience of education on children, youth <strong>and</strong> adults.<br />
These outcomes include minimum proficiency levels<br />
in reading <strong>and</strong> mathematics, readiness for school <strong>and</strong><br />
digital literacy skills.<br />
Another change is the clear shift to disaggregation:<br />
analysing education participation <strong>and</strong> outcome<br />
indicators by individual demographic <strong>and</strong> socio-economic<br />
characteristics. The only equivalent MDG indicator was<br />
the gender parity index in enrolment rates by level of<br />
education. The inclusion of other characteristics, notably<br />
location <strong>and</strong> wealth, is a consequence of increasing<br />
availability of information sources from school <strong>and</strong><br />
household surveys in the last two decades, which now<br />
permit comparison across countries.<br />
The third change from the MDG indicators is interest<br />
in the content of education – in particular, the<br />
mainstreaming of education for sustainable development<br />
<strong>and</strong> global citizenship through curricula, textbooks <strong>and</strong><br />
teacher preparation.<br />
The complementary Education 2030 thematic indicators<br />
are better aligned with the concepts in the SDG 4 targets.<br />
However, this higher ambition has consequences.<br />
It will require major investment of resources <strong>and</strong><br />
building of capacity at the national level. Many issues<br />
The tasks for national statistical systems in the area of<br />
education could be enormous. While some are hopeful<br />
that a data revolution will allow poorer countries to<br />
leapfrog costly traditional data collection mechanisms,<br />
improved coordination <strong>and</strong> capacity-building will still<br />
be needed. Tough decisions will have to be made to<br />
prioritize actions <strong>and</strong> focus on what is most important.<br />
Moreover, the proposed indicators, however ambitious,<br />
still do not cover the full range of concepts in SDG 4<br />
targets, as the following chapters will show.<br />
A different concern is related to potential unintended<br />
consequences of quantitative indicators <strong>and</strong><br />
international comparisons. Critics believe unchecked<br />
use of indicators misleads by oversimplifying reality,<br />
discouraging discussion about data quality <strong>and</strong><br />
distorting priorities. Much of the criticism concerns<br />
excessive use of composite indices, which carry<br />
particular ideas or theories about what countries should<br />
do. The content of such indices is often not openly<br />
debated <strong>and</strong> yet they exert undue influence on policies<br />
(Kelley <strong>and</strong> Simmons, 2015).<br />
Within <strong>and</strong> beyond the international education<br />
community, the generalized use of rankings of schools,<br />
higher education institutions <strong>and</strong> countries is often<br />
seen as reducing education to the lowest common<br />
denominator. Critics say rankings remove education<br />
from its context, ignore content <strong>and</strong> do not necessarily<br />
176<br />
CHAPTER 9 | THE CHALLENGES OF MONITORING EDUCATION IN THE SUSTAINABLE DEVELOPMENT GOALS
9<br />
offer policy-makers sufficient information to work<br />
towards improving learning (Goldstein <strong>and</strong> Moss, 2014).<br />
There is also the problem of deriving relevant <strong>and</strong><br />
informative policy information for a particular case or<br />
country from cross-national statistics <strong>and</strong> patterns.<br />
The challenge is how to make effective use of the kind of<br />
information cross-national <strong>and</strong> comparative education<br />
monitoring can provide. For example, an indicator on how<br />
many children achieve a minimum level of proficiency<br />
in mathematics based on a nationally representative<br />
sample should highlight the plight of millions of<br />
disadvantaged children, especially in poorer countries.<br />
Such is the traditional use of statistics as tools for proof<br />
<strong>and</strong> coordination (Desrosieres, 2010), <strong>and</strong> it is a far cry<br />
from the generalized use of st<strong>and</strong>ardized tests that<br />
assess each student <strong>and</strong> evaluate each teacher, as in<br />
some high income countries. This report st<strong>and</strong>s ready to<br />
bring the best in comparative education measurement<br />
while cautioning against the misuse of such information.<br />
OUTLINE OF THE<br />
MONITORING PART<br />
The monitoring part of the 2016 GEM Report presents<br />
the wide-ranging challenges <strong>and</strong> debates involving<br />
monitoring for the Education 2030 agenda <strong>and</strong> how<br />
countries <strong>and</strong> the international community can move<br />
forward. It is organized into 15 chapters.<br />
The next 10 (Chapters 10–19) look separately at each of<br />
the 7 education targets <strong>and</strong> 3 means of implementation.<br />
They identify the concepts that are explicitly or implicitly<br />
embedded in the target formulation. Each chapter<br />
discusses how the concepts are articulated within the<br />
proposed global <strong>and</strong> thematic indicators. They focus<br />
primarily on the extent to which the methodology of<br />
the indicators is established, <strong>and</strong> on identifying tools<br />
currently available to collect relevant data.<br />
there is no dedicated SDG target, though the<br />
Education 2030 Framework for Action gives a clear<br />
set of recommendations. Using a framework provided<br />
by national education accounts, the chapter discusses<br />
prospects for better data on public spending, aid <strong>and</strong><br />
household expenditure. Chapter 21 reflects on the<br />
fact that some proposed indicators are about neither<br />
inputs nor outcomes but instead relate to growing<br />
interest in the role of education systems. It provides<br />
an overview of available mechanisms <strong>and</strong> the scope<br />
for better coordination, especially at the regional<br />
level. Chapter 22 looks at all targets under other<br />
SDG goals, as well as the corresponding global indicators,<br />
to identify those where education is mentioned directly<br />
or indirectly.<br />
The monitoring part of the GEM Report tries not to be<br />
prescriptive but rather to make a timely contribution to<br />
the debate on what should be monitored <strong>and</strong> how. The<br />
state of global education monitoring is in flux. Many<br />
initiatives are under way to respond to the challenges of<br />
the proposed indicator frameworks.<br />
This comprehensive overview of the global education<br />
monitoring challenges offers insights, brings together<br />
disparate pieces of information <strong>and</strong> identifies<br />
stakeholders whose work needs recognition <strong>and</strong><br />
coordination. Given that implementing such an agenda<br />
may be daunting <strong>and</strong> confusing, especially for countries,<br />
the GEM Report’s monitoring part is meant to support<br />
countries <strong>and</strong> partners as they discuss <strong>and</strong> determine<br />
the best steps forward in achieving SDG 4. To conclude,<br />
Chapter 23 draws attention to common themes <strong>and</strong><br />
missing pieces in this discussion – <strong>and</strong> identifies building<br />
blocks <strong>and</strong> potential synergies for a more effective<br />
<strong>and</strong> efficient global education monitoring agenda<br />
over the next 15 years at the national, regional <strong>and</strong><br />
international levels.<br />
To the extent that methodology is established <strong>and</strong><br />
information available for a sufficient number of<br />
countries, indicative baseline information is presented.<br />
Approaches for monitoring areas not yet covered by the<br />
proposed indicators are also discussed. At the same time,<br />
it is also too early to provide definitive data for 2015 at<br />
the end of the EFA period.<br />
Chapters 20 to 22 address cross-cutting issues.<br />
Chapter 20 discusses education finance, for which<br />
2016 • GLOBAL EDUCATION MONITORING REPORT 177
10<br />
Children peek<br />
through a primary<br />
school window in<br />
Indonesia.<br />
CREDIT: All<strong>and</strong> Dharmawan/UNESCO<br />
KEY MESSAGES<br />
Progress towards this target will be a key measure of commitment to the SDGs.<br />
Universal access to primary education is far from achieved. As of 2014, about 25 million children worldwide were<br />
not expected ever to attend school.<br />
In 2014, 263 million children, adolescents <strong>and</strong> youth were out of school around the world.<br />
Universal secondary completion seems unattainable by 2030: Over 2008–2014, the upper secondary completion rate<br />
was 84% in high income, 43% in upper middle income, 38% in lower middle income <strong>and</strong> 14% in low income countries.<br />
There is a long way to go to ensure that every child completes 12 years of primary <strong>and</strong> secondary education. Out<br />
of 90 low <strong>and</strong> middle income countries, youth had attained at least 12 years of education, on average, in only 10.<br />
In 23% of countries, the law requires fewer than nine years of compulsory education. To know whether education<br />
is also really free requires knowing how much households contribute to the total cost.<br />
Global indicators capture quality only through learning outcomes, which is not sufficient. Better data are needed on<br />
inputs such as textbook availability, <strong>and</strong> processes through tools to monitor what is happening in the classroom.<br />
There is no common definition yet of what are ‘relevant <strong>and</strong> effective’ learning outcomes that would enable a global<br />
learning measure to be calculated from different international, regional <strong>and</strong> national assessments.<br />
Decisions on such definitions need to be taken in a way that is open <strong>and</strong> collaborative <strong>and</strong> puts the priorities of<br />
countries first by helping build national learning assessment systems.<br />
178<br />
CHAPTER 10 | TARGET 4.1 – PRIMARY AND SECONDARY EDUCATION
10<br />
CHAPTER 10<br />
Sustainable Development Goal 4.1<br />
TARGET 4.1<br />
Primary <strong>and</strong> secondary<br />
education<br />
By 2030, ensure that all girls <strong>and</strong> boys complete free, equitable <strong>and</strong> quality primary<br />
<strong>and</strong> secondary education leading to relevant <strong>and</strong> effective learning outcomes<br />
GLOBAL INDICATOR 4.1.1 – Percentage of children <strong>and</strong> young <strong>people</strong>: (a) in grades 2/3; (b) at the end of primary;<br />
<strong>and</strong> (c) at the end of lower secondary achieving at least a minimum proficiency level in (i) reading <strong>and</strong> (ii) mathematics,<br />
by sex<br />
THEMATIC INDICATOR 2 – Administration of a nationally representative learning assessment (i) during<br />
primary, (ii) at the end of primary <strong>and</strong> (iii) at the end of lower secondary education<br />
THEMATIC INDICATOR 3 – Gross intake ratio to the last grade (primary, lower secondary)<br />
THEMATIC INDICATOR 4 – Completion rate (primary, lower secondary, upper secondary)<br />
THEMATIC INDICATOR 5 – Out-of-school rate (primary, lower secondary, upper secondary)<br />
THEMATIC INDICATOR 6 – Percentage of children over-age for grade (primary, lower secondary)<br />
THEMATIC INDICATOR 7 – Number of years of (i) free <strong>and</strong> (ii) compulsory primary <strong>and</strong> secondary education<br />
guaranteed in legal frameworks<br />
2016 • GLOBAL EDUCATION MONITORING REPORT 179
10<br />
Access, participation <strong>and</strong> completion...........................................................................180<br />
Compulsory <strong>and</strong> free education....................................................................................... 185<br />
Quality........................................................................................................................................... 188<br />
Learning outcomes..................................................................................................................193<br />
Target 4.1 envisages the attainment of universal<br />
primary <strong>and</strong> secondary completion as a means<br />
of improving learning. These two education levels<br />
attract the largest share of education resources by<br />
governments. Progress towards the target will be a<br />
key way to demonstrate commitment to achieving<br />
Sustainable Development Goal (SDG) 4.<br />
Target 4.1 combines,<br />
modifies <strong>and</strong> extends the<br />
Progress towards<br />
corresponding formulations<br />
this target will of Education for All (EFA)<br />
be a key measure goals 2, on universal primary<br />
education, <strong>and</strong> 6, on quality.<br />
of commitment<br />
The characterization of<br />
to SDG 4<br />
the learning outcomes<br />
to be achieved has been<br />
changed from ‘recognized<br />
<strong>and</strong> measurable’, as found in the EFA formulation, to<br />
‘relevant <strong>and</strong> effective’. Overall expectations of the<br />
target have been raised considerably because of the new<br />
formulation’s scope, the proposed monitoring indicators<br />
<strong>and</strong> the recommendation that these indicators be<br />
disaggregated by individual characteristics.<br />
Detractors argue that a push for universal upper<br />
secondary completion will (a) distract from the priority<br />
of ensuring at least 10 years of basic education for<br />
all, including one year of pre-primary education; the<br />
Global Education Monitoring Report (GEM Report)<br />
reaffirms that even universal primary completion will<br />
not be attained by 2030 if recent trends continue (see<br />
Chapter 7); <strong>and</strong> (b) reduce the offering of diversified<br />
<strong>and</strong> more relevant programmes at this level, especially<br />
opportunities for technical <strong>and</strong> vocational education<br />
<strong>and</strong> training.<br />
This chapter reviews existing <strong>and</strong> potential indicators for<br />
each concept included in target 4.1. Issues of equity are<br />
briefly touched upon but are covered in greater detail<br />
in other chapters, especially Chapters 14 (on equity) <strong>and</strong><br />
20 (on finance).<br />
ACCESS, PARTICIPATION<br />
AND COMPLETION<br />
SDG 4, the education goal of the 2030 Agenda for<br />
Sustainable Development, brings universal primary <strong>and</strong><br />
secondary education under a single target. This allows<br />
a coherent approach on all indicators that track the<br />
progress of children, adolescents <strong>and</strong> youth through<br />
about 12 years of formal education, from entry in the<br />
first grade of primary to the end of secondary education.<br />
ACCESS<br />
As the new international education agenda opens, it should<br />
not be forgotten that millions of children in low <strong>and</strong><br />
lower middle income countries do not even begin school.<br />
The issue of children being denied access to education<br />
remains unresolved <strong>and</strong> needs to be monitored closely.<br />
The UNESCO Institute for Statistics (UIS) breaks down<br />
the total estimated number of out-of-school children<br />
into those who will never go, those who will eventually<br />
go <strong>and</strong> those who were enrolled but left. The first step<br />
is identifying the age at which the highest school<br />
participation rate is observed. The proportion of children<br />
not participating at that age is used as a proxy for the<br />
rate of children who will never participate across all ages<br />
(UIS <strong>and</strong> UNICEF, 2005). As of 2014, about 41% or 25<br />
million children of the current primary school-age cohort<br />
will never enrol in school. Two-thirds of them are girls.<br />
180<br />
CHAPTER 10 | TARGET 4.1 – PRIMARY AND SECONDARY EDUCATION
10<br />
FIGURE 10.1:<br />
More than 4 in 10 children not in school will never enrol<br />
Distribution of out-of-school children by school exposure, world <strong>and</strong> selected regions, 2014<br />
Female<br />
Southern Asia<br />
Male<br />
Female<br />
Sub-Saharan Africa<br />
Male<br />
Female<br />
Caucasus/C. Asia<br />
Male<br />
11<br />
19<br />
27<br />
11<br />
42<br />
41<br />
45<br />
50<br />
12<br />
62<br />
12<br />
81<br />
14<br />
18<br />
18<br />
17<br />
78<br />
69<br />
12<br />
61<br />
44<br />
42<br />
38<br />
33<br />
10<br />
26<br />
9<br />
FIGURE 10.2:<br />
Almost 30% of the poorest children in low income<br />
countries have never been to school<br />
Distribution of out-of-school children by school exposure,<br />
world <strong>and</strong> selected regions, 2014<br />
Never been to school (%)<br />
40<br />
30<br />
20<br />
29<br />
18<br />
17<br />
Poorest<br />
Average<br />
Richest<br />
Female<br />
Latin America/Caribbean<br />
Male<br />
Female<br />
World<br />
14<br />
12<br />
10<br />
11<br />
17<br />
23<br />
41<br />
47<br />
20<br />
21<br />
75<br />
71<br />
67<br />
39<br />
32<br />
10<br />
0<br />
7<br />
Low income<br />
countries<br />
7<br />
1<br />
Lower middle<br />
income<br />
countries<br />
3<br />
2<br />
0<br />
Upper middle<br />
income<br />
countries<br />
Male<br />
Source: UIS database.<br />
35<br />
Expected never<br />
to enrol<br />
19<br />
Enrolled but<br />
dropped out<br />
46<br />
Expected to<br />
enrol late<br />
Note: The estimate is calculated for those who are 1 to 3 years<br />
above primary school graduation age, which approximately<br />
corresponds to adolescents aged 12 to 14.<br />
Source: GEM Report team analysis (2016) using household<br />
surveys.<br />
In low <strong>and</strong> middle income countries, where 10% of<br />
children of primary school age were out of school in<br />
2014, 4% of the current cohort of children will never go<br />
to school. The magnitude of the challenge is highest<br />
in Southern Asia, where 62% of children not in school<br />
are expected never to enrol; the proportion rises to 81%<br />
among girls (Figure 10.1).<br />
Household surveys provide complementary information<br />
on access to education. Parents <strong>and</strong> guardians are<br />
directly asked whether each child has ever attended<br />
school. But survey data are available only with a time lag<br />
<strong>and</strong> therefore overestimate the percentage of those who<br />
have never been to school. What survey-based estimates<br />
may lack in timeliness <strong>and</strong> precision, however, they make<br />
up with information on disparity in access to school. For<br />
example, in lower middle income countries, while just 1%<br />
of children from the richest households have never been<br />
to school, the corresponding share from the poorest<br />
households is 17%, <strong>and</strong> in low income countries almost<br />
30% of children from the poorest households have never<br />
been to school (Figure 10.2).<br />
PARTICIPATION<br />
Target 4.1 draws attention to participation not only<br />
in primary <strong>and</strong> lower secondary but also in upper<br />
secondary education. In doing so, it extends the scope of<br />
monitoring into an education level that in most countries<br />
is not compulsory <strong>and</strong> consists of diverse tracks<br />
<strong>and</strong> programmes.<br />
The key indicator for monitoring participation, <strong>and</strong> the<br />
basis for calculating the number of those out of school,<br />
is the adjusted net enrolment rate. At the primary<br />
education level, it is the percentage of children in the<br />
official primary age group who are in primary school<br />
or above; enrolment in pre-primary education, the<br />
level below, is not included. But at the lower secondary<br />
education level, the rate is the percentage of those in the<br />
2016 • GLOBAL EDUCATION MONITORING REPORT 181
10<br />
age group who are in school regardless of level, including<br />
primary education, the level immediately below. This<br />
asymmetry is unjustified. Consideration should be given<br />
to amending the definition of the primary adjusted net<br />
enrolment rate to include children in pre-primary school,<br />
if only because the likelihood these children will continue<br />
into primary school is very high.<br />
This should be borne in mind when interpreting the<br />
adjusted net enrolment rates of 91% for primary<br />
education <strong>and</strong> 84% for lower secondary education<br />
in 2014.<br />
An important innovation for participation indicators<br />
is the addition of the upper secondary adjusted net<br />
enrolment rate, which was 63% in 2014. It ranged from<br />
40% in low income countries to 52% in lower middle<br />
income countries, 77% in upper middle income countries<br />
<strong>and</strong> 92% in high income countries (Table 10.1).<br />
Worldwide, according to these indicators, some 263<br />
million are not in school – including 61 million children<br />
of primary school<br />
age, 60 million<br />
adolescents of lower<br />
In 2014, 263 million secondary school age<br />
children, adolescents <strong>and</strong> 142 million youth<br />
of upper secondary<br />
<strong>and</strong> youth were out of<br />
school age. Subschool<br />
around the world Saharan Africa is the<br />
region with the most<br />
children out of school<br />
(31 million, 52% of the total) <strong>and</strong> adolescents out of<br />
school (24 million, 39%). Southern Asia is the region with<br />
the most out-of-school youth of upper secondary age<br />
(69 million, 48%).<br />
Gender disparity exists between primary school-age<br />
children: 9.7% of girls, but 8.1% of boys, are out of school.<br />
The gap is largest in Western Asia (5.6 percentage<br />
points). While there is no gender gap overall among<br />
adolescents of lower secondary school age <strong>and</strong> youth of<br />
upper secondary school age, disparity in participation<br />
in individual regions exists. Among youth of upper<br />
secondary school age, there is a 7 percentage point gap<br />
at the expense of females in sub-Saharan Africa, but an<br />
8 percentage point gap at the expense of males in<br />
Eastern Asia.<br />
Due to large differences in population size, the countries<br />
with the highest numbers of out-of-school children,<br />
adolescents <strong>and</strong> youth are rarely those with the highest<br />
out-of-school rates (Table 10.2). For example, India has<br />
achieved universal primary enrolment with an adjusted<br />
net enrolment rate of 98%, but has the second-highest<br />
number of children out of school among countries<br />
with data.<br />
For many countries, data are missing <strong>and</strong> have been<br />
imputed to allow the estimation of regional <strong>and</strong><br />
global numbers. Examples in the case of out-of-school<br />
children of primary school age include Afghanistan, the<br />
Democratic Republic of the Congo <strong>and</strong> Nigeria, which<br />
might otherwise have been near the top of the list.<br />
TABLE 10.1:<br />
Primary <strong>and</strong> secondary education participation indicators, 2014<br />
Adjusted net enrolment rate (%)<br />
Out of school (millions)<br />
Primary Lower secondary Upper secondary<br />
Children of primary<br />
school age<br />
Adolescents of lower<br />
secondary school age<br />
Youth of upper secondary<br />
school age<br />
World 91 84 63 60.9 60.2 141.8<br />
Low income 81 65 40 18.9 16.8 23.2<br />
Lower middle income 90 80 52 30.9 34.9 91.7<br />
Upper middle income 95 93 77 8.3 7.2 22.9<br />
High income 97 98 92 2.8 1.3 4.0<br />
Caucasus <strong>and</strong> Central Asia 94 96 84 0.3 0.3 0.6<br />
Eastern <strong>and</strong> South-eastern Asia 96 91 77 6.2 8.2 19.5<br />
Europe <strong>and</strong> Northern America 97 98 92 2.2 1.0 3.2<br />
Latin America <strong>and</strong> the Caribbean 94 92 76 3.6 2.8 7.5<br />
Northern Africa <strong>and</strong> Western Asia 89 86 67 5.5 3.6 8.5<br />
Pacific 94 98 66 0.2 0.0 0.5<br />
Southern Asia 94 80 50 11.4 20.7 68.7<br />
Sub-Saharan Africa 80 66 43 31.4 23.6 33.1<br />
Source: UIS database.<br />
182<br />
CHAPTER 10 | TARGET 4.1 – PRIMARY AND SECONDARY EDUCATION
10<br />
TABLE 10.2:<br />
Countries with the largest out-of-school numbers <strong>and</strong> rates, 2014 or latest available year<br />
Out-of-school rate (%)<br />
Primary school age Lower secondary school age Upper secondary school age Children of primary school age<br />
Out of school (millions)<br />
Adolescents of lower secondary<br />
school age<br />
Youth of upper secondary<br />
school age<br />
Liberia 62 Niger 70 Niger 89 Pakistan 5.6 India 11.1 India 46.8<br />
Eritrea 59 Eritrea 62 C. A. R. 84 India 2.9 Pakistan 5.5 Pakistan 10.4<br />
Sudan 45 C. A. R. 55 Burkina Faso 77 Sudan 2.7 Ethiopia 3.6 Indonesia 4.0<br />
Djibouti 43 Guinea 52 Mauritania 73 Ethiopia 2.1 Indonesia 1.9 Mexico 3.0<br />
Equat. Guinea 42 Pakistan 48 Mozambique 71 Indonesia 2.0 Myanmar 1.9 Brazil 1.8<br />
Source: UIS database.<br />
The percentage of out-of-school children who live in<br />
conflict-affected countries increased from 29% in 2000<br />
to 35% in 2014 (21.5 million children); among girls, it was<br />
37%. In Northern Africa <strong>and</strong> Western Asia, the share<br />
increased from 63% in 2000 to 91% in 2014. Globally,<br />
the percentage of out-of-school adolescents who live in<br />
conflict-affected countries also increased from 21% to<br />
25% over the same period.<br />
As mentioned above, caution is needed in interpreting<br />
the percentage of adolescents <strong>and</strong> youth in school.<br />
In Mozambique, 71% of adolescents in school were<br />
enrolled at the primary level in 2014. High percentages<br />
of students at a lower education level than the one<br />
expected for their age are cause for concern. An<br />
important factor that is linked to leaving school,<br />
especially at the secondary education level, is over-age<br />
students – generally due to a combination of late entry<br />
to school <strong>and</strong> repetition.<br />
The global share of repeaters in primary education was<br />
3.8% in 2014, but regional figures ranged from 0.1% in<br />
Caucasus <strong>and</strong> Central Asia to 5.9% in Northern Africa <strong>and</strong><br />
Western Asia <strong>and</strong> 8.3% in sub-Saharan Africa. The share of<br />
repeaters at the secondary level was 3.9%, with figures as<br />
high as 8.9% in Latin America <strong>and</strong> the Caribbean <strong>and</strong> 12.1%<br />
in sub-Saharan Africa.<br />
the over-age pattern in<br />
primary education by<br />
The countries with the<br />
an average difference<br />
10 highest proportions of at least 7 percentage<br />
of over-age primary points in a sample<br />
of 22 low <strong>and</strong> middle<br />
school students are all<br />
income countries. In<br />
in sub-Saharan Africa some countries, the gap<br />
<strong>and</strong> have more than is very large. In Sierra<br />
Leone, the percentage<br />
35% over-age students<br />
of over-age students<br />
was 36%, according to<br />
the 2013 Demographic<br />
<strong>and</strong> Health Survey (DHS), but only 14% according to<br />
the UIS.<br />
Household survey data help illustrate why monitoring<br />
over-age attendance is important, especially among<br />
girls. The percentage of over-age students is already<br />
high from the first grade but generally increases as<br />
students repeat <strong>and</strong> fall further behind. However, in<br />
Ghana, the percentage of over-age girls was 57% among<br />
grade 5 students but 50% among grade 8 students. In<br />
Malawi, it was 51% in grade 6 but 34% in grade 8, while<br />
the percentage of over-age boys stayed the same. Since<br />
students rarely skip grades, this suggests that those<br />
over-age are more likely to drop out (Figure 10.3a).<br />
Administrative data are available on the percentage of<br />
students who are over-age – that is, at least two years<br />
older than the official age for their grade. Globally, 4% of<br />
primary <strong>and</strong> 10% of lower secondary school students are<br />
over-age according to UIS data. But in the 10 countries<br />
where the problem is most severe, all of which are in<br />
sub-Saharan Africa, more than 35% of primary school<br />
students are over-age.<br />
Analysis of household survey data for this report<br />
indicates that administrative data may underestimate<br />
Household surveys also indicate that late entry is more<br />
common among children from poor households. In<br />
Haiti, 36% of the poorest 60% of students, but 21% of<br />
the richest 40%, entered primary school at least two<br />
years later than the official entrance age in 2012. The<br />
gap almost doubled by grade 4, when 75% of the poorest<br />
students were over-age, suggesting they were more<br />
likely to repeat school <strong>and</strong> fall behind. In Haiti, as well as<br />
in Swazil<strong>and</strong>, the percentage of the over-age among the<br />
poorest stops rising after grade 5 suggesting that they<br />
are more likely to leave school (Figure 10.3b).<br />
2016 • GLOBAL EDUCATION MONITORING REPORT 183
10<br />
FIGURE 10.3:<br />
Over-age attendance especially affects girls <strong>and</strong> the poor in some countries<br />
a. Percentage of over-age children, by grade <strong>and</strong> sex,<br />
Ghana 2011 <strong>and</strong> Malawi 2010<br />
80 80<br />
b. Percentage of over-age children, by grade <strong>and</strong> wealth,<br />
Haiti 2012 <strong>and</strong> Swazil<strong>and</strong> 2010<br />
Students at least two years older than official age for grade (%)<br />
70 70<br />
60 60<br />
50 50<br />
40 40<br />
30 30<br />
20 20<br />
Male<br />
Female<br />
10 10<br />
Students at least two years older than official age for grade (%)<br />
Poorest 60%<br />
Richest 40%<br />
0<br />
0<br />
1 2 3 4 5 6 7 8 1 2 3 4 5 6 7 8<br />
1 2 3 4 5 6 7 8 9 1 2 3 4 5 6 7 8 9<br />
Ghana<br />
Malawi<br />
Haiti<br />
Swazil<strong>and</strong><br />
Note: Children are defined as over-age if they are at least two years older than the official age for the grade.<br />
Source: GEM Report team analysis using DHS <strong>and</strong> MICS results.<br />
COMPLETION<br />
Target 4.1 emphasizes completion of primary <strong>and</strong><br />
secondary education. But consistent information across<br />
countries on graduation from the various education<br />
levels is lacking. Administrative data focus on the gross<br />
intake rate into last grade, i.e. the number of students<br />
enrolled in the final grade as a percentage of the number<br />
of <strong>people</strong> of graduation age for that education level.<br />
Globally, the gross intake rate into the final grade of<br />
primary school was 90% in 2014. There was a low of<br />
67% in low income countries, ranging up to 98% in high<br />
income countries. The rate exceeded 90% in all regions<br />
except sub-Saharan Africa, where it was 69%. The gross<br />
intake rate into the final grade of lower secondary<br />
school was 75% globally in 2014 <strong>and</strong> ranged from 38% in<br />
low income countries to 92% in high income countries.<br />
Again the lowest value, 42%, was in sub-Saharan Africa.<br />
No data are reported at the upper secondary level. It is<br />
important to note that the gross intake rate can exceed<br />
100% because the numerator (students in final grade)<br />
<strong>and</strong> denominator (<strong>people</strong> of graduation age) come from<br />
different sources <strong>and</strong> may be inconsistent. Indeed, the<br />
value exceeded 100% in 54 of the 157 countries with data<br />
in primary education.<br />
Completion indicators based on household survey data<br />
can help address this issue. Parents <strong>and</strong> guardians are<br />
directly asked whether each child has completed a given<br />
education level. Comparing administrative <strong>and</strong> survey<br />
data from the same country suggests that intake rates<br />
tend to overestimate completion. For example, among<br />
80 low <strong>and</strong> middle income countries, the median value<br />
of the gross intake rate into the final grade of lower<br />
secondary exceeded the completion rate at that level by<br />
11 percentage points.<br />
In 2008–2014, the primary completion rate was 51%<br />
in low income countries, 84% in lower middle income<br />
countries <strong>and</strong> 92% in upper middle income countries.<br />
There were major gaps between the poorest <strong>and</strong> richest:<br />
28% of the poorest children but 77% of the richest<br />
completed primary school in low income countries. This<br />
disparity is exacerbated when comparing boys <strong>and</strong> girls.<br />
The primary completion rate among the poorest girls is<br />
25% in low income countries (Table 10.3).<br />
184<br />
CHAPTER 10 | TARGET 4.1 – PRIMARY AND SECONDARY EDUCATION
10<br />
TABLE 10.3:<br />
Completion rates by education level, income group, sex <strong>and</strong> wealth, 2008–2014 (%)<br />
Primary Lower secondary Upper secondary<br />
Low income<br />
countries<br />
Lower middle<br />
income countries<br />
Upper middle<br />
income countries<br />
Low income<br />
countries<br />
Lower middle<br />
income countries<br />
Upper middle<br />
income countries<br />
Low income<br />
countries<br />
Lower middle<br />
income countries<br />
Upper middle<br />
income countries<br />
Total 51 84 92 27 68 79 14 38 43 84<br />
Female 49 83 93 24 67 80 12 36 44 87<br />
Male 53 84 90 31 70 77 18 40 43 82<br />
Poorest 20% 28 69 86 10 50 63 2 20 27 76<br />
Female 25 67 87 7 47 65 1 17 29 79<br />
Male 30 71 85 13 52 60 4 23 23 75<br />
Richest 20% 77 95 96 52 88 87 34 66 60 93<br />
Female 75 96 95 48 88 91 30 67 60 95<br />
Male 79 95 96 58 88 84 39 65 60 91<br />
Source: GEM Report team analysis using household surveys.<br />
High income<br />
countries<br />
The lower secondary completion rate is 27% in low<br />
income, 68% in lower middle income <strong>and</strong> 79% in upper<br />
middle income countries. Only half of the poorest<br />
adolescents, but<br />
88% of the richest,<br />
complete lower<br />
In 2008–2014, the<br />
secondary education<br />
primary completion rate in lower middle<br />
income countries.<br />
was 51% in low income<br />
countries, 84% in lower<br />
The upper secondary<br />
middle income countries completion rate is<br />
14% in low income,<br />
<strong>and</strong> 92% in upper middle<br />
38% in lower middle<br />
income countries<br />
income, 43% in upper<br />
middle income <strong>and</strong><br />
84% in high income<br />
countries. Only 20% of the poorest youth, but 66% of the<br />
richest, complete upper secondary education in lower<br />
middle income countries. Not even the richest in high<br />
income countries (93%) achieve universal completion.<br />
Just 1% of the poorest girls in low income countries<br />
complete upper secondary school.<br />
Given that the target is universal primary <strong>and</strong> secondary<br />
completion by 2030, current evidence suggests the scale<br />
of this ambition is unattainable. Out of 125 countries,<br />
in only 64 have at least half of young <strong>people</strong> completed<br />
upper secondary school. In 15 countries, fewer than half<br />
of children have completed primary school (Figure 10.4).<br />
In short, there is a long way to go to ensure that every<br />
child completes 12 years of primary <strong>and</strong> secondary<br />
education. Out of 90 low <strong>and</strong> middle income countries,<br />
20- to 24-year-olds had attained at least of 12 years<br />
of education, on average, in only 10. The richest had<br />
attained at least 12 years of education in 36 countries<br />
but the poorest only in Kazakhstan <strong>and</strong> Ukraine. In more<br />
than half the countries, the average attainment of the<br />
poorest was fewer than six years. In Nigeria, the richest<br />
youth attained 12.2 years, the poorest only 1.7 years, on<br />
average. In Burkina Faso, Mali, Niger <strong>and</strong> South Sudan,<br />
the poorest youth attained an average of less than one<br />
year of education (Figure 10.5).<br />
COMPULSORY AND FREE<br />
EDUCATION<br />
The Education 2030 Framework for Action, adopted<br />
by over 180 countries, committed countries to ‘ensure<br />
the provision of 12 years of free, publicly funded,<br />
equitable quality primary <strong>and</strong> secondary education, of<br />
which at least nine years are compulsory’. Thus, one<br />
of the proposed thematic indicators is the number<br />
of years of (a) free <strong>and</strong> (b) compulsory primary <strong>and</strong><br />
secondary education guaranteed in legal frameworks.<br />
The main source of information for this indicator is the<br />
UIS database, complemented where necessary with<br />
constitutional, legislative <strong>and</strong> policy documentation<br />
from the Eurydice network, the International Bureau of<br />
Education <strong>and</strong> national education ministries.<br />
Out of the 191 countries with data on compulsory<br />
education, 44 (23%) require fewer than 9 years<br />
(Figure 10.6), ranging from 52% of low income countries<br />
to 7% of high income countries.<br />
While the median number of years of compulsory<br />
education is 9, the median for free education is 11 years.<br />
However, even if fees are abolished, education is not free<br />
when related costs burden families. National education<br />
2016 • GLOBAL EDUCATION MONITORING REPORT 185
10<br />
FIGURE 10.4:<br />
Universal secondary completion is a distant target for most countries<br />
Completion rate, by level of education, selected countries, 2008–2014<br />
100<br />
90<br />
80<br />
70<br />
Completion rate (%)<br />
60<br />
50<br />
40<br />
30<br />
20<br />
10<br />
0<br />
Niger<br />
U. R. Tanzania<br />
Burkina Faso<br />
Burundi<br />
Bhutan<br />
Mozambique<br />
Madagascar<br />
C. A. R.<br />
South Sudan<br />
Chad<br />
Zimbabwe<br />
Senegal<br />
Rw<strong>and</strong>a<br />
Guyana<br />
Benin<br />
Ethiopia<br />
Cameroon<br />
Afghanistan<br />
Gabon<br />
Mali<br />
Togo<br />
Haiti<br />
Congo<br />
Guinea<br />
Ug<strong>and</strong>a<br />
Cote d’Ivoire<br />
Morocco<br />
Mauritania<br />
Malawi<br />
Nicaragua<br />
Brazil<br />
Iraq<br />
Cambodia<br />
Pakistan<br />
Sierra Leone<br />
Belize<br />
Lesotho<br />
Sudan<br />
Suriname<br />
Bangladesh<br />
Liberia<br />
Guatemala<br />
Comoros<br />
Lao PDR<br />
Zambia<br />
Timor-Leste<br />
Gambia<br />
Swazil<strong>and</strong><br />
D. R. Congo<br />
Yemen<br />
Honduras<br />
Costa Rica<br />
India<br />
Namibia<br />
Ghana<br />
China<br />
Nigeria<br />
Kenya<br />
South Africa<br />
Tunisia<br />
Albania<br />
Chile<br />
Indonesia<br />
Nepal<br />
Mexico<br />
Viet Nam<br />
Jordan<br />
Dominican Rep.<br />
Tajikistan<br />
Bolivia<br />
Panama<br />
Palestine<br />
Maldives<br />
Icel<strong>and</strong><br />
Colombia<br />
Mongolia<br />
Ecuador<br />
Argentina<br />
Rep. Moldova<br />
Spain<br />
Bosnia/Herzeg.<br />
Egypt<br />
Philippines<br />
Denmark<br />
Source: GEM Report team analysis using household surveys.<br />
FIGURE 10.5:<br />
In just 2 out of 90 low <strong>and</strong> middle income countries have the poorest young <strong>people</strong> attained at least 12 years of education<br />
Years of education attained among 20- to 24-year-olds, by wealth, selected countries, 2008–2014<br />
15<br />
12<br />
Years of education<br />
9<br />
6<br />
3<br />
Richest<br />
Average<br />
Poorest<br />
0<br />
Niger<br />
South Sudan<br />
Burkina Faso<br />
Afghanistan<br />
Mali<br />
Chad<br />
Burundi<br />
Ethiopia<br />
Madagascar<br />
Senegal<br />
C. A. R.<br />
Rw<strong>and</strong>a<br />
Mozambique<br />
Sudan<br />
Guinea<br />
Sierra Leone<br />
Benin<br />
Côte d’Ivoire<br />
Bhutan<br />
U. R. Tanzania<br />
Mauritania<br />
Pakistan<br />
Morocco<br />
S. Tome/Principe<br />
Gambia<br />
Liberia<br />
Iraq<br />
Bangladesh<br />
Malawi<br />
Yemen<br />
Ug<strong>and</strong>a<br />
Guatemala<br />
Togo<br />
Cameroon<br />
Cambodia<br />
Lao PDR<br />
Lesotho<br />
Nigeria<br />
Nepal<br />
Timor-Leste<br />
Comoros<br />
D. R. Congo<br />
Haiti<br />
Honduras<br />
Belize<br />
Zambia<br />
Congo<br />
India<br />
Swazil<strong>and</strong><br />
Gabon<br />
Suriname<br />
Namibia<br />
Kenya<br />
Guyana<br />
China<br />
Colombia<br />
Maldives<br />
Ghana<br />
Costa Rica<br />
Indonesia<br />
Uruguay<br />
Philippines<br />
Tajikistan<br />
Viet Nam<br />
Albania<br />
Zimbabwe<br />
Bolivia<br />
Mexico<br />
Dominican Rep.<br />
Tunisia<br />
Peru<br />
Egypt<br />
Mongolia<br />
Panama<br />
Jamaica<br />
Ecuador<br />
Armenia<br />
Argentina<br />
Rep. Moldova<br />
Barbados<br />
Kyrgyzstan<br />
Bosnia/Herzeg.<br />
Jordan<br />
TFYR Macedonia<br />
Palestine<br />
Belarus<br />
Serbia<br />
Montenegro<br />
Kazakhstan<br />
Ukraine<br />
Source: GEM Report team analysis using household surveys.<br />
186<br />
CHAPTER 10 | TARGET 4.1 – PRIMARY AND SECONDARY EDUCATION
10<br />
FIGURE 10.6:<br />
In almost one-quarter of countries, education is<br />
compulsory for fewer than nine years<br />
Number of countries by years of compulsory primary <strong>and</strong><br />
secondary education, 2014<br />
70<br />
60<br />
50<br />
Countries<br />
40<br />
30<br />
Primary<br />
Lower secondary<br />
Upper secondary<br />
20<br />
10<br />
Netherl<strong>and</strong>s<br />
Malta<br />
Peru<br />
Serbia<br />
TFYR Macedonia<br />
Germany<br />
Jamaica<br />
Estonia<br />
Saint Lucia<br />
Kyrgyzstan<br />
Belgium<br />
Romania<br />
Latvia<br />
Pol<strong>and</strong><br />
France<br />
Italy<br />
Belarus<br />
Bulgaria<br />
Austria<br />
Finl<strong>and</strong><br />
Montenegro<br />
Australia<br />
Hungary<br />
Canada<br />
Russian Fed.<br />
Israel<br />
Slovenia<br />
Czech Rep.<br />
Lithuania<br />
United States<br />
Sweden<br />
Cyprus<br />
Greece<br />
Slovakia<br />
Barbados<br />
Armenia<br />
Kazakhstan<br />
Croatia<br />
Ukraine<br />
Georgia<br />
0<br />
No<br />
data<br />
5 6 7 8 9 10 11 12<br />
Years of compulsory education<br />
Source: UIS database; Eurydice network; UNESCO International Bureau of<br />
Education; <strong>and</strong> national education ministries.<br />
accounts, which capture the share of total education<br />
expenditure borne by households, will be a strong<br />
indication of the extent to which education is free (see<br />
Chapter 20).<br />
The growth in private schooling in education provision<br />
in some countries threatens national commitments<br />
to free education. The share of private institutions in<br />
total enrolment was 13% in primary education in 2014,<br />
up from 10% in 2000. Across regions, it ranged from 1%<br />
in Caucasus <strong>and</strong> Central Asia to 19% in Latin America<br />
<strong>and</strong> the Caribbean. At the secondary level, the share<br />
increased from 19% in 2000 to 25% in 2014, ranging from<br />
3% in Caucasus <strong>and</strong> Central Asia to 28% in South-eastern<br />
Asia <strong>and</strong> 47% in Southern Asia. Differences are apparent<br />
within regions. In Latin America, the share of private<br />
primary enrolment doubled from 13% to 27% in Peru<br />
but was constant at about 8% in Mexico. Information<br />
is missing for many countries, while not all forms of<br />
private schooling are systematically captured. No<br />
regional average of the share of private institutions in<br />
primary education is available in Southern Asia, where<br />
privatization is known to be above the global average, as<br />
shown below.<br />
Household surveys are a complementary data source.<br />
According to 2008–2011 surveys, about 27% of children of<br />
primary school age attended private schools in Southern<br />
Asia, driven by India where 26% of primary school-age<br />
children attended private schools in 2009/10. In Nepal,<br />
18% of 6- to 10-year old students attended private school<br />
in 2009/10. The share ranged from 5% among the poorest<br />
quintile of the population to 56% among the richest<br />
(Dahal <strong>and</strong> Nguyen, 2014).<br />
Similar analysis of 16 sub-Saharan African countries<br />
suggests that administrative data tend to underestimate<br />
the share of private school enrolment, especially in<br />
countries where the private sector is exp<strong>and</strong>ing <strong>and</strong><br />
some schools operate without official recognition<br />
(Wodon, 2014). In Nigeria, private schools accounted<br />
for 5% of primary enrolment in 2005 <strong>and</strong> 8% in 2010,<br />
according to the UIS. Yet survey data indicate the share<br />
was already 13% in 2004 <strong>and</strong> reached 24% by 2015<br />
(Nigeria NPC <strong>and</strong> ORC Macro, 2004; Nigeria NPC <strong>and</strong> RTI<br />
International, 2016).<br />
That said, if the main objective is to monitor the extent<br />
to which the increase in private education threatens<br />
fulfilment of the right to education, not all private<br />
2016 • GLOBAL EDUCATION MONITORING REPORT 187
10<br />
schools pose such a threat. For example, in Bangladesh,<br />
where the share of private schooling in 2010 was 55%<br />
among those aged 11 to 15 <strong>and</strong> 80% among those aged<br />
16 to 18 (Dahal <strong>and</strong> Nguyen, 2014), the vast majority of<br />
private schools receive government aid <strong>and</strong> charge fees<br />
at the same low level as public schools.<br />
While a common definition of private schools remains<br />
elusive, more questions about the type of school<br />
attended should be added to surveys to supply missing<br />
data <strong>and</strong> monitor global trends.<br />
QUALITY<br />
Emphasis on good quality builds on <strong>and</strong> exp<strong>and</strong>s<br />
earlier policy commitments by the global education<br />
community. Education quality is explicitly mentioned in<br />
SDG 4 <strong>and</strong> targets 4.1–3. A focus on learning outcomes, a<br />
key dimension of quality, permeates much of the 2030<br />
Agenda. Targets 4.a <strong>and</strong> 4.c are related to key aspects of<br />
quality: learning environments <strong>and</strong> teachers.<br />
However, the scope for cross-country monitoring of<br />
quality is limited. Quality is understood <strong>and</strong> defined in<br />
various ways across the world. And with the exception<br />
of learning outcome indicators, <strong>and</strong> some equity<strong>and</strong><br />
inclusion-related indicators, the proposed SDG<br />
4 monitoring framework provides a weak basis for<br />
monitoring quality. This section provides an indicative<br />
framework of quality to motivate <strong>and</strong> guide discussions<br />
(Box 10.1).<br />
Good quality education should not be equated with, or<br />
reduced to, learning outcomes. To facilitate a broader<br />
discussion of quality under target 4.1, two classroom-<br />
BOX 10.1<br />
Monitoring quality in SDG 4<br />
The concept of quality is explicitly mentioned in SDG 4 <strong>and</strong> the first three education targets, <strong>and</strong> is strongly implicit in the remaining seven targets –<br />
for example, striving towards equity; ensuring safe, non-violent, inclusive <strong>and</strong> effective learning environments; <strong>and</strong> deploying qualified teachers are<br />
all markers of good quality education.<br />
The framework for underst<strong>and</strong>ing education quality proposed in the 2005 EFA Global Monitoring Report has been the st<strong>and</strong>ard reference over the past<br />
decade. With education systems added as a distinct dimension, separate from the general economic, political <strong>and</strong> social context, this new framework<br />
(Table 10.4) helps organize the presentation of the sections that discuss quality in this report.<br />
TABLE 10.4:<br />
A framework for education quality<br />
LEARNERS<br />
e.g. health <strong>and</strong> nutrition, parental engagement,<br />
stimulating home environments, emotionally<br />
supportive relationships, abilities, traits, barriers<br />
to learning, poverty, <strong>and</strong> language at home.<br />
SYSTEMS<br />
e.g. finance, planning <strong>and</strong> monitoring,<br />
curriculum <strong>and</strong> language, st<strong>and</strong>ards <strong>and</strong><br />
accountability, recruitment <strong>and</strong> incentives,<br />
professional development, links with other<br />
sectors, links across tiers of government, <strong>and</strong><br />
inclusive policy development<br />
SCHOOL AND CLASSROOM SETTINGS<br />
Teachers <strong>and</strong> teaching process<br />
e.g. motivated, well-prepared, attention to<br />
diversity, interactions, language, pedagogy,<br />
time on task, assessment for learning, <strong>and</strong><br />
various teaching strategies.<br />
School leadership <strong>and</strong> governance<br />
e.g. setting expectations, focusing on<br />
learning, <strong>and</strong> fostering collaboration.<br />
Structures <strong>and</strong> material inputs<br />
e.g. teaching <strong>and</strong> learning materials,<br />
technology, facilities, <strong>and</strong> water<br />
<strong>and</strong> hygiene.<br />
OUTCOMES<br />
For learners<br />
In pre-primary education<br />
e.g. school readiness, executive function,<br />
social-emotional <strong>and</strong> motor development, <strong>and</strong><br />
pre-academic skills.<br />
In primary, secondary <strong>and</strong> tertiary education<br />
e.g. learning achievement, critical thinking skills,<br />
collaborative skills, values <strong>and</strong> attitudes (including<br />
a better underst<strong>and</strong>ing of the world).<br />
For society<br />
e.g. behaviours linked with sustainable economic, social<br />
<strong>and</strong> environmental development; culture of peace <strong>and</strong><br />
non-violence; global citizenship; <strong>and</strong> cultural diversity.<br />
CONTEXT<br />
Economic, political <strong>and</strong> social conditions<br />
Source: UNESCO (2004).<br />
188<br />
CHAPTER 10 | TARGET 4.1 – PRIMARY AND SECONDARY EDUCATION
10<br />
SYSTEMS<br />
LEARNERS<br />
SCHOOL AND CLASSROOM SETTINGS<br />
Availability of textbooks <strong>and</strong> reading books<br />
Effective teaching practices<br />
OUTCOMES<br />
CONTEXT<br />
Economic, political <strong>and</strong> social conditions<br />
availability. In 2013, nearly 100% of schools had received<br />
their textbooks within the first month of the school<br />
year. This was a substantial improvement over 2010,<br />
when only one-third of the schools had received their<br />
textbooks in that period (Bangladesh Directorate of<br />
Primary Education, 2014).<br />
Even when governments have good data on schools<br />
<strong>and</strong> students <strong>and</strong> procure the correct number of books,<br />
local education authorities may not have storage <strong>and</strong><br />
distribution facilities or, in some cases, the funds for<br />
delivery (Read, 2015). A survey of teaching <strong>and</strong> learning<br />
materials in Ghana found that 57% of the stock of grade<br />
3 English textbooks to be delivered to districts could not<br />
be accounted for (Read, 2016).<br />
related inputs <strong>and</strong> processes have been selected. First,<br />
despite the importance of textbooks <strong>and</strong> reading<br />
books to learning, information on their availability is<br />
incomplete. Second, while monitoring pedagogy across<br />
countries is a major undertaking <strong>and</strong> cannot be served<br />
properly by quantitative studies, tools are available to<br />
observe teaching practices in classrooms <strong>and</strong> more use<br />
should be made of them.<br />
INPUTS: AVAILABILITY OF TEXTBOOKS AND<br />
READING BOOKS<br />
Access to textbooks, teacher guides <strong>and</strong> reading books<br />
is especially important for learning in low resource<br />
<strong>and</strong> print-poor settings. But comparative data on their<br />
availability is scant <strong>and</strong> unsystematic. Since 2008,<br />
the UIS has collected data on textbooks based<br />
on education ministry reports for 45 countries in<br />
Africa. These data can be used for indicators such as<br />
textbook/pupil ratios by grade level (1 to 7) <strong>and</strong> subject<br />
(mathematics <strong>and</strong> reading).<br />
Some countries have sophisticated computerized<br />
management information systems for instructional<br />
materials, developed with donor support, which<br />
allow officials to receive real-time updates. Namibia<br />
<strong>and</strong> Rw<strong>and</strong>a introduced online supply chain<br />
management systems that enable schools to order<br />
the books they want from publishers, <strong>and</strong> the<br />
government to monitor whether the books have<br />
been delivered (Read, 2016).<br />
Less sophisticated mechanisms can also be informative.<br />
As part of its primary school census, Bangladesh collects<br />
information on timeliness of delivery, one aspect of<br />
In some countries,<br />
when textbooks<br />
A survey of teaching<br />
reach schools,<br />
<strong>and</strong> learning materials uncertainty over<br />
in Ghana found that<br />
future supplies<br />
means they are<br />
57% of the stock of grade<br />
kept in storage for<br />
3 English textbooks to be fear of damage<br />
delivered to districts could or loss. Loss <strong>and</strong><br />
damage rates are<br />
not be accounted for<br />
underestimated.<br />
Ethiopia has<br />
increased print<br />
runs by 8% to compensate for that (Read, 2016).<br />
Corruption in public procurement <strong>and</strong> reselling of books<br />
for personal profit are believed to be common in many<br />
countries (Transparency International, 2013).<br />
In this context, school visits <strong>and</strong> classroom observations<br />
have a distinct advantage. They can validate or call into<br />
question the accuracy of official data. For example, the<br />
UIS reported that the average number of mathematics<br />
textbooks per grade 2 student in Burundi was 1.5 in<br />
2014. However, evidence from the 2014 PASEC learning<br />
achievement survey shows that this overestimates<br />
textbook availability, as only 18% of students had their<br />
own mathematics textbook while 31% had to share with<br />
another student <strong>and</strong> 51% with two or more students<br />
(Figure 10.7). In Chad, about 90% of students in grades<br />
2 <strong>and</strong> 6 reading <strong>and</strong> mathematics classes had to share<br />
textbooks with at least two students.<br />
An effective monitoring system would need to report<br />
textbook availability by grade, subject, school type <strong>and</strong><br />
language, but that would be complex. Data on languages<br />
used in schools are scarce <strong>and</strong> data on textbooks scarcer<br />
2016 • GLOBAL EDUCATION MONITORING REPORT 189
10<br />
FIGURE 10.7:<br />
In some sub-Saharan African countries, few primary school students have personal copies of textbooks<br />
Number of pupils per textbook, selected countries, 2014<br />
100<br />
80<br />
a. Grade 2 b. Grade 6<br />
Language<br />
Language<br />
100<br />
80<br />
%<br />
%<br />
One book for 3+ pupils<br />
60<br />
One book for 2 pupils<br />
40<br />
One book per pupil<br />
20<br />
0<br />
Chad<br />
Niger<br />
Burundi<br />
Cameroon<br />
Senegal<br />
Togo<br />
Benin<br />
Congo<br />
Burkina Faso<br />
Côte d’Ivoire<br />
Mathematics<br />
100 100<br />
80 80<br />
60 One book for 3+ pupils<br />
60<br />
One book for 2 pupils<br />
40 40<br />
One book per pupil<br />
% %<br />
60<br />
40<br />
20<br />
0<br />
Chad<br />
Niger<br />
Cameroon<br />
Mathematics<br />
One book for 3+ pupils<br />
One book for 2 pupils<br />
One book per pupil<br />
One book for 3+ pupils<br />
One book for 2 pupils<br />
One book per pupil<br />
Burkina Faso<br />
Chad<br />
Chad<br />
Burundi<br />
Senegal<br />
Congo<br />
Togo<br />
Cameroon<br />
Togo<br />
Cameroon<br />
Côte d’Ivoire<br />
Burkina Faso<br />
Burundi<br />
Benin<br />
Benin<br />
20 20<br />
Côte d’Ivoire<br />
Burkina Faso<br />
Congo<br />
Côte d’Ivoire<br />
0 0<br />
Niger<br />
Senegal<br />
Burundi<br />
Benin<br />
Niger<br />
Senegal<br />
Congo<br />
Togo<br />
Source: PASEC (2015).<br />
(Read, 2016) (see Chapter 14). Ug<strong>and</strong>a has approved<br />
12 languages for early primary grades.<br />
In linguistically diverse Central Asia, countries have<br />
multiple languages of instruction in primary <strong>and</strong><br />
secondary education. Uzbekistan has seven, Kyrgyzstan<br />
four. When these countries were part of the Soviet<br />
Union, they had a common curriculum <strong>and</strong> education<br />
structure. Uzbekistan could import Kyrgyz textbooks<br />
cheaply from Kyrgyzstan because they were identical<br />
in content, presentation <strong>and</strong> production to Uzbek<br />
textbooks. When country curricula diverged following<br />
independence, each country had to produce its own<br />
textbooks. Already struggling with costs, countries focus<br />
on their national language plus Russian. There are severe<br />
shortages of costlier minority language textbooks. In<br />
Kyrgyzstan, textbook availability in 2014 was less than<br />
40% for Kyrgyz <strong>and</strong> Russian, <strong>and</strong> even less for Uzbek <strong>and</strong><br />
Tajik textbooks – whose quality, a neglected dimension<br />
of availability, has been poor due to the lack of qualified<br />
translators (Read, 2016).<br />
Beyond textbooks, the availability of reading books<br />
is vital for strengthening the literacy environment,<br />
especially for poor children without access to books<br />
at home (see Chapter 11). In Burera district, Rw<strong>and</strong>a, a<br />
baseline survey of primary schools found an average of<br />
3.3 storybooks per school <strong>and</strong> none in almost half the<br />
schools (Save the Children, 2013).<br />
In many multilingual countries, few, if any, reading books<br />
are available languages children speak. In conjunction<br />
with a USAID effort to establish a Global Book Fund,<br />
an inventory of reading materials from 11 sub-Saharan<br />
African countries was prepared, focusing on lesser-used<br />
languages. More than 5,900 titles in 262 languages were<br />
collected. Data show scarcity in all African languages<br />
<strong>and</strong> the near-absence of books in many key languages.<br />
In Nigeria, reading materials were found for 9 of the<br />
country’s 520 languages, <strong>and</strong> in the United Republic of<br />
Tanzania, for 3 of 125 (IE Partners <strong>and</strong> R4D, 2015).<br />
190<br />
CHAPTER 10 | TARGET 4.1 – PRIMARY AND SECONDARY EDUCATION
10<br />
PROCESSES: CLASSROOM OBSERVATIONS OF<br />
EFFECTIVE TEACHING PRACTICES<br />
Studies of the impact of good teaching practices on<br />
learning outcomes in high income countries indicate that<br />
teachers who improved learning ‘built relationships with<br />
their students … helped students to have different <strong>and</strong><br />
better strategies or processes to learn the subject … <strong>and</strong><br />
demonstrated a willingness to explain material <strong>and</strong> help<br />
students with their work’ (Hattie, 2009, p. 108). Teachers<br />
also improve learning when they set high expectations<br />
for students, do not discriminate among them, ask them<br />
to learn from one another <strong>and</strong> provide feedback.<br />
Similar results are emerging from low <strong>and</strong> middle income<br />
countries. In rural India, teachers asking questions, using<br />
local examples to explain lessons <strong>and</strong> having children<br />
work in small groups were positively correlated with test<br />
scores in grades 2 <strong>and</strong> 4 (Banerji et al., 2013). Studies in<br />
South Africa identified a focus on reading <strong>and</strong> writing<br />
text <strong>and</strong> the adjustment of pace to pupil ability as critical<br />
for learning, though most classrooms were lacking in<br />
these factors (Hoadley, 2012).<br />
A systematic review of 54 empirical studies highlighted<br />
group <strong>and</strong> pair work, student questioning, use of local<br />
languages, the planning <strong>and</strong> varying of lesson sequences<br />
<strong>and</strong> the use of a range of learning materials as effective<br />
pedagogic strategies. It argued that ‘future research<br />
designs could fruitfully combine qualitative with<br />
quantitative studies, for example with both baseline <strong>and</strong><br />
post-tests measuring student attainment as a result of<br />
an intervention or reform, <strong>and</strong> systematic, structured<br />
classroom observation’ (Westbrook et al., 2013, p. 65).<br />
Classroom observations are routinely conducted to<br />
inform teacher education <strong>and</strong> professional development<br />
<strong>and</strong> to evaluate interventions. Could they also be used<br />
for monitoring? If so, how much has been done <strong>and</strong><br />
what methodological issues were raised? Such studies<br />
have so far served to measure availability of teaching<br />
<strong>and</strong> learning materials (see previous section), assess<br />
instructional time <strong>and</strong> its use in lessons, <strong>and</strong> confirm the<br />
use of effective teaching practices (Box 10.2).<br />
A survey of 15,000 classrooms in Brazil, Colombia,<br />
Honduras, Jamaica <strong>and</strong> Peru showed that teachers<br />
spent between 60% <strong>and</strong> 65% of their time on academic<br />
instruction, well below the recommended 85%. Even<br />
during instruction, the entire class was engaged only<br />
one-third of the time. In the Federal District, Mexico,<br />
teachers spent almost 40% of their time managing the<br />
classroom (Bruns <strong>and</strong> Luque, 2014).<br />
BOX 10.2<br />
Collecting comparable classroom observation data in<br />
sub-Saharan Africa<br />
The Service Delivery Indicators programme aims to develop a<br />
st<strong>and</strong>ardized approach to measure the quality of health <strong>and</strong> education<br />
services in sub-Saharan Africa. It was launched in 2010 as a partnership<br />
between the World Bank, the African Economic Research Consortium<br />
<strong>and</strong> the African Development Bank, with core funding from the Hewlett<br />
Foundation. Nationally representative surveys of primary schools,<br />
typically between 200 <strong>and</strong> 400 per country, have been done in Kenya,<br />
Mozambique, Nigeria, Senegal, Togo, Ug<strong>and</strong>a <strong>and</strong> the United Republic of<br />
Tanzania (2 rounds), <strong>and</strong> are in process in the Democratic Republic of the<br />
Congo, Madagascar <strong>and</strong> Niger.<br />
As in other studies, teacher absenteeism, which combines absence from<br />
school with absence from the classroom while at school, was typically<br />
between 40% <strong>and</strong> 50%. It was more than 55% in Mozambique, where if<br />
time lost within the lesson is also taken into account, the average child<br />
experienced just 1 hour <strong>and</strong> 40 minutes of actual daily teaching time.<br />
Such data call for attention to governance, management <strong>and</strong> oversight.<br />
Classroom observation also captured the nature of interactions. Across<br />
countries, about 30% of teaching <strong>and</strong> learning time was spent interacting<br />
with students (either as one group, several small groups or individually);<br />
another 30% was spent either writing on the blackboard or reading <strong>and</strong><br />
lecturing to students (an activity negatively associated with learning<br />
outcomes); 22% of classroom time was spent waiting for students to<br />
respond to a question or listening to student responses; <strong>and</strong> 6% was<br />
devoted to testing.<br />
Observers were asked to identify whether certain types of teacher<br />
practices were deployed during the lesson. While 84% of teachers<br />
introduced the lesson, only 43% summarized it at the end of class. Most<br />
of the questions asked were related to memorized information. It was<br />
observed that only 61% of teachers had smiled at pupils <strong>and</strong> 29% had<br />
used negative reinforcement. Such information provide insights into<br />
how pedagogical teacher training could focus more strongly on practices<br />
associated with better learning.<br />
Further analysis of data from Kenya, Mozambique, Nigeria, Togo <strong>and</strong><br />
Ug<strong>and</strong>a shows that classroom effects – a combination of teacher<br />
knowledge, time allocation <strong>and</strong> teaching practices – explained roughly<br />
15% of the total variance of student achievement, three times more than<br />
in high income countries. Positive reinforcement <strong>and</strong> frequent formative<br />
assessment were most strongly associated with increased student<br />
achievement, while mistreating students had a negative effect.<br />
Source: Filmer et al. (2015); Filmer (2016).<br />
2016 • GLOBAL EDUCATION MONITORING REPORT 191
10<br />
Multiple factors influence the time students spend<br />
learning in early grades. In Ethiopia, Guatemala,<br />
Honduras, Mozambique <strong>and</strong> Nepal, after combining time<br />
losses due to schools being closed, teachers being absent<br />
<strong>and</strong> students being either absent or, especially, off task,<br />
schools used less than 50% of the available time for<br />
instruction (Moore et al., 2012).<br />
Other factors further reducing time on task include teacher<br />
strikes, late student registration, lack of supplies at the<br />
start of term or schools closing earlier than planned. Taking<br />
these into account, primary school students in Senegal<br />
were on task during 388 of the 1,090 intended annual<br />
instructional hours, or 36% of the time (Niang, 2015).<br />
In Bauchi <strong>and</strong> Sokoto states, Nigeria, only one-quarter of<br />
grade 2 time is allocated to teaching, partly because what<br />
is supposed to be a 45-minute literacy lesson is actually<br />
much shorter, <strong>and</strong> because only half the teachers in the<br />
classrooms are teaching literacy skills during the lesson<br />
time (RTI International, 2016b) (Figure 10.8).<br />
Classroom observations do not just record time<br />
allocation. They can also record teaching practices – <strong>and</strong><br />
commonly show that teacher–student <strong>and</strong> student–<br />
student interactions are limited. In Cambodia, a tiny part<br />
of mathematics class time in lower secondary schools<br />
was spent doing applied individual or group work. There<br />
were limited opportunities for interaction or creative<br />
FIGURE 10.8:<br />
In northern Nigeria, only one-quarter of time is used for instruction<br />
Allocation of grade 2 Hausa lesson time, Bauchi <strong>and</strong> Sokoto states, Nigeria, 2014<br />
Teachers (%)<br />
100<br />
80<br />
60<br />
40<br />
20<br />
0<br />
3 6 9 12 15 18 21 24 27 30 33 36 39 42 45<br />
Source: RTI International (2016b).<br />
Minute of lesson<br />
No activity<br />
Other<br />
Literacy<br />
instruction<br />
thinking. About 61% of class time was spent receiving<br />
various forms of instruction, of which one-third involved<br />
copying; <strong>and</strong> another one-fifth of the time was spent<br />
on recitation, mostly involving students responding to<br />
teacher queries (Benveniste et al., 2008).<br />
In Ug<strong>and</strong>a, a study of 742 lower secondary school<br />
classrooms showed teachers struggling to make<br />
connections to students’ everyday life experiences<br />
<strong>and</strong> unlikely to provide specific feedback (Seidman et<br />
al., 2015). In Ethiopia, a study of 776 primary school<br />
mathematics classes assessed implementation of<br />
government policy to shift away from teacher-oriented<br />
learning methods. The target was 30% of class time spent<br />
on student-centred activity, but only 11% was reached,<br />
compared with 74% on teacher-oriented activities <strong>and</strong><br />
15% off task (Frost <strong>and</strong> Little, 2014).<br />
Classroom observation tools expect observers to use<br />
varying levels of subjective judgement. Low inference<br />
tools gather information on environments, time use<br />
<strong>and</strong> interactions between the teacher <strong>and</strong> students<br />
without drawing immediate conclusions. They focus<br />
on directly observable actions that are easy to code<br />
using checklists. Tools are administered by experts for<br />
research, monitoring <strong>and</strong> evaluation purposes <strong>and</strong> by<br />
district supervisors or instructional coaches to provide<br />
feedback to teachers as part of a support mechanism<br />
(RTI International, 2016a).<br />
High inference tools are more informal <strong>and</strong> open-ended.<br />
Observers must use their own judgement about what<br />
happens in the classroom <strong>and</strong> code teacher practices<br />
<strong>and</strong> student behaviour with more nuance. While these<br />
tools provide more insights, they are costly because<br />
they require extensive training to ensure reliability<br />
<strong>and</strong> consistency.<br />
Whether classroom observation tools can be used for<br />
comparing classroom instruction across countries is<br />
debatable. Classroom behaviour depends on systemlevel<br />
factors, such as government education policies,<br />
<strong>and</strong> differences in the home, such as household living<br />
conditions. In addition, classroom practices vary according<br />
to cultural beliefs <strong>and</strong> expectations. No single tool can<br />
meet the needs of all countries (Jukes et al., 2006).<br />
Yet, despite these limitations, the studies reviewed here<br />
often agree on what inhibits learning in classrooms<br />
around the world. The availability of broadly consistent<br />
monitoring tools can bring critical issues of pedagogy<br />
192<br />
CHAPTER 10 | TARGET 4.1 – PRIMARY AND SECONDARY EDUCATION
10<br />
<strong>and</strong> classroom climate to policy-makers’ attention. It<br />
is thus important to keep searching for tools that are<br />
adaptable yet reliable, valid, cost-efficient <strong>and</strong> easy to<br />
use at scale.<br />
LEARNING OUTCOMES<br />
Education systems have traditionally measured whether<br />
children go to school rather than whether learners<br />
benefit from their schooling experience, let alone what<br />
happens inside schools <strong>and</strong> classrooms. The focus has<br />
gradually shifted over the past 15 years, however, with<br />
the rapid increase in the use of national, regional <strong>and</strong><br />
international learning assessments.<br />
Target 4.1 echoes this shift. Its message is that the<br />
completion of primary <strong>and</strong> secondary education should<br />
lead to ‘relevant <strong>and</strong> effective learning outcomes’. The<br />
GEM Report welcomes this change in focus. All education<br />
systems need to find ways to improve a wide range of<br />
learning outcomes. Benchmarks can help policy-makers<br />
underst<strong>and</strong> where <strong>and</strong> with whom progress is not<br />
taking place, <strong>and</strong> what steps are needed to remedy the<br />
situation. However, questions arise as to which learning<br />
outcomes are ‘relevant <strong>and</strong> effective’, how they can be<br />
measured, <strong>and</strong> whether <strong>and</strong> how the information is used<br />
by those who enable learning.<br />
Proponents of a swift move to learning measurements<br />
that are comparable across countries argue they are<br />
long overdue (Study Group on Measuring Learning<br />
Outcomes, 2013). The plight of millions of children,<br />
especially in poorer countries, who do not master basic<br />
skills <strong>and</strong> competencies in primary school is insufficiently<br />
recognized <strong>and</strong> threatens the chances of achieving the<br />
SDGs. These learning outcomes need to be monitored<br />
in an internationally comparable fashion to maintain<br />
interest <strong>and</strong> mobilize policy responses.<br />
At the same time, focusing on a relatively limited set<br />
of skills that are more amenable to measurement risks<br />
marginalizing subjects <strong>and</strong> skills that are prioritized in<br />
each country’s curriculum (Muskin, 2015). Moreover,<br />
‘relevant <strong>and</strong> effective’ learning outcomes cannot be<br />
reduced to literacy <strong>and</strong> numeracy skills. They include<br />
much broader sets of knowledge, attitudes <strong>and</strong> skills,<br />
whose value is independent of their measurement<br />
status. Also, learning contexts are diverse; differences<br />
between countries can undermine the comparability<br />
of even a narrow set of skills like literacy <strong>and</strong> numeracy<br />
(Goldstein <strong>and</strong> Thomas, 2008). Finally, while largescale<br />
assessments are useful in tracking system-level<br />
performance, evidence is limited on how useful they are<br />
in guiding teacher training <strong>and</strong> classroom practices <strong>and</strong><br />
improving learning outcomes over time (Best et al., 2013).<br />
These vantage points – the need for comparison <strong>and</strong><br />
the challenges <strong>and</strong> consequences of comparison –<br />
represent a key issue in the global debate on learning.<br />
This directly relates to the need to report on the global<br />
indicator for target 4.1, i.e. the percentage of those in<br />
early primary, late primary <strong>and</strong> late lower secondary<br />
education achieving at least a minimum proficiency level<br />
in reading <strong>and</strong> mathematics (IIEP, 2015).<br />
In some ways, these<br />
The need for<br />
views can be bridged.<br />
The adage ‘don’t value<br />
comparison <strong>and</strong><br />
what you measure,<br />
the challenges <strong>and</strong> measure what you<br />
consequences of<br />
value’ is instructive.<br />
Improved proficiency<br />
comparison represent<br />
in the key foundation<br />
a key issue in the global skills of reading <strong>and</strong><br />
debate on learning, mathematics has value<br />
<strong>and</strong> clearly indicates<br />
<strong>and</strong> directly relate<br />
a well-functioning<br />
to country efforts to education system. And<br />
report on the global data on reading <strong>and</strong><br />
mathematics skills are<br />
indicator for target 4.1<br />
often used to explore<br />
the effects of learning<br />
on other development<br />
outcomes. But measuring proficiency in these areas<br />
requires sensitivity to national needs <strong>and</strong> circumstances.<br />
The project should be ‘open source’ <strong>and</strong> developed<br />
collaboratively <strong>and</strong> transparently.<br />
The next subsections describe three preconditions for<br />
the measurement of reading <strong>and</strong> mathematics skills:<br />
consensus on the content of the learning outcomes to be<br />
assessed, agreement on quality st<strong>and</strong>ards <strong>and</strong> a process<br />
to assure they are met, <strong>and</strong> a process to link information<br />
from various sources to produce a common measure.<br />
Challenges include (a) ensuring that assessments also<br />
serve other purposes beyond the relatively narrow<br />
objective to support global monitoring, (b) resolving the<br />
political – <strong>and</strong> not just the technical – dimensions of<br />
agreeing what is to be measured <strong>and</strong> compared <strong>and</strong><br />
(c) finding sustainable solutions with respect to finance<br />
2016 • GLOBAL EDUCATION MONITORING REPORT 193
10<br />
<strong>and</strong> resources. This is a tall order; solutions will inevitably<br />
be imperfect. However, various options are possible <strong>and</strong><br />
it is important to use open <strong>and</strong> inclusive approaches,<br />
taking into account country needs.<br />
LEARNING OUTCOME MEASURES:<br />
DEFINING THE CONTENT<br />
To define a minimum proficiency level in a domain such<br />
as reading or mathematics, a learning assessment needs<br />
to set basic parameters (Anderson <strong>and</strong> Morgan, 2008).<br />
First, what are the boundaries of the domain being<br />
assessed? In most countries, these are determined by<br />
curriculum contents. What happens when common<br />
ground must be found between differing national or<br />
subnational contents? Second, what is an expected<br />
progression of learning within these boundaries in<br />
primary <strong>and</strong> secondary education? Third, what questions<br />
<strong>and</strong> responses demonstrate that a learner has reached a<br />
particular level of proficiency, i.e. what evidence is used<br />
to determine whether specific skills have been acquired?<br />
How should test questions be allocated across content<br />
areas? How are proficiency levels defined <strong>and</strong> what<br />
criteria used to distinguish between them?<br />
Agreement is possible, though it does not come easily.<br />
The 2013 Third Regional Comparative <strong>and</strong> Explanatory<br />
Study (TERCE) was coordinated by the Latin American<br />
Laboratory for Assessment of the Quality of Education,<br />
a network of national education quality assessment<br />
directors, with the support of the UNESCO Regional<br />
Bureau for Education in Latin America <strong>and</strong> the Caribbean.<br />
It was administered in 15 countries, in grades 3 <strong>and</strong> 6,<br />
in reading, mathematics, natural sciences <strong>and</strong> writing,<br />
with questions based on analysis of common crosscurricular<br />
elements.<br />
Each domain was benchmarked to four proficiency<br />
levels jointly determined with experts. For example,<br />
at grade 3, students at level 2 of reading proficiency<br />
were expected to locate explicit information, infer<br />
information from connections made in the text,<br />
establish links that demonstrated underst<strong>and</strong>ing of<br />
the text’s overall meaning, <strong>and</strong> recognize a non-literary<br />
text’s communication purpose. Students at level 2 of<br />
mathematics proficiency were expected to read <strong>and</strong><br />
write numbers, interpret simple fractions, extract<br />
information from tables <strong>and</strong> graphs, <strong>and</strong> identify<br />
measurement units, relative positions of objects on<br />
maps <strong>and</strong> elements on geometric shapes. Different<br />
descriptions applied to level 2 at grade 6.<br />
The assessment found that, across the 15 countries,<br />
60% of grade 3 <strong>and</strong> 82% of grade 6 students were at<br />
level 2 <strong>and</strong> above in reading, <strong>and</strong> 53% of both grade<br />
3 <strong>and</strong> grade 6 students were at level 2 <strong>and</strong> above in<br />
mathematics. In the Dominican Republic, just 15% of<br />
grade 3 <strong>and</strong> 20% of grade 6 students were at level 2 <strong>and</strong><br />
above in mathematics. In Chile, about 85% of grade 3<br />
<strong>and</strong> grade 6 students achieved this proficiency level<br />
(UNESCO, 2015g) (Figure 10.9).<br />
However, the 2013 TERCE used a different scale to report<br />
scores than its predecessor, the 2006 SERCE. To ensure<br />
results could be made comparable over time, a High Level<br />
Consultative Technical Council was established to advise<br />
national coordinators. Countries were closely involved in<br />
the process of reaching consensus <strong>and</strong> communicating<br />
the change. Even though Latin American countries’<br />
education systems share many features, negotiation<br />
was required.<br />
A similar process will be needed at the global level to<br />
define what areas of existing national <strong>and</strong> cross-national<br />
assessments can be used, how learning progression in<br />
these areas is understood, <strong>and</strong> which questions in these<br />
assessments best capture this progression.<br />
Achieving agreement for a global indicator of minimum<br />
proficiency is difficult. Curriculum experts, policymakers<br />
<strong>and</strong> education managers should be involved. Two<br />
examples of challenges are discussed below: assessing<br />
learning outcomes in early grades <strong>and</strong> among out-ofschool<br />
populations.<br />
Assessing skills in early grades<br />
A highly contested issue in developing global indicators<br />
for monitoring SDG 4 was whether early grades would<br />
be included as a distinct stage in assessing reading <strong>and</strong><br />
mathematics learning outcomes. In a letter to the United<br />
Nations Statistical Commission, more than 200 civil<br />
society organizations (CSOs) <strong>and</strong> education professionals<br />
expressed deep concern about ‘the last-minute inclusion<br />
of early grade assessment among the global indicators’<br />
(Global Campaign for Education, 2016). By contrast, the<br />
People’s Action for Learning (PAL) Network, consisting of<br />
CSOs in nine countries that support citizen-led learning<br />
assessments, has advocated ‘for the continued inclusion<br />
of an indicator that measures learning progress early<br />
[in primary education] … to support timely corrective<br />
measures’ (PAL Network, 2016).<br />
194<br />
CHAPTER 10 | TARGET 4.1 – PRIMARY AND SECONDARY EDUCATION
10<br />
FIGURE 10.9:<br />
In Latin America, almost 50% of grade 3 <strong>and</strong> 6 students do not reach the minimum proficiency level in mathematics<br />
Percentage of grade 3 <strong>and</strong> grade 6 students at level 2 of proficiency <strong>and</strong> above, selected countries, 2013<br />
a. Reading b. Mathematics<br />
100 100<br />
Percentage of students at level 2 <strong>and</strong> above<br />
in reading (%)<br />
Percentage of students at level 2 <strong>and</strong> above<br />
in mathematics (%)<br />
80 80<br />
60 60<br />
40 Grade 3 40<br />
Grade 3<br />
20 20<br />
Grade 6 Grade 6<br />
0 0<br />
Dominican Rep.<br />
Paraguay<br />
Nicaragua<br />
Panama<br />
Guatemala<br />
Honduras<br />
Argentina<br />
Ecuador<br />
Brazil<br />
Mexico<br />
Peru<br />
Colombia<br />
Uruguay<br />
Costa Rica<br />
Chile<br />
Dominican Rep.<br />
Nicaragua<br />
Paraguay<br />
Guatemala<br />
Panama<br />
Honduras<br />
Colombia<br />
Ecuador<br />
Peru<br />
Argentina<br />
Brazil<br />
Uruguay<br />
Mexico<br />
Costa Rica<br />
Chile<br />
Source: UNESCO (2015g).<br />
Early grade learning achievement owes its inclusion<br />
in the global indicator for target 4.1 to the remarkable<br />
influence of two types of oral assessments that began<br />
in the mid-2000s: school-based assessments, notably<br />
the Early Grade Reading Assessment (EGRA) <strong>and</strong> Early<br />
Grade Math Assessment (EGMA), funded by USAID in<br />
low <strong>and</strong> middle income countries; <strong>and</strong> household-based<br />
assessments, notably the Annual Status of Education<br />
Report (ASER) in India, a citizen-led assessment, which<br />
generated an assessment approach since followed in<br />
nine countries <strong>and</strong> coordinated by the PAL Network.<br />
Both approaches revealed that millions of children in<br />
poorer countries were learning at a level well below what<br />
is expected (UIS, 2016e).<br />
EGRA was developed as a reliable <strong>and</strong> valid measure<br />
of skills that contribute to reading acquisition in three<br />
domains: sensitivity to language at the level of its<br />
sound structure, underst<strong>and</strong>ing about the orthographic<br />
system <strong>and</strong> written language, <strong>and</strong> underst<strong>and</strong>ing about<br />
words in their written forms (Dubeck <strong>and</strong> Gove, 2015).<br />
Special attention was paid to oral reading fluency as an<br />
indicator linked to reading comprehension. About one in<br />
five grade 3 students could not read a single word from<br />
a grade 2 passage in middle income countries such as<br />
Guyana, Jordan <strong>and</strong> Iraq. In a poorer country, Malawi,<br />
90% of grade 2 students could not read a single word in<br />
Chichewa in 2012 (Figure 10.10). Almost 40% could still<br />
not do so by the time they were in grade 4 (RTI, 2015).<br />
The percentage of those unable to read a single word or<br />
sentence is a basic indicator that could be used for crossnational<br />
monitoring. However, more nuanced measures<br />
are not suited for the purpose. Critics point out that<br />
while the cognitive processes involved in learning to<br />
read are universal, they are mediated through contexts,<br />
literacy environments <strong>and</strong> the availability of teaching<br />
<strong>and</strong> learning materials. The process varies by student<br />
motivation, student <strong>and</strong> teacher beliefs, <strong>and</strong> – especially<br />
– language <strong>and</strong> script (Bartlett et al., 2015). A large-scale<br />
review concluded that although ‘most oral assessments<br />
measure the same reading constructs … differences<br />
in language structure <strong>and</strong> complexity make direct<br />
comparison of the results impractical’, especially in the<br />
case of a task such as oral reading fluency (UIS, 2016e,<br />
pp. 293-4).<br />
Despite the debate on measuring learning outcomes in<br />
early grades, efforts continue to identify early skills that<br />
can be measured <strong>and</strong> compared. A prominent example<br />
2016 • GLOBAL EDUCATION MONITORING REPORT 195
10<br />
FIGURE 10.10:<br />
Early grade reading assessments reveal that many children are unable to read a single word after two or three years in school<br />
Percentage of grade 2 <strong>and</strong> grade 3 students who scored zero in oral reading fluency, selected countries <strong>and</strong> languages, 2009–2014<br />
100<br />
Students who could not read any words<br />
from a grade 2 passage (%)<br />
80<br />
60<br />
40<br />
20<br />
0<br />
Malawi, 2012, Chichewa<br />
Fulfulde<br />
Bomu<br />
Songhoi<br />
Bamanankan<br />
Gonja<br />
Dabgani<br />
Dagaare<br />
Asanti<br />
Kasem<br />
Ewe<br />
Ga<br />
English<br />
Fante<br />
Akuapem<br />
Nzema<br />
Dangme<br />
Nepal, 2014, Nepali<br />
Guyana, 2008, English<br />
Iraq, 2012, Arabic<br />
U. R. Tanzania, 2013, Kiswahili<br />
Jordan, 2012, Arabic<br />
Nicaragua, 2008, Spanish<br />
Mali, 2009 Ghana, 2013<br />
Guyana, 2008, English<br />
Jordan, 2012, Arabic<br />
Nepal, 2014, Nepali<br />
Iraq, 2012, Arabic<br />
Senegal, 2009, French<br />
Nicaragua, 2008, Spanish<br />
Grade 2 Grade 3<br />
Source: RTI (2015).<br />
is a learning module added to the forthcoming round<br />
of UNICEF’s Multiple Indicator Cluster Surveys (MICS)<br />
(Box 10.3). It <strong>and</strong> other initiatives underscore the need<br />
to balance a sound theoretical approach with practical<br />
considerations, which will likely delay agreement on<br />
cross-nationally valid measures <strong>and</strong> benchmarks.<br />
Assessing skills in out-of-school populations<br />
One weakness of the global indicator is that it focuses<br />
on monitoring learning outcomes of those in school<br />
rather than all children; many consider the latter more<br />
appropriate for an agenda that aims to leave no one<br />
behind. Reporting learning outcomes only for those in<br />
school will overestimate the percentage of children who<br />
attain agreed reading <strong>and</strong> numeracy benchmarks.<br />
Citizen-led assessments are preferable because they<br />
are administered to all children <strong>and</strong> youth in a given<br />
age group, regardless of whether they are or have been<br />
enrolled in school. In rural Pakistan, the 2014 ASER<br />
survey found the proportion of students in grade 6 who<br />
could read a grade 2 level story in Urdu, Sindhi or Pashto<br />
was 65% while among all children aged 10 (the theoretical<br />
grade 6 age) the share was 31%. Many 10-year-olds had<br />
never been to school, had already left (often because of<br />
not benefiting from the experience) or were in a lower<br />
grade <strong>and</strong> had not yet developed reading skills. While<br />
89% of grade 10 students could read a very simple<br />
text, only 64% of sampled 14-year-olds could do so, a<br />
difference of 25 percentage points (Figure 10.11a). Similar<br />
results emerge from analysis of the 2013 Uwezo survey<br />
in the United Republic of Tanzania (Figure 10.11b). These<br />
comparisons illustrate that the global indicator is flawed<br />
in its current form.<br />
That said, including out-of-school children <strong>and</strong><br />
adolescents in learning assessments has its own<br />
challenges. As out-of-school populations have lower<br />
skills on average, levels of difficulty might have to be<br />
reconfigured. This could reduce the levels’ relevance for<br />
those in school because they would give less information<br />
about higher skill levels.<br />
196<br />
CHAPTER 10 | TARGET 4.1 – PRIMARY AND SECONDARY EDUCATION
10<br />
BOX 10.3<br />
A new module on learning outcomes in Multiple Indicator Cluster Surveys<br />
Inspired by the need to create tools to measure the equity <strong>and</strong> learning dimensions of SDG 4, UNICEF is developing a new module in its MICS household<br />
survey programme to provide a snapshot of reading <strong>and</strong> mathematics learning outcomes. The module will be administered to 7- to 14-year-olds, including<br />
those who do not attend school. This information is expected to show whether children have basic reading <strong>and</strong> mathematics skills across a large sample of<br />
countries <strong>and</strong> their links to home environments <strong>and</strong> individual characteristics.<br />
The mathematics skills to be assessed relate to number sense <strong>and</strong> operations, such as reading numbers, comparing numbers, doing addition <strong>and</strong><br />
recognizing patterns. These are considered foundational <strong>and</strong> predictive of further skills development.<br />
Two reading skills will be assessed: oral reading accuracy <strong>and</strong> reading comprehension. The ability to read accurately predicts reading comprehension reliably.<br />
The module will include a short text for children to read aloud. Accuracy will be assessed by specially trained interviewers.<br />
Comprehension is the ultimate goal of reading <strong>and</strong> should be the focus of any assessment of reading skills, although a household survey imposes<br />
serious constraints. Two to three literal comprehension questions will ask readers to retrieve information directly from the text. One to two inferential<br />
comprehension questions will call for readers to underst<strong>and</strong> relationships that may not be explicitly stated in the text. Research showed that just three<br />
questions can be used to assess reading comprehension almost as well as a larger number.<br />
Indicators from the module will include the percentage of children who demonstrate early reading <strong>and</strong> number skills, based on the mastery of the tasks<br />
assessed in the module. Before the skills assessment, a set of questions will collect important background information while establishing rapport with the<br />
child. Questions will address parental involvement, such as how frequently parents read or tell oral stories to the children; language, including the home<br />
language; medium of instruction; <strong>and</strong> preferred language of the test (see Chapter 14).<br />
Important logistical issues should be considered. A major task is establishing a mechanism to ensure texts <strong>and</strong> questions follow general guidelines. This will<br />
also require creating a repository of word lists (from textbooks), texts <strong>and</strong> questions. Interviewers will require special training. It will also be necessary to<br />
ensure children can answer the questions without intrusion. Finally, sample designs must allow disaggregation by grade, age <strong>and</strong> socio-economic status.<br />
Sources: Cardoso <strong>and</strong> Dowd (2016); UNICEF (2015c).<br />
FIGURE 10.11:<br />
Whether indicators cover all students or all children can make a huge difference to global reporting<br />
a. Percentage of children by grade attended <strong>and</strong> by age who can<br />
read a grade 2 level story, Pakistan, 2014<br />
100 100<br />
b. Percentage of children by grade attended <strong>and</strong> by age<br />
who can do a grade 2 multiplication problem,<br />
United Republic of Tanzania, 2013<br />
Children who could read a grade 2 level story<br />
in Urdu, Sindhi or Pashto (%)<br />
Grade<br />
90 90<br />
Children who could do a grade 2 multiplication problem<br />
(%)<br />
80 80<br />
65% of grade 6<br />
70 children can read<br />
the story<br />
Age<br />
70<br />
60 60<br />
50 50<br />
40 40<br />
30<br />
31% of 10-year-old<br />
30<br />
children can read<br />
20 the story<br />
20<br />
10 10<br />
68% of grade 6 children<br />
can do a grade 2<br />
multiplication problem<br />
Grade<br />
51% of 12-year-old<br />
children can do a grade 2<br />
multiplication problem<br />
Age<br />
0 0<br />
Age 5 6 7 8 9 10 11 12 13 14 Age 7 8 9 10 11 12 13 14 15 16<br />
Grade 1 2 3 4 5 6 7 8 9 10 Grade 1 2 3 4 5 6 7 8 9 10<br />
Source: GEM Report team analysis using Pakistan ASER <strong>and</strong> United Republic of Tanzania Uwezo data.<br />
2016 • GLOBAL EDUCATION MONITORING REPORT 197
10<br />
Take PISA for Development, which aims to administer a<br />
learning assessment not just to those in school, as the<br />
main Programme for International Student Assessment<br />
survey does, but to all 14- to 16-year-olds found in<br />
sampled households. It will be administered in four Latin<br />
American <strong>and</strong> two sub-Saharan African countries in<br />
2018. Due to the prospect of low skills in out-of-school<br />
populations, the conceptual framework for reading<br />
literacy has extended the main PISA framework to<br />
lower levels of reading proficiency for better coverage of<br />
basic processes such as literal reading comprehension<br />
(OECD, 2016c).<br />
These examples highlight the contested nature of<br />
measuring learning outcomes. The choice of a learning<br />
assessment in Nigeria provides another example of<br />
potential trade-offs (Box 10.4). In short, the need to<br />
balance a sound theoretical approach with numerous<br />
practical considerations is likely to influence whether<br />
agreement on cross-national measures <strong>and</strong> benchmarks<br />
can be reached.<br />
LEARNING OUTCOME MEASUREMENT TOOLS:<br />
ASSURING ASSESSMENT QUALITY<br />
Agreeing what areas to assess is a critical first<br />
step, which needs to be followed by consensus on<br />
measurement tools. One thematic SDG indicator<br />
is whether a country has carried out nationally<br />
representative learning assessments during primary<br />
education, at the end of primary <strong>and</strong> at the end of<br />
lower secondary. Its objective is to raise awareness of<br />
the need for countries to monitor learning outcomes<br />
through regular, good quality assessments during<br />
primary <strong>and</strong> secondary education. The indicator could<br />
further encourage the development <strong>and</strong> use of national<br />
assessments to inform global learning measures,<br />
alongside existing <strong>and</strong> newly proposed regional <strong>and</strong><br />
international assessments.<br />
National assessments focus on system-level learning<br />
outcomes using criteria set by education authorities.<br />
They are generally low stakes <strong>and</strong> differ from high stakes<br />
public examinations, which are used for certification,<br />
institutional tracking or selection to higher levels of<br />
education. The UIS Catalogue of Learning Assessments<br />
collects information on their scope, purpose, funding <strong>and</strong><br />
design <strong>and</strong> the dissemination of results (UIS, 2014b). Its<br />
first version included 65 examples of assessments from<br />
29 countries; a second version is being designed.<br />
BOX 10.4<br />
Assessing learning outcomes in Nigeria<br />
Nigeria’s National Assessment of Learning Achievement in Basic<br />
Education (NALABE) has been administered four times since 2001<br />
by the Universal Basic Education Commission, the federal agency<br />
that works with state education ministries in delivering primary<br />
<strong>and</strong> lower secondary education. In the most recent round, in 2011,<br />
students in primary grades 4, 5 <strong>and</strong> 6 <strong>and</strong> lower secondary grade 1<br />
were assessed in English, mathematics <strong>and</strong> life skills in more than<br />
1,500 schools. The results were published as percentage scores<br />
with no reference to proficiency level. There was also no indication<br />
whether results could be compared over time.<br />
Unlike neighbouring countries, Nigeria is not involved in crossnational<br />
assessments. It participated in the UNESCO-UNICEF<br />
Monitoring Learning Achievement project in 1996 <strong>and</strong> 2003. To the<br />
extent that results were comparable across countries, they showed<br />
the performance of Nigerian students to be among the weakest in<br />
sub-Saharan Africa.<br />
A citizen-led, household-based assessment, Let’s Engage, Assess,<br />
<strong>and</strong> Report Nigeria (LEARNigeria), is to be launched in six states in<br />
2017. The Lagos-based Education Partnership Centre is coordinating<br />
LEARNigeria in collaboration with over 30 private <strong>and</strong> public<br />
agencies. A pilot survey in Kano <strong>and</strong> Lagos states in late 2015<br />
assessed about 2,000 children aged 5 to 15 for basic numeracy <strong>and</strong><br />
English <strong>and</strong> Hausa literacy.<br />
The new initiative followed publication of findings from the<br />
first review of the impact of citizen-led assessments. Key<br />
recommendations included reducing assessment frequency,<br />
broadening the set of assessed skills <strong>and</strong> developing<br />
communication strategies. The results led ASER India to decide<br />
not to carry out its 2015 survey so as to think through its future<br />
strategy. Citizen-led assessments mainly aim to raise awareness<br />
of actual learning outcomes <strong>and</strong> push government to act. Their<br />
success is now putting pressure on them to increase their scope<br />
<strong>and</strong> sophistication.<br />
Sources: Nigeria UBEC (2013); PAL Network (2015); Results for<br />
Development (2015).<br />
Global mapping for the 2015 EFA Global Monitoring Report<br />
(Benavot <strong>and</strong> Köseleci, 2015) provides an overall picture<br />
of the availability <strong>and</strong> external characteristics of national<br />
assessments. Most take place in upper primary school<br />
grades. Of the 135 countries that conducted at least one<br />
198<br />
CHAPTER 10 | TARGET 4.1 – PRIMARY AND SECONDARY EDUCATION
10<br />
assessment between 2007 <strong>and</strong> 2013, 75 did so in grades<br />
1 to 3, 123 in grades 4 to 6, 88 in grades 7 to 9 <strong>and</strong> 45 in<br />
grades 10 to 12. Almost all national assessments tested<br />
language (reading <strong>and</strong> writing) <strong>and</strong> mathematics; 53% of<br />
countries tested learning outcomes in natural/physical<br />
sciences, 34% in social sciences <strong>and</strong> 34% in foreign<br />
languages (Figure 10.12).<br />
Carrying out national assessments regularly helps<br />
consolidate education systems, as it spurs dem<strong>and</strong><br />
for timely data, especially when education reforms are<br />
being implemented. Yet there are significant variations<br />
by country. About one-third of national assessments<br />
in the UIS catalogue, including those of the Dominican<br />
Republic, Mauritius <strong>and</strong> Zimbabwe, are administered<br />
annually (UIS, 2016d). Some countries that carry out<br />
annual assessments rotate subjects. In Chile, the tested<br />
grades <strong>and</strong> subjects alternate to make more time<br />
<strong>and</strong> resources available for substantive data analysis<br />
(Ferrer, 2006).<br />
Apart from assessments’ availability, it will be necessary<br />
to establish clear st<strong>and</strong>ards for them <strong>and</strong> to introduce<br />
a strong mechanism to assure their quality. Ultimately,<br />
only assessments of good quality should be used to<br />
inform a global indicator on learning outcomes.<br />
Setting quality st<strong>and</strong>ards for national assessments<br />
Two dimensions of assessment quality are relevant.<br />
First, an enabling institutional context needs to<br />
ensure sustainability <strong>and</strong> strong links with the<br />
education system. Second, assessments should be<br />
valid <strong>and</strong> reliable, providing relevant information to<br />
policy-makers <strong>and</strong> the public, without interference or<br />
compromising factors.<br />
An enabling context is the key driver of long-term<br />
effectiveness of an assessment system. It requires<br />
supportive policies <strong>and</strong> institutions, <strong>and</strong> sufficient<br />
financial <strong>and</strong> human resources (Clarke, 2012). Broad<br />
political support is needed, since results could reveal<br />
serious challenges or inequality in learning. Over the last<br />
two decades in Brazil, committed <strong>and</strong> stable political<br />
leadership <strong>and</strong> support enabled the development of a<br />
strong, large-scale national assessment programme<br />
(Castro, 2012).<br />
Among 24 countries reviewed in the World Bank<br />
Systems Approach for Better Education Results (SABER)<br />
programme on student assessment since 2009, only<br />
Samoa, Ug<strong>and</strong>a, the United Arab Emirates <strong>and</strong> Zambia<br />
were considered to have established an enabling context,<br />
mostly as a result of external support. A legal document<br />
FIGURE 10.12:<br />
Most national assessments test learning outcomes in language <strong>and</strong> mathematics<br />
Percentage of countries that tested a particular subject among those that carried out at least one national assessment during the period,<br />
1990–1999, 2000–2006 <strong>and</strong> 2007–2013<br />
100<br />
100<br />
97<br />
100<br />
96<br />
96<br />
98<br />
90<br />
80<br />
70<br />
Countries (%)<br />
60<br />
50<br />
40<br />
30<br />
20<br />
10<br />
47<br />
51<br />
53<br />
31<br />
32<br />
34 34<br />
20<br />
22<br />
33<br />
24<br />
13<br />
0<br />
Language<br />
Mathematics<br />
Sciences<br />
Social sciences Foreign language Other<br />
Source: Benavot <strong>and</strong> Köseleci (2015).<br />
1990–1999 2000–2006 2007–2013<br />
2016 • GLOBAL EDUCATION MONITORING REPORT 199
10<br />
m<strong>and</strong>ating a particular assessment activity can ensure<br />
continuity. There is a formal policy in place in more than<br />
half the countries reviewed by SABER, including Ghana,<br />
Kazakhstan <strong>and</strong> Sri Lanka (World Bank, 2016a).<br />
Regular funding is also required. Yet only in one-third<br />
of the countries reviewed by SABER was a budget<br />
allocated to the national assessment programme.<br />
In Armenia, where a national assessment was carried<br />
out in 2010 to assess grade 8 students in language <strong>and</strong><br />
history, regular funding is provided to the Assessment<br />
<strong>and</strong> Testing Centre (World Bank, 2011). In Zambia, the<br />
budget funds all national assessment activities while aid<br />
from development partners is used for supplementary<br />
support (OECD <strong>and</strong> World Bank, 2014). Public funding<br />
of national assessments can be weak; in Pakistan,<br />
the activities of the National Education Assessment<br />
System, financed by the World Bank, waned when<br />
responsibility was transferred to provincial governments<br />
(Dundar et al., 2014).<br />
An assessment should be carried out by organizations<br />
whose work is recognized, respected <strong>and</strong> widely<br />
accepted. SABER reports indicate that 60% of countries<br />
had a stable national assessment body. In Ug<strong>and</strong>a,<br />
putting the National Examinations Board in charge of<br />
assessments has clarified institutional structures <strong>and</strong><br />
improved development <strong>and</strong> implementation (Kanjee <strong>and</strong><br />
Acana, 2013).<br />
A widely debated issue is whether assessment bodies<br />
should be attached to ministries of education. Many<br />
Latin American countries have made significant<br />
changes in institutional arrangements. Ecuador<br />
established its National Education Evaluation Institute<br />
in 2012, transferring responsibility from the Ministry<br />
of Education, in response to a m<strong>and</strong>ate in the new<br />
constitution. In Brazil, Colombia <strong>and</strong> Mexico, bodies have<br />
seen their autonomy strengthen <strong>and</strong> responsibilities<br />
broaden through sheer practice or legal provisions. But<br />
some specialized education ministry units have also<br />
been successful, as in Guatemala <strong>and</strong> Peru (Ferrer <strong>and</strong><br />
Fiszbein, 2015).<br />
Another issue is capacity. National assessments<br />
require experts to act as national <strong>and</strong> regional<br />
coordinators, item writers, statisticians, data managers<br />
<strong>and</strong> translators. The pool of qualified professionals<br />
for such highly specialized positions is limited. Some<br />
tertiary education departments lack programmes in<br />
education statistics <strong>and</strong> measurement. Many qualified<br />
professionals move to other government posts or the<br />
private sector, or pursue graduate studies abroad.<br />
Only six countries with SABER reports were considered<br />
adequately staffed (World Bank, 2016a). Of the two<br />
poorest, the Democratic Republic of the Congo relied<br />
heavily on an EGRA project; only Mauritania had a strong<br />
team, although staff were mainly temporary or part time<br />
(World Bank, 2013e, 2014a).<br />
As to the second dimension of assessment quality,<br />
countries need to take steps to assure a valid <strong>and</strong> reliable<br />
national assessment programme. Many assessment<br />
units’ technical reports are unavailable or not sufficiently<br />
detailed to establish whether these criteria are met. Only<br />
four SABER countries made comprehensive, high quality<br />
technical reports publicly available: Mauritania, Ug<strong>and</strong>a,<br />
the United Arab Emirates <strong>and</strong> Viet Nam.<br />
Concerns related to field operations may affect<br />
the perceived representativeness <strong>and</strong> legitimacy of<br />
assessment results. Almost half the countries with<br />
SABER reports, including Mozambique <strong>and</strong> Sudan, had no<br />
regular internal review mechanism (World Bank, 2016a).<br />
In Serbia, the quality of test items <strong>and</strong> instruments in<br />
the National Assessment of Fourth Grade Students was<br />
verified by external experts <strong>and</strong> psychometric analysis.<br />
A st<strong>and</strong>ardized administration manual is used (World<br />
Bank, 2012a). In Latin America, many technical reports do<br />
not indicate the criteria used to judge item validity, such<br />
as cultural biases, nor do they comment on curricular<br />
relevance or comparability across years (Ferrer, 2006).<br />
Ensuring learning assessment quality st<strong>and</strong>ards <strong>and</strong><br />
providing support<br />
Providing a supportive enabling environment <strong>and</strong><br />
clear st<strong>and</strong>ards that help ensure reliability, validity<br />
<strong>and</strong> transparency is no easy matter. But doing so is<br />
critical if national assessment results are to be counted<br />
as valid sources for the global indicator. How can the<br />
international community be assured that national,<br />
regional or international assessments are fit for the<br />
purpose of global monitoring?<br />
This question raises two issues. First, if technical<br />
requirements of conducting assessments are overly<br />
stringent, then the institutional or organizational<br />
capacity needed to conduct them will be beyond the<br />
reach of many countries. As a result, a small pool of<br />
private service providers could dominate the business of<br />
learning assessments, undermining their relevance <strong>and</strong><br />
use by countries. Assessing learning outcomes for global<br />
monitoring should be seen, first <strong>and</strong> foremost, as a public<br />
good that contributes to country progress in education<br />
<strong>and</strong> sustainable development. It should not become an<br />
opportunity to increase market share.<br />
200<br />
CHAPTER 10 | TARGET 4.1 – PRIMARY AND SECONDARY EDUCATION
10<br />
The second issue is that resources to bolster the<br />
capacity to conduct robust learning assessments are<br />
not allocated efficiently. Some long-st<strong>and</strong>ing regional<br />
programmes have not received consistent financial<br />
support. Individual countries have also struggled at<br />
times to obtain funding to participate in assessment<br />
programmes. Donor support of national assessments<br />
has too often followed short-term objectives, which only<br />
rarely result in countries developing sustained capacity<br />
to build effective <strong>and</strong> well-used assessment systems<br />
(Box 10.5). Coordination is needed to allocate financial<br />
resources efficiently. A new initiative by the Global<br />
Partnership for Education, Assessment for Learning,<br />
has been proposed as a platform, the main aim being to<br />
strengthen national learning assessment systems (GPE<br />
et al., 2016).<br />
Ensuring the relevance of learning assessments for<br />
teaching <strong>and</strong> learning<br />
Global measures of learning outcomes ‘should <strong>and</strong><br />
indeed must link deliberately <strong>and</strong> strategically to the<br />
supreme aim of improving the quality <strong>and</strong> relevance of<br />
teaching <strong>and</strong>, ultimately, of learning’ (Muskin, 2016, p. 75).<br />
Critics say cross-national assessments often promise<br />
this direct link to improved learning but do not deliver it<br />
(Carnoy et al., 2015).<br />
For an assessment framework to be relevant, it must be<br />
aligned with education goals, student learning, <strong>and</strong> inservice<br />
<strong>and</strong> pre-service teacher development objectives.<br />
Countries need to ‘think purposefully <strong>and</strong> strategically<br />
about how best to choose <strong>and</strong> use student learning<br />
assessments’ to ensure relevance <strong>and</strong> impact (Muskin,<br />
2016, p. 57). The 2030 Agenda presents an opportunity<br />
for countries to strengthen national assessment<br />
systems while contributing to international efforts to<br />
compile comparable data on learning outcomes. External<br />
<strong>and</strong> domestic funding should provide sustained support<br />
for robust national assessment systems, aligned with<br />
country needs, rather than simply seeking results for<br />
global monitoring.<br />
LEARNING OUTCOME MEASURES: REPORTING<br />
RESULTS FROM VARIOUS ASSESSMENTS<br />
The third building block for a global measure of learning<br />
outcomes is agreement on reporting <strong>and</strong> defining<br />
benchmarks by level (or age) <strong>and</strong> subject (or domain).<br />
This entails developing a set of items from various<br />
assessments, which can be linked through analysis of their<br />
relative level of difficulty. Much technical knowledge on<br />
linking originates in the United States, where efforts were<br />
made to link state tests to the long-st<strong>and</strong>ing national<br />
BOX 10.5<br />
Multiple assessments but no national learning assessment<br />
system in the United Republic of Tanzania<br />
The United Republic of Tanzania has a formal system of examinations which<br />
the National Examinations Council administers at the end of the primary<br />
<strong>and</strong> secondary cycles. As in many countries, such high stakes examinations<br />
attract the interest of media, parents <strong>and</strong> politicians. This was especially<br />
so in 2012, when therewas a sudden drop in pass rates. In recent years, a<br />
growing number of donor-funded learning assessments have tried to shift<br />
attention from pass rates to literacy <strong>and</strong> numeracy skills.<br />
Uwezo, the first citizen-led assessment in eastern Africa, showed that only 1<br />
in 10 grade 3 students could read a grade 2 level story in English <strong>and</strong> only 3 in<br />
10 in Kiswahili in 2011. The 2010 World Bank Service Delivery Indicator survey<br />
also showed that less than 10% of grade 4 students could read correctly all<br />
the words in a short sentence in English.<br />
Learning assessments have been used to monitor <strong>and</strong> evaluate national or<br />
subnational donor programmes. For example, the government introduced<br />
an EGRA/EGMA survey of grade 2 students called 3Rs (Reading, Writing,<br />
Arithmetic) as part of the Big Results Now programme. It was also used for<br />
the results framework of the Literacy <strong>and</strong> Numeracy Education Support<br />
programme, a Global Partnership for Education initiative. And it was<br />
linked to a Programme for Results finance instrument of the World Bank,<br />
the United Kingdom Department for International Development <strong>and</strong> the<br />
Swedish International Development Cooperation Agency. Aid disbursements<br />
will be proportional to the increase in average Kiswahili reading speed,<br />
benchmarked at 18 words per minute in 2013.<br />
Results are not comparable across these studies <strong>and</strong>, sometimes, even<br />
within a particular study over time. These learning assessments are not yet<br />
managed by a single government agency <strong>and</strong>, as they are not only funded<br />
but also largely run by donors, it is doubtful that capacity is being built.<br />
Meanwhile, donors have used progress in learning outcomes, with their<br />
uncertain results, as a condition for aid disbursement. Aid could be used<br />
instead to help develop a robust <strong>and</strong> sustainable national student learning<br />
assessment system.<br />
The United Republic of Tanzania participated in the Southern Africa<br />
Consortium for Monitoring Educational Quality (SACMEQ) survey in 2000<br />
<strong>and</strong> 2007; this robust regional assessment enabled tracking across countries<br />
<strong>and</strong> over time. However, the country did not participate in the latest round,<br />
in 2013, because of a lack of external funding. And despite the proliferation of<br />
learning assessments in recent years, the main measure of success for the<br />
Big Results Now programme is the end-of-cycle examination pass rate.<br />
Sources: Rawle <strong>and</strong> Attfield (2015); Twaweza (2012); United Republic of<br />
Tanzania government (2013); World Bank (2012b).<br />
2016 • GLOBAL EDUCATION MONITORING REPORT 201
10<br />
assessment (Feuer et al., 1999). Still, linking items is not<br />
just a technical issue but a process fundamentally related<br />
to the intended purpose of the indicator (Mislevy, 1992).<br />
In the context of global monitoring, two key issues<br />
are worth considering. First, given the 2030 Agenda’s<br />
emphasis on leaving no one behind, accurate background<br />
information on the learners whose knowledge <strong>and</strong> skills<br />
are being assessed is essential. But the information is<br />
collected inconsistently by various assessments <strong>and</strong><br />
cannot be compared, especially when primary school-age<br />
children are expected to provide accurate information<br />
about their family circumstances. This hampers tracking<br />
the global indicator by population characteristics.<br />
Second is the need to collect pertinent information about<br />
cultural, linguistic <strong>and</strong> contextual elements to advance<br />
more valid interpretations of differences between<br />
countries. Take the 2014 CONFEMEN Programme for the<br />
Analysis of Education Systems (PASEC) survey, which<br />
FIGURE 10.13:<br />
Burundi outperformed its peers in terms of learning achievement – but why?<br />
Percentage of students, by proficiency level, selected sub-Saharan African countries, 2014<br />
a. Grade 2 b. Grade 6<br />
Language<br />
Language<br />
100 100<br />
80 80<br />
Level 4 Level 4<br />
60 60<br />
Level 3 Level 3<br />
%<br />
%<br />
40 Level 2 40<br />
Level 2<br />
Level 1<br />
20 <strong>and</strong> below 20<br />
Level 1<br />
<strong>and</strong> below<br />
0 0<br />
Niger<br />
Benin<br />
Togo<br />
%<br />
%<br />
Chad<br />
Côte d’Ivoire<br />
Senegal<br />
Cameroon<br />
Congo<br />
Burkina Faso<br />
Burundi<br />
Niger<br />
Chad<br />
Togo<br />
Congo<br />
Cameroon<br />
Côte d’Ivoire<br />
Benin<br />
Senegal<br />
Burkina Faso<br />
Burundi<br />
Niger<br />
Benin<br />
Togo<br />
Chad<br />
Côte d’Ivoire<br />
Senegal<br />
Cameroon<br />
Congo<br />
Burkina Faso<br />
Burundi<br />
Niger<br />
Chad<br />
Togo<br />
Congo<br />
Cameroon<br />
Côte d’Ivoire<br />
Benin<br />
Senegal<br />
Burkina Faso<br />
Burundi<br />
Mathematics<br />
Mathematics<br />
100 100<br />
80 80<br />
Level 3 Level 3<br />
60 60<br />
Level 2 Level 2<br />
40 Level 1 40<br />
Level 1<br />
Below<br />
20<br />
Level 1<br />
20<br />
Below<br />
Level 1<br />
0 0<br />
Source: PASEC (2015).<br />
202<br />
CHAPTER 10 | TARGET 4.1 – PRIMARY AND SECONDARY EDUCATION
10<br />
was administered<br />
For global monitoring of in 10 francophone<br />
sub-Saharan<br />
learning, information about<br />
African countries<br />
cultural <strong>and</strong> linguistic<br />
at grades 2 <strong>and</strong> 6<br />
context is needed<br />
in language <strong>and</strong><br />
mathematics<br />
(PASEC, 2015).<br />
The results showed Burundi outperforming all the other<br />
countries in each grade-subject combination. Only<br />
3% of grade 2 students were in the two lowest levels in<br />
language, while the average was 43% for all 10 countries<br />
(Figure 10.13). While Burundi was the poorest of the 10,<br />
it was the only one where the assessment was in the<br />
national language <strong>and</strong> language of instruction, not in<br />
French. Such information is essential for interpreting<br />
the results.<br />
CONCLUSION<br />
A recent review of learning assessments concludes<br />
they are ‘an effective <strong>and</strong> relevant way to judge<br />
that a population is acquiring the basic knowledge<br />
<strong>and</strong> competencies’ (Muskin, 2016, p. 4). But can<br />
they provide useful <strong>and</strong> valid information for global<br />
monitoring purposes?<br />
Numerous assessment sources demonstrate technical<br />
obstacles to reporting globally comparable learning<br />
indicators. Solutions will be imperfect <strong>and</strong> incomplete.<br />
When evaluating options, it is important to choose<br />
one that serves national needs as well as the aim of<br />
global monitoring.<br />
This chapter emphasized the importance of applying<br />
the criteria of inclusivity, efficiency <strong>and</strong> feasibility. It<br />
underscored the principle that learning assessments<br />
should be considered a public good, delivered in the<br />
broad interest of the <strong>people</strong>. They should enhance<br />
prospects for improving a broad range of learning<br />
outcomes <strong>and</strong> reduce student disparity. The recently<br />
established Global Alliance to Monitor Learning, which<br />
aims to harmonize assessment frameworks <strong>and</strong><br />
st<strong>and</strong>ards <strong>and</strong> help coordinate capacity-building efforts,<br />
is a welcome initiative. Clear governance mechanisms<br />
are needed to advance global collective action on these<br />
issues (UIS, 2016a).<br />
Globally, the drive to test <strong>and</strong> assess learning outcomes<br />
has taken root. Most countries are committed to<br />
assessing learning; a surprisingly large percentage<br />
already conduct national assessments or have<br />
participated in cross-national assessments to compare<br />
learning levels with their neighbours or other systems.<br />
And yet most low income countries face enormous<br />
challenges to monitoring learning, in <strong>and</strong> out of school,<br />
<strong>and</strong> to committing to act on findings. In such contexts,<br />
many assessment systems are ineffective or of low<br />
quality <strong>and</strong> attention by government <strong>and</strong> school leaders<br />
to improve learning outcomes, especially among the<br />
marginalized, is low <strong>and</strong> unsustained.<br />
One trap to avoid is focusing on a narrow range of<br />
assessed subjects. National curricular policies <strong>and</strong><br />
assessment approaches should be well aligned to gain<br />
legitimacy <strong>and</strong> set the stage for reform. Support for<br />
initial assessments in certain subject domains should<br />
be contingent on sustained future efforts to develop<br />
valid, high quality assessments in other areas, such as<br />
sustainability issues <strong>and</strong> global citizenship, which are<br />
critical for the larger sustainable development agenda<br />
(see Chapter 16). Knowledge <strong>and</strong> skills in these <strong>and</strong> other<br />
areas can <strong>and</strong> should be assessed.<br />
Countries should not see the need to report against<br />
a global measure as a constraint. They should not be<br />
required to participate in a cross-national assessment.<br />
This is an opportunity for countries to review their<br />
assessment strategies <strong>and</strong> invest in the approach<br />
that best serves their long-term interests. The next 15<br />
years st<strong>and</strong> a good chance of driving improvement in<br />
the quality of national assessments, facilitated by the<br />
establishment of an international peer network <strong>and</strong><br />
through efficient resource use.<br />
Finally, once a global measure of learning is in place,<br />
it is important to set realistic expectations about the<br />
progress possible by 2030. Evidence from international<br />
assessments suggests that improvement in the<br />
percentage of students reaching minimum proficiency<br />
in reading <strong>and</strong> mathematics tests is likely to remain<br />
modest during such a short time span (Clarke, 2016).<br />
2016 • GLOBAL EDUCATION MONITORING REPORT 203
11<br />
Early learning in<br />
Dublin, Irel<strong>and</strong>.<br />
CREDIT: Jason Clarke Photography/<br />
Department of Children <strong>and</strong> Youth Affairs,<br />
Irel<strong>and</strong><br />
KEY MESSAGES<br />
Comparing rates of participation in pre-primary education is difficult because age groups <strong>and</strong> starting ages differ<br />
a lot across countries. Pre-primary education is compulsory in 50 countries, <strong>and</strong> free <strong>and</strong> compulsory for at least<br />
one year in 38.<br />
Globally, 67% of children of pre-primary school age are attending school. However, available data sources do not yet<br />
allow a reliable global estimate of how many children benefit from at least one year of pre-primary education.<br />
Available data sources also do not fully capture the diversity of services providing learning opportunities for<br />
young children.<br />
Among 3- to 4-year-olds, the richest children are almost 6 times more likely to attend an early childhood<br />
education programme than the poorest.<br />
Quality st<strong>and</strong>ards of early childhood care <strong>and</strong> education need to be set, monitored <strong>and</strong> enforced.<br />
Early childhood development can be assessed in four areas: executive function, social <strong>and</strong> emotional development,<br />
motor development, <strong>and</strong> early literacy <strong>and</strong> numeracy.<br />
According to UNICEF, about 70% of 3-year-olds <strong>and</strong> 80% of 4-year-olds are developmentally on track in 56 low<br />
<strong>and</strong> middle income countries. However, this measure focuses strongly on literacy <strong>and</strong> numeracy. More research<br />
is needed on normative development of children in diverse cultures <strong>and</strong> contexts.<br />
204<br />
CHAPTER 11 | TARGET 4.2 – EARLY CHILDHOOD
11<br />
CHAPTER 11<br />
Sustainable Development Goal 4.2<br />
TARGET 4.2<br />
Early childhood<br />
By 2030, ensure that all girls <strong>and</strong> boys have access to quality early<br />
childhood development, care <strong>and</strong> pre-primary education so that they are<br />
ready for primary education<br />
GLOBAL INDICATOR 4.2.1 – Proportion of children under 5 years of age who are developmentally<br />
on track in health, learning <strong>and</strong> psychosocial well-being, by sex<br />
GLOBAL INDICATOR 4.2.2 – Participation rate in organized learning (one year before the official<br />
primary entry age), by sex<br />
THEMATIC INDICATOR 9 – Percentage of children under 5 years of age experiencing positive <strong>and</strong><br />
stimulating home learning environments<br />
THEMATIC INDICATOR 11 – Gross pre-primary enrolment ratio<br />
THEMATIC INDICATOR 12 – Number of years of (i) free <strong>and</strong> (ii) compulsory pre-primary education<br />
guaranteed in legal frameworks<br />
2016 • GLOBAL EDUCATION MONITORING REPORT 205
11<br />
Access <strong>and</strong> participation..................................................................................................... 206<br />
Quality........................................................................................................................................... 210<br />
Child development outcomes.............................................................................................213<br />
Target 4.2 reaffirms the focus of the international<br />
community on ensuring that all children receive a<br />
strong foundation through early childhood care <strong>and</strong><br />
education. In fact, compared with the first Education<br />
for All (EFA) goal, the 2030 Agenda for Sustainable<br />
Development goes beyond care <strong>and</strong> education as a<br />
means of meeting children’s learning needs, <strong>and</strong><br />
includes early childhood development as an outcome.<br />
This is expressed in the concept of school readiness,<br />
which covers physical, social/emotional <strong>and</strong> language/<br />
cognitive domains.<br />
This chapter identifies three monitoring challenges<br />
in relation to the concepts in target 4.2. The first, in<br />
regard to access <strong>and</strong> participation, is that no available<br />
source provides enough information on how many<br />
children benefit from pre-primary education – <strong>and</strong><br />
organized learning programmes more generally – for<br />
at least one year. Two complementary participationrelated<br />
indicators have been proposed, drawing on<br />
administrative <strong>and</strong> survey data, to address this.<br />
under the education Sustainable Development Goal<br />
(SDG) for which the Inter-agency <strong>and</strong> Expert Group on<br />
Sustainable Development Goal Indicators put forward<br />
two global indicators, complementing the outcome<br />
measure with a participation measure.<br />
ACCESS AND PARTICIPATION<br />
Comparing pre-primary education participation rates<br />
across countries is more difficult than comparing<br />
participation measures in primary <strong>and</strong> secondary<br />
education, for several reasons. First, the age groups<br />
<strong>and</strong> starting ages are less st<strong>and</strong>ardized in pre-primary<br />
education than at other levels. Almost half the world’s<br />
countries have a three-year pre-primary education age<br />
group, with children expected to first enrol at the age<br />
of 3. However, many other combinations of duration<br />
<strong>and</strong> starting age are common (Table 11.1). Calculating<br />
participation rates over such varied groups of children<br />
may lead to misleading conclusions.<br />
Second, none of the proposed indicators capture the<br />
quality of provision. This chapter discusses proposed<br />
approaches for assessing the quality of early childhood<br />
education settings <strong>and</strong> systems.<br />
Finally, the feasibility of introducing a monitoring<br />
mechanism for early childhood development is uncertain.<br />
That uncertainty is partly why this is the only target<br />
Second, relatively few countries have free <strong>and</strong>/or<br />
compulsory pre-primary education. Among the 207<br />
countries <strong>and</strong> territories, pre-primary education was<br />
compulsory in 50, <strong>and</strong> free <strong>and</strong> compulsory for at least<br />
one year in 38.<br />
Third, pre-primary education takes diverse forms. Nongovernment<br />
provision is common (accounting for 42%<br />
“<br />
Of 207 countries <strong>and</strong> territories, pre-primary education was<br />
compulsory in 50, <strong>and</strong> free <strong>and</strong> compulsory for at least one year in 38<br />
”<br />
206<br />
CHAPTER 11 | TARGET 4.2 – EARLY CHILDHOOD
11<br />
“<br />
In 2014, 44% of children were enrolled in<br />
pre-primary education worldwide<br />
“<br />
globally in 2014 <strong>and</strong> 58% in South-eastern Asia) but more<br />
likely to not be registered. A variety of programmes<br />
have learning components, not all of which are purely<br />
educational. As a result, some countries struggle to<br />
capture the full scale of provision.<br />
Fourth, the willingness <strong>and</strong> capacity of government to<br />
exp<strong>and</strong> pre-primary education provision has been limited<br />
in some countries. In many poorer ones, the intake<br />
rate into the first grade of primary school has been<br />
consistently in excess of 100% of the relevant population.<br />
One explanation is an absence of pre-primary classes<br />
to absorb the dem<strong>and</strong> (Crouch, 2015). Without preprimary<br />
access, parents enrol their children in primary<br />
classes to improve their school readiness, but they are ill<br />
prepared for them.<br />
These challenges affect the underst<strong>and</strong>ing of the<br />
real levels of participation in early childhood learning<br />
programmes, as a comparison of different indicators<br />
also shows.<br />
The most common indicator with the widest country<br />
coverage is the pre-primary gross enrolment ratio,<br />
which is the number of children enrolled in pre-primary<br />
education as a percentage of the population of children<br />
in the relevant age group.<br />
TABLE 11.1:<br />
Distribution of countries by pre-primary education duration<br />
<strong>and</strong> starting age, <strong>and</strong> whether it is free <strong>and</strong> compulsory<br />
Duration (years)<br />
Total<br />
1 2 3 4<br />
Starting age (years)<br />
3 - 25 103 20 148<br />
4 5 34 6 - 45<br />
5 5 8 - - 13<br />
6 1 - - - 1<br />
Total 11 67 109 20 207<br />
Free 14 27 30 8 79<br />
Compulsory 30 15 5 0 50<br />
Free <strong>and</strong> compulsory 22 12 4 0 38<br />
Sources: UIS database; GEM Report team calculations.<br />
”<br />
In 2014, the global gross enrolment ratio was 44%,<br />
considerably lower than in 2012 as a result of a large<br />
downward adjustment to the estimate for India. Indeed,<br />
Southern Asia is the region with the lowest participation<br />
rate at 18.5%, followed by sub-Saharan Africa (21.5%) <strong>and</strong><br />
Northern Africa <strong>and</strong> Western Asia (29%). Much higher<br />
rates are observed in Latin America <strong>and</strong> the Caribbean<br />
(73%), Eastern <strong>and</strong> South-eastern Asia (76%) <strong>and</strong> Europe<br />
<strong>and</strong> Northern America (85%).<br />
A variant of the indicator considers enrolment not only<br />
in pre-primary but in all early childhood education<br />
programmes. Among the 148 countries with data<br />
for both indicators, the median value increases by<br />
3 percentage points when accounting for these<br />
programmes. This includes 92 countries where there is no<br />
difference between the indicators but also 23 countries<br />
where the difference exceeds 20 percentage points: in<br />
Namibia, the enrolment ratio more than doubles, from<br />
21% to 55%, while in Indonesia, it increases from 58%<br />
to 95%. This raises the question whether other early<br />
childhood education programmes are consistently being<br />
captured across all countries.<br />
The Pacific is the region with the highest gross<br />
enrolment ratio, 98%. This is somewhat misleading,<br />
however, <strong>and</strong> gives a good example of the indicator’s<br />
weakness. As the gross enrolment ratio value for<br />
Australia is not reported, the regional value is imputed.<br />
When all early childhood education programmes were<br />
taken into account, however, Australia reported a<br />
gross enrolment ratio of 216% because its pre-primary<br />
education age lasts only one year (4-year-olds),<br />
compared with two years for New Zeal<strong>and</strong> (3- to 4-yearolds)<br />
<strong>and</strong> three years for Papua New Guinea (3- to<br />
5-year-olds).<br />
An alternative indicator is the net enrolment ratio: the<br />
number of children one year younger than the primary<br />
school entrance age who are enrolled in pre-primary<br />
education as a percentage of the population of that<br />
age group. This indicator is an improvement because it<br />
tries to control for the differences across countries by<br />
2016 • GLOBAL EDUCATION MONITORING REPORT 207
11<br />
considering a comparable age group. Its median value<br />
does not differ from that of the gross enrolment ratio.<br />
Ideally, this would be true for all countries, in which case<br />
the pair of values for the two indicators would lie on the<br />
diagonal line (Figure 11.1).<br />
But the values for individual countries can vary<br />
considerably, e.g. the pre-primary gross enrolment ratio<br />
for 4- to 5-year-olds in Costa Rica was 53% but the net<br />
enrolment ratio among 5-year-olds, the last year of preprimary<br />
education, was 93%. This suggests that almost<br />
all 5-year-olds are enrolled in pre-primary education but<br />
many 4-year-olds are not.<br />
Discrepancies are also observed in the opposite<br />
direction. The pre-primary gross enrolment ratio for<br />
Irel<strong>and</strong> was 108% but the net enrolment ratio among<br />
4-year-olds, the last year of pre-primary education,<br />
was 58%. This is because a considerable proportion<br />
of 4-year-olds are already enrolled in primary school,<br />
which means the official pre-primary education age<br />
group does not capture actual national enrolment<br />
patterns (OECD, 2015b).<br />
The UNESCO Institute for Statistics (UIS) recently<br />
developed an extension of this indicator. Called the<br />
adjusted net enrolment ratio, it captures the number<br />
FIGURE 11.1:<br />
Similar indicators of pre-primary education participation give different<br />
results in many countries<br />
Pre-primary gross enrolment ratio <strong>and</strong> net enrolment ratio in the last year of<br />
pre-primary education, 2014<br />
Net enrolment ratio, last year of<br />
pre-primary education (%)<br />
100<br />
80<br />
60<br />
40<br />
20<br />
0<br />
0<br />
Source: UIS database.<br />
Paraguay<br />
Honduras<br />
Costa Rica<br />
Ecuador<br />
20 40 60 80 100<br />
Pre-primary gross enrolment ratio (%)<br />
Switzerl<strong>and</strong><br />
Irel<strong>and</strong><br />
U. A. Emirates<br />
120 140<br />
of children one year younger than the primary school<br />
entrance age who are enrolled in pre-primary or<br />
primary education as a percentage of the population<br />
of that age group. Globally, data from 135 countries<br />
show the adjusted net enrolment ratio to be equal to<br />
67%. This indicator is being used as a proxy for global<br />
indicator 4.2.2.<br />
Another indicator – the percentage of new entrants to<br />
the first grade of primary school who have participated<br />
in any early childhood education programmes – directly<br />
measures whether children have attended at least one<br />
year of pre-primary education. However, there are two<br />
approaches to getting the answer.<br />
The first is based on school reporting. Overall, for<br />
the 67 countries with data on all three indicators, the<br />
average percentage of new primary school entrants<br />
who had apparently participated in an early childhood<br />
programme was 15 percentage points higher than the<br />
net enrolment ratio in the last year of pre-primary<br />
school. This could suggest that primary schools<br />
exaggerate the extent to which their students attended<br />
early childhood education, though more evidence is<br />
needed to substantiate that explanation.<br />
The second approach is based on direct household<br />
reporting through, for instance, the UNICEF Multiple<br />
Indicator Cluster Survey (MICS), which collects<br />
systematic retrospective information on students in<br />
the first grade of primary school who had participated<br />
in pre-primary education the previous year. As this<br />
reflects direct responses from parents, it can serve as<br />
a st<strong>and</strong>ard against which to compare other potential<br />
proxy indicators for global indicator 4.2.2 based on<br />
administrative data, such as the net <strong>and</strong> adjusted net<br />
enrolment ratio.<br />
Such a comparison is possible for 38 countries with data<br />
over 2010–2015. The median proportion of children in<br />
the first grade whose parents reported their attendance<br />
in pre-primary school the previous year was around<br />
77%. This compares with a median net enrolment ratio<br />
for these countries of 59%, <strong>and</strong> a median adjusted net<br />
enrolment ratio of 80%. Thus it appears that the adjusted<br />
net enrolment ratio provides a more accurate picture of<br />
the percentage of children who participated in organized<br />
learning one year before the official primary entry age.<br />
However, it is important to note there can be significant<br />
differences for individual countries; e.g. in Mali the net<br />
enrolment ratio was 1% <strong>and</strong> the adjusted net enrolment<br />
208<br />
CHAPTER 11 | TARGET 4.2 – EARLY CHILDHOOD
11<br />
ratio was 44%, while the percentage of those directly<br />
reported as having attended pre-primary school the<br />
previous year was 15% (Figure 11.2).<br />
But the MICS does not just report the percentage of<br />
children in first grade of primary school who attended<br />
pre-primary school the previous year. It also collects<br />
information on attendance in early childhood education<br />
programmes for 3- to 4-year-olds. Among 42 mostly<br />
low <strong>and</strong> middle income countries with observations<br />
for all three age groups over 2009–2015, the median<br />
attendance rate was 24% among 3-year-olds, 45% among<br />
4-year-olds <strong>and</strong> 72% among those in the last year of preprimary<br />
education.<br />
The MICS-based indicators also enable disaggregation<br />
by individual characteristics, which is necessary to report<br />
on disparity. The extent of wealth-based disparity is<br />
striking. Among 3- to 4-year-olds, children in the richest<br />
households are almost six times more likely to attend<br />
an early childhood education programme than children<br />
from the poorest. In Tunisia in 2011/12, 81% of the richest<br />
3- to 4-year-olds but 13% of the poorest attended an<br />
early childhood education programme. The wealth<br />
disparity decreases among children in the first grade of<br />
primary school who had attended pre-primary school<br />
the previous year. Still, in the Lao People’s Democratic<br />
Republic, 67% of the richest but 10% of the poorest had<br />
attended pre-primary education (Figure 11.3).<br />
Pre-primary education-related questions in the MICS<br />
are split between two sections of the questionnaire.<br />
The first refers to children up to age 5 <strong>and</strong> the second<br />
to children age 5 <strong>and</strong> older, but the questions asked are<br />
not the same. Similar problems beset the Demographic<br />
<strong>and</strong> Health Survey, the other major household survey<br />
tool, which does not ask any education-related questions<br />
for children up to age 5, <strong>and</strong> only rarely includes preprimary<br />
education as a possible response to questions<br />
for children age 5 <strong>and</strong> older.<br />
Household surveys are better at capturing the diversity<br />
of available early childhood development programmes<br />
than administrative data, which are generally limited to<br />
formal pre-primary education. To enhance comparability,<br />
surveys should coordinate questions related to early<br />
childhood <strong>and</strong> pre-primary education so improved<br />
statistics for monitoring participation rates under target<br />
4.2 can be calculated. They also need to compile more<br />
detailed information on pre-primary programmes <strong>and</strong><br />
providers to better underst<strong>and</strong> the extent to which<br />
children are exposed to organized learning opportunities.<br />
FIGURE 11.2:<br />
Accounts of participation in early childhood care <strong>and</strong> education<br />
programmes differ between households <strong>and</strong> schools<br />
%<br />
%<br />
100<br />
80<br />
60<br />
40<br />
20<br />
0<br />
100<br />
80<br />
60<br />
40<br />
20<br />
0<br />
a. Pre-primary net enrolment ratio in the last year of pre-primary education, 2014; <strong>and</strong> percentage of<br />
students in the first grade of primary school who participated in pre-primary education the previous<br />
year, selected countries, 2010–2015<br />
Chad<br />
Sierra Leone<br />
D. R. Congo<br />
Mali<br />
Bosnia/Herzeg.<br />
Benin<br />
Congo<br />
Chad<br />
Sierra Leone<br />
D. R. Congo<br />
Mali<br />
Bosnia/Herzeg.<br />
Benin<br />
Congo<br />
Lao PDR<br />
Belize<br />
Lao PDR<br />
Belize<br />
Gambia<br />
Myanmar<br />
TFYR Macedonia<br />
Gambia<br />
Myanmar<br />
TFYR Macedonia<br />
Kyrgyzstan<br />
Montenegro<br />
Adjusted net enrolment ratio, last year of pre-primary education<br />
Attended pre-primary school the previous year<br />
Kyrgyzstan<br />
Montenegro<br />
S. Tome/Principe<br />
Oman<br />
S. Tome/Principe<br />
Oman<br />
Net enrolment ratio, last year of pre-primary education<br />
Attended pre-primary school the previous year<br />
Nepal<br />
Dominican Rep.<br />
Nepal<br />
Dominican Rep.<br />
Suriname<br />
Barbados<br />
Suriname<br />
Barbados<br />
Mongolia<br />
Ghana<br />
Mongolia<br />
Ghana<br />
Qatar<br />
Kazakhstan<br />
Qatar<br />
Kazakhstan<br />
Costa Rica<br />
Argentina<br />
Costa Rica<br />
Argentina<br />
Guyana<br />
Zimbabwe<br />
Guyana<br />
Zimbabwe<br />
Panama<br />
Saint Lucia<br />
Panama<br />
Saint Lucia<br />
Rep. Moldova<br />
El Salvador<br />
Jamaica<br />
Palestine<br />
Rep. Moldova<br />
El Salvador<br />
Jamaica<br />
Palestine<br />
Belarus<br />
Viet Nam<br />
Belarus<br />
Viet Nam<br />
Serbia<br />
Thail<strong>and</strong><br />
b. Pre-primary adjusted net enrolment ratio in the last year of pre-primary education, 2014; <strong>and</strong><br />
percentage of students in the first grade of primary school who participated in pre-primary education<br />
the previous year, selected countries, 2010–2015<br />
Serbia<br />
Thail<strong>and</strong><br />
Sources: UIS database for the net <strong>and</strong> adjusted net enrolment ratio; MICS final <strong>and</strong> key<br />
findings reports for the percentage of students in the first grade of primary school who<br />
attended pre-school during the previous school year.<br />
2016 • GLOBAL EDUCATION MONITORING REPORT 209
11<br />
FIGURE 11.3:<br />
There is wide disparity in access to early childhood education programmes between <strong>and</strong> within countries<br />
Percentage of children aged 3 <strong>and</strong> 4 years attending an early childhood education programme, <strong>and</strong> percentage of first grade primary school students who<br />
participated in pre-primary education the previous year by wealth, selected countries, 2009–2015<br />
100<br />
80<br />
60<br />
%<br />
40<br />
Attended pre-primary school the previous year,<br />
richest 20%<br />
Attended pre-primary school the previous year,<br />
poorest 20%<br />
Attended pre-primary school the previous year<br />
20<br />
0<br />
4-year-olds attending early childhood education<br />
programme<br />
3-year-olds attending early childhood education<br />
programme<br />
Iraq, 2011<br />
C. A. R., 2010<br />
Mali, 2015<br />
Bosnia/Herzeg., 2011–12<br />
Benin, 2014<br />
Lao PDR, 2011–12<br />
Guinea-Bissau, 2014<br />
Belize, 2011<br />
Gambia, 2010<br />
Myanmar, 2009–10<br />
TFYR Macedonia, 2011<br />
Kyrgyzstan, 2014<br />
Bangladesh, 2012–13<br />
Nigeria, 2011<br />
Montenegro, 2013<br />
Algeria, 2012–13<br />
Swazil<strong>and</strong>, 2010<br />
S. Tome/Principe, 2014<br />
Sudan, 2014<br />
Oman, 2014<br />
Nepal, 2014<br />
Dominican Rep., 2014<br />
Suriname, 2010<br />
Mongolia, 2013–14<br />
Tunisia, 2011–12<br />
Serbia, 2014<br />
Kazakhstan, 2010–11<br />
Qatar, 2014<br />
Costa Rica, 2011<br />
Argentina, 2011–12<br />
Guyana, 2014<br />
Panama, 2014<br />
Saint Lucia, 2012<br />
Rep. Moldova, 2014<br />
El Salvador, 2014<br />
Jamaica, 2011<br />
Belarus, 2012<br />
Viet Nam, 2013–14<br />
Thail<strong>and</strong>, 2012–13<br />
Source: MICS final <strong>and</strong> key findings reports.<br />
QUALITY<br />
The early childhood target explicitly emphasizes<br />
education of good quality. Quality may be understood in<br />
this context as the extent to which school <strong>and</strong> classroom<br />
settings (including structures <strong>and</strong> teaching processes)<br />
<strong>and</strong> systems support the holistic development of<br />
children, particularly those at risk of social exclusion.<br />
SYSTEMS<br />
OUTCOMES<br />
LEARNERS<br />
SCHOOL AND CLASSROOM SETTINGS<br />
The effectiveness of early childhood education in terms<br />
of outcomes (in particular, executive function, socialemotional<br />
development, motor development, <strong>and</strong><br />
pre-academic skills that improve the school readiness<br />
of children) is described in the next section. This section<br />
focuses on tools that assess quality in processes <strong>and</strong><br />
structures, <strong>and</strong> – to a lesser extent – systems.<br />
DEFINING QUALITY IN SETTINGS<br />
AND SYSTEMS<br />
Much of the information on quality in early childhood<br />
education has been generated through observation<br />
of classrooms, surveys of teachers <strong>and</strong> directors, <strong>and</strong><br />
examination of policies <strong>and</strong> regulations. This approach<br />
to defining <strong>and</strong> measuring quality relies on observable<br />
attributes of early childhood education services that<br />
research has linked to children’s future school achievement<br />
<strong>and</strong> well-being. The approach has its critics, who argue that<br />
quality should be defined as context-based, subjective,<br />
relative <strong>and</strong> based on values (Dahlberg et al., 1999).<br />
CONTEXT<br />
Economic, political <strong>and</strong> social conditions<br />
210<br />
CHAPTER 11 | TARGET 4.2 – EARLY CHILDHOOD
11<br />
Because of the range <strong>and</strong> diversity of early childhood<br />
programmes, these two viewpoints need to be<br />
integrated. Many observable attributes have been<br />
shown to promote child development, yet they must be<br />
relevant <strong>and</strong> applicable to each setting in which they are<br />
applied. The absence of st<strong>and</strong>ards can result in toleration<br />
of poor quality provision <strong>and</strong> a lack of guidance on<br />
how professional development programmes might be<br />
structured (Siraj-Blatchford <strong>and</strong> Wong, 1999).<br />
A pathway that draws upon measurement expertise<br />
while allowing for adaptation, revision <strong>and</strong> alignment<br />
with cultural values <strong>and</strong> discourse is essential for<br />
accurately measuring <strong>and</strong> comparing the quality of<br />
early childhood education.<br />
Consensus can be reached on many crucial dimensions<br />
of the process <strong>and</strong> structures of quality in early<br />
childhood settings. For example, the International Step<br />
by Step Association (ISSA), a non-government network<br />
of professionals especially active in Europe <strong>and</strong> Central<br />
Asia, has identified principles that underpin teaching<br />
practices of high quality (ISSA, 2009). They cover seven<br />
domains: interactions; family <strong>and</strong> community; inclusion,<br />
diversity, <strong>and</strong> values of democracy; assessment <strong>and</strong><br />
planning; teaching strategies; learning environment; <strong>and</strong><br />
professional development. Such frameworks can help<br />
form the basis for monitoring quality.<br />
Perhaps the most critical element of process quality<br />
is the interaction between teachers <strong>and</strong> children, its<br />
nature <strong>and</strong> depth, <strong>and</strong> the extent to which interactions<br />
enable children to be autonomous <strong>and</strong> stimulated<br />
(Mashburn et al., 2008; Britto et al., 2011). ISSA highlights<br />
three principles when assessing interactions: whether<br />
educators interact with children in a friendly <strong>and</strong><br />
respectful manner that supports the development of<br />
each child’s construction of self/identity <strong>and</strong> learning;<br />
whether interactions help develop a learning community<br />
where all children are supported to reach their potential;<br />
<strong>and</strong> whether educators engage in purposeful, reciprocal<br />
interactions with other adults to support children’s<br />
development <strong>and</strong> learning.<br />
Early childhood education environments of high quality<br />
are also inclusive. Educators should provide opportunities<br />
for every child <strong>and</strong> family to learn <strong>and</strong> participate,<br />
identify children who are falling behind, <strong>and</strong> address<br />
individual differences in needs <strong>and</strong> skills. A key aspect<br />
of inclusiveness is that children have the opportunity<br />
to learn in their native language. In areas with linguistic<br />
One of the most critical<br />
elements of a quality<br />
pre-primary education<br />
is the interaction<br />
between teachers <strong>and</strong><br />
children, <strong>and</strong> whether<br />
children are enabled to<br />
diversity, teachers<br />
who are fluent in<br />
children’s native<br />
tongues can have<br />
enormous benefits<br />
for language <strong>and</strong><br />
literacy development<br />
(Ball, 2011).<br />
Much of the attention<br />
on monitoring<br />
be autonomous <strong>and</strong><br />
quality has focused<br />
stimulated<br />
on quantitative<br />
measures – such as<br />
child/teacher ratios,<br />
class sizes, teacher qualifications, access to water <strong>and</strong><br />
good hygiene, or availability of materials – because the<br />
data are easier to collect. However, while improvement<br />
in these measures can increase process quality, it does<br />
not ensure it. Studies show modest correlations between<br />
the two dimensions at the classroom or programme level<br />
(Yoshikawa et al., 2013).<br />
Finally, the quality of early childhood care <strong>and</strong> education<br />
systems is understood to play a major role in achieving<br />
desirable outcomes. Five elements of achieving<br />
quality have been identified for high income countries:<br />
setting quality goals <strong>and</strong> regulations; designing<br />
<strong>and</strong> implementing curriculum st<strong>and</strong>ards; improving<br />
qualifications, training <strong>and</strong> workforce conditions;<br />
engaging parents <strong>and</strong> communities; <strong>and</strong> advancing data<br />
collection, research <strong>and</strong> monitoring (OECD, 2012c). The<br />
applicability <strong>and</strong> relevance of these actions in low <strong>and</strong><br />
middle income countries have not yet been addressed.<br />
In integrated <strong>and</strong> devolved systems, the quality of<br />
governance, both horizontal (across sectors) <strong>and</strong> vertical<br />
(across levels, from national to local), has also been<br />
considered critical (Britto et al., 2014).<br />
MEASURING QUALITY OF SETTINGS<br />
Several measures of early childhood education quality<br />
have been tested. They tend to involve trainees rating<br />
a setting using observation, documentation <strong>and</strong><br />
interviews during a two- to four-hour visit. The most<br />
desirable characteristic of an effective measure of<br />
quality assessment is validity, i.e. the extent to which<br />
the element assessed is meaningful <strong>and</strong> has proven<br />
positive effects on child outcomes. Establishing validity<br />
becomes more complicated when aiming for a measure<br />
2016 • GLOBAL EDUCATION MONITORING REPORT 211
11<br />
comparable across countries <strong>and</strong> various types of service<br />
provision (Ishimine <strong>and</strong> Tayler, 2014). Many measures<br />
have yet to be fully validated in all countries.<br />
The most widely<br />
used tool, the<br />
There are different tools<br />
Early Childhood<br />
for measuring early<br />
Environment Rating<br />
childhood education Scale (ECERS),<br />
was developed at<br />
quality, which tend to<br />
the University of<br />
involve class observation, North Carolina in<br />
documentation <strong>and</strong> 1980 <strong>and</strong> revised<br />
in 1998 (ECERS-R)<br />
interviews<br />
<strong>and</strong> 2015 (ECERS3).<br />
Variants of it focus<br />
on infants/toddlers,<br />
family child care <strong>and</strong> school age care. As part of a<br />
3-hour visit, the tool uses 43 items to measure process<br />
<strong>and</strong> structure aspects of quality in 7 key areas: space<br />
<strong>and</strong> furnishings; personal care routines; language <strong>and</strong><br />
reasoning; activities; interaction; programme structure;<br />
<strong>and</strong> parents <strong>and</strong> staff. In the latest revision, the ‘parents<br />
<strong>and</strong> staff’ subscale, which relied on self-reporting, has<br />
been dropped (Harms et al., 2015).<br />
ECERS-R forms the core of formal, observation-based<br />
quality assurance systems in much of the United States<br />
<strong>and</strong> has been translated <strong>and</strong> adapted for countries<br />
including Germany <strong>and</strong> Italy. Researchers in Bahrain<br />
(Hadeed, 2014), Bangladesh (Aboud, 2004), Brazil<br />
(Campos et al., 2011) <strong>and</strong> Cambodia (Rao <strong>and</strong> Pearson,<br />
2007), <strong>and</strong> in the Caribbean (Lambert et al., 2008),<br />
have also used this tool. However, while it tries to be<br />
comprehensive, ECERS-R only uses a selected set of<br />
questions for each domain.<br />
The Classroom Assessment Scoring System (CLASS),<br />
developed at the University of Virginia in 2008, focuses<br />
instead on just one domain, teacher-child interactions<br />
(Hamre et al., 2007). It relies on 4 cycles of 15-minute<br />
observations of teacher <strong>and</strong> child interactions, evaluating<br />
the degree of instructional <strong>and</strong> socio-emotional support<br />
<strong>and</strong> overall classroom organization.<br />
CLASS was validated in the United States but has also<br />
been applied in research <strong>and</strong> policy-oriented studies in<br />
Europe (e.g. Finl<strong>and</strong>, Pakarinen et al., 2010), Latin America<br />
(e.g. Ecuador, Araujo et al., 2015) <strong>and</strong> sub-Saharan Africa<br />
(e.g. United Republic of Tanzania, Shavega et al., 2014).<br />
Neither ECERS-R nor CLASS was originally developed<br />
for international use. By contrast, the Global Guidelines<br />
Assessment (GGA) of the Association for Childhood<br />
Education International, developed in collaboration with<br />
the US national committee of the World Organization for<br />
Early Childhood, set out to measure progress on the 2002<br />
Global Guidelines for Early Childhood Education <strong>and</strong> Care in<br />
the 21st Century (Barbour et al., 2004). The GGA is divided<br />
into five areas: environment <strong>and</strong> physical space; curriculum<br />
content <strong>and</strong> pedagogy; early childhood educators <strong>and</strong><br />
caregivers; partnership with families <strong>and</strong> communities;<br />
<strong>and</strong> young children with special needs. It has been used<br />
in East Asia (e.g. the Republic of Korea, Wortham, 2012),<br />
Europe (e.g. Greece, Rentzou, 2010) <strong>and</strong> Latin America<br />
(e.g. Guatemala, Hardin et al., 2008). However, it has not<br />
been validated in relation to child outcomes.<br />
Overall, several studies, mostly using ECERS-R, find<br />
positive associations between programme quality <strong>and</strong><br />
measures of child development linked to pre-academic<br />
cognitive skills or social-behavioural development<br />
(Burchinal et al., 2008; Sylva et al., 2006). But the size<br />
of the effects tends to be small (Sabol <strong>and</strong> Pianta, 2014;<br />
Gordon et al., 2015).<br />
The use of such tools is a helpful prompt for debating<br />
quality in target 4.2. It helps decision-makers address<br />
priorities, e.g. in China, where views are divided on the<br />
relative merits of whole classroom vs child-centred learning<br />
(Li et al., 2014; Hu, 2015). It also points out differences in<br />
quality between facilities or types of programmes within<br />
countries – e.g. in rural Indonesia, where differences in<br />
quality were shown between various types of provision<br />
(Brinkman et al., 2016) – <strong>and</strong> identify significant<br />
differences between countries (e.g. Vermeer et al., 2016).<br />
Countries <strong>and</strong> the international community should<br />
consider using such tools to monitor the quality of early<br />
childhood education provision more systematically.<br />
The process of consensus building should begin with<br />
countries setting their own goals <strong>and</strong> st<strong>and</strong>ards – <strong>and</strong><br />
using a mechanism to monitor them. They should use<br />
<strong>and</strong> adapt the tools that are most applicable to their<br />
context <strong>and</strong> that give useful feedback to educators for<br />
professional development (UNICEF, 2012a).<br />
MEASURING QUALITY OF SYSTEMS<br />
At the system level, a variety of tools have been<br />
developed. The World Bank Systems Approach for<br />
Better Education Results (SABER) has published<br />
212<br />
CHAPTER 11 | TARGET 4.2 – EARLY CHILDHOOD
11<br />
30 country reports in 3 areas, not limited to education:<br />
the enabling environment (legal framework, intersectoral<br />
coordination <strong>and</strong> finance); implementation (programme<br />
scope, coverage <strong>and</strong> equity); <strong>and</strong> monitoring <strong>and</strong> quality<br />
assurance (data availability, st<strong>and</strong>ards <strong>and</strong> compliance).<br />
An important aspect of quality is the extent to which<br />
st<strong>and</strong>ards are set <strong>and</strong> enforced. Among 21 countries with<br />
data, 8 did not have st<strong>and</strong>ards on the pupil/teacher ratio in<br />
public early childhood education institutions. Of those that<br />
did, 5 enforced them, <strong>and</strong> 3 set <strong>and</strong> enforced a st<strong>and</strong>ard<br />
of no more than 15 children per teacher (Table 11.2).<br />
TABLE 11.2:<br />
Setting <strong>and</strong> enforcing st<strong>and</strong>ards on the pupil/teacher ratio<br />
in public early childhood education institutions, selected<br />
countries, 2012–2015<br />
No st<strong>and</strong>ards<br />
Yes >15 children/teacher; not enforced<br />
Yes ≤15 children/teacher; not enforced<br />
Yes >15 children/teacher; enforced<br />
Yes ≤15 children/teacher; enforced<br />
Belize, D. R. Congo, Gambia, Kyrgyzstan, Mali, U. R. Tanzania,<br />
Ug<strong>and</strong>a, Yemen<br />
Burkina Faso, Guinea, Malawi, Nigeria<br />
Tonga<br />
Albania, Jamaica, Kiribati, Mauritius, Nepal<br />
Bulgaria, Indonesia, Samoa<br />
Source: World Bank SABER early childhood development country reports.<br />
In Europe, a monitoring mechanism helps countries<br />
exchange information on aspects of early childhood<br />
care <strong>and</strong> education systems, finding, for example, large<br />
differences between processes of evaluating whether<br />
settings meet st<strong>and</strong>ards. Evaluations are carried out at<br />
the central (e.g. Croatia), regional (e.g. Spain) or local<br />
(e.g. Lithuania) level or jointly at two (e.g. Denmark) or<br />
three levels (e.g. Finl<strong>and</strong>). They are sometimes delegated to<br />
independent agencies (e.g. in Scotl<strong>and</strong> [United Kingdom])<br />
or to non-profit companies operating on behalf of central<br />
authorities (e.g. in Irel<strong>and</strong>). In Italy, there is no external<br />
evaluation process for institutions serving older children,<br />
but local authorities evaluate institutions for younger<br />
children (European Commission/EACEA/Eurydice/<br />
Eurostat, 2014).<br />
The Organisation for Economic Co-operation <strong>and</strong><br />
Development (OECD) undertakes voluntary reviews<br />
of the early childhood care <strong>and</strong> education systems<br />
of member <strong>and</strong> non-member countries every three<br />
years. The most recent round focused on national<br />
monitoring systems of quality. In Kazakhstan, there is a<br />
st<strong>and</strong>ardized national framework of quality <strong>and</strong> effective<br />
feedback mechanisms between central authorities<br />
<strong>and</strong> local public providers. Monitoring is relatively<br />
infrequent, once every five years, <strong>and</strong> tends to have<br />
limited information about private institutions. In Mexico,<br />
despite very diverse institutional provision, involving<br />
federal <strong>and</strong> other public home-based <strong>and</strong> centre-based<br />
care, monitoring occurs annually <strong>and</strong> in-service training<br />
for evaluators is provided (OECD, 2015g).<br />
CHILD DEVELOPMENT OUTCOMES<br />
Target 4.2 focuses on ensuring that children begin formal<br />
schooling developmentally on track <strong>and</strong> ‘ready for primary<br />
education’. This holistic view linked to school-based<br />
learning marks a shift from a view of child development<br />
based exclusively on health-related indicators.<br />
Early childhood development, which refers to<br />
neurological <strong>and</strong> physical growth in the early years of<br />
life, has lasting implications for learning, health <strong>and</strong> wellbeing<br />
(Walker et al., 2007). Accurate, reliable measures of<br />
early childhood development can inform policy-making<br />
<strong>and</strong> investment alternatives, contribute to curricular<br />
reform <strong>and</strong> teacher training, <strong>and</strong> identify children at risk.<br />
Promoting early childhood development, especially for<br />
the marginalized, is a pathway to reducing inequality by<br />
ensuring that all children begin formal schooling on an<br />
even plane. Tracking early childhood development will<br />
likely reveal disparities that begin very early in life, at<br />
birth or earlier, <strong>and</strong> grow larger over time.<br />
Measuring young children’s development <strong>and</strong> readiness<br />
to learn has long entailed debate on the reliability of<br />
tools <strong>and</strong> the ethics of involving very young children<br />
(e.g. Myers, 2006; Zill, 2005). Critics question whether<br />
measuring such aspects of early childhood at a<br />
population level is even possible.<br />
Despite concerns, efforts to track progress towards<br />
target 4.2 should carefully consider recently developed<br />
measures of early childhood development. Efforts<br />
should focus on population-based measurement, or<br />
measures designed to inform policy at the national<br />
level, rather than diagnose individual children with<br />
delayed development. Population-based measures differ<br />
from measures designed for research or programme<br />
evaluation, as they are designed for use at scale, with an<br />
emphasis on feasible, cost-effective measurement.<br />
This subsection reviews key issues on early childhood<br />
development <strong>and</strong> some of the most commonly used<br />
regional <strong>and</strong> global measures. 1<br />
2016 • GLOBAL EDUCATION MONITORING REPORT 213
11<br />
WHAT DOES IT MEAN TO BE DEVELOPMENTALLY<br />
ON TRACK?<br />
‘Developmentally on track’ means children are developing<br />
the skills <strong>and</strong> competencies that will allow them to<br />
participate successfully in their environments <strong>and</strong><br />
reach their current <strong>and</strong> future developmental potential.<br />
Deciding how best to measure child development is<br />
complex. Four significant themes are outlined below.<br />
First, development proceeds in trajectories. Young children’s<br />
development at the start of school is the extension of<br />
a trajectory that began at conception <strong>and</strong> continues<br />
through infancy <strong>and</strong> toddlerhood. Disparities in children’s<br />
cognitive <strong>and</strong> language development are apparent as early<br />
as 4 months of age, <strong>and</strong> tend to widen, not decrease,<br />
over time (Fernald et al., 2012). Interpretation of data<br />
on child development <strong>and</strong> learning at a given point in<br />
time, such as the start of school, should be based on a<br />
view of children’s<br />
development as<br />
Disparities in cognitive<br />
a trajectory that<br />
begins at birth.<br />
<strong>and</strong> language development<br />
are apparent as early as 4<br />
Second,<br />
months of age, <strong>and</strong> tend<br />
patterns of child<br />
development<br />
to widen, not decrease,<br />
are similar in all<br />
over time<br />
settings, but<br />
environmental<br />
influences have a<br />
profound impact on development. Genetic information<br />
leads to common developmental patterns in all<br />
<strong>people</strong>, such as the acquisition of early language <strong>and</strong><br />
communication <strong>and</strong> the first expression of cognitive<br />
problem-solving skills. But nearly all human traits, skills<br />
<strong>and</strong> competencies reflect a complex set of interactions<br />
between genetic information <strong>and</strong> environmental<br />
stimuli, with some traits more strongly influenced by<br />
environment or genes than others (van Izjendoorn et<br />
al., 2011).<br />
The strongest, most reliable predictor of young children’s<br />
development in both high <strong>and</strong> low income countries is<br />
the home environment, even when children attend high<br />
quality pre-schools (Bornstein et al., 2015). Stimulating,<br />
supportive home environments can be measured by<br />
asking about the frequency of activities or observing<br />
caregiver–child interactions (Box 11.1).<br />
Children who are given more opportunities to<br />
communicate, room to explore <strong>and</strong> cognitive stimulation<br />
develop skills faster <strong>and</strong> more consistently. Children<br />
develop language faster when spoken to more frequently<br />
(Hart <strong>and</strong> Risley, 1995; Snow, 1997) regardless of whether<br />
the frequency of language interaction varies due to<br />
cultural preference (e.g. some cultures hold babies on<br />
the backs of adults, where they have less face-to-face<br />
interaction) or an inability to fully bond with a dedicated,<br />
emotionally available caregiver. It is not yet known<br />
whether children’s failure to show competencies in<br />
certain cultures is due to lack of cultural relevance or<br />
inadequacy of stimulation. Measurement must accept<br />
this lack of clarity, <strong>and</strong> continue to test core assumptions<br />
on the universality of children’s development.<br />
Third, some areas of child development, such as the<br />
accumulation of vocabulary words <strong>and</strong> early literacy<br />
skills, proceed in a linear fashion <strong>and</strong> are straightforward<br />
to measure (Thompson, 2014). Other developments, such<br />
as underst<strong>and</strong>ing that <strong>people</strong> have diverse perspectives,<br />
emerge at about the same age in more than one culture,<br />
at the age of about 4 years (Sabbagh et al., 2006). In yet<br />
others, development at an early age does not seem to show<br />
much relation to learning <strong>and</strong> achievement over time<br />
in intermediate years, but emerges later as a strong<br />
influence (V<strong>and</strong>ell et al., 2010).<br />
In addition, development in one area fuels development<br />
in others. Language development, for example, has a<br />
strong influence on social interactions because children<br />
with better language skills can communicate better<br />
with peers. This means that measuring early childhood<br />
development should include all domains of development,<br />
rather than focusing only on early academic skills. For<br />
some areas, the effects of early childhood development<br />
may take several years to become apparent.<br />
Fourth, while the science underlying basic developmental<br />
processes is clear, defining ‘on track’ development has<br />
not yet been fully established for children in many<br />
cultures. Measurement is relativistic: st<strong>and</strong>ards for<br />
what children should be able to do are informed by<br />
knowing what is typical, or what children around them<br />
can do. What is normative is ideally established through<br />
the creation of normal distributions of children’s<br />
development <strong>and</strong> skills acquisition in various parts of<br />
the world, with ages at which children are typically<br />
demonstrating specific skills.<br />
It is difficult to define normative development in a<br />
globally comparable manner because culture influences<br />
development <strong>and</strong>, primarily, because the extent to<br />
214<br />
CHAPTER 11 | TARGET 4.2 – EARLY CHILDHOOD
11<br />
BOX 11.1<br />
Defining positive <strong>and</strong> stimulating home learning environments<br />
While rapid brain development takes place during the first three to four years, at this age most children lack access to organized learning opportunities outside the home.<br />
To draw attention to this issue, the proposed thematic monitoring framework includes an indicator on the ‘percentage of children under 5 years of age experiencing positive<br />
<strong>and</strong> stimulating home learning environments’.<br />
A stimulating home learning environment provides educational interactions <strong>and</strong> learning<br />
materials. UNICEF’s MICS collects comparable information on both. In relation<br />
to interactions, the surveys estimate whether adult household members have engaged<br />
children aged 36 to 59 months in reading or looking at picture books; telling stories; singing<br />
songs; going outside the home; playing; <strong>and</strong> naming, counting <strong>and</strong>/or drawing things.<br />
UNICEF reported the percentage of children with whom adult household members had<br />
engaged in at least four of these activities in the past three days over 2009–2012. While<br />
adults had engaged almost all children in at least four activities in Ukraine, that was true<br />
for only 40% of children in Ghana. The probability that the father had engaged in at least<br />
one activity was typically about 25 percentage points lower, although smaller gaps were<br />
observed in countries including Jordan, Iraq <strong>and</strong> Tunisia (Figure 11.4a). Comparisons are<br />
affected by considerable differences between countries in the extent to which children<br />
live with their biological father.<br />
In 2013, UNICEF changed its reporting, <strong>and</strong> the new way of presenting results suggests<br />
that levels of parental engagement are actually considerably lower. In Zimbabwe, 43% of<br />
children had engaged in at least four activities in the past three days with an adult<br />
household member. About 75% of 3- to 4-year-olds lived with their biological mother but<br />
just 17% had engaged in at least four activities with her. And while about 50% of children<br />
lived with their biological father, only 3% had engaged in at least four activities with him.<br />
With respect to learning materials, the MICS collects information on the presence of<br />
children’s books at home. Across 54 mostly low <strong>and</strong> middle income countries over<br />
2010–2015, 19% of households had at least 3 books <strong>and</strong> 7.5% had at least 10 books. Among<br />
the poorest 20%, less than 1% of households had at least 10 books at home (Figure 11.4b).<br />
FIGURE 11.4:<br />
Home learning environments differ substantially<br />
between countries<br />
%<br />
100<br />
80<br />
60<br />
40<br />
20<br />
0<br />
a. Percentage of children age 36 to 59 months with whom an adult household<br />
member <strong>and</strong> the father engaged in activities that promote learning <strong>and</strong> school<br />
readiness in the past three days, 2009–2012<br />
Ghana, 2011<br />
Gambia, 2010<br />
Any adult, at least four activities<br />
Father, at least one activity<br />
100<br />
b. Percentage of children under age 5 who live in homes<br />
where children’s books are present, 2010–2015<br />
3 books<br />
80<br />
10 books<br />
10 books, poorest 20%<br />
60<br />
Mali, 2015<br />
Chad, 2010<br />
Guinea-Bissau, 2014<br />
D. R. Congo, 2013–14<br />
C. A. R., 2010<br />
Congo, 2011–12<br />
Gambia, 2010<br />
Malawi, 2013–14<br />
Benin, 2014<br />
Togo, 2010<br />
Sierra Leone, 2010<br />
Zimbabwe, 2014<br />
Cameroon, 2011<br />
Swazil<strong>and</strong>, 2010<br />
Cambodia, 2014<br />
Nepal, 2014<br />
Lao PDR, 2011–12<br />
Iraq, 2011<br />
S. Tome/Principe, 2014<br />
Nigeria, 2011<br />
Ghana, 2011<br />
Bhutan, 2010<br />
%<br />
40<br />
20<br />
0<br />
Bangladesh, 2012–13<br />
Dominican Rep., 2014<br />
Algeria, 2012–13<br />
Tunisia, 2011–12<br />
El Salvador, 2014<br />
Palestine, 2014<br />
Jordan, 2012<br />
Oman, 2014<br />
Panama, 2014<br />
Suriname, 2010<br />
Viet Nam, 2013–14<br />
Kyrgyzstan, 2014<br />
Mongolia, 2013–14<br />
Costa Rica, 2011<br />
Qatar, 2014<br />
Belize, 2011<br />
Thail<strong>and</strong>, 2012–13<br />
Guyana, 2014<br />
Cuba, 2014<br />
Kazakhstan, 2010–11<br />
Jamaica, 2011<br />
TFYR Macedonia, 2011<br />
Bosnia/Herzeg., 2011–12<br />
Uruguay, 2014<br />
Argentina, 2011–12<br />
Saint Lucia, 2012<br />
Rep. Moldova, 2014<br />
Serbia, 2014<br />
Montenegro, 2013<br />
Barbados, 2014<br />
Ukraine, 2012<br />
Belarus, 2012<br />
Swazil<strong>and</strong>, 2010<br />
Bhutan, 2010<br />
Sierra Leone, 2010<br />
Mauritania, 2011<br />
Congo, 2011–12<br />
Lao PDR, 2011-12<br />
Iraq, 2011<br />
D. R. Congo, 2010<br />
Togo, 2010<br />
Cameroon, 2011<br />
Nigeria, 2011<br />
Costa Rica, 2011<br />
Chad, 2010<br />
Tunisia, 2011–12<br />
Suriname, 2010<br />
C. A. R., 2010<br />
Jordan, 2012<br />
Argentina, 2011–12<br />
Belize, 2011<br />
Jamaica, 2011<br />
DPR Korea, 2009<br />
Kazakhstan, 2010–11<br />
TFYR Macedonia, 2011<br />
Thail<strong>and</strong>, 2012<br />
Saint Lucia, 2012<br />
Bosnia/Herzeg., 2011–12<br />
Belarus, 2012<br />
Ukraine, 2012<br />
Source: MICS final reports.<br />
Sources: Bradley <strong>and</strong> Caldwell (1995); Zimbabwe National Statistics Agency (2015).<br />
2016 • GLOBAL EDUCATION MONITORING REPORT 215
11<br />
which children achieve milestones or demonstrate skills<br />
is unknown in much of the world (Marfo et al., 2011).<br />
Parental or cultural concepts of child development vary.<br />
Policy may not match them. Measurement of culturally<br />
inappropriate expectations for children’s development<br />
would mask the true competencies of a population.<br />
A priority for research for the new education agenda<br />
is which measures are relevant to all children <strong>and</strong> can<br />
be used to define global st<strong>and</strong>ards for a child to be<br />
‘developmentally on track’.<br />
Three conclusions emerge. First, as child development <strong>and</strong><br />
skill acquisition proceed in trajectories, their measurement<br />
should ideally begin earlier than entry to school. From a<br />
developmental st<strong>and</strong>point, the start of formal schooling<br />
is not significant.<br />
Over time,<br />
measurement<br />
A priority for research for methodologies<br />
the new education agenda should be created<br />
to track progress<br />
is which measures can<br />
over time rather<br />
be used to define global than focusing on a<br />
single point in time.<br />
st<strong>and</strong>ards for a child to be<br />
‘developmentally on track’<br />
Second, measures<br />
of context are<br />
needed as well as<br />
indicators of child development <strong>and</strong> readiness to learn.<br />
The lack of information on children’s health, nutrition <strong>and</strong><br />
family environment makes it hard to determine whether<br />
<strong>and</strong> why children’s development is on track or not,<br />
<strong>and</strong> which policies <strong>and</strong> interventions could effectively<br />
support healthy development.<br />
Third, the use of national-level measurement that<br />
allows careful consideration of cultural <strong>and</strong> contextual<br />
influences on the timing <strong>and</strong> expression of child<br />
competencies <strong>and</strong> skills should be considered, alongside<br />
a research agenda to track normative development<br />
across cultures <strong>and</strong> develop approaches to measurement<br />
based on the findings.<br />
PRACTICAL ISSUES IN MEASURING CHILD<br />
DEVELOPMENT<br />
The above conclusions must be weighed against<br />
the need for feasible, cost-effective approaches to<br />
measurement that can be used at scale <strong>and</strong> over time.<br />
This entails a technical challenge. Given the gap between<br />
an ideal system <strong>and</strong> countries’ capacity in the near<br />
future, balance is needed between technical strength, the<br />
protection of children’s rights <strong>and</strong> feasibility.<br />
There is widespread agreement that children develop in<br />
four related domains that include a range of skills <strong>and</strong><br />
competencies:<br />
■■<br />
Executive function: Self-regulation, approaches to<br />
learning <strong>and</strong> other skills drive learning across a number<br />
of areas. This domain includes some of the strongest<br />
drivers of academic performance over time, including<br />
sustained attention, working memory <strong>and</strong> the ability<br />
to inhibit impulses.<br />
■■<br />
Social-emotional development: Social <strong>and</strong> emotional<br />
skills facilitate children’s successful interactions with<br />
others (including peers, teachers <strong>and</strong> family members)<br />
as well as children’s inclusion <strong>and</strong> may help them<br />
engage in school over time.<br />
■■<br />
Motor development: Fine <strong>and</strong> gross motor skills include<br />
coordination in walking, balancing, jumping <strong>and</strong> throwing<br />
balls; <strong>and</strong> the ability to write, pick up small objects <strong>and</strong><br />
otherwise use the fingers successfully. Fine motor<br />
development predicts cognition, presumably because<br />
it indicates to some degree whether neurological<br />
development is on track (Grissam et al., 2010).<br />
■■<br />
Pre-academic (early mathematics <strong>and</strong> literacy)<br />
skills: This is perhaps the most established domain<br />
in research <strong>and</strong> includes early skills such as letter/<br />
sound identification <strong>and</strong> counting that are considered<br />
fundamental to developing literacy <strong>and</strong> numeracy<br />
skills later in life.<br />
Measurement of each domain is possible but requires<br />
varied approaches. For example, social-emotional<br />
development is measured more accurately through<br />
reports by parents or teachers who know children well,<br />
while pre-academic skills are best measured through<br />
direct interaction with children.<br />
More agreement on measurement methodology exists<br />
in some domains than in others. There is agreement<br />
on measuring early literacy skills, but less on how to<br />
measure social-emotional development <strong>and</strong> executive<br />
function, because the constructs are less clearly defined<br />
<strong>and</strong> the related skills manifest less directly, <strong>and</strong> thus are<br />
more likely to vary by culture <strong>and</strong> context.<br />
216<br />
CHAPTER 11 | TARGET 4.2 – EARLY CHILDHOOD
11<br />
At the start of the process to develop or evaluate tools,<br />
it is essential to define measurement <strong>and</strong> its uses in a<br />
manner that protects<br />
children’s rights. There are<br />
It is essential to<br />
notable risks for children;<br />
for example, measuring<br />
define measurement<br />
their learning at the start<br />
of early literacy skills of the school year could<br />
<strong>and</strong> its uses in a<br />
exclude them from school<br />
on the grounds that they<br />
manner that protects<br />
are unready.<br />
children’s rights<br />
For measurement to<br />
accurately address equity<br />
concerns, all children, including those at risk for disabilities,<br />
must be included in samples. Thus, even though measures<br />
are not intended to identify individual children, the<br />
range of items must be broad enough to capture all<br />
children’s development, not just those that are typical.<br />
Measures based on nationally representative household<br />
surveys thus produce better data than those based on<br />
assessments only of children who are in pre-school.<br />
As measuring child development <strong>and</strong> learning is<br />
complex, questions remain. How comprehensive can<br />
surveys be? No survey, especially not one that can be<br />
conducted in 20 minutes, will fully describe children’s<br />
competencies or the quality of learning environments.<br />
For school readiness, many constructs may not be<br />
directly observable in their entirety. For example, socialemotional<br />
development refers to a group of behaviours<br />
or capacities, including those not easy to measure.<br />
How can reliability be ensured, i.e. the degree to which<br />
an assessment tool produces stable <strong>and</strong> consistent<br />
results, even if applied at different times or by different<br />
administrators? Assessments require trained assessors<br />
who are skilled <strong>and</strong> practised in assessing children. This<br />
level of training <strong>and</strong> expertise may not be possible in all<br />
regions. Language of administration is also critical for<br />
accurate assessment of children’s pre-academic skills.<br />
How can validity be ensured, i.e. the extent to which the<br />
test measures what it says it measures? A valid measure<br />
of school readiness should indicate how well children will<br />
perform later in school. However, many tools have not<br />
yet been used in studies that give clear evidence of how<br />
scores relate to children’s achievement over time.<br />
SELECTED APPROACHES TO MEASURING CHILD<br />
DEVELOPMENT<br />
Several population-based measures of early childhood<br />
development have been tested in recent years (Table 11.3).<br />
UNICEF developed the East Asia Pacific Child Development<br />
Scales (EAP-CDS). A validation study was conducted<br />
in 2013–2014 on a sample of over 7,000 children in<br />
Cambodia, China, Mongolia, Timor-Leste, Vanuatu <strong>and</strong><br />
Viet Nam. Some patterns varied by country (e.g. children<br />
in China had significantly higher mathematics scores).<br />
The impact of age, gender <strong>and</strong> maternal education on<br />
child development also varied by country. The size of the<br />
effect of attendance in early childhood programmes on<br />
early child development varied as well, with the biggest<br />
impact, in Cambodia, nearly three times the size of the<br />
smallest, in Timor-Leste (Rao et al., 2015).<br />
The International Development <strong>and</strong> Early Learning<br />
Assessment (IDELA), developed by Save the Children,<br />
was piloted in 11 countries <strong>and</strong> has since been used in<br />
more than 30, although not in representative samples<br />
(Pisani et al., 2015). A r<strong>and</strong>omized trial in partnership<br />
with the World Bank in Mozambique demonstrated that<br />
children who attended pre-school had higher scores at<br />
the end of pre-school <strong>and</strong> more engagement in early<br />
years of school (Martinez et al., 2012).<br />
The Regional Project on Child Development Indicators<br />
(PRIDI) project was developed by the Inter-American<br />
Development Bank. A study in four countries (Costa Rica,<br />
Nicaragua, Paraguay <strong>and</strong> Peru) indicated that the items<br />
showed expected sensitivity to age <strong>and</strong> cultural background,<br />
including maternal education (Verdisco et al., 2014)<br />
The Early Childhood Development Index (ECDI) was developed<br />
by UNICEF for the MICS programme (Zill <strong>and</strong> Ziv, 2007). A child<br />
is considered developmentally on track in four domains if:<br />
■■<br />
In the literacy-numeracy domain, a child can do at<br />
least 2 of 3 tasks: identify/name at least 10 letters<br />
of the alphabet, read at least 4 simple popular words<br />
<strong>and</strong> know the name <strong>and</strong> recognize the symbols of all<br />
numbers from 1 to 10.<br />
■■<br />
In the physical domain, a child can pick up a small<br />
object, such as a stick or a rock, with two fingers<br />
from the ground, <strong>and</strong> the mother/caretaker does not<br />
indicate that the child is sometimes too sick to play.<br />
2016 • GLOBAL EDUCATION MONITORING REPORT 217
11<br />
TABLE 11.3:<br />
Early childhood development tools<br />
Tool<br />
• Organization<br />
Age group<br />
East Asia Pacific Child Development Scales (EAP-<br />
CDS)<br />
• UNICEF <strong>and</strong> Asia Region Network for Early<br />
Childhood<br />
Ages 3 to 5<br />
International Development <strong>and</strong> Early Learning<br />
Assessment (IDELA)<br />
• Save the Children<br />
Ages 3 to 6<br />
Regional Project on Child Development Indicators<br />
(PRIDI)<br />
• Inter-American Development Bank<br />
Ages 2 to 4<br />
Early Childhood Development Index (ECDI)<br />
• UNICEF MICS<br />
Ages 3 to 4<br />
Measuring Early Learning Quality <strong>and</strong> Outcomes<br />
(MELQO)<br />
• Brookings Institution, UNESCO, UNICEF <strong>and</strong><br />
World Bank<br />
Ages 4 to 6<br />
History Domains Other information<br />
Based on the Early Learning Development<br />
St<strong>and</strong>ards, which helped countries outline<br />
developmentally appropriate expectations for<br />
young children’s development<br />
Originally a programme evaluation tool (based on<br />
items of other assessments) but now promoted as a<br />
measure for population-based monitoring<br />
Aimed at creating a global indicator of holistic<br />
early childhood development, drawing on the Early<br />
Development Index<br />
Initiated to promote feasible measurement of child<br />
development <strong>and</strong> learning <strong>and</strong> quality of learning<br />
environments in low <strong>and</strong> middle income countries<br />
85 items that cover approaches to learning; socialemotional<br />
development; cognitive development;<br />
cultural participation <strong>and</strong> knowledge; language<br />
<strong>and</strong> emergent literacy; motor development; health,<br />
hygiene <strong>and</strong> safety<br />
65 items that cover physical development, language,<br />
mathematics-cognitive development, socialemotional<br />
development<br />
Cognition, language <strong>and</strong> communication, socialemotional<br />
skills, motor skills<br />
10 items that cover numeracy <strong>and</strong> literacy (3),<br />
social-emotional development (3), approaches to<br />
learning (2), physical development (2)<br />
Social-emotional development, early literacy <strong>and</strong><br />
mathematics, executive functioning <strong>and</strong> approaches<br />
to learning<br />
Home environments, including maternal education<br />
<strong>and</strong> frequency of learning-related activities at home<br />
Child, family, community characteristics <strong>and</strong> child<br />
participation in early childhood development<br />
programmes<br />
Priority given to indigenous <strong>and</strong> marginalized<br />
populations<br />
Family environment module, with information on<br />
caregiver–child activities <strong>and</strong> access to playthings<br />
Measurement of quality in formal, pre-primary<br />
learning environments<br />
Source: Raikes (2016).<br />
■■<br />
In the social-emotional domain, a child exhibits at least<br />
two of three behaviours: gets along well with other<br />
children; does not kick, bite or hit other children; <strong>and</strong><br />
does not get distracted easily.<br />
■■<br />
In the learning domain, a child can follow simple<br />
directions on how to do something correctly <strong>and</strong>, when<br />
given something to do, is able to do it independently.<br />
The overall index is calculated as the percentage of<br />
children aged 3 to 4 who are developmentally on track in<br />
at least 3 of these 4 domains.<br />
The ECDI has been estimated in more than 50 countries.<br />
Its strength is that the information it provides can be<br />
combined with information on home environments,<br />
children’s health <strong>and</strong> nutrition, improving its policy<br />
relevance. It is considered to be the source of<br />
information on global indicator 4.2.1, even though it is<br />
only available for children under 5, which is before the<br />
start of formal schooling for most countries. There is<br />
also tension between trying to fully capture children’s<br />
development over a span of 2 years <strong>and</strong> relying on 10<br />
items to make collection at scale feasible.<br />
ECDI-generated data from 56 mostly low <strong>and</strong> middle<br />
income countries over 2009–2015 indicated that<br />
about 70% of 3-year-olds <strong>and</strong> 80% of 4-year-olds were<br />
developmentally on track. However, results differed<br />
considerably by domain. More than 95% of children were<br />
on track in the physical domain, about 90% in the learning<br />
domain <strong>and</strong> almost 75% in the social-emotional domain.<br />
But in the literacy-numeracy domain, just 25% of children<br />
were on track. Results also showed predicted associations<br />
with family wealth, with only 12% of children from the<br />
poorest quintile of households on track in the literacynumeracy<br />
domain (Figure 11.5); in Cameroon in 2011,<br />
3% of children from the poorest households <strong>and</strong> 45% of<br />
children from the richest were on track in that domain.<br />
Measuring Early Learning Quality <strong>and</strong> Outcomes<br />
(MELQO) was designed to help create <strong>and</strong> scale up<br />
workable open source tools, with joint leadership from<br />
the Brookings Institution, UNESCO, UNICEF <strong>and</strong> the<br />
World Bank in partnership with independent experts <strong>and</strong><br />
non-profit organizations. The tools include a common<br />
core of questions from other assessments, which can be<br />
adapted by countries to align with their st<strong>and</strong>ards. The<br />
tools have been trialled in Bangladesh, Kenya, the Lao<br />
People’s Democratic Republic, Madagascar, Mongolia,<br />
Sudan <strong>and</strong> the United Republic of Tanzania (Devercelli et<br />
al., 2015).<br />
In high income countries, the OECD is to carry out an<br />
international survey of early child outcomes in 2017/18 to<br />
allow countries to monitor system-level progress (OECD,<br />
2015g). Information on the domains the survey will cover<br />
is not yet available.<br />
218<br />
CHAPTER 11 | TARGET 4.2 – EARLY CHILDHOOD
11<br />
FIGURE 11.5:<br />
About three-quarters of 3- to 4-year-olds are developmentally on track in 56 countries<br />
Early Childhood Development Index, selected countries, 2009–2015<br />
100<br />
Early Childhood Development Index<br />
Literacy/numeracy domain<br />
Literacy/numeracy domain, poorest 20%<br />
80<br />
60<br />
`"<br />
%<br />
40<br />
20<br />
0<br />
Chad, 2010<br />
Sierra Leone, 2010<br />
C. A. R., 2010<br />
Congo, 2011–12<br />
Cameroon, 2011<br />
S. Tome/Principe, 2014<br />
Togo, 2010<br />
Nigeria, 2011<br />
Mauritania, 2011<br />
Malawi, 2013–14<br />
Guinea-Bissau, 2014<br />
Benin, 2014<br />
Mali, 2015<br />
Zimbabwe, 2014<br />
Swazil<strong>and</strong>, 2010<br />
Bangladesh, 2012–13<br />
Nepal, 2014<br />
D. R. Congo, 2013–14<br />
Gambia, 2010<br />
Cambodia, 2014<br />
Oman, 2014<br />
Jordan, 2012<br />
Algeria, 2012–13<br />
Suriname, 2010<br />
Bhutan, 2010<br />
Iraq, 2011<br />
Palestine, 2014<br />
Ghana, 2011<br />
DPR Korea, 2009<br />
Tunisia, 2011–12<br />
Mongolia, 2013–14<br />
Kyrgyzstan, 2014<br />
Panama, 2014<br />
El Salvador, 2014<br />
Costa Rica, 2011<br />
Lao PDR, 2011–12<br />
Qatar, 2014<br />
Rep. Moldova, 2014<br />
Dominican Rep., 2014<br />
Argentina, 2011–12<br />
Guyana, 2014<br />
Kazakhstan, 2010–11<br />
Uruguay, 2014<br />
Belize, 2011<br />
Viet Nam, 2013–14<br />
Cuba, 2014<br />
Ukraine, 2012<br />
Jamaica, 2011<br />
Saint Lucia, 2012<br />
Thail<strong>and</strong>, 2012–13<br />
TFYR Macedonia, 2011<br />
Belarus, 2012<br />
Montenegro, 2013<br />
Serbia, 2014<br />
Bosnia/Herzeg., 2011–12<br />
Barbados, 2014<br />
Source: MICS final <strong>and</strong> key findings reports.<br />
The case for measuring child development at the<br />
population level is strong. Among other reasons, it can<br />
identify sources of inequality that begin early in life<br />
<strong>and</strong> may persist through formal education <strong>and</strong> beyond.<br />
Equally important is the notion that development<br />
proceeds in patterns that are relevant across all groups<br />
of children, thus underscoring the efficiency of using a<br />
common set of constructs.<br />
ENDNOTES<br />
1. This section draws on Raikes (2016).<br />
That said, evidence is lacking as to whether one set<br />
of items on children’s development should be used<br />
everywhere, or if items should take into account culture<br />
<strong>and</strong> context (while keeping equivalent constructs) (e.g.<br />
Frongillo et al., 2014). The evidence clearly supports a<br />
more holistic set of measures of children’s development<br />
<strong>and</strong> early childhood care <strong>and</strong> education, including those<br />
directly related to the target. Finally, to accurately<br />
monitor progress on this aspect of the education<br />
Sustainable Development Goal, more research is needed<br />
on normative development of children in diverse contexts.<br />
2016 • GLOBAL EDUCATION MONITORING REPORT 219
12<br />
A young woman<br />
studies chemistry<br />
in the Russian<br />
Federation.<br />
CREDIT: V Makhorov/GEM Report<br />
KEY MESSAGES<br />
About 61 million of the world’s secondary school students, or 11%, were enrolled in some formal technical <strong>and</strong> vocational<br />
education programme in 2014.<br />
Relatively little is known about opportunities to learn skills in the workplace. New analysis from 12 countries shows about 20%<br />
of youth had participated in workplace-based programmes.<br />
No one indicator can capture the affordability of technical <strong>and</strong> vocational <strong>and</strong> training (TVET). One approach is to contrast the<br />
amount students pay to institutions with the amount of financial support they receive from government.<br />
One way to assess quality in TVET is whether a national qualification framework is in place. Such frameworks exist in 140 countries.<br />
Access to tertiary education has exp<strong>and</strong>ed rapidly. Enrolment doubled from 2000 to 2014, but with huge disparity across<br />
<strong>and</strong> within countries. Across 76 countries, 20% of the richest 25- to 29-year-olds had completed at least 4 years of tertiary<br />
education, compared with less than 1% of the poorest.<br />
The extent to which government financial assistance to households targets those most in need should be monitored to assess<br />
the affordability of tertiary education.<br />
University rankings are easy to underst<strong>and</strong> but give a partial <strong>and</strong> unreliable picture of the quality of student learning.<br />
The diversity of provision makes monitoring access to <strong>and</strong> participation in adult education particularly difficult. Globally, adults<br />
made up 4% of those enrolled in formal primary education, <strong>and</strong> 5% <strong>and</strong> 10%, respectively, in lower <strong>and</strong> upper secondary education.<br />
Less is known about participation in non-formal adult education. In European Union countries, 37% of adults participated in<br />
non-formal education in 2011.<br />
Assessment of affordability in adult education is constrained by the greater role of private financing <strong>and</strong> the lack of information on<br />
public financing. Governments in fewer than one in six countries spent more than 0.3% of GDP on adult education.<br />
220<br />
CHAPTER 12 | TARGET 4.3 – TECHNICAL, VOCATIONAL, TERTIARY AND ADULT EDUCATION
12<br />
CHAPTER 12<br />
Sustainable Development Goal 4.3<br />
TARGET 4.3<br />
Technical, vocational,<br />
tertiary <strong>and</strong> adult<br />
education<br />
By 2030, ensure equal access for all women <strong>and</strong> men to affordable <strong>and</strong><br />
quality technical, vocational <strong>and</strong> tertiary education, including university<br />
GLOBAL INDICATOR 4.3.1 – Participation rate of youth <strong>and</strong> adults in formal <strong>and</strong> non-formal<br />
education <strong>and</strong> training in the previous 12 months, by sex<br />
THEMATIC INDICATOR 13 – Gross enrolment ratio for tertiary education<br />
THEMATIC INDICATOR 14 – Participation rate in technical-vocational education programmes<br />
(15- to 24-year-olds)<br />
2016 • GLOBAL EDUCATION MONITORING REPORT 221
12<br />
Technical <strong>and</strong> vocational education <strong>and</strong> training.....................................................222<br />
Tertiary education...................................................................................................................227<br />
Adult education........................................................................................................................236<br />
Target 4.3 introduces technical, vocational <strong>and</strong> tertiary<br />
education into the global development agenda. These<br />
areas were considered<br />
in the Dakar Framework<br />
Target 4.3 introduces<br />
for Action, but only<br />
indirectly, as a way to<br />
technical, vocational<br />
support alternate goals.<br />
<strong>and</strong> tertiary education Technical <strong>and</strong> vocational<br />
into the global<br />
education was seen<br />
as a way for youth to<br />
development agenda<br />
acquire skills, <strong>and</strong> tertiary<br />
education as a way to<br />
prepare teachers. Tertiary<br />
education also appeared in the Millennium Development<br />
Goals (MDGs) but only in the context of gender parity.<br />
While targets 4.1 <strong>and</strong> 4.2 include both education<br />
participation <strong>and</strong> education outcomes, target 4.3<br />
focuses only on participation. But it is closely linked<br />
to targets 4.4 <strong>and</strong> 4.6, which focus on outcomes that<br />
may be acquired through education participation at the<br />
technical, vocational <strong>and</strong> tertiary levels.<br />
In its attempt to monitor the wide scope of target 4.3,<br />
the Inter-agency <strong>and</strong> Expert Group on SDG Indicators<br />
proposed as a global indicator the percentage of youth <strong>and</strong><br />
adults participating in formal or non-formal education or<br />
training in the previous 12 months. This broad measure<br />
embraces education <strong>and</strong> training in all its forms, well<br />
beyond technical, vocational <strong>and</strong> tertiary education.<br />
While the indicator may not match the exact formulation<br />
of the target, it helps redress an important omission.<br />
SDG 4 includes ‘lifelong learning opportunities for all’.<br />
Lifelong learning comprises all activities undertaken<br />
throughout life with the aim of improving knowledge,<br />
skills <strong>and</strong> competencies from a personal, civic, social or<br />
employment-related perspective. However, the 10 targets<br />
fail to deal explicitly with adult education, though they<br />
capture all other aspects of lifelong learning. Hence, this<br />
report covers adult education participation under target<br />
4.3 via global indicator 4.3.1.<br />
This chapter examines three education levels – technicalvocational,<br />
tertiary <strong>and</strong> adult – from the angle of the<br />
three concepts in the target formulation: (equitable)<br />
access, affordability <strong>and</strong> quality. The proposed indicators<br />
do not capture affordability <strong>and</strong> quality.<br />
Moreover, the target’s reference to ‘equal access for all<br />
women <strong>and</strong> men’ generates ambiguity. The inclusion of<br />
‘all’ shifts the emphasis from ‘equal access’ to ‘access<br />
for all’. Does the target imply that everyone above age 15<br />
should participate in technical, vocational <strong>and</strong> tertiary – or<br />
indeed also adult – education at least once in their life?<br />
Are the three levels interchangeable? Such questions could<br />
complicate monitoring, so this report avoids them <strong>and</strong><br />
focuses on identifying measures of access, affordability<br />
<strong>and</strong> quality separately for each of the three levels.<br />
TECHNICAL AND VOCATIONAL<br />
EDUCATION AND TRAINING<br />
The thematic indicator proposed for technical <strong>and</strong><br />
vocational education <strong>and</strong> training (TVET) is the<br />
participation rate in technical-vocational education<br />
programmes for youth. Traditionally, participation in<br />
TVET has been measured as a percentage of those<br />
enrolled at either the secondary or tertiary level.<br />
However, this indicator is expressed as a percentage of<br />
an age group (15- to 24-year-olds). Note that the indicator<br />
overlaps with global indicator 8.6.1, the percentage of<br />
youth not in education, employment or training, under<br />
the SDG 8 on employment. The following discussion<br />
addresses both education <strong>and</strong> training.<br />
222<br />
CHAPTER 12 | TARGET 4.3 – TECHNICAL, VOCATIONAL, TERTIARY AND ADULT EDUCATION
12<br />
A typology of TVET recognizes three main means of<br />
provision: at an institution, at the workplace or through a<br />
combination of the two (Table 12.1).<br />
Institution-based provision includes formal programmes,<br />
which provide students with an official diploma or<br />
certificate that is recognized by industry or corporations.<br />
Some of these programmes are not supervised by<br />
education ministries <strong>and</strong> enrolment in those may not be<br />
recorded in the data reported to the UNESCO Institute<br />
for Statistics (UIS). Institution-based provision also<br />
includes non-formal programmes, which are often not<br />
taken into account even when they result in certification.<br />
TABLE 12.1:<br />
A typology of technical <strong>and</strong> vocational education <strong>and</strong><br />
training provision<br />
Domain<br />
Indicator<br />
1. Institution-based (i) In formal education<br />
• Supervised by the Ministry of Education<br />
• Not supervised by the Ministry of Education<br />
(ii) Outside formal education<br />
2. Institution- <strong>and</strong> workplace-based Multiple types (e.g. dual systems)<br />
3. Workplace-based (i) Training before employment (e.g. apprenticeships)<br />
(ii) Training during employment<br />
Source: Adapted from IAG-TVET Working Group (2014).<br />
Workplace-based provision can be prior to employment,<br />
as in apprenticeships, or during employment. The<br />
question is whether participation in workplacebased<br />
training should be included in a measure of<br />
TVET participation.<br />
Given the variety of policy frameworks, institutional<br />
arrangements <strong>and</strong> organizational approaches, data<br />
collected through national statistical systems may<br />
only capture a partial picture, making TVET provision<br />
difficult to compare across countries.<br />
ACCESS<br />
About 62 million of all secondary school students,<br />
or 11%, were enrolled in some formal technical <strong>and</strong><br />
vocational programme in 2014. There was a gender<br />
gap of two percentage points at the expense of<br />
females. On average, TVET students account for<br />
1.5% of lower secondary <strong>and</strong> 23% of upper secondary<br />
enrolment. The highest share of technical <strong>and</strong> vocational<br />
education in secondary education is observed in Eastern<br />
<strong>and</strong> South-eastern Asia (17%) <strong>and</strong> the Pacific (26%), as<br />
a result of high enrolment levels in China <strong>and</strong> Australia,<br />
respectively. The lowest share is observed in Southern<br />
Asia (2%) (Figure 12.1).<br />
FIGURE 12.1:<br />
Only 2% of secondary school students were enrolled in technical <strong>and</strong> vocational programmes in Southern Asia<br />
Technical <strong>and</strong> vocational programmes as a share of secondary education enrolment, 2014<br />
Share of technical <strong>and</strong> vocational education in total secondary<br />
enrolment (%)<br />
50<br />
40<br />
30<br />
20<br />
10<br />
Source: UIS database.<br />
0<br />
Southern Asia<br />
Iran, Isl. Rep.<br />
15%<br />
Afghanistan<br />
1%<br />
Sub-Saharan<br />
Africa<br />
Cameroon<br />
22%<br />
Swazil<strong>and</strong><br />
0%<br />
Ecuador<br />
32%<br />
Peru<br />
1%<br />
Latin America <strong>and</strong><br />
the Caribbean<br />
Turkey<br />
21%<br />
Oman<br />
0%<br />
Nothern Africa<br />
<strong>and</strong> Western Asia<br />
Azerbaijan<br />
20%<br />
Tajikistan<br />
1%<br />
Caucasus <strong>and</strong><br />
Central Asia<br />
Netherl<strong>and</strong>s<br />
48%<br />
Canada<br />
4%<br />
Europe <strong>and</strong><br />
Northern America<br />
China<br />
22%<br />
Lao PDR<br />
1%<br />
Eastern <strong>and</strong><br />
South-eastern<br />
Asia<br />
Pacific<br />
Australia<br />
33%<br />
Fiji<br />
1%<br />
2016 • GLOBAL EDUCATION MONITORING REPORT 223
12<br />
Almost 19% of countries did not report this information<br />
in 2014, mostly because they reported no secondary<br />
enrolment data at all. A further 8% could not distinguish<br />
technical-vocational from general secondary enrolment,<br />
sometimes due to differences between national <strong>and</strong><br />
international definitions. For example, national sources<br />
showed 19% of US secondary school graduates focusing<br />
on a technical-vocational course of study in 2009<br />
(Dortch, 2014). As these studies may be offered as a<br />
single course or part of a career pathway, they do not<br />
map neatly onto the international definitions that<br />
separate general from vocational secondary school<br />
programmes. Hence UIS does not report technicalvocational<br />
enrolment data for the United States.<br />
In 2014, 11 million students were in post-secondary<br />
non-tertiary education programmes, which may last<br />
from six months to several years. In the 54 countries<br />
that identified the type of programme, 95% of students<br />
were enrolled in technical <strong>and</strong> vocational programmes.<br />
Notable cases where the share of enrolment in technicalvocational<br />
programmes was lower were China (38%),<br />
Egypt (18%) <strong>and</strong> France (51%).<br />
Many national systems offer technical <strong>and</strong> vocational<br />
programmes at the tertiary level, through either a shortcycle<br />
tertiary or a professional programme, but the UIS<br />
annual survey does not separate out this enrolment.<br />
Therefore, for the purpose of monitoring target 4.3,<br />
students enrolled in tertiary level technical <strong>and</strong><br />
vocational programmes are not currently counted.<br />
Adding participation in workplace-based programmes<br />
The main challenge for a comprehensive measure of<br />
youth participation in technical-vocational programmes<br />
is how to capture the incidence of workplace-based<br />
education <strong>and</strong> training. One option is to ignore workplace<br />
programmes altogether. Combined participation<br />
rates from institution-based <strong>and</strong> workplace-based<br />
programmes would need to reflect differences in<br />
duration, instruction methods <strong>and</strong>, ultimately, the skills<br />
acquired. They would also need to account for the vast<br />
differences in labour market contexts between countries,<br />
which result in very different kinds of skills training.<br />
And yet, workplace-based education <strong>and</strong> training is<br />
a very important source of technical-vocational skill<br />
formation for youth. Ignoring it would considerably<br />
narrow the scope of monitoring the target. Such<br />
information can only be captured by using data from<br />
labour force, enterprise or household surveys.<br />
For this report, an analysis of 12 countries 1 drew upon<br />
administrative <strong>and</strong> survey data to explore the implications<br />
of a broader measure of participation in technical-vocational<br />
programmes. In keeping with the remit of the proposed<br />
indicator, the analysis pooled data for all youth aged 15 to 24. 2<br />
In the case of institution-based programmes, about 7%<br />
of youth participated in such technical <strong>and</strong> vocational<br />
programmes in lower, upper or post-secondary nontertiary<br />
formal education, according to administrative<br />
data reported by UIS in the 12 countries. The estimate<br />
increased to 9% if ministry reports, agency databases<br />
<strong>and</strong> other sources of official information on institutionbased<br />
programme enrolments, whether from education<br />
ministries or other recognized providers, were added<br />
(Figure 12.2). The data were validated with comparisons<br />
to the reported national qualifications frameworks.<br />
Two factors account for the two percentage point<br />
difference. First, no data are reported in some cases. For<br />
example, no UIS data are available for technical-vocational<br />
participation in Jordan <strong>and</strong> Viet Nam, even though both<br />
countries have well-developed national programmes. In<br />
Viet Nam, 2.4 million students, or 14% of all youth, were<br />
enrolled in such programmes in 2010/11. The programmes<br />
FIGURE 12.2:<br />
A broader definition suggests wider youth access to<br />
technical-vocational programmes<br />
Youth participation rate in technical-vocational institution<strong>and</strong>/or<br />
workplace-based programmes, selected countries,<br />
2012 or most recent available year<br />
Youth participation rate (%)<br />
75<br />
50<br />
25<br />
0<br />
Nepal<br />
Institution- <strong>and</strong>/or workplace-based, estimated<br />
Institution-based, estimated<br />
Institution-based, reported<br />
Armenia<br />
Ug<strong>and</strong>a<br />
Egypt<br />
Jordan<br />
Kenya<br />
Source: GEM Report team analysis based on UIS data, official country<br />
reports <strong>and</strong> household surveys (World Bank Skills Toward Employment<br />
<strong>and</strong> Productivity, ILO School-to-Work Transition Survey, OECD<br />
Programme for the International Assessment of Adult Competencies).<br />
Sri Lanka<br />
Viet Nam<br />
Colombia<br />
Rep. of Korea<br />
Sweden<br />
Netherl<strong>and</strong>s<br />
224<br />
CHAPTER 12 | TARGET 4.3 – TECHNICAL, VOCATIONAL, TERTIARY AND ADULT EDUCATION
12<br />
are operated by the General Department of Vocational<br />
Training in the Ministry of Labour, Invalids <strong>and</strong> Social<br />
Affairs, which coordinates provision (ADB, 2014).<br />
Second, enrolment in formal education programmes<br />
not supervised by education ministries may be<br />
under-reported. For example, Egypt reported to UIS<br />
in 2009/10 only the 1.5 million students enrolled in<br />
Ministry of Education technical-vocational programmes,<br />
but an additional 440,000 were enrolled in short <strong>and</strong><br />
long programmes offered at public <strong>and</strong> private vocational<br />
training centres by 16 other ministries (Amin, 2014).<br />
Improved measurement of workplace-based programmes<br />
requires the use of comparable definitions in cross-country<br />
household surveys. It also calls for collecting more details on<br />
programme characteristics <strong>and</strong> retrospective information<br />
from individuals to better underst<strong>and</strong> who benefits from<br />
multiple programmes. In recent years, one-third of all<br />
countries have participated in one of the major household<br />
surveys that report on some dimension of TVET. These<br />
surveys, which are necessary for monitoring equity, should<br />
coordinate their definitions <strong>and</strong> questionnaires. The ILO,<br />
responsible for monitoring global indicator 8.6.1, should lead<br />
in ensuring this coordination.<br />
Capturing the considerable amount of education <strong>and</strong><br />
training that happens outside institutions requires<br />
addressing direct<br />
questions to youth.<br />
Capturing the<br />
However, the relevant<br />
questions are asked<br />
considerable amount of<br />
in very different ways<br />
education <strong>and</strong> training across surveys, as<br />
that happens outside they deal with various<br />
types of education<br />
institutions requires<br />
<strong>and</strong> training, including<br />
addressing direct<br />
apprenticeships,<br />
questions to youth internships, open<br />
or distance courses,<br />
organized on-the-job<br />
training, seminars <strong>and</strong> workshops. The surveys usually<br />
do not reveal the programmes’ duration <strong>and</strong> other<br />
characteristics. That said, on average, about 20% of<br />
youth appear to have participated in workplace-based<br />
programmes in the 12 countries (Figure 12.2).<br />
Sri Lanka took part in the World Bank Skills Toward<br />
Employment <strong>and</strong> Productivity survey. About 18% of<br />
youth had either been on a training course lasting at<br />
least 30 hours in the past 12 months or completed an<br />
apprenticeship. Ug<strong>and</strong>a participated in the International<br />
Labour Organization (ILO) School-to-Work Transition<br />
Survey. It showed 11% of youth had completed an<br />
apprenticeship, internship or other kind of training.<br />
These sources provide snapshots of young <strong>people</strong><br />
at specific times; they do not track the education<br />
<strong>and</strong> training of particular young <strong>people</strong> over time.<br />
More educated youth are more likely to participate<br />
in additional training than those with less education,<br />
which means they may be double-counted in technicalvocational<br />
programmes, especially in countries with<br />
high rates of provision.<br />
AFFORDABILITY<br />
The funding of TVET is shared by governments,<br />
employers <strong>and</strong> learners. Questions of affordability need<br />
to focus on the extent to which government policy<br />
helps address inequality in TVET access. Governments<br />
have a range of policy tools at their disposal, including<br />
grants, fee exemptions, loans, allowances <strong>and</strong> subsidies.<br />
However, the context differs widely between richer <strong>and</strong><br />
poorer countries.<br />
In richer countries, the average student in technical <strong>and</strong><br />
vocational education is more likely to come from a<br />
relatively disadvantaged background. For example, in<br />
Australia, the poor are almost four times as likely (22%)<br />
to enrol in vocational training as the wealthy (6%) (Lamb,<br />
2011). Yet, fees are often charged. Australia introduced fees<br />
for publicly funded programmes in the 1990s. Student fees<br />
<strong>and</strong> charges accounted for about 5% of total institution<br />
revenues in 2014, ranging from 2% in the Northern<br />
Territories to 9% in Western Australia (NCVER, 2015a).<br />
For students in both public <strong>and</strong> private programmes,<br />
the Australian government introduced VET FEE-HELP,<br />
an income-contingent loan programme that assists<br />
eligible students attending certain courses with an<br />
approved provider by paying all or part of their tuition.<br />
In 2014, 87% of eligible students benefited, or 203,000<br />
out of 3.9 million students at all levels (Australia DoET,<br />
2015; NCVER, 2015b). The average loan was AUD 12,300<br />
per student; poor students borrowed almost AUD 3,300<br />
more than rich students (Australia DoET, 2014). The<br />
programme has not yet been evaluated.<br />
A qualitative evaluation of 35 loan programmes in<br />
European countries found that while they supported<br />
participation, they did not target the learners in greatest<br />
need. Many did not provide sufficient guidance <strong>and</strong><br />
2016 • GLOBAL EDUCATION MONITORING REPORT 225
12<br />
“<br />
Attempts to support technical <strong>and</strong> vocational<br />
participation are less likely to benefit the poorest<br />
information to reach target groups averse to debt.<br />
Programmes with long repayment periods were<br />
more equity-oriented. Public programmes focusing<br />
on technical <strong>and</strong> vocational education in Finl<strong>and</strong>,<br />
the Netherl<strong>and</strong>s <strong>and</strong> Sweden were among the more<br />
successful. In Finl<strong>and</strong>, support consists of a study grant, a<br />
housing allowance <strong>and</strong> a student loan guarantee. To qualify<br />
for a loan guarantee, the learner must receive a study<br />
grant. Once the guarantee has been approved, learners<br />
contact banks <strong>and</strong> agree the interest rate, repayment<br />
conditions <strong>and</strong> other features of the loan (CEDEFOP, 2012).<br />
In poorer countries, youth from disadvantaged<br />
backgrounds are far less likely to enrol in post-basic<br />
education. Those who make it to technical <strong>and</strong> vocational<br />
programmes tend to come from relatively more<br />
advantaged backgrounds than in richer countries. An<br />
analysis of 22 countries that took part in the 2009 the<br />
Programme for International Student Assessment (PISA)<br />
of the Organisation for Economic Co-operation <strong>and</strong><br />
Development (OECD) showed that 4 of the 5 countries<br />
with the lowest proportion of vocational secondary<br />
school students from the bottom socio-economic group<br />
were middle income countries, such as Colombia <strong>and</strong><br />
Indonesia (Altinok, 2012).<br />
This means attempts to support technical <strong>and</strong> vocational<br />
participation are less likely to benefit the poorest. In<br />
Kenya, the Technical <strong>and</strong> Vocational Vouchers Programme<br />
offered a voucher worth US$460, enough to fully or<br />
almost fully cover tuition for both government <strong>and</strong><br />
private vocational programmes – but also twice the<br />
participants’ average annual salary level (Hicks et al., 2011).<br />
A study of seven countries in the Pacific found that the<br />
share of income from student fees in institution-based<br />
technical <strong>and</strong> vocational programmes was 35%, although<br />
it varied significantly from 1% at the Kiribati Institute<br />
of Technology to 64% at the five Technical <strong>and</strong> Business<br />
Colleges in Papua New Guinea (Schofield, 2015). Fees<br />
can be very high relative to household budgets. Those<br />
charged at the School of Engineering in Samoa equal half<br />
the income of the poorest 10% of households.<br />
”<br />
Financial aid programmes to offset student costs<br />
differ widely even within countries. In Samoa, there<br />
are two such arrangements. The aid-funded Australia-<br />
Pacific Technical College receives none of its income<br />
from students, as the cost of fees is covered through<br />
scholarships. The public National University of Samoa<br />
receives one-third of its income from fees but awards<br />
a full or partial scholarship to one in six students in<br />
technical-vocational programmes. Students enrolled in<br />
other institutions do not receive aid (Maglen et al., 2013).<br />
The extreme diversity of providers, cost structures, public<br />
policies <strong>and</strong> national contexts makes it unlikely that a single<br />
indicator can describe the affordability of a TVET system.<br />
As the section below on affordability of higher education<br />
notes, however, a possible approach might be to contrast the<br />
amount of institution income that is covered by students with<br />
the amount of financial support the government provides to<br />
students. This would require consensus on common<br />
guidelines <strong>and</strong> major investment in information systems.<br />
QUALITY<br />
There is a very broad range of issues related to quality<br />
in technical <strong>and</strong> vocational education. One approach to<br />
assessing quality is to focus on systems.<br />
SYSTEMS<br />
National qualification<br />
frameworks<br />
LEARNERS<br />
SCHOOL AND CLASSROOM SETTINGS<br />
OUTCOMES<br />
CONTEXT<br />
Economic, political <strong>and</strong> social conditions<br />
226<br />
CHAPTER 12 | TARGET 4.3 – TECHNICAL, VOCATIONAL, TERTIARY AND ADULT EDUCATION
12<br />
Within its Systems Approach for Better Education Results<br />
(SABER) programme, the World Bank has developed a<br />
tool to assess national policies for skills development<br />
(World Bank, 2013c). One dimension of system quality is<br />
whether there are relevant <strong>and</strong> reliable st<strong>and</strong>ards codified<br />
in a national qualification framework, which helps in<br />
recognizing, certifying <strong>and</strong> accrediting skills.<br />
st<strong>and</strong>ards. But by 2011, less than 10% of all graduates had<br />
received certificates. The government has recognized<br />
the national vocational qualification certificate for<br />
recruitment to specific grades in the public service<br />
but the certificate has not yet gained the same level<br />
of recognition among private employers (World Bank,<br />
2014c).<br />
At least 140 countries have implemented a national<br />
qualification framework (Keevy <strong>and</strong> Chakroun, 2015).<br />
The frameworks vary in effectiveness <strong>and</strong> do not ensure<br />
education quality in <strong>and</strong> of themselves (Blackmur,<br />
2015). But they can help learners, training providers<br />
<strong>and</strong> employers focus on outcomes, rather than on the<br />
precise way qualifications were acquired (Tuck, 2007;<br />
Veal, 2009).<br />
Simple frameworks classify formal learning programmes<br />
<strong>and</strong> associated qualifications <strong>and</strong> certificates. More<br />
advanced frameworks facilitate stakeholder interactions,<br />
support wider quality assurance, recognize learning<br />
gained outside formal education <strong>and</strong> training, <strong>and</strong><br />
make national qualification systems more transparent<br />
to the international community (Coles et al., 2014).<br />
In fact, regional groupings, such as Association of<br />
Southeast Asian Nations (ASEAN), Caribbean Community<br />
(CARICOM), the Commonwealth, the European Union,<br />
the Pacific Community <strong>and</strong> the Southern African<br />
Development Community, have helped coordinate<br />
recognition of national qualifications in regional<br />
frameworks (ETF, 2012; UIL et al., 2016).<br />
Among 18 countries analysed over 2012–2014 with<br />
the SABER tool, there was quick progress towards<br />
establishing national qualification frameworks. In<br />
Malaysia, the 2006 National Skills Development Act<br />
<strong>and</strong> 2007 Malaysian Qualifications Agency Act helped<br />
establish such a framework. Coverage of occupations<br />
under the National Occupational Skills St<strong>and</strong>ards tripled<br />
over the 2000s, <strong>and</strong> there was greater certification of<br />
skills testing. All publicly funded programmes had to be<br />
accredited, which strengthened coordination among<br />
training providers (World Bank, 2013a).<br />
Overall, two of three countries demonstrated<br />
considerable room for improvement. For example, Sri<br />
Lanka launched a national vocational qualification<br />
framework in 2004. Competency st<strong>and</strong>ards were<br />
developed for 114 occupations at the certificate level.<br />
Most institutions under the Ministry of Youth Affairs<br />
<strong>and</strong> Skills Development based their training on these<br />
By focusing efforts on underst<strong>and</strong>ing the relevance <strong>and</strong><br />
reliability of their qualifications frameworks, countries<br />
can then target efforts to improve quality throughout<br />
their TVET systems. An approach based on expert <strong>and</strong><br />
peer reviews with the support of regional bodies will be<br />
necessary to achieve these synergies.<br />
TERTIARY EDUCATION<br />
Tertiary education is very diverse, ranging from short<br />
courses, often with career or vocational focus, to<br />
bachelor’s, master’s <strong>and</strong> doctoral programmes. Tertiary<br />
education institutions vary widely within each country<br />
in terms of size, cost, course offerings, procedures,<br />
tradition, governance <strong>and</strong> quality. Differences between<br />
countries are far more visible than they are for primary<br />
<strong>and</strong> secondary education systems.<br />
The proposed thematic indicator – the tertiary education<br />
gross enrolment ratio – captures only a small part of the<br />
diversity in access – <strong>and</strong> does not touch upon the two<br />
other concepts of the target: affordability <strong>and</strong> quality.<br />
Examining the target in its entirety is the objective of<br />
this section.<br />
ACCESS<br />
Pre-entry, entry, progression <strong>and</strong> graduation in tertiary<br />
education systems are distinct phases (Orr, 2016).<br />
Ideally, different indicators should capture each of<br />
these key transitions to better underst<strong>and</strong> who is<br />
eligible to apply for tertiary education, who is selected,<br />
who enrols <strong>and</strong> who graduates (Belyakov et al., 2009)<br />
(Table 12.2). Participation in higher education reflects<br />
national policies on secondary education, admissions<br />
norms, st<strong>and</strong>ardized entrance exams, costs <strong>and</strong> financial<br />
aid, private provision, <strong>and</strong> university curricular design<br />
(Clancey <strong>and</strong> Goastellec, 2007).<br />
Pre-entry indicators. In some countries, secondary school<br />
graduates sit a central tertiary education entrance<br />
examination. In others, all young <strong>people</strong> who graduate<br />
2016 • GLOBAL EDUCATION MONITORING REPORT 227
12<br />
from upper secondary school have the right to enrol<br />
in tertiary education but have to perform well during<br />
their first year to continue (Orr <strong>and</strong> Hovdhaugen, 2014).<br />
According to the UIS, among 53 countries with relevant<br />
data, 92% of secondary school graduates, on average,<br />
have direct access to tertiary education – but the<br />
rates range as low as 61% in Mali, 43% in Mongolia <strong>and</strong><br />
71% in Pol<strong>and</strong>.<br />
Entry indicators. Two examples can be considered. First,<br />
the transition rate from upper secondary to tertiary<br />
TABLE 12.2:<br />
Indicators of tertiary education<br />
Phase Process Indicator<br />
1. Pre-entry Qualification Share of <strong>people</strong> of secondary school graduation age (e.g. 18 years)<br />
who leave secondary education with a qualification that enables<br />
them to apply to enter tertiary education (secondary gross<br />
graduation rate with direct access to tertiary)<br />
Application Share of <strong>people</strong> of secondary school graduation age (e.g. 18 years)<br />
who complete the central entrance examination (where relevant)<br />
2. Entry Offer Share of <strong>people</strong> who qualified or applied <strong>and</strong> received an offer of a<br />
tertiary education study place<br />
Transition Share of <strong>people</strong> who enrolled in the final grade of secondary<br />
education the previous year who were admitted into tertiary<br />
education this year (transition rate)<br />
Entry<br />
Share of <strong>people</strong> of tertiary education entry age (e.g. 19 years) who<br />
enrol in first year of tertiary education (entry ratio)<br />
3. Participation Enrolment Share of <strong>people</strong> who enrol in tertiary education among those of<br />
tertiary education age (usually a five-year age group, e.g. 19 to 23)<br />
(gross enrolment ratio)<br />
Dropout<br />
Share of students who entered tertiary education who drop out<br />
4. Graduation Share of <strong>people</strong> who completed tertiary education among those<br />
of tertiary education graduation age (usually a five-year age<br />
group, e.g. 25 to 29) (attainment rate)<br />
Source: UIS database.<br />
education, i.e. the number of students enrolled in the<br />
first year of tertiary education expressed as a percentage<br />
of the number of students who were enrolled in the<br />
last year of secondary education. Among 42 countries<br />
with data, the average was 78%. Second, the entry ratio,<br />
i.e. the number of students enrolled in the first year of<br />
tertiary education expressed as a percentage of the<br />
population of that age group. Among 53 countries with<br />
data, the intake ranged from 5% in Eritrea to 90% in<br />
Belarus (Figure 12.3).<br />
Participation indicators. Enrolment in tertiary education<br />
has grown steadily, doubling from 100 million students<br />
worldwide in 2000 to 207 million in 2014 (Table 12.3).<br />
The tertiary education gross enrolment ratio, which<br />
expresses enrolment as a percentage of the population<br />
of the five-year age group following secondary school<br />
graduation (typically ages 19 to 23) increased from 19%<br />
to 34% over the period. The ratio ranges from 8% in sub-<br />
Saharan Africa to 75% in Europe <strong>and</strong> Northern America.<br />
These figures may hide important differences between<br />
countries. In countries where part-time <strong>and</strong> older<br />
students are more likely to enrol, participation rates<br />
will be inflated. Likewise, countries with more credit<br />
requirements spread out over more years will have higher<br />
participation rates than countries where shorter-cycle<br />
bachelor’s programmes are more common.<br />
Graduation indicators. Two sources can be used.<br />
Administrative data provide information on the number<br />
of degrees awarded. Surveys <strong>and</strong> censuses ask individuals<br />
directly what is their highest level of education attained.<br />
FIGURE 12.3:<br />
There are huge disparities across countries in terms of access to tertiary education<br />
Gross entry ratio to first tertiary programmes, selected countries, 2014 or most recent available year<br />
Gross entry ratio to first tertiary<br />
programmes (%)<br />
100<br />
90<br />
80<br />
70<br />
60<br />
50<br />
40<br />
30<br />
20<br />
10<br />
0<br />
Eritrea<br />
Zimbabwe<br />
Burundi<br />
Lesotho<br />
Sudan<br />
Afghanistan<br />
Seychelles<br />
Guinea<br />
Honduras<br />
Ghana<br />
Bhutan<br />
Comoros<br />
El Salvador<br />
Cuba<br />
Sri Lanka<br />
Indonesia<br />
Egypt<br />
Algeria<br />
Malaysia<br />
Luxembourg<br />
Cabo Verde<br />
India<br />
Tunisia<br />
Italy<br />
Hungary<br />
United States<br />
Bahrain<br />
Finl<strong>and</strong><br />
Palestine<br />
Romania<br />
Argentina<br />
United Kingdom<br />
Albania<br />
Slovakia<br />
Sweden<br />
Portugal<br />
Malta<br />
Germany<br />
Iran, Isl. Rep.<br />
Austria<br />
Czech Rep.<br />
Lithuania<br />
Saudi Arabia<br />
Slovenia<br />
Spain<br />
Switzerl<strong>and</strong><br />
Norway<br />
Bulgaria<br />
Mongolia<br />
Denmark<br />
Russian Fed.<br />
Chile<br />
Belarus<br />
Source: UIS database.<br />
228<br />
CHAPTER 12 | TARGET 4.3 – TECHNICAL, VOCATIONAL, TERTIARY AND ADULT EDUCATION
12<br />
Administrative sources provide evidence on the gross<br />
graduation ratio, i.e. the number of graduates from<br />
first degree programmes, expressed as a percentage of<br />
the population of graduation age. This is available for<br />
almost 100 countries. In Madagascar, less than 3% of<br />
the population of graduation age completed tertiary<br />
education at least at the bachelor level in 2013. By<br />
contrast, 65% did so in Lithuania (Figure 12.4).<br />
This definition considers only bachelor- <strong>and</strong> master-level<br />
diplomas to be first degrees. Across 94 countries with<br />
data in 2014, an average of 79% of tertiary education<br />
graduates obtained a bachelor- or master-level degree.<br />
In countries where a larger share of tertiary education<br />
graduates obtain a short-cycle degree, such as Colombia<br />
(30%), the Republic of Korea (33%) <strong>and</strong> the United States<br />
(28%), there are wider discrepancies between the gross<br />
graduation <strong>and</strong> enrolment ratios.<br />
A comparison between the two ratios also provides<br />
insights into gender disparity in tertiary education. In<br />
general, in the relatively few countries where there is<br />
TABLE 12.3:<br />
Tertiary education participation indicators<br />
Enrolment (000) Gross enrolment ratio (%) Gender parity index<br />
2000 2014 2000 2014 2000 2014<br />
World 99 516 207 272 19 34 0.99 1.11<br />
Low income 1 237 4 460 3 8 0.43 0.53<br />
Lower middle income 24 996 58 642 11 22 0.79 0.97<br />
Upper middle income 24 798 78 729 14 41 0.94 1.16<br />
High income 48 485 65 441 55 74 1.17 1.25<br />
Caucasus <strong>and</strong> Central Asia 1 427 1 956 22 24 0.95 1.04<br />
Eastern <strong>and</strong> South-eastern Asia 24 213 67 351 15 39 0.83 1.11<br />
Europe <strong>and</strong> Northern America 39 940 51 870 56 75 1.25 1.28<br />
Latin America <strong>and</strong> the Caribbean 11 318 23 845 22 44 1.17 1.29<br />
Northern Africa <strong>and</strong> Western Asia 6 854 15 261 20 37 0.83 0.99<br />
Pacific 1 044 1 748 46 62 1.26 1.39<br />
Southern Asia 12 162 38 097 9 23 0.66 0.93<br />
Sub-Saharan Africa 2 557 7 145 4 8 0.66 0.70<br />
Source: UIS database.<br />
FIGURE 12.4:<br />
The share of young <strong>people</strong> who graduate with a bachelor’s or master’s degree differs widely between countries<br />
Tertiary education gross enrolment <strong>and</strong> gross graduation ratios for first degree programmes in tertiary education, selected countries, 2013 or most recent available year<br />
100<br />
90<br />
80<br />
70<br />
60<br />
%<br />
50<br />
40<br />
30<br />
Gross enrolment ratio<br />
Gross graduation ratio<br />
20<br />
10<br />
0<br />
Madagascar<br />
Rw<strong>and</strong>a<br />
Burundi<br />
Comoros<br />
South Africa<br />
Bangladesh<br />
Sri Lanka<br />
Ghana<br />
Honduras<br />
Nepal<br />
Sudan<br />
El Salvador<br />
Lao PDR<br />
Syrian A. R.<br />
Kuwait<br />
Belize<br />
Viet Nam<br />
Brunei Daruss.<br />
Azerbaijan<br />
Indonesia<br />
China<br />
Colombia<br />
Georgia<br />
Iran, Isl. Rep.<br />
Mexico<br />
Liechtenstein<br />
Dominican Rep.<br />
Cyprus<br />
Saudi Arabia<br />
Malaysia<br />
Panama<br />
Serbia<br />
Tunisia<br />
Estonia<br />
Egypt<br />
Turkey<br />
Barbados<br />
Lebanon<br />
TFYR Macedonia<br />
Palestine<br />
Hungary<br />
Palau<br />
Malta<br />
Kyrgyzstan<br />
Sweden<br />
Italy<br />
Rep. Moldova<br />
Bulgaria<br />
Costa Rica<br />
Austria<br />
Albania<br />
United States<br />
France<br />
Czech Rep.<br />
Israel<br />
Latvia<br />
Slovakia<br />
Japan<br />
Macao, China<br />
Spain<br />
Romania<br />
Norway<br />
Croatia<br />
United Kingdom<br />
Rep. of Korea<br />
Switzerl<strong>and</strong><br />
Slovenia<br />
Netherl<strong>and</strong>s<br />
Finl<strong>and</strong><br />
Denmark<br />
Portugal<br />
Belarus<br />
Pol<strong>and</strong><br />
New Zeal<strong>and</strong><br />
Icel<strong>and</strong><br />
Russian Fed.<br />
Australia<br />
Lithuania<br />
Source: UIS database.<br />
2016 • GLOBAL EDUCATION MONITORING REPORT 229
12<br />
disparity at the expense of women in enrolment, disparity<br />
in graduation is smaller. For example, in Egypt in 2013,<br />
there were 89 women for every 100 men enrolled in<br />
tertiary education, but there was gender parity in the<br />
graduation rate. It is less common for disparity to be<br />
exacerbated between enrolment <strong>and</strong> graduation. In<br />
Rw<strong>and</strong>a, 79 women enrolled but only 51 graduated for<br />
every 100 men in 2013.<br />
Globally, however, it is more common for disparity at the<br />
expense of men at the enrolment level to be exacerbated<br />
by the time of graduation. For example, in Costa Rica,<br />
80 men enrolled but 53 graduated for every 100 women<br />
in 2011. In Caribbean countries, such as Barbados, <strong>and</strong><br />
in Arab countries, such as Kuwait, more than twice as<br />
many women as men graduated from tertiary education<br />
(Figure 12.5).<br />
Survey <strong>and</strong> census sources can provide complementary<br />
information in several contexts, e.g. when there<br />
are many private providers that do not report regularly<br />
to the authorities on graduates. The main indicator<br />
is the tertiary education attainment rate – the<br />
percentage of a population group that has obtained a<br />
tertiary education degree or qualification. There is no<br />
consensus on which age group to use for reference.<br />
While the average age of students in Georgia <strong>and</strong><br />
Ukraine was up to 21 years, in Norway <strong>and</strong> Sweden<br />
it was 29 years (Eurostudent, 2015). Eurostat reports<br />
the tertiary education attainment rate among 30- to<br />
34-year-olds, based on the European Labour Force<br />
Survey, was 38% in 2014 across the 28 European Union<br />
countries; among women, attainment rates were on<br />
average nine percentage points higher than among men<br />
(Eurostat, 2016).<br />
The main advantage of survey sources is that they<br />
help in analysing inequality. New analysis for the<br />
GEM Report shows a very large disparity between<br />
the poorest <strong>and</strong> richest 25- to 29-year-olds in terms<br />
of those who have completed at least four years of<br />
tertiary education. Across 76 countries, 20% of the<br />
richest 25–29 year olds completed at least four years<br />
of tertiary education compared with less than 1% of the<br />
poorest. In the Philippines, 21% of 25- to 29-year-olds<br />
had completed at least four years of tertiary education<br />
in 2013, but the corresponding levels were 52% for the<br />
richest <strong>and</strong> 1% for the poorest. In Mongolia, 72% of<br />
the richest completed at least four years of tertiary<br />
education, compared with 3% of the poorest, in 2010.<br />
FIGURE 12.5:<br />
Disparity for men worsens between tertiary education participation <strong>and</strong> completion<br />
Gender parity index of the tertiary education gross enrolment ratio <strong>and</strong> gross graduation ratio from first degree programmes, selected countries,<br />
2013 or most recent available year<br />
2.0<br />
1.8<br />
1.6<br />
Disparity at the expense of males<br />
1.4<br />
Gender parity index<br />
1.2<br />
1.0<br />
0.8<br />
Gender parity<br />
0.6<br />
0.4<br />
0.2<br />
0.0<br />
Disparity at the expense of females<br />
Gender parity index, gross enrolment rate<br />
Gender parity index, gross graduation rate<br />
Burundi<br />
Rw<strong>and</strong>a<br />
Liechtenstein<br />
Swazil<strong>and</strong><br />
Lao PDR<br />
Ghana<br />
Bangladesh<br />
Uzbekistan<br />
Japan<br />
Nepal<br />
Azerbaijan<br />
Iran, Isl. Rep.<br />
Indonesia<br />
Madagascar<br />
Turkey<br />
Switzerl<strong>and</strong><br />
Syrian A. R.<br />
Egypt<br />
Rep. of Korea<br />
China<br />
Mexico<br />
Lebanon<br />
Jordan<br />
Sudan<br />
Belgium<br />
Serbia<br />
Chile<br />
TFYR Macedonia<br />
Kyrgyzstan<br />
Netherl<strong>and</strong>s<br />
France<br />
United Kingdom<br />
El Salvador<br />
Colombia<br />
United States<br />
Portugal<br />
Macao, China<br />
Spain<br />
Georgia<br />
South Africa<br />
Israel<br />
Palau<br />
Sri Lanka<br />
Armenia<br />
Rep. Moldova<br />
Australia<br />
Croatia<br />
Italy<br />
Russian Fed.<br />
Bulgaria<br />
Finl<strong>and</strong><br />
Romania<br />
Denmark<br />
Hungary<br />
Argentina<br />
Austria<br />
Malta<br />
Palestine<br />
Lesotho<br />
Lithuania<br />
Honduras<br />
New Zeal<strong>and</strong><br />
Belarus<br />
Cabo Verde<br />
Norway<br />
Luxembourg<br />
Myanmar<br />
Czech Rep.<br />
Saudi Arabia<br />
Slovakia<br />
Pol<strong>and</strong><br />
Source: UIS database.<br />
230<br />
CHAPTER 12 | TARGET 4.3 – TECHNICAL, VOCATIONAL, TERTIARY AND ADULT EDUCATION
12<br />
FIGURE 12.6:<br />
There are vast differences in tertiary attainment between the poor <strong>and</strong> the rich<br />
Percentage of 25- to 29-year-olds who have completed at least four years of tertiary education, by wealth, selected countries, 2008–2014<br />
100<br />
90<br />
80<br />
Richest<br />
Total<br />
Poorest<br />
Tertiary education attainment rate (%)<br />
70<br />
60<br />
50<br />
40<br />
30<br />
20<br />
10<br />
0<br />
Niger<br />
Ug<strong>and</strong>a<br />
C. A. R.<br />
Malawi<br />
Gambia<br />
Congo<br />
Burkina Faso<br />
Burundi<br />
Madagascar<br />
Zambia<br />
Mozambique<br />
Sierra Leone<br />
Liberia<br />
Rw<strong>and</strong>a<br />
Benin<br />
Chad<br />
Côte d’Ivoire<br />
Togo<br />
Senegal<br />
Mali<br />
Zimbabwe<br />
Cameroon<br />
Lesotho<br />
Comoros<br />
Timor-Leste<br />
Suriname<br />
Guyana<br />
Mauritania<br />
Cambodia<br />
Guatemala<br />
Swazil<strong>and</strong><br />
Ethiopia<br />
D. R. Congo<br />
Guinea<br />
Bangladesh<br />
Haiti<br />
Namibia<br />
Honduras<br />
Nigeria<br />
Ghana<br />
Nicaragua<br />
Indonesia<br />
Dominican Rep.<br />
Iraq<br />
Colombia<br />
Peru<br />
Tajikistan<br />
Bosnia/Herzeg.<br />
Bolivia<br />
Pakistan<br />
India<br />
Ecuador<br />
Philippines<br />
China<br />
Egypt<br />
Serbia<br />
Palestine<br />
Mexico<br />
Argentina<br />
Malta<br />
Germany<br />
Hungary<br />
Jordan<br />
Montenegro<br />
Bulgaria<br />
TFYR Macedonian<br />
Rep. Moldova<br />
Mongolia<br />
Armenia<br />
Kazakhstan<br />
Spain<br />
Netherl<strong>and</strong>s<br />
France<br />
Belgium<br />
United Kingdom<br />
Ukraine<br />
Source: GEM Report team analysis of household survey data.<br />
2.3<br />
2.3<br />
2.3<br />
2.6<br />
2.9<br />
3.8<br />
4.5<br />
6.1<br />
12.2<br />
Wide disparity is also present in some countries<br />
in Eastern Europe, such as Bulgaria, the Republic<br />
of Moldova <strong>and</strong> the former Yugoslav Republic of<br />
Macedonia (Figure 12.6).<br />
2.2<br />
Gender parity<br />
2.1<br />
2.2<br />
6.0<br />
However, surveys have certain disadvantages for<br />
analysing tertiary education patterns, especially at<br />
the level of participation indicators. St<strong>and</strong>ard surveys<br />
do not collect sufficiently detailed information on,<br />
for example, course duration or the actual award of<br />
a degree. In addition, questions capture the current<br />
conditions in which individuals live <strong>and</strong> not the<br />
conditions in which they grew up.<br />
Dominican Rep.<br />
Mongolia<br />
Greece<br />
Cuba<br />
Costa Rica<br />
Albania<br />
Icel<strong>and</strong><br />
Estonia<br />
Panama<br />
Sweden<br />
Belize<br />
Slovenia<br />
Cyprus<br />
Latvia<br />
Tunisia<br />
Brunei Daruss.<br />
Barbados<br />
Aruba<br />
Kuwait<br />
Antigua/Barbuda<br />
Seychelles<br />
Qatar<br />
While much can be gained from comparable indicators<br />
of tertiary education, robust management information<br />
systems inevitably are better at capturing the nuances<br />
of national contexts <strong>and</strong> are more useful for policymakers,<br />
as was found in Colombia (Box 12.1). But both<br />
national <strong>and</strong> international reporting need to adjust to<br />
enable monitoring of the growing diversity in student<br />
attendance, programme delivery <strong>and</strong> private provision<br />
patterns, which have implications on inequality<br />
in access.<br />
2016 • GLOBAL EDUCATION MONITORING REPORT 231
12<br />
Part-time vs full-time enrolment. Data from the UNESCO/<br />
OECD/Eurostat (UOE) database on education show that<br />
about one in five tertiary education students study<br />
part time. In countries including Argentina, Finl<strong>and</strong>,<br />
New Zeal<strong>and</strong>, Pol<strong>and</strong> <strong>and</strong> the United States, at least<br />
one in three study part time. In many countries, parttime<br />
tertiary education courses are less regulated by<br />
the state <strong>and</strong> more likely to be provided by the private<br />
independent sector. In Japan, almost all part-time<br />
students are in the private independent sector; in<br />
Latvia <strong>and</strong> the Netherl<strong>and</strong>s, almost half are. In Albania,<br />
Denmark <strong>and</strong> Irel<strong>and</strong>, part-time students are likely to<br />
pay higher tuition fees than students in full-time studies<br />
(European Commission/EACEA/Eurydice, 2015b).<br />
Distance vs on-campus learning. Distance learning, being<br />
less tied to the time, place <strong>and</strong> pace of a campus, could<br />
make access to tertiary education more equitable <strong>and</strong><br />
affordable. However, so far, it seems its biggest effect<br />
in high income countries is enabling students to gain<br />
credits for learning modules before or parallel to their<br />
on-campus studies (Lokken <strong>and</strong> Mullins, 2014). This is a<br />
more modest result than the expectations surrounding<br />
massive online open courses (Barber et al., 2013).<br />
BOX 12.1<br />
In Colombia, a strong management information system provides policy-specific data on tertiary education<br />
Colombia has a comprehensive system of publicly available tertiary education data based on detailed regulations. The Ministry of Education works closely with campuses to<br />
communicate updates to definitions <strong>and</strong> to resolve technological issues. In turn, campuses invest in staff professional development to ensure timely submission <strong>and</strong> meet<br />
the latest data quality st<strong>and</strong>ards.<br />
There are five distinct data sets. The Higher Education Information System (SNIES) includes base indicators on academic programmes, students, professors, campus<br />
administration, research, continuing education, internationalization <strong>and</strong> infrastructure. SPADIES tracks enrolment patterns in order to monitor <strong>and</strong> prevent university<br />
dropout, with a special focus on disadvantaged students. The Colombian Institute for the Promotion of Higher Education (ICFES) records data on Saber Pro, a national<br />
examination designed to assess student learning at the end of the first university degree. The Labor Observatory for Education (OLE) tracks students into the labour market,<br />
providing information on graduate work status, salaries, <strong>and</strong> shifts in workforce dem<strong>and</strong>s linked to student history. The International Network of Information <strong>and</strong> Knowledge<br />
Sources for Science, Technology <strong>and</strong> Innovation Management (SCIENTI) monitors detailed information about academic research <strong>and</strong> development, doctoral research<br />
programmes <strong>and</strong> research institutes.<br />
Tertiary education enrolment increased rapidly between 2000 <strong>and</strong> 2015. However, the expansion affected the student intake. The percentage of newly admitted students who<br />
had scored at the lowest level in the secondary school exit examination increased from 25% in 2000 to 37% in 2010 (Figure 12.7a). The low scoring students are more likely to<br />
drop out before finishing a degree. After eight semesters, 55% had dropped out, compared with 35% of the high scoring students (Figure 12.7b).<br />
FIGURE 12.7:<br />
In Colombia, students with lower admission scores are less likely to graduate<br />
100<br />
a. Distribution of tertiary education students, by admission score,<br />
2000–2015<br />
70<br />
b. Tertiary education cumulative early leaving rate, by admission score<br />
<strong>and</strong> by semester, students who entered at the 2010 autumn semester<br />
Share of student admission (%)<br />
80<br />
60<br />
40<br />
20<br />
High<br />
Middle<br />
Low<br />
Early leaving rate (%)<br />
60<br />
50<br />
40<br />
30<br />
20<br />
10<br />
Low<br />
Middle<br />
High<br />
0<br />
2000<br />
2001<br />
2002<br />
2003<br />
2004<br />
2005<br />
2006<br />
2007<br />
2008<br />
2009<br />
2010<br />
2011<br />
2012<br />
2013<br />
2014<br />
2015<br />
0<br />
1<br />
2 3 4 5 6 7 8 9 10 11 12<br />
Semester<br />
Source: Colombia Ministry of Education (2016a, 2016b).<br />
232<br />
CHAPTER 12 | TARGET 4.3 – TECHNICAL, VOCATIONAL, TERTIARY AND ADULT EDUCATION
12<br />
But data in this area are still patchy. An international<br />
monitoring effort on the provision <strong>and</strong> use of online<br />
<strong>and</strong> particularly open educational resources, the Global<br />
Online Higher Education Report, collected data in the<br />
second half of 2015 (ICDE, 2015).<br />
Public vs private higher education provision. According to<br />
UOE data, 17.5% of students were studying in private,<br />
independently funded institutions in 2012. Most<br />
countries have a very small share of students in<br />
this sector. Prominent exceptions are Brazil, Chile,<br />
Colombia, Indonesia, Japan, Mexico <strong>and</strong> the Republic<br />
of Korea, where the share is 80%. In Brazil, where<br />
70% of students are in private universities, the Prouni<br />
University for All programme was implemented in the<br />
private sector to widen access to tertiary education<br />
(Somers et al., 2013).<br />
AFFORDABILITY<br />
The affordability of tertiary education depends on<br />
the relationship between costs <strong>and</strong> income – current,<br />
forgone or future. Students pay direct education costs<br />
but also general living costs, such as transport, food<br />
<strong>and</strong> accommodation. Total costs can be compared with<br />
average household income levels based on household<br />
surveys. For example, the total cost of tertiary education<br />
in Mexico is 1.75 times the level of the average national<br />
household income, while it is only half that level in<br />
Canada <strong>and</strong> New Zeal<strong>and</strong> (Higher Education Strategic<br />
Associates, 2014). While this is a useful guide, it does<br />
not show how many young <strong>people</strong> cannot afford<br />
higher education.<br />
Collating information on direct costs of tertiary<br />
education is not straightforward. Tuition, registration<br />
<strong>and</strong> examination fees often differ by subject area <strong>and</strong><br />
by institution, especially between public <strong>and</strong> private.<br />
Detailed national data on costs are more likely to exist<br />
when there is a government policy to provide financial<br />
assistance to make tertiary education participation<br />
more affordable. For example, governments <strong>and</strong><br />
tertiary education institutions may provide grants,<br />
repayable loans <strong>and</strong> discounted accommodation (halls<br />
of residence), food (canteens) or transport (travel cards).<br />
Comparing financial burden on households with financial<br />
assistance to households can help highlight differences<br />
between countries (Orr, 2016). Across 26 countries in<br />
Europe, households contributed an average of 15% of<br />
FIGURE 12.8:<br />
There are diverse ways of making tertiary education affordable<br />
Household expenditure as a share of total expenditure for higher education institutions <strong>and</strong> support to students enrolled in tertiary<br />
education as a percentage of public expenditure on tertiary education, selected countries, 2011<br />
70<br />
Household expenditure as a share of total expenditure for<br />
tertiary education institutions (%)<br />
60<br />
50<br />
40<br />
30<br />
20<br />
10<br />
Croatia<br />
France<br />
Average<br />
Bulgaria<br />
Latvia<br />
Pol<strong>and</strong><br />
Italy<br />
Slovenia Netherl<strong>and</strong>s<br />
United Kingdom<br />
Cyprus<br />
Average<br />
0<br />
0<br />
Czech Rep.<br />
Belgium<br />
Denmark<br />
Sweden<br />
Norway<br />
10 20 30 40 50 60<br />
Support to students as percentage of public tertiary education expenditure (%)<br />
Source: European Commission/EACEA/Eurydice (2015a).<br />
2016 • GLOBAL EDUCATION MONITORING REPORT 233
12<br />
BOX 12.2<br />
“<br />
In Chile, about 165,000 students began attending university for free<br />
when the new academic year began in March 2016. They represented<br />
about half the students from the poorest 50% of Chilean households<br />
”<br />
total expenditure for tertiary education institutions<br />
in 2011, <strong>and</strong> student aid made up 18% of public tertiary<br />
education expenditure (Figure 12.8).<br />
There was substantial variation between countries.<br />
Cyprus, Norway <strong>and</strong> the United Kingdom provided well<br />
over 40% of public tertiary education expenditure in<br />
the form of student aid. In Norway, there are almost<br />
no fees <strong>and</strong> aid was used to compensate for differences<br />
in students’ ability to afford living costs during their<br />
studies. In Cyprus <strong>and</strong> the United Kingdom, aid was<br />
used to offset the impact of high tertiary education fees<br />
(European Commission/EACEA/Eurydice, 2015b).<br />
Using a national education accounts approach<br />
(Chapter 20) shows the share of households in total<br />
In Chile, persistent student dem<strong>and</strong>s for affordable higher<br />
education triggered reform<br />
High fees made Chile one of the most expensive countries in the world to be a university<br />
student. Student protests against the cost of tertiary education began in 2011 <strong>and</strong> became a<br />
central political issue, which eventually led to a major reform <strong>and</strong> a new law in December 2015.<br />
As a result, about 165,000 students began attending university for free when the new<br />
academic year began in March 2016. They represented about half the students from the<br />
poorest 50% of Chilean households. The new policy will cost the government between<br />
US$300 million <strong>and</strong> US$400 million a year, on top of the US$858 million it spends annually<br />
on scholarships <strong>and</strong> student loans.<br />
As currently designed, the programme limits free tuition to eligible students enrolled<br />
in 25 public <strong>and</strong> traditional private universities that make up the Council of Rectors of<br />
Chilean Universities <strong>and</strong> in 5 more recently established private universities that meet<br />
certain criteria on accreditation <strong>and</strong> not-for-profit status. By 2018, all institutions that<br />
meet the government criteria are to be covered.<br />
tertiary education expenditure to have been even<br />
higher in 2012 in non-European high income countries:<br />
for example, 40% in Australia, 42% in the Republic of<br />
Korea, 46% in the United States, 52% in Japan <strong>and</strong> 55% in<br />
Chile, where recent reforms came in response to strong<br />
political protests (Box 12.2) (OECD, 2015b).<br />
Large household contributions are not necessarily related<br />
to lack of equity <strong>and</strong> affordability. For example, Australia<br />
has more than twice the entry rate into bachelor’s<br />
programmes as Austria (76% vs. 34%), even though<br />
households contribute several times more to total tertiary<br />
education expenditure (40% vs. 2%) (OECD, 2015b). Australia<br />
has combined loans with income-contingent repayments<br />
<strong>and</strong> means-tested grants, encouraging disadvantaged<br />
students to enter tertiary education <strong>and</strong> reducing the risk<br />
of indebtedness (OECD, 2016b). The precise mix of policy<br />
tools <strong>and</strong> their success in targeting those most in need<br />
are clearly critical, <strong>and</strong> should be monitored to underst<strong>and</strong><br />
how to facilitate affordability (see Chapters 20 <strong>and</strong> 21).<br />
QUALITY<br />
Different measures of quality in tertiary education serve<br />
multiple stakeholders. Outcomes represent one measure.<br />
This section looks at two approaches to measuring them:<br />
through university rankings <strong>and</strong> student outcomes.<br />
SYSTEMS<br />
LEARNERS<br />
SCHOOL AND CLASSROOM SETTINGS<br />
Critics note that professional institutes <strong>and</strong> centres for technical formation, which enrol<br />
a high proportion of low income students, are not eligible for the free tuition programme<br />
<strong>and</strong> that offering a flat rate tuition subsidy leaves universities to cover the gap in more<br />
expensive disciplines.<br />
Sources: Hurtado (2012, 2015, 2016); Guzmán-Valenzuela (2016).<br />
OUTCOMES<br />
University rankings<br />
Student outcomes<br />
CONTEXT<br />
Economic, political <strong>and</strong> social conditions<br />
234<br />
CHAPTER 12 | TARGET 4.3 – TECHNICAL, VOCATIONAL, TERTIARY AND ADULT EDUCATION
12<br />
University rankings<br />
Ever since first appearing in the 1980s, university<br />
rankings have continued to grow in number <strong>and</strong><br />
popularity as basic reference points of performance by<br />
tertiary education institutions. The first global ranking<br />
system, the Academic Ranking of World Universities,<br />
based in Shanghai, was created so that Chinese<br />
university leaders could better underst<strong>and</strong> how their<br />
institutions compared to those in the rest of the world<br />
<strong>and</strong> how to improve them.<br />
In 2015, 11 global ranking systems produced updated lists. Of<br />
these, 5 are commercially based, generally published through<br />
existing news outlets; 3 are funded by governments; 2 are<br />
located at universities; <strong>and</strong> 1 is run by an independent<br />
non-profit organization. The systems use 118 indicators in all,<br />
half of which are related to faculty publications or research<br />
citation indices. In 7 systems, research measures make up<br />
at least 50% of all information. By contrast, teaching <strong>and</strong><br />
learning account for less than 10% of all indicators <strong>and</strong> are<br />
found in only 4 ranking systems (Figure 12.9).<br />
One of the systems, U-Multirank, does not actually<br />
stack universities up against each other but has designed<br />
a tool that allows users to create their own tables based<br />
on 29 indicators in 6 categories – teaching, research,<br />
innovation, internationalization, finance <strong>and</strong> employment.<br />
Rankings attract attention because they are simple<br />
to underst<strong>and</strong>. However, they have major flaws.<br />
They exclude the vast majority of universities around<br />
the world <strong>and</strong> collect information only on those<br />
whose faculties have produced at least a few hundred<br />
publications in the prior year. Only the Spanish groups<br />
Scimago <strong>and</strong> Webometrics evaluate more than 1,500<br />
universities. Both use information on web presence to<br />
establish the pool of universities to rank. Webometrics<br />
focuses its analysis on principles of open access,<br />
providing information on over 22,000 institutions.<br />
Despite some methodological improvements,<br />
university rankings are primarily marketing tools that<br />
rely heavily on institutional reputation <strong>and</strong> faculty<br />
publications. As currently designed, rankings are not<br />
based on indicators of teaching quality or student<br />
learning that are reliable, valid, st<strong>and</strong>ardized <strong>and</strong><br />
internationally comparable.<br />
Student outcomes<br />
While a typical student outcome measure would be the<br />
graduation rate, an increasingly broad range of student<br />
cognitive, affective, behavioural <strong>and</strong> psychological skills<br />
are being evaluated to assess the quality of tertiary<br />
education. Assessments of skills include engagement <strong>and</strong><br />
satisfaction surveys, professional licensing exams <strong>and</strong><br />
direct assessments of learning (Nusche, 2008).<br />
Direct assessments of student learning in higher<br />
education measure a combination of cognitive skills,<br />
such as verbal <strong>and</strong> quantitative reasoning, analytic<br />
FIGURE 12.9:<br />
Research output weighs heavily in global tertiary education ranking systems<br />
Distribution of indicator types used by selected global campus ranking systems, 2015<br />
All rankings<br />
Research International Teaching Innovation Finance Reputation Web Work Prizes<br />
Leiden<br />
PRSPWU<br />
URAP<br />
SCImago<br />
ARWU<br />
U.S. News<br />
CWUR<br />
U-Multirank<br />
QS WUR<br />
THE<br />
Webometrics<br />
0 20 40 60 80 100<br />
Indicators (%)<br />
Source: GEM Report team analysis using the online methodology notes of the following university ranking systems: Leiden Ranking; Performance Ranking of Scientific Papers<br />
for World Universities; University Ranking by Academic Performance; SCImago Institutions Ranking; Academic Ranking of World Universities; Global Universities Ranking U.S.<br />
News; Center for World University Rankings; U-Multirank; QS World University Rankings; THE World University Rankings; <strong>and</strong> Ranking Web of World Universities.<br />
2016 • GLOBAL EDUCATION MONITORING REPORT 235
12<br />
operations, critical thinking <strong>and</strong> problem solving.<br />
Assessments are designed to measure either generic<br />
skills or those that reflect a body of knowledge within<br />
a given field.<br />
Few countries deliver national assessments of student<br />
cognitive skills. Brazil initiated the Exame Nacional<br />
de Desempenho dos Estudantes (ENADE) through<br />
legislation in 1996 <strong>and</strong> has administered it nationally<br />
since 2004. About 80% of students in public <strong>and</strong> private<br />
institutions take the exam as they enter <strong>and</strong> exit<br />
bachelor studies. Results across 19 fields of study show<br />
that students display more improvement in subjectspecific<br />
areas than in the general knowledge component<br />
of the test (Melguizo <strong>and</strong> Wainer, 2015).<br />
These findings suggest that the curriculum significantly<br />
influences learning, since the general skills portion<br />
of the test is not aligned with the curricula of the<br />
study programmes. Another reason for the difference<br />
is the knowledge level associated with generic skills<br />
assessment. For example, students in medicine show<br />
almost no general skills gains over four years but<br />
substantial content area gains, most likely because they<br />
enter university with high general academic abilities.<br />
Cross-national comparisons of higher education learning<br />
outcomes have also been attempted. OECD completed<br />
a feasibility study on Assessment of Higher Education<br />
Learning Outcomes (AHELO) in 2013 with participation<br />
from 17 countries <strong>and</strong> jurisdictions. China, Finl<strong>and</strong> <strong>and</strong><br />
Norway supported a full assessment, but the project met<br />
with resistance from governments or higher education<br />
leaders in Canada, the United Kingdom <strong>and</strong> the United<br />
States (Morgan, 2015).<br />
A project called Measuring <strong>and</strong> Comparing Achievements<br />
of Learning Outcomes in Higher Education in Europe<br />
(CALOHEE) was launched in 2015. Results from the first<br />
round of assessments are expected in 2017. The intent<br />
is to assess whether students across the European<br />
Higher Education Area are achieving competencies that<br />
match internationally defined st<strong>and</strong>ards. CALOHEE is<br />
a bottom-up, university-driven process, while ENADE<br />
<strong>and</strong> AHELO were driven by governments oriented<br />
towards accountability.<br />
Some critics have questioned whether tertiary education<br />
learning assessments in general are measuring what they<br />
claim to measure (Primi et al., 2010; 2011). Universities<br />
also question their purpose. Assessments of student<br />
outcomes have largely been developed to promote<br />
accountability <strong>and</strong> are designed by external bodies –<br />
government agencies, private testing companies <strong>and</strong><br />
non-profit groups (Nusche, 2008). Critics note the<br />
absence of faculty in design <strong>and</strong> implementation, a<br />
crucial weakness considering that tertiary faculty have<br />
a relatively high degree of autonomy as stewards of<br />
academic content (Possin, 2013).<br />
The methodological limitations <strong>and</strong> costs of student<br />
outcome assessments are cause for reflection.<br />
Differences in national policy structures <strong>and</strong> resources,<br />
<strong>and</strong> in university missions in the education system, pose<br />
considerable barriers to a meaningful global measure of<br />
quality in tertiary education.<br />
ADULT EDUCATION<br />
While SDG 4 calls for ensuring lifelong learning<br />
opportunities for all, none of the education targets<br />
explicitly mentions adult education. However, the<br />
proposed global indicator for target 4.3 incorporates<br />
the concept of adult education, <strong>and</strong> adult learning,<br />
education <strong>and</strong> training<br />
opportunities form a<br />
While SDG 4 calls<br />
strategy for achieving<br />
target 4.3, according<br />
for ensuring lifelong<br />
to the Education 2030<br />
learning opportunities<br />
Framework for Action.<br />
for all, none of the<br />
The three modes of<br />
education targets<br />
adult education are<br />
explicitly mentions<br />
formal, non-formal<br />
adult education<br />
<strong>and</strong> informal. Formal<br />
education refers mostly<br />
to initial education that<br />
is ‘institutionalized, intentional <strong>and</strong> planned through<br />
public organizations <strong>and</strong> recognized private bodies’ <strong>and</strong><br />
‘recognized as such by the relevant national education or<br />
equivalent authorities’ (UIS, 2012b).<br />
Non-formal education is ‘any organized, systematic,<br />
educational activity, carried on outside the framework<br />
of the formal system, to provide selected types of learning’.<br />
It takes distinct forms, including lectures, seminars <strong>and</strong><br />
workshops with established learning objectives <strong>and</strong><br />
content, tutoring <strong>and</strong> private lessons, on-the-job training,<br />
<strong>and</strong> open <strong>and</strong> distance learning. While the dominant reason<br />
236<br />
CHAPTER 12 | TARGET 4.3 – TECHNICAL, VOCATIONAL, TERTIARY AND ADULT EDUCATION
12<br />
for participation is job related, it is difficult in practice to<br />
neatly determine precisely why <strong>people</strong> engage in<br />
non-formal adult learning (Rubenson, 1999).<br />
Informal education, in the widest sense, is arguably<br />
the most prevalent mode. It is defined as intentional<br />
or deliberate, but not institutionalized. Activities<br />
include learning ‘in the family, workplace, local<br />
community <strong>and</strong> daily life, on a self-directed, familydirected,<br />
or socially directed basis’ (UIS, 2012b).<br />
Because it is less organized <strong>and</strong> structured than the<br />
other two modes, it falls outside the scope of measuring<br />
participation in education.<br />
ACCESS<br />
The diversity of formal <strong>and</strong>, especially, non-formal<br />
provision makes the task of monitoring participation in<br />
adult education particularly difficult.<br />
The UIS collects information on learners aged 15 <strong>and</strong> over<br />
in formal education. For example, among 49 countries<br />
with data, adults made up 4% of those enrolled at the<br />
primary education level; the rate exceeded 5% in six<br />
countries, including Thail<strong>and</strong> (5.2%), Brazil (5.3%), <strong>and</strong><br />
India (6.5%), where more than 9 million adults were<br />
enrolled. Among 55 countries with data, adults accounted<br />
for 5% of those enrolled at the lower secondary <strong>and</strong> 10%<br />
of those enrolled at the upper secondary level.<br />
In Latin America <strong>and</strong> the Caribbean, one-quarter of<br />
adults have not completed primary school <strong>and</strong> half have<br />
not completed secondary school. A regional survey on<br />
adult learners (UIS, 2013) found that in Mexico, 3.5% of<br />
adults with less than primary education participated<br />
in primary school completion programmes, such as<br />
Education Model for Life <strong>and</strong> Work, which combines<br />
primary learning with employment skills <strong>and</strong> active<br />
citizenship training. In the Plurinational State of<br />
Bolivia, where 13% of adults with less than secondary<br />
school participated in secondary school completion<br />
programmes, lessons are often combined with vocational<br />
training <strong>and</strong> adults can obtain a qualification certificate<br />
from a professional school (Figure 12.10).<br />
Currently, however, there is no measure of adult formal<br />
<strong>and</strong> non-formal education participation. Useful lessons<br />
can be drawn from the experience of Europe. Ever since<br />
the European Union set a target of reaching an adult<br />
education participation rate of 15% by 2020, major efforts<br />
have been made to develop relevant data-collection tools.<br />
FIGURE 12.10:<br />
In Bolivia, one in eight adults without secondary school<br />
qualifications participated in a second chance programme<br />
Adult participation rate in primary <strong>and</strong> secondary education<br />
programmes as percentage of the population without the<br />
respective qualifications, selected Latin American <strong>and</strong><br />
Caribbean countries, 2010<br />
%<br />
14<br />
12<br />
10<br />
8<br />
6<br />
4<br />
2<br />
0<br />
El Salvador<br />
Enrolment in secondary education programmes for<br />
adults, expressed as percentage of population 20+ with<br />
primary education or incomplete secondary<br />
Enrolment in primary education programmes for<br />
adults, expressed as percentage of population 15+<br />
with no schooling or incomplete primary education<br />
Cayman Is<br />
Trinidad/Tobago<br />
Source: UIS database.<br />
Venezuela, B. R.<br />
Chile<br />
Uruguay<br />
Two household surveys collect information on adult<br />
education participation in Europe. The European Union<br />
Labour Force Survey (LFS) has been carried out quarterly<br />
since 1983 in 33 countries <strong>and</strong> is the official source of<br />
information on the adult education participation target.<br />
The Adult Education Survey (AES) was carried out in 2007<br />
<strong>and</strong> 2011 in 30 countries, with a third round scheduled<br />
for 2016. There are important differences between the<br />
two, e.g. in terms of reference periods or education<br />
<strong>and</strong> training definitions (Eurostat, 2011) (Table 12.4). In<br />
addition, there are differences within the LFS across<br />
countries (Holford <strong>and</strong> Mleczko, 2011).<br />
The 2011 AES indicated that the average adult<br />
education participation rate in both formal <strong>and</strong><br />
non-formal activities during the 12 months prior to<br />
the survey was 40% in the 28 European Union countries.<br />
The average non-formal education participation rate<br />
was 37% <strong>and</strong> the formal rate 6% (with some crossover).<br />
The formal adult education participation rate varied<br />
widely across countries, from 1% in Romania to 15% in<br />
the United Kingdom.<br />
Brazil<br />
Panama<br />
Mexico<br />
Peru<br />
Dominican Rep.<br />
Colombia<br />
Ecuador<br />
Bolivia<br />
2016 • GLOBAL EDUCATION MONITORING REPORT 237
12<br />
FIGURE 12.11:<br />
Adult education participation rates in Europe are higher among the<br />
more educated<br />
Adult education participation rate by type of opportunity <strong>and</strong> education<br />
attainment, European Union countries, 2011<br />
Adult education participation rate (%)<br />
100<br />
90<br />
80<br />
70<br />
60<br />
50<br />
40<br />
30<br />
20<br />
10<br />
0<br />
Romania<br />
Non-formal, adults with tertiary education<br />
Non-formal, adults with secondary education<br />
Formal, adults with tertiary education<br />
Formal, adults with secondary education<br />
Greece<br />
Pol<strong>and</strong><br />
Irel<strong>and</strong><br />
Bulgaria<br />
Lithuania<br />
Latvia<br />
Italy<br />
United Kingdom<br />
Malta<br />
Slovenia<br />
Czech Rep.<br />
Belgium<br />
Spain<br />
EUROPEAN UNION<br />
Hungary<br />
Slovakia<br />
Cyprus<br />
Portugal<br />
Austria<br />
Estonia<br />
Germany<br />
France<br />
Finl<strong>and</strong><br />
Denmark<br />
Netherl<strong>and</strong>s<br />
Luxembourg<br />
Sweden<br />
Source: Eurostat (2016).<br />
TABLE 12.4:<br />
Key differences in adult education participation questions<br />
in the European Union Labour Force Survey <strong>and</strong> the Adult<br />
Education Survey<br />
Issue European Union Labour Force Survey Adult Education Survey<br />
Reference period 4 weeks 12 months<br />
Definition of<br />
education <strong>and</strong><br />
training<br />
Excludes some activities, such as guided<br />
on-the-job training<br />
All types of non-formal activities<br />
Sequence of<br />
questions <strong>and</strong><br />
prompts<br />
Rationale for<br />
education<br />
Source: ICF (2015).<br />
Captures only formal education courses<br />
lasting at least one semester<br />
Uses simple questionnaire <strong>and</strong><br />
emphasizes work-related training<br />
Narrow range of outcomes: related to<br />
current/prospective job – or not<br />
Captures all formal courses of short<br />
duration<br />
Uses terms capturing slightly wider<br />
variety of activities, such as ‘private<br />
lessons, courses, conferences, talks,<br />
workshops, seminars <strong>and</strong> activities<br />
designed to train you for a job’<br />
A slightly broader range of outcomes<br />
outside work such as meeting other<br />
<strong>people</strong> or other personal reasons, or<br />
updating knowledge in the field<br />
Participation rates in adult education differ considerably<br />
by the level of education already attained. In general,<br />
adults who have attained tertiary education have more<br />
access to formal adult education opportunities than<br />
adults who have attained only secondary education<br />
(Figure 12.11). Large gaps in formal education participation<br />
rates between the more <strong>and</strong> less educated are found<br />
in Pol<strong>and</strong>, Slovakia <strong>and</strong> Sweden. The smallest gaps are<br />
observed in Finl<strong>and</strong> <strong>and</strong> Slovenia, while in Portugal those<br />
with secondary education have a higher chance of formal<br />
education (Box 12.3).<br />
By contrast, the LFS indicated the average adult<br />
education participation rate during the four weeks prior<br />
to the survey was closer to 10%. In Germany <strong>and</strong> Italy,<br />
the rate remained more or less constant over 2005–2013,<br />
BOX 12.3<br />
The adult education system in Portugal supports the<br />
more disadvantaged<br />
Portugal was the only country in Europe where the participation rate<br />
in formal education was higher for adults with secondary education<br />
(15%) than for adults with tertiary education (13%). This is exceptional:<br />
those who are more educated usually have access to a higher number<br />
of formal adult education opportunities.<br />
Portugal has by far the European Union’s highest rate of adults with<br />
less than lower secondary education (39% in 2013, well above secondhighest<br />
Greece with 19%) <strong>and</strong> less than upper secondary education<br />
(60% in 2013, compared with number two Spain at 44%). The adult<br />
education system is oriented towards helping these adults catch<br />
up. More than 5% of all Portuguese adults aged 25 to 64 acquired<br />
an upper secondary education certificate in adulthood, the highest<br />
rate in southern Europe in 2013. Provision comes under the umbrella<br />
Programa de Formação em Competências Básicas, a basic skills<br />
training programme introduced in 2010.<br />
In addition, Portuguese adults with secondary education are more<br />
likely to enter non-formal education (55%) than their counterparts in<br />
France (48%), Italy (40%) <strong>and</strong> Spain (36%).<br />
Under the New Opportunities Initiative, the largest public programme<br />
in recent decades, qualification <strong>and</strong> vocational training centres were<br />
established as ‘one-stop shops’ to deliver three lifelong learning<br />
services in an integrated way through guidance, validation of nonformal<br />
<strong>and</strong> informal learning, <strong>and</strong> provision of training programmes.<br />
There are also strong incentives to participate in adult education, such<br />
as income tax deductions <strong>and</strong> employer-funded training leave.<br />
Sources: CEDEFOP (2011); European Commission/EACEA/Eurydice<br />
(2015a); Nico <strong>and</strong> Nico (2011); OECD (2005a); UNEVOC (2014).<br />
238<br />
CHAPTER 12 | TARGET 4.3 – TECHNICAL, VOCATIONAL, TERTIARY AND ADULT EDUCATION
12<br />
while in Latvia it declined until 2011. Adults in Slovenia<br />
were more likely to enrol in some kind of training than in<br />
the other countries (Figure 12.12).<br />
The LFS <strong>and</strong> AES diverged not only in their estimates of<br />
average adult education participation rates but also in<br />
their estimates of participation rate trends over time. For<br />
example, between 2007 <strong>and</strong> 2011, a negative trend was<br />
observed for 10 countries in the AES <strong>and</strong> for 8 countries in<br />
the LFS – but with only three countries in common (ICF,<br />
2015), underlining how differing definitions lead to very<br />
different conclusions.<br />
To summarize, the proposed global indicator of adult<br />
participation in education during the previous 12 months<br />
presents several challenges. Consensus will be needed on the<br />
equivalency of diverse types of education experience. The<br />
tools to collect this information will need to be st<strong>and</strong>ardized<br />
accordingly to improve cross-country comparability of<br />
results. The experience of attempts to st<strong>and</strong>ardize related<br />
questions in Europe offers a basis for discussion.<br />
FIGURE 12.12:<br />
Different surveys point to different levels of adult education participation<br />
Adult education participation rate, selected countries, 2005–2013<br />
Adult education participation rate (%)<br />
50<br />
40<br />
30<br />
20<br />
10<br />
Labour Force Survey<br />
Adult Education Survey, formal<br />
Adult Education Survey, non-formal<br />
AFFORDABILITY<br />
0<br />
2005<br />
2007<br />
2009<br />
2011<br />
2013<br />
2005<br />
2007<br />
2009<br />
2011<br />
2013<br />
2005<br />
2007<br />
2009<br />
2011<br />
2013<br />
2005<br />
2007<br />
2009<br />
2011<br />
2013<br />
Even more than in technical-vocational <strong>and</strong> tertiary<br />
education, assessment of affordability in adult education<br />
is constrained by the lack of information on participation<br />
<strong>and</strong> public expenditure.<br />
Germany<br />
Source: Eurostat (2016).<br />
Italy<br />
Latvia<br />
Slovenia<br />
The 2009 Belém Framework for Action on adult learning<br />
<strong>and</strong> education called on countries to work towards<br />
‘increased investment in adult learning <strong>and</strong> education’<br />
but set no financing targets. The Global Report on Adult<br />
Learning <strong>and</strong> Education (GRALE), published every three<br />
years, requests countries to report the share of adult<br />
education in government spending. One-quarter of the<br />
over 90 countries that provided information (but 41% of<br />
high income countries) reported spending more than 4% on<br />
adult education. This, combined with information on public<br />
expenditure on education as a share of the gross domestic<br />
product (GDP), indicates that fewer than one in six countries<br />
spent more than 0.3% of GDP on adult education, all of them<br />
high income countries except for Kyrgyzstan <strong>and</strong> the United<br />
Republic of Tanzania. Future editions of GRALE will need to<br />
collect more precise information, but it is clear that adult<br />
education remains a low priority in budgets.<br />
Government expenditure is critical because it is more<br />
likely to cater for disadvantaged groups. For example,<br />
adult professional education <strong>and</strong> training in France<br />
accounted for 1.52% of GDP in 2012. This was shared<br />
between the state (53%), firms (43%) <strong>and</strong> households (4%).<br />
But the share of the state was 76% for apprentices <strong>and</strong><br />
84% for the unemployed (DARES, 2015).<br />
Overall, more information on public expenditure is needed<br />
to underst<strong>and</strong> how it is targeted at the groups most in<br />
need. Government funding may take the form of direct<br />
provision of adult education courses or subsidies to<br />
accredited providers so that participants pay no fees. It<br />
can also take the form of support to individual adults to<br />
pay for education (through grants, vouchers <strong>and</strong> loans)<br />
or support to firms to encourage them to provide more<br />
education <strong>and</strong> training opportunities.<br />
A review of relevant policies in Europe found examples of<br />
co-funding arrangements that were successfully targeted<br />
at groups in need. For example, in Sweden, which has a<br />
system of grants <strong>and</strong> loans to encourage adults to return<br />
to education, the grant component of total support was<br />
higher for those with up to upper secondary education<br />
(73%) than for other learners (31%). In Latvia, unemployed<br />
adults participating in a training programme received<br />
2016 • GLOBAL EDUCATION MONITORING REPORT 239
12<br />
“<br />
Fewer than one in six countries spent more<br />
than 0.3% of GDP on adult education<br />
”<br />
a coupon to attend approved non-formal education<br />
courses <strong>and</strong> a monthly grant (European Commission/<br />
EACEA/Eurydice, 2015b).<br />
QUALITY<br />
It is particularly challenging to monitor the full range<br />
of quality dimensions for adult education. Proposed<br />
frameworks have included aspects ranging from the<br />
existence of certification, recognition, validation <strong>and</strong><br />
accreditation to the degree to which programmes target<br />
population groups in need (e.g. Borkowsky, 2013; ICF,<br />
2015).<br />
Three commitments were made in the Belém<br />
Framework for Action to foster quality in adult learning<br />
<strong>and</strong> education. They focus on (a) curricula, learning<br />
materials <strong>and</strong> teaching methodologies, (b) research <strong>and</strong><br />
knowledge management systems, <strong>and</strong> (c) training <strong>and</strong><br />
capacity-building for adult educators. Adult educator<br />
preparation <strong>and</strong> professional development are used here<br />
as an example of a system-related quality dimension.<br />
SYSTEMS<br />
Adult educators<br />
LEARNERS<br />
As part of GRALE III, three questions focused on adult<br />
educators. Among the two-thirds of countries that<br />
responded, 80% claimed they had pre-service education<br />
<strong>and</strong> training for adult teachers <strong>and</strong> facilitators. However,<br />
only 39% required pre-service qualifications to teach in all<br />
adult education programmes. And only 29% claimed they<br />
had sufficient capacity in their continuing, in-service<br />
education <strong>and</strong> training programmes for adult education<br />
teachers (UIL, 2016).<br />
These averages provide a useful overview but are short<br />
on detail <strong>and</strong> difficult to validate. A series of country<br />
case studies was commissioned for the 2016 GEM Report<br />
to provide further insights. Cambodia has established<br />
348 Community Learning Centres to deliver multiple<br />
programmes, including vocational skills acquisition<br />
<strong>and</strong> income-generation initiatives, particularly in rural<br />
areas. Community teachers receive 16 days of in-service<br />
training provided by the provincial Department of Early<br />
Childhood Education (Vanna, 2016).<br />
The Jamaican Foundation for Lifelong Learning<br />
maintains a network of 29 adult education centres with<br />
129 adult facilitators, 65% of whom are qualified; a few<br />
have received specialized training in areas needed to<br />
provide relevant instruction <strong>and</strong> address learning deficits<br />
(Cross, 2016).<br />
SCHOOL AND CLASSROOM SETTINGS<br />
OUTCOMES<br />
CONTEXT<br />
Economic, political <strong>and</strong> social conditions<br />
In Mexico, adult education counsellors receive initial<br />
<strong>and</strong> continuous training, including on issues such<br />
as digital culture, written culture, worker education,<br />
competencies in indigenous languages <strong>and</strong> updates<br />
to National Institute of Adult Education guidelines.<br />
Certified courses are available for further study at<br />
various levels, while educators with a good record in<br />
terms of enrolment or student learning are provided<br />
with incentives, including training allowances<br />
(Hernández Flores, 2016).<br />
240<br />
CHAPTER 12 | TARGET 4.3 – TECHNICAL, VOCATIONAL, TERTIARY AND ADULT EDUCATION
12<br />
Since the 1990s, Mozambique has established the<br />
National Institute of Adult Education, bachelor’s <strong>and</strong><br />
master’s degrees in adult education <strong>and</strong> three adult<br />
education associations. However, more than half the<br />
facilitators lack initial pedagogical training (Ussene, 2016).<br />
Except in high income countries, the knowledge base<br />
on adult education remains limited. The common EU<br />
target for adult education has provided impetus for<br />
investment in collecting system-related information on<br />
adult education. It was concluded from GRALE III that<br />
efforts to improve data ‘need to set careful priorities<br />
<strong>and</strong> ensure that their ambitions are in line with available<br />
resources in different countries <strong>and</strong> contexts’ (UIL, 2016),<br />
<strong>and</strong> that there is a need to promote peer review <strong>and</strong> peer<br />
learning. Groups of countries with comparable profiles<br />
should establish networks within existing organizations<br />
to generate <strong>and</strong> exchange information on the quality of<br />
adult education.<br />
ENDNOTES<br />
1. Armenia, Colombia, Egypt, Jordan, Kenya, Nepal, the Netherl<strong>and</strong>s, the<br />
Republic of Korea, Sri Lanka, Sweden, Ug<strong>and</strong>a <strong>and</strong> Viet Nam.<br />
2. See technical note on GEM Report website for further information.<br />
2016 • GLOBAL EDUCATION MONITORING REPORT 241
13<br />
A student works<br />
on a microscope<br />
in Indonesia.<br />
CREDIT: United States government work<br />
KEY MESSAGES<br />
The probability of having a decent job is almost double among those with high, rather than low, reading skills.<br />
However, other than literacy <strong>and</strong> numeracy, it is difficult to identify skills that both help with access to decent<br />
work in various contexts <strong>and</strong> can be measured.<br />
Information <strong>and</strong> communication technology (ICT) skills have become essential to daily life <strong>and</strong> work. In the<br />
European Union in 2014, 65% of adults could send an email with an attachment, 44% could use basic arithmetic<br />
formulas in a spreadsheet <strong>and</strong> 28% could download <strong>and</strong> configure software.<br />
Digital literacy skills are a better marker for this target than ICT skills. However, monitoring them globally<br />
requires keeping up with rapid technological change <strong>and</strong> keeping diverse contexts in mind.<br />
Many of the most valued skills in the workplace, such as creativity, critical thinking, problem-solving <strong>and</strong><br />
collaboration, are not easy to define <strong>and</strong> are hard to monitor.<br />
Non-cognitive skills, such as perseverance, self-control <strong>and</strong> social skills, improve employment outcomes. How<br />
much they are valued varies by employment context <strong>and</strong> position. It is not recommended to try monitoring<br />
these skills at the global level.<br />
Financial literacy <strong>and</strong> entrepreneurship skills are relevant for the world of work. According to one definition, 33%<br />
of adults worldwide are financially literate. Assessments of entrepreneurship skills are still at the research stage.<br />
242<br />
CHAPTER 13 | TARGET 4.4 – SKILLS FOR WORK
13<br />
CHAPTER 13<br />
Sustainable Development Goal 4.4<br />
TARGET 4.4<br />
Skills for work<br />
By 2030, substantially increase the number of youth <strong>and</strong> adults who have<br />
relevant skills, including technical <strong>and</strong> vocational skills, for employment,<br />
decent jobs <strong>and</strong> entrepreneurship<br />
GLOBAL INDICATOR 4.4.1 – Percentage of youth <strong>and</strong> adults with information <strong>and</strong> communications<br />
technology (ICT) skills by type of skill<br />
THEMATIC INDICATOR 16 – Percentage of youth <strong>and</strong> adults who have achieved at least a<br />
minimum level of proficiency in digital literacy skills<br />
THEMATIC INDICATOR 17 – Youth/adult educational attainment rates by age group, economic<br />
activity status, levels of education <strong>and</strong> programme orientation<br />
2016 • GLOBAL EDUCATION MONITORING REPORT 243
13<br />
Cognitive skills.......................................................................................................................... 244<br />
Non-cognitive skills.................................................................................................................247<br />
Combinations of cognitive <strong>and</strong> non-cognitive skills for work........................... 250<br />
Conclusion...................................................................................................................................253<br />
Target 4.4 focuses on one of education’s outcomes:<br />
skills for work. It is similar to target 4.6, on literacy<br />
<strong>and</strong> numeracy, in two respects: both refer to workrelated<br />
skills <strong>and</strong> neither refers to the means by which<br />
these skills are to be acquired.<br />
With its explicit reference to technical <strong>and</strong> vocational<br />
skills, target 4.4 appears closely linked to target 4.3,<br />
which refers to technical <strong>and</strong> vocational education.<br />
However, skills for work are acquired in almost all<br />
education programmes <strong>and</strong>, critically, can be acquired<br />
outside education systems – for example, within families,<br />
communities <strong>and</strong> workplaces. Indeed, unlike hereditary<br />
traits, work-related skills originate in deliberate <strong>and</strong><br />
intentional experiences: they are dynamic <strong>and</strong> can be<br />
developed throughout the course of a lifetime.<br />
A central concept for this target is decent work, which is<br />
enshrined within Articles 6 <strong>and</strong> 7 of the 1966 International<br />
Covenant on Economic, Social <strong>and</strong> Cultural Rights.<br />
According to the United Nations (UN) Committee on<br />
Economic, Social <strong>and</strong> Cultural Rights, decent work<br />
respects fundamental human rights as well as worker<br />
rights in terms<br />
of work safety,<br />
remuneration <strong>and</strong> the<br />
Other than literacy <strong>and</strong><br />
physical <strong>and</strong> mental<br />
numeracy, it is difficult integrity of the<br />
worker.<br />
to envisage any skills<br />
that are relevant <strong>and</strong><br />
It is less clear what<br />
easy to measure<br />
skills are needed<br />
for decent work.<br />
Moreover, skill<br />
requirements are specific to job opportunities, which<br />
differ enormously across countries. Other than the<br />
foundation skills of literacy <strong>and</strong> numeracy, in fact, it is<br />
difficult to envisage any skills for work that can satisfy<br />
all the criteria: measurable along a common scale at<br />
low cost; able to be acquired through education; <strong>and</strong><br />
relevant in various labour market contexts. Faced with<br />
this challenge, the Inter-agency <strong>and</strong> Expert Group on<br />
Sustainable Development Goal Indicators (IAEG-SDGs)<br />
proposed measuring ICT skills, opting for relative<br />
ease of measurement at the cost of narrowing the<br />
scope of the target.<br />
This chapter reviews the skills that matter most for<br />
work <strong>and</strong> asks whether they can be monitored. It<br />
focuses on general skills, which are applicable in a range<br />
of work contexts, <strong>and</strong> not on technical <strong>and</strong> vocational<br />
skills, which are specific <strong>and</strong> not suitable for global<br />
comparisons. It skips one of the proposed thematic<br />
indicators, the attainment rate – not only because it was<br />
covered under target 4.1 but also because it has relatively<br />
little relation to the possession of actual skills.<br />
The chapter discusses cognitive <strong>and</strong> non-cognitive<br />
skills, a somewhat arbitrary distinction as non-cognitive<br />
skills – known by several other labels, such as soft or<br />
socio-emotional skills – involve cognition. In practice,<br />
depending on the context, a combination of skills is<br />
usually relevant. The chapter closes with a discussion of<br />
financial literacy <strong>and</strong> entrepreneurship skills as examples<br />
of work skills that develop at the nexus of intellectual,<br />
social <strong>and</strong> emotional abilities.<br />
COGNITIVE SKILLS<br />
Basic cognitive skills include literacy <strong>and</strong> numeracy. They<br />
are essential for getting work that pays enough to meet<br />
daily needs, pursuing further education <strong>and</strong> training<br />
opportunities, leading a healthy life <strong>and</strong> engaging actively<br />
244<br />
CHAPTER 13 | TARGET 4.4 – SKILLS FOR WORK
13<br />
in the social <strong>and</strong> political life of the community (UIL, 2016).<br />
Depending on the structure of the labour market, other<br />
cognitive skills, such as the ability to operate a computer,<br />
can also lead to improved employment opportunities.<br />
LINKING BASIC COGNITIVE SKILLS WITH<br />
DECENT WORK<br />
A higher level of basic cognitive skills, as captured<br />
through an internationally comparable measure of<br />
literacy proficiency, is associated with a higher chance<br />
of access to decent work opportunities. New analysis for<br />
this report shows that the average probability of holding<br />
a decent job almost doubles between those whose<br />
reading skills only allow them to locate a single piece<br />
of information in a short text (19%) <strong>and</strong> those who can<br />
interpret information from complex texts (35%).<br />
The analysis used data on adults from urban areas of<br />
seven middle income countries, drawing on the World<br />
Bank Skills Towards Employability <strong>and</strong> Productivity<br />
(STEP) survey, which was conducted in 2011–2013. For the<br />
purpose of the analysis, a job was defined as decent if<br />
it satisfied three criteria: it offered an adequate number<br />
of working hours per week, provided employees with a<br />
written contract to protect their rights, <strong>and</strong> guaranteed<br />
social benefits. On average across the seven countries,<br />
one in four employees held a decent job according to<br />
these criteria. Nationally the figure ranged from one in<br />
eight in Ghana to one in two in Armenia as a result of<br />
variations in the sector composition of employment<br />
(between agriculture, manufacturing <strong>and</strong> services) <strong>and</strong><br />
labour policies.<br />
Measurement of literacy skills is covered in depth in<br />
Chapter 15 on target 4.6. Across the seven countries in<br />
the present sample, literacy proficiency varied greatly.<br />
In Ghana, 61% of adults read below even the lowest level<br />
of proficiency, compared with 1% in Armenia. Completing<br />
secondary school makes a big difference: in Colombia <strong>and</strong><br />
Viet Nam, adults who had not done so were more than<br />
twice as likely not to reach level 2 of literacy proficiency.<br />
ICT AND DIGITAL LITERACY SKILLS<br />
ICT has quickly become essential to daily life <strong>and</strong><br />
work in most countries. A survey of 32 mostly middle<br />
income countries found that, on average in 2014, 38%<br />
of households had a computer at home <strong>and</strong> 44% used<br />
the internet at least occasionally (or had a smartphone).<br />
The latter measure ranged from 8% in Pakistan <strong>and</strong> 11%<br />
in Bangladesh to 62% in Lebanon <strong>and</strong> 63% in China (Pew<br />
Research Center, 2015).<br />
Demographic shifts <strong>and</strong> increasing access to education<br />
mean ICT use will continue to rise in the next 15 years.<br />
Already, the internet is used by 66% of <strong>people</strong> aged 18<br />
to 34, compared with 27% of those over 35, <strong>and</strong> by 75%<br />
of those with at least secondary education, compared<br />
with 19% of those with less (Pew Research Centre, 2015).<br />
It is essential for education systems to help everybody<br />
acquire ICT <strong>and</strong> digital literacy skills, especially where<br />
a considerable proportion of the population is at risk<br />
of being excluded from society <strong>and</strong> work opportunities<br />
because of a ‘digital divide’.<br />
ICT skills<br />
Defining, measuring <strong>and</strong> monitoring ICT skills presents<br />
several challenges for making comparisons over time <strong>and</strong><br />
across countries. Technology – <strong>and</strong> the skills needed to<br />
use it – develops so rapidly that what is relevant today<br />
may be less so tomorrow. And wide disparities between<br />
countries in technology availability mean the context in<br />
which such skills are exercised differs considerably.<br />
The proposed global indicator for target 4.4 is the<br />
percentage of individuals with ICT skills according to the<br />
definition of the International Telecommunication Union<br />
(ITU), formulated in the framework of the Partnership<br />
on Measuring ICT for Development (ITU, 2014). ‘ICT<br />
skills’ refers to nine computer-related activities that<br />
individuals have undertaken in the previous three months<br />
(Table 13.1). The information is to be collected by national<br />
statistical offices as part of st<strong>and</strong>ard household surveys<br />
or censuses.<br />
The ITU maintains globally comparable indicators in<br />
the World Telecommunication/ICT Indicators database.<br />
TABLE 13.1:<br />
Computer-related activities included in the definition of ICT skills<br />
Copy or move a file or folder<br />
Use copy <strong>and</strong> paste tools to duplicate or move information within a document<br />
Send emails with attached files (e.g. a document, picture or video)<br />
Use basic arithmetic formulas in a spreadsheet<br />
Connect <strong>and</strong> install new devices (e.g. a modem, camera or printer)<br />
Find, download, install <strong>and</strong> configure software<br />
Create electronic presentations with presentation software (including text, images, sound <strong>and</strong> video)<br />
Transfer files between a computer <strong>and</strong> other devices<br />
Write a computer program using a specialized programming language<br />
Source: ITU (2014).<br />
2016 • GLOBAL EDUCATION MONITORING REPORT 245
13<br />
As the indicator of ICT skills (HH15) was defined only<br />
recently, data were available for just eight countries<br />
by 2016. But European countries have been collecting<br />
similar information since the early 2000s (Eurostat,<br />
2014), <strong>and</strong> it is possible to combine information from<br />
these two comparable sources. In the European Union,<br />
among adults in 2014, 65% could send an e-mail with<br />
FIGURE 13.1:<br />
The frequency of computer-related activities varies across countries<br />
<strong>and</strong> by task<br />
Percentage of adults who had carried out a computer-related activity in the past<br />
three months, selected countries, 2013–2014<br />
Eurostat<br />
Finl<strong>and</strong><br />
Austria<br />
Lithuania<br />
Greece<br />
In Finl<strong>and</strong>, 28% of adults had<br />
written a computer program<br />
an attachment, 44% used basic arithmetic formulas in<br />
a spreadsheet, <strong>and</strong> 28% could download <strong>and</strong> configure<br />
software. The percentage of adults outside the European<br />
Union (EU) who had carried out this task was 3% in the<br />
Islamic Republic of Iran <strong>and</strong> 15% in Brazil (Figure 13.1).<br />
While the ITU has not synthesized activities into an easily<br />
communicated index of ICT skills, the European Union<br />
has proposed ways of adding up the number of activities<br />
carried out <strong>and</strong> assigning individuals to skill levels (European<br />
Commission, 2014). However, there is no consensus on<br />
how to aggregate the information. Moreover, in coming<br />
years further ICT skills are likely to be considered<br />
highly relevant for work. For example, the Organisation<br />
for Economic Co-operation <strong>and</strong> Development (OECD)<br />
countries are collecting information related to security<br />
<strong>and</strong> privacy, such as the ability to protect personal data<br />
(OECD, 2015h).<br />
Digital literacy skills<br />
The ICT skills indicator has the advantage of being<br />
straightforward to interpret <strong>and</strong> collect. However,<br />
it reflects only the prevalence of certain computerrelated<br />
activities <strong>and</strong> not the skill level at which they are<br />
performed. Such skills cannot be self-reported but need<br />
to be assessed directly.<br />
Romania<br />
ITU<br />
Singapore<br />
Kazakhstan<br />
Brazil<br />
Iran, Isl. Rep.<br />
Egypt<br />
In Romania, 16% of adults had<br />
carried out basic arithmetic in<br />
a spreadsheet<br />
In Kazakhstan, 48% of<br />
adults had sent an email<br />
with an attachment<br />
In Egypt, 7% of adults had used copy<br />
<strong>and</strong> paste tools to move information<br />
within a document<br />
0 10 20 30 40 50 60 70 80<br />
Adults who had used a computer <strong>and</strong> carried out the specific activity (%)<br />
Write computer program<br />
Download/configure software<br />
Create electronic presentation<br />
Do basic arithmetic in spreadsheet<br />
Connect/install device<br />
Sources: ITU (2015) <strong>and</strong> Eurostat (2016).<br />
Transfer file, computer to device<br />
Use copy/paste tools in document<br />
Send email with attachment<br />
Copy/move file<br />
90<br />
A measure of these skills should capture how individuals<br />
use technology in a critical <strong>and</strong> creative way to<br />
manage <strong>and</strong> create information, solve problems <strong>and</strong><br />
communicate (JRC, 2013). Accordingly, ICT (or digital)<br />
literacy was first defined as the cognitive ability to<br />
use ‘digital technology, communications tools, <strong>and</strong>/or<br />
networks to access, manage, integrate, evaluate, <strong>and</strong><br />
create information in order to function in a knowledge<br />
society’ (International ICT Literacy Panel, 2002). The<br />
definition drew on an earlier concept of information<br />
literacy as changed by the advent of digital technology<br />
(Catts <strong>and</strong> Lau 2008; Erstad, 2010).<br />
The International Computer <strong>and</strong> Information Literacy<br />
Study (ICILS), which was administered to grade 8 students<br />
in 21 education systems in 2013, defined computer <strong>and</strong><br />
information literacy as ‘an individual’s ability to use<br />
computers to investigate, create, <strong>and</strong> communicate in<br />
order to participate effectively at home, at school, in the<br />
workplace, <strong>and</strong> in society’ (Fraillon et al., 2014).<br />
Students completed a computer-based test that<br />
consisted of two modules r<strong>and</strong>omly selected out of<br />
four. Each 30-minute module was based on a theme<br />
<strong>and</strong> consisted of a set of small discrete tasks followed<br />
246<br />
CHAPTER 13 | TARGET 4.4 – SKILLS FOR WORK
13<br />
by a large task. The four themes involved creating<br />
an advertising poster for an after-school exercise<br />
programme, a web page on a school b<strong>and</strong> competition,<br />
a presentation to explain breathing to students <strong>and</strong> an<br />
information sheet about a trip for their peers.<br />
Four proficiency levels were developed. Students at<br />
level 1 demonstrated a functional working knowledge<br />
of computers as tools <strong>and</strong> a basic underst<strong>and</strong>ing of<br />
the consequences of a computer having multiple users.<br />
They applied conventional comm<strong>and</strong>s to perform<br />
basic communication tasks <strong>and</strong> add simple content to<br />
information products. They demonstrated familiarity<br />
with the basic layout conventions of electronic<br />
documents. In the Czech Republic, 85% of students<br />
performed above this level, compared with 9% in Turkey<br />
<strong>and</strong> 13% in Thail<strong>and</strong> (Figure 13.2).<br />
The apparent large gap in digital literacy between richer<br />
<strong>and</strong> poorer countries may reflect the degree of access to<br />
computers at home <strong>and</strong> school. Even within countries,<br />
ICILS results showed large differences according to<br />
socio-economic status. For example, in Chile students<br />
with parents of low occupational status scored on<br />
average at level 1, while those with parents of high status<br />
scored on average at level 2 (Fraillon et al., 2014).<br />
However, the choice of themes in the assessment<br />
appears vulnerable to the criticism of cultural bias.<br />
To extend coverage to low <strong>and</strong> lower middle income<br />
countries, it is essential to develop context-appropriate<br />
material for surveys of this kind.<br />
FIGURE 13.2:<br />
There is a large divide in digital literacy skills between poorer <strong>and</strong><br />
richer countries<br />
Distribution of grade 8 students by level of information <strong>and</strong> computer literacy,<br />
selected countries, 2013<br />
Distribution of grade 8 students<br />
by information <strong>and</strong> computer<br />
literacy level (%)<br />
100<br />
80<br />
60<br />
40<br />
20<br />
0<br />
Czech Rep.<br />
Australia<br />
Norway<br />
Pol<strong>and</strong><br />
Rep. of Korea<br />
One possibility is choosing a design where some test<br />
modules are replaced with new ones that reflect newer<br />
aspects of ICT. The Australian national assessment<br />
programme of ICT literacy, which has been conducted<br />
every three years since 2005, has taken such an approach.<br />
This has provided comparable test results over nine years<br />
during which numerous changes have occurred in relation<br />
to ICT <strong>and</strong> the use of digital devices (ACARA, 2015).<br />
Germany<br />
Slovakia<br />
Russian Fed.<br />
Note: In Norway, grade 9 students were assessed.<br />
Source: Fraillon et al. (2014).<br />
Croatia<br />
Slovenia<br />
Lithuania<br />
Chile<br />
Thail<strong>and</strong><br />
Turkey<br />
Level 3+<br />
Level 2<br />
Level 1<br />
Below Level 1<br />
ICILS is not the only attempt to assess <strong>and</strong> compare<br />
digital literacy skills across countries. The OECD has<br />
included a module on digital reading in the Programme<br />
for International Student Assessment (PISA) <strong>and</strong> one on<br />
problem-solving in technology-rich environments in the<br />
Programme for the International Assessment of Adult<br />
Competencies (PIAAC) (OECD, 2011b; 2014d). In addition,<br />
the University of Melbourne has launched the researchoriented<br />
Assessment <strong>and</strong> Teaching of 21st Century<br />
Skills project with the support of three ICT corporations<br />
(Griffin <strong>and</strong> Care, 2015).<br />
NON-COGNITIVE SKILLS<br />
Well-developed cognitive skills are necessary, but not<br />
sufficient for desirable employment-related outcomes.<br />
Their effect may be best realized in specific contexts or<br />
in combination with other individual characteristics. In<br />
particular, there has been growing interest in the role of<br />
non-cognitive skills, distinguished from cognitive skills<br />
in that they are less related to raw cognitive processing<br />
(Kautz et al, 2014; OECD, 2015f).<br />
Looking ahead, a global tool to assess progress in digital<br />
literacy will need to address rapid technological changes<br />
over time <strong>and</strong> incorporate changes in patterns of ICT use.<br />
For example, the introduction of tablets <strong>and</strong> smartphones<br />
has resulted in new ICT applications <strong>and</strong> ways of working<br />
digitally. Assessment of ICT <strong>and</strong> digital literacy skills needs<br />
to be designed to incorporate such developments without<br />
losing comparability over time (Ainley et al., 2016).<br />
This review, which is not meant to be comprehensive,<br />
examines three non-cognitive skills that have been<br />
shown to have a positive effect on employment<br />
outcomes, can improve through education <strong>and</strong> training,<br />
<strong>and</strong> can be meaningfully measured <strong>and</strong> compared<br />
between countries (Zhou, 2016).<br />
2016 • GLOBAL EDUCATION MONITORING REPORT 247
13<br />
BOX 13.1<br />
Despite decades of research, instruments to assess noncognitive<br />
skills are still at an early stage of development.<br />
Measurements mostly rely on self-reporting, which is<br />
sensitive to response bias. Importantly for cross-cultural<br />
measurement, different non-cognitive skills might<br />
be desirable in different cultures. For example, some<br />
The fundamental but elusive skills of creativity, critical thinking<br />
<strong>and</strong> collaboration<br />
The Education 2030 Framework for Action states that all individuals should acquire a solid<br />
foundation of knowledge, develop creative <strong>and</strong> critical thinking <strong>and</strong> collaborative skills, <strong>and</strong><br />
build curiosity, courage <strong>and</strong> resilience. Yet, such skills are not easy to define, assess or teach.<br />
Creativity involves producing novel <strong>and</strong> useful content through divergent thinking,<br />
i.e. exploring various possible solutions. The Torrance Tests of Creative Thinking are<br />
considered a valid <strong>and</strong> reliable predictor of creative achievement. However, they focus<br />
on identifying specific cognitive processes. In practice, creativity is much broader. It<br />
involves motivation, perseverance, focus, flexibility, independence <strong>and</strong> the ability to<br />
overcome problems. Moreover, st<strong>and</strong>ardized tests tend to be incompatible with the type<br />
of divergent thinking that is the focus of creativity assessment.<br />
Critical thinking is a concept with several layers <strong>and</strong> means different things to different<br />
<strong>people</strong>. The most widely recognized definition includes six cognitive dimensions: the<br />
abilities to interpret, analyse, evaluate, infer, explain <strong>and</strong> self-regulate. These abilities<br />
are amenable to assessment, but experts involved in the definition could not reach<br />
consensus on whether non-cognitive elements such as honesty in evaluating one’s own<br />
biases or underst<strong>and</strong>ing of others’ opinions are a necessary part of the definition. More<br />
generally, a technical view of critical thinking is challenged by those who believe there is<br />
no such thing as objective truth because knowledge is socially constructed.<br />
Collaboration skills include coordination, communication, conflict resolution, decisionmaking<br />
<strong>and</strong> negotiation. The 2015 PISA included collaborative problem-solving, which<br />
the framework defines as the ‘capacity of an individual to effectively engage in a process<br />
whereby two or more agents attempt to solve a problem by sharing the underst<strong>and</strong>ing <strong>and</strong><br />
effort required to come to a solution <strong>and</strong> pooling their knowledge, skills <strong>and</strong> efforts to reach<br />
that solution’. A student with a low level of these skills ‘pursues r<strong>and</strong>om or irrelevant actions,<br />
operates individually, <strong>and</strong> makes little contribution to resolve potential obstacles’.<br />
Underst<strong>and</strong>ing of these skills is still in exploratory stages. Designing an assessment of<br />
collaboration skills involves innovative thinking in identifying tasks through which shared<br />
underst<strong>and</strong>ing is developed, a team is organized <strong>and</strong> common actions are taken. It also<br />
requires finding approaches to assessing the collaboration skills of an individual when<br />
the responsibility for the failure of teamwork is hard to observe <strong>and</strong> the available time<br />
is limited. One solution has been the use of computer-simulated participants, but this<br />
raises the question whether the interactions are valid.<br />
Sources: Facione (1990); Kaufman <strong>and</strong> Sternberg (2010); Lai (2011); OECD (2013e); Plucker<br />
<strong>and</strong> Makem (2010); Sternberg (2012).<br />
cultures place higher value on empathy, sociability <strong>and</strong><br />
cooperation (Tri<strong>and</strong>is <strong>and</strong> Gelf<strong>and</strong>, 1998). Accordingly,<br />
some skills are emphasized in the labour market in one<br />
country but may have negative consequences in another<br />
(Miyamoto et al., 2015).<br />
Possessing more of a skill is usually considered an<br />
asset. However, evidence is lacking to show the level<br />
at which non-cognitive skills are most likely to predict<br />
employment outcomes. The optimal skill level likely<br />
depends on the employment context, as different jobs<br />
require different sets of skills (Borghans et al., 2006)..<br />
For instance, caring attitudes are highly relevant for<br />
positions in medical <strong>and</strong> therapeutic professions, but<br />
may not be rewarded in sales jobs that consider more<br />
direct <strong>and</strong> persistent behaviour an asset. The right mix<br />
of skills also depends on perspective. For instance, is a<br />
person carrying out monotonous work tasks better off<br />
with more or fewer coping skills (Green, 2011)?<br />
The development of measures to allow cross-country<br />
comparisons of non-cognitive skills, therefore, is<br />
challenging. While this report does not recommend largescale<br />
measurement for global comparisons, the growing<br />
research on measuring non-cognitive skills acquisition<br />
deserves attention. Finally, distinguishing between<br />
cognitive <strong>and</strong> non-cognitive skills is complicated because<br />
many of the most valued skills in the workplace are<br />
combinations that are not easily categorized (Gutman<br />
<strong>and</strong> Schoon, 2013) (Box 13.1).<br />
PERSEVERANCE<br />
Perseverance involves ‘steadfastness on mastering<br />
a skill or completing a task’ (Gutman <strong>and</strong> Schoon, 2013).<br />
It can take the form of ‘grit’, which has been defined<br />
as ‘perseverance to accomplish long-term or higherorder<br />
goals in the face of challenges <strong>and</strong> setbacks,<br />
engaging the student’s psychological resources’<br />
(Shechtman et al., 2013). Experiments have shown<br />
that perseverance is malleable. For example, individuals<br />
who reflect on failures or obstacles tend to have more grit<br />
<strong>and</strong> perform better on tasks involving sustained attention<br />
(Duckworth et al., 2011; Dimenichi <strong>and</strong> Richmond, 2015).<br />
A commonly adopted measurement tool is the Grit<br />
Scale, which contains 12 self-reported items on<br />
consistency of interest <strong>and</strong> perseverance of effort<br />
(Duckworth <strong>and</strong> Quinn, 2009). The World Bank STEP<br />
survey, which was carried out in middle income<br />
countries, included three items from the Grit Scale <strong>and</strong><br />
248<br />
CHAPTER 13 | TARGET 4.4 – SKILLS FOR WORK
13<br />
found that workers who scored better had spent less<br />
time finding their first job after graduation (World Bank,<br />
2014d). But the items of the Grit Scale have also been<br />
criticized as being subject to social desirability bias<br />
(Dimenichi <strong>and</strong> Richmond, 2015).<br />
The 2012 PISA assessed perseverance of 15-year-old<br />
students in more than 60 countries. It was defined via<br />
five components: the extent to which students (a) felt<br />
they gave up easily when confronted with a problem,<br />
(b) put off difficult problems, (c) remained interested<br />
in the tasks they started, (d) continued to work on<br />
a task until everything was perfect <strong>and</strong> (e) did more<br />
than was expected of them when confronted with a<br />
problem (OECD, 2013d). The study showed that 56% of<br />
the students indicated that they do not give up easily<br />
when confronted with a problem, <strong>and</strong> that there was a<br />
14 percentage point gap in perseverance levels at the<br />
expense of socio-economically disadvantaged students<br />
(Figure 13.3).<br />
SELF-CONTROL<br />
Self-control has been defined as ‘the capacity for altering<br />
one’s own responses, especially to bring them into line<br />
with st<strong>and</strong>ards such as ideals, values, morals, <strong>and</strong> social<br />
expectations, <strong>and</strong> to support the pursuit of long-term<br />
goals’ (Baumeister at al., 2007). Other terms used to<br />
describe it include self-regulation, self-discipline <strong>and</strong><br />
willpower (Duckworth <strong>and</strong> Kern, 2011).<br />
Self-control positively influences personal initiative <strong>and</strong><br />
proactive coping. A survey of about 400 prospective<br />
vocational training graduates in the Netherl<strong>and</strong>s<br />
suggested that self-control predicted student<br />
preparation for a job search before they entered the<br />
labour market (Baay et al., 2014). Low self-control of<br />
emotions in children has been directly linked to longterm<br />
unemployment in adulthood (Kokko et al., 2000).<br />
Early childhood experiences help develop brain regions<br />
related to self-control <strong>and</strong> are important to developing<br />
FIGURE 13.3:<br />
Socio-economic disadvantage is negatively associated with perseverance<br />
Percentage of students who disagreed with the statement ‘When confronted with a problem, I give up easily’, by socio-economic advantage,<br />
selected countries, 2012<br />
100<br />
90<br />
Students who disagree with the statement<br />
‘When confronted with a problem, I give up easily’ (%)<br />
80<br />
70<br />
60<br />
50<br />
40<br />
30<br />
20<br />
Advantaged<br />
Disadvantaged<br />
10<br />
0<br />
Japan<br />
Slovakia<br />
Norway<br />
Malaysia<br />
Jordan<br />
Rep. of Korea<br />
Sweden<br />
Indonesia<br />
Qatar<br />
Slovenia<br />
Thail<strong>and</strong><br />
Tunisia<br />
Greece<br />
France<br />
Belgium<br />
Romania<br />
Macao, China<br />
U. A. Emirates<br />
Turkey<br />
Italy<br />
Argentina<br />
Icel<strong>and</strong><br />
Denmark<br />
Brazil<br />
Spain<br />
Croatia<br />
Peru<br />
Hungary<br />
Finl<strong>and</strong><br />
Czech Rep.<br />
Montenegro<br />
New Zeal<strong>and</strong><br />
United Kingdom<br />
Mexico<br />
Cyprus<br />
Portugal<br />
Luxembourg<br />
Switzerl<strong>and</strong><br />
Irel<strong>and</strong><br />
Hong Kong, China<br />
Netherl<strong>and</strong>s<br />
Singapore<br />
Israel<br />
Viet Nam<br />
Australia<br />
Uruguay<br />
Latvia<br />
Chile<br />
Serbia<br />
Lithuania<br />
Colombia<br />
Austria<br />
Bulgaria<br />
Canada<br />
Estonia<br />
Germany<br />
Costa Rica<br />
United States<br />
Kazakhstan<br />
Pol<strong>and</strong><br />
Russian Fed.<br />
Source: OECD (2013d).<br />
2016 • GLOBAL EDUCATION MONITORING REPORT 249
13<br />
self-discipline (Tarullo et al., 2009). Difficult circumstances<br />
in childhood, such as poverty <strong>and</strong> chronically depressed<br />
parents, can negatively affect children’s self-control<br />
skills (Evans <strong>and</strong> Rosenbaum, 2008; Sektnan et al., 2010).<br />
Schooling can be an important corrective to help children<br />
develop or regain these skills. Education interventions<br />
can promote self-regulation <strong>and</strong> lower the impact of early<br />
childhood risk factors (McClell<strong>and</strong> <strong>and</strong> Tominey, 2014).<br />
Emotional support from teachers <strong>and</strong> targeted curricula<br />
can increase attention control, cognition <strong>and</strong> the ability<br />
to suppress impulses (Diamond et al., 2007).<br />
Several approaches have been used to measure self-control,<br />
including clinical experiments on the executive function<br />
(the cognitive processes that control behaviour). The most<br />
common tools are self-reported personality questionnaires<br />
such as the Eysenck I7 Impulsiveness Scale, the Self-<br />
Control Scale <strong>and</strong> the Barratt Impulsiveness Scale<br />
(Eysenck et al., 1984; Tangney et al., 2004; Barratt, 1985).<br />
Two measurement tools are frequently used to assess<br />
social skills. The Social Skills Inventory measures seven<br />
dimensions, including emotional/social expressiveness,<br />
sensitivity <strong>and</strong> control (Riggio, 1986). The Interpersonal<br />
Competence Questionnaire examines five interpersonal<br />
skill domains: initiation, self-disclosure, conflict<br />
management, emotional support <strong>and</strong> negative assertion<br />
(Muralidharan et al., 2011).<br />
COMBINATIONS OF COGNITIVE<br />
AND NON-COGNITIVE SKILLS<br />
FOR WORK<br />
It is often not possible to disentangle particular skills.<br />
Two examples of blended cognitive <strong>and</strong> non-cognitive<br />
skills are financial literacy <strong>and</strong> entrepreneurship skills.<br />
Both are relevant for the world of work but present<br />
challenges for measurement <strong>and</strong> monitoring.<br />
SOCIAL SKILLS<br />
Social skills include the ability to establish compatible<br />
<strong>and</strong> effective relations with others that are pleasing<br />
in interpersonal situations (Segrin, 2001). They have<br />
a great impact on an individual’s academic success,<br />
career choice, professional <strong>and</strong> peer interactions, <strong>and</strong> job<br />
performance (Riggio et al., 2003; Witt <strong>and</strong> Ferris, 2003).<br />
However, many studies recognize that cultural norms<br />
influence how children express <strong>and</strong> control emotions<br />
(Rogoff, 2003). For example, sensitivity <strong>and</strong> shyness<br />
in children are often regarded as mature <strong>and</strong> good<br />
behaviour in traditional Chinese culture but a weakness<br />
in many Western countries (Katz <strong>and</strong> McClellan, 1997;<br />
Chen, 2009). In Japan, the education system emphasizes<br />
teaching children to be silent <strong>and</strong> careful listeners, while<br />
in Western cultures such as the United States students<br />
are more expected to be confident speakers (Hatano <strong>and</strong><br />
Inagaki, 1998).<br />
Social skills training is usually provided as a group<br />
intervention that includes development of friendship <strong>and</strong><br />
conversation skills, anger management, empathy training<br />
<strong>and</strong> perspective-taking. Most studies focus on children with<br />
social communication problems. But the results of research<br />
on social skills training interventions have been mixed<br />
(Kjøbli <strong>and</strong> Ogden, 2014). Interventions tended to have the<br />
strongest impact on children who had experienced critical<br />
life events, were anxious, isolated <strong>and</strong> lonely, <strong>and</strong> lacked<br />
social stimulation (Lösel <strong>and</strong> Beelmann, 2003).<br />
FINANCIAL LITERACY<br />
Financial literacy describes the ability to manage<br />
personal finances <strong>and</strong> allocate business resources<br />
effectively. Individuals with low levels of financial<br />
literacy are more likely to borrow at high interest rates<br />
<strong>and</strong> acquire fewer assets, both critical disadvantages in<br />
contexts where a large percentage of the labour force is<br />
self-employed (Cole <strong>and</strong> Fern<strong>and</strong>o, 2008).<br />
In 2012, the Group of Twenty (G20) leaders endorsed<br />
a definition of financial literacy as ‘a combination of<br />
awareness, knowledge, skill, attitude <strong>and</strong> behaviour<br />
necessary to make sound financial decisions <strong>and</strong><br />
ultimately achieve individual financial well-being’ (OECD/<br />
INFE, 2011). ‘Knowledge’ refers not only to numeracy<br />
but also knowing certain financial institutions exist <strong>and</strong><br />
how to interact with them <strong>and</strong> their products effectively<br />
(Carpena et al., 2011).<br />
Attempts to develop an empirical measure of<br />
financial literacy have advanced in recent years. The<br />
OECD International Network on Financial Education<br />
administered a questionnaire with 8 numeracybased<br />
questions in 14 countries. It defined <strong>people</strong> as<br />
financially literate if they correctly answered at least<br />
6 of 8 questions. On this definition, the percentage of<br />
financial literacy ranged from 33% in South Africa to 69%<br />
in Hungary (Atkinson <strong>and</strong> Messy, 2012). Results from<br />
a second round of the assessment in a wider range of<br />
countries, which includes questions on attitudes <strong>and</strong><br />
behaviour, will be released in 2016 (OECD, 2015i).<br />
250<br />
CHAPTER 13 | TARGET 4.4 – SKILLS FOR WORK
13<br />
A St<strong>and</strong>ard & Poor’s module with numeracy-based<br />
questions related to interest, compound interest,<br />
inflation <strong>and</strong> risk diversification was attached to<br />
the Gallup World Poll <strong>and</strong> administered in more than<br />
140 countries in 2014. The survey defined <strong>people</strong> as<br />
financially literate if they correctly answered questions<br />
on at least three of these four financial concepts. It<br />
found that 33% of adults worldwide were financially<br />
literate, from a low of 13% in Yemen to a high of 71% in<br />
Norway (Klapper et al., 2015).<br />
There is wide variation in the level of financial development<br />
around the world. For example, the percentage of <strong>people</strong><br />
with a bank account varied from 89% in high income<br />
countries to 24% in low income countries, <strong>and</strong> just 7%<br />
among the poorest fifth of the population in Northern<br />
Africa <strong>and</strong> Western Asia (Demirguc-Kunt <strong>and</strong> Klapper, 2012).<br />
However, the survey showed no evidence that income<br />
was associated with financial literacy for countries with<br />
the gross domestic product (GDP) per capita below<br />
US$12,000. This suggests the limited relevance of some<br />
knowledge in poorer countries.<br />
More critically, knowledge does not lead directly to<br />
particular behaviour; other factors play a role, including<br />
traits such as decisiveness <strong>and</strong> the social contexts in<br />
which decisions are made. The World Bank, accordingly,<br />
differentiated between a knowledge-based measure of<br />
financial literacy <strong>and</strong> a measure of financial capability,<br />
which looked at how knowledge interacted with skills<br />
<strong>and</strong> attitudes to generate behaviour that led to positive<br />
outcomes. In a study of five countries, knowledge<br />
was not always positively correlated with capability. A<br />
notable example was that, in some cases, women had<br />
lower levels of financial literacy but higher levels of<br />
financial capability (Holzmann et al., 2013).<br />
Unlike assessments that targeted the entire adult<br />
population, the 2012 PISA measured financial literacy<br />
among 15-year-olds. It referred to ‘knowledge <strong>and</strong><br />
underst<strong>and</strong>ing of financial concepts <strong>and</strong> risks, <strong>and</strong><br />
the skills, motivation <strong>and</strong> confidence to apply such<br />
knowledge <strong>and</strong> underst<strong>and</strong>ing in order to make effective<br />
decisions across a range of financial contexts, to improve<br />
the financial well-being of individuals <strong>and</strong> society, <strong>and</strong> to<br />
enable participation in economic life’ (OECD, 2014a).<br />
At level 2, the minimum proficiency level, students<br />
would be able to apply their knowledge of common<br />
financial products <strong>and</strong> commonly used financial terms<br />
<strong>and</strong> concepts, <strong>and</strong> use information to make financial<br />
decisions in relevant contexts. They would recognize<br />
the value of a simple budget <strong>and</strong> interpret features of<br />
everyday financial documents. By this definition, 15%<br />
of students in participating countries fell below level<br />
2, ranging from 5% in Estonia to 23% in Israel. But in<br />
Colombia, 56% of 15-year-olds fell below level 2 (OECD,<br />
2014a) (Figure 13.4).<br />
Other factors influencing financial literacy include whether<br />
it is part of the intended curriculum, the prevalence of<br />
appropriate teaching <strong>and</strong> learning materials, <strong>and</strong> teacher<br />
knowledge. In general, evaluations demonstrate that<br />
education programmes can improve financial literacy.<br />
A meta-analysis of 21 experimental studies found that<br />
interventions led to modest improvements in financial<br />
knowledge <strong>and</strong> smaller effects on financial attitudes <strong>and</strong><br />
behaviours (O’Prey <strong>and</strong> Shepherd, 2014).<br />
Few financial literacy programmes targeted at adults<br />
have undergone rigorous evaluation. Results are mixed,<br />
although this may be the result of the diversity of<br />
content, training, medium of instruction <strong>and</strong> outcomes<br />
studied. One study among urban households in India<br />
found that traditional financial education alone did not<br />
affect long-term financial behaviour (Carpena et al., 2015).<br />
FIGURE 13.4:<br />
Financial literacy skills are unequally distributed across countries<br />
Distribution of 15-year-old students by level of financial literacy, selected<br />
countries, 2012<br />
Distribution of 15-year-olds by financial<br />
literacy proficiency level (%)<br />
100<br />
80<br />
60<br />
40<br />
20<br />
0<br />
Estonia<br />
Latvia<br />
Source: OECD (2014a).<br />
Pol<strong>and</strong><br />
Czech Rep.<br />
Australia<br />
New Zeal<strong>and</strong><br />
Croatia<br />
Spain<br />
Russian Fed.<br />
Slovenia<br />
United States<br />
France<br />
Italy<br />
Slovakia<br />
Israel<br />
Colombia<br />
Level 4+<br />
Level 3<br />
Level 2<br />
Level 1<br />
<strong>and</strong> below<br />
2016 • GLOBAL EDUCATION MONITORING REPORT 251
13<br />
ENTREPRENEURSHIP SKILLS<br />
Entrepreneurship, also a focus of target 4.4, requires<br />
a mix of skills. The European Commission defined<br />
entrepreneurship as ‘the mindset <strong>and</strong> process<br />
needed to create <strong>and</strong> develop economic activity by<br />
blending risk-taking, creativity <strong>and</strong>/or innovation<br />
with sound management, within a new or existing<br />
organisation’ (European Commission, 2003). Accordingly,<br />
entrepreneurship skills encompass ‘creativity, initiative,<br />
tenacity, teamwork, underst<strong>and</strong>ing of risk, <strong>and</strong> a sense of<br />
responsibility’ (European Commission, 2014).<br />
It helps to group these skills into three categories.<br />
Technical skills are specific to the industry in which the<br />
business is active. Management skills include planning,<br />
finance, accounting, marketing <strong>and</strong> quality control.<br />
Personal skills include self-control <strong>and</strong> discipline, creativity,<br />
persistence, leadership <strong>and</strong> the ability to manage risk<br />
(OECD, 2014d). A need for achievement <strong>and</strong> autonomy,<br />
self-efficacy, innovativeness, stress tolerance <strong>and</strong> a<br />
proactive personality have been identified as relevant<br />
characteristics (Rauch <strong>and</strong> Frese, 2007). Inevitably, there is<br />
no straightforward approach to measuring such a diverse<br />
set of cognitive <strong>and</strong> non-cognitive attributes.<br />
The Global Entrepreneurship Monitor included indicators<br />
on self-perceived capabilities in a survey of entrepreneurial<br />
activity across 60 countries in 2015. These perceptions<br />
were lowest in Europe at 43% <strong>and</strong> highest in sub-Saharan<br />
Africa, where more than 70% of adults in four of five<br />
participating countries were not only confident but also<br />
saw the most opportunities for entrepreneurial activity<br />
(GEM, 2016; OECD, 2015i). These results raise the question<br />
of comparability, as neither business characteristics nor<br />
risks are comparable between poor <strong>and</strong> rich countries.<br />
The research project on Assessment Tools <strong>and</strong> Indicators<br />
for Entrepreneurship Education went a step further to<br />
TABLE 13.2:<br />
Dimensions of entrepreneurial skills<br />
Entrepreneurial skills<br />
Entrepreneurial mindset<br />
Entrepreneurial knowledge<br />
Connectedness to education<br />
Connectedness to future career<br />
Source: Moberg et al. (2014).<br />
Exploration: creativity<br />
Evaluation: planning <strong>and</strong> financial literacy<br />
Exploitation: marshalling resources, managing ambiguity, teamwork<br />
Self-efficacy, locus of control, self-esteem<br />
Perceived knowledge about how to assess business opportunities; role <strong>and</strong> function<br />
entrepreneurs have in society; <strong>and</strong> knowledge about different types of entrepreneurial<br />
career options<br />
(=student-teacher relationship)<br />
(=student enterprising activities, work experience, <strong>and</strong> intention to start a company)<br />
validate self-reported measures of entrepreneurship skills<br />
using a sample of students across 13 European countries<br />
<strong>and</strong> 3 age groups: 10 to 11, 16 to 17 <strong>and</strong> 20 or older<br />
(Moberg et al., 2014). The tools covered five dimensions<br />
(Table 13.2). They have not yet been applied to monitor<br />
differences between countries.<br />
Research-based studies of entrepreneurship within<br />
countries offer interesting insights. In Sri Lanka, a survey<br />
collected background data on a sample of wage workers,<br />
micro-firm owners, <strong>and</strong> larger firm owners with more<br />
than five employees to identify differences between<br />
them in terms of measures including cognitive ability,<br />
entrepreneurial personality, financial literacy <strong>and</strong> risk<br />
attitudes. Larger firm owners had significantly higher<br />
cognitive abilities <strong>and</strong> were more competitive <strong>and</strong> better<br />
organized than micro-firm owners. Moreover, over two <strong>and</strong><br />
a half years, the few own-account workers who were more<br />
similar in skills to larger firm owners were more likely to<br />
exp<strong>and</strong> by hiring more employees (de Mel et al., 2010).<br />
In Peru, as part of a village microfinance programme, a<br />
training session of 30 to 60 minutes per week was added<br />
over a period of 1 to 2 years. The training focused on<br />
basic business practices, such as how to treat clients,<br />
where to sell, the use of special discounts <strong>and</strong> selling<br />
on credit. Participants demonstrated greater business<br />
knowledge <strong>and</strong> some better business practices, such as<br />
reinvesting profit in their business <strong>and</strong> maintaining sales<br />
records (Karlan <strong>and</strong> Valdivia, 2011).<br />
For entrepreneurship skills to be gained <strong>and</strong> to be effective,<br />
relevant topics <strong>and</strong> exercises should be explicitly integrated<br />
in school curricula <strong>and</strong> assessed as an education outcome.<br />
In Europe, the most common concrete learning outcomes<br />
at the upper secondary education level were attitudes<br />
such as initiative, risk-taking <strong>and</strong> problem-solving, which<br />
were specified in 19 of 36 education systems (European<br />
Commission/EACEA/Eurydice, 2012a). Spain specified the<br />
broadest range of entrepreneurship-related outcomes in<br />
its secondary education curricula, including assessment<br />
criteria. Overall, though, assessment guidance remains<br />
limited not just in Europe but around the world despite<br />
the variety of programmes on offer, as in the case of<br />
Palestine (Box 13.2).<br />
In general, there is little clarity to guide this aspect<br />
of target 4.4 because of the wide diversity of possible<br />
outcomes, targeted groups <strong>and</strong> modes of delivery; the<br />
tenuous links between programmes <strong>and</strong> outcomes; <strong>and</strong><br />
the complexity of measuring some key outcomes.<br />
252<br />
CHAPTER 13 | TARGET 4.4 – SKILLS FOR WORK
13<br />
CONCLUSION<br />
This chapter has reviewed a select set of skills ‘for<br />
employment, decent jobs <strong>and</strong> entrepreneurship’ with<br />
three important questions in mind.<br />
First, what skills are particularly relevant for global<br />
monitoring across diverse economic, social <strong>and</strong> cultural<br />
contexts? Popular accounts of ‘21st century skills’ are<br />
criticized for cultural specificity. Some critics caution<br />
against overemphasizing skills that reflect norms of<br />
powerful social groups or countries. An additional challenge<br />
relates to the mix of skills: while higher levels of cognitive<br />
skills may be better in most contexts, this is less the case for<br />
non-cognitive skills. Nevertheless, different skills in different<br />
combinations are relevant for different formal <strong>and</strong> informal<br />
jobs in poor <strong>and</strong> rich countries alike. For that reason, they<br />
should be explored within the scope of target 4.4.<br />
Second, once identified, are skills mainly acquired in<br />
education <strong>and</strong> training systems, or elsewhere? Views<br />
differ on the extent to which some skills are stable<br />
or malleable, whether they have a genetic element<br />
or are learned – at home or in school classrooms – or<br />
are indelibly affected by workplace expectations <strong>and</strong><br />
training. Target 4.4 offers an excellent opportunity<br />
to explore these questions. Considerable education<br />
resources are spent on programmes that aim to develop<br />
skills of future workers, but there is often insufficient<br />
comparative evidence of what skills are most important<br />
for which employment sectors <strong>and</strong> why.<br />
Third, are available measures valid <strong>and</strong> feasible at low cost?<br />
Several skills have been measured for decades, although<br />
mostly from a research angle, in high income countries <strong>and</strong><br />
without cross-country comparability. There are limitations<br />
in using self-reporting tools to measure employmentrelated<br />
skills, given the temptation for respondents to<br />
provide socially desirable responses. Socially constructed<br />
skills are especially difficult to measure reliably across<br />
cultures. Nevertheless, innovative approaches are being<br />
developed to measure important complex skills such as<br />
communication <strong>and</strong> collaboration. These approaches<br />
involve simulating interactions in laboratory conditions,<br />
which makes them less realistic <strong>and</strong> quite expensive, <strong>and</strong><br />
hence, not suitable for global monitoring. Yet, they merit<br />
closer attention to guide future education interventions.<br />
The debates around these questions are reflected in the<br />
proposed indicators for target 4.4. One is the education<br />
attainment rate in the adult population, which is not<br />
BOX 13.2<br />
Nurturing entrepreneurship skills in Palestine<br />
In Palestine, a variety of interventions exists to improve entrepreneurship skills, encourage<br />
youth to launch their own businesses <strong>and</strong> help them work productively in small <strong>and</strong> mediumsized<br />
enterprises. However, a review has concluded that none of the programmes have made<br />
attempts to assess their effectiveness in increasing their target population’s capacities.<br />
The Know About Business programme, initiated by the International Labour Office<br />
<strong>and</strong> the United Nations Development Programme (UNDP) in 2009, mainstreamed<br />
entrepreneurship courses in the curricula of vocational training centres under the<br />
Ministry of Labour <strong>and</strong> vocational schools under the Ministry of Education <strong>and</strong> Higher<br />
Education in 2011. A spin-off project introduced entrepreneurship courses into the<br />
curricula of the United Nations Relief <strong>and</strong> Works Agency (UNRWA) training centres.<br />
In addition, the Food <strong>and</strong> Agriculture Organization implemented its worldwide Junior<br />
Farmer Field <strong>and</strong> Life Schools programme in 16 rural schools, providing disadvantaged<br />
youth with agricultural <strong>and</strong> life skills. The programme provided technical entrepreneurship<br />
skills – including agricultural business management, marketing strategy <strong>and</strong> cost–<br />
benefit analysis – <strong>and</strong> raised awareness on crops as a source of income.<br />
Non-government organisations are also active. INJAZ Palestine helps students set<br />
up businesses in laboratory conditions to solve real business problems. The Youth<br />
Entrepreneurship Development programme, funded by the US Agency for International<br />
Development <strong>and</strong> implemented by the International Youth Foundation, has trained<br />
9,000 young <strong>people</strong> aged 14 to 29. The Palestine Education for Employment initiative<br />
delivers a certified course on business plan formulation.<br />
Overall, these programmes focus mostly on technical <strong>and</strong> management skills. However,<br />
personal skills may be more critical to overcoming gaps, notably by gender, in entrepreneurial<br />
activity. Data from the Global Entrepreneurship Monitor show that fear of failure, which was<br />
more common among women, was negatively associated with the probability of becoming<br />
an entrepreneur. The factor most associated with this fear was a negative perception<br />
of one’s own skills, suggesting a needed area of focus for future programmes.<br />
Sources: Daoud et al. (2015); Education for Employment (2015); FAO (2010); Hashweh<br />
(2012); ILO (2012); Intel (2015); Youth Entrepreneurship Development (2015).<br />
a measure of skill <strong>and</strong> whose use is an approach the<br />
international education community seeks to distance<br />
itself from. As the target formulation specifies technical<br />
<strong>and</strong> vocational skills, a more reasonable approach would<br />
be to capture acquisition of certified skills, although<br />
the cost of developing <strong>and</strong> maintaining a related<br />
administrative system in all countries would be high.<br />
The new agenda makes a tentative step instead to<br />
directly monitor a particular skill: ICT <strong>and</strong> digital literacy.<br />
While this risks narrowing the agenda, it should be seen<br />
as a call to begin focusing on acquisition of concrete,<br />
measurable skills.<br />
2016 • GLOBAL EDUCATION MONITORING REPORT 253
14<br />
Jaspreet, a girl at<br />
the Patiala School<br />
for Deaf <strong>and</strong> Blind,<br />
Punjab, India.<br />
CREDIT: Shivam Kapoor/UNESCO<br />
KEY MESSAGES<br />
The SDG agenda requires a major shift in monitoring, reporting <strong>and</strong> policy-making on inequality.<br />
Measurement focuses on disparity in results, such as how many girls are in school compared to boys, but tends to ignore the<br />
contributing causes, such as textbook bias, discriminatory classroom practices or social norms, <strong>and</strong> the policies that could<br />
address them.<br />
There are two challenges with inequality measures. First, as they can be used for any education indicator <strong>and</strong> broken down by<br />
any characteristic, such as gender, location or wealth, there is too much information to absorb. Second, different measures can<br />
give very different, even contradictory, results.<br />
Disparity by wealth is the most extreme. In low income countries, for every 100 among the richest youth who complete primary<br />
education, only 36 do so among the poorest; in lower <strong>and</strong> upper secondary education the corresponding figures are 19 <strong>and</strong> 7.<br />
Global or regional averages mask substantial gender gaps in education. While parity was achieved globally in 2014, only 63% of<br />
countries achieved parity in primary education, 46% in lower secondary <strong>and</strong> 23% in upper secondary.<br />
More comprehensive monitoring of gender equality in education is needed, which requires evaluating curricula, textbooks,<br />
assessments <strong>and</strong> teacher education.<br />
People with disabilities are routinely denied their right to education. Across 30 education systems in Europe, 4.6% of pupils were<br />
identified as having a special educational need in 2010. Yet monitoring is difficult because disability takes different forms <strong>and</strong> degrees.<br />
About 40% of <strong>people</strong> around the world are not taught in a language they speak or underst<strong>and</strong>. Monitoring should assess<br />
whether policies help students gain access to education in their home language, whether these policies are implemented <strong>and</strong><br />
whether teachers are prepared.<br />
Migrants have specific education needs. In high income countries, first-generation immigrant students scored well below their<br />
peers in reading <strong>and</strong> mathematics. Forcibly displaced populations are among the most neglected. According to the UN refugee<br />
agency, 50% of primary school-age refugees <strong>and</strong> 75% of secondary school-age refugees are out of school worldwide.<br />
254<br />
CHAPTER 14 | TARGET 4.5 – EQUITY
14<br />
CHAPTER 14<br />
Sustainable Development Goal 4.5<br />
TARGET 4.5<br />
Equity<br />
By 2030, eliminate gender disparities in education <strong>and</strong> ensure equal<br />
access to all levels of education <strong>and</strong> vocational training for the vulnerable,<br />
including persons with disabilities, indigenous <strong>people</strong>s <strong>and</strong> children in<br />
vulnerable situations<br />
GLOBAL INDICATOR 4.5.1 – Parity indices (female/male, rural/urban, bottom/top wealth quintile<br />
<strong>and</strong> others such as disability status, indigenous <strong>people</strong> <strong>and</strong> conflict-affected as data become<br />
available) for all indicators on this list that can be disaggregated<br />
THEMATIC INDICATOR 18 – Percentage of students in primary education whose first or home<br />
language is the language of instruction<br />
(reviewed in the Finance chapter)<br />
THEMATIC INDICATOR 19 – Extent to which explicit formula-based policies reallocate education<br />
resources to disadvantaged populations<br />
THEMATIC INDICATOR 20 – Education expenditure per student by level of education <strong>and</strong> source<br />
of funding<br />
THEMATIC INDICATOR 21 – Percentage of total aid to education allocated to low-income countries<br />
2016 • GLOBAL EDUCATION MONITORING REPORT 255
14<br />
Inequality measures..............................................................................................................257<br />
Gender...........................................................................................................................................262<br />
Disability......................................................................................................................................265<br />
Language......................................................................................................................................267<br />
Migration <strong>and</strong> forced displacement................................................................................271<br />
The desire to leave no one behind permeates the<br />
entire 2030 Agenda for Sustainable Development.<br />
For example, two Sustainable Development Goals (SDGs)<br />
are dedicated to addressing gender inequality (SDG 5)<br />
<strong>and</strong> reducing income inequality (SDG 10). There is also<br />
an unprecedented<br />
global commitment to<br />
The desire to leave no<br />
monitor progress using<br />
data disaggregated<br />
one behind permeates<br />
‘by income, gender,<br />
the entire 2030<br />
age, race, ethnicity,<br />
Agenda for Sustainable<br />
migratory status,<br />
disability, geographic<br />
Development<br />
location, <strong>and</strong> other<br />
characteristics<br />
relevant to national<br />
contexts’ (United Nations, 2015a, p. 27). This is expected<br />
to spur dem<strong>and</strong> for global monitoring <strong>and</strong> reporting<br />
of inequality.<br />
In the case of education, target 4.5 focuses exclusively<br />
on the need to ‘ensure equal access to all levels’. The<br />
cross-cutting nature of this target is reflected in the<br />
selection of global indicator 4.5.1, which aims to measure<br />
disparities in access to education from early childhood to<br />
adult education.<br />
This chapter addresses three main issues. First, what<br />
are appropriate ways to measure inequality <strong>and</strong> its<br />
evolution over time? Gender disparity in primary,<br />
secondary <strong>and</strong> tertiary education was monitored as<br />
part of the third Millennium Development Goal (MDG),<br />
contributing to greater awareness of challenges in many<br />
countries. The new agenda extends the scope to other<br />
population groups, notably those defined by location<br />
<strong>and</strong> wealth. The accumulation of large data sets in recent<br />
years makes the global measurement of inequality in<br />
education possible. But the question of how best to<br />
measure disparity remains to be addressed.<br />
Second, how can information be collected that identifies<br />
individuals as members of other vulnerable groups,<br />
such as <strong>people</strong> with disabilities <strong>and</strong> those who are<br />
forcibly displaced or speak a language other than the<br />
language of instruction?<br />
Third, what are broader aspects of equity in education<br />
beyond parity? Target 4.5 is limited to disparity <strong>and</strong>,<br />
in this respect, does not capture aspects of equity<br />
unrelated to access. In practice, education remains a<br />
social institution that reflects <strong>and</strong> reproduces socioeconomic<br />
<strong>and</strong> cultural disadvantages that prevail in the<br />
rest of society. For instance, even if they are in school,<br />
students from weaker socio-economic or marginalized<br />
backgrounds are more likely to attend schools<br />
characterized by subst<strong>and</strong>ard infrastructure, fewer<br />
qualified teachers, less ambitious peers <strong>and</strong> less<br />
effective pedagogical practices. These factors have a<br />
negative influence on their achievement in school <strong>and</strong><br />
overall attainment.<br />
While the target formulation makes no reference<br />
to the means for tackling disadvantage in education,<br />
three relevant thematic indicators have been<br />
proposed on policies, expenditure <strong>and</strong> aid; they are<br />
discussed in Chapter 20 on education financing.<br />
256<br />
CHAPTER 14 | TARGET 4.5 – EQUITY
14<br />
INEQUALITY MEASURES<br />
Measuring inequality in education is critical, but is<br />
challenging because of three main factors. First, inequality<br />
can be examined with reference to any education indicator,<br />
such as the primary completion rate or the number of<br />
years of education attained (Morrisson <strong>and</strong> Murtin, 2013;<br />
Meschi <strong>and</strong> Scervini, 2014). The increasing availability of<br />
national <strong>and</strong> international learning achievement surveys<br />
further enables the measurement of inequality in learning<br />
outcome indicators (OECD, 2010; Fereira <strong>and</strong> Gignoux,<br />
2014). An important difference is between education<br />
indicators that are delimited between 0% <strong>and</strong> 100% <strong>and</strong><br />
those that are not. For example, inequality would be<br />
zero if 100% of all students pass a minimum learning<br />
proficiency level but high in terms of the score in the<br />
same assessment.<br />
implications depending on whether a country is small or<br />
large, or whether it is sparsely or densely populated.<br />
Household wealth levels are also difficult to compare.<br />
Household surveys such as the Demographic <strong>and</strong> Health<br />
Surveys (DHS) <strong>and</strong> Multiple Indicator Cluster Surveys<br />
(MICS) have popularized asset indices (based, for<br />
example, on house construction materials or ownership<br />
of consumer durables) as a proxy measure of household<br />
socio-economic status in low <strong>and</strong> middle income<br />
countries. However, asset indices are not comparable<br />
between countries <strong>and</strong> over time (Rutstein <strong>and</strong> Staveteig,<br />
2014). Television ownership does not have the same<br />
implication in a European country as an African one, or in<br />
2000 vs 2010. Each asset index is specific to the country<br />
<strong>and</strong> the year. Its value is in comparing relative rather<br />
than absolute wealth levels.<br />
Second, different inequality measures can be used to see<br />
how an education indicator is distributed in the population,<br />
each with advantages <strong>and</strong> disadvantages. Some measures<br />
have solid conceptual foundations <strong>and</strong> can be linked better<br />
to social perceptions of justice <strong>and</strong> equity. Others are<br />
less rigorous but can be easily communicated. Different<br />
inequality measures can also lead to different conclusions<br />
about the degree of inequality <strong>and</strong> the extent to which it<br />
changes over time (Box 14.1).<br />
Third, policy-makers need to know how an education<br />
indicator varies by learner characteristics. The usual<br />
comparable markers of potential disadvantage are<br />
gender, location, <strong>and</strong> income or wealth. There is<br />
insufficient information<br />
for comparisons to be<br />
made for other important<br />
There is insufficient<br />
characteristics, such as<br />
information on disability. On other critical<br />
important markers markers, comparisons can<br />
be made within but not<br />
of disadvantage,<br />
between countries. For<br />
such as disability example, being a member<br />
of an ethnic, linguistic<br />
or religious group can<br />
be a marker of education advantage or disadvantage,<br />
depending on the country.<br />
Issues arise even among more comparable<br />
characteristics. For example, regarding location, national<br />
definitions of rural <strong>and</strong> urban areas vary across countries.<br />
Some surveys, moreover, may not use the national<br />
definitions. In addition, the definitions have different<br />
PARITY INDEX<br />
The Inter-agency <strong>and</strong> Expert Group on SDG Indicators<br />
has proposed the parity index as the global measure<br />
of inequality in education. This is the ratio between<br />
the values of two groups <strong>and</strong> ranges from 0 (extreme<br />
inequality at the expense of one group) to 1 (parity) to<br />
infinity (extreme inequality at the expense of the other<br />
group). For example, if 30% of the poorest <strong>and</strong> 60% of the<br />
richest have completed primary school, then the value of<br />
the wealth parity index of the primary completion rate<br />
is 0.5. This measure has been proposed because it is the<br />
easiest to communicate to a broad audience <strong>and</strong> has<br />
been effective for describing gender disparity over the<br />
past two decades.<br />
New analysis for this report estimates average parity<br />
index values by region <strong>and</strong> country income group for<br />
several education indicators <strong>and</strong> three individual-level<br />
characteristics. The data refer to 2008–2014 <strong>and</strong> cover<br />
82 low <strong>and</strong> middle income countries, which represent<br />
over 90% of the population in the two combined groups.<br />
Information is also provided on disparity in completion<br />
rates in high income countries.<br />
In the case of children who have ever been to school,<br />
there is gender parity for middle income countries, but<br />
disparity at the expense of girls in low income countries,<br />
where 93 girls for every 100 boys have ever been to<br />
school (Figure 14.2a). Disparity in having been to school<br />
is exacerbated when location <strong>and</strong> wealth are used as<br />
markers. In low income countries, disparity is at the<br />
expense of children in rural areas, with the location parity<br />
2016 • GLOBAL EDUCATION MONITORING REPORT 257
14<br />
BOX 14.1<br />
Different measures can lead to different conclusions on inequality<br />
A hypothetical country example is used to explain how different inequality measures can lead to opposite conclusions. It shows the distribution of the<br />
school attendance rate in two years. In 2000, only 5% of the poorest 20% of children attended school, compared with 40% of the richest 20%. In 2010,<br />
20% of the poorest 20% of children attended school, compared with 82% of the richest 20%.<br />
Four indicative inequality measures are calculated:<br />
• The range, i.e. the absolute difference in the value of the attendance rate between the poorest <strong>and</strong> richest 20%. By this measure, inequality<br />
increased from 2000 (35 percentage points) to 2010 (62 percentage points) (Figure 14.1a).<br />
• The ratio, i.e. the attendance rate for the poorest over that for the richest, more commonly known as the parity index, in which a higher value<br />
means lower inequality. This measure would have inequality decreasing from 2000 (0.12) to 2010 (0.24) (Figure 14.1b).<br />
• The odds ratio – the odds of attending school (i.e. the chance of attendance instead of non-attendance) among the richest over the odds of<br />
attending school among the poorest. It would indicate that inequality increased from 2000 (14) to 2010 (18) (Figure 14.1c).<br />
• The concentration index, which takes into account the value of the attendance rate not only among the poorest <strong>and</strong> the richest 20% but for all five<br />
quintiles. It is based on the cumulative distribution of the attendance rate (on the vertical axis) against the cumulative proportion of individuals<br />
ranked from poorest to richest (on the horizontal axis). For example, the poorest 20% were 5% of those attending school in 2000 <strong>and</strong> 10% in 2010.<br />
If there were perfect equality, the latter share would be 20%. The index measures the distance from the line of perfect equality. It would show<br />
inequality decreasing from 2000 (0.40) to 2010 (0.28) (Figure 14.1d).<br />
Selecting a measure needs to be based on careful weighing of the options’ advantages <strong>and</strong> disadvantages.<br />
FIGURE 14.1:<br />
For the same population, different measures can yield opposite conclusions on education inequality<br />
Trends in inequality of school attendance rate, by inequality measure, hypothetical example<br />
a. Range<br />
Inequality increased<br />
b. Ratio (parity index)<br />
Inequality decreased<br />
100<br />
40 - 5 = 35 82 - 20 = 62<br />
100<br />
5 / 40 = 0.12 20 / 82 = 0.24<br />
80<br />
82%<br />
Q5 - Richest<br />
80<br />
82%<br />
Q5 - Richest<br />
Attendance rate (%)<br />
60<br />
40<br />
20<br />
0<br />
40%<br />
Q5 - Richest<br />
Q4<br />
Q3<br />
Q2<br />
5% Q1 - Poorest<br />
2000<br />
20%<br />
Q3<br />
Q2<br />
Q1 - Poorest<br />
2010<br />
Q4<br />
Attendance rate (%)<br />
60<br />
40<br />
20<br />
0<br />
40%<br />
2000<br />
Q5 - Richest<br />
Q4<br />
Q3<br />
Q2<br />
5% Q1 - Poorest<br />
20%<br />
Q4<br />
Q3<br />
Q2<br />
Q1 - Poorest<br />
2010<br />
c. Odds ratio<br />
Inequality increased<br />
d. Concentration index<br />
Inequality decreased<br />
Attendance rate (%)<br />
100<br />
80<br />
60<br />
40<br />
20<br />
0<br />
(40/60) / (5/95) = 14 (82/18) / (20/80) = 18<br />
40%<br />
5%<br />
Q4<br />
Q3<br />
Q2<br />
Q1 - Poorest<br />
2000<br />
Q5 - Richest<br />
82%<br />
20%<br />
Q3<br />
Q2<br />
Q1 - Poorest<br />
2010<br />
Q5 - Richest<br />
Q4<br />
Cumulative distribution of attendance<br />
rate (%)<br />
100<br />
80<br />
60<br />
40<br />
20<br />
0<br />
0<br />
2000: Inequality = (B+C)/(A+B+C) = 0.40<br />
2010: Inequality = (C)/(A+B+C) = 0.28<br />
Equity<br />
C<br />
B<br />
A<br />
2010<br />
2000<br />
20<br />
40 60 80 100<br />
Cumulative distribution of population by wealth (%)<br />
Sources: Cowell, 2010; Vallet <strong>and</strong> Montjourides (2015); O’Donnell et al. (2007).<br />
258<br />
CHAPTER 14 | TARGET 4.5 – EQUITY
14<br />
index equal to 0.86, <strong>and</strong> at the expense of children from<br />
the poorest households, with the wealth parity index<br />
equal to 0.75 (Figures 14.2b <strong>and</strong> 14.2c).<br />
Disparity can also move in the opposite direction.<br />
Among adolescents of lower secondary school age,<br />
75 females for every 100 males complete lower<br />
secondary school in low income countries, but there<br />
are 96 males for every 100 females in upper middle<br />
income countries (Figure 14.2a).<br />
Disparity by wealth is the most extreme. In upper<br />
middle income countries, the wealth parity index of the<br />
completion rate equals 0.90 in primary education, 0.71<br />
in lower secondary <strong>and</strong> 0.44 in upper secondary. In low<br />
income countries, the wealth parity index equals 0.36 in<br />
primary education, 0.19 in lower secondary <strong>and</strong> just 0.07<br />
in upper secondary (Figure 14.2c).<br />
Disparities are much higher for completion than for<br />
attendance. For example, in lower middle income<br />
countries, the wealth parity index is 0.82 for the<br />
attendance rate of adolescents of lower secondary<br />
school age but 0.57 for the lower secondary completion<br />
rate. This suggests that many poorer adolescents still<br />
attend primary school.<br />
Overall, gender disparity appears less severe than<br />
disparity by location or wealth. However, this average<br />
can mask important differences when gender interacts<br />
with either of the other two characteristics. In sub-<br />
Saharan Africa, there is gender parity in the percentage<br />
of those who have ever been to school <strong>and</strong> those who<br />
have completed primary education among the richest<br />
20%. However, among the poorest 20% there were 89<br />
females for every 100 males who had ever been to school<br />
<strong>and</strong> 83 females for every 100 males who had completed<br />
primary education. The disparity widens to 73 females<br />
for lower secondary completion <strong>and</strong> 40 females for upper<br />
secondary completion. By contrast, there is considerable<br />
disparity at the expense of the poorest males in Eastern<br />
<strong>and</strong> South-eastern Asia in lower <strong>and</strong> upper secondary<br />
completion (Figure 14.3).<br />
Changes in the parity index over time can also be<br />
monitored. Between 2000 <strong>and</strong> 2010, across a wide range<br />
of education indicators, Southern Asia made considerable<br />
progress in reducing wealth disparity but sub-Saharan<br />
Africa hardly any; in fact, in upper secondary education,<br />
disparity in the latter region increased, with the value of<br />
the wealth parity index falling from 0.11 in 2000 to 0.09 in<br />
2010 (Figure 14.4).<br />
FIGURE 14.2:<br />
Inequality measures can be calculated for different education indicators <strong>and</strong><br />
population group characteristics<br />
Parity index for selected education indicators, by country income group, 2008–2014<br />
Gender parity index<br />
Location parity index<br />
Wealth parity index<br />
1.2<br />
1.0<br />
0.8<br />
0.6<br />
0.4<br />
0.2<br />
0.0<br />
1.2<br />
1.0<br />
0.8<br />
0.6<br />
0.4<br />
0.2<br />
0.0<br />
1.2<br />
1.0<br />
0.8<br />
0.6<br />
0.4<br />
0.2<br />
0.0<br />
Parity<br />
Parity<br />
Parity<br />
Ever been<br />
to school<br />
Primary<br />
school age<br />
a. By sex: female vs male<br />
b. By location: rural vs urban<br />
c. By wealth: poorest vs richest<br />
Lower<br />
secondary<br />
school age<br />
In school<br />
High income countries<br />
Lower middle income countries<br />
Upper<br />
secondary<br />
school age<br />
Primary<br />
Low income countries<br />
Lower<br />
secondary<br />
Completed school<br />
Upper middle income countries<br />
Source: GEM Report team analysis (2016) based on household survey data.<br />
Upper<br />
secondary<br />
2016 • GLOBAL EDUCATION MONITORING REPORT 259
14<br />
FIGURE 14.3:<br />
Gender disparity is higher among the poorest<br />
Gender parity index for selected education indicators, interaction with wealth, by region, 2008–2014<br />
1.4<br />
1.3<br />
1.2<br />
1.1<br />
Richest<br />
Gender parity index<br />
1.0<br />
0.9<br />
0.8<br />
Parity<br />
Average<br />
Poorest<br />
0.7<br />
0.6<br />
0.5<br />
0.4<br />
Ever been to school<br />
Completed primary<br />
Completed lower secondary<br />
Completed upper secondary<br />
Ever been to school<br />
Completed primary<br />
Completed lower secondary<br />
Completed upper secondary<br />
Ever been to school<br />
Completed primary<br />
Completed lower secondary<br />
Completed upper secondary<br />
Ever been to school<br />
Completed primary<br />
Completed lower secondary<br />
Completed upper secondary<br />
Ever been to school<br />
Completed primary<br />
Ccompleted lower secondary<br />
Completed upper secondary<br />
Ever been to school<br />
Completed primary<br />
Completed lower secondary<br />
Completed upper secondary<br />
Sub-Saharan Africa<br />
Southern Asia<br />
Northern Africa <strong>and</strong><br />
Western Asia<br />
Europe <strong>and</strong><br />
Northern America<br />
Latin America <strong>and</strong><br />
the Caribbean<br />
Eastern <strong>and</strong><br />
South-eastern Asia<br />
Note: Values for Eastern <strong>and</strong> South-eastern Asia <strong>and</strong> for Northern Africa <strong>and</strong> Western Asia refer only to low <strong>and</strong> middle income countries.<br />
Source: GEM Report team analysis (2016) based on household survey data.<br />
FIGURE 14.4:<br />
Education disparity by wealth declined faster in Southern Asia than in sub-Saharan Africa<br />
Wealth parity index for selected education indicators, Southern Asia <strong>and</strong> sub-Saharan Africa, circa 2000 <strong>and</strong> 2010<br />
1.0<br />
Parity<br />
0.9<br />
0.8<br />
2010<br />
Southern Asia<br />
0.7<br />
Wealth parity index<br />
0.6<br />
0.5<br />
0.4<br />
2010<br />
2000<br />
Sub-Saharan<br />
Africa<br />
2000<br />
0.3<br />
0.2<br />
0.1<br />
0<br />
Ever went<br />
to school<br />
Primary<br />
school age<br />
Lower<br />
secondary<br />
school age<br />
Upper<br />
secondary<br />
school age<br />
Into lower<br />
secondary<br />
Into upper<br />
secondary<br />
Primary<br />
Lower<br />
secondary<br />
Upper<br />
secondary<br />
In school<br />
Transitioned<br />
Completed<br />
Source: GEM Report team analysis (2016) based on household survey data.<br />
260<br />
CHAPTER 14 | TARGET 4.5 – EQUITY
14<br />
The parity index must be interpreted cautiously, for<br />
various reasons. For education indicators ranging from<br />
0% to 100%, its value tends to depend on the level of<br />
the indicator, with low inequality being recorded when<br />
the level is high, approaching the ‘ceiling’ (Mingat <strong>and</strong><br />
Ndem, 2014). Thus it risks offering limited information,<br />
as knowing the level of education development (e.g. the<br />
level of the primary completion rate) can predict, to a<br />
large extent, the level of inequality.<br />
Plotting the primary completion rate against the wealth<br />
parity index illustrates this (Figure 14.5). It would be<br />
misleading to compare the value of the index of two<br />
countries, such as Honduras <strong>and</strong> Mauritania, at different<br />
completion rate levels <strong>and</strong> conclude that the latter<br />
country is more unequal. However, the index is useful to<br />
analyse inequality between countries at similar levels of<br />
education development: for example, the wealth parity<br />
index of the primary school completion rate was only<br />
0.27 in Pakistan, compared with 0.56 in the Gambia.<br />
Also, the parity index, by comparing two groups, only<br />
uses a small part of available information. To show how<br />
an education indicator is distributed in a population<br />
ranked by a characteristic such as wealth (from poorest<br />
to richest), the concentration index can be used (Figure<br />
14.1d). Its calculation is based on the area between<br />
the concentration curve (which shows the actual<br />
distribution) <strong>and</strong> the diagonal line (which shows perfect<br />
equality): the farther a line is to the right of the diagonal,<br />
the higher the inequality.<br />
For example, with respect to the distribution of the lower<br />
secondary education completion rate in sub-Saharan Africa<br />
by wealth in 2000 <strong>and</strong> 2010, the poorest 40% of young<br />
<strong>people</strong> represented less than 20% of lower secondary<br />
school completers. According to this measure, inequality<br />
fell overall between 2000 <strong>and</strong> 2010, as the curve moved<br />
closer towards the diagonal. However, the two concentration<br />
curves intersect, showing that the middle classes<br />
benefited most, while the poorest did worse (Figure 14.6).<br />
Many governments have insufficient underst<strong>and</strong>ing<br />
of the need to monitor, report <strong>and</strong> act on education<br />
inequality. However, it is expected that the 2030<br />
Agenda’s focus on leaving no one behind will lead to a<br />
FIGURE 14.5:<br />
The parity index as a measure of education inequality needs to be interpreted cautiously<br />
Primary education completion rate <strong>and</strong> wealth parity index, selected low <strong>and</strong> middle income countries, 2008–2014<br />
1<br />
0.9<br />
0.8<br />
0.7<br />
Wealth parity index<br />
0.6<br />
0.5<br />
0.4<br />
Gambia<br />
Honduras<br />
0.3<br />
0.2<br />
Mauritania<br />
Pakistan<br />
0.1<br />
0<br />
0 10 20 30 40 50 60 70 80 90 100<br />
Primary completion rate (%)<br />
Source: GEM Report team analysis (2016) based on household survey data.<br />
2016 • GLOBAL EDUCATION MONITORING REPORT 261
14<br />
major shift. The increasing availability of household <strong>and</strong><br />
school-based surveys makes it possible to carry out indepth<br />
analyses both within <strong>and</strong> between countries.<br />
Nevertheless, distinct challenges remain for monitoring<br />
equal access to all education levels. The multiplicity of<br />
FIGURE 14.6:<br />
Much nuance in education inequality is lost using simple measures<br />
Concentration curve of the lower secondary education completion rate,<br />
sub-Saharan Africa, 2000 <strong>and</strong> 2010<br />
Cumulative distribution of lower secondary completion rate (%)<br />
100<br />
90<br />
80<br />
70<br />
60<br />
50<br />
40<br />
30<br />
20<br />
10<br />
0<br />
0<br />
Wealthier middle<br />
class individuals<br />
were better off<br />
in 2010<br />
Equity<br />
2000<br />
2010<br />
Poor individuals were<br />
worse off in 2010<br />
10 20 30 40 50 60 70 80 90 100<br />
Cumulative distribution of individuals by wealth (%)<br />
Source: GEM Report team analysis (2016) based on household survey data.<br />
education indicators, inequality measures, individual<br />
characteristics <strong>and</strong> their combinations means hundreds<br />
of estimates could be reported, too many to be useful.<br />
It is therefore necessary to agree on a limited number of<br />
key inequality measures. Consensus by the international<br />
community is also needed to generate consistent<br />
estimates from household surveys. Some important<br />
steps have been taken in that direction (Box 14.2).<br />
GENDER<br />
Ensuring that boys <strong>and</strong> girls participate in education<br />
at equivalent rates featured prominently in the MDG<br />
<strong>and</strong> Education for All (EFA) agendas. Genuine progress<br />
was achieved in gender parity in primary <strong>and</strong> secondary<br />
education, although global or regional averages have<br />
masked continuing disparity in two respects.<br />
First, while parity was achieved globally, on average, in<br />
2014 in primary, lower secondary <strong>and</strong> upper secondary<br />
education, only 63% of individual countries achieved<br />
parity in primary, 46% in lower secondary <strong>and</strong> 23% in<br />
upper secondary (Table 14.1). Second, as the previous<br />
section showed, national averages mask disparity within<br />
countries between particular groups. Poor females (<strong>and</strong><br />
males as well), particularly from rural areas or minority<br />
ethnic groups, often face big obstacles. Third, <strong>and</strong> most<br />
importantly, despite progress towards parity, gender<br />
equality in education is a much broader issue. This is<br />
where attention is now needed.<br />
TABLE 14.1:<br />
Gender parity index, by region <strong>and</strong> country income group, 2014<br />
Primary education Lower secondary education Upper secondary educaation<br />
Gender parity index Countries with parity (%) Gender parity index Countries with parity (%) Gender parity index Countries with parity (%)<br />
World 0.99 63 0.99 46 0.98 23<br />
Low income 0.93 31 0.86 9 0.74 5<br />
Lower middle income 1.02 52 1.02 33 0.93 17<br />
Upper middle income 0.97 70 1.00 60 1.06 22<br />
High income 1.00 81 0.99 59 1.01 37<br />
Caucasus <strong>and</strong> Central Asia 0.99 100 0.99 83 0.98 29<br />
Eastern <strong>and</strong> South-eastern Asia 0.99 86 1.01 57 1.01 37<br />
Europe <strong>and</strong> Northern America 1.00 93 0.99 67 1.01 31<br />
Latin America <strong>and</strong> the Caribbean 0.98 48 1.03 39 1.13 19<br />
Northern Africa <strong>and</strong> Western Asia 0.95 56 0.93 46 0.96 33<br />
Pacific 0.97 64 0.95 44 0.94 0<br />
Southern Asia 1.06 29 1.04 25 0.94 38<br />
Sub-Saharan Africa 0.93 38 0.88 19 0.82 6<br />
Note: All values shown are medians.<br />
Source: UIS database.<br />
262<br />
CHAPTER 14 | TARGET 4.5 – EQUITY
14<br />
BOX 14.2<br />
The Inter-Agency Group on Education Inequality Indicators<br />
The increasing availability of household surveys has made it possible to analyse disparity within <strong>and</strong> between countries. The 2012 launch of the World Inequality<br />
Database on Education (WIDE) by the EFA Global Monitoring Report (GMR) marked an innovative development for visualizing the stark differences in education between<br />
advantaged <strong>and</strong> disadvantaged groups. Using WIDE, this year’s Global Education Monitoring Report (GEM Report) shows averages for regions <strong>and</strong> country income groups<br />
that cover more than 90% of the global population.<br />
At the same time, the GEM Report team observed that this rich information is being used inefficiently at the global level. In the absence of common methodology,<br />
agencies are producing different estimates of the same indicators from the same data sources. Consensus remains elusive on definitions of key survey-based<br />
indicators – <strong>and</strong> too few of the available household survey data sources are being used.<br />
This contrasts with other sectors, where agencies collaborate to reach consensus on estimates of key socio-economic variables. For example, the Roll Back Malaria<br />
Partnership, the inter-agency team on joint child malnutrition estimates <strong>and</strong> the Joint Monitoring Programme for Water Supply <strong>and</strong> Sanitation have been generating<br />
global reference statistics, in the last case for more than 25 years.<br />
Accordingly, the GEM Report team presented a proposal at the World Education Forum in Incheon, Republic of Korea, in May 2015, within the framework of the<br />
Technical Advisory Group on post-2015 education indicators. It called on key institutions to agree on a harmonized set of definitions <strong>and</strong> methods to enable the<br />
international community to report official estimates on education inequality, in line with SDG objectives.<br />
The Inter-Agency Group on Education Inequality Indicators first convened in<br />
April 2016, led by the UNESCO Institute for Statistics (UIS), UNICEF <strong>and</strong> the<br />
World Bank. Its goal is to ‘promote <strong>and</strong> coordinate the use of household survey<br />
data for education monitoring purposes at the global, regional <strong>and</strong> national<br />
level, ensuring st<strong>and</strong>ardized analysis <strong>and</strong> reporting in order to complement<br />
evidence available through administrative data’. It has committed to producing<br />
a first report by the end of 2017, with results covering three indicators related<br />
to target 4.1: completion rate, out-of-school rate <strong>and</strong> over-age rate at the<br />
primary, lower secondary <strong>and</strong> upper secondary education levels.<br />
This is a modest but promising start. The group’s success will rest on partners’<br />
ability to pool resources, including currently underused data sources. An<br />
agreement between UIS <strong>and</strong> the World Bank to tap the latter’s rich databases<br />
is a step in the right direction. It is also essential to gradually target activities<br />
to build countries’ capacity to contribute to, <strong>and</strong> learn from, the estimation of<br />
survey-based education indicators.<br />
FIGURE 14.7:<br />
What is the primary completion rate in Nigeria?<br />
Primary education completion rate, Nigeria, 1980–2013<br />
Primary completion rate (%)<br />
100<br />
90<br />
80<br />
70<br />
60<br />
50<br />
40<br />
30<br />
1999<br />
2003<br />
2011<br />
2008<br />
2013<br />
2007<br />
DHS<br />
MICS<br />
Finally, the group needs to make effective use of existing information. For<br />
example, in Nigeria, there have been four DHS rounds <strong>and</strong> two MICS rounds in<br />
less than 15 years, on top of national household surveys that collect education<br />
information. However, surveys do not always produce consistent results on<br />
levels <strong>and</strong> trends, even on basic indicators such as the primary completion rate<br />
(Figure 14.7). The experience of other groups could be useful. The Inter-Agency<br />
Group for Child Mortality Estimation uses several sources to produce a single<br />
estimate for each country <strong>and</strong> year, assigning weights to each data source<br />
depending on their quality <strong>and</strong> reliability.<br />
20<br />
10<br />
0<br />
1980<br />
1985 1990 1995 2000 2005 2010 2013<br />
Notes: The analysis is based on six household surveys carried out in 1999–2013.<br />
The primary completion rate estimates are based on a retrospective cohort<br />
analysis over 20 years prior to the year of the survey. For example, for a survey<br />
carried out in 2000, the estimated completion rate for 1999 refers to 15-yearolds<br />
while the estimated completion rate for 1980 refers to 35-year-olds.<br />
Source: GEM Report team analysis (2016) based on household survey data.<br />
Sources: Alkema et al. (2014); UIS (2016); UNICEF et al. (2012);<br />
UNICEF <strong>and</strong> WHO (2015).<br />
2016 • GLOBAL EDUCATION MONITORING REPORT 263
14<br />
BEYOND PARITY: MEASURING SUBSTANTIVE<br />
GENDER EQUALITY IN EDUCATION<br />
The formulation of target 4.5 does not refer to gender<br />
equality in education unlike the fifth EFA goal. The<br />
formulation of SDG 5 <strong>and</strong> its targets on gender equality<br />
is much stronger. Moreover, the Education 2030<br />
Framework for Action explicitly recognizes gender<br />
equality as a guiding principle, linked to the realization of<br />
the right to education <strong>and</strong> referring to the need for girls<br />
<strong>and</strong> boys, women <strong>and</strong> men, to be equally empowered ‘in<br />
<strong>and</strong> through education’ (UNESCO, 2015b).<br />
Equalizing education access for all girls <strong>and</strong> boys is<br />
a crucial first step towards realizing gender equality<br />
in education <strong>and</strong> the intrinsic right to education for<br />
all. Yet, schools, as concrete institutions in education,<br />
can reproduce existing gender inequality rather than<br />
challenge it (Murphy-Graham, 2009). This can manifest<br />
through teacher behaviour, expectations <strong>and</strong> interactions<br />
with male <strong>and</strong> female students; peer group norms; the<br />
curriculum (whether gender is explicitly addressed or<br />
not); the distribution of education resources; <strong>and</strong> school<br />
structure, organization <strong>and</strong> management.<br />
In addition to reducing disparity in education attendance<br />
<strong>and</strong> completion, education for gender equality entails<br />
building knowledge <strong>and</strong> skills to empower disadvantaged<br />
girls or boys, depending on context. Students <strong>and</strong><br />
teachers need to reflect on existing norms <strong>and</strong> traditions<br />
<strong>and</strong> be encouraged to challenge them. Gender-based<br />
discrimination <strong>and</strong> violence need to be addressed.<br />
Healthy life choices should be supported, including with<br />
regards to sexual <strong>and</strong> reproductive health. Interventions<br />
to achieve these results can take place through teacher<br />
training <strong>and</strong> curricular reform, among other means.<br />
In addition to educational opportunities, five other<br />
domains help frame the discussion of gender equality<br />
in education. These include gender norms, values <strong>and</strong><br />
attitudes (many of which can be influenced through<br />
education); institutions outside the education system; laws<br />
<strong>and</strong> policies in education systems; resource distribution;<br />
<strong>and</strong> teaching <strong>and</strong> learning practices (Unterhalter, 2015).<br />
The adoption of the parity index by the Inter-agency <strong>and</strong><br />
Expert Group on SDG Indicators to monitor the gender<br />
aspects of target 4.5 extends its use beyond enrolment<br />
ratios to all education indicators, including learning<br />
outcomes. While this is positive, there are indicators that<br />
could track equality across all six domains using available<br />
<strong>and</strong> often globally comparable data (Table 14.2).<br />
Well-established indicators exist on norms, highlighting<br />
contextual factors with a direct impact on gender<br />
equality in <strong>and</strong> outside education (UNICEF, 2014c; Loaiza<br />
<strong>and</strong> Liang, 2013). For example, 45% of women aged 20<br />
to 24 in South Asia were married before age 18 (UNICEF,<br />
2015e). The World Values Survey suggests that women<br />
in countries with great gender inequality are more likely<br />
to agree that a university education is more important<br />
for boys than girls, <strong>and</strong> that men have more right to jobs<br />
when they are scarce (Bhatkal, 2014). Among adult men,<br />
20% in Croatia, 43% in Brazil, 66% in Rw<strong>and</strong>a <strong>and</strong> 81% in<br />
India believed a man should have the final word about<br />
decisions in the home (ICRW <strong>and</strong> Instituto Promundo,<br />
2011). The global lifetime prevalence of intimate partner<br />
violence among women who have ever had a partner is<br />
30% (WHO, 2013). The share of women aged 15 to 49 who<br />
say a husb<strong>and</strong> is justified in hitting or beating his wife<br />
TABLE 14.2:<br />
Potential indicators of gender inequality in education, by<br />
domain<br />
Domain<br />
Educational opportunities<br />
Gender norms, values <strong>and</strong> attitudes<br />
e.g. sexual <strong>and</strong> reproductive health<br />
decisions; women’s autonomy <strong>and</strong><br />
empowerment: domestic violence;<br />
household expenditure decisions<br />
Institutions outside education<br />
e.g. legislation forbidding gender-based<br />
discrimination<br />
Laws <strong>and</strong> policies in education systems<br />
e.g. guarantees of the right to education<br />
for girls <strong>and</strong> women<br />
Resource distribution<br />
e.g. gender parity in teacher pay,<br />
water <strong>and</strong> sanitation, training, learning<br />
materials<br />
Teaching <strong>and</strong> learning practices<br />
e.g. teacher <strong>and</strong> student gender-related<br />
attitudes <strong>and</strong> interactions<br />
Source: Based on Peppin Vaughan et al. (2016).<br />
Indicator<br />
• Gender parity index on enrolment, transition <strong>and</strong><br />
completion rates, <strong>and</strong> learning outcomes (alone or gender<br />
interacting with location <strong>and</strong> wealth)<br />
• Percentage of population aged 20 to 24 married before<br />
age 18<br />
• Percentage of women aged 20 to 24 who had a live birth<br />
before age 15 to 18<br />
• Percentage who agree with statement ‘A university<br />
education is more important for a boy than for a girl’ (e.g.<br />
World Values Survey)<br />
• Percentage who agree with statement ‘If a wife burns<br />
the food, a husb<strong>and</strong> is justified in hitting her’ (e.g. DHS<br />
<strong>and</strong> MICS)<br />
• Degree of decision-making on family planning<br />
• Degree of decision-making on earnings <strong>and</strong> household<br />
expenditure<br />
• Labour force participation rate or employment rate<br />
• Percentage of women in leadership positions in political<br />
<strong>and</strong> economic life<br />
• Whether the constitution contains at least one approach<br />
to gender equality<br />
• Whether the country is a signatory of the Convention on<br />
the Elimination of All Forms of Discrimination Against<br />
Women (CEDAW)<br />
• Social Institutions <strong>and</strong> Gender Index (SIGI) results<br />
• Whether the constitution protects the right to education<br />
regardless of gender<br />
• Whether the country has a policy on gender equality in<br />
education<br />
• Percentage of women in school leadership <strong>and</strong><br />
management positions<br />
• Gender parity in teacher education graduates by sector<br />
<strong>and</strong> level<br />
• Gender parity in teacher employment by sector <strong>and</strong> level<br />
• Gender parity in teacher pay by sector <strong>and</strong> level<br />
• Percentage of single-sex toilets<br />
• Percentage of poor girls (or boys) who receive incentives to<br />
attend school (cash transfers, stipends, scholarships)<br />
• Percentage of teachers who received training in gender<br />
sensitivity<br />
• Percentage of countries that include gender equality topics<br />
in their curricula (gender discrimination, gender roles,<br />
violence, sexual <strong>and</strong> reproductive health)<br />
264<br />
CHAPTER 14 | TARGET 4.5 – EQUITY
14<br />
for at least one of five reasons (e.g. burning the food)<br />
was 75% in the Democratic Republic of the Congo, 60% in<br />
Tajikistan <strong>and</strong> 49% in Yemen (UNICEF, 2016a).<br />
Regarding institutions outside education, annual national<br />
implementation reports on the Convention on the<br />
Elimination of All Forms of Discrimination against Women<br />
(CEDAW) provide information on legislation forbidding<br />
gender-based discrimination. The Social Institutions <strong>and</strong><br />
Gender Index (SIGI) is based on formal <strong>and</strong> informal laws,<br />
attitudes <strong>and</strong> practices that restrict women’s <strong>and</strong> girls’<br />
access to rights, justice <strong>and</strong> empowerment opportunities<br />
across 160 countries. Focusing on discriminatory family<br />
codes, restricted physical integrity, son bias, restricted<br />
resources <strong>and</strong> assets, <strong>and</strong> restricted civil liberties, it<br />
collects information on laws, attitudes <strong>and</strong> practices. It<br />
finds that 17 of 108 countries have very high levels of<br />
discrimination against women (OECD, 2014b).<br />
An important basis for underst<strong>and</strong>ing gender equality in<br />
education is analysis of aspects of teaching <strong>and</strong> learning<br />
practices. The extent of gender equality in curricula<br />
<strong>and</strong> textbooks can be captured as part of research<br />
studies based on expert reviews (see Chapter 16). In<br />
the case of teaching practice, classroom observations<br />
are necessary but are costly<br />
<strong>and</strong> not easy to generalize.<br />
In Malawi, as part of an early<br />
In Malawi, 28% of<br />
grade reading project, almost<br />
5,000 teachers 5,000 grade 1–3 teachers were<br />
observed in 11 observed in 11 districts in 2014;<br />
of those, 28% were found<br />
districts were<br />
not to use appropriate <strong>and</strong><br />
found not to use gender-sensitive language. In<br />
appropriate <strong>and</strong> the northern Nigerian states<br />
of Bauchi <strong>and</strong> Sokoto, 25%<br />
gender-sensitive<br />
of teachers did not provide<br />
language<br />
equal opportunities to boys<br />
<strong>and</strong> girls to speak in class (RTI<br />
International, 2016).<br />
From the learner’s point of view, evidence from surveys<br />
in the Programme for International Student Assessment<br />
(PISA) suggests that girls tend to have a much lower<br />
belief in their ability to solve specific mathematics tasks<br />
than boys, as well as in their mathematics abilities.<br />
Across OECD countries, boys were 11 percentage points<br />
more likely than girls to agree or strongly agree that<br />
school advanced science topics were easy for them<br />
(OECD, 2015a).<br />
Priorities for monitoring substantive gender equality<br />
There are two priorities for improving monitoring of<br />
gender equality in education. First, efforts need to<br />
focus on collecting more comprehensive data on gender<br />
aspects of curricula, textbooks, assessments <strong>and</strong> teacher<br />
education. In addition, consensus is needed on what<br />
aspects of gender sensitivity in teaching practice could<br />
be included in classroom observation tools (see Chapter<br />
10). Such efforts would benefit by being embedded within<br />
the framework of gender-responsive sector planning,<br />
as in the case of the recent collaboration between the<br />
Global Partnership on Education <strong>and</strong> the United Nations<br />
Girls’ Education Initiative (GPE <strong>and</strong> UNGEI, 2013).<br />
Second, closer links are needed between those working<br />
on indicators on gender equality in education <strong>and</strong> those<br />
focusing on broader indicators of gender equality (UN<br />
Women, 2015). Wider dissemination of findings <strong>and</strong><br />
discussion with international bodies concerned with<br />
women’s rights are needed. The Commission on the<br />
Status of Women would be an appropriate forum for<br />
discussion of how to enhance links between SDG 5 <strong>and</strong><br />
education reforms.<br />
To reach consensus on how best to measure substantive<br />
gender equality in education, <strong>and</strong> to establish a process<br />
for collaborating <strong>and</strong> sharing practice, it is important to<br />
form a working group on measurement methodology – it<br />
could include UIS, UNGEI <strong>and</strong> UN Women – as well as<br />
build a transnational network for groups concerned with<br />
gender equality in education to share strategies related<br />
to global progress on measurement.<br />
DISABILITY<br />
People with disabilities are among the most<br />
marginalized <strong>and</strong> excluded groups <strong>and</strong> are routinely<br />
denied their right to education of good quality. The<br />
2006 Convention on the Rights of Persons with<br />
Disabilities commits governments to ensure an inclusive<br />
education system at all levels (United Nations, 2006).<br />
The SDG agenda also focuses on disability <strong>and</strong> target<br />
4.5 specifically commits all countries to ensure equal<br />
access to all levels of education <strong>and</strong> vocational training,<br />
regardless of disability status. However, determining<br />
progress depends on an operational <strong>and</strong> internationally<br />
comparable measure of disability, which has remained<br />
elusive, because disability has diverse forms <strong>and</strong> there are<br />
important ethical <strong>and</strong> cost considerations. Still, progress<br />
has been made.<br />
2016 • GLOBAL EDUCATION MONITORING REPORT 265
14<br />
Cross-country comparisons are complicated by differences<br />
in classification systems. In education, the concept of<br />
special educational needs is commonly used, which is<br />
broader than the concept of disability: in some countries,<br />
it includes children from other socially marginalized<br />
groups. Across 30 education systems in Europe, 3.7% of<br />
compulsory education pupils were identified as having<br />
a special educational need in 2010. It was less than 2%<br />
in Sweden <strong>and</strong> almost 12% in Lithuania. Considerable<br />
variation can be observed even within one country – in<br />
the United Kingdom, it ranged from 2.8% in Engl<strong>and</strong> to<br />
7% in Scotl<strong>and</strong> – <strong>and</strong> over time, with Estonia, for instance,<br />
reporting 19% of children having special educational<br />
needs in 2008 but 9% in 2010 when a different definition<br />
was used. Policies vary considerably. More than 40% of<br />
students with special educational needs overall were<br />
in special schools, but the share was more than 80%<br />
in Belgium <strong>and</strong> Germany <strong>and</strong> almost zero in Italy <strong>and</strong><br />
Norway (NESSE, 2012) (Figure 14.8).<br />
Two approaches have sought to develop a common<br />
classification framework. In the first, the OECD asked<br />
countries to reorganize their national classification<br />
systems into three categories: (a) ‘disabilities’, which<br />
have organic origins <strong>and</strong> for which there is substantial<br />
agreement about categories (e.g. sensory, motor, severe,<br />
profound intellectual disabilities); (b) ‘difficulties’, which<br />
do not appear to have organic origins or to be directly<br />
FIGURE 14.8:<br />
Perceptions <strong>and</strong> responses to special educational needs<br />
Percentage of pupils with special needs <strong>and</strong> percentage of those who attend<br />
special schools, selected educational systems in Europe, 2010<br />
Share of pupils with special educational needs<br />
in separate special shools (%)<br />
100<br />
Belgium, French community<br />
80<br />
Germany Belgium, Flemish community<br />
Latvia<br />
Slovenia<br />
Netherl<strong>and</strong>s<br />
60<br />
Bulgaria<br />
Pol<strong>and</strong><br />
Luxembourg<br />
Austria Hungary<br />
40<br />
Czech Rep.<br />
UK, Engl<strong>and</strong><br />
Denmark Switzerl<strong>and</strong><br />
Estonia<br />
20<br />
Greece UK, Wales<br />
UK, Scotl<strong>and</strong><br />
Spain France<br />
Irel<strong>and</strong><br />
Finl<strong>and</strong><br />
Sweden Italy Portugal Lithuania<br />
Malta Cyprus<br />
Norway<br />
0<br />
0<br />
2 4 6 8 10<br />
Share of pupils with special educational needs in total<br />
compulsory education pupil population (%)<br />
Source: NESSE (2012).<br />
12<br />
linked to socio-economic, cultural or linguistic factors<br />
(e.g. behavioural difficulties, mild learning difficulties,<br />
dyslexia); <strong>and</strong> (c) ‘disadvantages’, which arise from<br />
socio-economic, cultural <strong>and</strong>/or linguistic factors (OECD,<br />
2005b).<br />
This approach resulted in unexpected variation. For<br />
example, under the tightly defined ‘disabilities’ category,<br />
the average percentage of primary education students<br />
who received additional resources in 2001 was 2.5%, but<br />
the range was from 0.5% in the Republic of Korea <strong>and</strong><br />
Turkey to 6.1% in the United States. The range under the<br />
other two categories was much broader (e.g. an average<br />
of 2.1% of students with ‘difficulties’, ranging from zero in<br />
Italy to 19% in Engl<strong>and</strong>, United Kingdom), revealing very<br />
different applications of the terms (OECD, 2005b).<br />
The second approach is the International Classification<br />
of Functioning, Disability <strong>and</strong> Health (ICF), adopted<br />
by the World Health Assembly in 2001. Based on the<br />
bio-psychosocial model, which defines disability as a<br />
result of the interaction between the features of a person<br />
<strong>and</strong> those of the environment in which that person lives,<br />
ICF assesses disability in terms of: body functions <strong>and</strong><br />
structures; activities (execution of tasks or actions)<br />
<strong>and</strong> participation (involvement in a life situation); <strong>and</strong><br />
contextual factors.<br />
The ICF covers a detailed framework of thous<strong>and</strong>s of<br />
subdomains, which in practice are difficult to measure.<br />
A set of principles is recommended for an operational<br />
measure of disability in large-scale population surveys.<br />
Questions are to focus on functional limitations (instead<br />
of disability) <strong>and</strong> responses should be scaled, instead<br />
of a yes-no choice (Mont, 2007). The Washington<br />
Group on Disability Statistics, under the auspices of<br />
the United Nations Statistical Division, has tried to<br />
adapt the ICF framework into a module that assesses<br />
six adult functioning domains: seeing, hearing,<br />
walking, remembering/concentrating, self-caring, <strong>and</strong><br />
communicating (Washington Group, 2006).<br />
The Washington Group also recognized that<br />
assessing disability among children required different<br />
methodologies, so they developed the Module on Child<br />
Functioning in collaboration with UNICEF. It is made up<br />
of questions to be answered by mothers or by primary<br />
caregivers of children aged 2 to 4 <strong>and</strong> 5 to 17 (Washington<br />
Group <strong>and</strong> UNICEF, 2014). Assessed domains included<br />
seeing, hearing, mobility/walking, attention, learning,<br />
communicating, self-care, motor skills, emotions,<br />
266<br />
CHAPTER 14 | TARGET 4.5 – EQUITY
14<br />
behaviour, play, development of relationships <strong>and</strong> coping<br />
with change. Where appropriate, respondents are asked<br />
to compare the functional difficulties of their child with<br />
those of a child of similar age (Table 14.3).<br />
The module underwent extensive cognitive <strong>and</strong> field<br />
testing between 2012 <strong>and</strong> 2016. For example, it was field<br />
tested with questions on 12 domains in Samoa as part<br />
of the 2014 DHS. It showed that 2.7% of 5- to 9-year-olds<br />
were unable to function at all in at least one domain,<br />
while 5.3% faced a lot of difficulty in at least one domain<br />
(Loeb, 2015). A parallel validation process is incorporating<br />
the module into the next round of UNICEF’s MICS.<br />
In 2016, the development of guidelines for producing<br />
statistics on children with disabilities <strong>and</strong> a user manual<br />
with technical information for implementation are due to<br />
be completed.<br />
An operational measure of disability is important to keep<br />
the education challenges of individuals with disabilities<br />
high on the global agenda. But other steps are needed.<br />
To ensure that education is inclusive, educators must<br />
be better prepared <strong>and</strong> school infrastructures properly<br />
adapted to address the needs of individuals with<br />
disabilities (see Chapter 17). Monitoring these aspects is<br />
important to ensure that schools <strong>and</strong> teachers do not<br />
leave any learners behind.<br />
TABLE 14.3:<br />
Selected questions from the Washington Group/UNICEF<br />
Survey Module on Child Functioning<br />
Seeing domain<br />
1a. Does (name) wear glasses?<br />
1b. When wearing his/her glasses, does<br />
(name) have difficulty seeing?<br />
1c. Does (name) have difficulty seeing?<br />
Mobility domain<br />
2a. Does (name) use any equipment or<br />
receive assistance for walking?<br />
2b. Without using his/her equipment or<br />
assistance, does (name) have difficulty<br />
walking 100/500 meters on level ground?<br />
2c. When using his/her equipment or<br />
assistance, does (name) have difficulty<br />
walking 100/500 meters on level ground?<br />
2d. Compared with children of the same age,<br />
does (name) have difficulty walking 100/500<br />
meters on level ground?<br />
Coping with change domain<br />
3. Does (name) have difficulty accepting<br />
changes in his/her routine?<br />
Source: UNICEF (2016b).<br />
(If no, skip to question 1c)<br />
Would you say (name) has: no difficulty, some difficulty,<br />
a lot of difficulty or cannot do at all?<br />
Would you say (name) has: no difficulty, some difficulty,<br />
a lot of difficulty or cannot do at all?<br />
(If no, skip to question 2d)<br />
Would you say (name) has: no difficulty, some difficulty,<br />
a lot of difficulty or cannot do at all?<br />
Would you say (name) has: no difficulty, some difficulty,<br />
a lot of difficulty or cannot do at all?<br />
Would you say (name) has: no difficulty, some difficulty,<br />
a lot of difficulty or cannot do at all?<br />
Would you say (name) has: no difficulty, some difficulty, a<br />
lot of difficulty or cannot do at all?<br />
LANGUAGE<br />
In most multilingual countries, many children are taught<br />
<strong>and</strong> tested in languages they do not speak at home,<br />
hindering their early acquisition of reading <strong>and</strong> writing<br />
proficiency. Their parents may lack literacy skills or<br />
familiarity with the language of instruction, 1 reinforcing<br />
learning opportunity gaps between linguistic groups<br />
(UNESCO, 2016d).<br />
Evidence suggests the most effective language education<br />
policy involves the use of a child’s first 2 or home language<br />
in the early years of schooling, alongside the introduction<br />
of a second one, 3 both as subject <strong>and</strong>, later, as a parallel<br />
medium of instruction. Implementation of such a policy<br />
has been found to improve performance in the second<br />
language as well as in other subjects (Benson, 2016).<br />
Recent studies also highlight the importance of sustained<br />
use of the first or home language as a medium of<br />
instruction for at least six years of schooling – increasing<br />
to eight years in resource-poor contexts (Heugh et al.,<br />
2007; Ouane <strong>and</strong> Glanz, 2011).<br />
One proposed thematic indicator under target 4.5 is<br />
the percentage of primary education students whose<br />
first or home language is used as language of instruction.<br />
Collecting reliable information on this is not easy or<br />
straightforward. By combining population statistics,<br />
language demographics <strong>and</strong> language in education<br />
policies, the Human Development Report estimated that<br />
35% of <strong>people</strong> did not have access to primary education<br />
in their mother tongue in 2000 (UNDP, 2004). A more<br />
recent study concluded that about 40% of <strong>people</strong> around<br />
the world do not have access to instruction in a language<br />
they speak or underst<strong>and</strong> (Walter <strong>and</strong> Benson, 2012).<br />
This could be expected; populations are growing faster in<br />
parts of the world where fewer <strong>people</strong> are taught in their<br />
mother tongue.<br />
In linguistically diverse countries <strong>and</strong> regions, language<br />
in education issues are especially salient. Of the<br />
25 countries with the highest index of linguistic diversity,<br />
20 were in sub-Saharan Africa <strong>and</strong> the remainder in<br />
South-eastern Asia, the Pacific <strong>and</strong> Southern Asia<br />
(Figure 14.9). These issues are also vocally debated in<br />
many countries in Europe <strong>and</strong> Northern America, where<br />
a large share of students from immigrant families have<br />
particular educational needs.<br />
A starting point for monitoring language policies in<br />
primary <strong>and</strong> secondary education is the systematic<br />
2016 • GLOBAL EDUCATION MONITORING REPORT 267
14<br />
FIGURE 14.9:<br />
Linguistic diversity is greatest in countries in sub-Saharan Africa<br />
Index of linguistic diversity<br />
Population<br />
FIGURE 14.10:<br />
Use of local languages is rising in sub-Saharan Africa, but most countries<br />
are far from nationwide mother tongue instruction<br />
Scale of language of instruction use in primary education, anglophone <strong>and</strong><br />
francophone countries in sub-Saharan Africa, 1960–2010<br />
Scale of language use in education<br />
10<br />
8<br />
4<br />
0<br />
1 billion<br />
100 million<br />
10 million<br />
1 million<br />
100,000<br />
9<br />
7<br />
6<br />
5<br />
3<br />
2<br />
1<br />
10,000<br />
1960<br />
0.0<br />
1965<br />
1970<br />
Brazil<br />
Mexico<br />
0.1 0.2 0.3 0.4 0.5<br />
Anglophone countries<br />
Francophone countries<br />
Mali<br />
1975<br />
1980<br />
1985<br />
1990<br />
1995<br />
2000<br />
China<br />
Bangladesh<br />
Egypt<br />
< Least diverse Index of linguistic diversity<br />
Most diverse ><br />
2005<br />
2010<br />
Several local languages (exclusive)<br />
One local language (exclusive)<br />
Several local languages (generalized)<br />
One local language (generalized)<br />
Several local languages (expansion)<br />
One local language (expansion)<br />
Several local languages (experimentation)<br />
One local language (experimentation)<br />
Foreign African language only<br />
European <strong>and</strong> foreign African language<br />
(e.g. classical Arabic)<br />
European language only<br />
Notes: ‘Experimentation’ (levels 3 <strong>and</strong> 4) refers to government-authorized pilot<br />
programmes to promote one or more local languages in a h<strong>and</strong>ful of schools. ‘Expansion’<br />
refers to a significant increase in the number of schools participating (levels 5 <strong>and</strong> 6).<br />
‘Generalized’ refers to nationwide implementation of such programmes, usually in the<br />
early years before transition to an international language. ‘Exclusive’ refers to situations<br />
where one or more local language is used as the medium of education throughout the<br />
primary cycle, <strong>and</strong> the foreign language is taught only as a subject.<br />
Source: Albaugh (2012).<br />
0.6<br />
Pakistan<br />
Indonesia<br />
Nigeria<br />
0.7 0.8 0.9 1.0<br />
Notes: The index of linguistic diversity is the probability that two <strong>people</strong> selected from the<br />
population at r<strong>and</strong>om will have different mother tongues; it ranges from 0 (everyone has<br />
the same mother tongue) to 1 (no two <strong>people</strong> have the same mother tongue). Sub-Saharan<br />
African countries are marked in orange. The population axis is in the logarithmic scale.<br />
Source: Lewis et al. (2016).<br />
India<br />
<strong>and</strong> regular mapping of official policy documents, the<br />
national constitution <strong>and</strong> laws related to linguistic<br />
<strong>and</strong> cultural groups. A recent study of policy changes<br />
in sub-Saharan Africa over 1960–2010 showed that at<br />
the time of countries’ independence, 20 (or 43%) out of<br />
43 sub-Saharan African countries used local languages<br />
in primary education, compared with 38 (80%) now<br />
(Albaugh, 2012, 2015). This study suggests convergence<br />
towards high levels of local language use across the<br />
region. But it also points to the different routes followed<br />
by francophone <strong>and</strong> anglophone countries in this region.<br />
Though progress in anglophone countries has slowed,<br />
they are ahead of francophone countries; local languages<br />
are gaining strength in the latter, influenced by advocacy<br />
by local actors, but not enough to catch up (Figure 14.10).<br />
Information for many countries can be found in the<br />
online catalogue L’aménagement linguistique dans le<br />
monde (Language planning around the world), which<br />
shows the status of language in national education<br />
policies, legislation <strong>and</strong> constitutions (Leclerc, 2016). Until<br />
2011, the International Bureau of Education’s World Data<br />
on Education compiled information from weekly lesson<br />
timetables on which language(s) curricula were delivered<br />
in. Combining information from these two data sources<br />
would provide a global snapshot of national language in<br />
education policies by grade or education level.<br />
But monitoring the proposed thematic indicator based<br />
on national policy documents has its limits. Such<br />
documents rarely provide information on student<br />
access to teaching <strong>and</strong> learning materials in their home<br />
language. And it is difficult to determine whether official<br />
policies on language in education are implemented at<br />
the local level, <strong>and</strong> if not, whether this reflects a lack<br />
of initial teacher preparation or in-service professional<br />
development opportunities.<br />
Take Mali, for example, a country that has moved quickly<br />
to adopt the use of local languages in education (Figure<br />
14.10). Starting with innovations in the early 1980s,<br />
the government set forth a multilingual curriculum in<br />
2002, introducing 11 national languages as media of<br />
instruction in addition to French (Traore, 2009). Yet, even<br />
a decade after this reform, school-level implementation<br />
problems were considerable. In 2010, in the Mopti<br />
region, for instance, a census of teachers <strong>and</strong> principals<br />
in 949 primary schools found that only 24% of schools<br />
followed the curriculum <strong>and</strong>, of those, only 1 in 3 offered<br />
bilingual education for the entire 6-year primary cycle.<br />
Even in these schools, only 11% of teachers had been<br />
268<br />
CHAPTER 14 | TARGET 4.5 – EQUITY
14<br />
trained in the bilingual curriculum, which means only<br />
1% of schools were providing bilingual instruction in<br />
the appropriate language <strong>and</strong> by a trained teacher<br />
throughout primary school (MEALN, 2011).<br />
Other countries face challenges in scaling up effective<br />
use of a child’s first or home language as a medium of<br />
instruction. In Viet Nam, as part of a pilot project, three<br />
languages (Hmong, Jarai <strong>and</strong> Khmer) have been used<br />
as a medium of instruction (UNESCO, 2012b). A survey<br />
of pre-primary <strong>and</strong> primary schools in Lao Cai province<br />
of student <strong>and</strong> teacher language proficiencies found<br />
Vietnamese was the first language of 70% of teachers<br />
but it was the strongest language for only 1 in 5 students<br />
(Figure 14.11).<br />
FIGURE 14.11:<br />
In Lao Cai province, Viet Nam, most teachers speak a different language<br />
than their students<br />
Distribution of teachers by ethnicity <strong>and</strong> students by strongest language, primary<br />
schools in Lao Cai province, Viet Nam, 2012<br />
Teachers<br />
0<br />
Kinh (ethnic Vietnamese)<br />
Students Hmong Dao Tay Other Not recorded<br />
Source: UNICEF (2012b).<br />
20 40 60 80 100<br />
%<br />
Classroom observation can help countries identify<br />
challenges in implementing policies on language in<br />
education that build on home language proficiency. In<br />
the Philippines, the multilingual education policy involved<br />
using local mother tongues to instruct during early years<br />
of schooling, with Filipino <strong>and</strong> English introduced as<br />
the language of instruction after grade 3. Despite this<br />
policy’s overall success, some regions lagged behind. In<br />
Maguindanao province, while 93% of grade 2 students<br />
spoke Maguindanaoan at home, only 73% of teachers<br />
were reported to use it in the classroom. And of those,<br />
41% never used the multilingual education textbook<br />
(RTI International, 2015).<br />
In Kenya <strong>and</strong> Ug<strong>and</strong>a, countries with similar policies of<br />
teaching in the language of the school catchment area,<br />
a study recorded the language used by teachers <strong>and</strong><br />
students in more than 1,500 primary schools, by grade,<br />
subject <strong>and</strong> activity. In Kenya’s Central <strong>and</strong> Nyanza<br />
provinces, English continued to be the medium of<br />
instruction. While hardly spoken in any of the children’s<br />
homes, it was used for about 60% of classroom time,<br />
increasing to 80% in mathematics <strong>and</strong> social studies. By<br />
contrast, in the Central region <strong>and</strong> Lango subregion of<br />
Ug<strong>and</strong>a, mother tongue instruction was provided about<br />
75% of the time in grades 1 to 3 <strong>and</strong> 90% of the time in<br />
mathematics <strong>and</strong> social studies. However, the transition<br />
to English in grade 4 was more abrupt (Piper <strong>and</strong> Miksic,<br />
2011) (Figure 14.12).<br />
Cross-national <strong>and</strong> national learning assessments can be<br />
employed to capture language policy implementation in<br />
schools. In the Trends in International Mathematics <strong>and</strong><br />
Science Study (TIMSS) <strong>and</strong> the Progress in International<br />
Reading Literacy Study (PIRLS), parents of fourthgraders<br />
were asked to report the language spoken by the<br />
child before starting school. In the 2011 round of PIRLS,<br />
92% of fourth-graders spoke the test language before<br />
starting schooling. But there were differences among<br />
countries: 1 in 3 students in Indonesia <strong>and</strong> 1 in 5 in the<br />
Islamic Republic of Iran did not speak the language of<br />
instruction before starting school, compared with less<br />
than 1 in 20 in Denmark, Hungary <strong>and</strong> Norway (Mullis et<br />
al., 2012b).<br />
TIMSS <strong>and</strong> PIRLS also collect data from eighth-graders<br />
themselves about how frequently they speak the test<br />
language at home. In 2011, on average, across countries<br />
participating in TIMSS, 79% of eighth-graders always or<br />
almost always spoke the language of the test at home,<br />
with 17% sometimes speaking it <strong>and</strong> 4% never speaking it<br />
(Mullis et al., 2012a).<br />
Similarly, in PISA surveys, 15-year-old students are asked<br />
whether the language spoken at home most of the time<br />
is the language of assessment (which in PISA is the<br />
language of instruction). Findings indicated that in 2012,<br />
on average, nearly 15% of students did not speak the<br />
language of instruction at home. The proportion varied<br />
considerably among countries: in Malaysia <strong>and</strong> Thail<strong>and</strong>,<br />
nearly half the students did not speak the assessment<br />
language at home, compared with less than 1% in Chile<br />
<strong>and</strong> Pol<strong>and</strong> (OECD, 2013c). Not surprisingly, students<br />
from immigrant families were disadvantaged: 63% of<br />
first-generation immigrant 15-year-old students, on<br />
average (<strong>and</strong> more than 80% in the Czech Republic, Israel<br />
<strong>and</strong> Sweden), spoke a different language at home than<br />
the assessment language; 38% of second-generation<br />
2016 • GLOBAL EDUCATION MONITORING REPORT 269
14<br />
FIGURE 14.12:<br />
Kenya <strong>and</strong> Ug<strong>and</strong>a followed different routes in implementing their language of instruction policy<br />
Selected indicators of language use in primary education, selected regions of Kenya <strong>and</strong> Ug<strong>and</strong>a, 2009<br />
a. Language used in classroom <strong>and</strong> spoken at home<br />
%<br />
0<br />
20<br />
40<br />
60<br />
80<br />
100<br />
Kenya<br />
Central<br />
Nyanza<br />
Classroom<br />
Home<br />
Classroom<br />
Home<br />
92<br />
84<br />
18<br />
11<br />
100<br />
90<br />
c. Use of mother tongue, by grade<br />
80<br />
Ug<strong>and</strong>a<br />
Ug<strong>and</strong>a<br />
Central<br />
Lango<br />
Classroom<br />
Home<br />
Classroom<br />
Home<br />
82<br />
93<br />
74<br />
68<br />
%<br />
70<br />
60<br />
50<br />
40<br />
b. Instructional time, by subject <strong>and</strong> language<br />
30<br />
Kenya<br />
0<br />
20<br />
40<br />
%<br />
60<br />
80<br />
100<br />
20<br />
Kenya<br />
Ug<strong>and</strong>a<br />
Mathematics<br />
Social studies<br />
Mathematics<br />
Social studies<br />
92<br />
90<br />
13<br />
8<br />
10<br />
0<br />
1 2 3 4 5 6 7<br />
Grade<br />
English Kiswahili Mother tongue Other<br />
Source: Piper <strong>and</strong> Miksic (2011).<br />
immigrant students still spoke a different language at<br />
home (OECD, 2015d).<br />
For Latin America <strong>and</strong> sub-Saharan Africa, information on<br />
language use at home <strong>and</strong> school can be compiled from<br />
three regional assessment programmes: the Analysis<br />
Programme of the CONFEMEN Education Systems<br />
(PASEC), the Southern <strong>and</strong> Eastern Africa Consortium<br />
for Monitoring Educational Quality (SACMEQ) <strong>and</strong> the<br />
Second Regional Comparative <strong>and</strong> Explanatory Study<br />
(SERCE). Analysis of PASEC countries by the GEM Report<br />
team shows the percentage of grade 5 students who<br />
did not speak the language of assessment at home to<br />
be very high, ranging from nearly 70% in Cameroon<br />
<strong>and</strong> Gabon to over 90% in Senegal <strong>and</strong> Togo. Among<br />
countries taking part in SACMEQ, 90% of sixth-graders<br />
did not speak the language of assessment at home in<br />
Malawi <strong>and</strong> Swazil<strong>and</strong>. Across Latin America, the largest<br />
shares of grade 6 students who did not speak the test<br />
language at home were found in Guatemala (16%) <strong>and</strong><br />
Paraguay (45%).<br />
The continuing neglect of mother tongue-based<br />
multilingual education in linguistically diverse countries<br />
helps explain large disparities in education outcomes.<br />
While tracking language of instruction is fraught with<br />
technical <strong>and</strong> possibly political challenges, it is a key<br />
issue that countries <strong>and</strong> regions need to tackle head-on if<br />
no one is to be left behind.<br />
270<br />
CHAPTER 14 | TARGET 4.5 – EQUITY
14<br />
MIGRATION AND FORCED<br />
DISPLACEMENT<br />
Voluntary <strong>and</strong> forced population movement affects<br />
the education opportunities <strong>and</strong> needs of hundreds of<br />
millions of children, young <strong>people</strong> <strong>and</strong> adults around the<br />
world. It also increases challenges for host governments.<br />
Four groups are discussed in this section: internal<br />
migrants, international migrants, internally displaced<br />
<strong>people</strong> <strong>and</strong> refugees.<br />
The largest population movement is internal migration,<br />
usually rural to urban. Migration statistics rely on<br />
censuses, carried out every 10 years. As a result, regional<br />
<strong>and</strong> global estimates are available only with considerable<br />
delay. The latest estimates, from 2005, suggest that<br />
globally 763 million were living outside their region of<br />
birth (UNDESA, 2013). It is more important for education<br />
planners to know the intensity of internal migration<br />
flows; over the past five years, it has been above average<br />
in countries including Chile, the Republic of Korea <strong>and</strong><br />
Senegal (Bell et al., 2015).<br />
China has experienced what is considered the largest<br />
migration in human history (Chan, 2013). A household<br />
registration system restricted access to public schools<br />
for children of rural migrants in order to discourage<br />
them from moving to cities. Subst<strong>and</strong>ard private schools<br />
were created to serve rural migrant children, attended<br />
by 60% of those in Shanghai <strong>and</strong> 75% in Guangzhou in<br />
the early 2000s. The government then abolished fees<br />
for rural migrant children in urban public schools <strong>and</strong><br />
provided additional funding to the schools to help<br />
absorb these students. By 2010, the proportion of<br />
migrant students attending public schools had increased<br />
to 74% (Hao <strong>and</strong> Yu, 2015).<br />
Despite problems in accommodating the influx of rural<br />
migrants, who often move into slum or peri-urban areas<br />
where public school access is limited, migration to urban<br />
areas generally facilitates access to public services.<br />
Analysis for the 2015 GMR showed that even if primary<br />
completion rates had remained constant in urban <strong>and</strong><br />
rural areas in sub-Saharan Africa, the increase in the<br />
share of <strong>people</strong> living in urban areas would have been<br />
enough to raise the average primary completion rate<br />
by 1.5 percentage points between 2000 <strong>and</strong> 2010<br />
(UNESCO, 2015d).<br />
Although much smaller in magnitude, international<br />
migration attracts far more attention. In 2015, 244<br />
million <strong>people</strong> were living outside their country of<br />
birth <strong>and</strong> the proportion of international migrants in<br />
the total population was 3.3%, compared with 2.8% in<br />
2000. South–South migration exceeded South–North<br />
migration for the first time in 2015, though immigrants<br />
remain a significant share of the population in high<br />
income countries in Europe (10%), Northern America<br />
(e.g. 15% in the United States) <strong>and</strong> the Pacific (e.g. 28% in<br />
Australia) (GMDAC, 2016).<br />
In high income<br />
countries, the<br />
In high income countries, education-related<br />
experiences<br />
first-generation immigrant<br />
of immigrant<br />
students scored about<br />
students are of<br />
50 points below students concern. Firstgeneration<br />
without an immigrant<br />
immigrant<br />
background in reading <strong>and</strong><br />
students scored<br />
mathematics<br />
about 50 points<br />
below students<br />
without an<br />
immigrant background in reading <strong>and</strong> mathematics<br />
in the 2012 PISA in OECD countries, while secondgeneration<br />
immigrant students scored about 20 points<br />
below. Still, the difference in mathematics performance<br />
between students with <strong>and</strong> without an immigrant<br />
background shrank by around 10 points between 2003<br />
<strong>and</strong> 2012 (OECD, 2015d).<br />
The challenge for policy-makers is that students with<br />
an immigrant background tend to be concentrated<br />
in schools in socio-economically disadvantaged<br />
areas. If the socio-economic status of students <strong>and</strong><br />
schools is taken into account, the average difference in<br />
mathematics performance in OECD countries between<br />
students who attend schools where more than 25% of<br />
students are immigrants compared to students who<br />
attend schools with no immigrant students drops by<br />
almost 75% (OECD, 2015d).<br />
Voluntary migration can disrupt education but can<br />
also have benefits. Both domestic migrants in China<br />
<strong>and</strong> international migrants in OECD countries may not<br />
do as well in school as their peers in host communities,<br />
but tend to do much better than if they had stayed<br />
in their communities of origin. In contrast, forced<br />
displacement tends to lead to gross violations of the<br />
right to education.<br />
The number of internally displaced <strong>people</strong> (IDPs) has<br />
been growing. At the end of 2014, 38 million IDPs were<br />
2016 • GLOBAL EDUCATION MONITORING REPORT 271
14<br />
estimated to live in 60 countries. The Democratic<br />
Republic of the Congo, Iraq, Nigeria, South Sudan <strong>and</strong><br />
the Syrian Arab Republic accounted for 60% of new IDPs<br />
(IDMC, 2015b). Internal displacement is predominantly<br />
urban, with IDPs often having fled conflict-affected<br />
areas to the relative safety of towns <strong>and</strong> cities, as in<br />
Colombia <strong>and</strong> Ug<strong>and</strong>a.<br />
IDPs are nationals of their country <strong>and</strong> hence the<br />
responsibility of their government. However, education<br />
management information systems seldom collect data<br />
on children of IDPs <strong>and</strong> when they do, it is annually – too<br />
infrequent for such transient populations. One exception<br />
is Ukraine, which collects monthly education status<br />
information on children displaced by conflicts in Crimea,<br />
Donetsk <strong>and</strong> Lugansk. As of March 2016, 51,000 displaced<br />
children (1.4% of the total student population) were<br />
enrolled in schools in other areas (Ukraine Ministry of<br />
Education <strong>and</strong> Science, 2016).<br />
IDPs are relatively invisible <strong>and</strong> their education needs<br />
neglected. In Nigeria, as a result of violent attacks on<br />
civilians by Boko Haram since 2009, 1 million school-age<br />
children were estimated to have fled violence by early<br />
2016 (HRW, 2016). The Displacement Tracking Matrix of<br />
the International Organization for Migration reported<br />
that in 19 of 42 displacement camps in 6 states in June<br />
2015, children had no access to formal or non-formal<br />
education facilities (IOM, 2015).<br />
In Iraq, conflict between<br />
armed groups <strong>and</strong><br />
In Iraq, only 45% of<br />
government forces has<br />
internally displaced escalated rapidly, resulting<br />
children <strong>and</strong><br />
in around 3.3 million IDPs<br />
as of end of 2014 (IDMC,<br />
adolescents living in<br />
2015b). In July 2015, out<br />
camps were enrolled of 78,000 IDP children<br />
in schools<br />
<strong>and</strong> adolescents aged<br />
6 to 17 living in camps,<br />
only 45% were enrolled<br />
in schools, <strong>and</strong> only 30% of the 730,000 IDP children<br />
<strong>and</strong> adolescents not in camps had access to education<br />
(OCHA, 2015a).<br />
Refugees are the most vulnerable group, numbering,<br />
by mid-2015, 15 million under the global m<strong>and</strong>ate of<br />
the Office of the United Nations High Commissioner<br />
for Refugees (UNHCR) (UNHCR, 2015b). There are also<br />
5.1 million Palestinian refugees registered with the United<br />
Nations Relief <strong>and</strong> Works Agency for Palestine Refugees<br />
in the Near East. Despite the visibility of the refugee<br />
influx in Europe, 86% of all refugees are hosted in lower<br />
income countries, some of which have weak education<br />
system capacity (UNHCR, 2015b).<br />
According to UNHCR, 50% of primary school-age<br />
refugees <strong>and</strong> 75% of secondary school-age refugees are<br />
out of school worldwide. Access to secondary education<br />
is particularly limited. In Bangladesh, Kenya <strong>and</strong><br />
Pakistan, less than 5% of adolescent refugees aged 12 to<br />
17 were enrolled in secondary education (UNESCO <strong>and</strong><br />
UNHCR, 2016).<br />
Data on refugee education come largely from camps<br />
<strong>and</strong> camp-like settings. Yet, more than half the world’s<br />
refugees reside in urban areas (UNHCR, 2015c). While<br />
the right to choose where to live increases livelihood<br />
opportunities for refugees, monitoring <strong>and</strong> evaluation<br />
of their education becomes problematic, as they are<br />
frequently not identified as refugees in schools.<br />
Some countries have taken steps to better monitor<br />
refugee children’s education status. Chad developed an<br />
integrated system to improve refugee education data<br />
management so as to eventually integrate the data<br />
in the national education management information<br />
system (UNHCR, 2016). However, refugee children <strong>and</strong><br />
adolescents are usually not identified in information<br />
systems. This omission may help limit the risk of<br />
discrimination, but some information is needed to<br />
protect refugees <strong>and</strong> address their vulnerability.<br />
Information may need to come from other sources.<br />
In Jordan, 83% of the approximately 630,000 Syrian<br />
refugees live outside camps (Jordan Ministry of<br />
Planning <strong>and</strong> International Cooperation, 2015). Since<br />
2012, interviews have been conducted with more than<br />
170,000 Syrian refugee households in non-camp settings<br />
under UNHCR’s Home Visits Programme. In 2014, 53% of<br />
school-age children were enrolled in formal education, up<br />
from 44% in 2013 (UNHCR, 2015a).<br />
Adding to the four groups discussed above are the<br />
average 26 million <strong>people</strong> per year who were displaced<br />
from their homes by natural disasters between 2008 <strong>and</strong><br />
2014 (IDMC, 2015a). As this report shows, the probability<br />
is high that this trend, already increasing in 1970, will<br />
continue rising in coming decades.<br />
272<br />
CHAPTER 14 | TARGET 4.5 – EQUITY
14<br />
There are important, sometimes intractable, challenges<br />
in monitoring the education status of migrant <strong>and</strong><br />
forcibly displaced populations. However, coordinated<br />
efforts need to be stepped up to improve systems so<br />
as to better underst<strong>and</strong> the reasons for the observed<br />
disparity in their access to education in general, <strong>and</strong><br />
education of good quality in particular.<br />
ENDNOTES<br />
1. Language of instruction refers to the language used for teaching the basic<br />
curriculum (Ball, 2011).<br />
2. The first language is defined as the language an individual (a) learned<br />
first, (b) identifies with, (c) knows best, (d) uses most, <strong>and</strong>/or (e) speaks<br />
<strong>and</strong> underst<strong>and</strong>s well enough to learn age-appropriate academic content<br />
(Benson, 2016).<br />
3. Second language refers to a language used in school <strong>and</strong> the community,<br />
learned after the first language <strong>and</strong> drawing on learners’ experiences outside<br />
the classroom (Benson, 2016).<br />
2016 • GLOBAL EDUCATION MONITORING REPORT 273
15<br />
In Tanzania, adult<br />
Maasai women learn<br />
basic Swahili literacy<br />
skills, business skills,<br />
HIV education <strong>and</strong><br />
l<strong>and</strong> rights through<br />
USAID programmes.<br />
CREDIT: Megan Johnson/USAID<br />
KEY MESSAGES<br />
There are challenges in monitoring adult participation in literacy programmes because of the diversity of<br />
providers. Surveys of adults can be a more reliable source of information than governments.<br />
New analysis shows that over 2004–2011, 6% of adults aged 15 to 49 in 29 poorer countries had ever participated<br />
in a literacy programme. Most of those were male <strong>and</strong> from richer households, even though the majority of<br />
illiterate adults were female <strong>and</strong> poor.<br />
The SDG agenda shifts attention from a concept of literacy in which someone is literate or not to a more<br />
nuanced concept of how proficient they are in literacy skills along a continuum.<br />
In the absence of data on literacy proficiency levels, reporting based on traditional rates continues. Over 2005–<br />
2014, some 758 million adults, almost two-thirds of them women, lacked any literacy skills.<br />
A better picture of literacy challenges can be found by directly assessing skills, as is the case in many high<br />
income countries. Among adults who participated in an OECD assessment, 15% did not have basic literacy skills.<br />
International collaboration is needed to help conduct more international literacy <strong>and</strong> numeracy assessments by<br />
2030. A successful approach should balance the ability of a country to proceed on its own against the need for<br />
its assessment to meet global quality st<strong>and</strong>ards.<br />
274<br />
CHAPTER 15 | TARGET 4.6 – LITERACY AND NUMERACY
15<br />
CHAPTER 15<br />
Sustainable Development Goal 4.6<br />
D<br />
TARGET 4.6<br />
Literacy <strong>and</strong> numeracy<br />
By 2030, ensure that all youth <strong>and</strong> a substantial proportion of adults,<br />
both men <strong>and</strong> women, achieve literacy <strong>and</strong> numeracy<br />
GLOBAL INDICATOR 4.6.1 – Percentage of population in a given age group achieving at least a<br />
fixed level of proficiency in functional (a) literacy <strong>and</strong> (b) numeracy skills, by sex<br />
THEMATIC INDICATOR 23 – Youth/adult literacy rate<br />
THEMATIC INDICATOR 24 – Participation rate of youth/adults in literacy programmes<br />
2016 • GLOBAL EDUCATION MONITORING REPORT 275
15<br />
Participation in adult literacy programmes................................................................ 277<br />
Literacy rates.............................................................................................................................278<br />
Literacy <strong>and</strong> numeracy proficiency levels..................................................................280<br />
Conclusion...................................................................................................................................285<br />
In the words of the 2006 Education for All Global<br />
Monitoring Report (GMR), underst<strong>and</strong>ing of literacy<br />
has exp<strong>and</strong>ed from ‘a simple process of acquiring<br />
basic cognitive skills, to using these skills in ways that<br />
contribute to socio-economic development, to developing<br />
the capacity for social awareness <strong>and</strong> critical reflection as<br />
a basis for personal <strong>and</strong> social change’ (UNESCO, 2005b).<br />
Accordingly, that GMR presented four discrete concepts<br />
of literacy, which can be summarized as:<br />
■■<br />
A set of cognitive skills (reading <strong>and</strong> writing) that are<br />
independent of context.<br />
■■<br />
A set of skills that are determined by the context<br />
in which they are applied, practised <strong>and</strong> situated;<br />
this is underpinned by the widely used definition<br />
of functional literacy referring to a person ‘who<br />
can engage in all those activities in which literacy is<br />
required for effective functioning of his group <strong>and</strong><br />
community <strong>and</strong> also for enabling him to continue to<br />
use reading, writing <strong>and</strong> calculation for his own <strong>and</strong><br />
the community’s development’ (UNESCO, 1978).<br />
■■<br />
An active <strong>and</strong> broad-based learning process, rather<br />
than a product of a more limited <strong>and</strong> focused<br />
educational intervention, referring to its potential to<br />
transform not only individuals but also societies.<br />
■■<br />
The texts <strong>people</strong> produce <strong>and</strong> consume, which vary<br />
in terms of language complexity <strong>and</strong> their explicit or<br />
hidden content.<br />
Target 4.6 maintains the international focus on adult<br />
literacy that was part of the fourth Education for All<br />
goal. While that goal for<br />
The global indicator on<br />
2000–2015 was halving<br />
the adult illiteracy rate,<br />
literacy <strong>and</strong> numeracy<br />
the corresponding<br />
is expressed in terms target for 2015–2030<br />
of skills proficiency<br />
has been left vague.<br />
Member states agreed<br />
that universal adult<br />
literacy would be unattainable over the next 15 years,<br />
but not what level should be reached. Universal youth<br />
literacy, which was not included previously, has been<br />
added to the target.<br />
The Sustainable Development Goals (SDGs) <strong>and</strong> agenda<br />
bring two important innovations. First, the global<br />
indicator on literacy <strong>and</strong> numeracy is formulated<br />
explicitly in terms of skills proficiency. This decision<br />
considerably improves on the weak target formulation,<br />
which views literacy as something to be ‘achieved’. The<br />
indicator comes closer to the view of literacy as not just<br />
a set of skills but also their application. And it tacitly<br />
recognizes recent advances in direct assessments that<br />
show literacy is not a skill <strong>people</strong> either do or do not<br />
possess. Rather, different levels <strong>and</strong> types of literacy<br />
empower adults to achieve different functions in<br />
life. Because of the constraints of global monitoring<br />
requirements, not all approaches to the concept of<br />
literacy are captured. However, the SDG agenda’s<br />
treatment of literacy represents a considerable advance.<br />
Second, the target specifies numeracy as a skill to be<br />
acquired. Some definitions of literacy have always<br />
encompassed numeracy, whether under ‘functional literacy’,<br />
as above, or under ‘operational literacy’, i.e. the ability<br />
‘to identify, underst<strong>and</strong>, interpret, create, communicate<br />
276<br />
CHAPTER 15 | TARGET 4.6 – LITERACY AND NUMERACY
15<br />
Literacy is a<br />
basic cognitive<br />
skill that is<br />
fundamental<br />
<strong>and</strong> compute’ (UNESCO, 2005a).<br />
However, explicitly referring to<br />
numeracy calls attention to its<br />
specific properties.<br />
Target 4.6 complements target<br />
4.3, which implicitly focuses on<br />
for access to<br />
adult education participation,<br />
decent work <strong>and</strong> target 4.4, which focuses on<br />
youth <strong>and</strong> adult skills relevant<br />
for work. The separation of<br />
literacy <strong>and</strong> numeracy from other skills is artificial <strong>and</strong><br />
unfortunate. As the review of selected skills under target<br />
4.4 suggested, literacy is a basic cognitive skill that is<br />
fundamental for access to decent work. Literacy <strong>and</strong><br />
numeracy are essential components of other specialized<br />
skills, such as digital <strong>and</strong> financial literacy, <strong>and</strong> blended<br />
skill sets, such as entrepreneurship.<br />
Nevertheless, maintaining a separate target on literacy<br />
<strong>and</strong> numeracy helps keep it from being seen as a<br />
skill solely tied to economic benefits. And it reminds<br />
the world of literacy’s distinctive role in community<br />
advancement <strong>and</strong> social inclusion. This chapter discusses<br />
the challenges of monitoring the participation rate<br />
in literacy programmes, which is one of the proposed<br />
thematic indicators. It then explores global indicator 4.6.1<br />
on literacy <strong>and</strong> numeracy proficiency skills.<br />
PARTICIPATION IN ADULT<br />
LITERACY PROGRAMMES<br />
Measuring participation in formal <strong>and</strong> non-formal adult<br />
literacy programmes has proved surprisingly difficult.<br />
It has been hard to compile information from diverse<br />
providers in the absence of more detailed information<br />
about their programmes’ characteristics. This section<br />
builds on the discussion of the related challenge of<br />
measuring participation in adult education programmes,<br />
covered under target 4.3 (see Chapter 12).<br />
While it should be possible to estimate participation<br />
rates in the large share of literacy programmes<br />
provided or sponsored by government, this elementary<br />
information has so far proved difficult to collect. The<br />
main source of information on literacy programmes<br />
should in principle be the Global Report on Adult Learning<br />
<strong>and</strong> Education (GRALE), published about every three<br />
years. However, the first three editions did not report<br />
participation rates, focusing simply on whether<br />
enrolment, attendance <strong>and</strong> completion information was<br />
collected. For example, in 2012, GRALE reported that<br />
literacy programmes were provided in 119 countries by<br />
the government, in 67 countries by the private sector<br />
<strong>and</strong> in 97 countries by civil society.<br />
Because comparing literacy programmes is difficult,<br />
information on participation rates is lacking. Courses<br />
differ in aims, content, relative intensity <strong>and</strong> duration.<br />
It may be difficult to differentiate between literacy<br />
programmes <strong>and</strong> those on other basic skills. It is also<br />
unclear whether participation rates should be defined<br />
relative to all adults, adults without literacy skills or<br />
another group.<br />
Regardless of the fragmented provision of literacy<br />
programmes <strong>and</strong> often weak oversight by governments,<br />
GRALE, as the key reference on adult literacy, needs to<br />
help develop a st<strong>and</strong>ardized reporting template that, at<br />
the very least, captures adult participation in publicly<br />
provided or sponsored literacy programmes.<br />
Given the diversity of provision, surveys of individuals<br />
are likely to be a more reliable source of information than<br />
governments. However, as levels of adult participation<br />
in literacy programmes tend to be low, estimates of<br />
participation rates may be less precise <strong>and</strong> general<br />
household survey programmes give little priority to<br />
questions capturing relevant details.<br />
Nevertheless, the information household surveys<br />
can provide has not yet been fully exploited. New<br />
analysis for this report uses a question once regularly<br />
included in the Demographic <strong>and</strong> Health Surveys (DHS)<br />
administered to all 15- to 49-year-olds, but unfortunately<br />
discontinued in recent rounds: whether respondents had<br />
‘ever participated in a literacy programme or any other<br />
programme that involves learning to read or write (not<br />
including primary school)’.<br />
The question has clear disadvantages – it is retrospective<br />
<strong>and</strong> provides neither information on when respondents<br />
attended the programme nor background on the type<br />
of programme attended – but is the sole source of<br />
comparative information. Among 29 low <strong>and</strong> middle<br />
income countries with relevant information over<br />
2004–2011, about 6% of adults aged 15 to 49 had ever<br />
participated in a literacy programme. In all the countries<br />
except Ethiopia, Honduras, Nepal <strong>and</strong> Senegal, these<br />
retrospective participation rates were below 15%.<br />
2016 • GLOBAL EDUCATION MONITORING REPORT 277
15<br />
Participation rate in adult literacy programmes (%)<br />
From an equity perspective, literacy programmes should<br />
target those who need them most: adults with low<br />
literacy skills, the majority of whom are women <strong>and</strong>/or<br />
from poor households. However, background information<br />
shows the average disparity in participation rates was<br />
slightly in favour of men. Across the 29 countries, 6.7%<br />
of men had attended a literacy programme, compared<br />
with 5.7% of women. A similar disparity favoured richer<br />
adults: 5.4% of the poorest had ever attended a literacy<br />
programme, compared with 7.1% of the richest. This may<br />
reflect the relative ease of access to such programmes<br />
in urban areas. But since the question is retrospective, it<br />
may also be that some individuals who were identified<br />
as rich were poor in the past but benefited from their<br />
literacy skills to earn a higher income.<br />
While the surveys did not ask when these adults<br />
participated in a programme, their ages indicate the<br />
prevalence of participation over time: 3.6% of 15- to<br />
19-year-olds, 6% of 30- to 34-year-olds <strong>and</strong> 9.2% of 45-<br />
to 49-year-olds had attended a literacy programme.<br />
FIGURE 15.1:<br />
In poorer countries, less than 1 in 10 adults has ever participated in an<br />
adult literacy programme<br />
Percentage of adults who had ever participated in a literacy programme, 15- to<br />
49-year-olds, by literacy status, selected countries, 2004–2011<br />
35<br />
30<br />
25<br />
20<br />
15<br />
10<br />
5<br />
0<br />
Guinea, 2005<br />
Could read a sentence<br />
Average<br />
Could not read a sentence<br />
Sierra Leone, 2008<br />
Madagascar, 2008<br />
U. R. Tanzania, 2004<br />
Liberia, 2007<br />
Cameroon, 2004<br />
India, 2005<br />
Kenya, 2008<br />
Lesotho, 2009<br />
Congo, 2005<br />
Indonesia, 2007<br />
Zambia, 2007<br />
Niger, 2006<br />
D. R. Congo, 2007<br />
Zimbabwe, 2005<br />
Ghana, 2008<br />
Source: GEM Report team analysis (2016) using DHS data.<br />
Benin, 2006<br />
Guyana, 2009<br />
Ug<strong>and</strong>a, 2006<br />
Rw<strong>and</strong>a, 2005<br />
Timor-Leste, 2009<br />
Haiti, 2005<br />
Swazil<strong>and</strong>, 2006<br />
Mali, 2006<br />
Malawi, 2010<br />
Ethiopia, 2011<br />
Senegal, 2010<br />
Honduras, 2011<br />
Nepal, 2011<br />
The lower participation rates among younger adults<br />
may reflect increasing overall literacy levels, which<br />
means younger adults are less likely to need literacy<br />
programmes. However, it may also reflect decreasing<br />
prevalence of mass literacy campaigns as access to<br />
formal education has increased in recent years.<br />
As important as knowing whether adults participated<br />
in literacy programmes is whether, <strong>and</strong> to what extent,<br />
they acquired functional literacy skills. The surveys<br />
provided information on whether respondents could<br />
read a simple sentence from a card, which could indicate<br />
indirectly whether the programmes had been effective.<br />
Across the 29 countries, an average of 8.7% of adults<br />
who could read a sentence had attended a literacy<br />
programme, compared with 5.2% of adults who could<br />
not (Figure 15.1). In countries including Mali, Niger <strong>and</strong><br />
Sierra Leone, the literacy skills of a large percentage of<br />
adults could be traced to their participation in a literacy<br />
programme (Box 15.1).<br />
At the same time, a considerable share of adults had<br />
not learned to read despite taking part in a literacy<br />
programme. Hence, Action Research on Measuring<br />
Literacy Programme Participants’ Learning Outcomes,<br />
an initiative of the UNESCO Institute for Lifelong<br />
Learning (UIL), is focusing on better underst<strong>and</strong>ing the<br />
effectiveness of such programmes (UIL, 2016).<br />
LITERACY RATES<br />
The SDG agenda rightly shifts attention away from the<br />
conventional dichotomy of literacy/illiteracy to measures<br />
of proficiency in literacy skills. For policy-makers, the<br />
rigid distinction between adults who do or do not<br />
possess literacy skills is less informative than the range of<br />
proficiency levels found among adults in various contexts<br />
<strong>and</strong> the kinds of policy interventions that can effectively<br />
improve literacy levels among particular groups.<br />
For the time being, however, the needed measurement<br />
tools are not widely available, so reporting on youth<br />
<strong>and</strong> adult literacy based on traditional literacy rates<br />
continues. According to the most recent estimates,<br />
the global adult literacy rate was 85%, which means<br />
758 million adults lacked any literacy skills. There were<br />
91 literate women for every 100 literate men – <strong>and</strong> as<br />
few as 74 literate women for every 100 literate men in<br />
low income countries. The youth literacy rate was 91%,<br />
meaning 114 million youth lacked any literacy skills. The<br />
278<br />
CHAPTER 15 | TARGET 4.6 – LITERACY AND NUMERACY
15<br />
BOX 15.1<br />
Measuring participation in literacy programmes in Niger<br />
Niger is burdened with one of the world’s lowest adult literacy rates as well as one of the largest gender disparities in this indicator: according to the UNESCO Institute for<br />
Statistics (UIS), the adult literacy rate was 15% in 2012 <strong>and</strong> there were 38 literate women for every 100 literate men. The situation was also dire among youth, who had a<br />
literacy rate of 24% in 2012. A direct assessment approach, based on the ability to read a simple sentence from a card administered as part of the 2012 DHS, confirmed these<br />
findings <strong>and</strong> highlighted extreme inequality: just 4% of youth in the poorest 20% of households could read, compared with 65% in the richest 20%.<br />
Only a small percentage of the population had ever participated in an adult literacy programme. The 2011 National Survey on Household Living Conditions <strong>and</strong> Agriculture<br />
found that 1.5% of adults aged 25 to 49 had ever attended a literacy programme; the rate for men was twice that for women. However, participation may have been<br />
underestimated. Literacy programmes were considered a separate category from formal <strong>and</strong> Islamic education, but some adults may have attended both a literacy<br />
programme <strong>and</strong> formal or Islamic schooling.<br />
The 2006 DHS asked a separate question on adult literacy. It found that 5.7% of adults aged 15 to 49 had ever attended a literacy programme. While a retrospective measure<br />
cannot establish where <strong>people</strong> lived at the time they attended literacy classes, evidence suggests more common participation in urban areas (Figure 15.2a). However, literacy<br />
programmes made a bigger difference in rural areas: 31% of literate adults in rural areas had participated in a programme, compared with 18% in urban areas (Figure 15.2b).<br />
FIGURE 15.2:<br />
Fewer adults in rural areas had participated in an adult literacy programme in Niger, but more adults with literacy skills in rural<br />
areas had done so<br />
Percentage of adults who had ever participated in a literacy programme, by location, Niger, 2006<br />
Participation rate in adult literacy programmes (%)<br />
14<br />
a. By age group b. By literacy status<br />
35<br />
12<br />
10<br />
8<br />
Urban<br />
Total<br />
6<br />
Rural<br />
4<br />
2<br />
0<br />
15–19 20–24 25–29 30–34 35–39 40–44<br />
Source: GEM Report team analysis (2016) using DHS data.<br />
Participation rate in adult literacy programmes (%)<br />
30<br />
25<br />
20<br />
15<br />
10<br />
5<br />
0<br />
Urban<br />
Total<br />
Rural<br />
Could read a sentence<br />
Could not read a sentence<br />
The Functional Literacy Programme for Women <strong>and</strong> Girls of the Directorate of Literacy <strong>and</strong> Adult Education Programmes, which was launched in 1987 <strong>and</strong> had been rolled<br />
out across the country by 1997, is the main national literacy intervention; it received an honourable mention in the 2012 UNESCO international literacy prizes. Its objective<br />
is to help participants acquire not only literacy but also life skills, including knowledge on health, environment, women’s rights <strong>and</strong> income-generating activities. Income<br />
from these activities also helps sustain the programme. To strengthen solidarity, facilitators are recruited from among former students or newly literate adults. Programme<br />
coverage is limited; about 57,000 women <strong>and</strong> girls from 1,284 centres participated between 1987 <strong>and</strong> 2012, while the estimated population of adult women who could not<br />
read was 4 million.<br />
A more recent programme, Basic Literacy Teaching by Mobile Phone (Alphabétisation de Base par Cellulaire or ABC), was implemented between 2009 <strong>and</strong> 2011 in 113 villages<br />
of the Dosso <strong>and</strong> Zinder regions, with about 5,500 adults following literacy <strong>and</strong> numeracy courses in their mother tongues. Classes were three hours a day, five days a week,<br />
during two four-month periods. In half the classes, mobile phones were introduced, one phone for five learners, as a way for them to practise previous lessons by using text<br />
messages. Assessments conducted before, during <strong>and</strong> after the programme found significant outcomes for both groups. The group provided with phones improved more,<br />
<strong>and</strong> its gains were larger by the last assessment. The mobile phone intervention was also found to be cost-effective. However, there was high attrition between the first <strong>and</strong><br />
second sessions as a result of a drought.<br />
Sources: Aker et al. (2012); UNESCO (2016a).<br />
2016 • GLOBAL EDUCATION MONITORING REPORT 279
15<br />
TABLE 15.1:<br />
Youth <strong>and</strong> adult literacy<br />
Youth literacy<br />
rate%<br />
Gender parity index<br />
Illiterate youth<br />
(000)<br />
Adult literacy<br />
rate %<br />
Gender parity<br />
index<br />
Illiterate adults<br />
(000)<br />
2005–2014 2005–2014 2005–2014 2005–2014 2005–2014 2005–2014<br />
World 91 0.96 114 127 85 0.91 757 920<br />
Low income 68 0.85 35 078 57 0.74 134 811<br />
Lower middle income 86 0.93 72 405 74 0.83 493 776<br />
Upper middle income 99 1.00 5 854 94 0.95 114 350<br />
High income<br />
Caucasus <strong>and</strong> Central Asia 100 1.00 15 100 1.00 120<br />
Eastern <strong>and</strong> South-eastern Asia 99 1.00 3 217 95 0.96 84 135<br />
Europe <strong>and</strong> Northern America<br />
Latin America <strong>and</strong> the Caribbean 98 1.00 2 266 93 0.99 33 373<br />
Northern Africa <strong>and</strong> Western Asia 93 0.96 6 073 82 0.86 52 878<br />
Pacific<br />
Southern Asia 84 0.91 52 848 68 0.76 389 408<br />
Sub-Saharan Africa 71 0.86 48 765 60 0.76 188 315<br />
Source: UIS database.<br />
youth literacy rate was as low as 71% in sub-Saharan<br />
Africa (Table 15.1).<br />
In recent years, the estimation of literacy rates has been<br />
supported by the availability of direct assessments in<br />
two large international comparative household survey<br />
programmes, the DHS <strong>and</strong> the Multiple Indicator Cluster<br />
Surveys (MICS). Both ask individuals aged 15 to 49 to<br />
read a simple sentence from a card. In recent MICS<br />
rounds, the literacy questions are asked only of women.<br />
The UIS began using direct assessments in countries<br />
lacking other sources of information, then gradually<br />
extended them more systematically to improve literacy<br />
estimates, especially in low income countries.<br />
Increased use of direct assessments has reduced<br />
discrepancies between official literacy rates <strong>and</strong> those<br />
obtained from direct assessments in household surveys.<br />
For example, among 19 low income countries, the median<br />
female youth literacy rate reported in the 2010 GMR<br />
was nine percentage points above the corresponding<br />
estimate based on DHS <strong>and</strong> MICS; the gap had been<br />
reduced to four percentage points for the literacy rates<br />
reported in the 2015 GMR.<br />
However, there are still discrepancies in both directions.<br />
For example, the estimated female youth literacy rate<br />
based on the 2010 MICS in Chad is 27 percentage points<br />
below the official rate, while the 2013 DHS in Zambia<br />
estimates the female youth literacy rate to be 21 percentage<br />
points higher than the official rate (Figure 15.3).<br />
The use of direct assessments to more accurately<br />
estimate literacy rates needs to be done carefully to<br />
ensure that the literacy rate trend is consistent. For<br />
example, according to the DHS, the primary education<br />
attainment rate of young women increased from<br />
12% in 2001 to 29% in 2012 in Mali <strong>and</strong> from 14% in<br />
1999 to 33% in 2012 in Guinea. But while the official<br />
female youth literacy rate increased from 24% in 2003 to<br />
39% in 2011 in Mali, it appears to have fallen from 34% in<br />
2003 to 22% in 2010 in Guinea.<br />
Overall, official literacy rates have improved considerably.<br />
Yet, this should not distract from a key shortcoming: even<br />
direct assessments measure only the most rudimentary<br />
of literacy skills. Effectively determining proficiency levels<br />
requires more nuanced <strong>and</strong> intensive efforts to assess<br />
the abilities of youth <strong>and</strong> adults ‘to identify, underst<strong>and</strong>,<br />
interpret, create, communicate <strong>and</strong> compute’.<br />
LITERACY AND NUMERACY<br />
PROFICIENCY LEVELS<br />
In the past 20 years, international interest in in-depth<br />
assessments of literacy <strong>and</strong> numeracy skills has<br />
increased (UNESCO, 2015d). For many high income<br />
countries, information on adult literacy <strong>and</strong> numeracy<br />
proficiency is available from the Organisation for<br />
Economic Co-operation <strong>and</strong> Development (OECD)<br />
Programme for the International Assessment of<br />
Adult Competencies (PIAAC) <strong>and</strong> its predecessors,<br />
the International Adult Literacy Survey (IALS) <strong>and</strong> the<br />
280<br />
CHAPTER 15 | TARGET 4.6 – LITERACY AND NUMERACY
15<br />
FIGURE 15.3:<br />
In many countries, literacy rates differ widely between official <strong>and</strong> household survey sources<br />
Female youth literacy rate as reported by UIS (2005–2012) <strong>and</strong> as directly assessed through household surveys (2008–2014), selected countries<br />
100<br />
90<br />
80<br />
70<br />
Female youth literacy rate (%)<br />
60<br />
50<br />
40<br />
30<br />
UNESCO Institute of Statistics<br />
Demographic <strong>and</strong> Health Surveys/<br />
Multiple Indicator Cluster Surveys (DHS/MICS)<br />
20<br />
10<br />
0<br />
Niger<br />
Guinea<br />
C. A. R.<br />
Benin<br />
Afghanistan<br />
Burkina Faso<br />
Liberia<br />
Côte d’Ivoire<br />
Mali<br />
Chad<br />
Ethiopia<br />
Mauritania<br />
D. R. Congo<br />
Sierra Leone<br />
Mozambique<br />
Nigeria<br />
Zambia<br />
Senegal<br />
Pakistan<br />
Madagascar<br />
Gambia<br />
Bhutan<br />
Malawi<br />
Haiti<br />
Togo<br />
U. R. Tanzania<br />
Cameroon<br />
Congo<br />
S. Tome/Principe<br />
Nepal<br />
Rw<strong>and</strong>a<br />
Timor-Leste<br />
Lao PDR<br />
Iraq<br />
Kenya<br />
Bangladesh<br />
Ghana<br />
Sudan<br />
Ug<strong>and</strong>a<br />
Cambodia<br />
Egypt<br />
Comoros<br />
Burundi<br />
Gabon<br />
Namibia<br />
Lesotho<br />
Zimbabwe<br />
Guyana<br />
Swazil<strong>and</strong><br />
Honduras<br />
Tunisia<br />
Viet Nam<br />
Dominican Rep.<br />
TFYR Macedonia<br />
Philippines<br />
Jamaica<br />
Peru<br />
Costa Rica<br />
Colombia<br />
Indonesia<br />
Jordan<br />
Suriname<br />
Albania<br />
Mongolia<br />
Bolivia<br />
Serbia<br />
Palestine<br />
Montenegro<br />
Bosnia/Herzeg.<br />
Kyrgyzstan<br />
Ukraine<br />
Armenia<br />
Belarus<br />
Kazakhstan<br />
Tajikistan<br />
Rep. Moldova<br />
Sources: UIS database (for UIS rates); GEM Report team analysis (for DHS/MICS rates).<br />
Adult Literacy <strong>and</strong> Lifeskills Survey (ALL). However, such<br />
assessments are lacking for most low <strong>and</strong> middle income<br />
countries. Exceptions include the World Bank Skills<br />
Toward Employment <strong>and</strong> Productivity (STEP) survey, the<br />
UIS Literacy Assessment Monitoring Programme (LAMP)<br />
<strong>and</strong> a few nationally administered surveys.<br />
International collaboration is needed to facilitate the<br />
conducting of comparative literacy <strong>and</strong> numeracy<br />
assessments. Three challenges need to be overcome.<br />
First, operational definitions of literacy <strong>and</strong> numeracy<br />
need to be agreed <strong>and</strong> validated. Second, a reporting<br />
framework is needed that captures levels of proficiency<br />
<strong>and</strong> what tasks survey participants can perform with<br />
their literacy <strong>and</strong> numeracy skills. Third, implementation<br />
issues, including costs, sampling dem<strong>and</strong>s <strong>and</strong> technical<br />
capacity, need to be resolved. The cost of assessments in<br />
high income countries <strong>and</strong> urban areas of some middle<br />
income countries is beyond reach for poorer countries.<br />
Cost-effective yet meaningful literacy <strong>and</strong> numeracy<br />
assessment modules need to be developed.<br />
The number of countries carrying out direct assessments<br />
of literacy <strong>and</strong> numeracy skills needs to increase.<br />
This would enable the true skills of adults in a range<br />
of contexts to be captured <strong>and</strong> global indicator 4.6.1<br />
to be monitored. However, coordinating such efforts<br />
across countries remains an issue. This section looks<br />
at challenges for literacy <strong>and</strong> numeracy assessment,<br />
placing more emphasis on numeracy, which has received<br />
less attention so far.<br />
LITERACY<br />
Experience in conducting assessments using different<br />
definitions to describe adult literacy has grown over the<br />
years. For PIAAC, which is conducted in 40 countries,<br />
literacy is defined as ‘the ability to underst<strong>and</strong>, evaluate,<br />
use <strong>and</strong> engage with written texts to participate in<br />
society, to achieve one’s goals <strong>and</strong> to develop one’s<br />
knowledge <strong>and</strong> potential’ (OECD, 2013a). Literacy is<br />
conceived as an activity with a purpose <strong>and</strong> social<br />
function.<br />
2016 • GLOBAL EDUCATION MONITORING REPORT 281
15<br />
PIAAC goes beyond the false dichotomy of literate vs<br />
non-literate <strong>and</strong> establishes a reporting framework of<br />
six proficiency levels describing tasks individuals can<br />
typically undertake within a relevant score range. For<br />
example, individuals at level 2 ‘can integrate two or more<br />
pieces of information based on criteria, compare <strong>and</strong><br />
contrast or reason about information <strong>and</strong> make low-level<br />
inferences’; this could be considered a basic proficiency<br />
st<strong>and</strong>ard. In the first round of PIAAC, 15% of adults fell<br />
below this level, ranging from less than 5% in Japan to<br />
almost 28% in Italy. Yet, all the participating countries<br />
were presumed to have achieved universal literacy, in the<br />
most rudimentary sense of being able to read.<br />
The STEP survey, administered in urban areas of middle<br />
income countries, was designed to record results using<br />
PIAAC’s literacy scale. In Colombia, where 75% of<br />
<strong>people</strong> live in urban areas, STEP showed that 36% of the<br />
population in 13 major metropolitan areas scored below<br />
level 2 (Figure 15.4). This st<strong>and</strong>s in sharp contrast with<br />
Colombia’s official literacy rate of 94%.<br />
Extending this approach to additional countries would<br />
require addressing several implementation issues,<br />
starting with developing tools that are robust but<br />
relatively inexpensive. The OECD, UIL <strong>and</strong> UIS recently<br />
agreed to develop a literacy assessment framework to<br />
underpin a short st<strong>and</strong>ardized adult literacy assessment<br />
that will be linked to the PIAAC scale, while being<br />
adapted to the context of each country (OECD, 2016d).<br />
The aim is to create a cost-effective module to collect<br />
data on literacy proficiency: adults would respond<br />
to a series of literacy-related questions as well as a<br />
background questionnaire within 30 minutes as part<br />
of a household visit. The assessment could st<strong>and</strong> alone<br />
but also be administered as a supplement to existing<br />
national studies such as the labour force survey.<br />
FIGURE 15.4:<br />
Assessing literacy on a continuous scale more accurately reflects adult skills<br />
Adult population by literacy proficiency level, 2011–2014<br />
100<br />
80<br />
60<br />
%<br />
40<br />
20<br />
0<br />
Ghana, urban<br />
Kenya, urban<br />
Bolivia, urban<br />
Colombia, urban<br />
Viet Nam, urban<br />
Georgia, urban<br />
Armenia, urban<br />
Ukraine, urban<br />
Chile<br />
Turkey<br />
Italy<br />
Israel<br />
Spain<br />
Greece<br />
Singapore<br />
Slovenia<br />
France<br />
Pol<strong>and</strong><br />
United States<br />
Germany<br />
Irel<strong>and</strong><br />
*United Kingdom<br />
Canada<br />
Denmark<br />
Lithuania<br />
Austria<br />
*Belgium<br />
Sweden<br />
Estonia<br />
Korea<br />
Australia<br />
Norway<br />
New Zeal<strong>and</strong><br />
Netherl<strong>and</strong>s<br />
Czech Rep.<br />
Slovakia<br />
Finl<strong>and</strong><br />
Japan<br />
STEP<br />
PIAAC<br />
Below level 1<br />
Level 1<br />
Level 3 <strong>and</strong> above<br />
Note: For countries with an asterisk (*), the PIAAC data refer to individual regions only: Engl<strong>and</strong> <strong>and</strong> Northern Irel<strong>and</strong> for the United Kingdom, <strong>and</strong><br />
Fl<strong>and</strong>ers for Belgium.<br />
Sources: OECD (2013a; 2016d) <strong>and</strong> GEM Report team analysis using World Bank STEP data.<br />
Level 2<br />
282<br />
CHAPTER 15 | TARGET 4.6 – LITERACY AND NUMERACY
15<br />
The assessment would need to have enough test items<br />
to accurately locate assessed individuals on a particular<br />
level of the scale. It should also be possible to identify<br />
whether individuals with very low literacy have problems<br />
mastering the basic components of reading. One option<br />
would be to assess the basic building blocks for reading<br />
comprehension, including knowledge of vocabulary,<br />
underst<strong>and</strong>ing of sentence logic <strong>and</strong> fluency in reading<br />
text passages. Considerable research would be required<br />
to ensure cross-cultural validity. As the section below<br />
on numeracy points out, care should be taken to adopt<br />
a model that is both relevant <strong>and</strong> feasible for countries<br />
with few resources.<br />
NUMERACY<br />
While the concept of numeracy connotes different things<br />
to different <strong>people</strong>, common themes are found in the<br />
definitions used in international assessments. First, they<br />
capture a continuum of skills. Second, they focus on<br />
competencies to effectively engage with quantitative<br />
tasks in everyday life, rather than on what <strong>people</strong> should<br />
have learned in school. Third, they refer to a broader set<br />
of knowledge <strong>and</strong> skills than just the ability to count,<br />
estimate <strong>and</strong> measure.<br />
In PIAAC, numeracy is defined as ‘the ability to<br />
access, use, interpret, <strong>and</strong> communicate mathematical<br />
information <strong>and</strong> ideas, in order to engage in <strong>and</strong><br />
manage the mathematical dem<strong>and</strong>s of a range of<br />
situations in adult life’ (PIAAC Numeracy Expert Group,<br />
2009; Gal <strong>and</strong> Tout, 2014; Tout <strong>and</strong> Gal, 2015). National<br />
<strong>and</strong> international assessments share aspects of this<br />
definition <strong>and</strong> other operational aspects to a lesser or<br />
greater extent (Box 15.2).<br />
Numeracy assessment is feasible in low <strong>and</strong><br />
middle income countries, though issues of validity,<br />
comparability <strong>and</strong> policy relevance need to be addressed<br />
given the diverse needs <strong>and</strong> technical capacities of<br />
stakeholders. One assessment system is unlikely to<br />
address the information needs of all stakeholders even in<br />
a single high income country, let alone in a large number<br />
of countries. To provide useful monitoring data by 2030,<br />
a successful approach has to balance the ability of a<br />
country to proceed on its own against the need for its<br />
assessment to meet global quality st<strong>and</strong>ards. For poorer<br />
countries, a model is needed that dem<strong>and</strong>s modest<br />
resources <strong>and</strong> time, <strong>and</strong> fits local technical capacity <strong>and</strong><br />
policy needs (Gal, 2016).<br />
BOX 15.2<br />
Differences between national <strong>and</strong> international<br />
numeracy assessments<br />
A review of three waves of OECD numeracy surveys (IALS, ALL<br />
<strong>and</strong> PIAAC), LAMP (which carried out surveys in Jordan, Mongolia,<br />
Palestine <strong>and</strong> Paraguay) <strong>and</strong> four national surveys (Bangladesh,<br />
Brazil, France <strong>and</strong> Kenya) suggests several areas for comparison.<br />
Brazil, Kenya <strong>and</strong> the LAMP countries adopted a broad definition<br />
of adult numeracy that is similar to that of PIAAC. Bangladesh <strong>and</strong><br />
France focused on a narrower set of arithmetic operations <strong>and</strong> basic<br />
functional numeracy skills; for both countries, the assessment<br />
was designed to identify low ability adults who could benefit from<br />
public programmes.<br />
The LAMP countries <strong>and</strong> France measured <strong>and</strong> reported numeracy<br />
results separately from those for literacy. In contrast, Bangladesh,<br />
Brazil <strong>and</strong> Kenya considered numeracy an integral part of literacy<br />
<strong>and</strong> did not report separate results, instead providing a combined<br />
result on functional literacy.<br />
The potential influence of literacy skills on performance of<br />
numeracy tasks was acknowledged. In LAMP <strong>and</strong> PIAAC, the design<br />
of items was changed to reduce literacy dem<strong>and</strong>s or text density.<br />
In France, an oral assessment was used. There were also differing<br />
levels of text usage. For example, in Bangladesh more items looked<br />
like school arithmetic exercises, using symbols <strong>and</strong> no text.<br />
Survey sessions per household ranged on average from 60 to<br />
90 minutes <strong>and</strong> numeracy was only one of several domains<br />
assessed alongside literacy, with additional items in a background<br />
questionnaire. Given the time constraint, it is not surprising that the<br />
numeracy tests were short: 12 items in Bangladesh, 18 in France <strong>and</strong><br />
Kenya, <strong>and</strong> 25 (out of a pool of 57) in PIAAC.<br />
Other differences in key aspects of the assessment framework<br />
included the difficulty of items (how they were spread across a<br />
continuum of levels from ‘easy’ to ‘difficult’), their contextualization<br />
(context-free computational items or items embedded in a<br />
particular cultural <strong>and</strong> functional context) <strong>and</strong> an estimation of<br />
proficiency (a simple total score or psychometric modelling).<br />
The levels of reporting used further complicate comparisons. LAMP<br />
reports on three numeracy levels, some countries used four levels<br />
ranging from non-literate to advanced literacy, <strong>and</strong> PIAAC used<br />
a five-level system plus the additional category ‘below level 1’.<br />
Consequently, it is not possible to benchmark results from one<br />
country against another.<br />
Source: Gal (2016).<br />
2016 • GLOBAL EDUCATION MONITORING REPORT 283
15<br />
With respect to definitions, numeracy should receive<br />
separate attention from literacy in the monitoring of<br />
adult basic skills. The PIAAC definition of numeracy<br />
could be adopted, with some extension to assess the<br />
most rudimentary skills (for example, the ability to sort<br />
objects) that are necessary for adults to carry out even<br />
the simplest numeracy tasks. This would provide more<br />
information at the low end of the numeracy reporting<br />
scale to drive policy interventions.<br />
The choice of a reporting framework – the number<br />
of reporting levels, the knowledge <strong>and</strong> skills they<br />
represent <strong>and</strong> the labels used – will depend on different<br />
considerations.<br />
The names<br />
given to levels<br />
The names given to<br />
of performance<br />
levels of performance carry value<br />
in literacy <strong>and</strong><br />
judgement, such<br />
as ‘semi-literate’<br />
numeracy can carry<br />
in Bangladesh or<br />
value judgement, such ‘minimum mastery<br />
as ‘semi-literate’ in<br />
level’ in Kenya. What<br />
is ‘low’ or ‘high’<br />
Bangladesh or ‘minimum<br />
is relative to the<br />
mastery level’ in Kenya social <strong>and</strong> economic<br />
progress of each<br />
country. These<br />
considerations must be taken into account. Finally, when<br />
more reporting levels are desired, more items are needed<br />
to cover each level reliably.<br />
A reporting framework of at least four levels may be<br />
preferable. LAMP <strong>and</strong> most of the countries reviewed<br />
included in the lowest level both those who have no skills<br />
<strong>and</strong> those with low skills. Yet, there is a fundamental<br />
difference between literacy <strong>and</strong> numeracy in this regard.<br />
Persons who are deemed ‘illiterate’ (i.e. who cannot read<br />
<strong>and</strong> write at all) cannot automatically be considered<br />
‘innumerate’; several mathematical practices are<br />
believed to be universal even in non-literate cultures. In<br />
other words, <strong>people</strong> may still have selected functional<br />
computational or context-specific mathematical skills.<br />
It is therefore necessary to distinguish between<br />
<strong>people</strong> with no formal skills (those who have relatively<br />
few mental calculation skills beyond counting simple<br />
quantities <strong>and</strong> who cannot underst<strong>and</strong> the meaning of<br />
written digits) <strong>and</strong> with low formal skills (those who can<br />
engage in some mental calculations using indigenous<br />
number systems or measurement techniques but<br />
know few print-based or formal numeracy symbols <strong>and</strong><br />
systems, even if they may be able to complete very<br />
simply written math problems).<br />
A basic level of numeracy would describe individuals<br />
with mental <strong>and</strong> written numeracy skills, including<br />
mathematical operations typically learned in school,<br />
as well as everyday mathematics, such as estimates<br />
<strong>and</strong> graphs, that might be used in newspapers. This<br />
level could vary widely in different societies, depending<br />
on economic development <strong>and</strong> urbanization or<br />
other country-specific factors, <strong>and</strong> would need to be<br />
st<strong>and</strong>ardized.<br />
Finally, an advanced level would describe individuals who<br />
can, with little difficulty or few errors, perform various<br />
arithmetic functions in formal school <strong>and</strong> everyday<br />
settings, locate <strong>and</strong> use quantitative information in<br />
assorted displays, solve multistep calculations <strong>and</strong> use<br />
measuring devices.<br />
Implementation issues include the number, types <strong>and</strong><br />
range of items in terms of content areas, difficulty<br />
levels, amount of text <strong>and</strong> other parameters (e.g. how<br />
authentic the settings are or whether open-ended<br />
responses should be used instead of multiple choice<br />
items). However, the starting point should be based on<br />
conducting the survey. Realistically, for instance, how<br />
many items can be administered? Assuming the survey<br />
can take up to 90 minutes per respondent, countries <strong>and</strong><br />
the international education community face a choice<br />
between two options in assessing numeracy skills.<br />
The first is to use a testing model that adapts to<br />
respondents’ ability, as was done in Brazil <strong>and</strong> France<br />
<strong>and</strong> by LAMP <strong>and</strong> PIAAC. This includes an initial test<br />
that screens out those with very low skills. Often, it<br />
covers a broader range of skills <strong>and</strong> difficulty levels <strong>and</strong><br />
requires a larger number of items to choose from. But<br />
such designs are much costlier due to the need to train<br />
personnel <strong>and</strong> use computer technology adapted to<br />
multiple scripts <strong>and</strong> indigenous languages. Further, they<br />
require sophisticated modelling <strong>and</strong> a high capacity for<br />
statistical analysis.<br />
The second option is to use a simpler design in which<br />
all respondents receive the same assessment items,<br />
as Bangladesh <strong>and</strong> Kenya have done. This enables a<br />
country to do its own analysis. However, the number of<br />
usable items is lower <strong>and</strong> it may not be possible to cover<br />
all desired reporting levels with enough items, which<br />
284<br />
CHAPTER 15 | TARGET 4.6 – LITERACY AND NUMERACY
15<br />
may reduce the assessment’s validity <strong>and</strong> reliability.<br />
Nevertheless, this option may be more realistic <strong>and</strong> able<br />
to be implemented regularly.<br />
A critical issue for both options is cross-country<br />
comparability. How can countries make comparisons of<br />
numeracy skills if they use different types of items, scale<br />
them in different ways <strong>and</strong> use different formulas to<br />
assign items to reporting levels?<br />
CONCLUSION<br />
The new international agenda promises to improve our<br />
underst<strong>and</strong>ing of population literacy <strong>and</strong> numeracy<br />
skills. These skills are important for poverty reduction,<br />
employability, healthier lives, <strong>and</strong> social inclusion.<br />
This section has provided a brief overview of the<br />
opportunities <strong>and</strong> challenges that accompany the<br />
monitoring of this new agenda.<br />
In the first option, countries would use statistical analysis<br />
to equate their skills distribution in terms of a common<br />
scale. In the second, an international expert group<br />
could create a common pool of 40 to 50 assessment<br />
items that would fit the reporting (i.e. difficulty) levels<br />
in terms of the dem<strong>and</strong>s of tasks. All countries would<br />
draw items from the same international item pool <strong>and</strong> be<br />
permitted to translate <strong>and</strong> adapt them to local systems<br />
<strong>and</strong> circumstances (e.g. numbers <strong>and</strong> measurement<br />
units). But they would retain the underlying intent of<br />
mathematical <strong>and</strong> statistical dem<strong>and</strong>s.<br />
The latter approach would be somewhat less reliable<br />
<strong>and</strong> valid than the proficiency estimates created, for<br />
example, by PIAAC, which uses a longer test <strong>and</strong> more<br />
sophisticated statistical procedures. However, it would<br />
arguably create the first ever way for many countries<br />
to report the percentage of their citizens at multiple<br />
levels of numeracy proficiency, using a common item<br />
pool <strong>and</strong> common reporting terminology, thus offering<br />
in effect a measure consistent with the requirements of<br />
global indicator 4.6.1. It would also be compatible with<br />
current practices in many countries <strong>and</strong> therefore have<br />
the potential to be understood by policy-makers <strong>and</strong><br />
launched quickly.<br />
The global indicator draws attention of policy makers<br />
to the importance of different levels of these skills <strong>and</strong><br />
the need to stop thinking about ‘eradicating’ illiteracy<br />
<strong>and</strong> innumeracy. But this will require coordinated action<br />
<strong>and</strong> choices to be made between competing options for<br />
assessing skills.<br />
ENDNOTES<br />
1. This section draws on Gal (2016).<br />
This approach also uses many of the actual working<br />
processes of comparative large-scale assessments.<br />
In all of them, joint expert groups agree a conceptual<br />
framework, solicit items from participating countries,<br />
create a common item pool <strong>and</strong> try to gauge difficulty<br />
levels, using a variety of consensus-building or st<strong>and</strong>ardsetting<br />
procedures (Tannenbaum <strong>and</strong> Katz, 2013). A<br />
key step is to identify a focal institution to facilitate<br />
coordination. All countries engage in a process of<br />
localization <strong>and</strong> adaptation. This preparatory stage could<br />
take two to three years, assuming partner countries<br />
contribute items to the pool. Afterwards, countries<br />
should be able to carry out surveys within a year or two.<br />
2016 • GLOBAL EDUCATION MONITORING REPORT 285
16<br />
In Cairo, the Recycling<br />
School, created with<br />
the support of UNESCO,<br />
gives children from the<br />
Zabbaleen community<br />
basic education,<br />
as well as health<br />
recommendations <strong>and</strong><br />
practical training to<br />
turn recycling into a<br />
true profession.<br />
CREDIT: Anne-Laure Cahen/Sipa Press/<br />
GEM Report<br />
KEY MESSAGES<br />
Target 4.7 is closely aligned with the vision of the 2030 SDG agenda. But the proposed ways of measuring<br />
progress towards it do not reflect its full ambition.<br />
Curricula are the main way countries promote knowledge <strong>and</strong> skills on sustainable development <strong>and</strong> global<br />
citizenship to students. Most countries report that human rights education is included in their curricula <strong>and</strong><br />
education st<strong>and</strong>ards. Comprehensive sexuality education, however, is not widely included.<br />
Three-quarters of countries had some emphasis on sustainable development in their curricula over 2005–2015,<br />
but far fewer referred to terms related to global citizenship. Only 15% of countries included key terms related to<br />
gender equality.<br />
Textbooks are a valuable source of information about national commitment to sustainable development. Close<br />
to 50% of secondary school textbooks mentioned human rights over 2000–2013, compared with around 5% over<br />
1890–1913. A regular monitoring mechanism on textbooks is needed.<br />
Teachers need to be trained to teach sustainable development <strong>and</strong> global citizenship, yet more than twothirds<br />
of European countries do not include these topics in teacher training. The share of countries completely<br />
integrating sustainable development in teacher education rose from 2% in 2005 to 8% in 2013.<br />
Monitoring knowledge <strong>and</strong> skills relevant to target 4.7 is not easy. Few assessments examine underst<strong>and</strong>ing<br />
of history, politics, geography, science <strong>and</strong> their interdependence. An assessment of grade 8 students in 38<br />
countries showed that only two-thirds were familiar with the Universal Declaration of Human Rights.<br />
Initiatives to monitor this target must address the tension between national values <strong>and</strong> commitment to a global<br />
agenda. Equally important is the need to evaluate knowledge <strong>and</strong> skills about sustainable development among<br />
adults as well as children <strong>and</strong> adolescents.<br />
286<br />
CHAPTER 16 | TARGET 4.7 – SUSTAINABLE DEVELOPMENT AND GLOBAL CITIZENSHIP
16<br />
CHAPTER 16<br />
Sustainable Development Goal 4.7<br />
TARGET 4.7<br />
Sustainable development<br />
<strong>and</strong> global citizenship<br />
By 2030, ensure that all learners acquire the knowledge <strong>and</strong> skills needed to promote<br />
sustainable development, including, among others, through education for sustainable<br />
development <strong>and</strong> sustainable lifestyles, human rights, gender equality, promotion<br />
of a culture of peace <strong>and</strong> non-violence, global citizenship <strong>and</strong> appreciation of<br />
cultural diversity <strong>and</strong> of culture’s contribution to sustainable development<br />
GLOBAL INDICATOR 4.7.1 – Extent to which (i) global citizenship education <strong>and</strong> (ii) education for<br />
sustainable development, including gender equality <strong>and</strong> human rights, are mainstreamed at all levels in (a)<br />
national education policies, (b) curricula, (c) teacher education <strong>and</strong> (d) student assessment<br />
THEMATIC INDICATOR 26 – Percentage of students by age group (or education level) showing adequate<br />
underst<strong>and</strong>ing of issues relating to global citizenship <strong>and</strong> sustainability<br />
THEMATIC INDICATOR 27 – Percentage of 15-year-old students showing proficiency in knowledge of<br />
environmental science <strong>and</strong> geoscience<br />
THEMATIC INDICATOR 28 – Percentage of schools that provide life skills-based HIV <strong>and</strong> sexuality education<br />
THEMATIC INDICATOR 29 – Extent to which the framework on the World Programme on Human Rights<br />
Education is implemented nationally (as per UNGA Resolution 59/113)<br />
2016 • GLOBAL EDUCATION MONITORING REPORT 287
16<br />
International st<strong>and</strong>ard-setting instruments............................................................ 289<br />
Curricula...................................................................................................................................... 289<br />
Textbooks.................................................................................................................................... 294<br />
Teacher education.................................................................................................................. 296<br />
Activities outside the classroom..................................................................................... 298<br />
Outcomes................................................................................................................................... 299<br />
Target 4.7 introduces education for global citizenship<br />
<strong>and</strong> sustainable development, <strong>and</strong> several related<br />
topics, explicitly linking education to other Sustainable<br />
Development Goals (SDGs) <strong>and</strong> capturing the<br />
transformative aspirations of the new global development<br />
agenda. More than any other education target, it<br />
touches on the social, humanistic <strong>and</strong> moral purposes<br />
of education, <strong>and</strong> their impact on policies, curricular<br />
contents <strong>and</strong> teacher preparation. It also acknowledges<br />
the important role of culture <strong>and</strong> the cultural dimensions<br />
of education.<br />
The Inter-agency <strong>and</strong> Expert Group on SDG Indicators<br />
proposed a broad global indicator to capture the wide<br />
scope of target 4.7: ‘the extent to which global citizenship<br />
education <strong>and</strong> education for sustainable development are<br />
mainstreamed in national education policies, curricula<br />
content, teacher education <strong>and</strong> student assessment’.<br />
This measure embraces indicators relating to inputs <strong>and</strong><br />
processes, but sidesteps the target’s aspirational intent<br />
of ensuring that all learners, young <strong>and</strong> old, acquire<br />
knowledge <strong>and</strong> skills aligned with the transformative<br />
2030 Agenda for Sustainable Development.<br />
This chapter focuses on the proposed global indicator<br />
<strong>and</strong> examines how global citizenship <strong>and</strong> sustainable<br />
development are included in system-wide interventions,<br />
curricular materials such as national curriculum<br />
frameworks <strong>and</strong> textbooks, <strong>and</strong> teacher education<br />
programmes. It addresses themes underpinning target<br />
4.7, including human rights, gender equality, climate<br />
change, sustainable livelihoods, sexual <strong>and</strong> reproductive<br />
rights, health <strong>and</strong> well-being, <strong>and</strong> responsible <strong>and</strong><br />
engaged citizenship.<br />
Target 4.7 is closely aligned with a lifelong learning<br />
framework, <strong>and</strong> does not specify the education levels or<br />
age groups to which its themes apply. Yet, the proposed<br />
global <strong>and</strong> thematic indicators mainly focus on children<br />
<strong>and</strong> adolescents in formal<br />
education. None of<br />
the proposed thematic<br />
Data gaps for<br />
indicators explicitly<br />
monitoring national capture adult learners in<br />
non-formal <strong>and</strong> informal<br />
<strong>and</strong> global progress<br />
education settings. Data<br />
towards target 4.7 gaps for monitoring<br />
outside the formal national <strong>and</strong> global<br />
progress towards target<br />
education system are<br />
4.7 outside the formal<br />
particularly wide education system are<br />
particularly wide. Hence,<br />
this chapter discusses<br />
recent initiatives to collect data more closely aligned<br />
with the concepts in target 4.7. Given the fluidity of<br />
country initiatives to address the many issues involved,<br />
it is important to use existing data sources to provide<br />
initial benchmarks for national <strong>and</strong> regional authorities.<br />
Identifying indicators to monitor knowledge <strong>and</strong> skills<br />
that are needed to promote sustainable development –<br />
<strong>and</strong> that have meaning across a wide spectrum of socioeconomic<br />
levels, political systems <strong>and</strong> cultural contexts<br />
– remains arduous (Fricke et al., 2015). This chapter<br />
288<br />
CHAPTER 16 | TARGET 4.7 – SUSTAINABLE DEVELOPMENT AND GLOBAL CITIZENSHIP
16<br />
examines several initiatives that could be used<br />
to monitor acquisition of relevant knowledge<br />
<strong>and</strong> skills.<br />
Individuals may acquire knowledge, underst<strong>and</strong>ing <strong>and</strong><br />
skills but lack the disposition to use them. While target<br />
4.7 does not explicitly say as much, the development<br />
of the right attitudes is an important dimension of<br />
global citizenship education (GCED) <strong>and</strong> education for<br />
sustainable development (ESD). This chapter thus briefly<br />
reviews several approaches to monitoring adolescents,<br />
youth <strong>and</strong> adult attitudes, <strong>and</strong> highlights challenges in<br />
establishing a global monitoring mechanism.<br />
INTERNATIONAL STANDARD-<br />
SETTING INSTRUMENTS<br />
Almost all the concepts mentioned in target 4.7<br />
that promote sustainable development are found in<br />
international frameworks <strong>and</strong> conventions, notably the<br />
International Recommendation concerning Education<br />
for International Underst<strong>and</strong>ing, Co-operation <strong>and</strong><br />
Peace <strong>and</strong> Education relating to Human Rights <strong>and</strong><br />
Fundamental Freedoms, adopted by member states at<br />
UNESCO’s 18th session in 1974. This recommendation<br />
lays out a normative framework for countries on issues<br />
related to peace <strong>and</strong> human rights in the goals, policies,<br />
contents <strong>and</strong> teacher training materials of national<br />
education systems (Arora et al., 1994; Savolainen, 2010;<br />
UNESCO, 2008).<br />
Although compliance is voluntary, UNESCO has<br />
monitored member states’ implementation on five<br />
occasions since 1974 (UNESCO, 2013). These monitoring<br />
exercises aimed to track the extent to which human<br />
rights materials <strong>and</strong> principles had been incorporated<br />
into the legal, administrative, educational <strong>and</strong> teaching<br />
tools that guide everyday practices in education (Prada,<br />
2011). Response rates were low, however, though they<br />
increased from 18% of countries in 2009 to 28% in 2013<br />
(UNESCO, 2009; 2013).<br />
The percentage of countries that responded<br />
to monitoring exercises of human rights in<br />
education, legal <strong>and</strong> administrative systems<br />
rose from 18% in 2009 to 28% in 2013<br />
The adoption of the SDGs highlighted strong<br />
alignment between the 1974 recommendation <strong>and</strong><br />
target 4.7 concepts. As a result, the significance of<br />
effective monitoring of country implementation of the<br />
recommendation became clearer. In 2016, UNESCO<br />
initiated a sixth consultation, asking member states to<br />
assess implementation of the recommendation over<br />
2013–2016. The terms are relevant to the monitoring of<br />
target 4.7. Member states are asked to report whether<br />
the following topics are included in their curricula <strong>and</strong>,<br />
if so, at which levels of education <strong>and</strong> in which subjects:<br />
peace <strong>and</strong> non-violence, human rights <strong>and</strong> fundamental<br />
freedoms, cultural diversity <strong>and</strong> tolerance, <strong>and</strong> human<br />
survival <strong>and</strong> well-being. Additional questions monitor the<br />
inclusion of these topics in textbooks, teacher education,<br />
student assessments/examinations, <strong>and</strong> programmes<br />
outside the school system, including non-formal<br />
education, informal education, adult education <strong>and</strong><br />
media-based education (UNESCO, 2016e). To increase<br />
response rates, the 2016 questionnaire includes many<br />
more multiple choice questions than before.<br />
Nevertheless, as past low response rates showed, many<br />
national ministries are limited in the capacity to respond<br />
to such surveys <strong>and</strong> the resources to prepare high quality<br />
national reports. Gathering the information to be included<br />
is hampered by the need to coordinate responses across<br />
relevant ministries <strong>and</strong> departments (Yusuf, 2007). It is<br />
difficult to assure the objectivity <strong>and</strong> validity of selfreported<br />
information, which can lower its monitoring<br />
value. Therefore, more systematic <strong>and</strong> rigorous<br />
approaches to monitoring country progress towards<br />
target 4.7 are needed to supplement country reports.<br />
CURRICULA<br />
Curricula are the main way in which knowledge <strong>and</strong> skills to<br />
promote sustainable development <strong>and</strong> global citizenship<br />
are typically conveyed to students. This section reviews<br />
mechanisms to monitor the adoption of topics relevant<br />
to sustainable development <strong>and</strong> global citizenship<br />
into official curricula. It then discusses a comparative<br />
approach for monitoring curricula at the global level.<br />
HUMAN RIGHTS EDUCATION<br />
One thematic indicator proposes measuring the extent<br />
of national implementation of the framework on the<br />
World Programme on Human Rights Education, in which<br />
the Office of the United Nations High Commissioner for<br />
2016 • GLOBAL EDUCATION MONITORING REPORT 289
16<br />
Human Rights (OHCHR), in cooperation with UNESCO,<br />
has developed programmes <strong>and</strong> curricula to teach<br />
human rights. This indicator captures elements of target<br />
4.7 as regards human rights, fundamental freedoms <strong>and</strong><br />
tolerance, among others.<br />
The first phase of the World Programme for Human<br />
Rights Education, 2005–2009, focused on integrating<br />
human rights education in primary <strong>and</strong> secondary<br />
schools. An evaluation in 2010 analysed implementation<br />
of this aspect, relying primarily on responses to an<br />
OHCHR questionnaire distributed to 192 member states<br />
(UNIACC, 2010).<br />
Most countries, including Australia, Barbados, Chile,<br />
Côte d’Ivoire, Indonesia, Namibia <strong>and</strong> Zambia, reported<br />
human rights education as being integrated into<br />
national curriculum <strong>and</strong> educational st<strong>and</strong>ards. A few<br />
countries teach human rights as a st<strong>and</strong>-alone subject<br />
but many integrate it as a<br />
cross-cutting issue, most<br />
Most countries often in subjects such as<br />
citizenship, civic education<br />
report human rights<br />
<strong>and</strong> social studies, but also<br />
education as being in disciplines such as law,<br />
integrated into religion, life skills, ethical<br />
<strong>and</strong> moral education, <strong>and</strong><br />
national curriculum<br />
environment (UNIACC, 2010).<br />
<strong>and</strong> educational<br />
st<strong>and</strong>ards<br />
The second phase of the<br />
programme, 2010–2014,<br />
focused on human rights<br />
in higher education <strong>and</strong> for teachers <strong>and</strong> educators,<br />
civil servants, law enforcement officials <strong>and</strong> military<br />
personnel. 1 Responses from 28 countries showed that<br />
the topic was most often addressed as a core curricular<br />
element in university undergraduate <strong>and</strong> graduate<br />
faculties or departments of law, political science,<br />
social science <strong>and</strong>/or international relations, as well<br />
as in general humanities <strong>and</strong> socio-economic courses<br />
(OHCHR, 2015).<br />
At the global level, in addition to this programme, the<br />
Universal Periodic Review process <strong>and</strong> the work of Special<br />
Rapporteurs help in monitoring human rights education,<br />
but response rates are low <strong>and</strong> responses insufficiently<br />
systematic for a clear global picture.<br />
To ensure that governments meet their obligations<br />
to report to the international community, review <strong>and</strong><br />
monitoring activities initiated by local actors are very<br />
important. HRE 2020, a civil society coalition to support<br />
<strong>and</strong> strengthen compliance with international human<br />
rights education commitments, recently provided<br />
an indicator framework to systematically document<br />
national commitments to carry out a comprehensive<br />
<strong>and</strong> coordinated effort for human rights education <strong>and</strong><br />
training (HRE 2020, 2015).<br />
Other monitoring efforts have been undertaken on<br />
specific elements tied to universal human rights<br />
frameworks, such as education about the Holocaust<br />
(Box 16.1).<br />
BOX 16.1<br />
Monitoring Holocaust education in curricular content<br />
Education about the Holocaust is expected to provide learners with<br />
knowledge <strong>and</strong> skills to help them become responsible <strong>and</strong> active<br />
global citizens who think critically, value human dignity <strong>and</strong> respect,<br />
reject prejudice that leads to violence <strong>and</strong> genocide, <strong>and</strong> contribute<br />
to a more peaceful, tolerant, inclusive <strong>and</strong> secure world.<br />
Analyses of textbooks worldwide show that Holocaust education<br />
is increasingly taught in the context of universal human rights<br />
frameworks rather than as an isolated European historical event,<br />
thereby reflecting growing expectations about the humanistic <strong>and</strong><br />
universal significance of learning about the Holocaust.<br />
A recent study by UNESCO <strong>and</strong> the Georg Eckert Institute for<br />
International Textbook Research analysed Holocaust education in<br />
272 national secondary-level curricula in 135 countries. It showed the<br />
Holocaust was part of the curriculum in about half of the countries,<br />
with varying contexts <strong>and</strong> terminologies. National curricula tend<br />
to ‘domesticate’ Holocaust history by explaining it in relation to<br />
local histories of mass atrocities. The Holocaust is most frequently<br />
mentioned in history in the context of the Second World War, but<br />
also in relation to human rights <strong>and</strong> human rights violations. In a<br />
comparatively high proportion of curricula in countries in Europe<br />
<strong>and</strong> Northern America, the Holocaust is a compulsory topic.<br />
One-quarter of curricula contain no references to the Holocaust.<br />
Yet, while they do not prescribe specific content, they discuss the<br />
purpose of the subject <strong>and</strong> methods to be used in its teaching.<br />
About one-third of the curricula do not mention the Holocaust<br />
explicitly but refer to its context. For example, in Zimbabwe the<br />
curriculum refers to injustices practised by Nazis <strong>and</strong> atrocities<br />
against minorities, <strong>and</strong> that of the Democratic Republic of the<br />
Congo discusses the harmful effects of Nazism.<br />
Sources: Bromley, (2013); Bromley <strong>and</strong> Russell, (2010); UNESCO<br />
(2014c); Carrier et al. (2015).<br />
290<br />
CHAPTER 16 | TARGET 4.7 – SUSTAINABLE DEVELOPMENT AND GLOBAL CITIZENSHIP
16<br />
COMPREHENSIVE SEXUALITY EDUCATION<br />
One proposed thematic indicator for tracking progress<br />
towards target 4.7 is the percentage of schools providing<br />
life skills-based education on HIV <strong>and</strong> on sexuality.<br />
Comprehensive<br />
sexuality education<br />
Out of 28 countries in is one of the most<br />
pressing <strong>and</strong> universal<br />
Asia <strong>and</strong> the Pacific, 22<br />
priorities for the<br />
included comprehensive<br />
health, well-being<br />
sexuality education <strong>and</strong> development of<br />
young <strong>people</strong>. Recent<br />
in secondary school<br />
evidence indicates<br />
curricula; 12 did at the<br />
that such education<br />
primary level<br />
not only plays an<br />
important role in<br />
preventing negative<br />
sexual <strong>and</strong> reproductive health outcomes, but also offers<br />
a platform to discuss gender issues <strong>and</strong> human rights,<br />
<strong>and</strong> promote respectful, non-violent relationships (UN<br />
Trust Fund <strong>and</strong> Instituto Promundo, 2012; UNFPA, 2007).<br />
Sexual health, gender equality <strong>and</strong> human rights<br />
are interrelated. The 1994 International Conference<br />
on Population <strong>and</strong> Development’s Programme of<br />
Action <strong>and</strong> other international agreements, such as<br />
the Ottawa Charter for Health Promotion, reflect this<br />
relationship <strong>and</strong> make clear that sexuality education<br />
must integrate these domains (Haberl<strong>and</strong> <strong>and</strong><br />
Rogow, 2015). The proposed thematic indicator thus<br />
responds to five elements of target 4.7: human rights,<br />
gender equality, culture of peace, non-violence,<br />
<strong>and</strong> knowledge <strong>and</strong> skills to promote sustainable<br />
development <strong>and</strong> lifestyles (e.g. by helping reduce<br />
early pregnancy <strong>and</strong> family size <strong>and</strong> instill values <strong>and</strong><br />
skills for responsible parenthood).<br />
Several multicountry reviews of comprehensive<br />
sexuality education have been conducted. A review<br />
of 335 national laws, policies, strategies, curricula <strong>and</strong><br />
training materials in 28 countries in Asia <strong>and</strong> the Pacific<br />
showed considerable variation in addressing sexual <strong>and</strong><br />
reproductive health issues. Some countries, including<br />
Cambodia, Indonesia, Malaysia, Thail<strong>and</strong> <strong>and</strong> Viet Nam,<br />
integrated comprehensive sexuality education across<br />
primary <strong>and</strong> secondary education, while there was no<br />
or very limited integration in Brunei Darussalam, the<br />
Islamic Republic of Iran <strong>and</strong> Pakistan. Comprehensive<br />
sexuality education was included in secondary school<br />
curricula in 22 of the 28 countries; 12 did so at the<br />
primary level. Information on curriculum integration at<br />
tertiary level was scarce (UNESCO, 2012c).<br />
Providing comprehensive sexuality education mainly<br />
at the secondary level misses the many adolescents in<br />
much of the world who are not in secondary school. It<br />
is thus important to track the extent to which children<br />
<strong>and</strong> adolescents benefit from such content in non-formal<br />
education. In 17 of the 28 countries, sexuality issues<br />
were included in non-formal education, targeting out-ofschool<br />
youth <strong>and</strong> others, though the scope <strong>and</strong> nature of<br />
these activities were unclear (UNESCO, 2012c).<br />
In 10 countries of sub-Saharan Africa, an in-depth<br />
review of curricula found that most included at least<br />
some information on gender, but the messages were<br />
sometimes contradictory <strong>and</strong> reinforced gender<br />
inequality. Gender-based <strong>and</strong> intimate-partner violence<br />
were sometimes overlooked, including in South Africa,<br />
which has one of the world’s highest rates of sexual<br />
violence. The inclusion of human rights varied but mostly<br />
did not address sexual rights. None of the curricula<br />
addressed sexual diversity. The issue of child marriage<br />
was omitted or poorly addressed in many of the<br />
countries where it is highly prevalent, including Kenya,<br />
Lesotho <strong>and</strong> Malawi (UNESCO <strong>and</strong> UNFPA, 2012).<br />
The Sexuality Education Review <strong>and</strong> Assessment Tool<br />
provides a framework for assessing the scope, content<br />
<strong>and</strong> delivery of comprehensive sexuality education.<br />
Used to assess national sexual education programmes<br />
in 13 countries of sub-Saharan Africa, it showed that<br />
less than half met global st<strong>and</strong>ards for required content<br />
across all age groups. The weakest content was related<br />
to the coverage of gender <strong>and</strong> social norms (Herat et al.,<br />
2014; UNFPA, 2015b).<br />
In Latin America <strong>and</strong> the Caribbean, the International<br />
Planned Parenthood Federation used a st<strong>and</strong>ardized<br />
questionnaire to collect data from 19 countries’ health<br />
<strong>and</strong> education ministries. Only half of the countries<br />
reported comprehensive sexuality education curricula that<br />
adequately included lessons on topics including gender<br />
equality, sexuality, HIV <strong>and</strong> AIDS, violence prevention<br />
<strong>and</strong> interpersonal relationships (Hunt et al., 2014).<br />
Where sexuality education has been integrated into<br />
curricula, its implementation can vary substantially.<br />
The Joint United Nations Programme on HIV/AIDS<br />
(UNAIDS) Inter-Agency Task Team on Education has<br />
developed 15 core indicators on the education response<br />
to HIV. One relates to the percentage of schools that<br />
provided life skills-based HIV <strong>and</strong> sexuality education<br />
in the previous academic year at either primary or<br />
secondary level. Until 2011, this indicator was gathered<br />
through the United Nations General Assembly Special<br />
2016 • GLOBAL EDUCATION MONITORING REPORT 291
16<br />
FIGURE 16.1:<br />
In 32 countries, fewer than half of schools provide life skills-based<br />
HIV education<br />
Percentage of schools that provided life skills-based HIV education at either the<br />
primary or secondary level in the previous academic year, selected countries, 2009-2010<br />
Sub-Saharan Africa<br />
Eastern/<br />
South-east.<br />
Asia<br />
Europe/N. America<br />
Caucasus/<br />
C. Asia<br />
Latin America/Caribbean<br />
Paific<br />
Togo<br />
Liberia<br />
Côte d’Ivoire<br />
Burkina Faso<br />
Nigeria<br />
C. A. R.<br />
Comoros<br />
Eritrea<br />
Ethiopia<br />
Djibouti<br />
Mali<br />
Burundi<br />
D. R. Congo<br />
Chad<br />
Ghana<br />
Niger<br />
Guinea<br />
Swazil<strong>and</strong><br />
Lesotho<br />
Botswana<br />
Cabo Verde<br />
Kenya<br />
South Africa<br />
Zimbabwe<br />
Timor-Leste<br />
Cambodia<br />
Lao PDR<br />
Japan<br />
Singapore<br />
Croatia<br />
Belarus<br />
Bulgaria<br />
Montenegro<br />
Greece<br />
Lithuania<br />
Ukraine<br />
Czech Rep.<br />
Romania<br />
Russian Fed.<br />
Finl<strong>and</strong><br />
Luxembourg<br />
Sweden<br />
Tajikistan<br />
Kazakhstan<br />
Kyrgyzstan<br />
Azerbaijan<br />
Uzbekistan<br />
Suriname<br />
Guatemala<br />
Dominican Rep.<br />
Honduras<br />
Haiti<br />
Belize<br />
Jamaica<br />
St Kitts/Nevis<br />
Saint Lucia<br />
Ecuador<br />
Bahamas<br />
Barbados<br />
Nicaragua<br />
Uruguay<br />
Grenada<br />
Antigua/Barbuda<br />
Dominica<br />
St Vincent/Grenad.<br />
El Salvador<br />
Venezuela, B. R.<br />
Vanuatu<br />
Papua N. Guinea<br />
Tuvalu<br />
Session country reporting system (Clarke <strong>and</strong> Aggleton,<br />
2012). However, there were no st<strong>and</strong>ard guidelines for<br />
what constituted life skills-based education in response<br />
to HIV, <strong>and</strong> the information was self-reported, making its<br />
quality difficult to establish.<br />
Despite such drawbacks, the indicators suggested how<br />
life skills-based HIV education was being carried out<br />
(Figure 16.1). In 2009, in sub-Saharan Africa, it had been<br />
provided in Burkina Faso, Côte d’Ivoire, Liberia <strong>and</strong> Togo<br />
in less than 10% of schools in the past academic year,<br />
compared with over 85% in some countries including<br />
Botswana, Swazil<strong>and</strong> <strong>and</strong> Zimbabwe (UNAIDS, 2011).<br />
The inclusion of this indicator in education management<br />
information systems <strong>and</strong> school-based surveys has<br />
been field-tested in some countries, including the United<br />
Republic of Tanzania <strong>and</strong> Zambia, <strong>and</strong> will allow for better<br />
future monitoring (UNESCO, 2015h).<br />
TOWARDS A GLOBAL MECHANISM TO MONITOR<br />
CURRICULUM CONTENT<br />
These brief reviews of mechanisms that monitor the<br />
integration of human rights <strong>and</strong> comprehensive sexuality<br />
education into curricula show scope for improvement,<br />
particularly the need to include additional concepts <strong>and</strong><br />
improve country coverage in monitoring.<br />
Analysis for this Report reviewed over 110 national<br />
curriculum framework documents for primary <strong>and</strong><br />
secondary education in 78 countries 2 for 2005–2015,<br />
focusing on five topics in target 4.7: human rights; gender<br />
equality; peace, non-violence <strong>and</strong> human security;<br />
sustainable development; <strong>and</strong> global citizenship/<br />
interconnectedness. The documents were coded using<br />
a st<strong>and</strong>ard protocol with a set number of key terms on<br />
each topic (IBE, 2016a).<br />
This analysis highlights which topics <strong>and</strong> themes<br />
countries emphasize in their curricula. Elements<br />
pertaining to human rights are the most prevalent.<br />
Among the 78 countries, key terms such as rights (88%)<br />
<strong>and</strong> democracy (79%) were the most common. There was<br />
also some emphasis on sustainable development issues<br />
in about three-quarters of the countries, though key<br />
terms such as social <strong>and</strong> economic sustainability were<br />
present in less than one-third of the curricula.<br />
Southern<br />
Asia<br />
Northern<br />
Africa/<br />
W. Asia<br />
Source: UNAIDS (2011).<br />
Nepal<br />
India<br />
Yemen<br />
Sudan<br />
Oman<br />
0 10 20 30 40 50 60 70 80 90 100<br />
%<br />
Countries make less reference in curricula to key<br />
terms related to global citizenship, with only about<br />
10% including concepts such as ‘global inequality’ <strong>and</strong><br />
292<br />
CHAPTER 16 | TARGET 4.7 – SUSTAINABLE DEVELOPMENT AND GLOBAL CITIZENSHIP
16<br />
‘global thinking’, <strong>and</strong> half mentioning globalization,<br />
multiculturalism <strong>and</strong> interculturalism. Gender equality<br />
is also less prevalent: less than 15% of the countries<br />
integrate key terms such as gender empowerment,<br />
gender parity or gender-sensitive, while half mention<br />
gender equality (Figure 16.2).<br />
FIGURE 16.2:<br />
Human rights is the most prevalent concept in national curricula<br />
Percentage of countries including each of the key terms in their national curriculum<br />
frameworks, 2005–2015<br />
In Latin America <strong>and</strong> the Caribbean, key terms related<br />
to sustainable development are common in Guatemala<br />
<strong>and</strong> Nicaragua, but much less so in Argentina, Belize,<br />
Dominica <strong>and</strong> Haiti. In sub-Saharan Africa, almost all key<br />
words related to sustainable development are found in<br />
Mauritius, but none in the United Republic of Tanzania<br />
<strong>and</strong> 10% in the Democratic Republic of the Congo <strong>and</strong><br />
Niger. Terms related to global citizenship are much<br />
less prevalent. In Europe <strong>and</strong> Northern America, none<br />
are found in the United Kingdom, <strong>and</strong> only 30% were<br />
included in Croatia, France <strong>and</strong> Hungary (Figure 16.3).<br />
The limited availability of curricular data poses a<br />
challenge for monitoring the intended content of<br />
education. While data for this new analysis cover many<br />
more countries than any other previous study, much less<br />
than half of the world’s countries were included.<br />
Further research into subject curricula would aid in<br />
underst<strong>and</strong>ing progress on target 4.7. Systematic lists of<br />
national curriculum frameworks <strong>and</strong> related materials are<br />
needed, which would require close collaboration between<br />
national education ministries <strong>and</strong> a leading international<br />
coordinating body such as the UNESCO International<br />
Bureau of Education (IBE). As national curricula are<br />
usually updated every five to seven years, on average,<br />
such global monitoring could be carried out in a similar<br />
time-frame (IBE, 2016a).<br />
Whole-school approach<br />
Education for global citizenship <strong>and</strong> sustainable<br />
development is not necessarily an additional subject<br />
to the curriculum. It is best adopted in a whole-school<br />
approach, with these themes explicitly expressed<br />
in school-wide priorities <strong>and</strong> school ethos, involving<br />
everyone from learners to the wider community.<br />
Whole-school approaches require more participatory<br />
<strong>and</strong> democratic decision-making that engages all<br />
stakeholders, including community members, school<br />
management, principals, teachers, parents <strong>and</strong> students<br />
(Bourn et al., 2016; UNESCO, 2015f).<br />
The 2016 International Civic <strong>and</strong> Citizenship Education<br />
Study (ICCS) includes items that reflect components of<br />
the whole-school approach. Principals are asked about<br />
Human rights<br />
Sustainable development<br />
Peace <strong>and</strong><br />
non-violence<br />
Global citizenship<br />
Gender equality<br />
Rights<br />
Democracy<br />
Freedom<br />
Social justice<br />
Human rights education<br />
Sustainable development<br />
Ecology<br />
Environmental education<br />
Environmental sustainability<br />
Climate change<br />
Renewable energy sources<br />
Waste management<br />
Economic sustainability<br />
Social sustainability<br />
Education for sustainable development<br />
Peace<br />
Abuse/harassment/violence<br />
Peace education<br />
Globalization<br />
Multiculturalism/interculturalism<br />
Global citizen(ship)<br />
Migration/immigration<br />
Global competition<br />
Global–local thinking<br />
Global inequality<br />
Gender equality<br />
Gender equity<br />
Gender sensitivity<br />
Gender parity<br />
Empowerment<br />
Note:The analysis is based on a sample of 78 countries.<br />
Source: IBE (2016a).<br />
0 10 20 30 40 50 60 70 80 90 100<br />
%<br />
2016 • GLOBAL EDUCATION MONITORING REPORT 293
16<br />
FIGURE 16.3:<br />
Prevalence of key terms relating to global citizenship<br />
<strong>and</strong> sustainable development varies across countries<br />
Percentage of key terms related to sustainable development <strong>and</strong> global<br />
citizenship in national curriculum frameworks, selected countries, 2005–2015<br />
Latin America/Caribbean Sub-Saharan Africa Europe/N. America<br />
Luxembourg<br />
Irel<strong>and</strong><br />
Lithuania<br />
Belgium<br />
Hungary<br />
Norway<br />
United Kingdom<br />
Canada<br />
Malta<br />
Serbia<br />
Croatia<br />
Portugal<br />
Estonia<br />
France<br />
Icel<strong>and</strong><br />
Sweden<br />
U. R. Tanzania<br />
D. R. Congo<br />
Niger<br />
Côte d’Ivoire<br />
Djibouti<br />
Ghana<br />
South Africa<br />
South Sudan<br />
Lesotho<br />
Seychelles<br />
Gambia<br />
Rw<strong>and</strong>a<br />
Zambia<br />
Namibia<br />
Mauritius<br />
Argentina<br />
Haiti<br />
Belize<br />
Dominica<br />
Brazil<br />
Grenada<br />
Paraguay<br />
Mexico<br />
Uruguay<br />
Venezuela, B. R.<br />
Chile<br />
Dominican Rep.<br />
El Salvador<br />
Honduras<br />
Panama<br />
Peru<br />
Guatemala<br />
Nicaragua<br />
initiatives to create environments in which sustainable<br />
development principles are respected <strong>and</strong> students<br />
experience them by, for example, saving energy, reducing<br />
<strong>and</strong> separating waste, purchasing environment-friendly<br />
items <strong>and</strong>, more generally, having environment-friendly<br />
behaviour encouraged. Teachers are asked about their<br />
involvement in initiatives <strong>and</strong> programmes related<br />
to environmental sustainability (Schulz et al., 2016).<br />
Evaluating implementation of this approach will be<br />
challenging, as data will mainly draw on self-reporting<br />
<strong>and</strong> address only some aspects.<br />
Some progress has been made in evaluating participation<br />
<strong>and</strong> decision-making. The 2012 Programme for<br />
International Student Assessment (PISA) asked principals<br />
the proportion of parents participating in activities<br />
including school governance. The results showed less<br />
than 5% involved in countries such as Belgium, the<br />
Netherl<strong>and</strong>s, New Zeal<strong>and</strong> <strong>and</strong> the United Kingdom<br />
<strong>and</strong> over 50% in Colombia, Indonesia <strong>and</strong> Kazakhstan<br />
(OECD, 2013b).<br />
International st<strong>and</strong>ard-setting instruments are also<br />
used to monitor democratic school governance.<br />
In 2010, 50 countries adopted the Council of Europe<br />
Charter on Education for Democratic Citizenship <strong>and</strong><br />
Human Rights Education. In 2012, the first monitoring<br />
of its implementation involved responses from 40 of<br />
the 50 countries, with over 90% reporting that they<br />
promoted democratic governance through student<br />
participation <strong>and</strong> parental involvement in decisionmaking.<br />
A follow-up questionnaire will be sent to<br />
governments in 2017 (Kerr, 2012).<br />
TEXTBOOKS<br />
Textbooks are a valuable source of information about<br />
national commitment to sustainable development. They<br />
tend to reflect classroom reality more closely (in terms<br />
of both contents <strong>and</strong> pedagogy) than official curricular<br />
policy statements (Torney-Porta et al., 2001). Recent<br />
advances in textbook content analysis are promising for<br />
gauging curricular content, especially if applied to large<br />
samples of textbooks from many countries.<br />
0<br />
20 40 60 80<br />
%<br />
Sustainable development Global citizenship<br />
Source: IBE (2016a).<br />
100<br />
An analysis of over 500 secondary education history,<br />
social science <strong>and</strong> geography textbooks, spanning 1970<br />
to 2008, found that specific mentions of international<br />
events increased from 30% in the early 1970s to over 40%<br />
in 2005. While almost none of the textbooks mentioned<br />
294<br />
CHAPTER 16 | TARGET 4.7 – SUSTAINABLE DEVELOPMENT AND GLOBAL CITIZENSHIP
16<br />
“<br />
Close to 50% of secondary school textbooks mention human<br />
rights over 2000–2013, compared with around 5% over 1890–1913<br />
globalization in 1970, nearly 40% did in 2005 (Buckner<br />
<strong>and</strong> Russell, 2013). Between 1975-1994 <strong>and</strong> 1995-2010,<br />
depictions of children as victims of mistreatment more<br />
than tripled, <strong>and</strong> descriptions of discrimination against<br />
women more than doubled (Terra <strong>and</strong> Bromley, 2012).<br />
”<br />
FIGURE 16.4:<br />
Some progress has been achieved in the extent to which textbooks<br />
include gender equality<br />
Percentage of textbooks that include an explicit statement on women’s rights<br />
In the Republic of Korea, a study documented the<br />
rapid rise of global citizenship education by describing<br />
trends in civic education textbooks, based on the<br />
average number of mentions of major national <strong>and</strong><br />
global themes by page. National citizenship topics <strong>and</strong><br />
themes remain core elements but emphasis on them<br />
has weakened over time, while global citizenship topics<br />
<strong>and</strong> themes have increased, especially in the 1990s <strong>and</strong><br />
2000s. In addition, textbook content <strong>and</strong> presentation<br />
have become more ‘progressive’ <strong>and</strong> increasingly learner<br />
centred, encouraging students to become self-directed,<br />
empowered individuals in a global society (Moon <strong>and</strong><br />
Koo, 2011).<br />
%<br />
40<br />
35<br />
30<br />
25<br />
20<br />
15<br />
10<br />
5<br />
0<br />
1946–1969 1970–1979 1980–1989 1990–1999 2000–2013<br />
Women’s rights<br />
Violence against women<br />
Women’s movement<br />
Discrimination against women<br />
Women’s contribution to society<br />
Global women’s movement<br />
Analysis for this Report took a similar approach. Three<br />
data sets on secondary school textbooks in history,<br />
civics, social studies <strong>and</strong> geography were compiled. The<br />
vast majority of textbooks were drawn from the most<br />
extensive collection of textbooks from around the world,<br />
at the Georg Eckert Institute for International Textbook<br />
Research in Germany. Textbooks were coded using<br />
st<strong>and</strong>ardized protocols developed after much piloting<br />
<strong>and</strong> intercoder reliability testing (Bromley et al., 2016).<br />
Analysis showed close to 50% of the textbooks<br />
mentioning human rights over 2000–2013, compared<br />
with around 5% over 1890–1913. The proportion of<br />
textbooks mentioning international human rights<br />
documents rose from 12% in the 1950s to 28% in the<br />
2000s. The proportion mentioning women’s rights has<br />
increased since 1980 (Figure 16.4), but with considerable<br />
regional variation, from just above 10% in Northern<br />
Africa <strong>and</strong> Western Asia to 40% in Europe <strong>and</strong> Northern<br />
America <strong>and</strong> in sub-Saharan Africa (Bromley et al., 2016).<br />
Five indicators were used to measure the extent to which<br />
textbooks explicitly emphasized environmental issues,<br />
Notes: Sample sizes for each period: 54 textbooks over 1950–1959, 88 over 1960–1969, 108 over<br />
1970–1979, 103 over 1980–1989, 131 over 1990–1999 <strong>and</strong> 219 over 2000–2011 <strong>and</strong> 2000–2013.<br />
The latest data sets on women’s rights <strong>and</strong> discrimination are for 2000–2013; for the other<br />
statements, the data sets are for 2000–2011.<br />
Source: Bromley et al. (2016).<br />
including if environmental protection or damage was<br />
discussed in at least one paragraph, if this issue was linked<br />
to rights, <strong>and</strong> if it was discussed as a global issue. Coverage<br />
of issues related to environmental protection or damage<br />
has increased: in the 1950s, just under 5% of textbooks<br />
discussed the issue in at least one paragraph, while 50%<br />
did in 2000–2011 (Figure 16.5).<br />
This analysis shows it is possible to develop valid <strong>and</strong><br />
reliable measures using textbooks. A regular monitoring<br />
mechanism should be established to provide globally<br />
comparable data on textbook contents across countries<br />
<strong>and</strong> systems <strong>and</strong> over time (Bromley et al., 2016).<br />
Data collection needs to take into account subject <strong>and</strong><br />
grade. There will be trade-offs between breadth <strong>and</strong><br />
depth. Instead of analysing all textbooks in each subject<br />
<strong>and</strong> grade, the focus should be on the social sciences –<br />
2016 • GLOBAL EDUCATION MONITORING REPORT 295
16<br />
FIGURE 16.5:<br />
Environment is a theme of growing importance in textbooks<br />
Percentage of textbooks that include an explicit statement on environment<br />
%<br />
60<br />
50<br />
40<br />
30<br />
20<br />
10<br />
0<br />
1950–1959 1960–1969 1970–1979 1980–1989 1990–1999 2000–2011<br />
Environmental protection or damage<br />
Global environmental issues<br />
Global environmental movement<br />
Environmental rights<br />
Environmental movement<br />
Note: Sample sizes for each period: 54 textbooks over 1950–1959, 88 over 1960–1969, 108 over<br />
1970–1979, 103 over 1980–1989, 131 over 1990–1999 <strong>and</strong> 219 over 2000–2011.<br />
Source: Bromley et al. (2016).<br />
civics, social studies, history – <strong>and</strong> natural sciences,<br />
where the relevant topics are taught most explicitly.<br />
One approach would be to cover textbooks at the end<br />
of primary, lower secondary <strong>and</strong> upper secondary<br />
education. As textbooks rarely change dramatically<br />
from year to year, gathering data every five years<br />
would be sufficient. It would also be possible to<br />
examine past trends.<br />
Ensuring that questions are valid across countries with<br />
different languages <strong>and</strong> cultures will be a challenge, but<br />
asking multiple questions on each theme would reduce<br />
errors associated with any single question. Questions<br />
need to be factual to minimize interpretation by coders.<br />
For instance, asking whether textbooks ‘discuss human<br />
rights’ would lead to responses varying with the coder’s<br />
underst<strong>and</strong>ing of this concept. But asking whether<br />
textbooks explicitly use the exact phrase ‘human rights’<br />
would provide more consistent responses.<br />
Cooperation between governments <strong>and</strong> international<br />
organizations is necessary for a global monitoring<br />
system to work. National governments should give<br />
researchers open access to curricular content <strong>and</strong><br />
information on how textbooks are developed <strong>and</strong><br />
approved. An international coordinating body such<br />
as the IBE will be critical to the success of local data<br />
collection efforts.<br />
TEACHER EDUCATION<br />
The mainstreaming of sustainable development <strong>and</strong><br />
global citizenship knowledge <strong>and</strong> skills in national<br />
curricula <strong>and</strong> textbooks is a prerequisite to monitoring<br />
country efforts to meet target 4.7. But it is not enough.<br />
Teachers who are prepared to teach in areas related<br />
to sustainable development <strong>and</strong> global citizenship are<br />
needed. Are global citizenship, human rights, sustainable<br />
development <strong>and</strong> comprehensive sexuality education<br />
included in teacher education? The content of teacher<br />
training programmes is seldom readily available, but<br />
some information, mostly regional, has been collected.<br />
In teacher training programmes in 10 countries in<br />
Asia <strong>and</strong> the Pacific, information is very limited on<br />
how teachers are trained in areas related to global<br />
citizenship, including empathy, underst<strong>and</strong>ing<br />
discrimination, cultural sensitivity, tolerance, acceptance<br />
<strong>and</strong> communication skills. Yet, there are some national<br />
examples. After Sri Lanka established a Unit for Social<br />
Cohesion <strong>and</strong> Peace Education in 2008, head teachers,<br />
teachers <strong>and</strong> teacher trainers attended orientation <strong>and</strong><br />
training in peace <strong>and</strong> values education. The Republic of<br />
Korea reported that policy guidelines on Major Directions<br />
for Training of Teacher Personnel encourage local<br />
education offices to provide in-service training on human<br />
rights (UNESCO, 2014d).<br />
Various forms of in-service teacher education<br />
on citizenship education have a component on<br />
issues related to global citizenship <strong>and</strong> sustainable<br />
development. Nearly one-third of 36 European countries<br />
have programmes to help teachers develop professional<br />
knowledge <strong>and</strong> competencies on citizenship. In Latvia,<br />
national in-service training for secondary school teachers<br />
includes programmes to develop citizenship education<br />
competencies, including values <strong>and</strong> diversity in society<br />
<strong>and</strong> quality of life <strong>and</strong> sustainability. Italy’s Puntoedu<br />
Europa programme offers teachers online courses <strong>and</strong><br />
regional workshops on topics such as human rights,<br />
intercultural dialogue <strong>and</strong> sustainable development<br />
<strong>and</strong> environment (Eurydice, 2012).<br />
National reports to the OHCHR on the second phase<br />
of the World Programme on Human Rights Education<br />
can help monitor the extent to which countries include<br />
human rights in pre-service or in-service teacher<br />
education, although the response rate was has been<br />
typically low. Of the 28 countries that submitted<br />
information in 2015, 7 reported integrating human<br />
296<br />
CHAPTER 16 | TARGET 4.7 – SUSTAINABLE DEVELOPMENT AND GLOBAL CITIZENSHIP
16<br />
rights training in pre-service teacher education. In Togo,<br />
such training is necessary to obtain the professional<br />
qualification to teach in schools. In Honduras, a course<br />
helps teachers detect human rights violations, identify<br />
<strong>people</strong> in vulnerable situations <strong>and</strong> use appropriate<br />
methods to teach human rights in public schools. For inservice<br />
teacher education, 13 countries, including Estonia,<br />
the Gambia <strong>and</strong> Seychelles, reported that human rights<br />
training was an essential element of their programmes<br />
(OHCHR, 2015).<br />
In some countries, civil society organizations have been<br />
involved in monitoring teachers’ preparedness to teach<br />
human rights. In 2012, the Danish Institute for Human<br />
Rights conducted a mapping study of human rights<br />
education in primary <strong>and</strong> lower secondary schools <strong>and</strong><br />
teacher training programmes. It found that human rights<br />
were not incorporated adequately in teacher training at<br />
universities <strong>and</strong> colleges. In focus groups, teachers <strong>and</strong><br />
teacher trainers reported lacking theoretical knowledge<br />
on adapting human rights education for different grades.<br />
International <strong>and</strong> regional instruments on human rights<br />
education were also largely unknown (Danish Institute<br />
for Human Rights, 2014).<br />
The quality of comprehensive sexuality education<br />
also depends ultimately on teachers’ knowledge of<br />
the subject matter <strong>and</strong> their confidence <strong>and</strong> skill in its<br />
delivery. A review of policy documents <strong>and</strong> mapping<br />
of teacher training institutions in 21 countries in sub-<br />
Saharan Africa found that more than half the countries<br />
integrated comprehensive sexuality education in<br />
pre-service teacher<br />
education curricula. In<br />
In sub-Saharan Africa, Ethiopia, it was included<br />
in cross-cutting<br />
more than half of<br />
subjects that all trainees<br />
countries integrated studied. In seven<br />
comprehensive<br />
countries, including<br />
the United Republic<br />
sexuality education<br />
of Tanzania, it was a<br />
in pre-service teacher specialization option.<br />
education curricula Only eight countries,<br />
including Lesotho,<br />
Malawi <strong>and</strong> Namibia,<br />
made comprehensive sexuality education a compulsory<br />
module (UNESCO, 2015a).<br />
commissioned by the UNAIDS Inter-Agency Task Team.<br />
Of the 39 countries surveyed, 74% reported providing<br />
pre-service teacher education on generic life skills<br />
<strong>and</strong> 62% on HIV education at the primary level. At the<br />
secondary level, the respective percentages increased to<br />
79% <strong>and</strong> 72%. This survey is, however, relatively limited in<br />
scope, mainly reflecting self-reported data from national<br />
education ministries <strong>and</strong> civil society (UNESCO <strong>and</strong><br />
UNAIDS, 2013).<br />
In sub-Saharan Africa, 6 of 13 countries that used the<br />
Sexuality Education Review <strong>and</strong> Assessment Tool had<br />
strong ratings for more than 40% of elements of their<br />
teacher training programmes. The other 7 did not<br />
explicitly prepare teachers in areas such as addressing<br />
embarrassment when talking about sexuality, avoiding<br />
bias caused by personal norms <strong>and</strong> beliefs, <strong>and</strong> not<br />
pressuring learners to talk about sensitive topics<br />
(UNESCO, 2015b).<br />
A recent analysis of teacher education programmes<br />
for primary <strong>and</strong> secondary school found changes over<br />
the past decade in attitudes, acceptance <strong>and</strong> discourse<br />
on education for sustainable development in teacher<br />
education. The analysis, based on 66 survey responses<br />
as part of a UNESCO assessment of the UN Decade of<br />
Education for Sustainable Development (2005–2014),<br />
found the share of countries completely integrating<br />
sustainable development in teacher education rose<br />
from 2% in 2005 to 8% in 2013. In pre-service teacher<br />
education, climate change, environment <strong>and</strong> human<br />
rights were the prevalent themes. They often integrated<br />
local issues, such as illegal logging <strong>and</strong> deforestation<br />
in Indonesia <strong>and</strong> disaster risk management in Japan,<br />
Pakistan <strong>and</strong> Viet Nam (McKeown <strong>and</strong> Hopkins, 2014).<br />
More work is needed to develop system-level indicators<br />
that accurately capture teacher training needs for<br />
teaching knowledge <strong>and</strong> skills to promote sustainable<br />
development. One example is the UN Economic<br />
Commission for Europe framework for integrating<br />
ESD in teacher training curricula. It identifies key<br />
competencies for teachers <strong>and</strong> educators, including<br />
integrative thinking, inclusivity, dealing with complexity,<br />
critical analysis, active engagement in contemporary<br />
issues, creative thinking about alternative futures, <strong>and</strong><br />
transformative pedagogy (UNECE, 2012).<br />
Information on teacher preparation in life skillsbased<br />
HIV education comes from the 2011–2012<br />
Education Sector HIV <strong>and</strong> AIDS Global Progress Survey,<br />
The data collection tools presented above, which all<br />
serve different purposes <strong>and</strong> respond to different needs,<br />
are too infrequently applied to fill the data gaps. Nor<br />
2016 • GLOBAL EDUCATION MONITORING REPORT 297
16<br />
do they follow a systematic format that would ensure<br />
country comparability. Monitoring in this area, whether<br />
for teacher competencies or classroom interactions, will<br />
be challenging (Box 16.2). Therefore, stronger efforts<br />
are urgently needed to assess concepts in target 4.7<br />
for teacher preparation <strong>and</strong> training. The application<br />
of a st<strong>and</strong>ard coding protocol – as for curricula <strong>and</strong><br />
textbooks – to teacher training institutions’ curricula<br />
or to the possible inclusion of global competence as a<br />
theme in future rounds of the Teaching <strong>and</strong> Learning<br />
International Survey (TALIS), for instance, would make<br />
it possible to analyse the effectiveness of professional<br />
development in preparing teachers to respond to various<br />
BOX 16.2<br />
Monitoring classroom interactions on sustainable<br />
development is challenging<br />
In GCED <strong>and</strong> ESD, participatory, learner-centred <strong>and</strong> inclusive<br />
teaching <strong>and</strong> learning practices are central. Qualitative tools have<br />
been used to track progress in adopting such practices. A study in<br />
10 countries in Asia <strong>and</strong> the Pacific used qualitative techniques, such<br />
as classroom observations, to examine if teaching methods were<br />
conducive to a participatory <strong>and</strong> interactive learning environment.<br />
As part of this project, a study of 18 classes in 6 schools across 3<br />
districts observed that in about half the classes, teachers relied<br />
on teacher-dominant <strong>and</strong> teacher-centred methods, while in the<br />
remaining half, teachers tried to make classes more interactive.<br />
Methodological limitations <strong>and</strong> implementation costs make it<br />
unrealistic to look for global measures of classroom interactions.<br />
Yet, some cross-national assessments have looked at classroom<br />
practices in relation to GCED <strong>and</strong> ESD.<br />
The 2009 ICCS, for instance, measured the climate for classroom<br />
discussion, within the limitations of self-reporting. Students were<br />
asked whether they expressed opinions in class even when their<br />
opinions differed from those of most other students, for example,<br />
<strong>and</strong> whether teachers presented several sides of an issue when<br />
explaining it in class.<br />
Across the participating countries, 52% of students, on average, often<br />
observed that teachers encouraged them to express their opinions,<br />
<strong>and</strong> 11% reported that students often brought up current events<br />
in the classroom. Students were more likely to report an open<br />
classroom climate in some countries, including Denmark, Indonesia<br />
<strong>and</strong> Italy, than in others, including Malta <strong>and</strong> the Republic of Korea.<br />
ICCS 2016 will continue to ask questions about classroom interaction.<br />
Sources: Schulz et al. (2010); UNESCO (2014d).<br />
groups of students, potentially through a range of<br />
teaching strategies (OECD, 2016a).<br />
ACTIVITIES OUTSIDE THE<br />
CLASSROOM<br />
While classrooms may be effective places to introduce<br />
students to sustainability <strong>and</strong> global citizenship issues,<br />
they are not the only ones, or necessarily the most<br />
potent. Extracurricular activities can strengthen <strong>and</strong><br />
complement classroom interventions <strong>and</strong> textbook<br />
contents. Such activities outside the classroom<br />
that complement core academic content include<br />
academic clubs <strong>and</strong> competitions, student government<br />
associations, sports activities <strong>and</strong> teams, debate clubs,<br />
theatre productions, music groups <strong>and</strong> volunteer work.<br />
An analysis for this Report has reviewed the impact of<br />
various extracurricular activities around the world. It<br />
finds that well-designed, inclusive activities that are<br />
accessible to all population groups improve conflict<br />
resolution <strong>and</strong> relationships for social cohesion, increase<br />
awareness of legal frameworks <strong>and</strong> concepts related to<br />
human rights as well as the personal capacity to claim<br />
<strong>and</strong> advocate for them, <strong>and</strong> promote a sense of global<br />
citizenship that transcends national boundaries <strong>and</strong><br />
allows for greater communication <strong>and</strong> collaboration with<br />
<strong>people</strong> from other countries (Akar, 2016).<br />
Such activities can empower young <strong>people</strong> to be<br />
confident <strong>and</strong> active agents of positive change to<br />
advance various elements of target 4.7, including equality<br />
<strong>and</strong> inclusion, peace, human rights <strong>and</strong> improved health,<br />
particularly as related to HIV prevention.<br />
Some surveys monitor access to extracurricular<br />
activities, mostly organized by schools. The 2006<br />
PISA, for instance, asked principals what kinds of<br />
extracurricular science activities their schools offered.<br />
On average, across OECD countries, 89% of students<br />
attended schools whose principals reported commonly<br />
offering science-related field trips. Other extracurricular<br />
science activities were less prevalent: 56% of students<br />
were in schools holding science competitions, 48% in<br />
schools encouraging extracurricular science projects,<br />
42% in schools organizing science fairs <strong>and</strong> 41% in<br />
schools with science clubs (OECD, 2012b).<br />
The 2009 ICCS asked teachers if they <strong>and</strong> their students<br />
participated in school-organized activities in the local<br />
298<br />
CHAPTER 16 | TARGET 4.7 – SUSTAINABLE DEVELOPMENT AND GLOBAL CITIZENSHIP
16<br />
community, including activities related to environment,<br />
human rights, underprivileged <strong>people</strong> or groups, local<br />
multicultural/intercultural events, <strong>and</strong> awareness-raising<br />
campaigns such as World AIDS Day. Principals were<br />
asked how many students had the opportunity to take<br />
part in such activities. Across the countries surveyed,<br />
participation in environment-related awareness-raising<br />
campaigns <strong>and</strong> activities appeared to be widespread.<br />
Support of underprivileged <strong>people</strong> or groups was less<br />
common, except in Indonesia <strong>and</strong> Thail<strong>and</strong>, where<br />
around 70% of teachers said they had participated in<br />
such activities (Schulz et al., 2010).<br />
Less information is available about extracurricular<br />
activities not organized by schools. Providers of such<br />
activities may not give information to or participate<br />
in any monitoring <strong>and</strong> reporting systems. It is hard to<br />
imagine global-scale monitoring of this area.<br />
Some opinion surveys have collected data on<br />
involvement in extracurricular <strong>and</strong> similar activities.<br />
In 2014, Flash Eurobarometer telephone interviews,<br />
collected data on participation in society, in particular<br />
involvement in voluntary <strong>and</strong> cultural activities, from<br />
<strong>people</strong> aged 15 to 30 in the 28 European Union (EU)<br />
countries. Around 30% of respondents reported being<br />
active in a sports club in the past 12 months, while<br />
16% were involved in a youth club, leisure-time club or<br />
other youth organization. On average, 5% participated<br />
in an organization promoting human rights or global<br />
development, <strong>and</strong> 3% in one involved in climate<br />
change <strong>and</strong> other environmental issues (European<br />
Commission, 2015).<br />
In some countries, national surveys can help track progress.<br />
In Engl<strong>and</strong> (United Kingdom), the National Foundation<br />
for Education Research carried out a nine-year evaluation<br />
of citizenship education. The Citizenship Education<br />
Longitudinal Study began in 2001 <strong>and</strong> tracked a cohort<br />
of young <strong>people</strong> from age 11 to age 18; the group entered<br />
secondary school in 2002. The eighth <strong>and</strong> final report<br />
found a clear, steady decline in the share taking part in<br />
extracurricular activities (sports, arts, drama <strong>and</strong> hobbies),<br />
from 80% in grade 7 to 66% in grade 13 (Keating et al., 2010).<br />
In the United States, the 2008 panel of the nationally<br />
representative Survey of Income <strong>and</strong> Programme<br />
Participation included a topical module on child wellbeing<br />
in the 10th wave of interviews conducted in<br />
2011. The survey collected information on a variety of<br />
child well-being indicators to illustrate children’s daily<br />
experiences, including participation in extracurricular<br />
activities. Data were limited to children aged 6 to 17<br />
<strong>and</strong> based on parents’ responses about children’s<br />
involvement in three extracurricular activities: sports,<br />
clubs <strong>and</strong> lessons. It was found that 35% of children<br />
participated in sport <strong>and</strong> 29% in clubs or lessons<br />
including music, dance <strong>and</strong> language (Laughlin, 2014).<br />
A major shortcoming of all these data collection tools<br />
is a lack of attention to the quality of experiences or<br />
development processes within extracurricular activities.<br />
And the absence of common or shared st<strong>and</strong>ards<br />
for publicly reporting information on extracurricular<br />
activities limits the chance of obtaining consistent <strong>and</strong><br />
reliable data.<br />
OUTCOMES<br />
Monitoring the core aspiration of target 4.7 – acquisition<br />
of knowledge <strong>and</strong> skills needed for sustainable<br />
development – is not easy. Challenges include the<br />
scarcity of relevant student assessments or specially<br />
developed opinion or values surveys, the difficulty of<br />
developing test items that are context-relevant but not<br />
culturally biased, the broad scope of the target’s topics<br />
<strong>and</strong> the relative lack of research on adult learning. One<br />
strategy would be to develop a pool of materials from<br />
which countries could select components that were<br />
both culturally <strong>and</strong> age<br />
appropriate <strong>and</strong> could be<br />
linked to a comparative or<br />
It is hard to test international scale.<br />
ASSESSING GLOBAL<br />
KNOWLEDGE AND<br />
UNDERSTANDING<br />
knowledge <strong>and</strong><br />
skills for sustainable<br />
development in a<br />
way that is context-<br />
Knowledge <strong>and</strong><br />
relevant but not<br />
underst<strong>and</strong>ing of global<br />
culturally biased themes <strong>and</strong> issues (e.g.<br />
peace <strong>and</strong> conflict, poverty,<br />
migration, globalization,<br />
climate change), events <strong>and</strong> institutions are essential<br />
to an ability to contribute to sustainable development<br />
(Davies, 2006). A basic, interdependent underst<strong>and</strong>ing<br />
of world history, geography, international institutions<br />
<strong>and</strong> global processes could serve as a starting point to<br />
monitor knowledge regarding the concepts in target 4.7.<br />
Yet, few cognitive assessments exist in this area.<br />
One example of student cognitive assessments comes<br />
from the 2009 ICCS, which drew on the 1999 Civic<br />
2016 • GLOBAL EDUCATION MONITORING REPORT 299
16<br />
Very few cognitive assessments exist for the<br />
underst<strong>and</strong>ing of world history, geography,<br />
international institutions <strong>and</strong> global processes<br />
Education Study. With the aim of reporting on students’<br />
conceptual knowledge <strong>and</strong> underst<strong>and</strong>ing in civic <strong>and</strong><br />
citizenship education, it used a 79 item test administered<br />
to grade 8 students in 38 countries of Europe, Asia <strong>and</strong><br />
Latin America (Schulz et al., 2010).<br />
The 2009 assessment included an item on knowledge<br />
of the Universal Declaration of Human Rights, which<br />
can provide a set of universal values as a basis for<br />
judgements about global issues (Osler <strong>and</strong> Starkey,<br />
2000). 3 An average of 68% of students responded<br />
correctly to this item. In Finl<strong>and</strong>, Pol<strong>and</strong> <strong>and</strong> the Republic<br />
of Korea, over 80% recognized that the declaration was<br />
intended to apply to all <strong>people</strong>; around 40% did so in the<br />
Dominican Republic <strong>and</strong> Thail<strong>and</strong> (Figure 16.6).<br />
Regional modules for Asia, Europe <strong>and</strong> Latin America<br />
were added to the 2009 ICCS. In Europe, students<br />
were asked about basic facts on the EU <strong>and</strong> its policies,<br />
institutions, practices <strong>and</strong> processes to gauge their<br />
knowledge of supra-national political governance<br />
structures (UNESCO, 2015f). Only 57% knew how many<br />
countries were EU member states; national averages<br />
ranged from 35% in Engl<strong>and</strong> (United Kingdom) to 75% in<br />
Slovakia (Kerr et al., 2010).<br />
National assessments with a civics component<br />
can also gauge knowledge relating to global issues.<br />
In the United States, the 2014 National Assessment<br />
of Educational Progress assessed grade 8 students’<br />
knowledge of the benefits of international interactions<br />
such as trade, treaties <strong>and</strong> humanitarian aid. While<br />
62% of students described benefits of two or three<br />
types of interactions, 11% could not describe a benefit<br />
of any type of interaction (Institute of Education<br />
Sciences, 2016).<br />
Preparing learners for a future of climatic <strong>and</strong><br />
environmental instability begins by helping them<br />
underst<strong>and</strong> issues such as why <strong>and</strong> how climate<br />
change takes place, <strong>and</strong> its likely effects on habitats<br />
<strong>and</strong> ecosystems (Mansilla <strong>and</strong> Jackson, 2011). The 2006<br />
FIGURE 16.6:<br />
In many countries, no more than two-thirds are familiar with the Universal Declaration of Human Rights<br />
Percentage of grade 8 students responding correctly to the item ‘Which of the following is the main purpose of the Universal<br />
Declaration of Human Rights?’, 2009 ICCS<br />
100<br />
90<br />
80<br />
70<br />
60<br />
50<br />
40<br />
30<br />
20<br />
10<br />
0<br />
Dominican Rep.<br />
Thail<strong>and</strong><br />
Guatemala<br />
Colombia<br />
Indonesia<br />
Latvia<br />
Paraguay<br />
Grade 8 students (%)<br />
Malta<br />
Chile<br />
Mexico<br />
Cyprus<br />
Norway<br />
Greece<br />
Sweden<br />
Bulgaria<br />
Belgium<br />
Luxembourg<br />
Estonia<br />
New Zeal<strong>and</strong><br />
Engl<strong>and</strong> (U. K.)<br />
Russian Fed.<br />
Austria<br />
Lithuania<br />
Spain<br />
Denmark<br />
Liechtenstein<br />
Czech Rep.<br />
Slovakia<br />
Slovenia<br />
Switzerl<strong>and</strong><br />
Irel<strong>and</strong><br />
Italy<br />
Finl<strong>and</strong><br />
Pol<strong>and</strong><br />
Rep. of Korea<br />
Source: Schulz et al. (2010).<br />
300<br />
CHAPTER 16 | TARGET 4.7 – SUSTAINABLE DEVELOPMENT AND GLOBAL CITIZENSHIP
16<br />
PISA included questions designed to assess knowledge,<br />
skill <strong>and</strong> dispositions on environmental <strong>and</strong> geoscience<br />
among more than 400,000 15-year-olds from 57<br />
countries. The study provided the first internationally<br />
comparable data on students’ knowledge of the<br />
environment <strong>and</strong> related problems, the sources of this<br />
knowledge, their attitudes on environmental issues <strong>and</strong><br />
the relationship between their results in environmental<br />
science <strong>and</strong> their environmental attitudes (OECD, 2009a).<br />
Of the 108 questions in the PISA 2006 science assessment,<br />
24 were related to environmental science; of these,<br />
14 focused on geoscience. Each subset was the basis<br />
for a performance index. At the lower end of the index<br />
distribution, students were unable to interpret a graph<br />
or figure when given appropriate cues, or show basic<br />
knowledge of common environmental processes (OECD,<br />
2009a). The environmental science performance index<br />
highlighted wide differences between countries. In<br />
Azerbaijan, Indonesia, Kyrgyzstan <strong>and</strong> Qatar, more than<br />
70% of students were at level D or below, compared<br />
with around 25% in Canada, Estonia, Finl<strong>and</strong> <strong>and</strong> Japan<br />
(Figure 16.7). These results from PISA 2006 could be<br />
taken as a baseline for the level of environmental science<br />
knowledge among 15-year olds.<br />
Since 2000, some national cognitive assessments have<br />
measured underst<strong>and</strong>ing of environmental issues <strong>and</strong><br />
the ability to use critical thinking in decisions about<br />
individual <strong>and</strong> collective action strategies.<br />
A national assessment of grade 6 <strong>and</strong> 12 students<br />
conducted in Israel over 2004–2006 included nearly<br />
20 questions on general environmental principles <strong>and</strong><br />
national <strong>and</strong> global issues. Some 80% of sixth graders<br />
correctly answered questions about bottle-deposit laws<br />
<strong>and</strong> recycling, but only 25% were successful on questions<br />
about global warming <strong>and</strong> bird migration. Older students<br />
had higher scores: only 25% of sixth graders knew about<br />
waste management <strong>and</strong> the most polluting mode of<br />
transport, compared with 55% of 12th graders (Negev et<br />
al., 2008).<br />
In Turkey, as part of a nationally representative survey of<br />
2,412 grade 5 students, cognitive skills on environmental<br />
protection were assessed in terms of identifying,<br />
evaluating <strong>and</strong> solving problems. About 5% could<br />
correctly order the scientific processes given to solve<br />
water pollution. About 50% knew that identifying <strong>and</strong><br />
assessing a problem starts with searching for relevant<br />
information from various sources, but only 27% knew<br />
FIGURE 16.7:<br />
Environmental knowledge varies widely between countries<br />
Percentage of 15-year-olds at level D or below on environmental<br />
science performance index, PISA 2006<br />
Caucasus/<br />
C. Asia<br />
Eastern/<br />
South-east<br />
Asia<br />
Europe/<br />
N. America<br />
Latin<br />
America/<br />
Caribbean<br />
Northern<br />
Africa/<br />
W. Asia<br />
Pacific<br />
Azerbaijan<br />
Kyrgyzstan<br />
Hong Kong (China)<br />
Japan<br />
Macao (China)<br />
Rep. of Korea<br />
Thail<strong>and</strong><br />
Indonesia<br />
Finl<strong>and</strong><br />
Canada<br />
Estonia<br />
Slovenia<br />
Netherl<strong>and</strong>s<br />
Liechtenstein<br />
Germany<br />
Belgium<br />
Hungary<br />
Czech Rep.<br />
Irel<strong>and</strong><br />
Pol<strong>and</strong><br />
Switzerl<strong>and</strong><br />
United Kingdom<br />
Austria<br />
Latvia<br />
Denmark<br />
Croatia<br />
France<br />
Sweden<br />
Spain<br />
Lithuania<br />
Slovakia<br />
Icel<strong>and</strong><br />
Norway<br />
Russian Fed.<br />
Luxembourg<br />
Greece<br />
United States<br />
Portugal<br />
Italy<br />
Israel<br />
Bulgaria<br />
Serbia<br />
Montenegro<br />
Romania<br />
Chile<br />
Uruguay<br />
Argentina<br />
Mexico<br />
Brazil<br />
Colombia<br />
Jordan<br />
Turkey<br />
Tunisia<br />
Qatar<br />
Australia<br />
New Zeal<strong>and</strong><br />
0 10 20 30 40 50 60 70 80 90 100<br />
15-year-old students (%)<br />
Note: At the lower end (level D or below) of the index distribution, students<br />
cannot interpret a graph or figure when given appropriate cues, or show basic<br />
knowledge of common environmental processes.<br />
Source: OECD (2009a).<br />
2016 • GLOBAL EDUCATION MONITORING REPORT 301
16<br />
that the last step was reporting <strong>and</strong> presenting the data<br />
collected (Erdogan <strong>and</strong> Ok, 2011).<br />
Improving on current assessments<br />
Recent initiatives seek to improve monitoring<br />
mechanisms for target 4.7 regarding adolescents,<br />
mainly in secondary education. In 2016, UNESCO<br />
<strong>and</strong> the International Association for the Evaluation<br />
of Educational Achievement (IEA) officially began<br />
collaborating on measuring global citizenship <strong>and</strong><br />
sustainable development knowledge. The IEA’s 2016<br />
ICCS will ask students to rate the seriousness of threats<br />
including poverty; declines in living st<strong>and</strong>ards, economic<br />
well-being <strong>and</strong> environmental health; <strong>and</strong> attacks<br />
on human dignity. The ratings will indicate student<br />
awareness of global issues (Schulz et al., 2016). ICCS<br />
2019 will build on the main cycle of ICCS 2016, extending<br />
country <strong>and</strong> thematic coverage. Critically, it will include<br />
indicators of knowledge, underst<strong>and</strong>ing, skills, beliefs,<br />
attitudes <strong>and</strong> behaviours relating to GCED <strong>and</strong> ESD.<br />
A major limitation of ICCS is the country coverage. More<br />
are needed for this instrument to be used effectively to<br />
provide global estimates. Another limitation is the age<br />
of those assessed. Ages 13 <strong>and</strong> 14 could be considered<br />
appropriate in countries where compulsory education<br />
ends at 14, but marked differences between young<br />
<strong>people</strong> on political engagement start to appear at<br />
age 15 to 16. These differences need to be recognized<br />
(Hoskins, 2016).<br />
A challenge for measuring outcomes related to<br />
target 4.7 has to do with tension between national values<br />
<strong>and</strong> the commitment to a global agenda. Hence, there<br />
is a need to develop comparative student assessments<br />
that are more attuned<br />
to local conditions. One<br />
promising example<br />
There is a need to<br />
is the Southeast Asia<br />
develop comparative Primary Learning<br />
student assessments Metrics, focusing on<br />
literacy, numeracy <strong>and</strong><br />
that are more attuned<br />
global citizenship in<br />
to local conditions grade 5. In 2016–2017,<br />
at least six countries in<br />
the region will pilot the<br />
assessment tools. By 2020, all countries of the Southeast<br />
Asian Ministers of Education Organization <strong>and</strong> the<br />
Association of Southeast Asian Nations are expected to<br />
join (SEAMEO <strong>and</strong> UNICEF, 2015).<br />
Another recent development is the OECD decision to<br />
include global competence as a field for testing in PISA<br />
2018 (see Box 16.3).<br />
Data sources on adult global knowledge <strong>and</strong> underst<strong>and</strong>ing<br />
are even more limited<br />
Existing data on knowledge <strong>and</strong> skills related to global<br />
citizenship <strong>and</strong> sustainable development tend to be<br />
limited to children <strong>and</strong> adolescents. Yet, it is equally<br />
important to evaluate similar knowledge <strong>and</strong> skills in the<br />
adult population. There have been very few cognitive<br />
assessments, however.<br />
One example was an early survey of global underst<strong>and</strong>ing<br />
in the United States that included measures of cognitive<br />
dimensions of global awareness <strong>and</strong> was not limited to<br />
knowledge of a particular culture or area. This nationally<br />
representative survey of some 3,000 undergraduates<br />
featured 101 items testing knowledge in 13 areas,<br />
including environment, international monetary <strong>and</strong> trade<br />
arrangements, human rights, <strong>and</strong> race <strong>and</strong> ethnicity.<br />
Only 31% of students identified crop cultivation as the<br />
human activity that has contributed most directly to<br />
environmental alteration of the greatest area of earth’s<br />
surface (Barrows et al., 1981).<br />
A more recent assessment of sustainability knowledge<br />
is the UN Sustainability Literacy Test (SULITEST). It is<br />
administered by higher education institutions to assess<br />
<strong>and</strong> verify sustainability literacy upon graduation.<br />
This online multiple-choice test measures the level of<br />
knowledge on social, environmental <strong>and</strong> economic issues<br />
<strong>and</strong> a basic underst<strong>and</strong>ing of the earth system. Of the<br />
50 questions, two-thirds are related to international<br />
issues such as global warming, the rest being on national<br />
<strong>and</strong> regional issues such as legislation <strong>and</strong> culture.<br />
Between January <strong>and</strong> October 2014, almost 20,000<br />
students in higher education took the SULITEST; the<br />
average score was 54% (Sustainability Literacy<br />
Test, 2014). 4<br />
Building on the idea that broad, integrated geographic<br />
knowledge is critical to becoming a global citizen, the<br />
National Geographic–Roper 2002 Global Geographic<br />
Literacy Survey assessed the geographic knowledge<br />
of 3,250 <strong>people</strong> aged 18 to 24 in nine countries. 5 The<br />
survey contained multiple-choice questions on country<br />
identification from maps <strong>and</strong> on factual knowledge of<br />
world issues <strong>and</strong> current events, including population,<br />
natural resources, religion, politics <strong>and</strong> nuclear weapons.<br />
Results showed young adults were uninformed about<br />
302<br />
CHAPTER 16 | TARGET 4.7 – SUSTAINABLE DEVELOPMENT AND GLOBAL CITIZENSHIP
16<br />
global population issues, which affect, among other<br />
things, food <strong>and</strong> energy consumption. Only 40% or less<br />
of young adults in all surveyed countries except Sweden<br />
(61%) correctly named China <strong>and</strong> India as the countries<br />
with more than 1 billion <strong>people</strong> (RoperASW, 2002).<br />
The follow-up National Geographic–Roper Public Affairs<br />
2006 Geographic Literacy Study was conducted in<br />
the United States. As in 2002, factual questions were<br />
addressed to a representative sample of young adults.<br />
Only 35% correctly chose Pakistan from four possible<br />
choices as the country hit by a catastrophic earthquake<br />
in October 2005. Seven in ten young Americans could<br />
find China on a map but less than two in ten knew that<br />
M<strong>and</strong>arin Chinese was was the world’s most widely<br />
spoken native language (GfK Roper Public Affairs, 2006).<br />
International opinion surveys, such as the regional<br />
barometer surveys (Afro, Arab, Asian, Eurasia <strong>and</strong> Latino)<br />
<strong>and</strong> the World Values Survey (WVS), include questions<br />
on self-reported knowledge <strong>and</strong> underst<strong>and</strong>ing of global<br />
<strong>and</strong> intercultural issues. The 2005–2009 WVS asked<br />
about awareness of the Millennium Development Goals<br />
(MDGs); only 5% of <strong>people</strong> surveyed in the United States<br />
<strong>and</strong> 11% in Japan had heard about them, compared with<br />
27% in Germany <strong>and</strong> 31% in Sweden. Sub-Saharan African<br />
countries registered the highest awareness of the MDGs,<br />
with 66% in Ethiopia, 47% in Mali <strong>and</strong> 44% in Zambia. This<br />
result indicated that <strong>people</strong> in countries that received<br />
aid were more likely to be aware of the MDGs than<br />
<strong>people</strong> in donor countries (Freschi, 2010). The potential<br />
of using international opinion surveys to measure<br />
adult global knowledge <strong>and</strong> underst<strong>and</strong>ing needs to be<br />
further explored.<br />
BOX 16.3<br />
Assessment of global competence in the 2018 PISA assessment<br />
Countries participating in PISA are collaborating to develop an assessment of global<br />
competence to be conducted in 2018. It will involve testing 15-year-olds, who also<br />
take separate tests in reading, mathematics <strong>and</strong> science.<br />
Global competence is a multidimensional learning domain encompassing three<br />
dimensions needed to engage in productive <strong>and</strong> respectful relationships with<br />
<strong>people</strong> from different cultures: knowledge <strong>and</strong> underst<strong>and</strong>ing, skills, <strong>and</strong> attitudes.<br />
It is defined as the capacity to analyse global <strong>and</strong> intercultural issues critically <strong>and</strong><br />
from multiple perspectives; to underst<strong>and</strong> how differences affect perceptions,<br />
judgements <strong>and</strong> ideas of self <strong>and</strong> others; <strong>and</strong> to engage in open, appropriate <strong>and</strong><br />
effective interactions with others from different backgrounds on the basis of a<br />
shared respect for human dignity.<br />
The cognitive assessment in the 2018 PISA currently proposed by the OECD aims<br />
to build a single scale to test knowledge, underst<strong>and</strong>ing, <strong>and</strong> analytical <strong>and</strong> critical<br />
thinking in a problem-solving context concerning a global or intercultural issue.<br />
It would include tasks that draw on numerous types of knowledge <strong>and</strong> thinking<br />
processes <strong>and</strong> would be designed to be appropriate to the context <strong>and</strong> learning of<br />
15-year-olds.<br />
The questionnaire would also include self-reported components on the dimension<br />
of knowledge <strong>and</strong> underst<strong>and</strong>ing – for instance, how familiar students are with<br />
global issues such as climate change <strong>and</strong> global warming, global health <strong>and</strong><br />
population growth – <strong>and</strong> on linguistic, communication <strong>and</strong> behavioural skills<br />
required to interact respectfully, appropriately <strong>and</strong> effectively with others.<br />
Students’ flexibility, empathy, openness to <strong>and</strong> respect for cultural otherness,<br />
global mindedness <strong>and</strong> responsibility will also be assessed.<br />
Sources: OECD (2015e); OECD (2016a); Reimers (2010).<br />
SKILLS AND ATTITUDES<br />
Critical skills for promoting sustainable development<br />
include communicating appropriately <strong>and</strong> effectively<br />
with <strong>people</strong> from other cultures or countries;<br />
comprehending other <strong>people</strong>’s thoughts, beliefs <strong>and</strong><br />
feelings <strong>and</strong> seeing the world from their perspective;<br />
adjusting one’s thoughts, feelings or behaviours to fit<br />
new contexts <strong>and</strong> situations; <strong>and</strong> analysing <strong>and</strong> thinking<br />
critically in order to scrutinize <strong>and</strong> appraise information<br />
<strong>and</strong> meanings.<br />
PISA 2018 will be an important step to assess such<br />
skills on a broader scale (OECD, 2016a). The cognitive<br />
assessment will be designed to test knowledge,<br />
underst<strong>and</strong>ing, <strong>and</strong> analytical <strong>and</strong> critical thinking in<br />
an authentic problem-solving context. Self-reported<br />
items will be incorporated to measure skills such as<br />
communication, flexibility <strong>and</strong> empathy (Box 16.3).<br />
A number of cross-national assessments examine<br />
attitudes, including openness towards <strong>people</strong> from other<br />
cultures or countries, respect for cultural otherness <strong>and</strong><br />
responsibility for one’s own actions.<br />
ICCS 2009 contained scales for monitoring supportive<br />
attitudes, e.g. on gender equality <strong>and</strong> towards migrants.<br />
Supportive attitudes on gender equality were captured<br />
by how students responded to positive <strong>and</strong> negative<br />
statements on ideas such as equal opportunity to take<br />
part in government <strong>and</strong> equal pay for the same jobs.<br />
Large majorities agreed with positive <strong>and</strong> disagreed with<br />
2016 • GLOBAL EDUCATION MONITORING REPORT 303
16<br />
negative statements about gender equality, with girls<br />
expressing more support for gender equality than boys<br />
(Schulz et al., 2010).<br />
fairly willing to pay much higher prices to protect the<br />
environment in 2000 <strong>and</strong> 2010, down by six percentage<br />
points from 1993 (Franzen <strong>and</strong> Vogl, 2013).<br />
Regional ICCS modules reflect local, national <strong>and</strong> regional<br />
differences. The 2009 Latin American questionnaire<br />
included items measuring acceptance <strong>and</strong> respect of social<br />
minority groups as neighbours. While most students in the<br />
participating countries (Chile, Colombia, the Dominican<br />
Republic, Guatemala, Mexico <strong>and</strong> Paraguay) were tolerant<br />
of <strong>people</strong> of a different nationality, from other regions<br />
of the country or with a different skin colour, fewer<br />
approved of <strong>people</strong> with a different sexual orientation or<br />
with HIV (Schulz et al., 2011).<br />
The European Social Survey, conducted every two<br />
years, consists of a core questionnaire <strong>and</strong> rotating<br />
questions. In 2014, the rotating questions were related<br />
to immigration. An active willingness to seek out <strong>and</strong><br />
take up opportunities to engage with <strong>people</strong> from other<br />
cultures can be measured by, for instance, having close<br />
friends of another cultural group. In France, Sweden<br />
<strong>and</strong> Switzerl<strong>and</strong>, 35% of respondents reported not<br />
having close friends of a different race or ethnic group<br />
(ESS, 2014).<br />
In the 2010 Australian National Assessment, student<br />
attitudes on indigenous cultures were measured in<br />
grades 6 <strong>and</strong> 10. In both grades, 9 out of 10 students<br />
agreed that Australia should support cultural traditions<br />
<strong>and</strong> languages of Indigenous Australians. A similar<br />
proportion agreed on the importance of recognizing<br />
traditional l<strong>and</strong> ownership <strong>and</strong> giving everyone the<br />
chance to learn about promoting reconciliation between<br />
Indigenous <strong>and</strong> non-Indigenous Australians (Australian<br />
Curriculum Assessment <strong>and</strong> Reporting Authority, 2011).<br />
The annual International Social Survey Programme<br />
(ISSP) is a cross-national collaborative project on<br />
attitudes concerning social issues, conducted in<br />
multiyear modules. 6 Its third module on environment,<br />
in 2010, mainly dealt with attitudes on issues such as<br />
environmental protection, <strong>and</strong> respondents’ behaviour<br />
<strong>and</strong> preferences regarding government measures on<br />
environmental protection.<br />
In 2015, the Pew Research Centre conducted a survey<br />
in 40 countries to measure perceptions of global<br />
challenges. The survey of representative samples of<br />
adults over age 18 showed that climate change was<br />
cited as the biggest challenge in 19 countries, making<br />
it the most widespread concern. In Latin America <strong>and</strong><br />
sub-Saharan Africa, 50% of adults reported high concern<br />
about climate change. Global economic instability was<br />
the biggest concern in several countries <strong>and</strong> the second<br />
biggest in half the countries surveyed (Pew Research<br />
Centre, 2015).<br />
Cross-national opinion surveys have their limits,<br />
however. Attempts to measure <strong>and</strong> analyse self-reported<br />
data on attitudes often confront the social desirability<br />
problem: adults are rarely willing to admit prejudices in<br />
relation to gender, race <strong>and</strong> religion in opinion surveys<br />
but may be more likely to give a socially acceptable or<br />
desirable response.<br />
An ISSP summary index on environmental attitudes<br />
shows Canada, Denmark <strong>and</strong> Switzerl<strong>and</strong> leading the<br />
ranks in environmental concern, with Bulgaria, the<br />
Philippines <strong>and</strong> South<br />
Africa at the lower<br />
end. Longitudinal<br />
The International<br />
analysis of successive<br />
Social Survey<br />
ISSP waves shows<br />
environmental concern<br />
Programme shows that<br />
decreasing in almost<br />
environmental concern all countries over the<br />
is decreasing in almost past two decades. In<br />
the United States,<br />
all countries over the<br />
for instance, about<br />
past two decades<br />
46% of the population<br />
was very willing or<br />
Overall, target 4.7 makes explicit the need for ‘all learners<br />
[to] acquire the knowledge <strong>and</strong> skills to promote<br />
sustainable development’. Currently proposed indicators<br />
refer only to school-age children <strong>and</strong> adolescents. An<br />
appropriate monitoring framework would find ways to<br />
better capture the target’s intent. Future data collection<br />
efforts should strengthen the knowledge base on out-ofschool<br />
youth <strong>and</strong> all adults.<br />
Furthermore, coordinated efforts are needed in<br />
developing a shared monitoring framework <strong>and</strong><br />
conducting assessments of learners’ knowledge <strong>and</strong><br />
skills. Establishing common underst<strong>and</strong>ings at the<br />
regional level, such as the Southeast Asia Primary<br />
Learning Metrics, is likely to prove more feasible in<br />
coming years.<br />
304<br />
CHAPTER 16 | TARGET 4.7 – SUSTAINABLE DEVELOPMENT AND GLOBAL CITIZENSHIP
16<br />
ENDNOTES<br />
1. The third phase, 2015–2019, focuses on strengthening the work of the first<br />
two phases <strong>and</strong> promoting human rights training for media professionals<br />
(OHCHR, 2014).<br />
2. 18 countries in Latin America <strong>and</strong> the Caribbean, 16 in Europe <strong>and</strong> Northern<br />
America, 15 in sub-Saharan Africa, 11 in the Pacific, 7 in Eastern <strong>and</strong> Southeastern<br />
Asia, 6 in Southern Asia, 3 in Northern Africa <strong>and</strong> Western Asia, <strong>and</strong> 2<br />
in the Caucasus <strong>and</strong> Central Asia.<br />
3. Underst<strong>and</strong>ing the importance of human rights helps underst<strong>and</strong> the rights<br />
<strong>and</strong> responsibilities of individuals <strong>and</strong> groups, examine the multiple ways<br />
in which intolerance violates human rights, <strong>and</strong> recognize human rights<br />
violations such as racism, sexism <strong>and</strong> xenophobia (Reimers, 2010).<br />
4. The SULITEST will also be available for companies <strong>and</strong> organizations in 2016.<br />
5. Canada, France, Germany, Italy, Japan, Mexico, Sweden, the United Kingdom<br />
<strong>and</strong> the United States.<br />
6. Module topics have included environment; the role of government; social<br />
inequality; social support; family <strong>and</strong> gender issues; work orientation; the<br />
impact of religious background, behaviour, <strong>and</strong> beliefs on social <strong>and</strong> political<br />
preferences; <strong>and</strong> national identity.<br />
2016 • GLOBAL EDUCATION MONITORING REPORT 305
17<br />
Somali children wash their h<strong>and</strong>s before<br />
eating lunch at Shabelle boarding school<br />
in Mogadishu. “We learn about hygiene<br />
at school – we learn that it is important<br />
to wash our h<strong>and</strong>s after going to the<br />
toilet – we learn that it is important to<br />
wash our h<strong>and</strong>s before eating too. I feel<br />
better now that I am washing my h<strong>and</strong>s<br />
– I don’t get sick as often.”.<br />
CREDIT: Kate Holt/GEM Report<br />
KEY MESSAGES<br />
While the target recognizes the principles of a child-friendly school – child-centredness, democratic participation<br />
<strong>and</strong> inclusiveness – not all these are amenable to global monitoring.<br />
A lot of work remains to be done on improving data, but existing sources show that 3 in 10 primary schools still<br />
lack adequate water supply, increasing to 5 in 10 in the 49 least developed countries.<br />
Some countries inspect school structural safety closely, but not in detail. Participatory methods have been<br />
developed to help students <strong>and</strong> the community provide information on school conditions.<br />
Due to lack of consensus on a definition <strong>and</strong> often limited monitoring capacity, it is hard to know how many<br />
school facilities are accessible to children with disabilities.<br />
ICT in education is commonly considered an essential element of an effective learning environment. But in some<br />
of the poorest countries most primary schools do not even have electricity. Even if they do, other factors may<br />
prevent schools from being connected to the internet. And in many developing countries, there are far too many<br />
learners per computer to make the activity beneficial.<br />
School-related violence is a global phenomenon. About 40% of 13- to 15-year-old students in 37 countries<br />
reported having been involved in physical fights. Overall, better coordination is needed between various<br />
international surveys to reveal more about where <strong>and</strong> how often violence occurs.<br />
A high number of attacks on schools, teachers <strong>and</strong> students by state security forces or non-state armed groups<br />
are recorded every year. Military use of schools took place in 26 countries between 2005 <strong>and</strong> 2015. Between<br />
2009 <strong>and</strong> 2012, 1,000 or more education-related attacks took place in 6 countries.<br />
306<br />
CHAPTER 17 | TARGET 4.A – EDUCATION FACILITIES AND LEARNING ENVIRONMENTS
17<br />
CHAPTER 17<br />
Sustainable Development Goal 4.A<br />
TARGET 4.A<br />
Education facilities <strong>and</strong><br />
learning environments<br />
Build <strong>and</strong> upgrade education facilities that are child, disability <strong>and</strong> gender<br />
sensitive <strong>and</strong> provide safe, non-violent, inclusive <strong>and</strong> effective learning<br />
environments for all<br />
GLOBAL INDICATOR 4.A.1 – Percentage of schools with access to: (a) electricity, (b) the Internet<br />
for pedagogical purposes, (c) computers for pedagogical purposes, (d) adapted infrastructure<br />
<strong>and</strong> materials for students with disabilities, (e) basic drinking water, (f) single-sex basic sanitation<br />
facilities, <strong>and</strong> (g) basic h<strong>and</strong>washing facilities (as per the water, sanitation <strong>and</strong> hygiene (WASH)<br />
indicator definitions)<br />
THEMATIC INDICATOR 33 – Percentage of students experiencing bullying, corporal punishment,<br />
harassment, violence, sexual discrimination <strong>and</strong> abuse<br />
THEMATIC INDICATOR 34 – Number of attacks on students, personnel <strong>and</strong> institutions<br />
2016 • GLOBAL EDUCATION MONITORING REPORT 307
17<br />
School infrastructure............................................................................................................ 308<br />
Information <strong>and</strong> communication technology in schools......................................311<br />
Violence <strong>and</strong> attacks in schools........................................................................................ 314<br />
This target is built on the concept of child-friendly<br />
schools, which is promoted by UNICEF <strong>and</strong> based on<br />
the 1990 Convention on the Rights of the Child. The target<br />
recognizes the principles of a child-friendly school – childcentredness,<br />
democratic participation <strong>and</strong> inclusiveness<br />
– which have been measured in cross-country research<br />
studies (Godfrey et al., 2012). However, it is hard to<br />
imagine them monitored on a global scale. Hence this<br />
chapter focuses on three aspects of child-friendly schools<br />
with potential for global monitoring: school infrastructure,<br />
information <strong>and</strong> communication technology (ICT), <strong>and</strong><br />
violence <strong>and</strong> attacks in schools.<br />
BOX 17.1<br />
A school infrastructure index in Paraguay<br />
Good school infrastructure is an element of an effective learning environment <strong>and</strong> can<br />
contribute to improved learning outcomes. The challenge is to collect up-to-date information<br />
on various aspects of school facilities, assess priorities <strong>and</strong> act upon the evidence.<br />
In 2008, with funding from the Inter-American Development Bank, the government<br />
of Paraguay carried out an infrastructure census, which generated a wealth of data<br />
on classrooms, ancillary rooms, libraries, laboratories, electricity, technology, water<br />
<strong>and</strong> sanitation. A basic school infrastructure index was developed to synthesize the<br />
information. The index ranged from zero to one, with one representing the best<br />
infrastructure level a school could achieve. The mean value by district ranged from 0.08<br />
to 0.37 for primary schools <strong>and</strong> from 0.12 to 0.44 for secondary schools, with the lowest<br />
values in rural districts, such as Caazapá <strong>and</strong> Canindeyú, which are inhabited by Guaranispeaking<br />
communities, <strong>and</strong> the highest values in the district of the capital city, Asunción.<br />
The infrastructure in indigenous areas was particularly poor. Only 6% of schools had<br />
access to running water in indigenous schools, compared with 37% in other rural areas<br />
<strong>and</strong> 67% in urban areas. In indigenous schools, 47% of classrooms were in good condition,<br />
compared with 69% in other rural areas <strong>and</strong> 88% in urban areas.<br />
Despite a more than tenfold increase of the construction <strong>and</strong> equipment investment<br />
budget between 2008 <strong>and</strong> 2012, from US$1.4 million to US$13.4 million, the amount<br />
allocated for primary <strong>and</strong> secondary schools stagnated. The bulk of the increase went to<br />
tertiary education, improvements in the offices of the Ministry of Education <strong>and</strong> Culture,<br />
<strong>and</strong> repairs for the Higher Institute of Fine Arts. Short-term infrastructure plans focused<br />
on new headquarters for the ministry, leaving the updating of the infrastructure census<br />
for the medium term <strong>and</strong> the development of early childhood facilities for the long term.<br />
Sources: Juntos por el Educación (2013); UNICEF (2013a); Wodon (2016).<br />
SCHOOL INFRASTRUCTURE<br />
Adequate education facilities <strong>and</strong> learning environments<br />
are necessary not only to safeguard learners’ health <strong>and</strong><br />
well-being but also to fulfil their right to education. School<br />
infrastructure refers to a wide range of elements, including<br />
light <strong>and</strong> ventilation, insulation, furniture, blackboards<br />
<strong>and</strong> laboratories. The formulation of infrastructure<br />
st<strong>and</strong>ards <strong>and</strong> introduction of monitoring mechanisms<br />
at the national <strong>and</strong> sometimes international level have<br />
progressed (Box 17.1) but need to be further built upon so<br />
that comparable information is available for every school.<br />
Three aspects of school infrastructure that are explicit<br />
or implicit in the target formulation are reviewed in<br />
this section: water, sanitation <strong>and</strong> hygiene (‘build<br />
<strong>and</strong> upgrade education facilities’); structural safety<br />
(‘safe’); <strong>and</strong> accessibility for <strong>people</strong> with disabilities<br />
(‘disability … sensitive’).<br />
Water, sanitation <strong>and</strong> hygiene<br />
Improving water, sanitation <strong>and</strong> hygiene facilities in<br />
education institutions can have significant positive<br />
effects on health <strong>and</strong> education outcomes. These<br />
facilities include potable drinking water; clean, safe<br />
toilets; <strong>and</strong> h<strong>and</strong>washing facilities. Inadequate facilities<br />
increase the risk of disease transmission. Improved<br />
facilities, coupled with hygiene education, can reduce<br />
absenteeism. They can also increase dem<strong>and</strong> for<br />
education, particularly among adolescent girls, who<br />
may drop out due to a lack of girls-only toilet facilities<br />
(UNICEF, 2010).<br />
308<br />
CHAPTER 17 | TARGET 4.A – EDUCATION FACILITIES AND LEARNING ENVIRONMENTS
17<br />
“<br />
In the least developed countries, only half of primary<br />
schools had an adequate water supply in 2013<br />
The main mechanism of global monitoring in this area<br />
is the WHO/UNICEF Joint Monitoring Programme,<br />
established in 1990, which has provided regular national,<br />
regional <strong>and</strong> global estimates of progress towards<br />
the Millennium Development Goal (MDG) targets. In<br />
recent years, it has exp<strong>and</strong>ed its focus to include water,<br />
sanitation <strong>and</strong> hygiene in schools.<br />
The existing Joint Monitoring Programme global data<br />
set is composed of data from national education census<br />
reports, the UNESCO Institute for Statistics (UIS) sub-<br />
Saharan Africa regional module, the Latin American<br />
Laboratory for Assessment of the Quality of Education<br />
(LLECE) <strong>and</strong> the 2011 UN-Water Global Analysis <strong>and</strong><br />
Assessment of Sanitation <strong>and</strong> Drinking Water. Where<br />
primary data sources were unavailable or inaccessible,<br />
UNICEF country office annual reports were used. For<br />
2013, data are available from 149 countries representing<br />
83% of the global population <strong>and</strong> 96% of the population of<br />
developing countries (UNICEF, 2015a).<br />
These data show that school water <strong>and</strong> sanitation<br />
provision has improved since 2008 but remains low.<br />
The average share of primary schools with adequate<br />
water supply in 2013 was 71% worldwide, but 52% in the<br />
49 least developed countries. The respective estimates<br />
for adequate sanitation were 69% <strong>and</strong> 51% (Figure 17.1).<br />
The data are insufficient for global figures on school<br />
hygiene, but availability of h<strong>and</strong>washing facilities in the 11<br />
countries with data is very low.<br />
Caution is needed in interpreting the estimates, as<br />
underlying definitions are inconsistent across data sources<br />
or countries. For example, the definition of an adequate<br />
sanitation facility may cover the mere existence of<br />
toilets, improved toilets (e.g. flush, ventilated, improved<br />
pit latrine, pit latrine with slab or composting), functional<br />
toilets, or toilets meeting national st<strong>and</strong>ards. Precise<br />
definitions are unavailable for 60% of countries.<br />
In other words, while several dimensions are inherent in<br />
the definition of adequate water supply <strong>and</strong> sanitation<br />
(including quantity, quality, proximity, functionality,<br />
gender segregation <strong>and</strong> accessibility to children with<br />
disabilities), many are often not captured. A review of<br />
”<br />
54 school census questionnaires found that 48 included<br />
items on water <strong>and</strong> sanitation, but only Myanmar<br />
collected information on all parameters for water, <strong>and</strong><br />
only Belize <strong>and</strong> Iraq for sanitation. Only 30 countries gave<br />
information on gender-segregated toilets (UNICEF, 2015a).<br />
There are guidelines on how to formulate relevant<br />
questions on school census forms <strong>and</strong> household surveys<br />
to improve information quality (UNICEF, 2011). The<br />
Joint Monitoring Programme is working with partners<br />
to recommend a core <strong>and</strong> exp<strong>and</strong>ed set of questions to<br />
support the harmonization of indicators across national<br />
monitoring systems (WHO <strong>and</strong> UNICEF, 2015). It will<br />
also establish a systematic data quality review process<br />
to weight national coverage figures for more accurate<br />
regional <strong>and</strong> global estimates. It seeks to exp<strong>and</strong> the data<br />
set to include both primary <strong>and</strong> secondary schools.<br />
FIGURE 17.1:<br />
Three in 10 primary schools still lack adequate water supply <strong>and</strong> sanitation<br />
Proportion of primary schools with adequate water supply <strong>and</strong> sanitation,<br />
average <strong>and</strong> country groups, 2008 <strong>and</strong> 2013<br />
Proportion of schools with adequate water<br />
supply <strong>and</strong> sanitation (%)<br />
100<br />
80<br />
60<br />
40<br />
20<br />
0<br />
World<br />
71<br />
65<br />
Source: UNICEF (2015a).<br />
Least developed<br />
countries<br />
52<br />
43<br />
Water<br />
Developing<br />
countries<br />
70<br />
63<br />
Developed<br />
countries<br />
89<br />
88<br />
World<br />
69<br />
63<br />
Least developed<br />
countries<br />
51<br />
42<br />
Developing<br />
countries<br />
Sanitation<br />
67<br />
61<br />
2013<br />
2008<br />
Developed<br />
countries<br />
89<br />
2016 • GLOBAL EDUCATION MONITORING REPORT 309
17<br />
Structural safety of schools<br />
Disasters often damage or destroy school infrastructure,<br />
claim lives of students <strong>and</strong> teachers, <strong>and</strong> disrupt<br />
education provision. In the last 10 years, earthquakes<br />
in China, Haiti <strong>and</strong> Nepal; cyclones in Bangladesh; <strong>and</strong><br />
typhoons in the Philippines have destroyed thous<strong>and</strong>s<br />
of schools. The effects of such events extend beyond the<br />
short term. In Nicaragua, Hurricane Mitch resulted in a<br />
45% increase in child labour among the most affected<br />
households, while increases in repetition <strong>and</strong> poor<br />
education performance rates followed Typhoon Mike in<br />
the Philippines (World Bank, 2015b).<br />
school buildings met<br />
After a school safety requirements for a<br />
technical certificate<br />
act was passed in the<br />
of school building<br />
Islamic Republic of Iran, safety, covering more<br />
25% of classrooms were than 100,000 schools.<br />
Data are updated <strong>and</strong><br />
rebuilt or retrofitted in<br />
published annually.<br />
the following five years The certificate has<br />
been updated <strong>and</strong><br />
incorporated into<br />
regular monitoring (Mahdizadeh, 2011).<br />
While the occurrence of natural hazards is mostly beyond<br />
human control, the impact is magnified when schools are<br />
unsafe <strong>and</strong> communities are vulnerable. This issue is even<br />
greater with the increasing likelihood of extreme weather<br />
events associated with climate change.<br />
The Global Alliance for Disaster Risk Reduction <strong>and</strong><br />
Resilience in the Education Sector has drawn up a<br />
Comprehensive School Safety Framework. It includes<br />
a disaster-resilient infrastructure component with guidelines<br />
<strong>and</strong> regulations on specific local risks, <strong>and</strong> skilled personnel<br />
<strong>and</strong> inspection mechanisms to assess the risk profile<br />
of buildings <strong>and</strong> compliance with st<strong>and</strong>ards (GADRRRES/<br />
UNISDR, 2014).<br />
Good examples of international guidelines include the<br />
guidance notes on safer school construction developed by<br />
the Inter-agency Network for Education in Emergencies<br />
<strong>and</strong> the Global Facility for Disaster Reduction <strong>and</strong><br />
Recovery (INEE <strong>and</strong> GFDRR, 2009), since complemented<br />
by a manual on community-based approaches<br />
(GADRRRES, 2015). At the national level, Guatemala’s<br />
School Buildings Safety Indicator <strong>and</strong> guidelines for<br />
assessment have been adopted by UNICEF <strong>and</strong> other<br />
countries in Latin America. In Indonesia, the Centre<br />
for Disaster Mitigation at the Institute of Technology<br />
B<strong>and</strong>ung published, with Save the Children, a h<strong>and</strong>book<br />
of typical school design <strong>and</strong> a manual on retrofitting<br />
vulnerable school buildings, following the experience<br />
of the Aceh <strong>and</strong> West Sumatra Earthquake Response<br />
programmes (UNISDR, 2011).<br />
However, not all countries can afford detailed inspectionbased<br />
assessment. Tools that can help bridge these<br />
gaps are critical. The Global Alliance for Disaster Risk<br />
Reduction <strong>and</strong> Resilience in the Education Sector has<br />
developed three assessment tools for use on tablets <strong>and</strong><br />
smartphones, as part of the Comprehensive Safe Schools<br />
Self-Assessment Suite. With these tools, students <strong>and</strong><br />
community members can provide information on school<br />
conditions through crowd-sourcing; safety committees<br />
<strong>and</strong> education administrators can assess buildings; <strong>and</strong><br />
trained surveyors can carry out on-site inspections.<br />
Under the Safe Schools Initiative of the Association<br />
of Southeast Asian Nations, the self-assessment <strong>and</strong><br />
on-site inspection components have been applied in the<br />
Lao People’s Democratic Republic (ASSI, 2015).<br />
The Global Programme for Safer Schools of the Global<br />
Facility for Disaster Reduction <strong>and</strong> Recovery also<br />
advocates community auditing of school buildings<br />
as a valuable alternative monitoring tool. Community<br />
mapping initiatives have been undertaken<br />
in Haiti, Indonesia, Nepal <strong>and</strong> Sri Lanka (GFDRR, 2015).<br />
Accessibility for <strong>people</strong> with disabilities<br />
To gain access to education facilities <strong>and</strong> learning<br />
environments, <strong>people</strong> with disabilities need to<br />
overcome obstacles such as lack of mobility<br />
equipment, poor transport infrastructure <strong>and</strong> road<br />
conditions, inappropriately designed buildings,<br />
negative social attitudes, absence of teaching aids<br />
<strong>and</strong> unsuitable curricula.<br />
The risk profile of buildings <strong>and</strong> compliance with<br />
st<strong>and</strong>ards can be assessed. The Islamic Republic of Iran<br />
passed a school safety act in 2006; in the following five<br />
years some 25% of classrooms were rebuilt or retrofitted<br />
(Ghafory-Ashtiany, 2014). Before any work began, a<br />
comprehensive database was prepared on whether<br />
UNICEF has designed an Inclusive Education Rating<br />
System tool, which includes the physical environment<br />
as a key dimension, to enable specialists to assess<br />
national policy <strong>and</strong> the school system. UNICEF has also<br />
developed criteria on which to base assessments at the<br />
school level, including detailed guidance on getting to,<br />
310<br />
CHAPTER 17 | TARGET 4.A – EDUCATION FACILITIES AND LEARNING ENVIRONMENTS
17<br />
entering <strong>and</strong> moving through the school; using water,<br />
sanitation <strong>and</strong> recreational facilities; <strong>and</strong> developing<br />
school evacuation safeguards (UNICEF, 2014a; 2014f).<br />
with disabilities in each room; similarly, only one<br />
asked whether toilets were accessible to children with<br />
disabilities (UNICEF, 2014b).<br />
Even if accessibility is defined to narrowly focus on<br />
physical barriers in school buildings, it is difficult to know<br />
if facilities in a given country are suitable for children with<br />
disabilities, due to the lack of a definition of accessible<br />
schools <strong>and</strong>, more often, limited monitoring capacity.<br />
Article 9 of the 2006 Convention on the Rights of Persons<br />
with Disabilities calls on countries to ‘[d]evelop, promulgate<br />
<strong>and</strong> monitor the implementation of minimum st<strong>and</strong>ards<br />
<strong>and</strong> guidelines for the accessibility of facilities <strong>and</strong> services<br />
open or provided to the public’ <strong>and</strong> explicitly refers to<br />
schools (United Nations, 2006). Accessibility st<strong>and</strong>ards are<br />
a necessary basis for monitoring compliance. A review in<br />
Asia <strong>and</strong> the Pacific found that at least 25 of 36 countries<br />
had such st<strong>and</strong>ards for buildings, public transport or both<br />
(UNESCAP, 2010).<br />
In South Africa, the Department of Basic Education<br />
issued a comprehensive set of legally binding norms<br />
<strong>and</strong> st<strong>and</strong>ards for all public schools in 2013. They include<br />
universal design principles on minimum space, toilets<br />
<strong>and</strong> parking spots for children with disabilities <strong>and</strong> are to<br />
be followed in all future construction work (South Africa<br />
Government, 2013). However, the presence of st<strong>and</strong>ards<br />
is not sufficient. While South Africa has a National<br />
Education Infrastructure Management System, it does<br />
not appear to monitor implementation of the st<strong>and</strong>ards<br />
with respect to disability (South Africa Government,<br />
2015). Civil society groups do, however, conduct social<br />
audits <strong>and</strong> point to cases where schools do not meet the<br />
norms <strong>and</strong> st<strong>and</strong>ards (Equal Education, 2015).<br />
INFORMATION AND<br />
COMMUNICATION<br />
TECHNOLOGY IN SCHOOLS<br />
ICT is commonly considered an essential element of<br />
an effective learning environment. Available evidence<br />
has not established a direct link between ICT in schools<br />
<strong>and</strong> learning outcomes, but school computers (desktop,<br />
laptop or notebook) <strong>and</strong> mobile phones may be the only<br />
way for students to gain access to digital content <strong>and</strong><br />
the digital world in many countries. 1<br />
The 2015 Qingdao Declaration on ICT <strong>and</strong> post-2015<br />
education called upon the Global Education Monitoring<br />
Report to report on ICT in education but did not set specific<br />
targets. The basis for monitoring ICT in education<br />
has been the 2003 Geneva Plan of Action of the World<br />
Summit on the Information Society. Two of its 10 targets,<br />
which were to be achieved by 2015, were related to<br />
education: to ‘connect universities, colleges, secondary<br />
schools <strong>and</strong> primary schools with ICTs’ <strong>and</strong> to ‘adapt<br />
all primary <strong>and</strong> secondary school curricula to meet<br />
the challenges of the Information Society, taking into<br />
account national circumstances’ (ITU, 2011).<br />
The UIS focuses on eight core indicators to monitor<br />
these targets (Table 17.1). It has conducted regional data<br />
collection in Latin America <strong>and</strong> the Caribbean (UIS, 2012),<br />
the Arab States (UIS, 2013), Asia (UIS, 2014a) <strong>and</strong> sub-<br />
Saharan Africa (UIS, 2015). In some sub-Saharan African<br />
In India, the Sarva Shiksha Abhiyan programme, promoting<br />
education for all, supports ramps, railings <strong>and</strong> modification<br />
in toilets <strong>and</strong> provides manuals to village education<br />
committees. Data in the District Information System<br />
for Education led the government to declare 82% of<br />
schools ‘barrier free’ in 2015. However, this assessment<br />
only captured the availability of ramps <strong>and</strong> not all<br />
aspects that should be considered before a school can<br />
be declared compliant with accessibility st<strong>and</strong>ards (India<br />
Government, 2015; NUEPA, 2014).<br />
Education management information systems are illprepared<br />
to collect relevant information. A review of<br />
40 school census forms showed that only one<br />
mentioned physical infrastructure provisions for children<br />
TABLE 17.1:<br />
UIS core indicators on ICT in education<br />
Domain<br />
Infrastructure<br />
Usage<br />
Participation<br />
Teaching staff<br />
Source: UIS (2009).<br />
Indicator<br />
EDR1: Proportion of schools with electricity<br />
ED1. Proportion of schools with a radio used for educational purposes<br />
ED2. Proportion of schools with a television used for educational purposes<br />
ED3. Proportion of schools with a telephone communication facility<br />
ED4. Learner-to-computer ratio in schools with computer-assisted instruction<br />
ED4bis. Learner-to-computer ratio<br />
ED5. Proportion of schools with internet access, by type of access<br />
ED6. Proportion of learners who have access to the internet at school<br />
ED7. Proportion of learners enrolled at the post-secondary non-tertiary <strong>and</strong> tertiary level in ICT fields<br />
ED8. Proportion of ICT-qualified teachers in primary <strong>and</strong> secondary schools<br />
2016 • GLOBAL EDUCATION MONITORING REPORT 311
17<br />
countries, such as Burkina Faso, Comoros, Guinea,<br />
Madagascar <strong>and</strong> Niger, ICT is not a relevant curricular<br />
objective <strong>and</strong> courses related to basic computer skills<br />
or computing may not even be available in primary or<br />
secondary education.<br />
Using ICT in schools requires readily <strong>and</strong> regularly<br />
available electricity. Secondary schools, which are<br />
more likely to be in urban areas, are better connected.<br />
But in many sub-Saharan African countries, the lack of<br />
mains electricity hampers the use of ICT, despite the<br />
increasing availability of solar panels <strong>and</strong> other solutions.<br />
In the Central African Republic, practically no primary<br />
or secondary school was connected to an electrical grid<br />
(Figure 17.2). Even if schools are connected to a power<br />
source, power surges <strong>and</strong> brownouts are common, further<br />
impeding the reliable usage of ICT (Mudenda et al., 2014;<br />
Practical Action, 2013).<br />
Electricity is a poor predictor of access to the internet<br />
in many countries. Despite full electrification, internet<br />
access was 56% in Trinidad <strong>and</strong> Tobago, 30% in<br />
Palestine, 27% in Azerbaijan <strong>and</strong> 6% in Kyrgyzstan<br />
(Figure 17.3). Internet connectivity depends on the<br />
national telecommunications infrastructure, geography<br />
<strong>and</strong> schools’ ability<br />
Internet connectivity<br />
to pay. In Mongolia,<br />
91% of primary<br />
depends on the national<br />
<strong>and</strong> secondary<br />
telecommunications schools had internet<br />
infrastructure, geography<br />
connection in 2012.<br />
When some schools<br />
<strong>and</strong> schools’ ability to pay<br />
began disconnecting<br />
due to high costs, the<br />
Ministry of Education,<br />
Culture <strong>and</strong> Science provided central funds to ensure<br />
connectivity (ADB, 2012).<br />
Measuring internet connectivity requires information<br />
on the type <strong>and</strong> speed of connection as well as<br />
distinguishing between its use for administrative <strong>and</strong><br />
pedagogical purposes. The Broadb<strong>and</strong> Commission’s<br />
target of Broadb<strong>and</strong> for All by 2020 commits the<br />
international community to monitor school connectivity<br />
(Broadb<strong>and</strong> Commission, 2013). Private sector internet<br />
service providers should contribute relevant data..<br />
To ensure that computer- <strong>and</strong> internet-assisted<br />
instruction meets all pupils’ needs, enough computers<br />
must be available. Pupil/computer ratios around 2:1 or<br />
FIGURE 17.2:<br />
Most primary schools do not have electricity in some of the poorest countries<br />
Proportion of primary <strong>and</strong> secondary schools with electricity, 2009–2014<br />
100<br />
80<br />
Schools with electricity (%)<br />
60<br />
40<br />
20<br />
0<br />
C. A. R.<br />
Madagascar<br />
Sierra Leone<br />
Burundi<br />
Niger<br />
Nepal<br />
Myanmar<br />
Mali<br />
D. R. Congo<br />
Togo<br />
Guinea<br />
Comoros<br />
U. R. Tanzania<br />
Malawi<br />
Lao PDR<br />
Senegal<br />
Benin<br />
Nicaragua<br />
Zambia<br />
Gambia<br />
Côte d’Ivoire<br />
Ghana<br />
Eritrea<br />
India<br />
Venezuela, B. R.<br />
Bangladesh<br />
Namibia<br />
Bhutan<br />
Cabo Verde<br />
Botswana<br />
Ecuador<br />
Indonesia<br />
Philippines<br />
Belize<br />
Morocco<br />
S. Tome/Principe<br />
Costa Rica<br />
Suriname<br />
Brazil<br />
Paraguay<br />
Argentina<br />
Swazil<strong>and</strong><br />
El Salvador<br />
South Africa<br />
Uruguay<br />
Algeria<br />
Thail<strong>and</strong><br />
Jordan<br />
Iran, Isl. Rep.<br />
Seychelles<br />
Mauritius<br />
Maldives<br />
Singapore<br />
Rep. of Korea<br />
Malaysia<br />
Hong Kong, China<br />
Qatar<br />
Palestine<br />
Source: UIS database.<br />
312<br />
CHAPTER 17 | TARGET 4.A – EDUCATION FACILITIES AND LEARNING ENVIRONMENTS
17<br />
FIGURE 17.3:<br />
Electricity access does not automatically translate to internet access in schools<br />
Proportion of schools with electricity <strong>and</strong> internet, primary <strong>and</strong> secondary schools, selected countries, 2009–2014<br />
100<br />
Schools with electricity <strong>and</strong> internet (%)<br />
80<br />
60<br />
40<br />
20<br />
Electricity<br />
Internet<br />
0<br />
Madagascar<br />
Liberia<br />
Guinea<br />
Guatemala<br />
Nepal<br />
Suriname<br />
Kyrgyzstan<br />
Cambodia<br />
Paraguay<br />
S. Tome/Principe<br />
Sri Lanka<br />
Gambia<br />
Ecuador<br />
El Salvador<br />
Azerbaijan<br />
Palestine<br />
Argentina<br />
Bhutan<br />
Brazil<br />
Egypt<br />
Turks/Caicos Is<br />
Trinidad/Tobago<br />
Montserrat<br />
Qatar<br />
Grenada<br />
St. Vincent/Grenad.<br />
Colombia<br />
Dominica<br />
Oman<br />
Jordan<br />
Iran, Isl. Rep.<br />
Antigua/Barbuda<br />
Malaysia<br />
Mongolia<br />
Mauritius<br />
Uruguay<br />
Thail<strong>and</strong><br />
Maldives<br />
Singapore<br />
Rep. of Korea<br />
Hong Kong, China<br />
Brunei Daruss.<br />
Georgia<br />
Armenia<br />
Source: UIS database.<br />
Secondary<br />
Primary<br />
Oman<br />
Egypt<br />
Turks/Caicos Is<br />
Trinidad/Tobago<br />
Sint Maarten<br />
St Vincent/Grenad.<br />
Saint Lucia<br />
St Kitts/Nevis<br />
Montserrat<br />
Jamaica<br />
Grenada<br />
Dominica<br />
Curaçao<br />
Cuba<br />
Cayman Is<br />
Br. Virgin Is<br />
Barbados<br />
Bahamas<br />
Aruba<br />
Antigua/Barbuda<br />
Anguilla<br />
Kyrgyzstan<br />
Georgia<br />
Armenia<br />
Belarus<br />
100<br />
80<br />
60<br />
40<br />
20<br />
0<br />
3:1 promote collaborative learning. In many developing<br />
countries, however, the number of learners per computer<br />
may be so high that time on task per pupil is too limited.<br />
In Guinea <strong>and</strong> Madagascar, the pupil/computer ratio<br />
was at least 500:1. In most countries, pupil/computer<br />
ratios decrease from primary to secondary education.<br />
For example, in the Islamic Republic of Iran, the pupil/<br />
computer ratio was 83:1 in primary education, 28:1 in<br />
lower secondary education <strong>and</strong> 17:1 in upper secondary<br />
education in 2012 (Figure 17.4).<br />
Several countries have invested in well-publicized<br />
projects to increase computer availability. Rw<strong>and</strong>a<br />
has reduced its pupil/computer ratio in primary <strong>and</strong><br />
secondary schools as part of the One Laptop per<br />
Child project, which manufactures low cost, durable<br />
computers for schools in developing countries. Georgia<br />
reduced its ratio from more than 200:1 in 2004 to 7:1<br />
in 2012 as a result of spearheading the ambitious Deer<br />
Leap programme to ensure computers were placed in all<br />
schools (UIS, 2014b).<br />
However, national averages mask differences within<br />
countries. In China, computer availability is twice as high in<br />
2016 • GLOBAL EDUCATION MONITORING REPORT 313
17<br />
FIGURE 17.4:<br />
In many countries, the pupil/computer ratio is too high to enable meaningful learning<br />
Pupil/computer ratio in primary, lower <strong>and</strong> upper secondary education, 2009–2014<br />
500<br />
400<br />
300<br />
200<br />
150<br />
In Guinea <strong>and</strong> Madagascar, there are at least 500 students per computer in primary <strong>and</strong> secondary schools<br />
In Gambia, there are 277 students per computer in primary schools<br />
125<br />
Primary<br />
Students per computer<br />
100<br />
75<br />
50<br />
Lower secondary<br />
Upper secondary<br />
25<br />
0<br />
Madagascar<br />
Guinea<br />
Gambia<br />
Paraguay<br />
Egypt<br />
Iran, Isl. Rep.<br />
Botswana<br />
El Salvador<br />
Argentina<br />
Brazil<br />
Palestine<br />
Ecuador<br />
Costa Rica<br />
Cuba<br />
Jordan<br />
Trinidad/Tobago<br />
Dominica<br />
Turkey<br />
Romania<br />
Chile<br />
Malaysia<br />
Greece<br />
Italy<br />
Bulgaria<br />
Thail<strong>and</strong><br />
Croatia<br />
Pol<strong>and</strong><br />
Portugal<br />
Lithuania<br />
Qatar<br />
Oman<br />
Austria<br />
Latvia<br />
Slovenia<br />
Hungary<br />
Belgium<br />
France<br />
Slovakia<br />
Cyprus<br />
Finl<strong>and</strong><br />
Estonia<br />
Malta<br />
Barbados<br />
Spain<br />
Denmark<br />
Cayman Is<br />
Norway<br />
Source: UIS database.<br />
urban primary schools (14:1) as in rural schools (29:1) (Zeng<br />
et al., 2012). In contrast, computers are more available<br />
in rural areas in Tajikistan due to a policy to provide all<br />
schools with a laboratory with the same fixed number of<br />
devices, regardless of enrolment; this has the effect of<br />
favouring pupils in small rural schools (ADB, 2012).<br />
The UIS will be collecting global data on ICT in<br />
education every two years, including on device type<br />
<strong>and</strong> deployment patterns. However, underst<strong>and</strong>ing<br />
the impact of ICT on outcomes will require better<br />
data on how, when <strong>and</strong> how much teachers <strong>and</strong><br />
pupils use ICT. For internet use, such data will be far<br />
easier to collect through internet traffic statistics<br />
than through physical surveys. Finally, to the extent<br />
that mobile phones become more commonly used for<br />
teaching <strong>and</strong> learning in the future, provision should be<br />
made to monitor their use.<br />
VIOLENCE AND ATTACKS<br />
IN SCHOOLS<br />
SCHOOL-RELATED VIOLENCE<br />
The UN World Report on Violence against Children<br />
identified violence in schools <strong>and</strong> other education<br />
settings as a global phenomenon (Pinheiro, 2006).<br />
School-related violent acts or threats comprise<br />
psychological, physical <strong>and</strong> sexual violence. They<br />
occur on school premises but also on the way to<br />
school, at home or in cyberspace. They are enforced<br />
by unequal power dynamics <strong>and</strong> are often the result<br />
of gender norms <strong>and</strong> stereotypes.<br />
In schools, manifestations of violence include bullying,<br />
corporal punishment, verbal <strong>and</strong> emotional abuse,<br />
intimidation, sexual harassment <strong>and</strong> assault, gang<br />
activity <strong>and</strong> the presence of weapons. While attention<br />
usually focuses on extreme events, such as shootings,<br />
314<br />
CHAPTER 17 | TARGET 4.A – EDUCATION FACILITIES AND LEARNING ENVIRONMENTS
17<br />
it is the more common <strong>and</strong> often unnoticed forms of<br />
violence that have the largest negative impact on the<br />
education experience of children <strong>and</strong> adolescents. These<br />
tend to be under-reported, as they often involve taboos<br />
(UNICEF, 2014d).<br />
Large-scale, cross-country school-based surveys are<br />
increasingly used to collect data on aspects of violence<br />
in schools; some countries also have well-established<br />
monitoring mechanisms. Yet, overall, consistent evidence<br />
on the global prevalence of school-related violence is<br />
lacking. A recent report by the Technical Working Group<br />
on Data Collection on Violence against Children identified<br />
a surge of interest but also fragmented approaches.<br />
Studies use different definitions of violence <strong>and</strong> record<br />
different behaviours. Their methods are not consistent in<br />
terms of time frames, sequencing of questions, response<br />
options, privacy arrangements or ethical protocols<br />
(UNICEF, 2014e). Better coordination is needed to enable<br />
the monitoring of global trends.<br />
Bullying is the most widely documented form of violence<br />
in schools<br />
Bullying is repeated exposure to aggressive behaviour<br />
from peers with the intent to inflict injury or discomfort.<br />
It can include physical violence, verbal abuse <strong>and</strong> the<br />
intent to cause psychological harm through humiliation<br />
or exclusion.<br />
The 2011 Trends in International Mathematics <strong>and</strong><br />
Science Study (TIMSS) collected data on grade 8<br />
students’ experience of six bullying behaviours, such<br />
as whether someone ‘spread lies’ about them or made<br />
them ‘do things’ they did not want to do (Mullis et al.,<br />
2012). About 41% reported having been bullied at least<br />
once in the past month. In Ghana, almost four-fifths<br />
did so. Boys were more likely to report being victims of<br />
bullying in almost every country, a trend particularly<br />
notable in Japan <strong>and</strong> the<br />
Republic of Korea, as well<br />
as in Arab States, such as<br />
In the 2011 TIMSS, Bahrain <strong>and</strong> Qatar.<br />
about 41% of<br />
grade 8 students<br />
reported having<br />
been bullied at<br />
least once in the<br />
past month<br />
The 2013 Third Regional<br />
Comparative <strong>and</strong><br />
Explanatory Study (TERCE),<br />
administered to grade<br />
6 students in 15 Latin<br />
American countries,<br />
distinguished between<br />
two forms of bullying,<br />
FIGURE 17.5:<br />
In Latin America, psychological bullying is twice as prevalent as<br />
physical bullying<br />
Percentage of grade 6 students who reported being bullied when in school,<br />
by type, 2013<br />
Prevalence of bullying (%)<br />
40<br />
35<br />
30<br />
25<br />
20<br />
15<br />
10<br />
5<br />
0<br />
Costa Rica<br />
Uruguay<br />
Mexico<br />
Paraguay<br />
Chile<br />
showing that psychological bullying was twice as<br />
prevalent as physical bullying. The prevalence of physical<br />
bullying varied from 9% in Costa Rica to 22% in the<br />
Dominican Republic, while rates of psychological bullying<br />
varied from 24% in Mexico to 35% in Peru (Figure 17.5).<br />
The Health Behaviour in School-Aged Children Survey<br />
collects data every four years on health <strong>and</strong> well-being,<br />
social environments <strong>and</strong> health behaviours of boys <strong>and</strong><br />
girls in more than 40 countries in Europe <strong>and</strong> North<br />
America. Results of the 2009/10 round show that those<br />
who reported having been bullied at least two or three<br />
times at school in the previous two months decreased<br />
from 13% among 11-year-olds to 9% among 15-year-olds.<br />
By contrast, the proportion who reported having bullied<br />
others increased from 8% among 11-year-olds to 12%<br />
among 15-year-olds (Currie et al., 2012). In the United<br />
States, 7% of students aged 12 to 18 reported having been<br />
cyberbullied during the previous year (Robers et al., 2015).<br />
Physical violence is very common<br />
Physical violence in schools manifests differently across<br />
countries. The Global School-based Student Health<br />
Survey (GSHS) asked adolescents whether they had been<br />
involved in physical fights at school in the past year.<br />
About 40% of 13- to 15-year-olds in 37 countries reported<br />
Panama<br />
Nicaragua<br />
Brazil<br />
Guatemala<br />
Argentina<br />
Source: GEM Report team analysis based on TERCE data.<br />
Ecuador<br />
Honduras<br />
Colombia<br />
Psychological<br />
Physical<br />
Peru<br />
Dominican Rep.<br />
2016 • GLOBAL EDUCATION MONITORING REPORT 315
17<br />
having been involved in physical fights between 2009 <strong>and</strong><br />
2012, <strong>and</strong> the prevalence reached almost 70% in Samoa<br />
(Figure 17.6).<br />
In the United States, a large group of surveys<br />
administered over two decades allows the Departments<br />
of Justice <strong>and</strong> Education to monitor levels of physical<br />
violence. The rate of violent victimization at school of<br />
students ages 12-18 declined from 9% in 1993 to 4% in<br />
2013. The percentage of grade 9-12 students carrying a<br />
weapon such as a gun, knife or club on school property<br />
declined from 12% to 5% during that period. But the<br />
percentage of those threatened or injured with such<br />
a weapon on school property remained constant at<br />
7% (Robers et al., 2015).<br />
In the Caribbean, school violence is a major problem.<br />
According to the Citizen Security Survey carried<br />
out in seven Caribbean countries, 16% of youth carried<br />
weapons during the day (UNDP, 2012). The Trinidad <strong>and</strong><br />
Tobago Youth Survey, which was administered in about<br />
25% of the country’s secondary schools, albeit mostly<br />
in high risk urban areas, found that 6% of students were<br />
gang members <strong>and</strong> 8% were gang associates (Katz <strong>and</strong><br />
Fox, 2010). The Community Safety <strong>and</strong> Security Branch<br />
of the Jamaica Constabulary Force regularly collects<br />
statistics on fights, stabbings <strong>and</strong> weapons found <strong>and</strong><br />
seized in school (Jamaica Observer, 2015).<br />
FIGURE 17.6:<br />
Many adolescents across the world are involved in physical fights<br />
Percentage of 13- to 15-year-olds who reported having been involved in physical fights<br />
over the past 12 months, 2009–2012<br />
80<br />
Involved in physical fights at school (%)<br />
70<br />
60<br />
50<br />
40<br />
30<br />
20<br />
10<br />
0<br />
Suriname<br />
Costa Rica<br />
Malawi<br />
Malaysia<br />
Honduras<br />
Niue<br />
Benin<br />
Bolivia<br />
Anguilla<br />
Maldives<br />
Belize<br />
Cook Isl<strong>and</strong>s<br />
Kiribati<br />
Br. Virgin Is<br />
Philippines<br />
Iraq<br />
St Kitts/Nevis<br />
Pakistan<br />
Peru<br />
Barbados<br />
Dominica<br />
Nauru<br />
Morocco<br />
Palestine<br />
Kuwait<br />
Egypt<br />
Oman<br />
Algeria<br />
Antigua/Barbuda<br />
Fiji<br />
Lebanon<br />
Qatar<br />
Male<br />
Total<br />
Female<br />
Tonga<br />
Jamaica<br />
Solomon Is<br />
Mauritania<br />
Samoa<br />
A culture of physical<br />
In the Caribbean,<br />
violence is often embedded<br />
in teacher–pupil relations.<br />
school violence is a<br />
In rural Ug<strong>and</strong>a, in a<br />
major problem baseline survey of 42<br />
primary schools using the<br />
child institutional version of<br />
a screening tool developed by the International Society<br />
for the Prevention of Child Abuse <strong>and</strong> Neglect, 54% of<br />
students reported physical violence by a staff member<br />
(Devries et al., 2015). Such behaviour is sometimes<br />
condoned by communities <strong>and</strong> even tolerated by the<br />
state. According to the Global Initiative to End All<br />
Corporal Punishment of Children, corporal punishment<br />
of children in schools is not fully prohibited by law in<br />
73 states (Global Initiative, 2015).<br />
Much of the scale <strong>and</strong> scope of sexual violence in schools<br />
remains hidden<br />
Sexual violence, a highly destructive form of violence in<br />
schools, is a global concern, yet knowledge of its extent<br />
is limited. It manifests as verbal <strong>and</strong> psychological<br />
harassment, sexual assault, rape, coercion, exploitation<br />
<strong>and</strong> discrimination in <strong>and</strong> around schools.<br />
The 2007 Southern <strong>and</strong> Eastern Africa Consortium<br />
for Monitoring Educational Quality (SACMEQ) survey<br />
provides comparable data on sexual harassment in<br />
primary schools across 15 education systems in sub-<br />
Saharan Africa. In six countries, including Kenya <strong>and</strong><br />
Zambia, over 40% of school principals reported that<br />
pupil–pupil sexual harassment had occurred either<br />
‘sometimes’ or ‘often’. Teachers were also reported to be<br />
perpetrators, with an average of 39% of school principals<br />
stating that teacher–pupil harassment had occurred in<br />
their schools, with the range varying from one-fifth of<br />
surveyed schools in Mozambique to over three-quarters<br />
in Seychelles (UNESCO, 2015j).<br />
But the way school principals perceive the problem<br />
provides an incomplete picture. Violence against Children<br />
Surveys of youth aged 13 to 17 have collected information<br />
about the location <strong>and</strong> circumstances of incidences of<br />
sexual violence in eight countries. In Malawi, one in five<br />
females <strong>and</strong> one in eight males had experienced at least<br />
one incident of sexual abuse in the year prior to the<br />
survey in 2013. Among victims of abuse, 21% of boys <strong>and</strong><br />
10% of girls reported that their most recent experience<br />
of sexual abuse happened in schools (Malawi Ministry of<br />
Gender, Children, Disability, <strong>and</strong> Social Welfare, 2014).<br />
Source: GEM Report team analysis (2016) based on 2009–2012 GSHS data.<br />
316<br />
CHAPTER 17 | TARGET 4.A – EDUCATION FACILITIES AND LEARNING ENVIRONMENTS
17<br />
Violence <strong>and</strong> attacks against civilian<br />
populations in north-eastern Nigeria <strong>and</strong><br />
neighbouring countries have forced more<br />
than 1 million children out of school<br />
School violence cannot be addressed unless it is<br />
better monitored<br />
Wide-ranging information is becoming available on various<br />
facets of school-related violence around the world. But<br />
all three principal types of sources – self-reports, citizen<br />
perceptions <strong>and</strong> police statistics – have their weaknesses.<br />
A monitoring framework with st<strong>and</strong>ardized indicators<br />
would be a first step to improve reporting. The Technical<br />
Working Group on Data Collection on Violence against<br />
Children can help draw attention to good practice <strong>and</strong><br />
methodological challenges. Core indicators should be<br />
integrated into national systems <strong>and</strong> international surveys,<br />
which currently approach school violence from a variety of<br />
perspectives. A higher degree of coordination is required<br />
to ensure that international surveys are carried out with<br />
sufficient regularity in the next 15 years to measure<br />
global school-based violence trends.<br />
ATTACKS<br />
Attacks related to education come in various forms.<br />
They are any intentional threat or use of force, including<br />
those directed at students <strong>and</strong> educators, at education<br />
institutions, including recruitment into armed groups.<br />
They can occur on the way to or from an education<br />
institution because of someone’s status as a student<br />
or educator. They can be directed at activists, including<br />
teacher union members, as well as education personnel<br />
<strong>and</strong> education aid workers. Schools, teachers <strong>and</strong><br />
students are often directly attacked, whether by state<br />
security forces or non-state armed groups, for political,<br />
military, ideological or sectarian reasons.<br />
Such direct attacks have a disastrous effect on the<br />
affected individuals, but the wider effects of a climate<br />
of fear <strong>and</strong> instability can paralyse whole education<br />
systems. The risk of attack can force schools to close <strong>and</strong><br />
discourage attendance <strong>and</strong> teacher recruitment. Violence<br />
<strong>and</strong> attacks against civilian populations in north-eastern<br />
Nigeria <strong>and</strong> neighbouring countries have forced more<br />
than 1 million children out of school, putting them at<br />
risk of dropping out altogether. In Nigeria alone, around<br />
600 teachers have been killed during the Boko Haram<br />
insurgency (UNICEF, 2015d).<br />
Monitoring such attacks is necessary to respond<br />
effectively <strong>and</strong> hold perpetrators accountable. However,<br />
obtaining accurate information is particularly challenging<br />
since incidents may often take place in remote<br />
areas with poor security <strong>and</strong> infrastructure, where<br />
governments may have little authority. More broadly,<br />
systems enabling schools, teachers, students <strong>and</strong><br />
citizens to report incidents are often lacking.<br />
One way to acquire first-h<strong>and</strong>, detailed data is to<br />
improve schools’ capacity for reporting incidents to<br />
the government. Human rights monitoring groups such<br />
as the Committee on Economic, Social <strong>and</strong> Cultural<br />
Rights, the Human Rights Committee, the Committee<br />
on the Rights of the Child <strong>and</strong> the Human Rights Council<br />
could then use the data to bring greater attention to<br />
monitoring <strong>and</strong> reporting of attacks on education.<br />
An open platform enabling teachers, students <strong>and</strong><br />
citizens to report incidents anonymously holds promise,<br />
as those with information may lack skills, resources<br />
or motivation to make reports, <strong>and</strong> may face serious<br />
threats to their safety. The potential to receive such<br />
real-time information is exp<strong>and</strong>ing with the growing<br />
availability of mobile phone technology.<br />
Following two reports published by UNESCO in 2007<br />
<strong>and</strong> 2010, the Global Coalition to Protect Education from<br />
Attack (GCPEA) launched the third Education under<br />
Attack report in 2014. Based on analysis of interviews<br />
<strong>and</strong> secondary sources, the report documented pervasive<br />
violence against education institutions, teachers<br />
<strong>and</strong> students. The majority of the incidents were<br />
concentrated in certain countries. Between 2009 <strong>and</strong><br />
2012, 1,000 or more education-related attacks per country<br />
took place in Afghanistan, Colombia, Pakistan, Somalia,<br />
Sudan <strong>and</strong> the Syrian Arab Republic, <strong>and</strong> between 500<br />
<strong>and</strong> 999 attacks in Côte d’Ivoire, the Democratic Republic<br />
of the Congo, Iraq, Israel, Libya, Mexico, Palestine <strong>and</strong><br />
Yemen (GCPEA, 2014). Military use of schools took place<br />
in 26 countries between 2005 <strong>and</strong> 2015 (GCPEA, 2015). A<br />
fourth report is scheduled for release in 2018.<br />
ENDNOTES<br />
1. This section draws on Wallet (2016).<br />
2016 • GLOBAL EDUCATION MONITORING REPORT 317
18<br />
Students from<br />
around the world<br />
graduate at Columbia<br />
University’s School<br />
of International<br />
<strong>and</strong> Public Affairs,<br />
New York.<br />
CREDIT: Barbara Alper/Columbia<br />
University – School of International<br />
<strong>and</strong> Public Affairs<br />
KEY MESSAGES<br />
The target on scholarships could exacerbate inequality, because beneficiaries tend to come from more<br />
advantaged backgrounds.<br />
The target’s formulation is lacking in several respects. For example, it does not specify whether a degree should<br />
be completed or whether students should return to their home countries.<br />
Scholarships should be counted as contributing to the target only if they are at least partly publicly funded,<br />
because it is not possible to hold non-government providers to account.<br />
There is no single source of information on scholarship numbers, let alone on recipients’ nationality or fields<br />
of study. Information collected for this report from 54 government scholarship programmes indicates that<br />
some 22,500 scholarships were offered in 2015, corresponding to 1% of the 2.5 million mobile students from<br />
developing countries.<br />
Aid data can give partial information on scholarship programmes. In 2014, US$2.8 billion in aid was allocated<br />
to scholarships <strong>and</strong> imputed student costs. But only US$386 million of that was directed to least developed<br />
countries <strong>and</strong> small isl<strong>and</strong> developing states.<br />
318<br />
CHAPTER 18 | TARGET 4.B – SCHOLARSHIPS
18<br />
CHAPTER 18<br />
Sustainable Development Goal 4.B<br />
$<br />
TARGET 4.B<br />
Scholarships<br />
By 2020, substantially exp<strong>and</strong> globally the number of scholarships available<br />
to developing countries, in particular least developed countries, small isl<strong>and</strong><br />
developing States <strong>and</strong> African countries, for enrolment in higher education,<br />
including vocational training <strong>and</strong> information <strong>and</strong> communications<br />
technology, technical, engineering <strong>and</strong> scientific programmes, in developed<br />
countries <strong>and</strong> other developing countries<br />
GLOBAL INDICATOR 4.B.1 – Volume of official development assistance flows for scholarships, by<br />
sector <strong>and</strong> type of study<br />
THEMATIC INDICATOR 35 – Number of higher education scholarships awarded, by beneficiary country<br />
2016 • GLOBAL EDUCATION MONITORING REPORT 319
18<br />
Number of scholarships....................................................................................................... 320<br />
Aid data on scholarships......................................................................................................324<br />
Scholarship programmes are a means of providing<br />
higher education opportunities for suitably prepared<br />
youth <strong>and</strong> adults from developing countries who would<br />
otherwise not be able to afford them. Target 4.b reflects<br />
one of the commitments of the Istanbul Programme of<br />
Action for the Least Developed Countries for the Decade<br />
2011–2020, which pledged to ‘[c]ontinue providing, <strong>and</strong><br />
encourage, as appropriate, higher education institutes<br />
to allocate, places <strong>and</strong> scholarships for students <strong>and</strong><br />
trainees from least developed countries, in particular in<br />
the fields of science, technology, business management<br />
<strong>and</strong> economics’ (United Nations, 2011).<br />
As the 2015 Education for All Global Monitoring Report<br />
noted, the formulation of target 4.b came as a surprise.<br />
Because it targets specific countries, it does not appear<br />
consistent with a universal agenda. While it nominally<br />
aspires to reduce inequality in access between countries,<br />
it could instead exacerbate it because beneficiaries tend<br />
to have advantaged backgrounds <strong>and</strong> easier access to<br />
information about scholarship programmes. In addition,<br />
there is some evidence that a considerable share of<br />
scholarship recipients do not return to their countries<br />
after ending their studies (Hein <strong>and</strong> Plesch, 2009). This<br />
would suggest that scholarships tend to support the<br />
higher education institutions of developed countries<br />
instead of benefiting developing countries. This chapter<br />
reviews available sources of information <strong>and</strong> finds several<br />
obstacles to achieving this target.<br />
NUMBER OF SCHOLARSHIPS<br />
CHALLENGES IN DEFINING SCHOLARSHIPS<br />
A close analysis of target 4.b raises many questions <strong>and</strong><br />
finds its formulation to be lacking in several respects. 1<br />
The target refers to scholarships being ‘available’ rather<br />
than ‘awarded’. An agency in a developed country may<br />
advertise a scholarship to everyone in the world but<br />
award it to a student from a developed country, or<br />
target a scholarship to c<strong>and</strong>idates from developing<br />
countries but not award it. Target 4.b should therefore<br />
be interpreted to mean that scholarships are available<br />
to students from<br />
developing countries,<br />
these scholarships are<br />
The target should<br />
awarded, <strong>and</strong> the offers<br />
be interpreted to<br />
are accepted.<br />
mean the number of<br />
The target states<br />
scholarships ‘awarded’,<br />
that scholarships<br />
rather than ‘available’<br />
must be ‘available to<br />
developing countries’.<br />
This wording suggests<br />
that they do not originate in developing countries<br />
<strong>and</strong> thus would exclude cases where developing countries<br />
fund scholarships out of their own resources for their<br />
citizens to study abroad. That in turn raises questions<br />
beyond the traditional concept of aid flows from one<br />
country to another. For example, should the government<br />
of Indonesia or Tajikistan or Zimbabwe exp<strong>and</strong> the<br />
number of scholarships for its citizens to study abroad or<br />
instead invest these resources in its own universities?<br />
Even if we limit attention to scholarships made<br />
‘available to developing countries’ from external<br />
sources, should all scholarship programmes based in<br />
developed countries be counted equally? Government<br />
<strong>and</strong> public higher education institutions are not the only<br />
providers; corporations, foundations, non-government<br />
organisations, philanthropists <strong>and</strong> other individuals also<br />
donate scholarship funds.<br />
For example in 2013, the MasterCard Foundation<br />
announced a US$500 million programme of scholarship<br />
support for students from sub-Saharan Africa. Other<br />
private corporations run their own scholarship<br />
programmes. The Tullow Group Scholarship Scheme<br />
320<br />
CHAPTER 18 | TARGET 4.B – SCHOLARSHIPS
18<br />
funds a programme managed by the British Council<br />
that makes scholarships available in selected sub-<br />
Saharan African <strong>and</strong> Latin American countries<br />
where Tullow Oil operates. The Graça Machel SASOL<br />
Scholarships are available to women from Mozambique.<br />
Yet, making non-state scholarship providers accountable<br />
for achievement of the target does not appear to make<br />
much sense. These are not public funds <strong>and</strong> there is no<br />
obligation to make, let alone to ‘substantially exp<strong>and</strong>’,<br />
such contributions.<br />
Note that even government scholarship programmes<br />
can have a mix of funding sources. For example, the two<br />
main UK government scholarship programmes that are<br />
open to students from developing countries are the<br />
Chevening Scholarships, funded through the Foreign<br />
<strong>and</strong> Commonwealth Office, <strong>and</strong> the Commonwealth<br />
Scholarships, funded mostly through the Department<br />
for International Development. Both actively solicit<br />
co-funding from private <strong>and</strong> philanthropic interests.<br />
The target also states that scholarships must be<br />
tenable ‘in developed countries <strong>and</strong> other developing<br />
countries’. ‘Other’ is the keyword here. The target refers<br />
to scholarships for students who cross a border to study<br />
at a higher education institution in a country other than<br />
their own. Just as the target does not mean scholars who<br />
are supported by their own government to study abroad,<br />
it would also exclude programmes that sponsor nationals<br />
of developing countries to study in their own country,<br />
such as USAID scholarships in Pakistan. Thus the<br />
Fulbright programme, which offers scholarships for postgraduate<br />
study in the United States, would qualify under<br />
this target, while a larger programme that in 2015 offered<br />
3,000 university scholarships for study in Pakistan, half<br />
to women, would not.<br />
Even if non-government scholarship programmes funded<br />
by developed countries were to be counted for this<br />
target, issues would remain unresolved. The MasterCard<br />
Foundation scholarships are applicable at a range of<br />
schools <strong>and</strong> universities, in developed <strong>and</strong> developing<br />
countries, including a recipient’s home country. Under<br />
this programme, a Ghanaian student could study in<br />
Ghana, Nigeria or the United States. In the second <strong>and</strong><br />
third cases, these scholarships would qualify under<br />
target 4.b, because the recipients are studying ‘in<br />
developed countries’ (United States) or ‘other developing<br />
countries’ (Nigeria). But the student studying in Ghana<br />
would not qualify.<br />
It is also unclear whether the target includes<br />
scholarships for study by distance learning, which is<br />
increasingly popular. ‘Split site’ arrangements allow<br />
developing country students to be registered at a home<br />
university but have their research supervised by staff at<br />
a university in a developed country. How would these<br />
scholarships be considered?<br />
Scholarships must<br />
The target does not<br />
be ‘for enrolment in<br />
higher education’.<br />
refer to the completion<br />
However, enrolment<br />
of a degree, or whether is not equivalent to<br />
students return to their<br />
graduation. Although<br />
many scholarship<br />
home countries<br />
programmes track<br />
success rates as far<br />
as graduation, few<br />
go beyond that. The number of scholarships awarded<br />
does not indicate the completion of a degree, or whether<br />
students return to their home countries.<br />
A related question is whether a scholarship should have<br />
particular characteristics in terms of duration <strong>and</strong> size.<br />
For comparability purposes, scholarships would also<br />
have to be specified in terms of year-equivalents to<br />
ensure that short-term placements are not counted as<br />
equal to longer ones, <strong>and</strong> to prevent incentives against<br />
scholarships for longer programmes. In addition, the<br />
amount awarded may cover full or partial tuition as well<br />
as living expenses. It is not clear how such options would<br />
count in terms of their contribution towards the target.<br />
Finally, methods of support besides scholarships do<br />
not count toward the target, even though they may<br />
serve the same objective. For example, the Partnership<br />
for Higher Education in Africa, a consortium of funding<br />
bodies from the United States, dedicated US$440 million<br />
towards higher education initiatives in nine African<br />
countries between 2000 <strong>and</strong> 2010 (PHEA, 2010). While<br />
it did not provide scholarships directly to individuals, it<br />
did include grants, usually to universities, through which<br />
scholarships were awarded. But as a subsidiary part of<br />
the programme, these scholarships may not have been<br />
reported as such, <strong>and</strong> would have been difficult to track.<br />
Therefore, it is recommended that scholarships be<br />
counted as eligible under target 4.b to the extent<br />
that they are taken up by (not just made available<br />
to) students from developing countries (available<br />
to ‘students’, not just ‘countries’). The scholarships<br />
2016 • GLOBAL EDUCATION MONITORING REPORT 321
18<br />
should refer to study at higher education institutions<br />
in countries other than the students’ home country,<br />
including those by distance learning. They should<br />
require no further contribution from the student<br />
to meet study, travel <strong>and</strong> living costs. Finally, they<br />
should be, at least partly, publicly funded <strong>and</strong> accounted<br />
for as a scholarship in the public accounts of the<br />
donor countries (including scholarships co-funded by<br />
private interests).<br />
This will exclude many scholarships, especially from<br />
private <strong>and</strong> philanthropic sources, since they are under<br />
no obligation to sponsor scholarships in the first place.<br />
It is still necessary to monitor these scholarships since<br />
their availability can influence the policies <strong>and</strong> actions<br />
of donor countries, which might spend less on<br />
scholarships in response.<br />
It is further recommended that a set of indicators<br />
include the number of scholarships awarded; the<br />
number of scholarship years awarded; the number of<br />
scholarship recipients who complete their studies; <strong>and</strong><br />
the number of scholarship recipients who return to<br />
their country. All indicators would be disaggregated by<br />
country origin of beneficiary, sex, field of study, level<br />
of study, mode of study (e.g. on site vs distance) <strong>and</strong><br />
country of study.<br />
identified in the target, there were 235,000 students<br />
from least developed countries, 271,000 from sub-<br />
Saharan Africa <strong>and</strong> 106,000 from small isl<strong>and</strong> developing<br />
states. Among the 90 countries belonging to these three<br />
groups (some belong to two or even all three of them),<br />
there were 451,000 mobile students.<br />
The outbound mobility ratio, i.e. the number of<br />
students from a country studying abroad, expressed<br />
as a percentage of total tertiary enrolment in that<br />
country, was 1.8% for developing countries. However,<br />
in some countries, notably among small isl<strong>and</strong><br />
developing states, the ratio is considerably higher. For<br />
example, in Saint Lucia, there are 5 nationals studying<br />
abroad for every 10 students in the country. In<br />
Seychelles, there are twice as many tertiary students<br />
abroad than at home (Figure 18.1).<br />
Establishing a baseline against which to measure<br />
progress towards target 4.b is challenging due to<br />
the limited data on recipients’ characteristics. Many<br />
programmes are reluctant to share detailed information.<br />
Funders might consider recipient data confidential<br />
<strong>and</strong> proprietary, just as how some higher education<br />
institutions do not disclose how admission decisions are<br />
made. Also, disclosing recipient data might reveal that<br />
some programmes are not meeting their declared targets<br />
DATA CHALLENGES AND NEXT STEPS<br />
Even this more precise definition of scholarships<br />
presents a major challenge because providers<br />
have not designed monitoring <strong>and</strong> reporting<br />
systems to respond to such a global target. Hardly<br />
any studies have tried to assess scholarship trends.<br />
The few that have tried to look at scholarships across<br />
countries have stumbled; there are insufficient measures<br />
to evaluate policies <strong>and</strong> programmes (CSC, 2014). The<br />
absence of common or shared st<strong>and</strong>ards for publicly<br />
reporting scholarship programme data limits the chances<br />
of obtaining consistent <strong>and</strong> reliable data on levels of<br />
government funding <strong>and</strong> on numbers of applicants <strong>and</strong><br />
recipients (Perna et al., 2014).<br />
What is known is the size of the total target population<br />
for scholarship programmes, which is the number of<br />
internationally mobile students in higher education. In<br />
2013, out of a global population of 199 million students<br />
in post-secondary institutions, 3.5 million were studying<br />
outside their country, of which 2.5 million were from<br />
developing countries. With respect to the country groups<br />
FIGURE 18.1:<br />
Many students from small isl<strong>and</strong> developing states are<br />
studying abroad<br />
Outbound mobility ratio, selected countries, 2013 or most recent year<br />
Outbound mobility ratio (%)<br />
100<br />
80<br />
60<br />
40<br />
20<br />
0<br />
Cuba<br />
Jamaica<br />
Singapore<br />
Belize<br />
Barbados<br />
Mauritius<br />
Guyana<br />
Marshall Is<br />
Timor-Leste<br />
Antigua/Barbuda<br />
Cabo Verde<br />
S. Tome/Principe<br />
Cook Is<br />
Saint Lucia<br />
Comoros<br />
Seychelles<br />
Source: UIS database.<br />
Small isl<strong>and</strong> developing states<br />
In Seychelles, the outbound mobility<br />
ratio is 198%, i.e. there are twice as many<br />
nationals studyng abroad as at home<br />
322<br />
CHAPTER 18 | TARGET 4.B – SCHOLARSHIPS
18<br />
Around 22,500 scholarships were offered in 2015,<br />
corresponding to 1% of the number of internationally<br />
mobile students from developing countries<br />
“<br />
”<br />
for some populations. Many large programmes do not<br />
assign quotas by country so this information is not even<br />
monitored. The absence of data is not limited to the<br />
nationality of scholarship recipients but extends to all<br />
other characteristics of interest listed in the target, such<br />
as destination countries <strong>and</strong> fields of study (‘information<br />
<strong>and</strong> communications technology, technical, engineering<br />
<strong>and</strong> scientific programmes’).<br />
Information collected for this report from 54 government<br />
scholarship programmes, of which 9 were based in<br />
developing countries, indicates that some 22,500<br />
scholarships were offered in 2014/15, corresponding to<br />
1% of the number of mobile students from developing<br />
countries (IIE, 2016a). While this is likely to be an<br />
underestimate, it is the best baseline available.<br />
Scholarship programmes need to more openly<br />
share information that can lead to better<br />
underst<strong>and</strong>ing of how they contribute to the<br />
target 4.b. Programmes should be encouraged to collect<br />
<strong>and</strong> report disaggregated data on intended recipients,<br />
actual recipients <strong>and</strong> their country of origin. To<br />
move forward, three options can be considered.<br />
First, governments of developing countries could<br />
monitor <strong>and</strong> report the number of their tertiary-level<br />
students receiving scholarships from domestic or<br />
external sources. This approach would miss individuals<br />
not enrolled in their home country who receive<br />
scholarships to pursue full degrees overseas.<br />
Sub-Saharan Africa<br />
Least developed coutries<br />
Outbound mobility ratio (%)<br />
100<br />
80<br />
60<br />
40<br />
20<br />
0<br />
Ethiopia<br />
Mozambique<br />
Ghana<br />
Angola<br />
Côte d’Ivoire<br />
Togo<br />
Mali<br />
Eritrea<br />
Cameroon<br />
Niger<br />
Lesotho<br />
Senegal<br />
Chad<br />
Zimbabwe<br />
Congo<br />
Swazil<strong>and</strong><br />
Outbound mobility ratio (%)<br />
100<br />
80<br />
60<br />
40<br />
20<br />
0<br />
Myanmar<br />
Bangladesh<br />
D. R. Congo<br />
Cambodia<br />
Lao PDR<br />
Burundi<br />
Burkina Faso<br />
Yemen<br />
Nepal<br />
C. A. R.<br />
Afghanistan<br />
Timor-Leste<br />
Malawi<br />
Mauritania<br />
Djibouti<br />
Bhutan<br />
2016 • GLOBAL EDUCATION MONITORING REPORT 323
18<br />
Second, higher education institutions could be engaged<br />
by their supervising authority to gather <strong>and</strong> report data<br />
on foreign students as to whether they use scholarship<br />
funds. For example, in the United States, the Department<br />
of Education Integrated Postsecondary Education Data<br />
System could require all accredited institutions to report<br />
the number of students from other countries pursuing<br />
studies on scholarship.<br />
Third, an independent, non-government entity could<br />
be appointed to incorporate scholarship information<br />
into existing student mobility data collection efforts,<br />
especially since many scholarship recipients are<br />
already captured in such data. For example, the<br />
Institute of International Education operates Project<br />
Atlas, bringing together 25 national-level mobility data<br />
collection agencies from around the world that annually<br />
share data on the number of foreign students they<br />
receive <strong>and</strong> the number of their domestic students that<br />
study overseas. Project Atlas includes all major host<br />
countries of globally mobile students, including Australia,<br />
Canada, China, France, Germany, the United Kingdom<br />
<strong>and</strong> the United States (IIE, 2016b).<br />
FIGURE 18.2:<br />
Half of all aid for scholarships <strong>and</strong> imputed student costs is concentrated<br />
in 13 middle income countries<br />
Distribution of scholarships <strong>and</strong> imputed student costs by recipient country, 2014<br />
US$996 million<br />
51<br />
60<br />
71<br />
71<br />
74<br />
Least developed<br />
countries <strong>and</strong> small<br />
isl<strong>and</strong> developing<br />
states, 386<br />
Source: GEM Report team analysis (2016) using OECD DAC data.<br />
80<br />
81<br />
85<br />
91<br />
112<br />
113<br />
370<br />
162<br />
China<br />
Morocco<br />
India<br />
Algeria<br />
Turkey<br />
Tunisia<br />
Cameroon<br />
Viet Nam<br />
Ukraine<br />
Iran, Isl. Rep.<br />
Brazil<br />
Indonesia<br />
Syrian A. R.<br />
Other<br />
AID DATA ON SCHOLARSHIPS<br />
An alternative way to get information on scholarship<br />
programmes is through examining aid to education.<br />
Much debate has occurred as to whether scholarships<br />
should be counted as official development assistance.<br />
The definition of the Organisation for Economic<br />
Co-operation <strong>and</strong> Development (OECD) of ‘core’ aid,<br />
otherwise referred to as country programmable aid,<br />
excludes scholarships.<br />
Data from the OECD Development Assistance<br />
Committee (DAC) provide some evidence on aid<br />
from OECD DAC member states that is directed at<br />
scholarships <strong>and</strong> imputed student costs. The latter<br />
are the costs incurred for students from developing<br />
countries studying at higher education institutions of<br />
host countries. However, OECD DAC member states vary<br />
a lot in how they report this expenditure.<br />
For France <strong>and</strong> Germany, scholarships <strong>and</strong> imputed<br />
student costs (i.e. indirect costs of tuition in donor<br />
countries) account for more than half of their total direct<br />
aid to education. These two donors provide more aid as<br />
scholarships <strong>and</strong> imputed student costs than all donors<br />
together do for basic education in low income countries.<br />
By contrast, the United Kingdom <strong>and</strong> the United States<br />
are major providers of scholarships but only a very small<br />
proportion of these are registered as aid. An aid-based<br />
measure of scholarships does not therefore provide a<br />
comprehensive picture of expenditure on scholarships<br />
<strong>and</strong> is not appropriate as a global indicator.<br />
Nevertheless, this indicator is still informative. In 2014,<br />
an average of US$2.8 billion of aid was allocated to<br />
scholarships <strong>and</strong> imputed student costs. Most of this<br />
funding goes to middle income countries (81%). China is<br />
the single largest recipient (13%) <strong>and</strong> its share is almost<br />
equal to that received by all least developed countries <strong>and</strong><br />
small isl<strong>and</strong> developing states together. Scholarships <strong>and</strong><br />
imputed student costs for Algeria, China, India, Morocco,<br />
Tunisia <strong>and</strong> Turkey in 2014 came almost to the equivalent<br />
of the total amount of direct aid to basic education in<br />
low income countries that year (Figure 18.2). At the<br />
same time, China provides thous<strong>and</strong>s of scholarships<br />
every year, notably through the Forum on China-Africa<br />
Cooperation (Reilly, 2015).<br />
324<br />
CHAPTER 18 | TARGET 4.B – SCHOLARSHIPS
18<br />
About 70% of aid to higher education in 2013/14 was<br />
disbursed for scholarships <strong>and</strong> imputed student costs<br />
rather than strengthening higher education institutions<br />
in developing countries. The share varied from 57% in<br />
low income countries to 83% in upper middle income<br />
countries (Figure 18.3).<br />
FIGURE 18.3:<br />
Most aid to higher education is directed to scholarships <strong>and</strong> imputed<br />
student costs<br />
Distribution of aid to post-secondary education, by type of use <strong>and</strong> country<br />
income group, 2013/14<br />
100<br />
%<br />
80<br />
60<br />
39<br />
18<br />
55<br />
69<br />
Imputed student costs<br />
40<br />
19<br />
20<br />
0<br />
43<br />
Low income<br />
countries<br />
27<br />
Lower middle<br />
income countries<br />
14<br />
17<br />
Upper middle<br />
income countries<br />
Scholarship<br />
Higher education<br />
Source: GEM Report team analysis (2016) using OECD DAC data.<br />
ENDNOTES<br />
1. This section draws on Balfour (2016).<br />
2016 • GLOBAL EDUCATION MONITORING REPORT 325
19<br />
Ednam Boyle,<br />
a teacher, teaches<br />
a class with her baby<br />
on her back in the<br />
Temple of Faith Primary<br />
School, Western Area of<br />
Freetown, Sierra Leone.<br />
CREDIT: Kate Holt/GEM Report<br />
KEY MESSAGES<br />
There are two major challenges in defining a teacher shortage. First, showing how many teachers are available<br />
in a country does not show how many there are per school. Second, the quantity of teachers cannot be isolated<br />
from quality.<br />
Data are scarce on the number of qualified teachers classified by academic qualification. In 2014, on average,<br />
82% of teachers had the minimum qualifications required to teach in pre-primary education, 93% in primary<br />
education <strong>and</strong> 91% in secondary education.<br />
Comparing how many teachers are trained in each country is difficult because national st<strong>and</strong>ards are not comparable.<br />
Many teachers have not received minimum training. In the Caribbean, 85% of primary school teachers are<br />
trained. In Northern Africa <strong>and</strong> Western Asia, 73% of pre-primary school teachers are trained. In sub-Saharan<br />
Africa, less than half of pre-primary <strong>and</strong> less than three quarters of secondary school teachers are trained.<br />
Aid to teacher training tripled between 2002 <strong>and</strong> 2014 to reach US$251 million. Least developed countries<br />
received 41% of the total.<br />
The target is very narrowly defined. It is also necessary to monitor whether teachers are motivated <strong>and</strong><br />
supported. This includes monitoring induction <strong>and</strong> mentoring programmes, on-the-job training, working<br />
conditions <strong>and</strong> contracts, pay <strong>and</strong> teacher attrition.<br />
326<br />
CHAPTER 19 | TARGET 4.C – TEACHERS
19<br />
CHAPTER 19<br />
Sustainable Development Goal 4.C<br />
TARGET 4.C<br />
Teachers<br />
By 2030, substantially increase the supply of qualified teachers, including<br />
through international cooperation for teacher training in developing countries,<br />
especially least developed countries <strong>and</strong> small isl<strong>and</strong> developing States<br />
GLOBAL INDICATOR 4.C.1 – Proportion of teachers in: (a) pre-primary; (b) primary; (c) lower<br />
secondary; <strong>and</strong> (d) upper secondary education who have received at least the minimum organized<br />
teacher training (e.g. pedagogical) pre-service or in-service required for teaching at the relevant level in<br />
a given country<br />
THEMATIC INDICATOR 37 – Percentage of teachers qualified according to national st<strong>and</strong>ards,<br />
by education level <strong>and</strong> type of institution<br />
THEMATIC INDICATOR 38 – Pupil/qualified teacher ratio, by education level<br />
THEMATIC INDICATOR 40 – Pupil/trained teacher ratio, by education level<br />
THEMATIC INDICATOR 41 – Average teacher salary relative to other professions requiring a<br />
comparable level of education qualification<br />
THEMATIC INDICATOR 42 – Teacher attrition rate, by education level<br />
THEMATIC INDICATOR 43 – Percentage of teachers who received in-service training in the last<br />
12 months, by type of training<br />
2016 • GLOBAL EDUCATION MONITORING REPORT 327
19<br />
Adequate supply of qualified teachers..........................................................................328<br />
Teacher motivation <strong>and</strong> support......................................................................................333<br />
The formulation of a target on teachers has been both<br />
applauded <strong>and</strong> criticized. The international community<br />
recognizes the importance of a distinct target relating to<br />
the teaching profession, which had been missing from<br />
the Education for All <strong>and</strong> Millennium Development Goals<br />
agendas. However, there has been dissatisfaction that<br />
in the Sustainable Development Goals (SDGs), teachers<br />
are considered a means of implementation, which<br />
risks underestimating the profession’s fundamental<br />
contribution to the provision of good quality education<br />
<strong>and</strong> an enabling learning environment. The actual<br />
formulation of the target is also weak, referring only to<br />
the ‘supply of qualified teachers’ <strong>and</strong> including a limited<br />
conception of how to enhance teachers’ qualifications.<br />
This chapter will go beyond these relatively narrow<br />
confines to address the monitoring implications<br />
of the more general commitment, expressed in the<br />
Education 2030 Framework for Action, to ‘ensure that<br />
teachers <strong>and</strong> educators are empowered, adequately<br />
recruited, well-trained, professionally qualified,<br />
motivated <strong>and</strong> supported’.<br />
ADEQUATE SUPPLY OF<br />
QUALIFIED TEACHERS<br />
Overcrowded classrooms are still common in many<br />
of the poorest countries, pointing to an inadequate<br />
supply of teachers. The ‘teacher gap’ is the number of<br />
teachers at each education level needing to be recruited<br />
to achieve universal enrolment while ensuring that the<br />
average pupil/teacher ratio does not exceed a set target<br />
level. In richer countries, teacher shortages are reflected<br />
in hard-to-fill vacancies in specialized subjects, resulting<br />
in teachers teaching subjects for which they are not<br />
qualified (Santiago, 2002).<br />
There are two major challenges in defining a teacher<br />
shortage. First, statistics on average teacher availability<br />
hide substantial inequality within countries. Second, the<br />
quantity of teachers cannot be isolated from quality.<br />
Policy-makers have often responded to the challenge<br />
of exp<strong>and</strong>ing enrolment <strong>and</strong> increasing class size by<br />
lowering hiring st<strong>and</strong>ards.<br />
TEACHER AVAILABILITY AND DEPLOYMENT<br />
The traditional indicator of teacher availability is<br />
the pupil/teacher ratio. Globally, there are 17 pupils<br />
per teacher in pre-primary education, 24 in primary<br />
education, <strong>and</strong><br />
18 in lower <strong>and</strong><br />
upper secondary<br />
Globally, there are 17 education.<br />
pupils per teacher in pre-<br />
Yet, there is no global<br />
primary education, 24 in<br />
consensus on the<br />
primary education, <strong>and</strong> recommended pupil/<br />
18 in lower <strong>and</strong> upper teacher ratio by<br />
level of education.<br />
secondary education<br />
Moreover, while a<br />
higher pupil/teacher<br />
ratio is linked with a<br />
larger average class size, the relationship is not one-toone<br />
<strong>and</strong> varies considerably between countries. Class<br />
size depends on how teachers are allocated to classes.<br />
This, in turn, is linked to factors such as the proportion<br />
of time teachers spend teaching <strong>and</strong> the relationship<br />
between the length of the teacher working day <strong>and</strong><br />
student instruction time.<br />
In a group of about 30 mostly high income countries, a<br />
pupil/teacher ratio of 10 was linked with an average class<br />
size of 20 in primary <strong>and</strong> lower secondary education.<br />
For a pupil/teacher ratio of 17 in primary education, the<br />
average class size was 18 in Slovakia but 27 in Japan in<br />
2013. Likewise, for an average class size of 27 in lower<br />
secondary education, the pupil/teacher ratio was 15 in<br />
the United States but 32 in Mexico (Figure 19.1).<br />
328<br />
CHAPTER 19 | TARGET 4.C – TEACHERS
19<br />
FIGURE 19.1:<br />
The pupil/teacher ratio is not the same as the number of students in a classroom<br />
Pupil/teacher ratio <strong>and</strong> average class size, selected middle <strong>and</strong> high income countries, 2013<br />
a. Primary education<br />
b. Lower secondary education<br />
40<br />
40<br />
Rep. of Korea<br />
Class size, primary education<br />
30<br />
20<br />
10<br />
Greece<br />
Hungary<br />
Japan<br />
Slovakia<br />
Indonesia<br />
Colombia<br />
Class size, lower secondary education<br />
30<br />
20<br />
10<br />
United States<br />
Estonia<br />
Italy<br />
United Kingdom<br />
Mexico<br />
0<br />
0<br />
0 5 10 15 20 25 30 35<br />
Pupil/teacher ratio<br />
0 5 10 15 20 25 30 35<br />
Pupil/teacher ratio<br />
Source: OECD (2015b).<br />
In richer countries, there is no solid evidence that<br />
a smaller class size has a positive effect on learning<br />
outcomes, or, where such an effect has been established,<br />
that it is sizeable (Hanushek, 2006). In poorer countries,<br />
evidence from the SACMEQ learning achievement<br />
survey in southern <strong>and</strong> eastern Africa suggested<br />
negative effects once a class size exceeded 60 (Fehrler<br />
et al., 2009).<br />
But recent examples have raised doubt about the direct<br />
effect on learning of lowering class size from even<br />
these high levels unless accompanied by interventions<br />
to improve teacher quality. For example, data from<br />
the Uwezo citizen-led assessment survey in Ug<strong>and</strong>a in<br />
2010–2013 showed that average class size in government<br />
primary schools was 68 but even halving it would have<br />
a negligible effect on learning (Jones, 2016). Similarly, in<br />
a r<strong>and</strong>omized control trial among 210 primary schools<br />
in the former Western Province of Kenya, the effect of<br />
nearly halving the first grade class size from 82 to 44 had<br />
no effect on learning (Duflo et al., 2015).<br />
The pupil/teacher ratio indicator has further weaknesses,<br />
as it does not reflect real availability of teachers in<br />
classrooms. While the UNESCO Institute for Statistics<br />
(UIS) tries to collect data on teachers working full time,<br />
many countries still report on total teacher headcount<br />
regardless of working hours (UIS, 2006).<br />
Nor does the pupil/teacher ratio account for teacher<br />
absenteeism. Views vary as to whether teachers are at<br />
fault for not turning up at work or whether governments<br />
poorly manage teacher time, for example by requiring<br />
them to travel to be paid or to fulfil non-school duties.<br />
Regardless, absenteeism remains high in some countries.<br />
In Indonesia, the percentage of primary school teachers<br />
not in classrooms during two unannounced visits fell<br />
from 19% in 2003 but was still 10% in 2013 (ACDP, 2014).<br />
The problem of absenteeism is multilayered. A survey of<br />
100 primary schools in 17 disadvantaged districts in the<br />
United Republic of Tanzania found that 12% of teachers<br />
were absent from school on the day of an unannounced<br />
visit in 2014. Of the teachers present, 63% had arrived<br />
late, <strong>and</strong> 67% of the teachers present at school <strong>and</strong><br />
scheduled to teach were not in the classroom (Pettersson<br />
<strong>and</strong> Rawle, 2015). Service Delivery Indicator surveys of<br />
primary schools in seven countries of sub-Saharan Africa in<br />
2011–2014 estimated that, out of average scheduled daily<br />
teaching time of 5 hours <strong>and</strong> 31 minutes, teachers spent<br />
2 hours <strong>and</strong> 53 minutes teaching, or 52% (Filmer, 2016).<br />
Teachers may be deployed unequally among schools.<br />
In Ug<strong>and</strong>a, where there were as many as 57 pupils per<br />
teacher on average in primary schools in 2010, 20 out of<br />
112 districts had more than 70 pupils per teacher. While<br />
only 13% of schools had a teacher deficit in the district<br />
of the capital, Kampala, 100% of schools had a deficit<br />
2016 • GLOBAL EDUCATION MONITORING REPORT 329
19<br />
“<br />
In 2014, on average, 82% of teachers were qualified in pre-primary<br />
education, 93% in primary education, <strong>and</strong> 91% in secondary education<br />
”<br />
in the northern district of Kotido (Ug<strong>and</strong>a Ministry of<br />
Education <strong>and</strong> Sport <strong>and</strong> IIEP Pôle de Dakar, 2014).<br />
In rural China, a shift of deployment authority from<br />
townships to counties was found to increase inequality<br />
in teacher allocation to favour communities close to the<br />
county seat (Han, 2013).<br />
Finally, the pupil/teacher ratio provides a static view<br />
of a past situation without reflecting national efforts<br />
to address teacher shortages. Evidence from the UIS<br />
regional module in sub-Saharan Africa shows that<br />
recruitment of new primary school teachers, relative<br />
to teacher stocks, was higher on average in countries<br />
with higher pupil/teacher ratios, as would be expected<br />
of lagging countries trying to catch up. But among<br />
them there were wide variations. For example, Niger<br />
had a pupil/teacher ratio of 39 in 2012 but recruited new<br />
teachers in 2010–2013 at a rate three times faster than<br />
Madagascar, which had a pupil/teacher ratio of 43.<br />
DEFINING QUALIFIED TEACHERS<br />
In addition to these weaknesses, the simple pupil/<br />
teacher ratio assumes that all those teaching are fully<br />
qualified <strong>and</strong> prepared to teach. This is why the target<br />
refers to the supply of ‘qualified’ teachers, to ensure<br />
that quality is not compromised. However, the definition<br />
of ‘qualified’ is ambiguous. It is understood in terms of<br />
both academic qualifications (the level of education a<br />
teacher has completed, regardless of domain of study)<br />
<strong>and</strong> training qualifications (successful completion of a<br />
training course that represents the minimum condition<br />
to enter teaching). A teacher may possess one but not<br />
the other. The proposed global indicator focuses on<br />
training rather than academic qualifications.<br />
Academic qualifications<br />
The percentage of teachers with the minimum academic<br />
qualifications required to teach at each level of education<br />
is the indicator that captures the intention of target 4.c,<br />
although it was not proposed as the global indicator.<br />
Overall, the median share of qualified teachers was 82%<br />
in pre-primary education (based on 59 countries), 93% in<br />
primary education (84 countries), <strong>and</strong> 91% in secondary<br />
education (60 countries) in 2014.<br />
Interpreting these statistics is not possible without<br />
information on the minimum required academic<br />
qualification in each country. For example, only 47%<br />
of primary school teachers are qualified in Palestine,<br />
where the minimum level of qualification is a short-cycle<br />
tertiary education degree. By contrast, 88% of primary<br />
school teachers are qualified in Côte d’Ivoire, but the<br />
minimum level of qualification is an upper secondary<br />
education certificate.<br />
The new UIS global module on teachers collects<br />
information on the minimum academic qualifications<br />
required to teach at each level of education; thus far the<br />
information is available for 37 countries. It shows, for<br />
example, that to teach in pre-primary education, a primary<br />
school diploma is required in Mauritania but a bachelor’s<br />
or equivalent degree in Algeria. To teach primary school,<br />
an upper secondary diploma is enough in China but a<br />
bachelor’s or equivalent degree is needed in Indonesia.<br />
Such information clearly is needed for all countries.<br />
Training qualifications<br />
According to the UIS, a trained teacher has ‘at least<br />
the minimum organized teacher training requirements<br />
(pre-service or in-service) to teach a specific level of<br />
education according to the relevant national policy<br />
or law’. The requirements usually include pedagogical<br />
knowledge (approaches, methods <strong>and</strong> techniques of<br />
teaching) <strong>and</strong> professional knowledge (instruments <strong>and</strong><br />
legal frameworks governing the teaching profession).<br />
Some programmes may also cover content knowledge<br />
(curriculum, subject matter <strong>and</strong> use of relevant materials).<br />
The entry requirements for such training differ by<br />
country, however, <strong>and</strong> no information is available on<br />
the level of training required. In that sense, the global<br />
indicator for target 4.c – the percentage of teachers with<br />
minimum training – is even weaker than the percentage<br />
of teachers with minimum academic qualifications, as<br />
there is no benchmark with which to compare the data.<br />
330<br />
CHAPTER 19 | TARGET 4.C – TEACHERS
19<br />
The coverage of both indicators remains low. In 2014, the<br />
percentage of countries with data for the global indicator<br />
of trained teachers varied from 22% in upper secondary<br />
education to 46% in primary. Coverage has increased<br />
little over time: it was 34% for primary education in 1999.<br />
For the qualified teacher indicator, coverage is about<br />
seven percentage points lower than for the trained<br />
teacher indicator.<br />
FIGURE 19.2:<br />
More than half of pre-primary <strong>and</strong> one-quarter of secondary school<br />
teachers in sub-Saharan Africa are not trained<br />
Percentage of trained teachers, by education level <strong>and</strong> region, 2014<br />
100<br />
90<br />
80<br />
There are several reasons for data gaps. In some cases,<br />
data simply do not exist – for example, countries with<br />
a large private education sector often cannot report<br />
accurately on personnel in the sector. More commonly,<br />
data exist but require coordination of several databases.<br />
New UIS initiatives to collect global teacher data, as well<br />
as subnational teacher data in Asia, will help countries<br />
better integrate education information systems.<br />
Trained teachers (%)<br />
70<br />
60<br />
50<br />
40<br />
30<br />
20<br />
10<br />
Despite the limitations, there is clear evidence that a<br />
large share of teachers appears not to have received the<br />
minimum training. For example, in the Caribbean only<br />
85% of primary school teachers are trained. In Northern<br />
Africa <strong>and</strong> Western Asia, only 73% of pre-primary school<br />
teachers are trained. In sub-Saharan Africa, fewer than<br />
half of pre-primary <strong>and</strong> three quarters of secondary<br />
school teachers are trained (Figure 19.2).<br />
If countries are ranked in terms of the percentage of<br />
trained teachers, from lowest to highest, fewer countries<br />
are seen to have a very low percentage of untrained<br />
teachers in primary than in pre-primary education. For<br />
example, in the bottom quarter of countries, at least one in<br />
four primary teachers are not trained. This compares with<br />
one in two at the pre-primary level. In the bottom half of<br />
countries, at least one in four pre-primary teachers are<br />
not trained (Figure 19.3).<br />
Higher country coverage would not be enough to<br />
indicate all the trained teacher gaps. For example, the<br />
percentage of trained staff may be lowest in pre-primary<br />
education but the situation is likely to be worse for early<br />
childhood care <strong>and</strong> education as a whole, as teachers<br />
tend to have higher initial education requirements<br />
than carers. Thus, carers may remain without sufficient<br />
education or training. However, there are exceptions.<br />
For example, in some high income countries, such as<br />
Japan <strong>and</strong> Portugal, both types of staff must have initial<br />
education at the tertiary level. Some countries, including<br />
the Czech Republic, Israel <strong>and</strong> Italy, provide integrated<br />
initial education to care workers <strong>and</strong> pre-primary<br />
teachers (OECD, 2012a).<br />
0<br />
Caucasus <strong>and</strong><br />
Central Asia<br />
Source: UIS database.<br />
South-eastern<br />
Asia<br />
Pre-primary<br />
Northern Africa<br />
<strong>and</strong> Western Asia<br />
Primary<br />
Caribbean<br />
Secondary<br />
In secondary education, in addition to training<br />
qualifications, many countries face teacher gaps in<br />
particular specializations. In Germany in 2009, 28% of<br />
secondary school principals said they faced a shortage<br />
of mathematics teachers <strong>and</strong> 42% a shortage of science<br />
Sub-Saharan<br />
Africa<br />
FIGURE 19.3:<br />
In half of countries, more than one in four pre-primary teachers are<br />
not trained<br />
Cumulative distribution of percentage of trained teachers, by level of education,<br />
2014 or latest available year<br />
Trained teachers (%)<br />
100<br />
90<br />
80<br />
70<br />
60<br />
50<br />
40<br />
30<br />
20<br />
10<br />
0<br />
0<br />
Pre-primary<br />
Primary<br />
Lower secondary<br />
Upper secondary<br />
25 50 75 100<br />
Cumulative distribution of countries (%)<br />
Note: Distributions were calculated over 76 countries in pre-primary education, 96 in<br />
primary, 56 in lower secondary <strong>and</strong> 50 in upper secondary.<br />
Source: UIS database.<br />
2016 • GLOBAL EDUCATION MONITORING REPORT 331
19<br />
BOX 19.1<br />
teachers (European Commission/EACEA/Eurydice, 2012b).<br />
Almost half of all principals in countries that participated<br />
in the 2013 Teaching <strong>and</strong> Learning International Survey<br />
(TALIS) reported a shortage of teachers with competence<br />
in teaching students with special needs (OECD, 2014c).<br />
These measures do not capture inequality in distribution<br />
of trained teachers. Evidence on this issue is scarce<br />
despite the importance of monitoring whether betterprepared<br />
teachers are allocated to the schools that<br />
need them most. For example, in Abu Dhabi, United<br />
Arab Emirates, teachers with more than five years<br />
Monitoring the preparedness <strong>and</strong> development of school leaders<br />
Committed school leaders can transform schools. In richer countries, it has been<br />
estimated that school leadership accounts for one-quarter of the difference in student<br />
outcomes explained by school-related variables. This makes school leadership second<br />
only to teachers as an influence on learning.<br />
However, cross-country information on school leader qualifications is fragmented. In<br />
Europe, headship training is required in 21 countries or regions; the duration varies from<br />
one week in Romania to a master’s programme in Malta. Specific training programmes<br />
also exist in countries where it is not an official requirement for appointment.<br />
In countries that participated in the 2013 TALIS, 92% of lower secondary principals had tertiary<br />
education qualifications but many lacked preparation for specific tasks. For example, only<br />
14% of principals in Denmark had participated in school administration or principal training<br />
programmes prior to their appointment, <strong>and</strong> 45% had still not done so by the time of the<br />
survey. The latter share was as high as 51% in Serbia <strong>and</strong> 58% in Croatia. In addition, 41% of<br />
principals in Spain <strong>and</strong> 57% in Pol<strong>and</strong> had never received training in instructional leadership.<br />
In Chile, the government introduced the Good School Leadership Framework, a<br />
competitive process for selecting principals, <strong>and</strong> in 2011 the Programme for the Training of<br />
Excellent Principals, which in its first two years trained more than one-third of principals<br />
in leadership skills through graduate degrees.<br />
To address its absence of a professional qualification, South Africa introduced an<br />
Advanced Certificate in Education: School Leadership. Following positive evaluation, the<br />
government made the programme a requirement for new principals within three years<br />
of their appointment. Jamaica recently established the National Centre for Educational<br />
Leadership to train <strong>and</strong> certify aspiring <strong>and</strong> existing principals.<br />
In poorer countries, it is rare for school heads or principals to have preparation or inservice<br />
training; they get little support from local education authorities. Among 12 mostly<br />
low income sub-Saharan African <strong>and</strong> South Asian countries, only Bangladesh made an<br />
effort to train all school leaders.<br />
Sources: Bennell <strong>and</strong> Akyeampong (2007), Bruns <strong>and</strong> Luque (2014), Bush (2008), Bush <strong>and</strong><br />
Glover (2012), European Commission/EACEA/Eurydice (2013), Leithwood et al. (2008),<br />
OECD (2014c), Vaillant (2015).<br />
of teaching experience are 60% less likely to work in<br />
schools with higher proportions of students from diverse<br />
language backgrounds. In Sweden, teachers with more<br />
experience are half as likely to work in schools with<br />
larger proportions of students from socio-economically<br />
disadvantaged homes (OECD, 2014c). This is the result<br />
of both allocation decisions <strong>and</strong> higher teacher turnover<br />
rates in challenging schools.<br />
Finally, some categories of educators require specialized<br />
training but are not covered by general measurements.<br />
Notably, school principals are engaged in an increasingly<br />
complex set of activities <strong>and</strong> their qualifications need to<br />
be monitored (Box 19.1).<br />
As was shown above, minimum training requirements are<br />
difficult to compare across countries. In particular, initial<br />
teacher education courses differ in terms of duration,<br />
length of induction period <strong>and</strong> modality – whether<br />
they are provided alongside general education or after<br />
the completion of subject-based study. In the case of<br />
subject teachers, courses also differ with respect to the<br />
degree of specialization (European Commission/EACEA/<br />
Eurydice, 2012b).<br />
Structural aspects also make comparing qualifications<br />
difficult, for a number of reasons (Tatto et al., 2012).<br />
For example, countries may apply more or less strict<br />
criteria for admission to teacher education programmes.<br />
Botswana requires c<strong>and</strong>idates for primary <strong>and</strong> lower<br />
secondary mathematics teacher training to prove<br />
proficiency in mathematics before enrolling.<br />
Country policies of teacher education programme<br />
quality assurance differ. In Thail<strong>and</strong>, the Office for<br />
National Education St<strong>and</strong>ards <strong>and</strong> Quality Assessment<br />
is an external evaluation body with the power to rescind<br />
programmes’ accreditation. Chile encourages alternative<br />
teacher education provision, which inflates the supply<br />
of trainee posts <strong>and</strong> lowers admission criteria, but the<br />
system is not regulated.<br />
Some countries add a layer of quality assurance by not<br />
allowing all graduates of teacher education programmes<br />
into the profession. In Oman <strong>and</strong> the Philippines, those<br />
with a teaching qualification must also take a test set by<br />
external agencies (Tatto et al., 2012).<br />
The profile of teacher educators differs as well,<br />
particularly in poorer countries where they may have had<br />
very little training themselves. Analysis in six sub-Saharan<br />
African countries found that early reading teacher<br />
332<br />
CHAPTER 19 | TARGET 4.C – TEACHERS
19<br />
educators were rarely experts in the field (Pryor et al.,<br />
2012). In Eritrea, Gambia <strong>and</strong> Zambia, instructors in many<br />
primary school teacher preparation courses tended to be<br />
former secondary school teachers with little experience<br />
of teaching at the primary level (Mulkeen, 2010).<br />
The introduction of a global indicator defined in terms<br />
of professional qualifications is expected to increase the<br />
pool of information on trained teachers. However, more<br />
work needs to be done to develop system-level indicators<br />
that capture more accurately the nuances in minimum<br />
requirements for entering the profession. Even so, the<br />
extent to which teachers meet the requirements is not a<br />
predictor of their skills (Box 19.2).<br />
INTERNATIONAL COOPERATION IN<br />
TEACHER TRAINING<br />
The target formulation explicitly refers to ‘international<br />
cooperation for teacher training in developing countries,<br />
especially least developed countries <strong>and</strong> small isl<strong>and</strong><br />
developing States’ as a means of increasing the supply<br />
of qualified teachers. However, this addition to the target<br />
seems out of proportion to the role that international<br />
cooperation can play in teacher education.<br />
The OECD Development Assistance Committee, which<br />
is the international platform on aid finance, has a special<br />
code for teacher training. It does not capture the total<br />
amount of external support to teacher training, though,<br />
as part of it may be subsumed under general purpose<br />
codes. Between 2002 <strong>and</strong> 2014, donors tripled their<br />
disbursements from US$77 million to US$251 million,<br />
which is equivalent to 2% of total direct aid to education.<br />
Least developed countries received 41% of total aid to<br />
teacher training <strong>and</strong> small isl<strong>and</strong> developing states 7%.<br />
The three donors that prioritized teacher training the<br />
most in their education aid portfolio in 2014 were Canada<br />
(9.5%), Portugal (8.5%) <strong>and</strong> Australia (6.2%).<br />
TEACHER MOTIVATION<br />
AND SUPPORT<br />
How to motivate <strong>and</strong> support teachers does not feature in<br />
the formulation of target 4.c but is a major policy concern<br />
reflected in the Education 2030 Framework for Action,<br />
which asserts that strongly supported <strong>and</strong> motivated<br />
teachers are more likely to ensure that learners benefit<br />
from their classroom experience. Models have been<br />
proposed to explain how personalities, values <strong>and</strong> skills<br />
interact with external factors <strong>and</strong> circumstances to shape<br />
BOX 19.2<br />
Directly assessing teacher skills<br />
Improving data on teacher qualifications will yield better information on how school<br />
systems comply with minimum st<strong>and</strong>ards, but will not address the need for evidence on<br />
teacher knowledge <strong>and</strong> skills. Given the diversity of competencies teachers bring to the<br />
classroom, it is unrealistic to look for global measures of teacher skills. But some aspects of<br />
teacher competencies can be assessed. The initiatives discussed below should be followed<br />
closely. While they may not lead to global indicators, they are likely to answer policy<br />
questions at the regional <strong>and</strong> national levels <strong>and</strong> could provide useful benchmarks.<br />
On general knowledge, data from 23 countries that participated in 2011 in the OECD<br />
Programme for the International Assessment of Adult Competencies (PIAAC) showed that<br />
teachers’ numeracy skills relative to those of the average employed adult with a university<br />
degree varied substantially. For example, the numeracy skills of teachers in France <strong>and</strong><br />
Spain were at the top 75% to 80% of the average adult skill distribution, whereas teachers in<br />
Denmark <strong>and</strong> the Russian Federation were close to the middle of the distribution.<br />
On subject-specific skills, as part of SACMEQ in 2007, grade 6 teachers took the<br />
same assessment as their students. Analysis for this report shows that results varied<br />
strongly among the 15 countries. While only 2% of teachers in Kenya scored below the<br />
concrete problem-solving level in mathematics, the share was 35% in South Africa, 39%<br />
in Mozambique <strong>and</strong> 43% in Zambia. The next round of the CONFEMEN Programme for<br />
Analysis of Education Systems (PASEC) in francophone African countries in 2019 will<br />
include a similar assessment of teacher skills.<br />
On professional skills, the Teacher Education <strong>and</strong> Development Study in Mathematics<br />
(TEDS-M), conducted by the International Association for the Evaluation of Educational<br />
Achievement, assessed teacher trainees in terms of pedagogical content knowledge. It<br />
included three subdomains: curricular knowledge, knowledge of planning for teaching<br />
<strong>and</strong> learning, <strong>and</strong> enacting mathematics for teaching <strong>and</strong> learning. A proficiency level<br />
was developed which corresponded to the ability to ‘recognize whether or not a teaching<br />
strategy was correct for a particular concrete example, <strong>and</strong> to evaluate students’ work<br />
when the content was conventional or typical of the primary grades’. Less than 1% of<br />
teachers who were being trained for the lower primary grades in Georgia achieved the<br />
level, compared with 44% in Germany.<br />
In the OECD, the Teacher Knowledge Survey, a pilot survey in six countries in 2016, will<br />
assess the general pedagogical knowledge of lower secondary school teachers, trainee<br />
teachers <strong>and</strong> teacher educators. The survey will assess teachers’ performance in three key<br />
areas of pedagogy required for effective teaching: instruction, learning <strong>and</strong> assessment.<br />
Sources: Hanushek et al. (2014); König (2014); Tatto et al. (2012).<br />
teachers’ thoughts, feelings <strong>and</strong> beliefs (Neves de Jesus<br />
<strong>and</strong> Lens, 2005; Richardson et al., 2014) (Figure 19.4).<br />
Recent comparative studies have provided valuable<br />
insights. For example, the 2013 TALIS showed that<br />
teachers’ levels of job satisfaction were higher when<br />
they had opportunities to participate in decision-making<br />
2016 • GLOBAL EDUCATION MONITORING REPORT 333
19<br />
FIGURE 19.4:<br />
Teacher motivation results from interaction of external factors with individual traits, values <strong>and</strong> skills<br />
A framework for underst<strong>and</strong>ing the factors that affect teacher motivation<br />
EXTERNAL FACTORS<br />
INDIVIDUAL FACTORS TEACHER BEHAVIOUR STUDENT OUTCOMES<br />
i.e. personality, values,<br />
knowledge <strong>and</strong> skills<br />
SOCIETY<br />
e.g. view of teacher status<br />
GOVERNMENT<br />
e.g. remuneration, contractual arrangements<br />
<strong>and</strong> professional development<br />
SCHOOL WORKING CONDITIONS<br />
e.g. participation in decision-making, school<br />
leadership, induction <strong>and</strong> mentoring<br />
TEACHER THOUGHTS<br />
AND FEELINGS<br />
e.g. efficacy: whether<br />
they believe they<br />
can have an effect on<br />
student learning; morale;<br />
stress <strong>and</strong> burnout;<br />
commitment; <strong>and</strong> job<br />
satisfaction<br />
SCHOOL PRACTICE<br />
CLASSROOM PRACTICE<br />
TURNOVER AND ATTRITION<br />
STUDENT LEARNING<br />
CLASSROOM WORKING CONDITIONS<br />
e.g. workload volume <strong>and</strong> student behavior<br />
Source: Adapted from Leithwood (2006).<br />
in schools, collaborate with colleagues <strong>and</strong> receive<br />
meaningful feedback from their supervisors (OECD, 2014c).<br />
A diagnostic tool on teacher motivation in poorer countries<br />
was developed by two international non-governmental<br />
organizations (NGOs) on behalf of the Teacher Motivation<br />
Working Group <strong>and</strong> piloted in Bangladesh, India, Ug<strong>and</strong>a<br />
<strong>and</strong> Viet Nam. It includes asking teachers to describe<br />
whether they feel they can influence decisions at the<br />
school <strong>and</strong> how to deal with students who lag behind<br />
(Save the Children <strong>and</strong> World Vision, 2015).<br />
However, the collection of direct information across<br />
countries on motivation <strong>and</strong> job satisfaction would entail<br />
considerable challenges for the purposes of international<br />
monitoring, which requires consistent definitions to<br />
capture long-term trends.<br />
This chapter covers selected aspects of teacher<br />
motivation <strong>and</strong> support. It looks at external factors,<br />
primarily related to government policy: induction <strong>and</strong><br />
mentoring mechanisms for new teachers; continuous<br />
professional development opportunities; working<br />
conditions, notably in terms of contractual arrangements;<br />
<strong>and</strong> remuneration. It then reviews evidence on one<br />
potential manifestation of low motivation: the rate at<br />
which teachers leave the profession. Overall, it suggests<br />
there is a long way to go before reliable data on salaries,<br />
working conditions <strong>and</strong> attrition can be captured.<br />
INDUCTION<br />
Teachers face their biggest challenges as they make<br />
the transition from being learners to being leaders in<br />
the classroom. Induction <strong>and</strong> mentoring programmes,<br />
which cover a range of activities <strong>and</strong> take different<br />
forms, are aimed at supporting teachers who are new<br />
to the profession as well as those new to a school. They<br />
can be structured <strong>and</strong> organized along a set of formally<br />
specified rules, as in formal induction, or done informally.<br />
In 34 countries <strong>and</strong> subregional entities participating in<br />
the 2013 TALIS, 44% of lower secondary school teachers<br />
who were new to the school had access to formal induction<br />
programmes, according to their head teachers; this<br />
support mechanism was available to 66% of teachers at all<br />
levels who were new to the profession. However, according<br />
to the teachers themselves, only 49% had participated<br />
in an induction programme. The share ranged from<br />
more than four in five in East Asian countries, such as<br />
Japan, Malaysia <strong>and</strong> Singapore, to less than one in five in<br />
Estonia, Finl<strong>and</strong>, Norway <strong>and</strong> Sweden.<br />
334<br />
CHAPTER 19 | TARGET 4.C – TEACHERS
19<br />
The survey also asked lower secondary school teachers<br />
whether they were participating at a mentoring<br />
programme at the time. About 13% said they had been<br />
assigned a mentor; the rate increased to 25% among<br />
those with fewer than five years of experience. Within<br />
this latter group, the range varied from 6% in Chile <strong>and</strong><br />
9% in Italy to 52% in Abu Dhabi, United Arab Emirates. In<br />
Mexico, the share of teachers assigned a mentor was 22%<br />
in primary education, 17% in lower secondary education<br />
<strong>and</strong> 13% in upper secondary education (OECD, 2014c).<br />
The effectiveness of induction <strong>and</strong> mentoring<br />
programmes depends on the quality of interaction<br />
with mentors. It can be bolstered if teachers have been<br />
exposed to classrooms in their initial education. As<br />
part of the teacher module of the World Bank Systems<br />
Approach for Better Education Results (SABER),<br />
information was collected on formal policies related to<br />
the incidence <strong>and</strong> duration of prior classroom experience<br />
for primary school teachers in conjunction with<br />
induction or mentoring programmes (Table 19.1).<br />
Some patterns emerge. In Cambodia, teacher trainees are<br />
required to have up to three months of prior classroom<br />
experience, with no formal systems to facilitate the<br />
transition of new teachers into schools. By contrast, teacher<br />
trainees in Lebanon are required, among other, to do<br />
at least one year of classroom teaching to get their<br />
certification, <strong>and</strong> to take part in an induction programme<br />
when joining a school (World Bank, 2016b).<br />
Differences between induction <strong>and</strong> mentoring<br />
programmes can make it hard to compare results. A study<br />
of six countries in Eastern Europe <strong>and</strong> the Caucasus<br />
found that only Azerbaijan had a formal induction<br />
programme for new teachers, lasting one year. Yet, fewer<br />
systematic support measures may exist at the school<br />
level, as for example in Ukraine. Georgia introduced a pilot<br />
teacher induction <strong>and</strong> mentoring programme in 2009/10,<br />
as part of which mentors received training <strong>and</strong> a special<br />
allowance, but called it off subsequently due to problems<br />
in implementation (GHK, 2011; World Bank, 2016b).<br />
Teachers in western Balkan countries tend to have an<br />
extended probation period of up to one year under the<br />
guidance of appointed mentors. In the Sarajevo canton<br />
of Bosnia <strong>and</strong> Herzegovina, mentors receive an allowance<br />
equal to 5% to 10% of their salary, but no training, <strong>and</strong> may<br />
not come from the same institutions as their mentees,<br />
which can reduce their contact hours (ICF GHK, 2013).<br />
IN-SERVICE TRAINING<br />
One of the proposed thematic indicators aims to explore<br />
the availability of in-service training as a way to support<br />
teachers. The indicator presents more challenges<br />
than those on teacher qualifications, as continuous<br />
professional development programmes are even more<br />
diverse than pre-service programmes <strong>and</strong> less easy to<br />
classify into clear categories.<br />
As the information is not collected in a systematic <strong>and</strong><br />
comparable way from administrative data, the UIS does<br />
not currently report on it. In any case, in-service training<br />
is rarely delivered in a centralized way, with significant<br />
variation even at the school level. It also depends<br />
on institutional requirements <strong>and</strong> the willingness of<br />
teachers to participate, as well as whatever obstacles<br />
they face, such as cost, time <strong>and</strong> schedule conflicts. A<br />
global approach to gathering data would have to solicit<br />
information directly from a sample of teachers.<br />
The 2013 TALIS provides good insights into the possibilities<br />
<strong>and</strong> challenges posed by this indicator. Among lower<br />
secondary school teachers in 34 countries <strong>and</strong> subregional<br />
entities, about 88% reported participation in at least one<br />
professional development activity in the 12 months prior<br />
to the survey, with the lowest rates observed in Chile<br />
(72%) <strong>and</strong> Slovakia (73%). Participation rates remained<br />
constant on average across countries in the two TALIS<br />
rounds, although they fell from 100% to 84% in Spain<br />
<strong>and</strong> from 85% to 75% in Italy between 2008 <strong>and</strong> 2013.<br />
Teachers sometimes paid for training themselves, but this<br />
should be excluded from the indicator to capture the<br />
degree of support teachers receive.<br />
TABLE 19.1:<br />
Support opportunities for new primary school teachers, selected countries, 2010–2014<br />
Prior classroom experience needed<br />
Less than<br />
12 months<br />
Côte d’Ivoire, Djibouti, Kenya, Mali, Russian<br />
Federation (St Petersburg <strong>and</strong> Tomsk regions)<br />
Induction, mentoring or student experience<br />
programme opportunities<br />
Classroom experience during initial teacher education<br />
or participation in induction or mentoring programmes<br />
Both classroom experience in initial teacher education<br />
<strong>and</strong> through induction or mentoring programmes<br />
3 months<br />
or less<br />
Cambodia,<br />
Republic of Moldova<br />
12 to 24<br />
months<br />
Bulgaria,<br />
Serbia<br />
More than<br />
24 months<br />
Guinea-Bissau, Jordan, Kazakhstan, Nigeria<br />
(Anambra <strong>and</strong> Bauchi), Palestine, TFYR Macedonia<br />
Benin, Guyana, Nigeria (Ekiti),<br />
Ug<strong>and</strong>a<br />
Lebanon,<br />
Tunisia<br />
Source: World Bank (2016b).<br />
2016 • GLOBAL EDUCATION MONITORING REPORT 335
19<br />
Information on participation rates needs to be<br />
complemented with information on the type <strong>and</strong><br />
duration of training. Activities range from organized <strong>and</strong><br />
structured to informal <strong>and</strong> self-directed learning. Among<br />
the structured approaches, 71% of teachers reported<br />
attending courses or workshops for an average of eight<br />
days during the previous year, making these the most<br />
common form of activity in participating countries.<br />
Among informal approaches, 37% of teachers reported<br />
participating in a professional development-oriented<br />
network, with the prevalence ranging from less than<br />
20% in the Czech Republic, France <strong>and</strong> Portugal to<br />
63% in Croatia. In addition, 30% of teachers reported<br />
involvement in mentoring <strong>and</strong> peer observation as part<br />
of a formal school arrangement, ranging from 5% in<br />
Finl<strong>and</strong> to 65% in Singapore (OECD, 2014c).<br />
Institutional frameworks of continuous<br />
professional development<br />
While it is preferable to estimate actual levels of<br />
participation in continuous professional development<br />
by asking teachers directly, an alternative is to assess<br />
national policy as an indicator of a country’s commitment<br />
to provide such development opportunities.<br />
In Europe, government expectations for professional<br />
development differ. From pre-primary to upper<br />
secondary education, continuous professional<br />
development is considered a duty in Belgium <strong>and</strong><br />
Hungary, necessary only for promotion in France <strong>and</strong><br />
Pol<strong>and</strong>, <strong>and</strong> simply optional in Greece <strong>and</strong> Irel<strong>and</strong>.<br />
Countries also differ in the range of incentives offered<br />
to teachers. In Spain, professional development plans<br />
at the school level are compulsory; monetary incentives<br />
are provided, time is compensated <strong>and</strong> professional<br />
development is applied as a criterion for mobility. In<br />
Sweden, where professional development plans at the<br />
school level are not compulsory, none of these incentives<br />
are used (European Commission/EACEA/Eurydice, 2013).<br />
Similar information has been collected as part of the SABER<br />
module on teachers. For example, primary school teachers<br />
are not required to participate in professional development<br />
in Benin, Cambodia <strong>and</strong> Palestine, while in Djibouti, Egypt<br />
<strong>and</strong> Kazakhstan they must participate for at least 10 days<br />
but do not have to share the cost (World Bank, 2016b).<br />
WORKING CONDITIONS<br />
While the majority of teachers globally are employed<br />
on a permanent basis, the use of short-term contracts<br />
is growing. Alternative routes to teaching have been<br />
used to fill temporary needs <strong>and</strong> overcome particular<br />
recruitment challenges. They have also been used to<br />
control the cost of teacher salaries.<br />
Frequent use of short-term contracts can damage the<br />
status of teaching as a career (ILO <strong>and</strong> UNESCO, 2015).<br />
They have been associated with high teacher turnover,<br />
which disrupts school management <strong>and</strong> reduces the<br />
quality of student learning experiences (Burns <strong>and</strong> Darling-<br />
Hammond, 2014). They also create unequal opportunities<br />
in teacher careers, as in the case of Cameroon (Box 19.3).<br />
The UIS distinguishes between civil servants, teachers on<br />
fixed or short-term contracts, community teachers <strong>and</strong><br />
volunteers. While data from the global module on teachers<br />
have not yet been made available, according to the regional<br />
module on teachers in Asia the percentage of teachers on<br />
civil service contracts varies between <strong>and</strong> within countries.<br />
For example, in both the Lao People’s Democratic Republic<br />
<strong>and</strong> Malaysia, the share of private schools is below 5%. And<br />
yet only 69% of primary school teachers in the Lao People’s<br />
Democratic Republic <strong>and</strong> 82% in Malaysia had public sector<br />
permanent contracts. Only about 4 in 10 primary<br />
school teachers in the capital city districts of Delhi <strong>and</strong><br />
Jakarta were on such contracts (Figure 19.5).<br />
In India, the state with the lowest percentage of civil servant<br />
teachers was Jhark<strong>and</strong>, at just 24%. The hiring of contract<br />
teachers began during the District Primary Education<br />
Programme in the late 1990s. These teachers do not have the<br />
same career opportunities as those on civil service contracts.<br />
Even though the Right to Education Act states that teachers<br />
should only be recruited as civil servants, the government<br />
had planned to fill half the vacant posts in Jhark<strong>and</strong> with<br />
contract teachers as recently as 2012 (Rao et al., 2015).<br />
In Brazil, according to the National Household Sample<br />
Survey, 54% of teachers from the pre-primary through<br />
to the secondary levels are public servants, 23% are<br />
on regular contracts <strong>and</strong> a further 23% lack a formal<br />
contract, with this share rising to 31% in the North-East<br />
region (Alves <strong>and</strong> Pinto, 2011).<br />
Short-term contracts are far more common for beginning<br />
teachers than for experienced ones. For example, in<br />
the Czech Republic, 61% of beginning teachers are on<br />
short-term contracts, compared with less than 10% of<br />
experienced teachers (Burns <strong>and</strong> Darling-Hammond, 2014).<br />
Comparing definitions of employment status across<br />
countries is complicated. In Europe, teachers may be<br />
336<br />
CHAPTER 19 | TARGET 4.C – TEACHERS
19<br />
BOX 19.3<br />
Upgrading ‘parents’ teachers’ in Cameroon<br />
The three types of employment status for primary school teachers in<br />
Cameroon are civil servants, contract teachers <strong>and</strong> parents’ teachers.<br />
The minimum qualification for primary school teachers is a certificate<br />
for basic aptitude in pedagogy for early childhood <strong>and</strong> primary<br />
education (CAPIEMP), although a bachelor’s degree may also be<br />
accepted under certain circumstances. To obtain the CAPIEMP, trainee<br />
teachers need to study at an Ecole Normale d’Instituteurs for three<br />
years if they have a diploma of the first secondary education cycle or<br />
one year if they have a diploma of the second secondary education<br />
cycle (baccalauréat). The CAPIEMP conveys the right to become a<br />
category B permanent civil servant, though not all holders are hired<br />
by the state.<br />
Fixed-term contract teachers have been hired in Cameroon since<br />
2003. As of 2013, contract teachers were paid at a rate 55% below<br />
that of civil servant teachers. They are not entitled to the bonuses<br />
civil servant teachers receive, nor do they have a career path, even<br />
though they tend to have the required qualifications.<br />
FIGURE 19.5:<br />
The percentage of contract teachers varies between <strong>and</strong> within countries<br />
Percentage of primary school teachers with public sector permanent contracts, by<br />
province/region, selected countries, 2014<br />
100<br />
%<br />
90<br />
80<br />
70<br />
60<br />
50<br />
40<br />
30<br />
20<br />
10<br />
Source: UIS database.<br />
0<br />
Malaysia<br />
Lao PDR Indonesia India<br />
Average<br />
Region<br />
Capital<br />
Parent associations have been hiring so-called parents’ teachers, especially<br />
in rural areas. They are paid even less than contract teachers. As of 2014,<br />
out of 94,000 primary school teachers, about 18% were parents’ teachers.<br />
To address inequality in working conditions, the government<br />
decided to hire about 3,000 contract teachers each year over three<br />
years. In 2014 <strong>and</strong> 2015, only parents’ teachers were hired, while in<br />
2016, both parents’ teachers <strong>and</strong> young CAPIEMP graduates were<br />
to be hired on contract. The government set criteria including that<br />
those hired through this arrangement must have obtained the<br />
CAPIEMP before 2013, be younger than age 40 <strong>and</strong> be currently<br />
working in a public primary school that faces a teacher gap.<br />
Sources: Cameroon Tribune (2014); Nkengne (2010); WDE (2011).<br />
<strong>and</strong> attractive career choice. A competitive remuneration<br />
package is an essential component of recruiting <strong>and</strong><br />
retaining the best <strong>people</strong> to the profession.<br />
In general, it is difficult to estimate the average teacher<br />
salary, even within a particular education level. Statutory<br />
salaries differ among countries in many aspects,<br />
including maximum <strong>and</strong> minimum levels, the number<br />
of years after which a teacher can reach the maximum<br />
level <strong>and</strong> the distribution of teachers within salary scales.<br />
Evidence on hours of work or overtime pay is often<br />
scarce. There are major differences in what allowances<br />
are included <strong>and</strong> excluded <strong>and</strong> how social security<br />
contributions are calculated.<br />
civil servants or, especially those employed at the local<br />
or school level, may have a contract subject to general<br />
labour law, but the two may be similar in practice. In the<br />
Netherl<strong>and</strong>s, teachers in public schools are career civil<br />
servants while those in grant-aided private schools are on<br />
contract, yet they have the same working conditions, <strong>and</strong><br />
collective agreements cover the whole education sector<br />
(European Commission/EACEA/Eurydice, 2013).<br />
SALARIES<br />
While many <strong>people</strong> choose to become teachers because<br />
they derive an intrinsic benefit from teaching, the<br />
profession also needs to be socially valued as a viable<br />
Detailed analysis for comparable countries can be<br />
insightful <strong>and</strong> identify national differences. For example,<br />
salary progression varies enormously in Europe. In<br />
Denmark, primary <strong>and</strong> lower secondary school teachers<br />
with 12 years of experience can reach the maximum<br />
statutory salary, which is less than 20% above the<br />
minimum level. By contrast, in Hungary, primary <strong>and</strong><br />
secondary school teachers need 42 years of experience<br />
to reach the maximum statutory salary, which is more<br />
than twice the minimum level (European Commission/<br />
EACEA/Eurydice, 2015c). In OECD countries, teacher<br />
salaries increase with the level of education taught, with<br />
an average gap of 26% between pre-primary <strong>and</strong> upper<br />
secondary teachers (OECD, 2015b).<br />
2016 • GLOBAL EDUCATION MONITORING REPORT 337
19<br />
These indicators are internal to the teaching profession.<br />
To know a remuneration package’s worth, it must be<br />
compared with an external benchmark. The most common<br />
approach has been to express average annual salaries<br />
as a percentage of per capita income. For example, the<br />
Education for All Fast Track Initiative recommended that<br />
the average annual salary of primary school teachers<br />
in low income countries, inclusive of benefits, should be<br />
3.5 times the GDP per capita (EFA-FTI, 2004).<br />
However, the relationship between salaries <strong>and</strong> per capita<br />
income largely reflects the level of a country’s socioeconomic<br />
development, the structure of labour markets<br />
<strong>and</strong> income distribution. In poor countries, <strong>people</strong> with<br />
teaching qualifications tend to be scarce <strong>and</strong> therefore<br />
more expensive, on average. For example, among<br />
countries with data on teacher salaries, as used to<br />
estimate the costs of the Education 2030 targets in the<br />
2015 EFA Global Monitoring Report, primary school teacher<br />
salaries were 2.4 times the GDP per capita in lower<br />
middle income countries but 3.3 times in low income<br />
countries. Comparing salary levels between countries<br />
at similar levels of development may be meaningful but<br />
FIGURE 19.6:<br />
Teachers in Latin America earn less than other professionals<br />
Earnings gap between professionals/technicians <strong>and</strong> teachers, after accounting for<br />
sex, age <strong>and</strong> education, selected Latin American countries, 2006–2009<br />
Teacher earnings relative to other professionals (=100)<br />
130<br />
120<br />
110<br />
100<br />
90<br />
80<br />
70<br />
60<br />
50<br />
40<br />
Paraguay, 2006<br />
El Salvador, 2009<br />
Dominican Rep., 2009<br />
Source: Mizala <strong>and</strong> Ñopo (2012).<br />
Chile, 2009<br />
#<br />
Peru, 2009<br />
#<br />
Panama, 2007<br />
Ecuador, 2006<br />
Average<br />
Brazil, 2009<br />
Honduras, 2007<br />
Pre-primary <strong>and</strong> primary<br />
Secondary<br />
Costa Rica, 2009<br />
Bolivia, 2009<br />
Uruguay, 2007<br />
direct comparisons between richer <strong>and</strong> poorer countries<br />
are likely to mislead.<br />
An alternative approach, which the proposed thematic<br />
indicator favours, is to focus on the average teacher salary<br />
as a percentage of the salary of similarly educated adult<br />
full-time workers. For example, administrative data of<br />
OECD countries indicate that primary school teachers<br />
earn 78% <strong>and</strong> lower secondary school teachers 80% of the<br />
salary of similarly educated adults. Within the latter group,<br />
the range varies from 57% in Slovakia <strong>and</strong> 60% in Chile to<br />
about 100% in Denmark <strong>and</strong> France (OECD, 2015b).<br />
In practice, establishing the relative attractiveness<br />
of teacher salaries using administrative data can be<br />
challenging in many countries. For example, instead of being<br />
determined centrally, salaries are often set at lower tiers<br />
of government or the school level. Nor are administrative<br />
sources always well placed to capture data on the pay of<br />
teachers in the private sector or those on contracts.<br />
For this reason, one approach is to look at labour<br />
force survey data. The advantage of this approach is<br />
that a single source provides comparable information<br />
on salaries as well as other individual background<br />
characteristics for both teachers <strong>and</strong> other workers. This<br />
makes it possible to estimate the earnings gap while<br />
accounting for explanatory factors.<br />
Analysis of labour force surveys from 13 Latin American<br />
countries showed results quite similar to those in OECD<br />
countries. Pre-primary <strong>and</strong> primary school teachers<br />
earned 76% of what other professionals <strong>and</strong> technicians<br />
did, while secondary school teachers earned 88%, after<br />
accounting for differences in sex, age <strong>and</strong> education<br />
(Figure 19.6). However, there were large differences<br />
within the group. In the Dominican Republic, the average<br />
teacher earned about 70%, while in Uruguay, teachers<br />
enjoyed a slight advantage over other professionals <strong>and</strong><br />
technicians (Mizala <strong>and</strong> Ñopo, 2012).<br />
While this approach provides a solid basis to discuss<br />
the relative pay of teachers across countries, it also has<br />
considerable disadvantages. Labour force surveys are not<br />
sufficiently frequent for monitoring purposes, nor are their<br />
data sets easily available in all parts of the world. Their<br />
sample sizes need to be large enough to accommodate<br />
the fact that teachers tend to be only about 3% of the<br />
labour force. Even if samples are large, they are unlikely<br />
to distinguish between levels <strong>and</strong> sectors of education or<br />
between teachers <strong>and</strong> head teachers.<br />
338<br />
CHAPTER 19 | TARGET 4.C – TEACHERS
19<br />
As information on occupations is not collected in<br />
the same way everywhere, it may not be possible to<br />
establish a consistent definition of a comparison group<br />
of ‘other professionals’ across countries. In addition,<br />
self-employed professionals often do not declare all their<br />
income, resulting in underestimation of the earnings gap<br />
between them <strong>and</strong> teachers, who are more likely to be on<br />
civil service contracts.<br />
Nevertheless, such an approach is likely to give a more<br />
consistent view of the relative pay of teachers <strong>and</strong> its<br />
evolution over time than what is currently available.<br />
Adopting this approach will require improved coordination<br />
<strong>and</strong> the establishment of an inter-agency mechanism with<br />
the support of the International Labour Organization.<br />
ATTRITION<br />
Teachers may leave the profession for many reasons,<br />
from retirement or dismissal to illness or death, as well<br />
as voluntarily. While some level of voluntary attrition<br />
in the first years is desirable (when teachers discover<br />
they have no vocation for teaching), excessive attrition<br />
represents a waste of resources on teacher training <strong>and</strong><br />
recruitment. Higher turnover <strong>and</strong> attrition may disrupt<br />
students’ classroom <strong>and</strong> learning experiences, especially<br />
in disadvantaged areas where teaching is viewed as a less<br />
attractive profession <strong>and</strong> where replacing teachers may<br />
be difficult <strong>and</strong> time-consuming.<br />
The degree to which teachers quit the profession<br />
voluntarily to search for other work can serve as<br />
a potential indicator of low motivation among<br />
teaching professionals.<br />
While few countries regularly report overall annual<br />
teacher attrition rates, what rates are available vary<br />
widely between <strong>and</strong> within countries. In sub-Saharan<br />
Africa, the most recent annual attrition rates among<br />
public primary teachers range from 1% in Mauritania to<br />
15% in Togo. Among 14 OECD countries with comparable<br />
data, attrition rates for public school teachers were<br />
below 3% in three countries, between 3% <strong>and</strong> 6% in six<br />
<strong>and</strong> above 6% in five (OECD, 2005c). Attrition rates also<br />
change within countries over time. In the United States,<br />
attrition rose by 41% between 1988/89 <strong>and</strong> 2008/09,<br />
from 6.4% to 9% (Ingersoll et al., 2014).<br />
the list in a survey of anglophone sub-Saharan African<br />
countries (Mulkeen, 2010). In high income countries,<br />
attrition rates are highest among new teachers<br />
for reasons such as lack of support <strong>and</strong> broader<br />
disillusionment with working conditions <strong>and</strong> pay. Higher<br />
rates of teacher attrition are observed in disadvantaged<br />
areas <strong>and</strong> schools for children with special education<br />
needs. Teachers in such schools are also more likely<br />
to transfer to more affluent schools (Borman <strong>and</strong><br />
Dowling, 2008; Boe et al., 2008; Ingersoll et al., 2014;<br />
OECD, 2005c).<br />
Working conditions can play a major role in influencing<br />
turnover. In Punjab province, Pakistan, 24% of public<br />
schools reported that a teacher had left in the previous<br />
year, compared with 71% of private ones (Andrabi et<br />
al., 2008), which had lower pay <strong>and</strong> less job protection.<br />
In Mexico, the attrition rate of community teachers in<br />
remote areas was higher than in other schools but fell<br />
from 22% to 17% after the introduction of a monthly<br />
stipend incentive (IADB, 2014). In Ug<strong>and</strong>a, teacher<br />
attrition fell by 24% from 2005 to 2006 following a 33%<br />
pay rise (Mulkeen, 2010).<br />
Data collection methods are inconsistent. They may not<br />
clearly distinguish between teaching <strong>and</strong> non-teaching<br />
staff, or whether attrition refers only to teachers<br />
leaving the profession altogether or includes teachers<br />
moving between schools. Commonly, attrition rates<br />
are gathered through an annual survey conducted at<br />
school level. But this leaves considerable margin for error.<br />
More appropriate data collection would be through a<br />
centralized human resources database that records both<br />
attrition <strong>and</strong> transfers between schools. An alternative<br />
approach would be a survey that collects information<br />
directly from teachers. For example, in the United States,<br />
the National Center for Education Statistics carries out<br />
the Schools <strong>and</strong> Staffing Survey about every four years<br />
<strong>and</strong> then revisits a sample of teachers a year later as part<br />
of the Teacher Follow-up Survey (NCES, 2014).<br />
Where surveys capture the reasons for attrition,<br />
resignation, rather than retirement, is often the most<br />
significant cause. Voluntary resignation was top of<br />
2016 • GLOBAL EDUCATION MONITORING REPORT 339
20<br />
A young girl<br />
st<strong>and</strong>s <strong>and</strong> writes<br />
on the blackboard<br />
in Germany.<br />
CREDIT: Fotolia<br />
KEY MESSAGES<br />
A lack of adequate <strong>and</strong> equitable finance was a key reason why the world fell short of achieving the Education for All goals<br />
between 2000 <strong>and</strong> 2015. Yet no SDG 4 target specifically relates to education finance.<br />
Reporting on education spending rarely combines funds from governments, external donors <strong>and</strong> households. National<br />
education accounts look at all three sources simultaneously <strong>and</strong> give a more accurate picture.<br />
On average worldwide, public expenditure on education passes the two minimum thresholds proposed in the Education 2030<br />
Framework for Action, but at least 35 countries spent less than the recommended 4% of GDP on education <strong>and</strong> less than 15% of<br />
total public expenditure.<br />
Data are incomplete, as only 60% of countries report total education expenditure as a percentage of GDP for any given year;<br />
they are also out of date, as they become available with a three-year reporting lag.<br />
Monitoring of government spending must track whether funds go to those most in need. Countries should establish regional<br />
peer review mechanisms to learn from each other in promoting equity.<br />
Aid needs to increase at least sixfold to fill the US$39 billion annual gap to reach the new targets. But in 2014, aid levels were 8%<br />
lower than at their peak in 2010. The gap could be filled if donors dedicated 0.7% of gross national income to aid <strong>and</strong> allocated<br />
10% of their aid to basic <strong>and</strong> secondary education.<br />
Poorer countries should be prioritized in aid, yet low income countries received 28% of total aid to basic education in 2014 while<br />
accounting for 36% of all out-of-school children.<br />
Levels of humanitarian aid need to be tracked as well. In 2015, education received US$198 million, or less than 1.9% of total<br />
humanitarian aid.<br />
Households still pick up a lot of the cost of education. In the poorest countries, their share of total education spending was<br />
almost triple that in the richest countries. New analysis shows that information on household spending is available in most<br />
countries but rarely used.<br />
340<br />
CHAPTER 20 | FINANCE
20<br />
CHAPTER 20<br />
20<br />
Finance<br />
(selected finance-related indicators from target 4.5)<br />
THEMATIC INDICATOR 19 – Extent to which explicit formula-based policies reallocate education<br />
resources to disadvantaged populations<br />
THEMATIC INDICATOR 20 – Education expenditure per student by level of education <strong>and</strong> source<br />
of funding<br />
THEMATIC INDICATOR 21 – Percentage of total aid to education allocated to low-income countries<br />
2016 • GLOBAL EDUCATION MONITORING REPORT 341
20<br />
National education accounts.............................................................................................342<br />
Improving financial data..................................................................................................... 346<br />
While the 2030 Agenda for Sustainable<br />
Development includes three targets related to<br />
means of implementation, remarkably, none of these<br />
refers to education financing. This partly reflects a<br />
perceived lack of an education expenditure target<br />
that would be appropriate for all countries. But it<br />
also reflects concerns that spending volume is<br />
unrelated to effectiveness <strong>and</strong> efficiency: Critics point<br />
out that countries with similar levels of spending in<br />
terms of income per capita produce widely different<br />
educational outcomes.<br />
However, the 2015 EFA Global Monitoring Report<br />
(GMR) argued that the lack of equitable <strong>and</strong> adequate<br />
financing was a key reason why the world fell short<br />
of achieving the EFA goals in 2015 – <strong>and</strong> that where<br />
progress accelerated, there was clear evidence of<br />
increased allocations to education, usually from a<br />
very low starting point.<br />
Regardless of the absence of a financing target,<br />
comprehensive <strong>and</strong> regular education financing data<br />
are a prerequisite both for effective education sector<br />
planning <strong>and</strong> for monitoring the commitment of all<br />
partners to the global education agenda. This section<br />
focuses on the need for better information on the<br />
volume <strong>and</strong> composition of education financing. Gaps in<br />
data are so wide that simple national, regional <strong>and</strong> global<br />
trends cannot be ascertained. This may also be one<br />
reason why stronger links between education financing<br />
<strong>and</strong> outcomes have not yet been established.<br />
The section begins by proposing an overall framework<br />
for capturing all education financing flows. It then<br />
discusses gaps in data on public expenditure, aid <strong>and</strong><br />
household spending, along with recent initiatives to<br />
address these gaps.<br />
NATIONAL EDUCATION<br />
ACCOUNTS<br />
National <strong>and</strong> global debates on education financing are<br />
incomplete. For example, in poor countries they tend<br />
to focus either on what the government spends or on<br />
what the country receives from external sources – but<br />
they rarely consider how the two flows combine <strong>and</strong><br />
affect each other. In some countries, education ministry<br />
expenditure is only part of what a government may<br />
spend on education, with other ministries, lower tiers of<br />
government <strong>and</strong> autonomous agencies also channelling<br />
funding. Even if information on the other sources exists,<br />
it may be compiled using different classifications.<br />
Another problem is the lack of evidence on the share<br />
of total education spending funded by households. For<br />
example, the 2015 GMR showed that if government<br />
<strong>and</strong> household expenditure were added up, households<br />
contributed a much larger share of total expenditure on<br />
education in poorer countries than in richer countries.<br />
This finding has major implications for equity, yet does<br />
not receive the attention it deserves.<br />
The lack of equitable <strong>and</strong> adequate finance was a key reason<br />
why the world fell short of achieving the EFA goals in 2015<br />
“<br />
”<br />
342<br />
CHAPTER 20 | FINANCE
20<br />
Faced with similar challenges, the health sector<br />
developed the concept of national health accounts as<br />
a common framework to collect <strong>and</strong> process health<br />
expenditure data. Efforts began in the 1960s, although<br />
not until the 1990s was the approach systematically<br />
adopted worldwide. By 2010, 130 countries had used<br />
national health accounts at least once, while around<br />
41 countries were doing so more or less regularly<br />
(World Bank, 2010). In several countries, national health<br />
accounts are institutionalized with a specific unit, often<br />
in the health ministry.<br />
common categories around five dimensions: financing<br />
units, education levels, producing units, activities <strong>and</strong><br />
economic transactions.<br />
Over 2013–2016, with support from the Global<br />
Partnership for Education, the UNESCO Institute for<br />
Statistics (UIS), the UNESCO International Institute for<br />
Educational Planning (IIEP) <strong>and</strong> the IIEP-Pôle de Dakar<br />
implemented a project that supported eight countries<br />
in using a common NEA methodology. All the countries<br />
collected government expenditure data. In addition:<br />
In education, there have been fragmented efforts to<br />
introduce a similar approach in individual countries; a<br />
recent project aims to establish <strong>and</strong> systematically apply<br />
common national education account (NEA) st<strong>and</strong>ards.<br />
This section presents emerging lessons from the project<br />
<strong>and</strong> future priorities for this approach.<br />
MAPPING EDUCATION FINANCING FLOWS<br />
Generally, NEAs are designed to collect education<br />
expenditure data from public, private <strong>and</strong> external<br />
sources coherently <strong>and</strong> comprehensively. The<br />
methodology tracks all education financial flows<br />
from education funders – financing units such as<br />
governments, households or external sources – to their<br />
use by providers of education services – producing units<br />
such as education institutions or administrative offices<br />
(Figure 20.1). All data are processed <strong>and</strong> sorted into<br />
■■<br />
Guinea <strong>and</strong> Zimbabwe focused on public resource<br />
allocation within the system<br />
■■<br />
Côte d’Ivoire <strong>and</strong> Viet Nam focused on<br />
household expenditure<br />
■■<br />
The Lao People’s Democratic Republic <strong>and</strong> Senegal<br />
focused on external funding<br />
■■<br />
Nepal <strong>and</strong> Ug<strong>and</strong>a carried out full NEAs, covering all<br />
funding sources.<br />
The development of NEAs requires several steps. The first is<br />
to establish a national technical team with representatives<br />
from the education <strong>and</strong> finance ministries <strong>and</strong> the national<br />
statistical office. A steering committee made up of senior<br />
staff from these organizations ensures that the process<br />
is anchored in their respective institutions <strong>and</strong> responds<br />
FIGURE 20.1:<br />
There are multiple sources <strong>and</strong> uses of education financing<br />
National education accounts framework<br />
Administrative offices<br />
Administrative offices<br />
Teacher compensation<br />
GOVERNMENT<br />
(central, regional, local)<br />
REST OF THE WORLD<br />
(aid: grants <strong>and</strong> loans)<br />
PRIVATE<br />
(households, firms,<br />
non-profit sector)<br />
Pre-primary<br />
Primary<br />
Secondary<br />
Technical-vocational<br />
Tertiary<br />
Non-formal<br />
Education institutions<br />
Teaching<br />
Ancillary services<br />
Connected goods <strong>and</strong><br />
services, e.g. transport,<br />
uniforms, private tuition<br />
Non-teaching<br />
staff compensation<br />
Schoolbooks, teaching<br />
materials<br />
Other goods<br />
<strong>and</strong> services<br />
Gross capital formation<br />
FINANCING UNITS<br />
LEVEL OF EDUCATION<br />
PRODUCING UNITS<br />
ACTIVITIES<br />
ECONOMIC TRANSACTIONS<br />
Source: Based on IIEP, UIS <strong>and</strong> GPE (2016b).<br />
2016 • GLOBAL EDUCATION MONITORING REPORT 343
20<br />
to policy planning <strong>and</strong> decision-making needs. Then all<br />
financial flows are mapped, along with the mechanisms<br />
through which funds are made available to education<br />
providers. After identifying data sources <strong>and</strong> collecting<br />
the data, a series of financing tables (for financing units)<br />
<strong>and</strong> income <strong>and</strong> expenditure tables (for producing units)<br />
is developed to consolidate total education expenditure<br />
from all sources. The final step is to generate indicators<br />
<strong>and</strong> communicate evidence to help planners, researchers<br />
<strong>and</strong> policy-makers make sense of them.<br />
The lessons that emerge from NEAs can be startling. For<br />
example, large parts of public education expenditure can<br />
be missed, depending on the accounting classifications<br />
used. In Zimbabwe, the civil service commission pays<br />
the pensions of education sector staff, but they do not<br />
appear in formal reporting of education expenditure. Yet,<br />
such payments make up about 10% of total government<br />
spending on education. In Côte d’Ivoire, three main<br />
ministries fund education. But, in addition, the President’s<br />
Emergency Programme <strong>and</strong> 12 other ministries also fund<br />
education expenditure. These additional sources add<br />
about 9% to the total government spending on education.<br />
The main surprises emerge when household education<br />
expenditure is added. For example, the government of<br />
Nepal spends 3.5% of GDP on education, 2.6 percentage<br />
points less than Viet Nam. But when households <strong>and</strong><br />
other sources are taken into account, the order is<br />
reversed: Nepal allocates 1.5 percentage points more on<br />
education than Viet Nam (Figure 20.2).<br />
The use of NEAs in more countries would not only<br />
provide a more accurate picture of national education<br />
funding, but would also allow publication of some<br />
interesting indicators. Among them is one of the<br />
thematic indicators of the Education 2030 Framework<br />
for Action: expenditure per student by level of<br />
education <strong>and</strong> source of funding. For example, the<br />
government of Nepal spends about US$326 (in<br />
purchasing power parity terms) per primary student<br />
annually, but the country as a whole spends significantly<br />
more when funding from all sources is considered<br />
(Table 20.1).<br />
Other indicators include the degree of decentralization of<br />
education expenditure, <strong>and</strong> the distribution of education<br />
expenditure between remuneration <strong>and</strong> other uses,<br />
such as textbooks <strong>and</strong> teaching materials. Although the<br />
UIS already reports on these indicators, the number<br />
of countries able to provide good quality information<br />
on them is low <strong>and</strong> will continue to be so until an NEA<br />
approach is more widely used.<br />
A key output of the project is a methodological guide<br />
on NEAs (IIEP et al., 2016b). It aims to help countries<br />
produce education financing data that are systematic,<br />
comprehensive <strong>and</strong> comparable to those of other<br />
countries, but flexible enough to describe specific<br />
national contexts. The methodology draws heavily<br />
on international st<strong>and</strong>ards such as the UN System<br />
of National Accounts (SNA), the Government Finance<br />
Statistics Manuals of the International Monetary<br />
FIGURE 20.2:<br />
Taking household expenditure into account can transform underst<strong>and</strong>ing of national education financing<br />
Education expenditure as percentage of GDP, by source, selected countries, 2013–2015<br />
% of GDP<br />
10<br />
9<br />
8<br />
7<br />
6<br />
5<br />
4<br />
3<br />
2<br />
1<br />
0<br />
Cote d’Ivoire, 2014 Nepal, 2015 Viet Nam, 2013 Zimbabwe, 2014<br />
Source: Based on IIEP, UIS <strong>and</strong> GPE (2016a).<br />
Not included as education expenditure before<br />
national education accounts analysis<br />
Private, households<br />
Private, NGOs<br />
Public, regional <strong>and</strong> local<br />
Aid, on budget<br />
Public, central<br />
Private, other<br />
Aid, off budget<br />
Public, central<br />
Public, regional<br />
<strong>and</strong> local<br />
344<br />
CHAPTER 20 | FINANCE
20<br />
TABLE 20.1:<br />
Selected education financing indicators based on national education accounts<br />
Indicator Côte d’Ivoire, 2014 Nepal, 2015 Viet Nam, 2013 Zimbabwe, 2014<br />
Total expenditure per primary student (PPP US$) 594 535 1 256 -<br />
Government expenditure per primary student (PPP US$) 419 326 1 098 202<br />
Share of education expenditure (%) funded by:<br />
• governments 66 38 77 -<br />
• households 33 55 23 -<br />
• external sources 1 7 -<br />
Share of government education expenditure spent by local <strong>and</strong>/or regional governments (%) 0 1 65 0<br />
• teacher (%) 81 79 63 99<br />
• non-teacher (%) 64 74 - 98<br />
Expenditure on non-teacher compensation as a share of government expenditure on primary education (%) 17 5 - 1<br />
Expenditure on schoolbooks <strong>and</strong> teaching materials as a share of total government expenditure on<br />
primary education (%)<br />
4 5 - 0<br />
Notes: Some indicators are missing - because not all countries carried out the full set of analyses. In Nepal, the share of education expenditure funded by households (55%) includes a part funded by<br />
other private sources (7%).<br />
Source: UIS, IIEP <strong>and</strong> GPE (2016a).<br />
Fund (IMF) <strong>and</strong> the International St<strong>and</strong>ard Classification<br />
of Education.<br />
Ensuring consistency with the SNA <strong>and</strong> the Classification<br />
of the Functions of Government, which is the basis for<br />
the IMF Government Finance Statistics, is not only<br />
necessary for developing countries. A comparison of<br />
total government education expenditure estimates as<br />
a percentage of GDP found discrepancies between a<br />
national accounts approach <strong>and</strong> the UIS-OECD-Eurostat<br />
data collection tool amounting to at least 0.5% of GDP in<br />
half of 28 European countries (Mejer, 2006).<br />
CHALLENGES AND PRIORITIES<br />
Experience from the recently completed project<br />
shows that carrying out a full NEA is intensive,<br />
with challenges linked to data collection, capacity,<br />
resources, institutionalization <strong>and</strong> sustainability.<br />
Required data are not always available, easily accessible<br />
or usable. Most education management information<br />
systems do not cover income <strong>and</strong> expenditure of<br />
schools. Data on regional <strong>and</strong> local governments<br />
are not always consolidated at a central level or,<br />
when they are, often lack details, such as how much<br />
is specifically spent on education. Development<br />
partners provide a large part of their contributions<br />
to the education sector outside of the recipient<br />
government’s budget. Non-government, communitybased<br />
<strong>and</strong> faith-based organizations often do not put<br />
their education expenditure <strong>and</strong> financial reporting<br />
information in the public domain.<br />
In addition to obtaining data from these sources,<br />
national teams have to complement this with other data<br />
collection, which may require significant unbudgeted<br />
resources. Ministries may not have the required capacity<br />
in statistical <strong>and</strong> economic analysis, which would make it<br />
difficult to use the NEA approach on a regular basis.<br />
The experience of the health sector could be beneficial.<br />
At the national level, in countries where national<br />
health accounts are used, the education ministry<br />
could learn from obstacles faced by health ministries,<br />
especially in terms of institutionalizing the process<br />
<strong>and</strong> mobilizing resources. At the international level,<br />
national health accounts have become a widely used<br />
tool with the backing of the World Health Organization<br />
(WHO) <strong>and</strong> several donors. Dialogue with WHO could<br />
help the education sector learn how to achieve similar<br />
commitment for NEAs from key actors.<br />
Countries seeking to adopt NEAs should embed<br />
them into national planning processes to ensure<br />
sufficient institutional <strong>and</strong> political support. More<br />
awareness is needed of the utility of education<br />
financing data for policy, planning <strong>and</strong> management.<br />
It is important for countries to follow the NEA<br />
methodology from the start, even if the actual exercise<br />
is done in stages, e.g. by starting in the first phase with<br />
government sources. In this way, a full set of accounts<br />
can eventually be published.<br />
The publication of the first international methodological<br />
guide <strong>and</strong> the experience built by the few countries<br />
2016 • GLOBAL EDUCATION MONITORING REPORT 345
20<br />
“<br />
In 2014, 51 out<br />
of 138 countries<br />
spent less than<br />
4% of GDP on<br />
education<br />
”<br />
that have taken the<br />
NEA approach have<br />
created momentum on<br />
which the international<br />
education community<br />
should build. It is often<br />
said that ‘the perfect is<br />
the enemy of the good’;<br />
not all implementation<br />
challenges can be resolved,<br />
especially in countries<br />
with weaker capacity.<br />
The key lesson that the<br />
NEA project brings to the Education 2030 agenda is its<br />
perspective. Planners need to look at education financing<br />
flows comprehensively. This approach holds the key<br />
for underst<strong>and</strong>ing who benefits from different funding<br />
sources, <strong>and</strong> for addressing equity <strong>and</strong> quality issues<br />
in education.<br />
IMPROVING FINANCIAL DATA<br />
To build strong NEAs, information on expenditure flows<br />
from the three main financing pillars – government,<br />
aid partners <strong>and</strong> households – needs to improve. This<br />
section covers key challenges.<br />
PUBLIC EXPENDITURE<br />
The two key indicators on public financing of education<br />
appear in the Education 2030 Framework for Action,<br />
which proposed two benchmarks as ‘crucial reference<br />
points’ (§105):<br />
■■<br />
allocate at least 4% to 6% of GDP to education, <strong>and</strong>/or<br />
■■<br />
allocate at least 15% to 20% of public expenditure<br />
to education.<br />
In 2014, the median global public education expenditure<br />
was 4.6% of GDP, i.e. within the range proposed by the<br />
framework. Expenditure varied from 2.8% in Caucasus<br />
<strong>and</strong> Central Asia to 5% in Europe <strong>and</strong> Northern America.<br />
In terms of country income group, low income countries<br />
spent 3.9% of GDP on education, at the low end of<br />
the range. If countries are taken as the unit, 51 of the<br />
138 countries with data spent less than 4% of GDP on<br />
education. Among them were 13 low income countries<br />
<strong>and</strong> 16 high income countries.<br />
Public education expenditure was 14.2% of total public<br />
expenditure in 2014, which was below the range proposed<br />
by the Framework for Action. Expenditure varied from<br />
12.1% in Europe <strong>and</strong> Northern America to 16.6% in sub-<br />
Saharan Africa. Low income countries as a group were at<br />
16.7%. Overall, 70 of the 132 countries with data allocated<br />
less than 15% of public expenditure to education,<br />
including 9 low income countries <strong>and</strong> 37 high income<br />
countries (Table 20.2).<br />
The formulation of the Framework for Action is not<br />
entirely clear. It is first of all inconsistent. On one h<strong>and</strong>,<br />
it refers to ranges (‘4% to 6%’) but at the same time it<br />
TABLE 20.2:<br />
Public education expenditure, by region <strong>and</strong> country income group, 2014<br />
Public education expenditure<br />
as % of GDP<br />
Number of countries<br />
that spent
20<br />
suggests the lower limit of the range as a minimum<br />
requirement (‘at least 4%’). Even if this inconsistency<br />
is ignored, the benchmark is open to two different<br />
interpretations (‘<strong>and</strong>/or’). Countries may meet one target<br />
while not meeting the other.<br />
Of the two options, the achievement of either of the<br />
two targets as a minimum condition is a more relevant<br />
requirement because it recognizes differing national<br />
contexts. For example, poorer countries may have low<br />
capacity for mobilizing domestic resources but high<br />
commitment to spend a larger share of their budget on<br />
education. Conversely, richer countries tend to raise<br />
more domestic resources but spend a lower share of the<br />
budget on education because the cohorts of school-age<br />
children are smaller.<br />
Among 132 of the 209 countries with data on both<br />
indicators, 35 spent less than 4% of GDP on education<br />
<strong>and</strong> allocated less than 15% of their total public<br />
expenditure on education. For example, Sri Lanka spent<br />
1.6% of GDP <strong>and</strong> 9.8% of total public expenditure on<br />
education (Figure 20.3).<br />
If spending is inefficient, more of it will not be the way<br />
to reach education targets. Yet it is equally the case<br />
that no country can achieve the international education<br />
targets if expenditure is kept very low. The purpose of<br />
this Framework for Action target is to highlight countries<br />
that clearly spend considerably below international<br />
norms – including countries not regularly reporting to<br />
the UIS, such as Myanmar (Box 20.1).<br />
Underst<strong>and</strong>ing the data gap<br />
Analysis of the key public education financing indicators<br />
not only draws attention to countries where expenditure<br />
is so low it compromises their chance to achieve 2030<br />
targets, but also reveals an erratic supply of information.<br />
For example, no more than 60% of countries have data<br />
on total education expenditure as a percentage of GDP<br />
for any given year since 2000. Coverage rates increase<br />
to about 70% for countries having data at least once in a<br />
three-year period. Moreover, data become available with<br />
a considerable lag: only 45% of countries had reported<br />
2012 data by 2016.<br />
On the positive side, the percentage of countries<br />
with expenditure data by level increased steadily over<br />
FIGURE 20.3:<br />
One in four countries falls below both international education financing benchmarks<br />
Public education expenditure as a share of GDP <strong>and</strong> as a share of total public expenditure, 2014<br />
30<br />
25<br />
Ethiopia<br />
Total public expenditure on education as share of total<br />
government expenditure (%)<br />
20<br />
15<br />
10<br />
C. A. R.<br />
D. R. Congo<br />
Bangladesh<br />
Ug<strong>and</strong>a<br />
Cambodia<br />
Sri Lanka<br />
Georgia<br />
Guatemala<br />
Chad<br />
Pakistan<br />
Guinea<br />
Romania<br />
Benin<br />
Afghanistan<br />
Lao PDR<br />
Burundi<br />
Niger<br />
Costa Rica<br />
Mozambique<br />
5<br />
South Sudan<br />
0<br />
0<br />
Source: UIS database.<br />
1 2 3 4 5 6<br />
Total public expenditure on education as share of GDP (%)<br />
7 8<br />
2016 • GLOBAL EDUCATION MONITORING REPORT 347
20<br />
BOX 20.1<br />
Ending a legacy of very low public spending on education in Myanmar<br />
Myanmar has historically allocated a very low share of its national resources to<br />
education. The scarce data that exist suggest that education spending hardly ever<br />
exceeded 1% of GDP throughout the 1990s <strong>and</strong> 2000s, a level that set Myanmar apart<br />
not only from its regional neighbours but also globally. About 70% of total education<br />
expenditure was borne by households.<br />
Part of the reason for Myanmar’s situation was a very low rate of domestic resource<br />
mobilization. This began to change in recent years. Tax revenue increased from 3.9% of<br />
GDP in 2011/12 to 7.1% in 2012/13, partly because a managed float exchange rate system<br />
was introduced, but also because tax administration improved. Natural resource revenue<br />
from gas sales <strong>and</strong> income from the sale of state property led to a further increase of<br />
tax revenue to over 8% in 2014/15. However, some of the gains were not sustainable, <strong>and</strong><br />
revenue from income tax remains very low at about 3% of GDP.<br />
The government has more than doubled the share of public expenditure allocated<br />
to education, from less than 5% to 13% – <strong>and</strong> in 2015/16, the combined share of<br />
education, health <strong>and</strong> other social services is expected for the first time to be greater<br />
than that of defence.<br />
In 2015, the share of public education expenditure exceeded 2% of GDP for the first<br />
time in at least two decades (Figure 20.4), though it has a long way to go to breach the<br />
recommended international threshold at 4%. In the 1970s, the country spent at times<br />
3% of GDP on education.<br />
FIGURE 20.4:<br />
Myanmar is making an effort to reach minimum benchmarks in<br />
education financing<br />
Public education expenditure as a share of GDP <strong>and</strong> of public expenditure,<br />
Myanmar, 2000–2014<br />
Total public expenditure on education as share of total<br />
government expediture (%)<br />
15<br />
10<br />
5<br />
0<br />
0<br />
2011<br />
2003<br />
2000<br />
2014, preliminary actuals<br />
2015, revised estimates<br />
1<br />
2 3 4<br />
Total public expenditure on education<br />
as share of GDP (%)<br />
Sources: IMF (2015); Myanmar Government (2015); Myanmar Ministry of Education (2014);<br />
OECD (2013f); UIS database; UNICEF (2013b); World Bank (2013b, 2015d); World Bank <strong>and</strong><br />
AusAid (2013).<br />
2000–2010, from 20% to 40% for at least primary <strong>and</strong><br />
secondary education (Figure 20.5). But values for all<br />
levels frequently do not add up to 100%, which hampers<br />
data interpretation.<br />
To estimate an indicator’s average at the level of a region<br />
or country income group, at least half the countries in<br />
the group need to have the data. Low coverage makes<br />
it difficult to estimate averages in regions, such as<br />
Northern Africa <strong>and</strong> Western Asia, <strong>and</strong> the Pacific.<br />
If it is difficult to establish the validity of average levels<br />
of education expenditure for the most recent year, it<br />
is even more difficult to show trends because fewer<br />
countries will have observations on two points in time.<br />
However, the evidence suggests an overall increase in<br />
both indicators of public education expenditure over the<br />
period, from 4% to 4.6% of GDP <strong>and</strong> from 13.8% to 15% of<br />
total public expenditure (Figure 20.6).<br />
It should also be noted that averages treat countries<br />
equally regardless of size. For example, the Eastern <strong>and</strong><br />
South-eastern Asia regional average is reported because<br />
14 of the 18 countries had data – but China was not<br />
among them. Conversely, if each observation is weighted<br />
by national GDP, then public education expenditure in<br />
Latin America <strong>and</strong> the Caribbean exceeded the global<br />
average at 5.5% of GDP.<br />
Beyond these two indicators, even less information<br />
is available. For example, data on teacher salaries in<br />
primary education as a share of current public<br />
education expenditure is available for only 80 countries,<br />
or 38% of the total.<br />
Addressing the data gap<br />
The key factor in ensuring availability of good<br />
quality data on education expenditure is good public<br />
expenditure management at the national level. The<br />
national education budget <strong>and</strong> expenditure reporting<br />
must be transparent. Education ministries cannot ensure<br />
this alone; it requires interventions across government.<br />
An overall attitude of openness regarding reporting of<br />
public education expenditure is critical. Fewer than 3 in 10<br />
of the countries scoring the lowest on the International<br />
Budget Partnership’s Open Budget Index reported data<br />
on public education expenditure as a percentage of GDP<br />
in 2012/13; at the two highest levels, however, almost 8 in<br />
10 did so (IBP, 2015).<br />
348<br />
CHAPTER 20 | FINANCE
20<br />
FIGURE 20.5:<br />
Information on even the most basic education financing<br />
indicators is often missing<br />
Percentage of countries with data on public education<br />
expenditure as a share of GDP, by education level, 2000–2014<br />
Countries with data (%)<br />
100<br />
90<br />
80<br />
70<br />
60<br />
50<br />
40<br />
30<br />
20<br />
10<br />
0<br />
2000<br />
2001<br />
2002<br />
2003<br />
2004<br />
2005<br />
2006<br />
2007<br />
2008<br />
2009<br />
2010<br />
2011<br />
Total<br />
Pre-primary<br />
Primary<br />
Secondary<br />
Tertiary<br />
Source: GEM Report team analysis based on information in the UIS database.<br />
2012<br />
2013<br />
2014<br />
The Public Expenditure <strong>and</strong> Financial Accountability<br />
(PEFA) programme, a multi-agency partnership, outlined<br />
7 pillars <strong>and</strong> 31 performance indicators of an ‘open <strong>and</strong><br />
orderly’ public financial management system to guide<br />
country assessments (PEFA, 2016). Areas of interest<br />
are captured in indicators related to the transparency<br />
pillar, such as budget classification, resources received<br />
by service delivery units <strong>and</strong> public access to key<br />
fiscal information.<br />
Inevitably, the national context affects the quality<br />
of public financial management. An analysis of PEFA<br />
assessments in 93 countries carried out over 2006–2010<br />
found that the public financial management system<br />
score was negatively associated with state fragility,<br />
while quality was positively associated with per capita<br />
income <strong>and</strong> economic growth as well as external<br />
capacity-building support (de Renzio et al., 2010).<br />
One example of external support in many developing<br />
countries is the introduction of financial management<br />
information systems to increase budget credibility<br />
through comprehensive reporting <strong>and</strong> information<br />
transparency. The United Republic of Tanzania has been<br />
commended for having established the most successful<br />
FIGURE 20.6:<br />
Expenditure on education has increased since 2000<br />
6<br />
a. Education expenditure as a share of GDP, by country income<br />
group, 2000 <strong>and</strong> 2014<br />
20<br />
b. Education expenditure as a share of total public expenditure,<br />
by country income group, 2000 <strong>and</strong> 2014<br />
5<br />
Education expenditure as share of GDP (%)<br />
4<br />
3<br />
2<br />
1<br />
2000<br />
2014<br />
Education expenditure as share of total<br />
government expenditure (%)<br />
15<br />
10<br />
5<br />
2000<br />
2014<br />
0<br />
World<br />
Low<br />
income<br />
Lower<br />
middle<br />
income<br />
Upper<br />
middle<br />
income<br />
High<br />
income<br />
0<br />
World<br />
Low<br />
income<br />
Lower<br />
middle<br />
income<br />
Upper<br />
middle<br />
income<br />
High<br />
income<br />
Notes: All values shown are medians for countries with data in both 2000 <strong>and</strong> 2014. Medians for all country groups except low income countries are based on data<br />
from less than 50% of countries.<br />
Source: GEM Report team analysis based on information in the UIS database.<br />
2016 • GLOBAL EDUCATION MONITORING REPORT 349
20<br />
information system in sub-Saharan Africa since 1994,<br />
<strong>and</strong> upgrades have further strengthened its budget<br />
preparation (Diamond <strong>and</strong> Khemani, 2005; World Bank,<br />
2015c). Information on public expenditure data for<br />
education started being reported regularly in 2004.<br />
Support by international<br />
agencies can facilitate<br />
Open public financial<br />
reporting of existing<br />
management systems data. For example, since<br />
are associated with the 1990s, World Bankled<br />
public expenditure<br />
economic growth<br />
reviews, in partnership<br />
with finance ministries,<br />
often analyse the level<br />
<strong>and</strong> pattern of public education expenditure <strong>and</strong> assess<br />
effectiveness <strong>and</strong> equity.<br />
Since 2009 another World Bank initiative, BOOST, has<br />
compiled public expenditure data from treasury systems<br />
using national budget classification codes in 16 countries,<br />
divided by government level, administrative unit,<br />
economic <strong>and</strong> functional classification.<br />
Similarly, since 2003, the IIEP, often jointly with the World<br />
Bank, has led country status reports in 22 sub-Saharan<br />
African countries. These in-depth diagnostic tools for<br />
national education systems involve intensive data<br />
collection <strong>and</strong> provide capacity-building for national teams.<br />
Concern over the timeliness of public education<br />
expenditure information has sometimes led to a<br />
search for alternatives. The assumption has been<br />
that the bottleneck is data processing, rather than<br />
availability of data in the national financial management<br />
system. Government Spending Watch, an initiative<br />
of Development Finance International, a non-profit<br />
organization funded by Oxfam, tracks spending in<br />
education <strong>and</strong> other sectors using public <strong>and</strong> semi-public<br />
budget-related documents. However, this information<br />
may lack the quality assurance that an international<br />
agency can provide.<br />
All these efforts serve different purposes <strong>and</strong> respond<br />
to different needs. However, they are too infrequent to<br />
substitute for missing data (UIS, 2016c). And, as they<br />
do not follow a systematic format, they do not ensure<br />
comparability across countries <strong>and</strong> are therefore not a<br />
long-term solution to the problem of data gaps.<br />
Following the example of WHO in the health sector,<br />
greater engagement with the IMF <strong>and</strong> its Government<br />
Finance Statistics could be helpful (Seiferling, 2013).<br />
However, the IMF does not prioritize data collection<br />
in individual sectors. Reform of public financial<br />
management systems thus remains the main answer to<br />
the problem of low financial data availability.<br />
EQUITY IN PUBLIC EXPENDITURE<br />
A review of public expenditure cannot be limited<br />
to quantity but must extend to the three critical<br />
dimensions of quality: efficiency, effectiveness <strong>and</strong><br />
equity. This section focuses on equity, as one proposed<br />
thematic indicator is the ‘extent to which explicit<br />
formula-based policies reallocate education resources<br />
to disadvantaged populations’. The objective of equity<br />
can be well served by clear <strong>and</strong> transparent criteria for<br />
allocating resources that take into account school <strong>and</strong><br />
student needs (Levacic, 2008; Fazekas, 2012).<br />
This indicator can be monitored systematically across<br />
countries. For example, a review of European school<br />
financing systems identified differences in the extent to<br />
which formula funding was used, alone or in combination<br />
with other rules, to allocate resources to schools. Five<br />
countries, including Bulgaria, Norway <strong>and</strong> Spain, used a<br />
funding formula to allocate all resources to schools either<br />
directly or through local authorities. Other countries<br />
used this approach to allocate only staff, operational or<br />
capital resources. Yet others, such as Greece, Hungary<br />
<strong>and</strong> Portugal, do not use any formula at all (European<br />
Commission/EACEA/Eurydice, 2014).<br />
In its current formulation, however, the indicator is<br />
restrictive. Funding formula mechanisms are only one<br />
of several policy tools that governments can use to<br />
help disadvantaged students <strong>and</strong> schools overcome<br />
challenges. Moreover, funding formula mechanisms<br />
may be suitable in some countries but not in others,<br />
depending on national context.<br />
What matters is whether countries make sufficient use<br />
of various education financing policy tools to address<br />
equity concerns. Information is limited on the extent to<br />
which they do so. The World Bank’s Systems Approach<br />
for Better Education Results (SABER) has a module on<br />
school financing that includes questions on resources<br />
for students from disadvantaged backgrounds, <strong>and</strong> a<br />
350<br />
CHAPTER 20 | FINANCE
20<br />
new module on equity <strong>and</strong> inclusion (World Bank, 2013c;<br />
2016c). But neither has been tested extensively at the<br />
country level. Benchmarking <strong>and</strong> other mechanisms are<br />
needed to assess <strong>and</strong> compare efforts between countries.<br />
For the purpose of this report, a framework with five<br />
main questions was used as a basis for assessing the<br />
extent to which education financing policies in 10<br />
countries 1 compensated for disadvantage in education<br />
(Table 20.3). The answers were based on analysis of<br />
secondary data on laws, policies <strong>and</strong> programmes<br />
relating to coverage, targeting <strong>and</strong> other areas<br />
(Makarova, 2016).<br />
A common finding was that provision of policies <strong>and</strong><br />
programmes addressing disadvantage in education was<br />
not integrated. Although some countries had made an<br />
effort to link social <strong>and</strong> education support programmes,<br />
none had an integrated policy document providing<br />
information on all available mechanisms targeting<br />
disadvantage in education.<br />
While all countries in the sample had made an explicit<br />
general commitment in laws <strong>and</strong> strategies to address<br />
disadvantage in education, fewer had detailed policies<br />
<strong>and</strong> regulations, such as the decree on the normative<br />
cost per student <strong>and</strong> the st<strong>and</strong>ard voucher in Georgia,<br />
<strong>and</strong> the regulation on calculation of the education<br />
subvention in Pol<strong>and</strong>.<br />
All 10 countries had adopted at least one policy or<br />
programme to provide special funding to disadvantaged<br />
students <strong>and</strong> schools. Diverse interventions aimed<br />
to improve dem<strong>and</strong> for education, including social<br />
protection programmes, such as conditional cash<br />
transfers (e.g. PKH in Indonesia, PATH in Jamaica,<br />
Juntos in Peru), school meals, scholarships (e.g. the<br />
BSM Scholarship programme in Indonesia <strong>and</strong> the<br />
National Scholarship Program in Pol<strong>and</strong>), disability<br />
benefits (e.g. in Sri Lanka), universal <strong>and</strong> targeted child<br />
benefit programmes (e.g. in the Netherl<strong>and</strong>s) <strong>and</strong> full<br />
or partial subsidies for school supplies, transport <strong>and</strong><br />
boarding (e.g. in Morocco) (Box 20.2).<br />
To improve the supply of education, formula funding<br />
was used to provide additional resources for students<br />
with special education needs (e.g. in Jamaica <strong>and</strong> the<br />
Netherl<strong>and</strong>s) <strong>and</strong> to cover higher operating costs of small<br />
<strong>and</strong> remote schools (e.g. in Georgia <strong>and</strong> Sri Lanka). There<br />
are inclusive education programmes, special training for<br />
teachers in disadvantaged schools, school rehabilitation,<br />
<strong>and</strong> education programmes targeting specific groups<br />
TABLE 20.3:<br />
A framework to assess country commitment to equity through financing<br />
Question<br />
1 Is the legal framework explicit on the obligation of the government to address disadvantage in<br />
education?<br />
2 a. Is the provision of universal <strong>and</strong> free pre-primary, primary <strong>and</strong> secondary education a directive<br />
principle of state policy?<br />
b. In the case of payments that can have a detrimental impact on the education opportunity of<br />
disadvantaged children, does the government offer waivers?<br />
3 a. Are there policies to provide more resources to students from disadvantaged households?<br />
b. …<strong>and</strong> if so what share of total public education <strong>and</strong>/or social protection spending is being<br />
reallocated…<br />
c. .…<strong>and</strong> what percentage of the student population does it reach?<br />
d. How are targeting decisions made...<br />
e. ...<strong>and</strong> is the success of targeting monitored <strong>and</strong> evaluated?<br />
4 a. Are there policies to provide more resources to disadvantaged schools?<br />
b. .…<strong>and</strong> if so what share of total public education spending is being reallocated<br />
c. .…<strong>and</strong> what percentage of schools does it reach?<br />
d. How are targeting decisions made…<br />
e. ...<strong>and</strong> is the success of targeting monitored <strong>and</strong> evaluated?<br />
Elaboration<br />
The commitment would be considered strong if the needs of several disadvantaged groups were addressed<br />
through laws, as well as specific regulations on school funding.<br />
The commitment would range from minimum when fees exist in pre-primary, primary <strong>and</strong> secondary<br />
education to maximum if there is free universal education at each level.<br />
The commitment would be highest if there were waivers or other mechanisms to compensate for costs such<br />
as textbooks, school transport or uniforms.<br />
The commitment would be strong if there were policies that provided resources to students from<br />
disadvantaged households, such as cash transfers, grants, scholarships <strong>and</strong> in-kind incentives such as<br />
school meals.<br />
i.e. what is the depth of the intervention<br />
i.e. what is the coverage of the intervention<br />
i.e. is there any targeting, are criteria clear <strong>and</strong> can records be checked<br />
i.e. does the country have a well-developed M&E system analysing beneficiaries <strong>and</strong> feeding into policy<br />
The commitment would be strong if schools that are disadvantaged due to their student intake, size or<br />
location get extra resources to compensate for their higher costs, through weighted per-pupil funding rules.<br />
i.e. what is the depth of the intervention<br />
i.e. what is the coverage of the intervention<br />
i.e. is there any targeting, are criteria clear <strong>and</strong> can records be checked<br />
i.e. does the country have a well-developed M&E system analysing beneficiaries <strong>and</strong> feeding into policy<br />
5 Are there policies to provide more resources to disadvantaged regions? The commitment would be strong if decentralization of education responsibilities to lower tiers of<br />
government were accompanied by additional financial support to regions whose relatively fewer resources<br />
put them at a disadvantage.<br />
Source: Makarova (2016).<br />
2016 • GLOBAL EDUCATION MONITORING REPORT 351
20<br />
BOX 20.2<br />
(e.g. intercultural bilingual education policies for<br />
indigenous <strong>people</strong> in Peru <strong>and</strong> the Programme for the<br />
Roma community in Pol<strong>and</strong>).<br />
Three countries provide useful examples in examining<br />
overall how countries address equity through financing. The<br />
policy of the Netherl<strong>and</strong>s on disadvantage in education is<br />
not only integrated, comprehensive <strong>and</strong> systemic, but also<br />
strongly focused on prevention, early detection <strong>and</strong> early<br />
support mechanisms for vulnerable children, with emphases<br />
on measurement <strong>and</strong> better cooperation between<br />
professionals (Hilverdink, 2013). Between 2003 <strong>and</strong> 2012,<br />
the socio-economic status of 15-year-olds became a weaker<br />
predictor of performance in mathematics (OECD, 2013b).<br />
Promoting equity through education financing policies in Morocco<br />
In Morocco, free universal education to age 15 is a principle of state policy. Equity is<br />
enshrined in the foundation education policy texts: the 1999 National Education <strong>and</strong><br />
Training Charter <strong>and</strong> the 2011 Constitution. Yet, households were still bearing significant<br />
costs that impeded their children’s schooling. The 2009–2012 National Education<br />
Emergency Plan <strong>and</strong> the 2013–2016 Education Action Plan tried to improve equity<br />
through financing policies. The former included subsidies for transport <strong>and</strong> boarding <strong>and</strong><br />
free school lunches.<br />
In addition, the Tayssir cash transfer programme provides direct financial support to poor<br />
rural families to reduce dropout <strong>and</strong> improve school attendance. Labelling the transfers<br />
as education support without making them strictly conditional has led to large gains in<br />
school participation. In 2013/14, 825,000 students (13% of the total population of primary<br />
<strong>and</strong> secondary school age) benefited from the Tayssir programme. By contrast, the cash<br />
transfer programme for education in Tunisia covered fewer than 80,000 children in 2013.<br />
Close to 4 million students have also benefited from the One Million Schoolbags initiative,<br />
which targets poorer first grade students. Over half the total budget for social support to<br />
education was directed at these two programmes in 2014–2015.<br />
Despite improvement towards gender parity in primary education since 2000 in<br />
Morocco, girls’ enrolment in secondary education is lagging due to cultural obstacles as<br />
well as access <strong>and</strong> quality issues in rural areas. In response, the government developed<br />
a strategy to construct dedicated schools <strong>and</strong> boarding facilities. The Ministry of<br />
National Education <strong>and</strong> Vocational Training also identified criteria for targeting the most<br />
disadvantaged schools, including areas with high levels of dropout <strong>and</strong> low income<br />
populations. An evaluation of the Emergency Plan in 2012 showed impressive progress<br />
in developing education services <strong>and</strong> ensuring more equitable access, particularly in<br />
rural <strong>and</strong> disadvantaged areas. A development that will facilitate further evaluations is<br />
the establishment of a monitoring programme through the longitudinal survey of the<br />
National Observatory of Human Development.<br />
Source: Benhassine et al. (2015), UNESCO (2015c), UNICEF (2014g), <strong>and</strong> World Bank (2014b).<br />
Samoa has made an effort to address the needs of<br />
disadvantaged students through the Samoa School Fees<br />
Grant Scheme, which removed primary <strong>and</strong> secondary<br />
education fees <strong>and</strong> covered all schools’ operating<br />
costs with grants to help them meet minimum service<br />
st<strong>and</strong>ards (SSFGS, 2010). However, the programme’s longterm<br />
prospects need to be secured, as it is mainly funded<br />
by international donors. In addition, the country lacks<br />
direct social protection programmes for disadvantaged<br />
households <strong>and</strong> children (Amosa, 2012).<br />
In the Democratic Republic of Congo, the government<br />
developed a mechanism for equalizing fiscal transfers<br />
between provinces. It also abolished fees for grades 1–5<br />
in 2011. However, only 68% of teachers were registered on<br />
the payroll in 2013, with the remaining teachers still being<br />
paid by households through so-called motivation fees<br />
(World Bank, 2015e). Household out-of-pocket payments<br />
accounted for 64% of total expenditure in primary<br />
education in 2012 (UNICEF, 2015b). In response to these<br />
challenges, the government produced its Education <strong>and</strong><br />
Training Sector Strategy 2016–2025 with equity as one of<br />
three strategic axes (D. R. Congo Government, 2015). Key<br />
actions include the expansion of classroom construction<br />
in remote areas, the abolition of fees at grade 6 <strong>and</strong> for<br />
the end of primary cycle examination, <strong>and</strong> improvements<br />
in salary payments (GPE, 2016).<br />
Comparing the equity focus of national education financing<br />
policies across countries is feasible. However, considerable<br />
effort will be required in introducing a process, agreeing<br />
on a framework <strong>and</strong> actually carrying out an assessment.<br />
To get countries on board, the emphasis should be on<br />
establishing a peer review mechanism through which<br />
they can learn from each other. This is discussed in more<br />
detail in the next chapter, on system indicators.<br />
AID EXPENDITURE<br />
Government is the main source of education expenditure.<br />
However, as cost projections in the 2015 GMR showed,<br />
external financing remains vital for low income countries.<br />
The financing gap was estimated at 42% of the total cost<br />
of reaching the new targets, assuming the countries<br />
could increase domestic resource mobilization <strong>and</strong><br />
ensure that 20% of public expenditure was allocated to<br />
education (UNESCO, 2015i).<br />
It is not surprising that countries look to external<br />
financing to fill this gap. Aid to basic <strong>and</strong> secondary<br />
education in low income countries would have to<br />
352<br />
CHAPTER 20 | FINANCE
20<br />
“<br />
There is a 42% financing gap for reaching the new targets<br />
in low income countries<br />
”<br />
rise least sixfold but the gap could be filled if countries<br />
on the OECD Development Assistance Committee<br />
(DAC) <strong>and</strong> selected non-DAC donors (Brazil, China,<br />
India, Kuwait, Qatar, the Russian Federation, Saudi<br />
Arabia, South Africa <strong>and</strong> the United Arab Emirates)<br />
dedicated 0.7% of their gross national income (GNI)<br />
to aid – a longst<strong>and</strong>ing target for international aid<br />
levels – <strong>and</strong> allocated 10% of their aid to basic <strong>and</strong><br />
secondary education.<br />
However, data from the OECD-DAC Creditor Reporting<br />
System (CRS), the main global platform for reporting<br />
aid to education, suggest that the outlook for aid is<br />
unfavourable. Since 2005, total aid flows have fluctuated<br />
at around 0.3% of donor countries’ GNI. With developed<br />
countries growing slower than developing countries<br />
since 2000, aid is declining in relative importance in the<br />
latter. In addition, the share of aid to education in total<br />
aid fell from 10% in 2010 to 8% in 2014.<br />
Overall, since peaking in 2010, total aid to education<br />
declined by 8% to US$13.1 billion in 2014 (Figure 20.7).<br />
Aid to basic education is 14% below its 2010 levels; in<br />
sub-Saharan Africa it is down by 22%. However, aid to<br />
secondary education increased by 14% (Table 20.4).<br />
Targeting aid to countries in need<br />
The share of total aid to education allocated to low income<br />
countries has been identified as a thematic indicator for<br />
the equity-focused target 4.5. Various options can be<br />
considered for monitoring this indicator. One is to<br />
use the 2015 World Bank income classification <strong>and</strong><br />
FIGURE 20.7:<br />
Aid to education has yet to return to 2010 levels<br />
Total aid to education disbursements, 2002–2014<br />
16<br />
Total aid to basic education<br />
Constant US$ 2014 billions<br />
14<br />
12<br />
10<br />
8<br />
6<br />
4<br />
2<br />
Total aid to secondary education<br />
Total aid to post-secondary education<br />
11.0<br />
9.8<br />
8.9<br />
8.5<br />
4.9<br />
4.5<br />
6.5<br />
4.0<br />
4.2<br />
2.6<br />
1.6<br />
1.2<br />
1.3<br />
1.1<br />
1.0<br />
2.9 3.2 3.6<br />
4.1 4.5<br />
12.1<br />
11.9<br />
5.1 4.8<br />
1.9 2.0<br />
5.0 5.1<br />
14.0<br />
14.2<br />
5.4 5.6<br />
2.5 2.4<br />
6.1 6.2<br />
13.6<br />
5.4<br />
2.2<br />
5.9<br />
12.8<br />
5.2<br />
2.3<br />
5.3<br />
13.6<br />
5.3<br />
2.8<br />
5.6<br />
13.1<br />
4.9<br />
2.8<br />
5.3<br />
0<br />
2002<br />
2003 2004 2005 2006 2007 2008 2009 2010 2011 2012 2013 2014<br />
Source: GEM Report team analysis based on information in the OECD CRS database.<br />
2016 • GLOBAL EDUCATION MONITORING REPORT 353
20<br />
focus on its 32 low income countries, all but 6 of<br />
which are in sub-Saharan Africa. By this measure, low<br />
income countries received 22% of total aid <strong>and</strong> 28%<br />
of total aid to basic education in 2014, <strong>and</strong> the shares<br />
have remained constant for 10 years (Figure 20.8).<br />
The percentages are slightly higher if aid unallocated<br />
by income group is excluded. Note that the definition<br />
FIGURE 20.8:<br />
The share of aid to education to low income <strong>and</strong> least<br />
developed countries has remained constant<br />
Share of low income <strong>and</strong> least developed countries in total aid to<br />
education <strong>and</strong> to basic education disbursements, 2002–2014<br />
%<br />
50<br />
45<br />
40<br />
35<br />
30<br />
25<br />
20<br />
15<br />
10<br />
5<br />
0<br />
2002<br />
TABLE 20.4:<br />
Aid disbursements to education, by region <strong>and</strong> income level, 2010 <strong>and</strong> 2014<br />
Total aid<br />
to education<br />
Constant 2014 US$ millions<br />
Total aid<br />
to basic education<br />
Constant 2014 US$ millions<br />
Total aid<br />
to secondary education<br />
Constant 2014 US$ millions<br />
2010 2014 2010 2014 2010 2014<br />
World 14 218 13 055 6 210 5 330 2 444 2 782<br />
Low income 3 213 2 810 1 701 1 509 682 646<br />
Lower middle income 5 482 5 504 2 631 2 267 1 032 1 400<br />
Upper middle income 2 935 2 655 700 694 338 350<br />
High income 664 158 281 41 240 60<br />
Unallocated by income 1 925 1 927 898 818 152 326<br />
Caucasus <strong>and</strong> Central Asia 284 213 86 47 67 37<br />
Eastern <strong>and</strong> South-eastern Asia 1 957 503 556 110 269 271<br />
Europe <strong>and</strong> Northern America 497 1,601 94 420 68 75<br />
Latin America <strong>and</strong> the Caribbean 1 180 882 476 306 237 175<br />
Northern Africa <strong>and</strong> Western Asia 2 014 2 108 810 889 238 292<br />
Pacific 242 228 125 105 59 37<br />
Southern Asia 2 278 2 687 1 300 1 234 362 800<br />
Sub-Saharan Africa 3 978 3 233 1 913 1 489 856 788<br />
Overseas territories 510 72 237 24 217 41<br />
Unallocated by region or country 1 277 1 528 613 705 72 265<br />
Source: GEM Report team analysis based on information in the OECD CRS database.<br />
2004<br />
2006<br />
2008<br />
2010<br />
2012<br />
2014<br />
LDCs, basic education<br />
LDCs, education<br />
LICs, basic education<br />
LICs, education<br />
Note: LDCs = least developed countires; LICs = low income countries<br />
Source: GEM Report team analysis based on information in the OECD CRS<br />
database.<br />
of aid to education used by the GEM Report includes<br />
20% of direct budget support, which is assumed to be<br />
allocated to education.<br />
One challenge with this approach is that the definition<br />
of low income countries is changing. The number of<br />
low income countries according to the World Bank<br />
classification fell from 63 in 2000 (when the threshold<br />
income level was US$755 per capita) to 32 in 2015 (by<br />
which time the threshold income level had risen to<br />
US$1,035). Between 2014 <strong>and</strong> 2015, four more countries<br />
‘graduated’ into lower middle income status (Bangladesh,<br />
Kenya, Myanmar <strong>and</strong> Tajikistan), while one slipped back<br />
into low income status (South Sudan).<br />
An alternative option is to focus on least developed<br />
countries, a group whose membership changes less<br />
frequently. In December 2015, it consisted of 48<br />
countries, of which only Equatorial Guinea <strong>and</strong> Vanuatu<br />
are expected to exit by 2020. Least developed countries<br />
received 30% of total aid <strong>and</strong> 37% of total aid to basic<br />
education in 2014.<br />
Neither of these measures indicates need. One measure<br />
of need is the percentage of those who do not complete<br />
primary school. For example, low income countries<br />
received 28% of total aid to basic education while<br />
accounting for 43% of children who do not complete<br />
primary school.<br />
An important question is which donors prioritize aid to<br />
low income countries. One way to establish this is to<br />
compare the donor’s share of aid to education to low<br />
income countries with its share of aid to education to<br />
all countries. If the former is higher than the latter, the<br />
donor prioritizes low income countries.<br />
For example, the United Kingdom has prioritized<br />
low income countries for the past few years <strong>and</strong> has<br />
in fact increased its relative focus. In 2012–2014, it<br />
accounted for 17% of total aid to education for low<br />
income countries but 10% of total aid to education for<br />
all countries. By contrast, Australia accounted for 0.3%<br />
of total aid to education for low income countries but<br />
as much as 4% of total aid to education to all countries,<br />
as its aid programme focuses on Asia <strong>and</strong> the Pacific<br />
<strong>and</strong> not sub-Saharan Africa, where most low income<br />
countries are located (Figure 20.9).<br />
One weakness in estimating the extent to which aid to<br />
education (or an individual donor) targets low income<br />
354<br />
CHAPTER 20 | FINANCE
20<br />
countries is that estimates exclude about 15% of total<br />
aid to education, which is not assigned to any particular<br />
country. Much of this corresponds to disbursements by<br />
the Global Partnership for Education (GPE), a growing<br />
source of funding for education in low income countries.<br />
Donors’ contributions to the GPE are subsumed within<br />
their aid reporting to the CRS, <strong>and</strong> GPE disbursements<br />
are estimated through GPE records, not CRS records.<br />
Donors differ in how they report to the GPE: some report<br />
aid as going to recipient countries, others as aid through<br />
the World Bank as the implementing agency, <strong>and</strong> others<br />
through undisclosed channels, of which some are<br />
specified by region or country.<br />
The GPE disbursed US$524 million in 2014, of which<br />
two-thirds, or US$349 million, was directed at low<br />
income countries (GPE, 2015). For example, Australia<br />
appears to have disbursed only US$7 million in aid to<br />
basic education to low income countries in 2012–2014.<br />
However, it also disbursed US$88 million on average per<br />
year to the GPE over that period, of which two-thirds<br />
was likely to have gone to low income countries (GPE,<br />
2016). Omitting this growing financing flow risks biasing<br />
conclusions about aid targeting. Hence, it is important<br />
for the CRS to include the GPE as a reporting entity.<br />
Monitoring other trends in aid to education<br />
When figures for official development assistance (ODA)<br />
are reported, the impression is often given that aid is<br />
a single transfer of resources to developing countries.<br />
In practice, it is diverse, using a range of forms, modes,<br />
instruments <strong>and</strong> channels. One trend worth monitoring<br />
relates to types of aid: loans are growing in relation to<br />
grants. Another involves aid channels, namely the extent<br />
to which aid passes through governments.<br />
Type of aid: grants <strong>and</strong> loans. Grants made up 83% of total<br />
aid to education in 2014, a larger share than that of all aid<br />
across sectors (74%). Low income countries receive<br />
84% of their total aid, as well as their total aid to<br />
education, in the form of grants, with the largest<br />
recipients being Ethiopia, Mozambique <strong>and</strong> Nepal<br />
(Figure 20.10). By contrast, lower middle income<br />
countries traditionally receive a larger proportion of<br />
their education aid in the form of loans.<br />
Between 2007 <strong>and</strong> 2014, within total ODA flows<br />
from OECD-DAC members, loans increased by<br />
122% while grants grew by 21%. It will be important to<br />
FIGURE 20.9:<br />
There are differences in the focus on low income countries across<br />
donors <strong>and</strong> over time<br />
Ratio of donor share of total aid to education to low income countries over donor<br />
share of total aid to education to all countries, top ten donors, 2002–2004,<br />
2008–2010 <strong>and</strong> 2012–2014<br />
Donor share of total aid to education to low income countries/<br />
Donors share of total aid to education<br />
2.5<br />
2.0<br />
1.5<br />
1.0<br />
0.5<br />
0.0<br />
Canada<br />
2002–2004 2008–2010 2012–2014<br />
In the period 2012–2014, the United Kingdom accounted<br />
for 17% of total aid to education to low income countries<br />
<strong>and</strong> 10% of total aid to education<br />
United Kingdom<br />
World Bank<br />
United States<br />
Other<br />
Japan<br />
EU institutions<br />
France<br />
Germany<br />
Netherl<strong>and</strong>s<br />
Australia<br />
track loan agreements per country <strong>and</strong> lender, including<br />
by non-OECD donors, to monitor implications of this<br />
trend. There is a risk that increasing borrowing could<br />
begin to crowd out spending on education <strong>and</strong> other<br />
social sectors.<br />
Channels of aid: through or bypassing government. In low<br />
income, fragile <strong>and</strong> conflict-affected countries, donors<br />
often bypass government aid disbursement systems,<br />
partly as a result of concerns over capacity. Out of<br />
total aid, 66% was delivered through government in<br />
lower middle income countries in 2014, compared with<br />
52% in low income countries, where NGOs, civil society<br />
organizations <strong>and</strong> multilateral agencies are a more<br />
common delivery channel (36%).<br />
More priority to low<br />
income countries<br />
Less priority to low<br />
income countries<br />
Note: The top ten donors are defined on the basis of their total aid to education disbursements<br />
in 2002–2014.<br />
Source: GEM Report team analysis based on information in the OECD CRS database.<br />
2016 • GLOBAL EDUCATION MONITORING REPORT 355
20<br />
FIGURE 20.10:<br />
Loans are a considerable part of official development assistance,<br />
even in education<br />
Share of official development assistance (ODA) disbursements <strong>and</strong> other<br />
official flows, by type of aid, 2014<br />
%<br />
100<br />
80<br />
60<br />
40<br />
20<br />
0<br />
Low income<br />
countries<br />
Total aid<br />
Lower middle<br />
income countries<br />
Low income<br />
countries<br />
Total aid to education<br />
ODA grants ODA loans Equity investments<br />
Source: GEM Report team analysis based on OECD CRS data.<br />
Lower middle<br />
income countries<br />
Similarly, aid to education channelled through NGOs, civil<br />
society organizations <strong>and</strong> multilateral agencies is 26%<br />
for low income countries – more than double the share in<br />
lower middle income countries (12%). It will be important<br />
to track the extent to which governments increase in<br />
importance as a channel of aid in the poorest countries.<br />
Humanitarian aid<br />
Humanitarian aid makes up only a small share of the<br />
external financing countries receive for education. In<br />
2014, the education sector received US$188 million<br />
in humanitarian aid, less than 1.5% of the amount of<br />
development aid disbursed for education that year.<br />
HOUSEHOLD EXPENDITURE<br />
The share of households in total education expenditure<br />
tends to be much higher in poorer than in richer countries.<br />
Reducing that share is key to achieving the new education<br />
targets. As an analysis of 50 countries in the 2015 GMR<br />
showed, households’ share of total education expenditure<br />
was 18% in high income countries, 34% in middle income<br />
countries <strong>and</strong> 49% in low income countries.<br />
While public expenditure as a share of GDP equals<br />
4.4% in low income countries <strong>and</strong> 4.8% in high income<br />
countries, the addition of household expenditure would<br />
reduce <strong>and</strong> could even reverse the gap in total education<br />
expenditure between the two groups. This highlights a<br />
key challenge: not only to improve the level of national<br />
support to education but also to distribute this cost<br />
between households <strong>and</strong> government. That is why an<br />
NEA approach could challenge established views about<br />
the relative efforts countries make to support education.<br />
:;0+1?@"5)7,3"<br />
>?@"A27,13"<br />
Information on household expenditure is available<br />
in most countries. Using the online catalogue of<br />
the International Household Survey Network <strong>and</strong><br />
information available on websites of national statistical<br />
agencies, analysis for this report of all 142 low <strong>and</strong><br />
FIGURE 20.11:<br />
Education remains an underprioritized <strong>and</strong> underfunded<br />
sector of humanitarian aid<br />
Selected statistics on consolidated <strong>and</strong> flash appeal requests<br />
<strong>and</strong> funding for the education sector, 2000–2015<br />
300<br />
250<br />
a. Total humanitarian aid to education<br />
245<br />
In 2015, out of a total of US$10.6 billion in humanitarian<br />
aid, the education sector received US$198 million (Figure<br />
20.11a). This is less than 1.9% of total funding, despite<br />
a target set by the UN Secretary-General’s Global<br />
Education First Initiative for education to receive at least<br />
4% of humanitarian aid (Figure 20.11b) (United Nations,<br />
2012). Education is at a double disadvantage because<br />
it not only receives the smallest share in humanitarian<br />
appeals, but what it does receive is consistently less than<br />
the average compared with requests: in 2015 the sector<br />
received 31% of its requests for humanitarian aid, compared<br />
with an average of 55% across all sectors (Figure 20.11c).<br />
US$ millions<br />
200<br />
198<br />
150<br />
100<br />
80<br />
50<br />
12<br />
0<br />
2000<br />
2001<br />
2002<br />
2003<br />
2004<br />
2005<br />
2006<br />
2007<br />
2008<br />
2009<br />
2010<br />
2011<br />
2012<br />
2013<br />
2014<br />
2015<br />
Source: Office for the Coordination of Humanitarian Affairs (2016).<br />
356<br />
CHAPTER 20 | FINANCE
20<br />
middle income countries suggests that the vast majority<br />
collect information on household education expenditure.<br />
However, it is rarely used: either policy-makers are<br />
unaware of its existence <strong>and</strong> importance or their<br />
capacity to analyse it <strong>and</strong> draw relevant conclusions is<br />
often limited.<br />
Household surveys could be improved. It is possible for<br />
information to be recorded for individual children <strong>and</strong><br />
easily linked to their education level <strong>and</strong>, in some cases,<br />
the grade, school (with an EMIS number) or sector (i.e.<br />
public or private). However, two-thirds of the countries<br />
only collected aggregate information for educationrelated<br />
expenditure incurred by the household. While<br />
there are statistical methods to use this information<br />
to estimate education expenditure per child <strong>and</strong> level<br />
of education (Tiyab <strong>and</strong> Ndabananiye, 2013), it would<br />
be preferable if household expenditure surveys were<br />
designed to collect information separately for each child.<br />
At least 99 of the 142 countries included questions<br />
in a national expenditure survey between 2008 <strong>and</strong><br />
2014 on items related to education; deeper analysis<br />
was possible for data from 82 countries. Of these 82<br />
countries’ questionnaires, all but 15 included questions<br />
on individual expenditure items. While the most common<br />
question concerned school fees, 59 countries collected<br />
information on textbooks, 49 countries on stationery<br />
<strong>and</strong> 33 countries on private tuition. At least 29 countries<br />
make survey data publicly available to the broader<br />
research community.<br />
In coming years, coordinated national action is needed<br />
on two fronts. First, education ministries need to work<br />
with national statistical agencies to build capacity,<br />
analyse existing data <strong>and</strong> use them as part of an effort<br />
to develop <strong>and</strong> improve NEAs. Second, survey questions<br />
must be formulated in a way that would make them<br />
more relevant for education policy. The establishment<br />
of the Task Force on St<strong>and</strong>ards for Education Spending<br />
Estimates based on Household Survey Data under the<br />
auspices of the UN Statistical Commission’s Inter-<br />
Secretariat Working Group on Household Surveys is a<br />
step in that direction.<br />
ENDNOTES<br />
1. The Democratic Republic of the Congo, Georgia, Indonesia, Jamaica,<br />
Morocco, the Netherl<strong>and</strong>s, Peru, Pol<strong>and</strong>, Samoa <strong>and</strong> Sri Lanka.<br />
b. Share of education in total humanitarian aid<br />
c. Share of humanitarian aid requests funded<br />
5<br />
[value]<br />
100<br />
4<br />
Target<br />
80<br />
3<br />
Food<br />
3<br />
60<br />
%<br />
2<br />
2<br />
1<br />
1<br />
1<br />
0<br />
2000<br />
2001<br />
2002<br />
2003<br />
2004<br />
2005<br />
2006<br />
2007<br />
2008<br />
2009<br />
2010<br />
2011<br />
2012<br />
2013<br />
2014<br />
2015<br />
%<br />
Total<br />
40<br />
20<br />
Education<br />
0<br />
2000<br />
2001<br />
2002<br />
2003<br />
2004<br />
2005<br />
2006<br />
2007<br />
2008<br />
2009<br />
2010<br />
2011<br />
2012<br />
2013<br />
2014<br />
2015<br />
2016 • GLOBAL EDUCATION MONITORING REPORT 357
21<br />
Hmong girls line up<br />
after their exercise<br />
during break time at<br />
a primary school in<br />
Lao Cai, Viet Nam.<br />
CREDIT: Nguyen Thanh Tuan/UNESCO<br />
KEY MESSAGES<br />
The quality of education systems <strong>and</strong> policies cannot be monitored through statistics alone.<br />
There are many global tools for monitoring education systems <strong>and</strong> policies, such as on free <strong>and</strong> compulsory<br />
education or teachers. However, in order for such tools to serve monitoring purposes, agreement on their scope,<br />
coverage <strong>and</strong> regularity as well as country ownership are necessary.<br />
While a global framework for reviewing education systems <strong>and</strong> policies might be desirable, in practice a<br />
regional approach is more practical. Regional partners have shared contexts, <strong>and</strong> a genuine interest in each<br />
other’s performance.<br />
Better coordination is needed between existing global <strong>and</strong> regional monitoring bodies on education system<br />
diagnostic tools to address gaps <strong>and</strong> reduce overlaps.<br />
358<br />
CHAPTER 21 | EDUCATION SYSTEMS
21<br />
CHAPTER<br />
21<br />
Education systems<br />
(selected system-related indicators from different targets)<br />
THEMATIC INDICATOR 2 – Administration of a nationally representative learning assessment<br />
(i) during primary (ii) at the end of primary <strong>and</strong> (iii) at the end of lower secondary education<br />
THEMATIC INDICATOR 19 – Extent to which explicit formula-based policies reallocate education<br />
resources to disadvantaged populations<br />
GLOBAL INDICATOR 4.7.1. – Extent to which (i) global citizenship education <strong>and</strong> (ii) education for<br />
sustainable development are mainstreamed in (a) national education policies, (b) curricula, (c) teacher<br />
education, <strong>and</strong> (d) student assessment<br />
2016 • GLOBAL EDUCATION MONITORING REPORT 359
21<br />
Diagnostic tools for monitoring education systems..............................................361<br />
Looking ahead...........................................................................................................................365<br />
This report has reviewed a wide range of proposed<br />
<strong>and</strong> potential indicators that are aimed at<br />
supporting efforts – by countries, regions <strong>and</strong> other<br />
stakeholders – to monitor progress towards all<br />
Sustainable Development Goals (SDG) targets that<br />
explicitly include education.<br />
To inform <strong>and</strong> guide education decision-making,<br />
<strong>and</strong> to underst<strong>and</strong> whether <strong>and</strong> why progress is being<br />
made, it is necessary to analyse factors at the<br />
level of national education systems, such as major<br />
legislation; policies on teachers, curriculum <strong>and</strong><br />
assessment; finance <strong>and</strong> governance practices; nonformal<br />
education programmes; <strong>and</strong> recent reforms.<br />
Certain aspects of systems <strong>and</strong> policies can be<br />
represented with straightforward quantitative indicators.<br />
For example, information on the existence <strong>and</strong> duration<br />
of free <strong>and</strong> compulsory education can be gleaned<br />
from official documents. In other instances – for<br />
example, in relation to the indicators above – measures<br />
are more complex <strong>and</strong> qualitative. They require both<br />
an examination of pertinent sources <strong>and</strong> the use of<br />
expertise <strong>and</strong> proper judgement.<br />
Take national learning assessments: for an indicator<br />
of them to be relevant, it is necessary to determine<br />
whether they are nationally representative <strong>and</strong><br />
sufficiently robust in design to provide valid <strong>and</strong><br />
reliable data that can be compared over time. Such<br />
information cannot be self-reported. In another<br />
example, the indicator on financing to promote<br />
equity is meant to determine, in part, how education<br />
policies address the needs of disadvantaged <strong>and</strong><br />
marginalized groups. And the indicator on country<br />
efforts to mainstream sustainable development<br />
<strong>and</strong> global citizenship topics in curricula or teacher<br />
education requires careful judgement related to the<br />
contents of education.<br />
Several concepts in the SDG 4 targets, such as gender<br />
equality <strong>and</strong> education quality, merit monitoring but are<br />
not covered by any of the proposed thematic indicators.<br />
Yet, systematic information related to such concepts<br />
can be compiled<br />
from various sources<br />
using a more<br />
Several concepts in<br />
qualitative approach.<br />
the education targets,<br />
such as gender equality,<br />
This chapter looks at<br />
selected approaches<br />
merit monitoring but<br />
to monitoring<br />
are not covered by<br />
aspects of education<br />
any of the proposed<br />
systems <strong>and</strong><br />
policies. Many<br />
thematic indicators<br />
organizations<br />
provide descriptive<br />
information <strong>and</strong><br />
conduct diagnostic assessments of education systems<br />
<strong>and</strong> policies. The assessments vary in scope, purpose,<br />
frequency, methodology <strong>and</strong> use, depending on<br />
organizations’ priorities. This can result in duplication<br />
of effort <strong>and</strong> gaps in country coverage. Improved<br />
coordination is needed, therefore, to strengthen the<br />
evidence base for monitoring at the regional <strong>and</strong><br />
global levels.<br />
Note that monitoring education systems does not in<br />
any way suggest that governments should be held to<br />
account for their policies <strong>and</strong> institutional arrangements.<br />
Rather, it is necessary to help explain why progress<br />
toward different aspects of the SDG agenda is, or is not,<br />
being achieved.<br />
The chapter also discusses circumstances in which<br />
countries more willingly share information on their<br />
education systems <strong>and</strong> policies. This is especially<br />
important at the regional level, where countries that<br />
may share traditions based on history, tradition <strong>and</strong><br />
culture can build useful frameworks for comparisons<br />
<strong>and</strong> learn from each other.<br />
360<br />
CHAPTER 21 | EDUCATION SYSTEMS
21<br />
DIAGNOSTIC TOOLS FOR<br />
MONITORING EDUCATION<br />
SYSTEMS<br />
A review of work by various international <strong>and</strong> regional<br />
agencies highlights a variety of approaches used to<br />
map education systems <strong>and</strong> provide useful comparative<br />
information for policy-makers.<br />
GLOBAL TOOLS<br />
In 1996, the UNESCO International Bureau of<br />
Education (IBE) established the World Data on<br />
Education (WDE) series. Originally, the WDE<br />
reproduced the National Reports on the Development<br />
of Education that member states submitted to IBE<br />
before each International Conference on Education.<br />
Later, national profiles were organized using a common<br />
structure to cover principles <strong>and</strong> general objectives;<br />
laws <strong>and</strong> other basic regulations; administration <strong>and</strong><br />
management; structure <strong>and</strong> organization by level;<br />
education processes, including learning achievement<br />
assessments; <strong>and</strong> teaching staff. The seventh edition in<br />
2011 covered about 160 countries (IBE, 2016b).<br />
The WDE has been a valuable source of information on<br />
education systems at the global level. However, resource<br />
constraints plagued its development. Initially, national<br />
governments verified the profiles before publication.<br />
However, by the third edition this process ceased.<br />
Country networks or digital platforms to regularly<br />
update profiles never emerged, so profiles quickly went<br />
out of date. In addition, the depth of coverage narrowed<br />
<strong>and</strong> eight areas were dropped, including current<br />
educational priorities, financing of education, <strong>and</strong> higher<br />
education.<br />
UNESCO has no current plan to update the series,<br />
although regional initiatives have been developed.<br />
For example, the Education Policy <strong>and</strong> Reform Unit at<br />
the Asia <strong>and</strong> Pacific Regional Bureau for Education in<br />
Bangkok recently began publishing system profiles as<br />
part of the National Education Systems <strong>and</strong> Policies in<br />
Asia-Pacific platform.<br />
UNESCO does provide at least three other examples<br />
of global databases that are regularly maintained.<br />
The UNESCO Institute for Statistics (UIS), as part<br />
of its annual education survey, collects data on the<br />
availability of compulsory <strong>and</strong> free education in every<br />
country. The UIS carries out quality assurance on these<br />
data, which are used in the statistical tables in the<br />
GEM Report annex. Information is collected by age or<br />
grade on whether<br />
countries legislate<br />
The UNESCO Institute for compulsory <strong>and</strong><br />
free education.<br />
for Statistics (UIS)<br />
collects data on the<br />
A second example,<br />
availability of compulsory initiated in 2014, is<br />
the Global Database<br />
<strong>and</strong> free education in<br />
on the Right to<br />
every country<br />
Education. Country<br />
data on fulfilment<br />
of the right to<br />
education are organized into five categories: ratification<br />
of normative instruments; observations from UN bodies<br />
such as the Universal Periodic Review under the Human<br />
Rights Council; constitutional frameworks; legislative<br />
<strong>and</strong> administrative frameworks; <strong>and</strong> education policies.<br />
The information is regularly updated with reports which<br />
countries submit to the UN, together with official national<br />
documents they are encouraged to share (UNESCO,<br />
2016b). Within the framework of its strategy on st<strong>and</strong>ardsetting<br />
instruments in the field of education, UNESCO<br />
intends to upgrade this database to an Observatory on<br />
the Right to Education as a research tool.<br />
A third example of a st<strong>and</strong>ardized – albeit more<br />
specialized – resource is the World Technical <strong>and</strong><br />
Vocational Education <strong>and</strong> Training (TVET) Database, an<br />
online repository developed by UNESCO-UNEVOC. It<br />
provides concise, reliable <strong>and</strong> up-to-date information<br />
on TVET systems worldwide to help officials, experts,<br />
stakeholders <strong>and</strong> researchers learn about trends <strong>and</strong><br />
challenges. The database comprises over 70 country<br />
profiles containing key descriptive information about<br />
national TVET systems, including national policies,<br />
strategies, structure, qualification frameworks <strong>and</strong><br />
reforms. They are compiled from various national <strong>and</strong><br />
international sources <strong>and</strong> validated by UNEVOC centres<br />
or other national authorities (UNESCO-UNEVOC, 2016).<br />
These system-level profiles cover a wide selection<br />
of countries but a narrow range of education policy<br />
issues. In general, they emphasize factual information<br />
communicated by countries, but omit important areas<br />
of education policy-making.<br />
One initiative aiming to create a global platform of<br />
system-level information is the World Bank’s Systems<br />
2016 • GLOBAL EDUCATION MONITORING REPORT 361
21<br />
Approach for Better Education Results (SABER), launched<br />
in 2011 to increase knowledge on education policies<br />
<strong>and</strong> institutions so as to improve underst<strong>and</strong>ing of<br />
the link between resources <strong>and</strong> outcomes. SABER<br />
collects ‘comparable data on policies <strong>and</strong> institutions of<br />
education systems around the world <strong>and</strong> benchmarks<br />
them against good practice’ (World Bank, 2013d; p. 5).<br />
To do this, it examines 13 domains of national education<br />
systems in a format that facilitates comparisons<br />
across countries. The domains are organized into four<br />
groups related to particular levels of education (such as<br />
early childhood <strong>and</strong> tertiary education), resources <strong>and</strong><br />
support mechanisms (such as teachers <strong>and</strong> learning<br />
assessments), governance <strong>and</strong> finance (such as school<br />
finance <strong>and</strong> autonomy), <strong>and</strong> cross-cutting areas (such as<br />
equity <strong>and</strong> inclusion) (Figure 21.1).<br />
An analytical framework underpins each domain <strong>and</strong><br />
draws attention to policy choices. It informs the<br />
development of a questionnaire, which is administered<br />
with the support of a contracted expert. Data on policies<br />
<strong>and</strong> institutions are then evaluated <strong>and</strong> rated on a<br />
four-level scale of system development (from ‘latent’ to<br />
‘advanced’) <strong>and</strong> aggregated into a national score. Once<br />
governments agree on the outcome, the results are<br />
published in a report <strong>and</strong> an online database. While over<br />
100 countries have been reviewed in at least one domain,<br />
the coverage for any individual domain is relatively<br />
limited. The highest coverage is for student assessment,<br />
with 36 countries participating. No country has been<br />
studied more than once in a particular domain.<br />
The World Bank plans to extend the project’s scope<br />
so that it captures not only policy intentions but also<br />
evidence of implementation. In addition, information<br />
from all the domains is being repackaged under six<br />
themes: st<strong>and</strong>ards, governance, resources, information,<br />
delivery <strong>and</strong> accountability. This new structure reflects<br />
the fact that it is not the disparate elements that<br />
constitute a system but the interactions <strong>and</strong> synergies<br />
between them (Abdul Hamid, 2016).<br />
SABER follows a tradition of diagnostic tools that the<br />
World Bank has deployed in several policy areas. The<br />
most notable is the Country Policy <strong>and</strong> Institutional<br />
Assessment, which assesses several policies, including<br />
education, <strong>and</strong> informs the Bank’s loan allocation<br />
decisions. In principle, SABER not only provides a rating<br />
but also engages countries in a process to improve their<br />
policies, notably by comparing policies of peers. That<br />
said, World Bank analytical <strong>and</strong> policy-rating frameworks<br />
tend to reflect Bank priorities. Moreover, education<br />
policies do not progress in a clear <strong>and</strong> unambiguous<br />
way; many studies have shown that different policies<br />
can be combined to achieve similar outcomes, depending<br />
on context. Thus, identifying universal education<br />
policies that can be prescribed in other contexts can<br />
be problematic.<br />
FIGURE 21.1:<br />
The SABER programme covers a wide range of aspects of education systems<br />
Policy domains covered in the World Bank Systems Approach for Better Education Results<br />
EDUCATION LEVELS<br />
Early childhood development (32)<br />
Workforce development (25)<br />
Tertiary education (0)<br />
QUALITY RESOURCES AND<br />
SYSTEMS SUPPORT<br />
Student assessment (36)<br />
Teachers (28)<br />
Information <strong>and</strong> communication<br />
technology (0)<br />
GOVERNANCE AND FINANCE<br />
Finance (4)<br />
School autonomy <strong>and</strong><br />
accountability (13)<br />
Education management<br />
information systems (4)<br />
School health <strong>and</strong> school feeding (8)<br />
Private sector (1)<br />
CROSS-CUTTING ISSUES<br />
RESILIENCE (7)<br />
EQUITY AND INCLUSION (0)<br />
Note: The number in brackets indicates the number of reviews carried out, according to the SABER website, as of May 2016.<br />
Source: World Bank (2016a).<br />
362<br />
CHAPTER 21 | EDUCATION SYSTEMS
21<br />
While SABER has extended the evidence base on<br />
education systems in many areas, it is not meant to<br />
serve as a global monitoring tool. For that, at least two<br />
issues need to be addressed: agreement on the scope,<br />
coverage <strong>and</strong> regularity of the reviews; <strong>and</strong> greater<br />
country ownership. Both require partnerships with<br />
other organizations that are interested in developing<br />
<strong>and</strong> applying system-level tools. For example, the<br />
International Teacher Task Force, based at UNESCO,<br />
recently collaborated with the World Bank to apply<br />
the SABER teacher module, which had been previously<br />
administered to 28 countries, to a further 27. The<br />
objective is to produce country reports in 2016 that<br />
will follow the SABER format. An additional report will<br />
provide an international synthesis of what countries<br />
consider key requirements of teaching as a profession in<br />
their policies <strong>and</strong> practices (World Bank, 2015a). However,<br />
as the next section argues, monitoring may be best<br />
served at a regional rather than a global level.<br />
REGIONAL TOOLS<br />
For countries to contribute information to a<br />
mechanism that assesses the strengths <strong>and</strong> weaknesses<br />
of their education systems, consensus is needed on<br />
how best to identify, develop <strong>and</strong> validate system-level<br />
indicators. Achieving a shared underst<strong>and</strong>ing around<br />
these issues may prove difficult. Yet, members of a<br />
regional entity or broad transnational organization<br />
(e.g. the Commonwealth, the Organisation for<br />
Economic Co-operation <strong>and</strong> Development (OECD) or<br />
the International Organisation of La Francophonie)<br />
are more likely to voluntarily exchange information<br />
on their education systems – <strong>and</strong> a consensus about<br />
purpose, policy priorities <strong>and</strong> mechanisms is more<br />
easily reached, facilitated by deeper country<br />
commitment <strong>and</strong> engagement.<br />
on education would exert pressure on their systems<br />
to become more similar <strong>and</strong> thus impinge on national<br />
sovereignty. Nevertheless, they agreed on the value<br />
of exchanging information <strong>and</strong> documentation on<br />
education systems (Eurydice, 2000).<br />
Since 1992, education has been increasingly recognized<br />
as an area of EU competency, <strong>and</strong> this exchange has<br />
increased, gaining particular momentum with the<br />
adoption of Europe 2020, an overarching strategy on<br />
growth <strong>and</strong> jobs. It includes investment in education<br />
as a priority <strong>and</strong> sets two relevant core targets for 2020:<br />
that no more than 10% of adolescents should leave<br />
school before completing upper secondary education,<br />
<strong>and</strong> that at least 40% of 30- to 34-year-olds should<br />
have attained tertiary education (European Union,<br />
2015). As part of the related Education <strong>and</strong> Training<br />
2020 programme, member states receive guidance on<br />
priority reforms in the form of annual country-specific<br />
recommendations. These generate more awareness of<br />
the importance of education <strong>and</strong> strengthen incentives<br />
to share examples of good policy practice.<br />
From its tentative initial steps, Eurydice has grown into<br />
a network of 40 national units in 36 countries, including<br />
8 that are not EU members. Its work is relevant to the<br />
global debate on education system-level information.<br />
It produces an online database of national education<br />
systems that covers a broad range of issues <strong>and</strong> is<br />
continuously updated by national authorities (Eurydice,<br />
2016a). It also prepares comparative thematic studies<br />
on topics decided jointly by the European Commission<br />
<strong>and</strong> member states. The 2015 topics, for instance, were<br />
higher education, adult education, school evaluation <strong>and</strong><br />
teachers (Eurydice, 2016b). The studies visualize complex<br />
information on policy choices in a transparent way to<br />
facilitate cross-country comparisons.<br />
Two examples st<strong>and</strong> out. The Eurydice Network<br />
on Education Systems <strong>and</strong> Policies in Europe was<br />
established in 1980. The primary treaties of the<br />
European Union (EU) respect the ‘responsibility of the<br />
Member States<br />
for the content of<br />
teaching <strong>and</strong> the<br />
The Eurydice Network<br />
organization of<br />
in Europe has an online education systems’.<br />
database of education In the 1970s, the<br />
countries were<br />
systems in 36 countries<br />
concerned that<br />
joint activities<br />
Another example of a cross-country framework of<br />
education system indicators is the OECD’s Indicators<br />
of Education Systems (INES) programme, introduced<br />
in 1992. One of its three networks focused on ‘learning<br />
environment <strong>and</strong> the organization of schools’ <strong>and</strong><br />
collected information on issues such as curricular<br />
content <strong>and</strong> decision-making responsibilities in<br />
education systems. In 2009, this network evolved into<br />
the INES Network for System-Level Indicators (NESLI),<br />
which collects system-level data. ‘As mutual confidence<br />
<strong>and</strong> underst<strong>and</strong>ing is a prerequisite for establishing<br />
internationally comparable data’, the data collection<br />
process ‘requires considerable specialized expertise that<br />
2016 • GLOBAL EDUCATION MONITORING REPORT 363
21<br />
depends on stable international working arrangements’<br />
(OECD, 2009b). The INES oversight <strong>and</strong> coordination<br />
bodies determine the NESLI work plan following<br />
strategic direction by the OECD Education Policy<br />
Committee, which is responsible for the organization’s<br />
work on education.<br />
NESLI collects information such as indicators on teacher<br />
remuneration <strong>and</strong> instruction time, using annual, cyclical<br />
or ad hoc surveys. Much of the information is published<br />
in the annual OECD Education at a Glance reports.<br />
Extensive annexes to the reports describe sources of<br />
information by country. In recent years, information on<br />
non-member countries has been included (Box 21.1).<br />
BOX 21.1<br />
Engaging in multiple initiatives to diagnose<br />
education systems – the case of Brazil<br />
In recent years, the OECD has increasingly extended its diagnostic<br />
assessments of education systems to cover non-member countries.<br />
For example, it has carried out reviews of national education<br />
policies in the Dominican Republic, Indonesia <strong>and</strong> Tajikistan. For<br />
some reviews, such as in Malaysia <strong>and</strong> Thail<strong>and</strong>, it has collaborated<br />
with UNESCO. NESLI has also sought to engage OECD c<strong>and</strong>idate<br />
countries, such as Colombia <strong>and</strong> Lithuania, <strong>and</strong> non-member<br />
countries, such as Brazil <strong>and</strong> the Russian Federation.<br />
Brazil joined the network after participating in the World Education<br />
Indicators project, a joint effort of the OECD, UIS <strong>and</strong> World Bank.<br />
Brazil has benefited from exchanging information with other countries<br />
through NESLI but also from improved domestic coordination<br />
between government departments, which was necessary to collect<br />
the information. But since it is not an OECD member, Brazil cannot<br />
influence NESLI’s agenda toward its areas of interest. And as a<br />
federal country with a large degree of decentralization, it has also<br />
found it difficult to report national-level information.<br />
Brazil is also a member of two regional groupings that promote<br />
exchange of information on education systems: the Organization<br />
of Ibero-American States (OEI), which has a common education<br />
agenda that increasingly looks at qualitative aspects of education<br />
systems; <strong>and</strong> Mercosur, a customs union <strong>and</strong> trading bloc, which<br />
considers education as one factor promoting regional integration<br />
<strong>and</strong> has carried out comparative reviews of member countries’<br />
education systems.<br />
Sources: Mercosur (2008); OEI (2010).<br />
The OECD has carried out systematic country<br />
education policy reviews since the 1970s; INES <strong>and</strong><br />
NESLI follow in a long tradition of diagnostic tools<br />
developed by the organization. Policy reviews are<br />
becoming more diversified, focusing on selected areas<br />
or levels of education, such as early childhood or postsecondary<br />
skills acquisition. At the same time, there are<br />
attempts to unify different str<strong>and</strong>s of work, for example<br />
through the Education GPS database, which links<br />
information on system indicators with other sources,<br />
<strong>and</strong> the Education Policy Outlook series (OECD, 2015c).<br />
An excellent example of such efforts, albeit in a different<br />
context, is the OEI education strategy known as Metas<br />
Educativas 2021 (‘Education Goals 2021’), agreed by Latin<br />
American education ministers in 2008. A specialized<br />
body, the Institute of Monitoring <strong>and</strong> Evaluation, was<br />
established to review progress on 11 targets <strong>and</strong> 39<br />
indicators, at least one of which explicitly refers to<br />
the functioning of education systems (OEI, 2014). At<br />
the 2015 meeting of the OEI Governing Council, viceministers<br />
requested the development of more qualitative<br />
indicators to capture aspects of targets on equity <strong>and</strong><br />
teacher professional development (OEI, 2015).<br />
Other regional organizations have analysed systems <strong>and</strong><br />
policies, although usually in relation to particular aspects<br />
of education. For example, the Association of Southeast<br />
Asian Nations <strong>and</strong> the South-east Asian Ministers of<br />
Education Organization are taking steps to harmonize<br />
regional higher education systems to facilitate mobility<br />
of students, faculty <strong>and</strong> researchers for better regional<br />
economic integration. This analysis has led to work<br />
that compares, links <strong>and</strong> coordinates higher education<br />
systems in areas such as quality assurance (Niedermeier<br />
<strong>and</strong> Pohlenz, 2016; Ratanawijitrasin, 2015).<br />
A final example of high quality education system<br />
diagnostic assessment is the long-st<strong>and</strong>ing<br />
Country Status Report series of the UNESCO<br />
International Institute for Educational Planning<br />
(IIEP) in sub-Saharan Africa (IIEP et al., 2014). This<br />
initiative seeks to build national decision-makers’<br />
capacity for sector analysis <strong>and</strong> facilitate domestic<br />
policy dialogue. Attempts to compare countries – for<br />
example through the IIEP Pôle de Dakar database –<br />
focus almost exclusively on quantitative indicators.<br />
A coordinated effort would be needed to improve the<br />
basis for comparing systems <strong>and</strong> policies, which would<br />
generate sustained regional dialogue.<br />
364<br />
CHAPTER 21 | EDUCATION SYSTEMS
21<br />
LOOKING AHEAD<br />
In essence, policies are about transforming resources<br />
(the main focus of education monitoring in the past)<br />
into effective processes (rarely monitored), resulting in<br />
measurable outcomes (the focus of the SDG agenda).<br />
Determining which systems <strong>and</strong> policies are effective<br />
relies considerably on the nature of the evidence<br />
collected <strong>and</strong> analysed. Linking policies to measurable<br />
results through a system-oriented approach in education<br />
reflects a similar trend in the global health field (WHO,<br />
2009). The focus on systems in education also affects<br />
the research agenda. One example is the Research on<br />
Improving Systems of Education project funded by<br />
the UK Department for International Development <strong>and</strong><br />
the Australian Department of Foreign Affairs <strong>and</strong> Trade<br />
(Hanson, 2015).<br />
A broad range of validated indicators of education<br />
systems <strong>and</strong> policies is needed to support the<br />
monitoring of the Education 2030 agenda. However,<br />
as this chapter has shown, education system<br />
diagnoses differ widely in their objectives (e.g. referring<br />
to different agendas <strong>and</strong> targets), scope (e.g. general<br />
vs specific), methodology (e.g. country driven vs<br />
externally imposed or conducted by experts) <strong>and</strong> use<br />
(e.g. whether they lead to policy changes). Much could<br />
be done to address gaps <strong>and</strong> reduce overlap among<br />
diagnostic instruments.<br />
to be used in policy-making <strong>and</strong> be sustained over time,<br />
not least because governments have an interest in<br />
neighbouring countries’ performance.<br />
The key to successfully exchanging information<br />
on education systems between countries is<br />
strong coordination mechanisms from regional<br />
intergovernmental organizations that include<br />
education development among their objectives.<br />
Countries can draw on the experience of the EU, OEI or<br />
OECD to initiate policy dialogue through system-level<br />
indicators that are relevant to their regions as well as<br />
to the Education 2030 agenda. The African Union (with<br />
the Association for the Development of Education<br />
in Africa), the Arab League Educational, Cultural <strong>and</strong><br />
Scientific Organization, the South Asian Association for<br />
Regional Cooperation, the Caribbean Community, the<br />
Commonwealth <strong>and</strong> the International Organisation of La<br />
Francophonie are examples of potential mechanisms for<br />
peer learning.<br />
Sharing experiences between countries <strong>and</strong> promoting<br />
policy dialogue, based on broadly comparable qualitative<br />
information on education systems, will facilitate<br />
effective decisionmaking.<br />
While a<br />
global framework for<br />
A regional or subregional<br />
reviewing education<br />
approach is more<br />
systems <strong>and</strong> policies<br />
feasible than a global might be desirable, in<br />
practice a regional or<br />
framework for reviewing<br />
subregional approach<br />
education systems<br />
is more feasible.<br />
Many regions have<br />
common education<br />
contexts <strong>and</strong> can structure reviews to better reflect<br />
their shared values, objectives <strong>and</strong> challenges. Members<br />
of regional entities are more likely to express deeper<br />
political commitment <strong>and</strong> national ownership for such<br />
an undertaking – critical conditions for creating valid,<br />
up-to-date system-level indicators of education. And<br />
the results of regional monitoring are much more likely<br />
2016 • GLOBAL EDUCATION MONITORING REPORT 365
22<br />
Women farmers<br />
from Zambia take<br />
part in a planting<br />
day of new trees.<br />
CREDIT: Sydelle Willow Smith/GEM Report<br />
KEY MESSAGES<br />
Education is explicitly mentioned in global indicators for five SDGs other than SDG 4, pertaining to poverty,<br />
employment <strong>and</strong> the environment.<br />
Education should be monitored in at least three ways: how it affects development outcomes, such as fertility;<br />
how it increases the number of skilled professionals working in all sectors; <strong>and</strong> how it can change adult attitudes<br />
<strong>and</strong> behaviour.<br />
Many other SDGs should break down their indicators by education level to underst<strong>and</strong> underlying inequality<br />
holding back progress. For instance, across 54 countries, there would be over 100 fewer births for every 1,000<br />
adolescent women if they had secondary education rather than no education. The prevalence of malaria among<br />
children aged 6 months to 59 months in 15 sub-Saharan African countries over 2009–2015 would have been<br />
halved if their mothers had had secondary rather than primary education.<br />
366<br />
CHAPTER 22 | EDUCATION IN THE OTHER SDGS
22<br />
CHAPTER<br />
22<br />
Education in the<br />
other SDGs<br />
(global indicators from goals other than SDG 4 that are education-related)<br />
GLOBAL INDICATOR 1.A.2 – Proportion of total government spending on essential services<br />
(education, health <strong>and</strong> social protection)<br />
GLOBAL INDICATOR 5.6.2 – Number of countries with laws <strong>and</strong> regulations that guarantee<br />
women aged 15–49 years access to sexual <strong>and</strong> reproductive health care, information <strong>and</strong> education<br />
GLOBAL INDICATOR 8.6.1 – Proportion of youth (aged 15–24 years) not in education,<br />
employment or training<br />
GLOBAL INDICATOR 12.8.1 – Extent to which (i) global citizenship education <strong>and</strong> (ii) education<br />
for sustainable development (including climate change education) are mainstreamed in (a) national<br />
education policies; (b) curricula; (c) teacher education; <strong>and</strong> (d) student assessment<br />
GLOBAL INDICATOR 13.3.1 – Number of countries that have integrated mitigation, adaptation,<br />
impact reduction <strong>and</strong> early warning into primary, secondary <strong>and</strong> tertiary curricula<br />
2016 • GLOBAL EDUCATION MONITORING REPORT 367
22<br />
Direct references to education in global SDG indicators ................................... 368<br />
Indirect references to education in global SDG indicators ................................369<br />
Lifelong learning as a factor contributing across the SDGs............................... 373<br />
The Global Education Monitoring Report (GEM Report)<br />
demonstrates the importance of education as both<br />
a human right <strong>and</strong> as tool for the advancement of all<br />
Sustainable Development Goals (SDGs). The 2030 Agenda<br />
for Sustainable Development recognizes the importance<br />
of a separate education goal as well as the need to<br />
achieve other goals through education. Accordingly,<br />
the Incheon Declaration of the World Education Forum<br />
nominated the GEM Report ‘as the mechanism for<br />
monitoring <strong>and</strong> reporting on … SDG 4 <strong>and</strong> on education<br />
in the other … SDGs’ (§18).<br />
This chapter addresses SDGs other than SDG 4 through<br />
their global indicators that are relevant for education.<br />
It begins with a discussion of indicators that directly<br />
refer to education, as listed above. It then addresses<br />
indicators that can be indirectly linked to education:<br />
those linked to development outcomes, which can be<br />
disaggregated by education; <strong>and</strong> those linked to means<br />
of implementation, which refer to the national capacity<br />
necessary for achieving the SDGs, for example, as found<br />
in trained professionals <strong>and</strong> researchers. Finally, it offers<br />
a perspective on the underestimated role of lifelong<br />
learning for the achievement of the goals by 2030.<br />
DIRECT REFERENCES TO<br />
EDUCATION IN GLOBAL<br />
SDG INDICATORS<br />
Education is directly<br />
mentioned in five<br />
global indicators<br />
outside SDG 4<br />
Education is directly<br />
mentioned in five global<br />
indicators outside SDG<br />
4, under poverty, gender<br />
equality, economic growth,<br />
sustainable consumption<br />
<strong>and</strong> production, <strong>and</strong><br />
climate change. Each of<br />
the indicators suggests that education plays a key role<br />
for achieving broader development outcomes.<br />
Global indicator 1.a.2 calls for monitoring government<br />
spending on education, health <strong>and</strong> social protection<br />
under a target that focuses on ‘mobilization of resources<br />
… to implement programmes <strong>and</strong> policies to end<br />
poverty in all its dimensions’. Attention to government<br />
education expenditure is justified by the fact that public<br />
expenditure in social sectors, aided by a fair taxation<br />
system, can play a major role in reducing poverty. For<br />
example, across 27 Organisation for Economic Cooperation<br />
<strong>and</strong> Development (OECD) countries, adding the<br />
value of public services to household income reduced the<br />
poverty rate by 46% because such services were targeted<br />
to households most in need (OECD, 2011a). And a review<br />
showed that public education <strong>and</strong> health expenditure<br />
reduced inequality in six Latin American countries more<br />
than cash transfers to households (Lustig et al., 2013).<br />
There is a well-recognized methodology for reporting<br />
such expenditure (see Chapter 20). Nevertheless,<br />
the Inter-agency <strong>and</strong> Expert Group on Sustainable<br />
Development Goal Indicators (IAEG-SDGs) has<br />
classified it as a Tier III indicator, implying that ‘there<br />
are no established methodology <strong>and</strong> st<strong>and</strong>ards’ <strong>and</strong><br />
referring to the need for a reporting mechanism (with<br />
the International Labour Organization, World Health<br />
Organization <strong>and</strong> UNESCO responsible for the respective<br />
sectors of economy, health <strong>and</strong> education <strong>and</strong> the World<br />
Bank as a potential custodian agency).<br />
Global indicator 5.6.2 is the only indicator under SDG 5,<br />
which explicitly refers to education as a means to gender<br />
equality, although other indicators also closely relate<br />
to educational development, such as the proportion of<br />
time spent on unpaid domestic <strong>and</strong> care work or the<br />
seats held by women in national parliaments <strong>and</strong> local<br />
368<br />
CHAPTER 22 | EDUCATION IN THE OTHER SDGS
22<br />
governments. It measures the number of countries<br />
with laws <strong>and</strong> regulations that guarantee access to<br />
sexual <strong>and</strong> reproductive health care, information <strong>and</strong><br />
education, in accordance with the Programme of Action<br />
of the International Conference on Population <strong>and</strong><br />
Development <strong>and</strong> the Beijing Platform for Action.<br />
reports on the implementation of the Recommendation<br />
concerning Education for International Underst<strong>and</strong>ing,<br />
Co-operation <strong>and</strong> Peace <strong>and</strong> Education relating to<br />
Human Rights <strong>and</strong> Fundamental Freedoms, adopted at<br />
the 1974 UNESCO General Conference. Nevertheless, this<br />
has been classified as a Tier III indicator.<br />
One component of the indicator will therefore focus on<br />
the number of countries with such laws <strong>and</strong> regulations<br />
in education, noting if they are age-appropriate, genderfocused<br />
<strong>and</strong> human rights-based. The methodology,<br />
currently under development, consists of initial selfreporting<br />
by governments. Data collection is expected<br />
to start in July 2017 (UNFPA, 2016). As the approach has<br />
not yet been tested, the indicator has been classified as<br />
Tier III. This qualitative systems indicator approach (see<br />
Chapter 21) is very similar to that used for issues raised<br />
under target 4.7 (see Chapter 16).<br />
Global indicator 8.6.1 monitors the proportion of youth<br />
not in education, employment or training (NEET).<br />
It complements global indicator 4.3.1, the youth<br />
participation rate in formal <strong>and</strong> non-formal education<br />
<strong>and</strong> training. The difference between them is that the<br />
SDG 8 global indicator also includes employment. The<br />
indicator captures youth who are either discouraged<br />
from or not interested in participating in the labour force.<br />
A methodology has been established, so the indicator<br />
has been classified as Tier I (ILO, 2013).<br />
However, this indicator cannot easily be compared across<br />
countries. For example, a comparison of 28 countries that<br />
participated in the School-to-Work Transition Survey shows<br />
that Cambodia <strong>and</strong> Madagascar had NEET rates below 10%<br />
among 15- to 29-year-olds, while Bangladesh <strong>and</strong> Samoa<br />
exceeded 40%. The European Union average was 15% in<br />
2012/13, similar to the low income countries average (18%)<br />
but well below that of middle income countries (26%). It is<br />
unclear what the target should be. It is important to look<br />
at the parts that constitute the indicator to underst<strong>and</strong><br />
whether the challenge in a country is, for example, access<br />
to education <strong>and</strong> training or constraints to labour force<br />
participation for women (ILO, 2015).<br />
Finally, global indicators 12.8.1 <strong>and</strong> 13.3.1 focus on global<br />
citizenship education <strong>and</strong> education for sustainable<br />
development as means to support the transition to<br />
sustainable production <strong>and</strong> consumption patterns as well<br />
as addressing the causes <strong>and</strong> impact of climate change.<br />
In that respect, they are essentially identical to global<br />
indicator 4.7.1 (see Chapter 16). Accordingly, the proposed<br />
sources of information are the quadrennial national<br />
Alternative sources <strong>and</strong> approaches may be necessary.<br />
This report has argued for more specificity than these<br />
reports allow <strong>and</strong> to increase country coverage in the<br />
monitoring process. A global process to code national<br />
curriculum framework documents using a st<strong>and</strong>ard<br />
protocol could be established. This would require close<br />
collaboration with ministries <strong>and</strong> a leading international<br />
coordinating body (see Chapter 16).<br />
INDIRECT REFERENCES TO<br />
EDUCATION IN GLOBAL SDG<br />
INDICATORS<br />
Apart from monitoring indicators that explicitly refer to<br />
education, future GEM Reports will also pay attention to<br />
indirect references to education in the other SDGs. Two<br />
examples are highlighted in this section: education as a<br />
factor associated with other development outcomes <strong>and</strong><br />
therefore as a characteristic by which particular global<br />
indicators can be disaggregated; <strong>and</strong> indicators that<br />
refer to human resource capacity, which are related to<br />
professional <strong>and</strong> higher education.<br />
EDUCATION AS A FACTOR ASSOCIATED WITH<br />
DEVELOPMENT OUTCOMES<br />
The GEM Report has presented strong examples of<br />
the relationship between education <strong>and</strong> other<br />
development outcomes. In many cases, research has<br />
clearly shown that education attainment has a causal<br />
effect over <strong>and</strong> above other related influences such as<br />
wealth. In other cases, this causal relationship has not<br />
yet been established.<br />
Observing the correlation of education attainment with<br />
other development outcomes <strong>and</strong> how this relationship<br />
varies by country <strong>and</strong> evolves over time is interesting.<br />
It can indicate whether the relationship is consistent<br />
<strong>and</strong> how it may contribute to reaching the targets.<br />
It can also point at cases where the relationship is<br />
weak to give useful feedback to education planners.<br />
Taking the education level into account can also show<br />
the intergenerational effects of education on other<br />
outcomes.<br />
2016 • GLOBAL EDUCATION MONITORING REPORT 369
22<br />
“<br />
On average across 54 countries, there would be over 100 fewer<br />
births for every 1,000 women if they had secondary education<br />
compared to no education at all<br />
”<br />
But caution is needed. A population with particular levels<br />
of education attainment changes over time as education<br />
systems exp<strong>and</strong>. For example, the characteristics of<br />
women who had never been to school in low income<br />
countries in 1990, when this circumstance was relatively<br />
common, are very different from those in 2015, when this<br />
situation has become rarer.<br />
Three examples from the health SDG show disparity<br />
in development outcomes by level of education. The<br />
adolescent birth rate – the number of births per<br />
1,000 women aged 15 to 19 (global indicator 3.7.2) –<br />
varies considerably by education level. Across 54 low<br />
<strong>and</strong> middle countries with data over 2008–2015, the<br />
unweighted average number of births per 1,000 women<br />
was 176 if they had no education, 142 if they had primary,<br />
61 if they had secondary <strong>and</strong> 13 if they had tertiary.<br />
In sub-Saharan Africa, the negative association of<br />
adolescent birth rate with secondary education appears<br />
to have become stronger over time (Figure 22.1a).<br />
Since 2000, the under-5 mortality rate (global indicator<br />
3.2.1) has rapidly declined in Southern <strong>and</strong> Eastern Africa.<br />
In countries including Rw<strong>and</strong>a <strong>and</strong> Zambia, the mortality<br />
rate of children whose mothers had secondary education<br />
was 20% to 30% lower than children with primaryeducated<br />
mothers. It was about 50% lower in countries<br />
such as the Plurinational State of Bolivia, Guinea <strong>and</strong> the<br />
FIGURE 22.1:<br />
Education is positively associated with desirable development outcomes<br />
a. Adolescent birth rate (births per 1,000 women, aged 15 to 19 years), 1997–2014<br />
300<br />
250<br />
No education<br />
Primary<br />
Secondary<br />
Higher<br />
Births per 1,000 women<br />
200<br />
150<br />
100<br />
50<br />
0<br />
1998<br />
2011<br />
1998 2014<br />
1997 2009 2000 2011<br />
2001 2011<br />
2007 2013<br />
1997 2013<br />
2000 2014<br />
2000 2012<br />
2000 2012<br />
2000 2014<br />
1997 2012<br />
Cameroon<br />
Ghana<br />
Madagascar<br />
Ethiopia<br />
Nepal<br />
Pakistan<br />
Yemen<br />
Egypt<br />
Haiti<br />
Peru<br />
Cambodia<br />
Indonesia<br />
Western <strong>and</strong> Central<br />
Africa<br />
Eastern <strong>and</strong> Southern<br />
Africa<br />
Southern Asia<br />
Northern Africa <strong>and</strong><br />
Western Asia<br />
Latin America<br />
<strong>and</strong> the Caribbean<br />
Eastern <strong>and</strong><br />
South-eastern Asia<br />
Source: Demographic <strong>and</strong> Health Survey STATcompiler (2016).<br />
370<br />
CHAPTER 22 | EDUCATION IN THE OTHER SDGS
22<br />
b. Under-5 mortality rate (deaths per 1,000 live births), 1997–2014<br />
250<br />
200<br />
No education<br />
Primary<br />
Secondary<br />
Higher<br />
Deaths per 1,00 live births<br />
150<br />
100<br />
50<br />
0<br />
1999<br />
2013<br />
1999 2012<br />
2000 2010<br />
2002 2014<br />
2007 2013 2000 2011<br />
1997 2013<br />
2000 2014<br />
1998 2008 2000 2010<br />
1997 2012<br />
1998 2013<br />
Nigeria<br />
Guinea<br />
Rw<strong>and</strong>a<br />
Zambia<br />
Pakistan<br />
Bangladesh<br />
Yemen<br />
Egypt<br />
Bolivia<br />
Colombia<br />
Indonesia<br />
Philippines<br />
Western <strong>and</strong> Central<br />
Africa<br />
Eastern <strong>and</strong> Southern<br />
Africa<br />
Southern Asia<br />
Northern Africa <strong>and</strong><br />
Western Asia<br />
Latin America <strong>and</strong><br />
the Caribbean<br />
Eastern <strong>and</strong><br />
South-eastern Asia<br />
Prevelance of malaria according to a rapid<br />
diagnostic test (%)<br />
70<br />
60<br />
50<br />
40<br />
30<br />
20<br />
10<br />
0<br />
c. Prevalence of malaria using a rapid diagnostic test<br />
(children aged 6 to 59 months), 2009–2015<br />
Burkina Faso, 2014<br />
Mali, 2012–13<br />
Guinea, 2012<br />
Côte d’Ivoire, 2011–12<br />
Mozambique, 2011<br />
Togo, 2013–14<br />
Malawi, 2014<br />
Liberia, 2009<br />
Ghana, 2014<br />
Ug<strong>and</strong>a, 2014–15<br />
D. R. Congo, 2013–14<br />
Cameroon, 2011<br />
No education<br />
Primary<br />
Secondary<br />
Higher<br />
Source: Demographic <strong>and</strong> Health Survey STATcompiler (2016).<br />
Benin, 2011–12<br />
Burundi, 2012<br />
Angola, 2011<br />
Philippines (Figure 22.1b). The prevalence of malaria was<br />
also half among children aged 6 to 59 months whose<br />
mothers had secondary rather than primary education<br />
in 15 sub-Saharan African countries over 2009–2015<br />
(Figure 22.1c).<br />
In brief, disaggregating relevant global indicators<br />
by education levels would shed more light on their<br />
relationship <strong>and</strong> on the underlying inequality that<br />
obstructs the achievement of the SDG targets. Global<br />
indicators that could be monitored this way include, for<br />
example, those related to poverty (1.1.1; by the level of<br />
education of the household head), malnutrition (2.2.2),<br />
child marriage (5.3.1), access to improved sanitation (6.2.1),<br />
access to electricity (7.1.1), unemployment (8.5.2), urban<br />
slum population (11.1.1), recycling (12.5.1), disaster deaths<br />
(13.1.2), violence (16.1.3) <strong>and</strong> birth registration (16.9.1).<br />
EDUCATION AS A FACTOR RELATED<br />
TO NATIONAL CAPACITY FOR SDG<br />
IMPLEMENTATION<br />
A number of other targets <strong>and</strong> indicators across the<br />
SDGs are indirectly linked to the potential of education<br />
to build capacity. Education systems can prepare<br />
2016 • GLOBAL EDUCATION MONITORING REPORT 371
22<br />
professionals <strong>and</strong> researchers to implement sustainable<br />
development plans in academia, administration<br />
<strong>and</strong> business.<br />
Targets 3.c <strong>and</strong> 3.d refer to the development <strong>and</strong> training<br />
of the health workforce in developing countries, <strong>and</strong><br />
national capacity-building for early warning, reduction<br />
<strong>and</strong> management of health risks, respectively. Several<br />
factors play a role but, among them, strong education<br />
systems that provide relevant skills in sufficient<br />
quantities are a prerequisite. In brief, ‘no health<br />
workforce, no global health security’ (Lancet, 2016).<br />
Yet, countries with the heaviest disease burden are<br />
those with the lowest density of health professionals.<br />
About 44% of the WHO’s member states have less than<br />
1 physician <strong>and</strong> 28% less than 1 nurse or midwife per<br />
1,000 inhabitants (WHO, 2015). At least 1 billion <strong>people</strong><br />
worldwide, especially in rural areas, are without access to<br />
a qualified health professional (Crisp <strong>and</strong> Chen, 2014).<br />
Over the next decade, besides increasing the number<br />
of health professionals, countries will need to adapt the<br />
curricula of medical education: new diagnostics, vaccines<br />
<strong>and</strong> drugs are being developed; medical technology is<br />
progressing; <strong>and</strong> patient conditions are changing owing<br />
to ageing populations, urbanization <strong>and</strong> the increasing<br />
FIGURE 22.2:<br />
There is vast disparity in the availability of scientific <strong>and</strong> technical personnel<br />
Researchers <strong>and</strong> technicians (in full-time equivalent) per million inhabitants, 2011–2013<br />
Technicians per million inhabitants<br />
100,000<br />
10,000<br />
1,000<br />
100<br />
10<br />
1<br />
1<br />
Panama:<br />
150 researchers, 62 technicians<br />
Note: Both axes are on a logarithmic scale.<br />
Source: UIS database.<br />
Denmark:<br />
10,457 researchers,<br />
3,205 technicians per<br />
million inhabitants<br />
Viet Nam:<br />
1,178 researchers, 110 technicians<br />
Bahrain:<br />
378 researchers, 36 technicians<br />
Lesotho:<br />
21 researchers, 5 technicians<br />
per million inhabitants<br />
10 100 1,000 10,000 100,000<br />
Researchers per million inhabitants<br />
number of deaths due to non-communicable diseases<br />
(Crisp <strong>and</strong> Chen, 2014).<br />
Trained community health workers can alleviate<br />
shortages of qualified health professionals. A systematic<br />
review found they have been effective in giving health<br />
education, preventing malaria, promoting breastfeeding<br />
<strong>and</strong> providing essential newborn care <strong>and</strong> psychosocial<br />
support (Gilmore <strong>and</strong> McAuliffe, 2013). Adequate training<br />
appears to be a key characteristic of programmes that<br />
have been scaled up successfully (Pallas et al., 2013).<br />
Target 6.a focuses on capacity-building support<br />
to developing countries – which requires trained<br />
professionals – in water- <strong>and</strong> sanitation-related<br />
activities <strong>and</strong> programmes, including water harvesting,<br />
desalination, water efficiency, wastewater treatment <strong>and</strong><br />
recycling <strong>and</strong> reuse technologies.<br />
A lack of human resources has been identified in<br />
the water <strong>and</strong> sanitation sector since the UN Water<br />
conference in 1991. However, surveys reveal governments<br />
lack awareness. In 2011, nearly half of the 74 countries<br />
surveyed for a global status update were unable to state<br />
how many staff were working in the sector (WHO <strong>and</strong> UN<br />
Water, 2012).<br />
Only one-third of 94 countries surveyed have<br />
comprehensive human resource strategies for urban <strong>and</strong><br />
rural areas for drinking water, sanitation <strong>and</strong> hygiene<br />
(WHO <strong>and</strong> UN Water, 2014). In Ghana, there is a surplus<br />
of about 3,000 professionals in management <strong>and</strong> finance<br />
in the water sector but a shortage of 280,000 technical<br />
staff in the sanitation sector if full service coverage is to<br />
be achieved. The more stigmatized sanitation sector is<br />
unable to attract professionals <strong>and</strong> those willing to work<br />
in rural areas (International Water Association, 2014).<br />
Target 9.5 focuses on enhancing scientific research <strong>and</strong><br />
encouraging innovation. The percentage of research <strong>and</strong><br />
development expenditure as a share of gross domestic<br />
product (GDP) <strong>and</strong> the number of researchers per 1<br />
million inhabitants serve as global indicators of national<br />
capacity. For example, at just 21 researchers <strong>and</strong> 5<br />
technicians per 1 million inhabitants in 2011, Lesotho is ill<br />
prepared to implement SDG strategies (Figure 22.2).<br />
International cooperation is needed to develop research<br />
capacity <strong>and</strong> technology development, an objective<br />
that needs to be monitored in parallel to scholarships.<br />
This is the intention, among others, of targets related<br />
to medical research (3.b), environmentally sound<br />
technologies (12.a) <strong>and</strong> marine technology (14.a).<br />
372<br />
CHAPTER 22 | EDUCATION IN THE OTHER SDGS
22<br />
LIFELONG LEARNING AS<br />
A FACTOR CONTRIBUTING<br />
ACROSS THE SDGS<br />
Fulfilling the SDG agenda will require a massive <strong>and</strong> rapid<br />
transformation. As formal schooling systems receive<br />
most of the attention, behaviour change – crucial for<br />
achieving SDGs – appears to be neglected. Thus, despite<br />
the reference in the SDG 4 goal formulation, the critical<br />
role of adult education <strong>and</strong> learning has been overlooked<br />
in the other targets.<br />
How can mortality from<br />
non-communicable<br />
As formal schooling<br />
diseases be reduced<br />
receives most of the by one-third in 15<br />
attention for achieving years unless adults<br />
drastically change<br />
the SDGs, behaviour<br />
behaviours related<br />
change <strong>and</strong> the critical to the consumption<br />
role of adult education of food, alcohol <strong>and</strong><br />
tobacco? How will the<br />
<strong>and</strong> learning have<br />
number of deaths <strong>and</strong><br />
been overlooked<br />
injuries from traffic<br />
accidents be halved<br />
without dramatic<br />
changes in road behaviour? How will equal opportunities<br />
for leadership at all levels of decision-making in<br />
political, economic <strong>and</strong> public life be enhanced unless<br />
stereotypical attitudes are challenged? And how will<br />
food <strong>and</strong> general waste be substantially reduced in the<br />
context of today’s consumerism?<br />
For such changes to take place in such a short period of<br />
time, campaigns with an active education component<br />
will be necessary. This is where the intersectoral nature<br />
of the new agenda will come to full force but also<br />
where various facets of adult education <strong>and</strong> learning<br />
opportunities will need to be explored <strong>and</strong> monitored.<br />
For some <strong>people</strong>, the learning programmes expressed<br />
or implied in the other SDGs tend not to be seen as<br />
‘education’ but as ‘extension’ programmes in health,<br />
agriculture, skills development, environmental<br />
management, citizenship or community development.<br />
While they are not regarded as the responsibility of<br />
ministries of education, this by no means suggests they<br />
should be neglected.<br />
2016 • GLOBAL EDUCATION MONITORING REPORT 373
23<br />
Young Nepalese<br />
students study<br />
their textbooks.<br />
CREDIT: Anup Vaswani/GEM Report<br />
KEY MESSAGES<br />
Global monitoring of SDG 4 requires sufficient comparable information to foster a global dialogue over progress. Such monitoring<br />
does not undermine country reviews of its own progress in education, which focuses on national context <strong>and</strong> specific needs.<br />
Countries should be encouraged to contribute to discussions on the monitoring of SDG 4 in an informed <strong>and</strong> meaningful way. The<br />
Technical Cooperation Group should set up a decision-making mechanism to foster consensus <strong>and</strong> strengthen its legitimacy.<br />
AT THE NATIONAL LEVEL: BUILD CAPACITY IN SIX KEY AREAS<br />
Equity. Cooperation between education ministries <strong>and</strong> national statistical agencies is needed to shed light on basic disparities.<br />
Education ministries should help create questions concerning education for household surveys.<br />
Learning outcomes. Countries need to ensure that a robust, sample-based national learning assessment is in place, which can<br />
be used to monitor progress in learning over time.<br />
Quality. Countries need to monitor curricula, textbooks <strong>and</strong> teacher education programmes closely.<br />
Lifelong learning. Countries need to monitor education needs, opportunities <strong>and</strong> accomplishments of their adult populations<br />
who are actively involved in critical decisions on sustainable development.<br />
Systems. Regional organizations offer countries appropriate forums for exchanging information on the aims <strong>and</strong><br />
characteristics of their education <strong>and</strong> learning systems.<br />
Finance. Countries are encouraged to adopt the national education accounts approach to underst<strong>and</strong> better how education<br />
expenditure is shared between governments, donors <strong>and</strong> households.<br />
AT THE REGIONAL LEVEL: SUPPORT PEER LEARNING<br />
Using regional networks as peer learning mechanisms, countries can exchange information on policy successes <strong>and</strong> challenges,<br />
including on addressing disadvantages <strong>and</strong> improving education for global citizenship <strong>and</strong> sustainable development.<br />
AT THE GLOBAL LEVEL: FOSTER CONSENSUS AND COORDINATION<br />
An international household survey programme dedicated to education is needed to fill several major gaps.<br />
A consistent approach to monitor learning outcomes is also required, including a code of conduct among donors to avoid overlap.<br />
The establishment of a research hub related to global education measurement issues is strongly recommended.<br />
374<br />
CHAPTER 23 | PRIORITIES FOR MONITORING EDUCATION IN THE SUSTAINABLE DEVELOPMENT GOALS
23<br />
CHAPTER<br />
23<br />
Priorities for<br />
monitoring education<br />
in the Sustainable<br />
Development Goals<br />
2016 • GLOBAL EDUCATION MONITORING REPORT 375
23<br />
Synthesis of monitoring challenges <strong>and</strong> opportunities....................................... 377<br />
Recommendations on monitoring the education agenda..................................379<br />
The Global Education Monitoring Report 2016 (GEM<br />
Report) makes a strong case that education is a<br />
catalyst for achieving the ambitious 2030 Agenda<br />
for Sustainable Development, with its 17 Sustainable<br />
Development Goals (SDGs), including SDG 4 on<br />
education. It provides evidence on the extent to which<br />
achieving the SDG 4 targets by 2030 would accelerate<br />
the achievement of the key economic, health <strong>and</strong><br />
environment-related SDGs.<br />
The monitoring part of the GEM Report reviewed<br />
the scope for monitoring education in the SDGs,<br />
especially SDG 4, carefully examining concepts in<br />
target formulations, analysing proposed as well as<br />
missing indicators, discussing the latest developments<br />
in measurement tools <strong>and</strong> identifying the main gaps in<br />
conceptualization <strong>and</strong> measurement.<br />
Viewed in one way, the Education 2030 monitoring<br />
agenda, when presented by individual target is daunting<br />
in its breadth. Responding to each target would pose<br />
significant challenges to education ministries <strong>and</strong><br />
national statistical agencies, not only in poor countries<br />
but also in rich ones.<br />
At the same time, the proposed monitoring agenda<br />
is underwhelming. Given the severity of sustainable<br />
development challenges, it barely scratches the surface<br />
of the fundamental questions facing education <strong>and</strong><br />
lifelong learning. How do education systems help<br />
learners of all ages acquire relevant knowledge, practice<br />
critical thinking, manage uncertainty, act responsibly<br />
regarding the environmental crisis, underst<strong>and</strong> their<br />
shared humanity <strong>and</strong> behave as global citizens? The<br />
monitoring framework does not go far enough to answer<br />
these questions.<br />
The new Education<br />
2030 agenda is<br />
instilling a new<br />
sense of purpose in<br />
education monitoring,<br />
compared with the<br />
emphasis of past<br />
exp<strong>and</strong>ed approach<br />
to reviewing progress<br />
should be celebrated<br />
<strong>and</strong> safeguarded. It<br />
offers a starting point<br />
for advancing the<br />
sustainable development<br />
agenda, with<br />
education at its heart.<br />
The challenge is for<br />
decades on counting<br />
governments <strong>and</strong><br />
heads in schools<br />
the international<br />
community to take<br />
concrete steps to<br />
achieve the new education targets while acting swiftly<br />
<strong>and</strong> purposefully to enable their monitoring, based on<br />
agreed indicators, even those with identified weaknesses.<br />
This concluding chapter has two objectives. First, it aims<br />
to distil the detailed discussions by target to provide<br />
a summary of emerging priorities for monitoring the<br />
new agenda. Second, using these conclusions as a basis,<br />
the chapter describes key implications in terms of the<br />
necessary steps forward at the national, regional <strong>and</strong><br />
global levels. In doing so, it points to potential links<br />
between approaches that can support an efficient <strong>and</strong><br />
feasible monitoring strategy for countries <strong>and</strong> the<br />
international community.<br />
The driving consideration in forming these<br />
recommendations is not monitoring per se, let alone<br />
global monitoring, but whether monitoring can<br />
significantly help catalyse improvements in education<br />
systems <strong>and</strong> the quality of learning environments<br />
serving all learners, regardless of background <strong>and</strong> age.<br />
Yet, overall, important steps have been taken. The<br />
agenda is instilling a new sense of purpose in education<br />
monitoring activities, compared with the emphasis<br />
of past decades on counting heads in schools. The<br />
All countries are now committed to global monitoring.<br />
While global monitoring is not the main objective of<br />
the Education 2030 agenda, its contribution should not<br />
be underestimated. The GEM Report’s m<strong>and</strong>ate is to<br />
376<br />
CHAPTER 23 | PRIORITIES FOR MONITORING EDUCATION IN THE SUSTAINABLE DEVELOPMENT GOALS
23<br />
facilitate well-informed <strong>and</strong> meaningful comparisons<br />
between countries <strong>and</strong> regions so as to spur debates,<br />
especially between governments, civil society <strong>and</strong><br />
engaged citizens, on what, how <strong>and</strong> how well education<br />
systems deliver. Comparative monitoring should not be<br />
seen as an attempt to impose particular global norms,<br />
but rather as an invitation to dialogue, engagement<br />
<strong>and</strong> commitment.<br />
SYNTHESIS OF MONITORING<br />
CHALLENGES AND OPPORTUNITIES<br />
As the first in the new series of GEM Reports, the 2016<br />
edition has looked in depth at the monitoring issues<br />
related to each individual SDG 4 target. This is timely:<br />
while the basic parameters of the global <strong>and</strong> thematic<br />
monitoring framework have been agreed, in many cases<br />
important details are still being decided. These issues need<br />
to be presented openly to the international community<br />
as a contribution to technical <strong>and</strong> political debate.<br />
The scope of the monitoring agenda is wide, <strong>and</strong> the<br />
issues involved are often complex. This section aims<br />
to provide the bigger picture by drawing together<br />
conclusions, summarizing key messages <strong>and</strong> indicating<br />
common themes in challenges across targets.<br />
Target 4.1: Following several decades of focus on<br />
participation measures based on enrolment, the new<br />
agenda marks an important advance with its shift to<br />
completion rates, an approach the GEM Report team<br />
has advocated in recent years.<br />
After this positive step, the main outst<strong>and</strong>ing question is<br />
how the international community will monitor ‘relevant <strong>and</strong><br />
effective learning outcomes’. This involves the content of<br />
learning (what is ‘relevant’) as well as whether it is achieving<br />
various aims (what is ‘effective’). Monitoring learning<br />
outcomes effectively will require making processes open<br />
<strong>and</strong> collaborative, <strong>and</strong> building national learning assessment<br />
systems that take country priorities into account. While<br />
the urge to report on the global indicator is underst<strong>and</strong>able,<br />
the process should respect these two principles.<br />
As important as reporting on learning outcomes is for<br />
monitoring, equally valuable is reporting on key, yet<br />
neglected, background characteristics that will<br />
help explain these outcomes. For example, governments<br />
need to be sensitized to monitor the languages students<br />
speak at home as compared with those in which they<br />
are taught <strong>and</strong> assessed. Another issue is ensuring<br />
that children who are out of school are not left behind:<br />
reporting needs to include all children or adolescents in a<br />
given age group <strong>and</strong> not just those who attend school.<br />
Target 4.2: Two issues emerge in relation to the target on<br />
early childhood care, education <strong>and</strong> development. First,<br />
the diversity of services needs to be better understood.<br />
Current approaches to measurement are highly<br />
fragmented <strong>and</strong> do not capture many characteristics of<br />
provision, especially the strength of education <strong>and</strong> learning<br />
components in early childhood programmes outside preprimary<br />
education. This calls for stronger coordination<br />
between national <strong>and</strong> international surveys to measure<br />
participation across a wider spectrum of programmes.<br />
Second, the search for a measure of early childhood<br />
development must continue. The current measure, based<br />
on the UNICEF Early Childhood Development Index,<br />
has four components but is strongly influenced by the<br />
literacy <strong>and</strong> numeracy component. These questions<br />
have been criticized as being too advanced <strong>and</strong> reflecting<br />
norms on early education rather than young children’s<br />
cognitive capacity (McCoy et al., 2016). To underst<strong>and</strong><br />
whether children are reaching their development<br />
potential, more research is needed on measures that are<br />
valid across a wide range of countries.<br />
Target 4.3: Two clear issues arise in relation to monitoring<br />
technical-vocational, tertiary <strong>and</strong> adult education.<br />
First, as with early childhood education, the available<br />
monitoring tools are not even close to capturing the<br />
increasingly large diversity of education <strong>and</strong> learning<br />
opportunities. For example, monitoring systems tend<br />
to focus on formal technical <strong>and</strong> vocational education.<br />
They do not capture new forms of tertiary education.<br />
Nor do they include adult education, except in a few high<br />
income countries. Similar problems beset household<br />
survey approaches.<br />
Second, the proposed indicator framework entirely<br />
ignores affordability – but progress towards this target<br />
in the next 15 years relies on it. Although debates on<br />
this issue are complex, it is important to agree on basic<br />
parameters that will help ensure government policies on<br />
these types of education <strong>and</strong> learning opportunities are<br />
better targeted to those most in need.<br />
Target 4.4: This target covers a broad range of skills for<br />
the world of work. However, while education systems<br />
need to help learners acquire several transferrable skills<br />
for decent work, such skills may not be suitable for largescale<br />
monitoring, especially at the global level.<br />
2016 • GLOBAL EDUCATION MONITORING REPORT 377
23<br />
By contrast, the focus of the global indicator on information<br />
<strong>and</strong> communications technology (ICT) skills is much<br />
narrower. Based on self-reported competencies related to<br />
computer use, it is in fact inadequate. Instead, an emphasis<br />
on digital literacy skills would represent an advance. While<br />
still narrow, it is broader than ICT skills <strong>and</strong> has two concrete<br />
advantages: it would focus on direct measurement of an<br />
actual skill, which should be a priority for this agenda, <strong>and</strong><br />
it would focus on a skill likely to become very relevant as<br />
a marker of disadvantage in the world of work for most,<br />
if not all, <strong>people</strong>. Therefore, the international community<br />
should learn how to better measure digital literacy skills.<br />
Current school-based measures are culturally biased <strong>and</strong><br />
need to be further developed to be suitable for monitoring<br />
beyond a select group of high income countries.<br />
Target 4.5: In recent years, the World Inequality Database<br />
on Education has helped bring disparity in education<br />
opportunities between <strong>and</strong> within countries to the<br />
attention of the wider public. The launch of the Inter-<br />
Agency Group on Education Inequality Indicators will<br />
now advance this agenda by making effective use of a<br />
very large number of data sets.<br />
Three major challenges remain. First, the choice of a<br />
suitable inequality measure is still open. The parity index,<br />
proposed as the global indicator, is easy to communicate<br />
but has notable weaknesses. Second, despite progress in<br />
global coordination, many education ministries do not yet<br />
monitor disparity. Third, global comparisons are currently<br />
possible only by sex, location <strong>and</strong> wealth. The search for<br />
measures of other markers – notably disability, language,<br />
migration <strong>and</strong> displacement – needs to continue.<br />
Leaving no one behind, the rallying cry of the new<br />
agenda, will not be answered solely by a proliferation of<br />
disparity measures. It also calls for a concerted effort<br />
to monitor the policies pursued by countries to address<br />
education disadvantage, including policies outside<br />
education. A mechanism is needed to allow countries to<br />
collect <strong>and</strong> compare this<br />
qualitative information.<br />
A new mechanism is<br />
needed to help countries<br />
collect <strong>and</strong> compare<br />
information about<br />
policies successfully<br />
addressing disadvantages<br />
in education<br />
Target 4.6: One example of<br />
the gaps in monitoring adult<br />
education opportunities is<br />
the continuing absence of<br />
information on participation<br />
in adult literacy<br />
programmes. After years of<br />
advocacy, the new agenda<br />
has embraced a shift to a<br />
nuanced direct assessment<br />
of a range of literacy <strong>and</strong> numeracy proficiency levels<br />
instead of relying on dubious self-reported skills. However,<br />
as with assessments of learning outcomes in basic<br />
education, it is essential to help build national systems<br />
to monitor these skills. In addition, diversity in literate<br />
environment contexts <strong>and</strong> variations in national capacity<br />
for collecting <strong>and</strong> analysing data must be accounted for.<br />
Target 4.7: In response to explicit reference in the target to<br />
knowledge <strong>and</strong> skills related to sustainable development<br />
<strong>and</strong> global citizenship, the international community has<br />
prioritized progress assessments based on the content of<br />
education. This is positive, as it will encourage countries<br />
to reflect on what is taught in classrooms. However,<br />
it has not been clarified how such information is to be<br />
collected <strong>and</strong> communicated at the global level.<br />
UNESCO member states’ reports on implementation<br />
of the 1974 Recommendation concerning Education<br />
for International Underst<strong>and</strong>ing, Co-operation <strong>and</strong><br />
Peace <strong>and</strong> Education relating to Human Rights <strong>and</strong><br />
Fundamental Freedoms are proposed as the mechanism<br />
to monitor progress towards the target. But low<br />
response rates <strong>and</strong> submission quality mean the process<br />
is weak <strong>and</strong> needs to be complemented by a more<br />
systematic <strong>and</strong> rigorous approach.<br />
The GEM Report has proposed an approach that would<br />
require a systematic listing of national curriculum<br />
frameworks <strong>and</strong> a coding protocol to analyse curricular<br />
materials. Such a mechanism would also require close<br />
collaboration between education ministries <strong>and</strong> regional<br />
or international organizations to ensure that the<br />
quality of the information is good <strong>and</strong> that the process<br />
is country-led. The mechanism could also cover other<br />
aspects of national policies, including teacher education<br />
programmes, learning assessments <strong>and</strong> textbooks.<br />
Target 4.a: Interest in the concept of child-friendly<br />
schools drove the formulation of this target. The<br />
most meaningful measures of such environments are<br />
observation-based, making this a particularly difficult<br />
target for global monitoring. One potential entry point<br />
is the growing interest in measures of school violence,<br />
though further progress will require collaboration to<br />
ensure that definitions in student surveys, currently<br />
fragmented, are aligned. School infrastructure indicators<br />
may be the easiest to measure but also the least likely<br />
to capture the spirit of an effective learning environment.<br />
Target 4.b: There is a surprising gap in information on<br />
scholarships. Providers need to collaborate to develop<br />
an entirely new global mechanism for reporting on<br />
378<br />
CHAPTER 23 | PRIORITIES FOR MONITORING EDUCATION IN THE SUSTAINABLE DEVELOPMENT GOALS
23<br />
government <strong>and</strong> non-government scholarships. Collected<br />
information must cover the basic characteristics not<br />
only of scholarships, but also of their recipients, notably<br />
their origin, destination <strong>and</strong> field of study. This process<br />
needs to start as soon as possible, since the target<br />
is to be achieved by 2020 <strong>and</strong> the currently proposed<br />
global indicator, based on scholarships funded from aid<br />
programmes, provides a very incomplete picture.<br />
Target 4.c: The formulation of the teacher target also<br />
put the spotlight on a weak evidence base. Current<br />
measures of qualified <strong>and</strong> trained teachers are hard to<br />
compare because st<strong>and</strong>ards are not comparable. The fact<br />
that personnel databases are often not linked to overall<br />
education management information systems makes it<br />
difficult to monitor equity in staff distribution across<br />
schools, teachers’ working conditions <strong>and</strong> the rate at<br />
which they leave the profession. Not enough use is made<br />
of labour force surveys that could show how teacher<br />
remuneration compares with other professions.<br />
Considerable insights could be gained from a tool that<br />
collects information directly from teachers, along the<br />
lines of the Organisation for Economic Co-operation<br />
<strong>and</strong> Development (OECD) Teaching <strong>and</strong> Learning<br />
International Survey, whose contribution has been<br />
acknowledged by all stakeholders. Given the dual<br />
potential for allowing cross-country comparison with<br />
high quality data but also for informing policy, it is worth<br />
considering the expansion of such a tool to cover low <strong>and</strong><br />
middle income countries.<br />
Finance: The coverage of basic data on government<br />
expenditure is remarkably low <strong>and</strong> there is a considerable<br />
time lag. But the main challenge is providing a comprehensive<br />
picture of all financing sources. Therefore the priority<br />
is to support the institutionalization of national<br />
education accounts, similar to national health accounts.<br />
This key step would bring all financing sources into a<br />
common measure <strong>and</strong> clarify who benefits from public<br />
education services.<br />
Civil society organizations have advocated the use of<br />
normative instruments for monitoring whether governments<br />
guarantee free education. While underst<strong>and</strong>ing whether<br />
education is free is important, the GEM Report argues<br />
that this is less likely to come from official policy<br />
documents than from monitoring the share of total<br />
education expenditure that households bear. Civil<br />
society organizations should therefore rally behind<br />
national education accounts <strong>and</strong> ensure that household<br />
income <strong>and</strong> expenditure survey data are available to<br />
facilitate analysis.<br />
Systems: A strong case has been made for education system<br />
indicators to be monitored. This is not to suggest that<br />
governments should be held to account for their institutional<br />
arrangements. Rather, the purpose is to facilitate dialogue<br />
<strong>and</strong> encourage governments to learn from each other.<br />
This idea has two implications. First, it would require<br />
agencies involved in collecting such information to<br />
collaborate to reduce overlaps in their diagnostic tools <strong>and</strong><br />
make more effective use of resources. Second, regional<br />
organizations, which may include education as one of their<br />
areas of cooperation, would have to play a larger role in<br />
developing their vision vis-à-vis the Education 2030 agenda<br />
<strong>and</strong> use this as a first step to collect in-depth information<br />
on comparable aspects of education systems.<br />
Education in the other SDGs: The scope for monitoring<br />
education in goals other than SDG 4 cannot be limited to<br />
the small number of global indicators in which education<br />
is explicitly mentioned. It also needs to consider<br />
education’s role in achieving particular development<br />
outcomes, building national capacity for SDG<br />
implementation <strong>and</strong> supporting adults in contributing<br />
to the broader transformation needed in economic <strong>and</strong><br />
political structures <strong>and</strong> in relation to the environment, all<br />
of which are key to the sustainable development agenda.<br />
RECOMMENDATIONS ON<br />
MONITORING THE EDUCATION<br />
AGENDA<br />
The above review of the monitoring of each target points<br />
to several priorities for action at the national, regional<br />
<strong>and</strong> global levels, the most important being to produce<br />
sufficient comparable information that allows global<br />
dialogue on progress towards SDG 4. This aim does not<br />
contradict the message that every country should be<br />
empowered to monitor its own progress towards SDG 4,<br />
focusing on its own national context <strong>and</strong> needs.<br />
The international education community has agreed<br />
on the monitoring framework, which consists of two<br />
complementary sets of indicators. First, there are<br />
11 global indicators that were developed as part of<br />
the Inter-agency <strong>and</strong> Expert Group on Sustainable<br />
Development Goal Indicators process; countries are<br />
expected to sign these during the United Nations<br />
General Assembly in September 2016. These indicators<br />
will be m<strong>and</strong>atory for monitoring SDG 4.<br />
Second, there are 43 thematic indicators, of which<br />
11 constitute the set of global indicators. The need for this<br />
2016 • GLOBAL EDUCATION MONITORING REPORT 379
23<br />
exp<strong>and</strong>ed list arose because the global indicators could not<br />
capture the full range of global education priorities. Countries<br />
are not required to report on the additional thematic<br />
indicators, unlike the global indicators. Instead, the additional<br />
indicators are meant to provide guidance as countries<br />
consider more in-depth ways to track their progress.<br />
The original list of thematic indicators was based on<br />
an initial expert proposal. UNESCO <strong>and</strong> the UNESCO<br />
Institute for Statistics (UIS) then set up the Technical<br />
Cooperation Group (TCG) on the Indicators for SDG4-<br />
Education 2030 to support their further development<br />
<strong>and</strong> implementation. The TCG includes 28 countries<br />
as members <strong>and</strong> 14 as observers, in addition to<br />
5 international bodies (including the GEM Report) <strong>and</strong><br />
2 international representatives of civil society. It is<br />
meant to be an umbrella group, incorporating bodies<br />
dedicated to specialized areas of the agenda, such as<br />
the Global Alliance for Monitoring Learning <strong>and</strong> the<br />
Inter-Agency Group on Education Inequality Indicators.<br />
The UIS serves as its secretariat.<br />
For every thematic indicator in the framework, the secretariat<br />
has provided detailed information on the definition <strong>and</strong><br />
sources <strong>and</strong> a preliminary classification according to the<br />
availability of methodology <strong>and</strong> actual data. One of the TCG’s<br />
first tasks is to address 8 of the 43 thematic indicators that<br />
have already been identified as poorly aligned with the<br />
target or difficult to implement. Initial decisions are<br />
expected when the TCG next meets in October 2016.<br />
The establishment of a permanent group for technical<br />
cooperation, representing a large number of countries, is<br />
a considerable advance in the international dialogue on<br />
education monitoring, <strong>and</strong> fills a notable gap experienced<br />
during the Education<br />
for All period. At least<br />
Countries must be given<br />
two challenges lie<br />
ahead. First, countries<br />
a chance to contribute<br />
must be assured<br />
to discussions in the an opportunity<br />
Technical Cooperation<br />
to contribute to<br />
discussions in<br />
Group in an informed<br />
an informed <strong>and</strong><br />
<strong>and</strong> meaningful way meaningful way. Their<br />
active role in the TCG<br />
is critical. Indeed, one<br />
objective of the monitoring part of the 2016 GEM Report<br />
is to serve as a reference document for such discussions.<br />
Second, a mechanism is needed for future decisionmaking<br />
within the TCG, to help reach consensus <strong>and</strong><br />
strengthen the group’s legitimacy.<br />
AT THE NATIONAL LEVEL:<br />
BUILD CAPACITY IN SIX KEY AREAS<br />
Where do countries st<strong>and</strong> in relation to the emerging<br />
monitoring challenges? It is essential for education<br />
ministries <strong>and</strong> national statistical agencies not to<br />
lose track of the big picture with so many competing<br />
requests for their time <strong>and</strong> resources. This section<br />
focuses on six key steps countries need to take to<br />
strengthen national monitoring of education in the next<br />
three to five years while concurrently contributing to the<br />
development of a global monitoring framework.<br />
Work is needed to address equity. Education management<br />
information systems produce data usually based<br />
on school censuses that fail to shed light on basic<br />
disparity – in access, participation, completion <strong>and</strong><br />
learning – by student characteristics. But the rest of<br />
the national statistical system can often produce highly<br />
relevant information on education inequality through<br />
household or labour force surveys. Unfortunately, these<br />
two systems are disconnected in many countries so<br />
education ministries lack the capacity to recognize<br />
the complementary <strong>and</strong> critical nature of the evidence<br />
produced by national statistical agencies. A classic<br />
example is that education ministries are not sufficiently<br />
involved in the design of national household surveys<br />
<strong>and</strong> hence education questions are poorly formulated,<br />
undermining analysis <strong>and</strong> cross-country comparisons.<br />
This situation needs to change. Dialogue <strong>and</strong><br />
cooperation are needed between education ministries<br />
<strong>and</strong> national statistical agencies. Target 4.5 requires<br />
reporting on disparity through a series of education<br />
indicators. Countries need to agree on a new mechanism<br />
for this reporting. The work of the Inter-Agency Group<br />
on Education Inequality Indicators can help initiate a<br />
process for continued dialogue.<br />
Definitions of learning outcomes need to be broadened.<br />
Countries need to ensure the establishment of samplebased<br />
national learning assessments that can be used<br />
to monitor progress on a range of learning outcomes<br />
over time. Such assessment frameworks need to be of<br />
good quality <strong>and</strong> meet st<strong>and</strong>ards that the international<br />
community can help define, regarding not only technical<br />
aspects of reliability <strong>and</strong> validity but also openness <strong>and</strong><br />
transparency in the publication of results.<br />
Countries will need good guidance to build assessment<br />
frameworks to ensure they produce information to<br />
improve teaching <strong>and</strong> learning processes. Reporting for<br />
a global indicator would be a helpful by-product, though<br />
380<br />
CHAPTER 23 | PRIORITIES FOR MONITORING EDUCATION IN THE SUSTAINABLE DEVELOPMENT GOALS
23<br />
not the main concern. Countries also need to take<br />
responsibility for monitoring the skills of those who have<br />
never been to school or who left school early. A first step<br />
would be to assess the skills of youth <strong>and</strong> adults.<br />
A new strategy for assessing learning, <strong>and</strong><br />
communicating its purpose, is essential to shift the<br />
nature of national education debates. In many countries,<br />
learning outcomes are still often mistakenly equated<br />
with pass rates in national high stakes examinations,<br />
such as those at the end of the basic education cycle<br />
or for transition into higher education. In contexts with<br />
high stakes testing, change is likely to be slow.<br />
In terms of quality, learning outcomes are not the only<br />
key element. A focus on learning is essential to generate<br />
debate that has often been lacking. But such a focus can<br />
also create high expectations that learning outcomes<br />
will improve rapidly; experience over the last two<br />
decades suggests this is not likely (Clarke, 2016). If there<br />
is too much focus on learning outcomes, other urgent<br />
questions on education quality risk being neglected.<br />
For example, target 4.7, on sustainable development<br />
<strong>and</strong> global citizenship, is a linchpin of the new global<br />
education agenda. To ensure commitment to its<br />
objectives, countries need to closely monitor policies,<br />
curricula, textbooks <strong>and</strong> teacher education programmes,<br />
as well as learning outcomes.<br />
Another important aspect of quality is to identify the<br />
topics <strong>and</strong> concepts which should be conveyed through<br />
education, then define the desired results of education<br />
systems in relation to them. One way to start would be<br />
mapping how these concepts are promoted at different<br />
levels of the education system in policies, textbooks <strong>and</strong><br />
classroom practices. It would also be useful for countries<br />
to engage in frank dialogue with each other on how<br />
effectively they address issues of tolerance, respect for<br />
diversity, group identity, collaboration, human rights <strong>and</strong><br />
sustainability in their education systems. Such openness<br />
is not easy <strong>and</strong> requires political courage.<br />
It is essential not to lose track of lifelong learning <strong>and</strong> its<br />
monitoring <strong>and</strong> expansion. Achievement of the SDGs calls<br />
for massive social <strong>and</strong> economic transformation. Schooling<br />
alone cannot deliver all the desired outcomes. Even if<br />
the entire cohort of 15- to 19-year-olds were to complete<br />
secondary education by 2030, this would be insufficient;<br />
the vast majority of the adults who will be called upon to<br />
make critical decisions relating to sustainable development<br />
will have already completed their schooling <strong>and</strong> not been<br />
exposed to the relevant content.<br />
In most of countries, the education needs, opportunities<br />
<strong>and</strong> accomplishments of the adult population are not<br />
being monitored. Countries need mechanisms that track<br />
adult education <strong>and</strong> learning opportunities, including<br />
those geared to the sustainable development agenda.<br />
This report has provided the example of the systematic<br />
approach followed in Europe, yet even that was only<br />
from the perspective of what is relevant for work. The<br />
world needs to move beyond this to capture a fuller<br />
range of lifelong learning opportunities that is fit for the<br />
purpose of the SDGs.<br />
Analysing education systems requires finding the right<br />
forums <strong>and</strong> prioritizing the right issues. It is relatively<br />
easy for countries to engage in debate on key education<br />
challenges through their membership in organizations of<br />
regional cooperation, which can offer the best channels<br />
for exchanging information on education structures <strong>and</strong><br />
system characteristics. Countries need to champion such<br />
collaboration. This is not a call for increased homogenization<br />
of education systems, but rather for openness in comparing<br />
how countries deal with similar problems.<br />
Equity <strong>and</strong> inclusion are examples of issues to prioritize.<br />
Much can be gained by comparing how countries approach<br />
them. The GEM Report advocates for countries to<br />
answer a set of basic questions on how they try to offset<br />
disadvantage among students <strong>and</strong> schools, so as to better<br />
underst<strong>and</strong> which countries have the most effective results.<br />
Finally, countries are encouraged to adopt the national<br />
education accounts approach to improve monitoring<br />
of finance. Education finance has often focused on<br />
government spending or on how much poorer countries<br />
receive in aid. What is needed is to shift the debate to<br />
better underst<strong>and</strong> who contributes what resources to<br />
what activities.<br />
This outlook provides a completely different picture,<br />
showing how education expenditure is shared between<br />
governments <strong>and</strong> households. What emerges is the<br />
realization that while there may be a policy of free<br />
education, households often bear a very large share<br />
of the total cost. This undermines equity, a fact that<br />
remains underappreciated by policy-makers.<br />
Shifting to the new approach will be tricky. The<br />
international community must encourage countries<br />
2016 • GLOBAL EDUCATION MONITORING REPORT 381
23<br />
to adopt national education accounts, but not<br />
overburden them with procedures that pose excessively<br />
technical dem<strong>and</strong>s.<br />
These recommendations in six key areas are relevant<br />
to all countries, reflecting the universal character of the<br />
SDG agenda, even if low <strong>and</strong> middle income countries<br />
need to do more work. The recommendations assume<br />
that countries take seriously their responsibility<br />
for monitoring the SDGs <strong>and</strong> are prepared to do<br />
what it takes, receiving technical <strong>and</strong> financial<br />
support where needed.<br />
Countries have already engaged at the regional level<br />
with the UIS in important mapping exercises assessing<br />
where they st<strong>and</strong> vis-à-vis the global <strong>and</strong> thematic<br />
indicators (UIS, 2016). This rapid appraisal exercise<br />
served an important purpose of familiarizing countries<br />
with the monitoring framework as well as giving an<br />
early indication of data availability. But this exchange<br />
may also have overwhelmed countries with details <strong>and</strong><br />
technical issues.<br />
The recommendations above try to address the big<br />
picture. Numerous key changes are needed, which are a<br />
condition for reforms in education monitoring systems<br />
that will allow them to cope with the challenges of the<br />
Education 2030 agenda. Getting these changes right first<br />
will make it easier for countries to then take ownership of<br />
their monitoring agenda <strong>and</strong> make decisions on where to<br />
allocate resources <strong>and</strong> from where to seek technical <strong>and</strong><br />
financial support.<br />
AT THE REGIONAL LEVEL: SUPPORT<br />
PEER LEARNING<br />
While the Education 2030 agenda is global, progress in<br />
many areas is more likely to happen at the regional level,<br />
particularly where qualitative, system-related information<br />
is needed. Countries are increasingly collecting better<br />
<strong>and</strong> more systematic information through quantitative<br />
indicators. This is insufficient, however; comparative<br />
information is needed to underst<strong>and</strong> how countries<br />
in similar situations have responded <strong>and</strong> to help guide<br />
governments in the next steps.<br />
The role of regional organizations is critical. Where such<br />
organizations include education among their concerns,<br />
this can help make the global education agenda<br />
more specific to members’ contexts. The GEM Report<br />
highlights the experience of bodies such as the European<br />
Union <strong>and</strong> the Organization of Ibero-American States.<br />
The European Union’s education strategy is supported<br />
by a network that regularly provides policy information<br />
on key issues to member states, which exchange<br />
information voluntarily, <strong>and</strong> take part in forums to learn<br />
from their peers.<br />
Countries in a given region tend to have common<br />
education contexts. Their comparative reviews often<br />
reflect shared values,<br />
objectives <strong>and</strong><br />
challenges. Members<br />
Regional organizations of regional entities<br />
should help make the are therefore more<br />
likely to express<br />
global education agenda<br />
deeper political<br />
more specific <strong>and</strong><br />
commitment to, <strong>and</strong><br />
relevant to the contexts national ownership<br />
of, undertaking peer<br />
of their members<br />
reviews. And the<br />
results of regional<br />
monitoring are much<br />
more likely to be used in policy-making <strong>and</strong> sustained<br />
over time, not least because governments have an<br />
interest in neighbouring countries’ performance.<br />
AT THE GLOBAL LEVEL: FOSTER CONSENSUS<br />
AND COORDINATION<br />
With the basic parameters of the monitoring framework<br />
<strong>and</strong> a global consultation mechanism in place, the GEM<br />
Report has three recommendations on how to improve<br />
the global coordination of monitoring approaches.<br />
First, an international household survey programme,<br />
dedicated to education, is needed to cover many of the<br />
information gaps in the new agenda. There have been<br />
attempts to establish such a programme. Beginning in<br />
the early 2000s, alongside the Demographic <strong>and</strong> Health<br />
Survey (DHS) programme, USAID funded educationspecific<br />
EdData surveys in a few countries. However, this<br />
initiative was limited to only a few countries <strong>and</strong> did not<br />
become generalized. Since then, funders have shown<br />
a lack of willingness to finance an education-specific<br />
survey. Few questions are dedicated to education in the<br />
questionnaires of major cross-country multipurpose<br />
surveys such as the DHS, the UNICEF Multiple Indicator<br />
Cluster Surveys <strong>and</strong> the World Bank Living St<strong>and</strong>ards<br />
Measurement Study. And these surveys are reluctant<br />
to add more questions on education, given the many<br />
dem<strong>and</strong>s on their resources.<br />
382<br />
CHAPTER 23 | PRIORITIES FOR MONITORING EDUCATION IN THE SUSTAINABLE DEVELOPMENT GOALS
23<br />
In light of the exp<strong>and</strong>ed scope of the Education 2030<br />
monitoring agenda <strong>and</strong> its many gaps, the question<br />
of an education-specific survey needs to be revisited.<br />
Such a tool could address issues such as participation<br />
in early childhood, technical-vocational, tertiary <strong>and</strong><br />
adult education; the use of language at home <strong>and</strong> in<br />
school; the collection of detailed information on school<br />
attendance; <strong>and</strong> the direct assessment of literacy <strong>and</strong><br />
numeracy skills. Potential donors need to discuss the<br />
cost-effectiveness of a new tool of this kind.<br />
The second recommendation is for a consistent approach<br />
to support the monitoring of learning outcomes.<br />
Countries need support to build national assessment<br />
systems that have solid foundations <strong>and</strong> are in their best<br />
interests. Some countries face a multitude of options<br />
from development partners that stretch their capacity.<br />
A code of conduct among donors <strong>and</strong> a common pool<br />
of resources are needed, with priorities including the<br />
building of national capacity, the provision of long-term<br />
support <strong>and</strong> the avoidance of overlap. Coordinated<br />
support would also help countries gain access to shared<br />
resources <strong>and</strong> knowledge networks.<br />
Third, analysis of several measurement challenges in<br />
the GEM Report highlights the fact that, with the<br />
exp<strong>and</strong>ed scope of the Education 2030 agenda, many<br />
targets have not yet been measured on a global scale.<br />
Indicators, especially those related to learning outcomes,<br />
have not yet been fully developed. A common challenge<br />
is that large differences in culture <strong>and</strong> other contextual<br />
factors hamper clear, comparable definitions of such<br />
concepts as early childhood development, relevant<br />
learning outcomes in basic education, digital literacy <strong>and</strong><br />
skills for global citizenship.<br />
Therefore, this report recommends that institutions<br />
like the UIS, with the support of the TCG, set a research<br />
agenda related to the challenges of comparative<br />
measurement in education. To be valid, proposed<br />
measures need to be tested on the ground <strong>and</strong> at<br />
scale. In key areas of global education, research on<br />
measurement is fragmented. While there is much national<br />
expertise, there is little pooling of resources to address<br />
questions in a cross-country, cross-cultural context. In<br />
the absence of a coordinating institution, it is strongly<br />
recommended that a research hub be established to<br />
focus on issues related to the major gaps in the global<br />
monitoring of education. Education could draw lessons<br />
from partnerships or networks in health or agriculture<br />
that have pooled research resources to similar effect.<br />
Framing the debate: what data revolution for education?<br />
Much of the discussion about global monitoring of the<br />
SDGs has been cast in terms of a ‘data revolution’. The<br />
term can be defined in many ways, but one of the most<br />
widely used descriptions is found in the final document<br />
of the United Nations Secretary-General’s Independent<br />
Expert Advisory Group on the Data Revolution for<br />
Sustainable Development: ‘New technologies are leading<br />
to an exponential increase in the volume <strong>and</strong> types of<br />
data available, creating unprecedented possibilities for<br />
informing <strong>and</strong> transforming society <strong>and</strong> protecting the<br />
environment. Governments, companies, researchers<br />
<strong>and</strong> citizen groups are in a ferment of experimentation,<br />
innovation <strong>and</strong> adaptation to the new world of data, a<br />
world in which data<br />
are bigger, faster <strong>and</strong><br />
more detailed than<br />
The GEM Report<br />
ever before’ (United<br />
believes that the<br />
Nations, 2014c).<br />
concept of a ‘data<br />
The GEM Report<br />
revolution’ associated<br />
takes the view that<br />
with technology <strong>and</strong> the concept of a ‘data<br />
‘big data’ is likely to be revolution’ associated<br />
with technology <strong>and</strong><br />
irrelevant in education,<br />
‘big data’ is likely to be<br />
if not misleading<br />
irrelevant in education,<br />
if not misleading.<br />
Most countries are<br />
still grappling with compiling basic education data <strong>and</strong><br />
underst<strong>and</strong>ing their purposes <strong>and</strong> uses. And most of the<br />
issues confronting countries are about basic concepts,<br />
such as what is meant by literacy proficiency skills or<br />
early childhood development. In addition, there is a<br />
need to invest in robust monitoring systems. In both<br />
these areas, the international community is called upon<br />
to provide assistance. Rather than overhauling ways<br />
of collecting data <strong>and</strong> bringing about a ‘revolution’<br />
through technological means, better coordination<br />
between agencies <strong>and</strong> more resources to implement<br />
plans would bring about the changes needed to monitor<br />
Education 2030.<br />
Moreover, accessibility, openness <strong>and</strong> accountability of<br />
data in education remain constrained. Many countries<br />
carry out household, school or learning achievement<br />
surveys but do not make the results or the data public.<br />
Countries need to do much more to promote the<br />
availability of data <strong>and</strong> encourage their use. This must<br />
be a key part of any ‘revolution’ if it is to be in the<br />
service of all.<br />
2016 • GLOBAL EDUCATION MONITORING REPORT 383
Rotan, who lives<br />
in the Korail slum,<br />
Dhaka, Bangladesh<br />
prepares to leave for<br />
classes at the BRAC<br />
primary school.<br />
384<br />
CHAPTER 24 | EPILOGUE<br />
CREDIT: Conor Ashleigh/Australian<br />
Department of Foreign Affairs <strong>and</strong> Trade
CHAPTER<br />
24<br />
Epilogue<br />
385
24<br />
The GEM Report as an informed <strong>and</strong> honest broker on issues of<br />
education <strong>and</strong> sustainable development.....................................................................387<br />
Strengthening accountability in the SDG follow-up <strong>and</strong> review<br />
architecture – <strong>and</strong> in education....................................................................................... 388<br />
One year has passed since 193 member states of the<br />
United Nations unanimously adopted the 2030<br />
Agenda for Sustainable Development. As efforts to<br />
implement the ambitious 17 Sustainable Development<br />
Goals (SDGs) gather steam, member states <strong>and</strong> the<br />
international community can build on the experience<br />
gained from the agenda’s two predecessors, Agenda 21<br />
<strong>and</strong> the Millennium Development Goals (MDGs).<br />
One vital lesson learned from these earlier global<br />
development agendas was that systematic follow-up<br />
<strong>and</strong> review are critically important. A crucial challenge<br />
has been the tension between global commitment <strong>and</strong><br />
national implementation. The 2030 Agenda is not legally<br />
binding <strong>and</strong> cannot<br />
be legally enforced.<br />
Instead, it sets out a<br />
Systematic follow-up <strong>and</strong><br />
collective vision for<br />
review is critical for global <strong>people</strong> <strong>and</strong> <strong>planet</strong><br />
development agendas; that requires political<br />
will, resources<br />
a crucial challenge is the<br />
<strong>and</strong> collaboration.<br />
tension between global<br />
commitment <strong>and</strong> national<br />
Legitimate issues<br />
have been raised<br />
implementation<br />
about past agendas<br />
such as the MDGs.<br />
Did the international<br />
goals <strong>and</strong> targets establish an agenda that was truly<br />
global, or mainly applied to ‘developing countries’? Were<br />
the targets to be monitored in global terms without<br />
reference to national boundaries, or were they meant<br />
to influence national policies <strong>and</strong> strategies <strong>and</strong> be<br />
monitored as such? If success is defined in all-or-nothing<br />
terms, does this not ignore countries’ progress, which<br />
may have been significant even without reaching the<br />
actual goal? Br<strong>and</strong>ing struggling countries with a mark<br />
of failure while disregarding their accomplishments<br />
is not constructive. Moreover, successful national<br />
strategies may look quite different, reflecting the<br />
diversity of context between <strong>and</strong> even within countries<br />
(V<strong>and</strong>emoortele, 2014).<br />
Hindsight has not solved these issues. They are still valid<br />
one year into the 2030 Agenda’s implementation <strong>and</strong><br />
certainly relevant for SDG 4 on education. What does<br />
the universal sustainable development agenda mean<br />
in practice? Are all targets appropriate for all countries,<br />
in equal measure? What about wealthy countries<br />
that in the past have participated solely in terms of<br />
official development assistance? How can progress be<br />
measured in a way that reflects the diversity of country<br />
implementation? If a country decides to prioritize some<br />
targets over others, for whatever reasons, should this be<br />
considered a failure?<br />
The international community has taken the first steps<br />
to build a global architecture for follow-up <strong>and</strong> review. A<br />
rough sketch was originally outlined in the UN Secretary-<br />
General’s report on ‘critical milestones’, which are<br />
expected to be adopted through a General Assembly<br />
resolution (United Nations, 2016c).<br />
The High-Level Political Forum (HLPF) has served as the<br />
main international platform to provide political leadership<br />
<strong>and</strong> guidance on development issues. Participants<br />
included UN member states <strong>and</strong> commissions,<br />
intergovernmental bodies, major groups – such as<br />
business, non-government organizations, partnerships<br />
<strong>and</strong> alliances – <strong>and</strong> large cities. When it convened in<br />
386<br />
CHAPTER 24 | EPILOGUE
24<br />
“<br />
When the High-Level Political Forum first convened in July 2016, it<br />
emphasized that assessment of SDG success must be based on the<br />
well-being of the most vulnerable groups<br />
”<br />
July 2016, under the theme ‘Leaving no one behind’, it<br />
emphasized that assessment of SDG success must be<br />
based on the well-being of the most vulnerable groups,<br />
both nationally <strong>and</strong> globally.<br />
The HLPF’s work has been informed by the first edition<br />
of the SDG Report, an annual progress report following<br />
in the footsteps of the MDG Report, which summarizes<br />
regional <strong>and</strong> global patterns <strong>and</strong> trends for each goal,<br />
based on a subset of the SDG indicator framework<br />
expected to be approved by the UN General Assembly<br />
in September 2016 (United Nations, 2016b). The SDG<br />
data repository, on which the report is based, is an<br />
achievement in its own right. However, there are concerns<br />
that certain indicators covered by the SDG Report are not<br />
relevant to many countries.<br />
The HLPF was also informed by the first set of national<br />
reviews, submitted voluntarily by 22 member states<br />
(United Nations, 2016a). 1 These reviews are the backbone<br />
of the new follow-up <strong>and</strong> review architecture. They<br />
suggest that several obstacles common to many SDGs<br />
circumscribe progress on them: financing, capacity,<br />
governance <strong>and</strong> the immediate day-to-day concerns of<br />
national governments. The national reviews also show<br />
wide gaps in how countries perceive their role. For some<br />
wealthier countries, the 2030 Agenda may still be seen as<br />
a development strategy that pertains to other countries.<br />
Experience from this first year highlights a st<strong>and</strong>ing<br />
dilemma in international agreements: what are effective<br />
means <strong>and</strong> instruments to promote implementation of<br />
global statements of intent at the national level?<br />
THE GEM REPORT AS AN<br />
INFORMED AND HONEST BROKER<br />
ON ISSUES OF EDUCATION AND<br />
SUSTAINABLE DEVELOPMENT<br />
Experience has shown that regional associations (in<br />
which countries typically share values, objectives<br />
<strong>and</strong> challenges) <strong>and</strong> thematic groups (within which<br />
particular themes <strong>and</strong> concerns come to be shared<br />
<strong>and</strong> seen as appropriate) can serve as bridges between<br />
global dialogue <strong>and</strong> national initiatives. The proposed<br />
follow-up <strong>and</strong> review architecture has opened space for<br />
thematic reviews <strong>and</strong> regional indicators – a welcome<br />
development, as high level global discussions can be<br />
difficult to link to the concerns of individual countries<br />
as well as specialized groups such as the international<br />
education community.<br />
In the Education for All (EFA) agenda, the EFA Global<br />
Monitoring Report series begun in 2002 became accepted<br />
by governments <strong>and</strong> civil society as a major thematic<br />
follow-up <strong>and</strong> review mechanism. It provided in-depth<br />
information <strong>and</strong> analysis <strong>and</strong> acted as an international<br />
reference point. It sharpened the focus <strong>and</strong> gave voice to<br />
important emerging issues in education, helping prioritize<br />
<strong>and</strong> clarify what is at stake. It facilitated dialogue among<br />
global, regional <strong>and</strong> national actors <strong>and</strong>, to a lesser<br />
extent, among sectors including health, gender <strong>and</strong><br />
social protection.<br />
At the World Education Forum in May 2015,<br />
representatives of the international education<br />
community renewed the report’s m<strong>and</strong>ate to continue<br />
as the Global Education Monitoring Report (GEM Report).<br />
The fundamental aim of the new series is to address<br />
how education at all stages of life – in school, at the<br />
workplace, at home <strong>and</strong> in the community – can be made<br />
more inclusive, equitable <strong>and</strong> of higher quality.<br />
2016 • GLOBAL EDUCATION MONITORING REPORT 387
24<br />
The aim of the new GEM Report series is<br />
to address how education at all stages of<br />
life – in school, at the workplace, at home<br />
<strong>and</strong> in the community – can be made more<br />
inclusive, equitable <strong>and</strong> of higher quality<br />
The 2016 GEM Report focuses attention on two<br />
overarching issues. First, it carefully addresses an<br />
integral feature of the SDG agenda – the interdependent<br />
nature of the goals – by exploring the close links<br />
between education <strong>and</strong> other sustainable development<br />
outcomes. The challenges facing <strong>people</strong> <strong>and</strong> <strong>planet</strong> are<br />
enormous <strong>and</strong> urgent. The broad role that education<br />
<strong>and</strong> lifelong learning can <strong>and</strong> must play is not always<br />
fully appreciated. The report draws attention to the<br />
interconnectedness of natural <strong>and</strong> social systems<br />
<strong>and</strong> interlinkage between sectors, with education as<br />
a powerful catalyst. The need to integrate equitable<br />
education of good quality into the SDG agenda<br />
should be a primary aspiration of the education <strong>and</strong><br />
development communities.<br />
Second, the broadening of the education agenda’s scope<br />
requires reflection. How will the world monitor progress<br />
on so many ambitious targets? A monitoring framework<br />
has been devised that attempts to capture many of<br />
the new areas. However, the framework for SDG 4 is<br />
underwhelming in its ability to capture core concerns<br />
<strong>and</strong> challenges of sustainable development. By drawing<br />
attention to gaps <strong>and</strong> needed actions, the 2016 GEM<br />
Report seeks to become a critical reference document<br />
as the international community discusses the existing<br />
monitoring framework <strong>and</strong> seeks to improve it.<br />
There is much to be learned. The 2019 HLPF will be the<br />
first high level gathering of the SDG period to discuss<br />
the state of education. Given what is known about the<br />
strengths <strong>and</strong> weaknesses of the SDG process, it is not<br />
too early to ask what key issues should be discussed<br />
at this gathering, what decisions should be taken, what<br />
information is needed to facilitate the decisions <strong>and</strong> how<br />
this information should be presented <strong>and</strong> communicated.<br />
For example, a key to accelerating progress is sustained<br />
financing. Investing in education is fundamental for global<br />
well-being. The 2019 HLPF could be an important occasion<br />
to take stock of implementation of the September 2016<br />
recommendations of the International Commission on<br />
the Financing of Global Education Opportunity. Another<br />
key is the ability to disaggregate data to enable rapid <strong>and</strong><br />
appropriate response to the needs of diverse groups <strong>and</strong><br />
ensure that no one is left behind.<br />
The GEM Report’s role in this process is understood to<br />
be that of an honest broker, an impartial but visionary<br />
mediator of information, working towards the delivery<br />
of global public goods for the elimination of poverty, for<br />
healthy lives, for the sustainable use of natural resources<br />
<strong>and</strong> for a better future for the <strong>planet</strong> <strong>and</strong> coming<br />
generations. The education of children, youth <strong>and</strong> adults<br />
has a critical role in each of these scenarios.<br />
STRENGTHENING ACCOUNTABILITY<br />
IN THE SDG FOLLOW-UP AND<br />
REVIEW ARCHITECTURE – AND<br />
IN EDUCATION<br />
For the follow-up <strong>and</strong> review process to work towards<br />
achievement of the SDGs, information will need to spur<br />
action <strong>and</strong> action must be turned into results. But will<br />
this happen? It is expected that highlighting inequality<br />
in education will result in larger financial allocations that<br />
are better targeted to schools or countries in need, <strong>and</strong><br />
that evidence on poor learning outcomes will translate<br />
into better efforts to underst<strong>and</strong> where teaching needs<br />
to improve. In other words, it is believed that identifying<br />
problems will spur the right action to make a difference<br />
by those who are responsible at various levels – global,<br />
national, local, community <strong>and</strong> individual.<br />
However, it has been shown time <strong>and</strong> again that such<br />
positive action does not always occur. There are donors<br />
that continue to allocate much less than 0.7% of their<br />
gross national income to aid, governments that spend<br />
well under 4% of their gross domestic product on<br />
education, systems that assign resources unequally<br />
between schools, budgets that favour the advantaged,<br />
<strong>and</strong> teachers who are unsupported or do not respect<br />
their code of conduct – all of which combine to result in<br />
millions of children achieving well below their potential.<br />
How to encourage responsible behaviour is still a<br />
burning question.<br />
As part of the SDG process, accountability for achieving<br />
international goals is built on a commitment to a<br />
388<br />
CHAPTER 24 | EPILOGUE
24<br />
‘robust, voluntary, effective, participatory, transparent<br />
<strong>and</strong> integrated follow-up <strong>and</strong> review framework’ to<br />
‘track progress in implementing this Agenda’ (United<br />
Nations, 2015).<br />
How will this be<br />
achieved? The 2017 GEM<br />
The 2017 GEM Report<br />
Report will explore the<br />
will explore the role<br />
role of accountability in<br />
of accountability in education at all levels,<br />
recognizing that multiple,<br />
education at all levels<br />
diverse actors working<br />
within <strong>and</strong> across<br />
countries are responsible<br />
for the future of the SDGs. For each of these actors to be<br />
successful, there must be a strong enabling environment<br />
in which they underst<strong>and</strong> their responsibilities <strong>and</strong> have<br />
the capacity <strong>and</strong> resources to act accordingly, along with<br />
the will <strong>and</strong> motivation to make an honest effort.<br />
These actors need to buy into the process, accept its<br />
worth, <strong>and</strong> then take on their responsibility. But creating<br />
a genuine buy-in that motivates actors to do what is<br />
necessary to fulfil their obligations often involves a shift<br />
in culture. Mutual accountability can help with this shift<br />
by combining top-down <strong>and</strong> bottom-up approaches, as<br />
well as internal <strong>and</strong> external mechanisms. This motivates<br />
actors by creating a more just <strong>and</strong> fair system that<br />
assists in the development <strong>and</strong> realization of collective<br />
aims, which carry enormous value in education.<br />
ENDNOTES<br />
1. The 22 countries are China, Colombia, Egypt, Estonia, Finl<strong>and</strong>, France,<br />
Georgia, Germany, Madagascar, Mexico, Montenegro, Morocco, Norway, the<br />
Philippines, the Republic of Korea, Samoa, Sierra Leone, Switzerl<strong>and</strong>, Togo,<br />
Turkey, Ug<strong>and</strong>a <strong>and</strong> the Bolivarian Republic of Venezuela.<br />
2016 • GLOBAL EDUCATION MONITORING REPORT 389
Children use the<br />
blackboard to lean<br />
on in the Dan Saa<br />
school, Niger.<br />
CREDIT: Tagaza Djibo/UNESCO<br />
390<br />
ANNEX
Annex<br />
Statistical Tables<br />
Introduction........................................................................................................................................................................ 392<br />
Table 1: Background demographic statistics, legal guarantee of compulsory <strong>and</strong> free education <strong>and</strong><br />
structure of national education system...............................................................................................................................401<br />
Table 2: SDG 4, Target 4.1 – Universal access, participation <strong>and</strong> completion,<br />
primary education..........................................................................................................................................................................409<br />
Table 3: SDG 4, Target 4.1 - Universal access, participation <strong>and</strong> completion, secondary education.........417<br />
Table 4: SDG 4, Target 4.2 – Universal access to early childhood development, care <strong>and</strong><br />
pre-primary education...................................................................................................................................................................425<br />
Table 5: SDG 4, Target 4.3 – Universal access to technical, vocational <strong>and</strong><br />
tertiary education........................................................................................................................................................................... 429<br />
Table 6: SDG 4, Target 4.4 – Youth <strong>and</strong> adult skills for employment, decent jobs<br />
<strong>and</strong> entrepreneurship.....................................................................................................................................................................437<br />
Table 7: SDG 4, Target 4.5 – Gender – Eliminating gender disparity in education............................................ 441<br />
Table 8: SDG 4, Target 4.5 – Gender – Achieving gender equality in education................................................ 445<br />
Table 9: SDG 4, Target 4.5 - Equity - Equal completion of school for vulnerable groups.............................. 449<br />
Table 10: SDG 4, Target 4.6 – Youth <strong>and</strong> adult literacy <strong>and</strong> numeracy....................................................................453<br />
Table 11: SDG 4, Target 4.7 – Education for sustainable development <strong>and</strong><br />
global citizenship..............................................................................................................................................................................457<br />
Table 12: SDG 4, Means of implementation 4.a <strong>and</strong> 4.b – Education facilities,<br />
learning environments <strong>and</strong> internationally inbound <strong>and</strong> outbound tertiary students................................. 461<br />
Table 13: SDG 4, Means of implementation 4.c – Teaching staff, teacher qualifications<br />
<strong>and</strong> training in pre-primary, primary, secondary <strong>and</strong> tertiary education........................................................... 465<br />
Table 14: Domestic financial commitment to education: public spending...........................................................473<br />
Aid Tables<br />
Introduction..................................................................................................................................................... 478<br />
Table 1: Bilateral <strong>and</strong> multilateral ODA.................................................................................................................................... 481<br />
Table 2: Bilateral <strong>and</strong> multilateral aid to education......................................................................................................... 482<br />
Table 3: Recipients of aid to education.................................................................................................................................484<br />
Table 4: ODA recipients.................................................................................................................................................................490<br />
Glossary............................................................................................................................................................. 493<br />
Abbreviations...................................................................................................................................................497<br />
Index.....................................................................................................................................................................501<br />
391
A shoe rack in a school<br />
in the Chittagong,<br />
Bangladesh, showing<br />
the number of<br />
children attending<br />
class that day.<br />
CREDIT: Ripon Barua/UNESCO<br />
392<br />
ANNEX | STATISTICAL TABLES
5<br />
Statistical tables 1<br />
INTRODUCTION<br />
FROM EDUCATION FOR ALL TO THE<br />
EDUCATION SUSTAINABLE DEVELOPMENT<br />
GOAL: NEW AGENDA, NEW STATISTICAL TABLES<br />
With the adoption in September 2015 of the 2030<br />
Agenda for Sustainable Development – which sets new<br />
development priorities, including for education through<br />
the fourth Sustainable Development Goal (SDG 4) – <strong>and</strong>,<br />
in November 2015, of the Education 2030 Framework<br />
for Action at the 38th session of the UNESCO General<br />
Conference, the Education for All (EFA) cycle came to an<br />
end. With this edition of the Global Education Monitoring<br />
Report (GEM Report), the statistical tables are evolving to<br />
reflect the new education agenda.<br />
The tables have been reorganized to reflect <strong>and</strong> align<br />
with (a) the aspirational nature <strong>and</strong> great ambition of<br />
the Education 2030 agenda, which has at its core equity<br />
<strong>and</strong> inclusion <strong>and</strong> embraces a lifelong perspective; (b) the<br />
seven SDG 4 targets <strong>and</strong> three means of implementation,<br />
which are not only about access to, participation in <strong>and</strong><br />
completion of education, but also have education quality<br />
at their core in terms of inputs, outputs, processes,<br />
learning outcomes <strong>and</strong> environments, <strong>and</strong> the skills<br />
youth <strong>and</strong> adults must be equipped with for decent<br />
work; <strong>and</strong> (c) a broad set of 43 internationally comparable<br />
thematic indicators, of which 11 are global indicators. 2<br />
Consequently, the statistical tables of the GEM Report<br />
aim to be more comprehensive than in earlier reports,<br />
while reflecting significant limitations in terms of data<br />
availability <strong>and</strong> country coverage, particularly regarding<br />
some indicators that still need to be defined <strong>and</strong><br />
developed. Accordingly, placeholders or proxy indicators<br />
are occasionally used. These statistical tables contain<br />
more indicators than in earlier reports, particularly<br />
on education quality, learning outcomes, youth <strong>and</strong><br />
adult skills (including not only literacy <strong>and</strong> numeracy<br />
but also information <strong>and</strong> communications technology<br />
skills) <strong>and</strong> tertiary education. While aligned with the<br />
proposed thematic <strong>and</strong> global indicators, the statistical<br />
tables include additional indicators – such as repetition,<br />
dropout, <strong>and</strong> transition from primary to secondary<br />
education <strong>and</strong> from secondary to tertiary – which remain<br />
critical but were left out of the new indicator set.<br />
In addition to administrative data provided to the UIS<br />
by education ministries worldwide, the statistical tables<br />
rely on data from other sources, including national,<br />
regional <strong>and</strong> international learning assessments;<br />
national <strong>and</strong> international household surveys, such as<br />
the Demographic <strong>and</strong> Health Surveys <strong>and</strong> UNICEF’s<br />
Multiple Indicator Cluster Surveys; <strong>and</strong> bodies including<br />
the Joint United Nations Programme on HIV/AIDS<br />
(UNAIDS), the Organisation for Economic Co-operation<br />
<strong>and</strong> Development (OECD), UNICEF, the United Nations<br />
Population Division (UNPD), the World Bank <strong>and</strong> the<br />
World Health Organization (WHO).<br />
The new statistical tables are organized by targets <strong>and</strong><br />
means of implementation instead of by education level<br />
(from pre-primary to tertiary) as was formerly the case;<br />
this results in some seeming anomalies, such as early<br />
childhood care <strong>and</strong> education coming after primary <strong>and</strong><br />
secondary education. As in the past, the tables include<br />
domestic education finance, which, though absent from<br />
the SDG 4 targets, is a key means of implementation<br />
<strong>and</strong> an enabling factor to achieve the targets. Because of<br />
the comprehensiveness of the new statistical tables <strong>and</strong><br />
the size constraints of the GEM Report, they continue<br />
2016 • GLOBAL EDUCATION MONITORING REPORT 393
5<br />
to be presented in two versions: a shorter version in the<br />
printed report <strong>and</strong> a more complete version, containing<br />
all indicators to date, published on the GEM Report<br />
website (see footnote 1).<br />
METHODOLOGICAL NOTES<br />
While the statistical tables present data from multiple<br />
sources, most of the education data included are still<br />
provided by the UIS. The most recent data on pupils,<br />
students, teachers <strong>and</strong> education expenditure presented<br />
in the tables are for the school year or financial year<br />
ending in 2014. 3 They are based on survey results<br />
reported to <strong>and</strong> processed by the UIS before the end of<br />
March 2016. A small number of countries 4 submitted data<br />
for the school year ending in 2015, presented in bold in<br />
the tables. These statistics refer to all formal education,<br />
both public <strong>and</strong> private, by level of education.<br />
The statistical tables list 209 countries <strong>and</strong> territories, all of<br />
which are UNESCO member states or associate members.<br />
Most of them report their data to the UIS using st<strong>and</strong>ard<br />
questionnaires issued by the institute itself. For some<br />
countries, however, education data are collected by the<br />
UIS via surveys carried out jointly by the UIS, OECD <strong>and</strong><br />
the statistical office of the European Union through the<br />
UIS/OECD/Eurostat (UOE) questionnaires. 5<br />
POPULATION DATA USED AND ISCED<br />
CLASSIFICATION<br />
The population-related indicators used in the statistical<br />
tables, including enrolment ratios, number of out-ofschool<br />
children, adolescents <strong>and</strong> youth, <strong>and</strong> number<br />
of youth <strong>and</strong> adults, are based on the 2015 revision of<br />
population estimates produced by the UNPD. Because<br />
of possible differences between national population<br />
estimates <strong>and</strong> those of the United Nations, these<br />
indicators may differ from those published by individual<br />
countries or by other organizations. 6<br />
In the 2015 revision, the UNPD does not provide<br />
population data by single years of age for countries<br />
with total population of less than 90,000, including<br />
Andorra, Anguilla, Cayman Isl<strong>and</strong>s, Dominica, Monaco,<br />
Montserrat, Saint Martin, Sint Maarten <strong>and</strong> Turks <strong>and</strong><br />
Caicos Isl<strong>and</strong>s. For Bermuda, Dominica, Marshall Isl<strong>and</strong>s<br />
<strong>and</strong> Turks <strong>and</strong> Caicos Isl<strong>and</strong>s, the UIS decided to use<br />
population data from the previous UNPD revision (2012).<br />
Where no UNPD population estimates exist, national<br />
population figures, when available, or UIS estimates<br />
were used to calculate enrolment ratios. In the case of<br />
Brazil, due to inconsistencies between UNPD estimates<br />
<strong>and</strong> national enrolment data, the UIS has agreed with<br />
the country to temporarily use its national population<br />
estimates, derived from the PNAD household survey,<br />
until a solution is found.<br />
Education data reported to the UIS are in conformity<br />
with the International St<strong>and</strong>ard Classification of<br />
Education (ISCED), revised in 2011. Countries may<br />
have their own definitions of education levels that do<br />
not correspond to ISCED 2011. Differences between<br />
nationally <strong>and</strong> internationally reported education<br />
statistics may be due to the use of nationally defined<br />
education levels rather than the ISCED st<strong>and</strong>ard, in<br />
addition to the population issue raised above.<br />
LITERACY DATA<br />
The literacy statistics presented in the statistical tables<br />
are often based on a definition of literacy as the ability<br />
to read <strong>and</strong> write, with underst<strong>and</strong>ing, a short simple<br />
statement related to one’s daily life 7 <strong>and</strong> are largely<br />
based on data sources that use self-declaration or<br />
third party declaration methods, in which respondents<br />
are asked whether they <strong>and</strong> the members of their<br />
household are literate, as opposed to being asked a more<br />
comprehensive question or to demonstrate the skill. 8<br />
Some countries assume that anyone who completes a<br />
certain level of education is literate. 9 As definitions <strong>and</strong><br />
methodologies used for data collection differ by country,<br />
data need to be used with caution.<br />
Literacy data presented in the statistical tables cover<br />
adults aged 15 <strong>and</strong> over as well as youth aged 15 to<br />
24. They are for the 2005–2014 reference period, <strong>and</strong><br />
include both national observed data from censuses<br />
<strong>and</strong> household surveys, indicated with an asterisk (*)<br />
<strong>and</strong> UIS estimates (**). The latter are for 2014 <strong>and</strong> are<br />
based on the most recent national observed data. They<br />
were produced using the Global Age-specific Literacy<br />
Projections (GALP) model. 10 The reference years <strong>and</strong><br />
literacy definitions for each country are presented in the<br />
table of metadata for literacy statistics posted on the<br />
GEM Report website (see footnote 1).<br />
ESTIMATES AND MISSING DATA<br />
Regarding UIS statistics provided by the UIS itself, both<br />
observed <strong>and</strong> estimated education data are presented<br />
throughout the statistical tables. Wherever possible, the<br />
394<br />
ANNEX | STATISTICAL TABLES
5<br />
UIS encourages countries to make their own estimates,<br />
which are presented as national estimates <strong>and</strong> marked<br />
with one asterisk (*). Where this does not happen, the UIS<br />
may make its own estimates if sufficient supplementary<br />
information is available. These estimates are marked with<br />
two asterisks (**). Gaps in the tables may arise where<br />
data submitted by a country are found to be inconsistent.<br />
The UIS makes every attempt to resolve such problems<br />
with the countries concerned, but reserves the final<br />
decision on omitting data it regards as problematic.<br />
If information for the year ending in 2014 are not<br />
available, data for earlier or later years are used. Such<br />
cases are indicated by footnotes.<br />
REGIONAL AND OTHER COUNTRY<br />
GROUPING AVERAGES<br />
Regional figures for literacy <strong>and</strong> education rates <strong>and</strong><br />
ratios (gross intakes rates, gross, net <strong>and</strong> adjusted net<br />
enrolment ratios, dropout rates, etc.) are weighted<br />
averages, taking into account the relative size of the<br />
relevant population of each country in each region.<br />
The figures for countries with larger populations have<br />
a proportionately greater influence on the regional<br />
aggregates. The averages are derived from both<br />
published data <strong>and</strong> imputed values, for countries for<br />
which no recent data or reliable publishable data are<br />
available. Weighted averages marked with two asterisks<br />
(**) in the tables are UIS partial imputations due to<br />
incomplete country coverage (between 33% <strong>and</strong> 60% of<br />
the population of a given region or country grouping).<br />
Where insufficient reliable data are available to produce<br />
an overall weighted mean, a median figure is calculated<br />
based only on countries with available data – at least half<br />
in a given region or country grouping.<br />
INDICATORS PRESENTED IN THE<br />
STATISTICAL TABLES<br />
In the longer version of the annex on the website, the<br />
GEM Report presents 16 statistical tables covering 283<br />
distinct indicators (not counting gender breakdowns).<br />
Among these are the 43 thematic indicators, including<br />
the 11 global indicators <strong>and</strong> 32 others yet to be<br />
finalized at time of publication. In the meantime, some<br />
placeholders or proxy measures are presented to help<br />
keep attention on issues to be monitored <strong>and</strong> policy<br />
priorities across the SDG 4 targets, while highlighting<br />
areas for further work <strong>and</strong> indicator development.<br />
Table 1 focuses on the thematic <strong>and</strong> global indicators<br />
included in the statistical tables. A number of them are<br />
new indicators. This table gives some assessment of data<br />
availability <strong>and</strong> country coverage, shows what is missing<br />
<strong>and</strong> indicates the placeholders used.<br />
TABLE:<br />
Proposed thematic <strong>and</strong> global indicators presented in the statistical tables<br />
SDG 4 targets <strong>and</strong> related indicators<br />
Included<br />
in tables<br />
Global<br />
indicators Placeholders Missing aspects Sources of data<br />
4.1 – By 2030, ensure that all girls <strong>and</strong> boys complete free, equitable <strong>and</strong> quality primary <strong>and</strong> secondary education leading to relevant <strong>and</strong> effective learning outcomes 1<br />
1 Proportion of children <strong>and</strong> young <strong>people</strong>: (a) in grades<br />
2/3; (b) at the end of primary; <strong>and</strong> (c) at the end of lower<br />
secondary achieving at least a minimum proficiency level in<br />
(i) reading <strong>and</strong> (ii) mathematics, by sex<br />
Yes 4.1.1 Comparable only<br />
across countries<br />
that took part in the<br />
same survey<br />
Altinok (2013); Cheng <strong>and</strong> Omoeva (2014);<br />
education ministry national reports <strong>and</strong><br />
websites; EGMA/EGRA; PASEC; PILNA; PIRLS;<br />
PISA; SACMEQ; TERCE; TIMSS; ASER; Uwezo<br />
2 Administration of a nationally representative learning<br />
assessment (a) during primary (b) at the end of primary <strong>and</strong><br />
(c) at the end of lower secondary education<br />
Yes Altinok (2013); Cheng <strong>and</strong> Omoeva (2014);<br />
education ministry national reports <strong>and</strong><br />
websites; EGMA/EGRA; PASEC; PILNA; PIRLS;<br />
PISA; SACMEQ; TERCE; TIMSS; ASER; Uwezo<br />
3 Gross intake ratio to the last grade (primary, lower<br />
secondary)<br />
4 Completion rate (primary, lower secondary, upper<br />
secondary)<br />
5 Out-of-school rate (primary, lower secondary, upper<br />
secondary)<br />
6 Percentage of pupils over-age for grade (primary, lower<br />
secondary)<br />
7 Number of years of (a) free <strong>and</strong> (b) compulsory primary <strong>and</strong><br />
secondary education guaranteed in legal frameworks<br />
Yes<br />
Yes<br />
Yes<br />
Yes<br />
Yes<br />
UIS database<br />
GEM Report team calculations based on<br />
national <strong>and</strong> international household surveys<br />
(e.g. DHS, MICS)<br />
UIS database<br />
UIS database<br />
Eurydice (2014, 2015, 2016); UNESCO-IBE<br />
(2012); national education ministry websites;<br />
UIS database<br />
2016 • GLOBAL EDUCATION MONITORING REPORT 395
5<br />
SDG 4 targets <strong>and</strong> related indicators<br />
Included<br />
in tables<br />
Global<br />
indicators Placeholders Missing aspects Sources of data<br />
4.2 – By 2030, ensure that all girls <strong>and</strong> boys have access to quality early childhood development, care <strong>and</strong> pre-primary education so that they are ready for primary education<br />
8 Proportion of children under 5 years of age who are developmentally<br />
on track in health, learning <strong>and</strong> psychosocial<br />
well-being, by sex<br />
Yes 4.2.1 UNICEF MICS Early Childhood<br />
Development Index<br />
UNICEF MICS 4/5 country reports<br />
9 Percentage of children under 5 years of age experiencing<br />
positive <strong>and</strong> stimulating home learning environments<br />
Yes<br />
UNICEF MICS 4/5 country reports<br />
10 Participation rate in organized learning (one year before the<br />
official primary entry age), by sex<br />
Yes 4.2.2 Adjusted net enrolment ratio,<br />
one year before the official<br />
primary school entry age<br />
UIS database<br />
11 Pre-primary gross enrolment ratio Yes UIS database<br />
12 Number of years of (a) free <strong>and</strong> (b) compulsory pre-primary<br />
education guaranteed in legal frameworks<br />
Yes<br />
Eurydice (2014, 2015, 2016); UNESCO-IBE<br />
(2012); national education ministry websites;<br />
UIS database<br />
4.3 – By 2030, ensure equal access for all women <strong>and</strong> men to affordable <strong>and</strong> quality technical, vocational <strong>and</strong> tertiary education, including university<br />
13 Gross enrolment ratio for tertiary education Yes UIS database<br />
14 Participation rate in technical-vocational education<br />
programmes (15- to 24-year-olds)<br />
No Percentage of youth (15-24)<br />
enrolled in secondary technical<br />
<strong>and</strong> vocational education<br />
Programmes at tertiary<br />
education level<br />
<strong>and</strong> outside education<br />
(work-based <strong>and</strong> other<br />
settings)<br />
UIS database<br />
15 Participation rate of youth <strong>and</strong> adults in formal <strong>and</strong><br />
non-formal education <strong>and</strong> training in the previous 12<br />
months, by sex<br />
Yes 4.3.1 Adults enrolled in formal<br />
education as a share of total<br />
enrolment by level<br />
Youth participation<br />
rate<br />
Eurostat Adult Education Survey 2011<br />
4.4 – By 2030, substantially increase the number of youth <strong>and</strong> adults who have relevant skills, including technical <strong>and</strong> vocational skills, for employment, decent jobs <strong>and</strong> entrepreneurship<br />
16.1 Percentage of youth <strong>and</strong> adults who have achieved at least<br />
a minimum level of proficiency in digital literacy skills<br />
No<br />
Percentage of students at<br />
each proficiency level in digital<br />
literacy skills<br />
IEA International Computer <strong>and</strong> Information<br />
Literacy Study<br />
16.2 Proportion of youth <strong>and</strong> adults with information <strong>and</strong> communications<br />
technology (ICT) skills, by type of skill<br />
Yes 4.4.1 Eurostat database; ITU World Telecommunication<br />
/ ICT Indicators database<br />
17 Youth/adult educational attainment rates by age group,<br />
economic activity status, levels of education <strong>and</strong> programme<br />
orientation<br />
No, but<br />
placeholder<br />
presented<br />
Percentage of adults aged 25<br />
<strong>and</strong> over by minimum level of<br />
education attained<br />
Educational attainment<br />
rate of youth<br />
(15-24)<br />
UIS database<br />
4.5 – By 2030, eliminate gender disparities in education <strong>and</strong> ensure equal access at all levels of education <strong>and</strong> vocational training for the vulnerable, including persons with disabilities, indigenous <strong>people</strong>s <strong>and</strong> children<br />
in vulnerable situations<br />
Parity indices (female/male, rural/urban, bottom/top<br />
wealth quintile <strong>and</strong> others such as disability status,<br />
indigenous <strong>people</strong>s <strong>and</strong> conflict-affected, as data become<br />
available) for all education indicators on this list that can<br />
be disaggregated<br />
18 Percentage of students in primary education whose first or<br />
home language is the language of instruction<br />
19 Extent to which explicit formula-based policies reallocate<br />
education resources to disadvantaged populations<br />
Yes 4.5.1 Data on <strong>people</strong><br />
with disabilities, indigenous<br />
<strong>people</strong><br />
No<br />
No<br />
UIS database; GEM Report team calculations<br />
based on national <strong>and</strong> international household<br />
surveys (e.g. DHS, MICS)<br />
20 Education expenditure per student by level of education <strong>and</strong><br />
source of funding<br />
No, but<br />
placeholder<br />
presented<br />
Government expenditure per pupil/student<br />
by level of education<br />
presented, in constant 2013 US$;<br />
in constant 2013 PPP$; as % of<br />
GDP; as % of GDP per capita<br />
UIS database<br />
21 Percentage of total aid to education allocated to low income<br />
countries<br />
Yes (aid tables)<br />
OECD DAC<br />
4.6 – By 2030, ensure that all youth <strong>and</strong> a substantial proportion of adults, both men <strong>and</strong> women, achieve literacy <strong>and</strong> numeracy<br />
22 Percentage of population in a given age group achieving at<br />
least a fixed level of proficiency in functional (a) literacy <strong>and</strong><br />
(b) numeracy skills, by sex<br />
No, but<br />
placeholder<br />
presented<br />
4.6.1 Percentage of youth <strong>and</strong> adults<br />
achieving at least a fixed level of<br />
proficiency in functional literacy<br />
skills <strong>and</strong> numeracy skills<br />
OECD PIAAC<br />
23 Youth/adult literacy rate Yes UIS database<br />
24 Participation rate of youth/adults in literacy programmes No, but<br />
placeholder<br />
presented<br />
Participants in literacy<br />
programmes, expressed as<br />
percentage of the illiterate<br />
population<br />
UIS database, regional survey for Latin<br />
Amercia <strong>and</strong> the Caribbean<br />
396<br />
ANNEX | STATISTICAL TABLES
5<br />
SDG 4 targets <strong>and</strong> related indicators<br />
Included<br />
in tables<br />
Global<br />
indicators Placeholders Missing aspects Sources of data<br />
4.7 – By 2030, ensure that all learners acquire the knowledge <strong>and</strong> skills needed to promote sustainable development, including, among others, through education for sustainable development <strong>and</strong> sustainable lifestyles,<br />
human rights, gender equality, promotion of a culture of peace <strong>and</strong> non-violence, global citizenship <strong>and</strong> appreciation of cultural diversity <strong>and</strong> of culture’s contribution to sustainable development<br />
25 Extent to which (i) global citizenship education <strong>and</strong> (ii)<br />
education for sustainable development, including gender<br />
equality <strong>and</strong> human rights, are mainstreamed at all levels<br />
in (a) national education policies; (b) curricula; (c) teacher<br />
education <strong>and</strong> (d) student assessment<br />
Yes 4.7.1 Inclusion in national curricula<br />
frameworks of issues relating<br />
to global citizenship <strong>and</strong><br />
sustainable development:<br />
gender equality; human rights;<br />
sustainable development; <strong>and</strong><br />
global citizenship<br />
Inclusion of the given<br />
issues in national<br />
education policies,<br />
teacher education <strong>and</strong><br />
student assessments<br />
UNESCO IBE (2016)<br />
26 Percentage of students by age group (or education level)<br />
showing adequate underst<strong>and</strong>ing of issues relating to global<br />
citizenship <strong>and</strong> sustainability<br />
No, but<br />
placeholder<br />
presented<br />
Percentage of youth with<br />
adequate underst<strong>and</strong>ing of<br />
issues relating to HIV/AIDS <strong>and</strong><br />
sexuality education<br />
Gender equality,<br />
human rights <strong>and</strong><br />
global citizenship<br />
UNAIDS (2011), 2015 UNAIDS AIDSInfo Online<br />
Database <strong>and</strong> DHS StatCompiler<br />
27 Percentage of 15-year-old students showing proficiency in<br />
knowledge of environmental science <strong>and</strong> geoscience<br />
No, but<br />
placeholder<br />
presented<br />
Percentage of 15-year-old<br />
students performing at or above<br />
proficiency level 2 in science<br />
literacy as a proxy measure<br />
of environmental science <strong>and</strong><br />
geoscience<br />
GEM Report team calculations based on PISA<br />
2012 data (OECD, 2013)<br />
28 Percentage of schools that provide life skills-based HIV <strong>and</strong><br />
sexuality education<br />
29 Extent to which the framework on the World Programme on<br />
Human Rights Education is implemented nationally (as per<br />
UNGA Resolution 59/113)<br />
Yes Sexuality education UNAIDS (2011), 2015 UNAIDS AIDSInfo Online<br />
Database <strong>and</strong> DHS StatCompiler<br />
No<br />
4.a – Build <strong>and</strong> upgrade education facilities that are child, disability <strong>and</strong> gender sensitive <strong>and</strong> provide safe, non-violent, inclusive <strong>and</strong> effective learning environments for all<br />
30–<br />
32<br />
Proportion of schools with access to (a) electricity; (b)<br />
the Internet for pedagogical purposes; (c) computers<br />
for pedagogical purposes; (d) adapted infrastructure <strong>and</strong><br />
materials for students with disabilities; (e) basic drinking<br />
water; (f) single-sex basic sanitation facilities; <strong>and</strong> (g) basic<br />
h<strong>and</strong>washing facilities (as per the water, sanitation <strong>and</strong><br />
hygiene indicator definitions)<br />
Yes 4.a.1 UNICEF (2015); UIS database<br />
33 Percentage of students experiencing bullying, corporal<br />
punishment, harassment, violence, sexual discrimination<br />
<strong>and</strong> abuse<br />
Yes<br />
Corporal punishment,<br />
harassment, sexual<br />
discrimination <strong>and</strong><br />
abuse<br />
Global School-based Student Health Survey<br />
34 Number of attacks on students, personnel <strong>and</strong> institutions No<br />
4.b – By 2030, substantially exp<strong>and</strong> globally the number of scholarships available to developing countries, in particular least developed countries, small isl<strong>and</strong> developing States <strong>and</strong> African countries, for enrolment in<br />
higher education, including vocational training <strong>and</strong> information <strong>and</strong> communications technology, technical, engineering <strong>and</strong> scientific programmes, in developed countries <strong>and</strong> other developing countries<br />
35 Number of higher education scholarships awarded, by<br />
beneficiary country<br />
36 Volume of official development assistance flows for<br />
scholarships by sector <strong>and</strong> type of study<br />
No<br />
No<br />
4.b.1<br />
4.c – By 2030, substantially increase the supply of qualified teachers, including through international cooperation for teacher training in developing countries, especially least developed countries <strong>and</strong> small isl<strong>and</strong>s<br />
developing States<br />
37 Percentage of teachers qualified according to national<br />
st<strong>and</strong>ards, by education level <strong>and</strong> type of institution<br />
Yes<br />
Information by type<br />
of institution<br />
UIS database<br />
38 Pupil/qualified teacher ratio, by education level Yes UIS database<br />
39 Proportion of teachers in: (a) pre-primary, (b) primary, (c)<br />
lower secondary; <strong>and</strong> (d) upper secondary education who<br />
have received at least the minimum organized teacher<br />
training (e.g. pedagogical training) pre-service or in-service<br />
required for teaching at the relevant level in a given country<br />
Yes 4.c.1 UIS database<br />
40 Pupil/trained teacher ratio by education level Yes UIS database<br />
41 Average teacher salary relative to other professions requiring<br />
a comparable level of education qualification<br />
No<br />
42 Teacher attrition rate, by education level Yes (long) UIS database<br />
43 Percentage of teachers who received in-service training in<br />
the last 12 months, by type of training<br />
No<br />
Source: GEM Report team.<br />
2016 • GLOBAL EDUCATION MONITORING REPORT 397
5<br />
SYMBOLS USED IN THE STATISTICAL TABLES<br />
(PRINTED AND WEB VERSIONS)<br />
* National estimate<br />
** UIS partial estimate<br />
… No data available<br />
- Magnitude nil or negligible<br />
. Category not applicable or does not exist<br />
Footnotes to the tables, along with the glossary<br />
following the statistical tables, provide additional help in<br />
interpreting the data <strong>and</strong> information.<br />
COMPOSITION OF REGIONS AND OTHER<br />
COUNTRY GROUPS<br />
With the adoption of a new education agenda in the<br />
2030 Agenda for Sustainable Development, the country<br />
classification in the statistical tables has shifted from<br />
the EFA regions to those used by the United Nations<br />
Statistical Division (UNSD) as of May 2015, with some<br />
adjustments. The UNSD classification includes all<br />
territories, whether independent national entities or<br />
parts of bigger entities; however, the list of countries<br />
presented in the statistical tables includes only full<br />
UNESCO member states <strong>and</strong> associate members, as<br />
well as Bermuda <strong>and</strong> Turks <strong>and</strong> Caicos Isl<strong>and</strong>s, nonmember<br />
states that were included in the EFA statistical<br />
tables. To this list, a territory <strong>and</strong> a country, Hong Kong<br />
(China) <strong>and</strong> Liechtenstein, previously excluded, have<br />
been added. Other territories contained in the UNSD<br />
regional classification but not covered by UNESCO are<br />
still excluded: American Samoa, the Channel Isl<strong>and</strong>s,<br />
the Falkl<strong>and</strong> Isl<strong>and</strong>s (Malvinas), French Guiana, French<br />
Polynesia, Greenl<strong>and</strong>, Guadeloupe, Guam, the Isle of<br />
Man, Martinique, Mayotte, New Caledonia, the Northern<br />
Mariana Isl<strong>and</strong>s, Réunion, Puerto Rico, the US Virgin<br />
Isl<strong>and</strong>s <strong>and</strong> Western Sahara. The UIS does not collect<br />
data for most of these territories. Nor does it collect<br />
data for the Faroe Isl<strong>and</strong>s, so this territory is not<br />
included in the GEM Report despite its status as<br />
UNESCO associate member.<br />
World classification 11<br />
■■<br />
Countries in transition (17):<br />
Albania, Armenia, Azerbaijan, Belarus, Bosnia <strong>and</strong><br />
Herzegovina, Croatia, Kazakhstan, Kyrgyzstan,<br />
Montenegro, Republic of Moldova, Russian Federation,<br />
Serbia, Tajikistan, The former Yugoslav Republic of<br />
Macedonia, Turkmenistan, Ukraine, Uzbekistan.<br />
■■<br />
Developed countries (41):<br />
Andorra, Australia, Austria, Belgium, Bermuda,<br />
Bulgaria, Canada, Cyprus, Czech Republic, Denmark,<br />
Estonia, Finl<strong>and</strong>, France, Germany, Greece,<br />
Hungary, Icel<strong>and</strong>, Irel<strong>and</strong>, Israel, Italy, Japan, Latvia,<br />
Liechtenstein, Lithuania, Luxembourg, Malta, Monaco,<br />
Netherl<strong>and</strong>s, New Zeal<strong>and</strong>, Norway, Pol<strong>and</strong>, Portugal,<br />
Romania, San Marino, Slovakia, Slovenia, Spain,<br />
Sweden, Switzerl<strong>and</strong>, United Kingdom, United States.<br />
■■<br />
Developing countries (151):<br />
Eastern <strong>and</strong> South-eastern Asia (except Japan);<br />
Latin America <strong>and</strong> the Caribbean (except Bermuda);<br />
Northern Africa <strong>and</strong> Western Asia (except Israel);<br />
Pacific (except Australia <strong>and</strong> New Zeal<strong>and</strong>); Southern<br />
Asia; sub-Saharan Africa.<br />
GEM Report regions<br />
■■<br />
Caucasus <strong>and</strong> Central Asia (8 countries)<br />
Armenia, Azerbaijan, Georgia, Kazakhstan, Kyrgyzstan,<br />
Tajikistan, Turkmenistan, Uzbekistan.<br />
■■<br />
Eastern <strong>and</strong> South-eastern Asia (18 countries/<br />
territories)<br />
Brunei Darussalam, Cambodia, China, Democratic<br />
People’s Republic of Korea, Hong Kong (China),<br />
Indonesia, Japan, Lao People’s Democratic Republic,<br />
Macao (China), Malaysia, Mongolia, Myanmar,<br />
Philippines, Republic of Korea, Singapore, Thail<strong>and</strong>,<br />
Timor-Leste, Viet Nam.<br />
■■<br />
Eastern Asia (7 countries/territories)<br />
China, Democratic People’s Republic of Korea,<br />
Hong Kong ( China), Japan, Macao (China),<br />
Mongolia, Republic of Korea.<br />
■■<br />
South-eastern Asia (11 countries)<br />
Brunei Darussalam, Cambodia, Indonesia,<br />
Lao People’s Democratic Republic, Malaysia,<br />
Myanmar, Philippines, Singapore, Thail<strong>and</strong>, Timor-<br />
Leste, Viet Nam.<br />
■ ■ Europe <strong>and</strong> Northern America (46 countries)<br />
Albania, Andorra, Austria, Belarus, Belgium, Bosnia <strong>and</strong><br />
Herzegovina, Bulgaria, Canada, Croatia, Cyprus, Czech<br />
Republic, Denmark, Estonia, Finl<strong>and</strong>, France, Germany,<br />
Greece, Hungary, Icel<strong>and</strong>, Irel<strong>and</strong>, Italy, Latvia,<br />
Liechtenstein, Lithuania, Luxembourg, Malta, Monaco,<br />
Montenegro, Netherl<strong>and</strong>s, Norway, Pol<strong>and</strong>, Portugal,<br />
Republic of Moldova, Romania, Russian Federation,<br />
San Marino, Serbia, Slovakia, Slovenia, Spain, Sweden,<br />
398<br />
ANNEX | STATISTICAL TABLES
5<br />
Switzerl<strong>and</strong>, The former Yugoslav Republic of<br />
Macedonia, Ukraine, United Kingdom, United States.<br />
■■<br />
Latin America <strong>and</strong> the Caribbean (43 countries/<br />
territories)<br />
Anguilla, Antigua <strong>and</strong> Barbuda, Argentina, Aruba,<br />
Bahamas, Barbados, Belize, Bermuda, Plurinational<br />
State of Bolivia, Brazil, British Virgin Isl<strong>and</strong>s, Cayman<br />
Isl<strong>and</strong>s, Chile, Colombia, Costa Rica, Cuba, Curaçao,<br />
Dominica, Dominican Republic, Ecuador, El Salvador,<br />
Grenada, Guatemala, Guyana, Haiti, Honduras,<br />
Jamaica, Mexico, Montserrat, Nicaragua, Panama,<br />
Paraguay, Peru, Saint Kitts <strong>and</strong> Nevis, Saint Lucia,<br />
Saint Martin, Saint Vincent <strong>and</strong> the Grenadines,<br />
Sint Maarten, Suriname, Trinidad <strong>and</strong> Tobago, Turks<br />
<strong>and</strong> Caicos Isl<strong>and</strong>s, Uruguay, Bolivarian Republic<br />
of Venezuela.<br />
■■<br />
Caribbean (24 countries/territories)<br />
Anguilla, Antigua <strong>and</strong> Barbuda, Aruba, Bahamas,<br />
Barbados, Belize, Bermuda, British Virgin Isl<strong>and</strong>s,<br />
Cayman Isl<strong>and</strong>s, Curaçao, Dominica, Grenada,<br />
Guyana, Haiti, Jamaica, Montserrat, Saint Kitts <strong>and</strong><br />
Nevis, Saint Lucia, Saint Martin, Saint Vincent <strong>and</strong><br />
the Grenadines, Sint Maarten, Suriname, Trinidad<br />
<strong>and</strong> Tobago, Turks <strong>and</strong> Caicos Isl<strong>and</strong>s.<br />
■■<br />
Latin America (19 countries)<br />
Argentina, Plurinational State of Bolivia, Brazil, Chile,<br />
Colombia, Costa Rica, Cuba, Dominican Republic,<br />
Ecuador, El Salvador, Guatemala, Honduras, Mexico,<br />
Nicaragua, Panama, Paraguay, Peru, Uruguay,<br />
Bolivarian Republic of Venezuela.<br />
■■<br />
Northern Africa <strong>and</strong> Western Asia (20 countries/<br />
territories)<br />
Algeria, Bahrain, Egypt, Iraq, Israel, Jordan, Kuwait,<br />
Lebanon, Libya, Morocco, Oman, Palestine, Qatar,<br />
Saudi Arabia, Sudan, Syrian Arab Republic, Tunisia,<br />
Turkey, United Arab Emirates, Yemen.<br />
Micronesia (Federated States of), Nauru, New Zeal<strong>and</strong>,<br />
Niue, Palau, Papua New Guinea, Samoa, Solomon<br />
Isl<strong>and</strong>s, Tokelau, Tonga, Tuvalu, Vanuatu.<br />
■■<br />
Southern Asia (9 countries)<br />
Afghanistan, Bangladesh, Bhutan, India, Islamic<br />
Republic of Iran, Maldives, Nepal, Pakistan, Sri Lanka.<br />
■■<br />
Sub-Saharan Africa (48 countries)<br />
Angola, Benin, Botswana, Burkina Faso, Burundi, Cabo<br />
Verde, Cameroon, Central African Republic, Chad,<br />
Comoros, Congo, Côte d’Ivoire, Democratic Republic<br />
of the Congo, Djibouti, Equatorial Guinea, Eritrea,<br />
Ethiopia, Gabon, Gambia, Ghana, Guinea, Guinea-<br />
Bissau, Kenya, Lesotho, Liberia, Madagascar, Malawi,<br />
Mali, Mauritania, Mauritius, Mozambique, Namibia,<br />
Niger, Nigeria, Rw<strong>and</strong>a, Sao Tome <strong>and</strong> Principe,<br />
Senegal, Seychelles, Sierra Leone, Somalia, South<br />
Africa, South Sudan, Swazil<strong>and</strong>, Togo, Ug<strong>and</strong>a, United<br />
Republic of Tanzania, Zambia, Zimbabwe.<br />
Conflict-affected countries (31 as of 2013)<br />
Afghanistan, Algeria, Burundi, Central African Republic,<br />
Chad, Colombia, Democratic Republic of the Congo,<br />
Ethiopia, India, Indonesia, Islamic Republic of Iran, Iraq,<br />
Libya, Mali, Myanmar, Nepal, Nigeria, Pakistan, Palestine,<br />
Philippines, Russian Federation, Rw<strong>and</strong>a, Somalia, South<br />
Sudan, Sri Lanka, Sudan, Syrian Arab Republic, Thail<strong>and</strong>,<br />
Turkey, Ug<strong>and</strong>a <strong>and</strong> Yemen.<br />
Income groups 12<br />
■■<br />
Low income (32 countries)<br />
Afghanistan, Benin, Burkina Faso, Burundi, Cambodia,<br />
Central African Republic, Chad, Comoros, Democratic<br />
People’s Republic of Korea, Democratic Republic of<br />
the Congo, Eritrea, Ethiopia, Gambia, Guinea, Guinea-<br />
Bissau, Haiti, Liberia, Madagascar, Malawi, Mali,<br />
Mozambique, Nepal, Niger, Rw<strong>and</strong>a, Sierra Leone,<br />
Somalia, South Sudan, Togo, Tokelau, Ug<strong>and</strong>a, United<br />
Republic of Tanzania, Zimbabwe.<br />
■■<br />
Northern Africa (6 countries)<br />
Algeria, Egypt, Libya, Morocco, Sudan, Tunisia.<br />
■■<br />
Western Asia (14 countries <strong>and</strong> territories)<br />
Bahrain, Iraq, Israel, Jordan, Kuwait, Lebanon, Oman,<br />
Palestine, Qatar, Saudi Arabia, Syrian Arab Republic,<br />
Turkey, United Arab Emirates, Yemen.<br />
■■<br />
Pacific (17 countries/territories)<br />
Australia, Cook Isl<strong>and</strong>s, Fiji, Kiribati, Marshall Isl<strong>and</strong>s,<br />
■ ■ Lower middle income (50 countries)<br />
Armenia, Bangladesh, Bhutan, Plurinational State<br />
of Bolivia, Cameroon, Cabo Verde, Congo, Côte<br />
d’Ivoire, Djibouti, Egypt, El Salvador, Georgia, Ghana,<br />
Guatemala, Guyana, Honduras, India, Indonesia,<br />
Kenya, Kiribati, Kyrgyzstan, Lao People‘s Democratic<br />
Republic, Lesotho, Mauritania, Micronesia (Federated<br />
States of), Morocco, Myanmar, Nicaragua, Nigeria,<br />
Pakistan, Palestine, Papua New Guinea, Philippines,<br />
Republic of Moldova, Samoa, Sao Tome <strong>and</strong> Principe,<br />
2016 • GLOBAL EDUCATION MONITORING REPORT 399
5<br />
Senegal, Solomon Isl<strong>and</strong>s, Sri Lanka, Sudan, Swazil<strong>and</strong>,<br />
Syrian Arab Republic, Tajikistan, Timor-Leste, Ukraine,<br />
Uzbekistan, Vanuatu, Viet Nam, Yemen, Zambia.<br />
■■<br />
Upper middle income (54 countries)<br />
Albania, Algeria, Angola, Azerbaijan, Belarus, Belize,<br />
Bosnia <strong>and</strong> Herzegovina, Botswana, Brazil, Bulgaria,<br />
China, Colombia, Costa Rica, Cuba, Dominica,<br />
Dominican Republic, Ecuador, Fiji, Gabon, Grenada,<br />
Islamic Republic of Iran, Iraq, Jamaica, Jordan,<br />
Kazakhstan, Lebanon, Libya, Malaysia, Maldives,<br />
Marshall Isl<strong>and</strong>s, Mauritius, Mexico, Mongolia,<br />
Montenegro, Montserrat, Namibia, Nauru, Palau,<br />
Panama, Paraguay, Peru, Romania, Saint Lucia,<br />
Saint Vincent <strong>and</strong> the Grenadines, Serbia, South<br />
Africa, Suriname, Thail<strong>and</strong>, The former Yugoslav<br />
Republic of Macedonia, Tonga, Tunisia, Turkey,<br />
Turkmenistan, Tuvalu.<br />
■■<br />
High income (73 countries/territories)<br />
Andorra, Anguilla, Antigua <strong>and</strong> Barbuda, Argentina,<br />
Aruba, Australia, Austria, Bahamas, Bahrain, Barbados,<br />
Belgium, Bermuda, British Virgin Isl<strong>and</strong>s, Brunei<br />
Darussalam, Canada, Cayman Isl<strong>and</strong>s, Chile, Cook<br />
Isl<strong>and</strong>s, Croatia, Curaçao, Cyprus, Czech Republic,<br />
Denmark, Equatorial Guinea, Estonia, Finl<strong>and</strong>, France,<br />
Germany, Greece, Hong Kong (China), Hungary,<br />
Icel<strong>and</strong>, Irel<strong>and</strong>, Israel, Italy, Japan, Kuwait, Latvia,<br />
Liechtenstein, Lithuania, Luxembourg, Macao (China),<br />
Malta, Monaco, Netherl<strong>and</strong>s, New Zeal<strong>and</strong>, Niue,<br />
Norway, Oman, Pol<strong>and</strong>, Portugal, Qatar, Republic<br />
of Korea, Russian Federation, Saint Kitts <strong>and</strong> Nevis,<br />
Saint Martin, San Marino, Saudi Arabia, Seychelles,<br />
Singapore, Sint Maarten, Slovakia, Slovenia, Spain,<br />
Sweden, Switzerl<strong>and</strong>, Trinidad <strong>and</strong> Tobago, Turks<br />
<strong>and</strong> Caicos Isl<strong>and</strong>s, United Arab Emirates, United<br />
Kingdom, United States, Uruguay, Bolivarian Republic<br />
of Venezuela.<br />
3. This means 2013/14 for countries with a school year that overlaps two<br />
calendar years, <strong>and</strong> 2014 for those with a calendar school year. The most<br />
recent reference year for education finance for the UOE countries (see<br />
below) is the year ending in 2013.<br />
4. Djibouti, Ghana, Kazakhstan, Mauritania, Montenegro, Nepal, the Republic of<br />
Korea, Sao Tome <strong>and</strong> Principe, Tajikistan <strong>and</strong> Turks <strong>and</strong> Caicos Isl<strong>and</strong>s.<br />
5. The countries concerned are most European countries as well as Australia,<br />
Brazil, Canada, Chile, China, India, Indonesia, Israel, Japan, Jordan, Mexico,<br />
New Zeal<strong>and</strong>, Republic of Korea, Turkey <strong>and</strong> United States.<br />
6. Where obvious inconsistencies exist between enrolment reported by<br />
countries <strong>and</strong> the United Nations population data, the UIS may decide not<br />
to calculate or publish enrolment ratios. This is the case, for instance, with<br />
Armenia, Australia, Bahrain, the Plurinational State of Bolivia, Hong Kong<br />
(China), Jamaica, Kuwait, Macao (China), Malaysia, Maldives, Oman, Qatar,<br />
Saint Lucia, Singapore <strong>and</strong> the United Arab Emirates.<br />
7. That is the definition long used by UNESCO, but a parallel definition arose<br />
with the introduction in 1978 of the notion of functional literacy, which<br />
emphasizes the use of literacy skills. That year the UNESCO General<br />
Conference approved defining as functionally literate those who can engage<br />
in all activities in which literacy is required for the effective functioning<br />
of their group <strong>and</strong> community <strong>and</strong> also for enabling them to continue to<br />
use reading, writing <strong>and</strong> calculation for their own <strong>and</strong> the community’s<br />
development.<br />
8. In the data released by the UIS, some literacy rates are based on direct<br />
tests rather than individuals’ declarations. This is the case for Benin,<br />
Central African Republic, Congo, Côte d’Ivoire, the Democratic Republic of<br />
the Congo, Egypt, Gabon, Guyana, Haiti, Jordan, Kenya, Lesotho, Liberia,<br />
Madagascar, Malawi, Mauritania, Niger, Nigeria, Rw<strong>and</strong>a, Swazil<strong>and</strong> <strong>and</strong><br />
Zimbabwe. Care should therefore be taken when analysing trends over time<br />
<strong>and</strong> when interpreting these results.<br />
9. For reliability <strong>and</strong> consistency reasons, the UIS does not publish literacy<br />
data based on educational attainment proxies. Only data reported by<br />
countries based on self-declaration or household declaration are included<br />
in the statistical tables. However, in the absence of such data, educational<br />
attainment proxies for some countries, particularly developed ones, are used<br />
to compute regional weighted averages.<br />
10. For a description of the GALP methodology, see UNESCO (2005, p. 261) <strong>and</strong><br />
UIS (2006).<br />
11. This is a UNSD classification in three main country groupings as per the May<br />
2015 version published online at http://unstats.un.org/unsd/methods/m49/<br />
m49regin.htm.<br />
ENDNOTES<br />
1. A full set of statistics <strong>and</strong> indicators related to this introduction is found in<br />
Excel tables on the GEM Report website at http://en.unesco.org/gem-report.<br />
2. The thematic indicators were proposed by the Technical Advisory Group<br />
on post-2015 education indicators – now the Technical Cooperation Group,<br />
whose secretariat is based at the UNESCO Institute for Statistics (UIS) – to<br />
monitor progress towards the targets at the global, regional <strong>and</strong> national<br />
levels. The global indicators were approved at the 47th session of the UN<br />
Statistical Commission in March 2016. At time of publication, consultations<br />
were still under way on the other thematic indicators, which were to be<br />
officially adopted in October 2016.<br />
400<br />
ANNEX | STATISTICAL TABLES
TABLE 1<br />
Background demographic statistics, legal guarantee of compulsory <strong>and</strong> free education <strong>and</strong> structure of national education system – part 1<br />
DEMOGRAPHY 1 GDP AND POVERTY 2 LEGAL GUARANTEE OF COMPULSORY AND FREE EDUCATION 4<br />
Total<br />
population<br />
(000)<br />
Average annual<br />
growth rate<br />
(%)<br />
Current<br />
US$<br />
GDP per capita<br />
PRE-PRIMARY EDUCATION<br />
PRIMARY AND SECONDARY EDUCATION<br />
Population living on<br />
Free education (years)<br />
Current<br />
PPP US$<br />
less than PPP US$1.90<br />
a day<br />
(%)<br />
Compulsory<br />
education<br />
(age group)<br />
Free<br />
education<br />
(years)<br />
Compulsory<br />
education<br />
(age group) Primary Secondary<br />
Country or territory<br />
2016 2016 2014 2014 2003–2013 3<br />
Caucasus <strong>and</strong> Central Asia<br />
Armenia 6 3,026 0.1 3,874 8,070 2.4 . . 6-16 4 7<br />
Azerbaijan 7 9,868 1.0 7,884 17,516 0.0 . . 6-15 4 7<br />
Georgia 3,980 -0.1 3,670 7,582 11.5 . . 6-14 6 6<br />
Kazakhstan 17,855 1.1 12,602 24,228 0.0 6-6 4 7-18 4 7<br />
Kyrgyzstan 6,034 1.4 1,269 3,322 2.9 . 4 7-16 4 7<br />
Tajikistan 8,669 2.1 1,114 2,691 4.7 . . 7-16 4 5<br />
Turkmenistan 5,439 1.1 9,032 15,474 ... . 3 6-18 4 8<br />
Uzbekistan 30,300 1.2 2,037 5,573 66.8 . . 7-18 4 7<br />
Eastern <strong>and</strong> South-eastern Asia<br />
Brunei Darussalam 429 1.3 40,980 71,185 ... 5-5 1 6-15 6 7<br />
Cambodia 15,827 1.5 1,095 3,263 6.2 . . . 6 3<br />
China 1,382,323 0.4 7,590 13,206 11.2 . . 6-15 6 3<br />
DPR Korea 25,281 0.5 ... ... ... 6-6 1 7-16 5 5<br />
Hong Kong, China 6 7,346 0.7 40,170 55,084 ... . . 6-15 6 6<br />
Indonesia 260,581 1.1 3,492 10,517 15.9 . . 7-15 6 3<br />
Japan 126,324 -0.2 36,194 36,426 ... . . 6-15 6 3<br />
Lao People’s Democratic Republic 6,918 1.7 1,793 5,321 30.0 . . 6-14 5 .<br />
Macao, China 6 597 1.5 96,038 139,767 ... 5-5 3 6-15 6 6<br />
Malaysia 30,752 1.3 11,307 25,639 0.3 . . 6-11 . .<br />
Mongolia 3,006 1.4 4,129 11,946 0.4 . . 6-17 5 7<br />
Myanmar 54,363 0.9 1,204 ,,, ... 4-4 . 5-9 5 .<br />
Philippines 102,250 1.5 2,873 6,969 13.1 5-5 1 6-18 6 6<br />
Republic of Korea 50,504 0.4 27,970 34,356 ... . . 6-15 6 3<br />
Singapore 6 5,697 1.4 56,285 82,763 ... . . 6-14 6 .<br />
Thail<strong>and</strong> 68,147 0.2 5,977 15,735 0.1 . . 6-15 6 6<br />
Timor-Leste 1,211 2.1 1,169 2,227 46.8 . . 6-15 6 3<br />
Viet Nam 94,444 1.0 2,052 5,629 3.2 5-5 . 6-14 5 .<br />
Europe <strong>and</strong> Northern America<br />
Albania 2,904 0.3 4,564 10,305 1.1 . . 6-16 . .<br />
Andorra 8 69 -0.2 ... ... ... . . 6-16 6 4<br />
Austria 8,570 0.3 51,191 46,222 ... . 3 6-15 4 8<br />
Belarus 9,482 -0.3 8,040 18,185 0.0 . . 6-15 4 7<br />
Belgium 9 11,372 0.6 47,353 42,578 ... . 3 6-18 6 6<br />
Bosnia <strong>and</strong> Herzegovina 3,802 -0.3 4,790 9,891 0.1 5-5 . 6-15 5 4<br />
Bulgaria 7,098 -0.8 7,851 16,617 2.0 6-6 4 7-16 4 8<br />
Canada 36,286 0.9 50,235 44,057 ... . 2 6-16 6 6<br />
Croatia 4,225 -0.4 13,475 21,210 0.9 . . 7-15 4 4<br />
Cyprus 7 1,177 0.9 27,194 30,873 ... 5-5 1 6-15 6 6<br />
Czech Republic 9 10,548 0.1 19,530 30,407 0.1 . . 6-15 5 8<br />
Denmark 9 5,691 0.4 60,707 44,916 ... . 3 6-16 7 .<br />
Estonia 9 1,309 -0.3 20,162 26,946 1.0 . . 7-17 6 3<br />
Finl<strong>and</strong> 9 5,524 0.3 49,824 39,981 ... . . 7-16 6 3<br />
France 9 64,668 0.4 42,733 38,847 ... . 3 6-16 5 7<br />
Germany 9 80,682 -0.1 47,822 45,802 ... . 3 6-18 4 9<br />
Greece 10,919 -0.2 21,498 25,877 ... 5-5 2 6-15 6 6<br />
Hungary 9,821 -0.3 14,029 24,721 0.3 6-6 . 7-18 4 8<br />
Icel<strong>and</strong> 332 0.8 52,004 43,304 ... . . 6-16 7 3<br />
Irel<strong>and</strong> 9 4,714 0.8 54,374 48,755 ... . . 6-16 8 5<br />
Italy 59,801 0.0 34,909 34,706 ... . . 6-16 5 3<br />
Latvia 1,956 -0.5 15,719 22,873 1.4 5-6 4 7-16 6 6<br />
Liechtenstein 7,9 38 0.6 ... ... ... . 3 6-15 5 7<br />
Lithuania 2,850 -0.6 16,507 26,742 1.0 4-6 4 7-16 4 8<br />
Luxembourg 576 1.3 116,664 97,662 ... 4-5 2 6-16 6 7<br />
Malta 9 420 0.2 ... ... ... . 2 5-16 6 7<br />
Monaco 8,9 38 0.4 ... ... ... . 3 6-16 5 7<br />
Montenegro 626 0.0 7,378 14,338 1.7 . . 6-15 5 4<br />
Netherl<strong>and</strong>s 16,980 0.3 52,172 47,663 ... 5-5 . 6-18 6 6<br />
Norway 9 5,272 1.1 97,307 64,856 ... . . 6-16 7 3<br />
Pol<strong>and</strong> 38,593 -0.1 14,343 24,744 0.0 6-6 . 7-18 6 6<br />
Portugal 9 10,304 -0.4 22,132 28,393 ... . . 6-18 6 3<br />
Republic of Moldova 7 4,063 -0.2 2,239 4,983 0.1 6-6 4 7-16 4 7<br />
Romania 19,373 -0.7 9,997 19,401 0.0 5-5 3 6-16 5 8<br />
Russian Federation 143,440 -0.1 12,736 25,636 0.0 . . 7-18 4 5<br />
San Marino 7 32 0.4 ... ... ... . . 6-16 … …<br />
Serbia 7 8,813 -0.4 6,153 12,660 0.1 6-6 . 7-15 4 8<br />
Slovakia 5,429 0.0 18,501 27,711 0.2 . . 6-16 4 9<br />
Slovenia 9 2,069 0.1 23,999 29,963 0.0 . . 6-15 6 3<br />
Spain 9 46,065 0.0 29,767 33,211 ... . . 6-16 6 4<br />
Sweden 9 9,852 0.7 58,939 45,183 ... . . 7-16 6 6<br />
Switzerl<strong>and</strong> 8,379 0.8 85,594 57,235 ... 5-6 2 7-16 6 3<br />
TFYR Macedonia 2,081 0.1 5,456 13,142 1.3 5-5 1 6-18 5 8<br />
Ukraine 44,624 -0.5 3,082 8,665 0.0 5-5 1 6-17 4 7<br />
United Kingdom 9 65,111 0.6 46,332 39,762 ... . 2 5-16 6 7<br />
United States 324,119 0.7 54,629 54,629 ... . 1 5-18 6 6<br />
Latin America <strong>and</strong> the Caribbean<br />
Anguilla 8 15 0.9 ... ... ... . . 5-17 7 5<br />
Antigua <strong>and</strong> Barbuda 93 1.0 13,432 22,077 ... . . 5-16 7 5<br />
401
TABLE 1<br />
Part 1 (Continued)<br />
DEMOGRAPHY 1 GDP AND POVERTY 2 LEGAL GUARANTEE OF COMPULSORY AND FREE EDUCATION 4<br />
Total<br />
population<br />
(000)<br />
Average annual<br />
growth rate<br />
(%)<br />
Current<br />
US$<br />
GDP per capita<br />
PRE-PRIMARY EDUCATION<br />
PRIMARY AND SECONDARY EDUCATION<br />
Population living on<br />
Free education (years)<br />
Current<br />
PPP US$<br />
less than PPP US$1.90<br />
a day<br />
(%)<br />
Compulsory<br />
education<br />
(age group)<br />
Free<br />
education<br />
(years)<br />
Compulsory<br />
education<br />
(age group) Primary Secondary<br />
402<br />
Country or territory<br />
2016 2016 2014 2014 2003–2013 3<br />
Argentina 43,847 0.9 12,510 ... 1.8 5-5 3 6-18 6 6<br />
Aruba 104 0.3 ... ... ... 4-5 2 6-17 6 5<br />
Bahamas 393 1.1 22,217 23,491 ... . 2 5-16 6 6<br />
Barbados 285 0.2 15,366 16,058 ... . 2 5-16 6 5<br />
Belize 367 2.0 4,831 8,417 ... . . 5-14 6 .<br />
Bermuda 62 -0.4 ... ... ... . . 5-16 6 7<br />
Bolivia, Plurinational States of 6 10,888 1.5 3,124 6,630 7.7 5-5 2 6-16 6 6<br />
Brazil 7 209,568 0.8 11,384 15,838 4.9 4-5 2 6-17 5 7<br />
British Virgin Isl<strong>and</strong>s 7 31 1.6 ... ... ... . . 5-16 7 5<br />
Cayman Isl<strong>and</strong>s 8 61 1.3 ... ... ... . 2 5-17 6 6<br />
Chile 18,132 1.0 14,528 22,346 0.9 5-5 1 6-21 6 6<br />
Colombia 48,654 0.8 7,904 13,357 6.1 5-5 3 6-15 5 6<br />
Costa Rica 4,857 1.0 10,415 14,918 1.7 3-5 3 6-15 6 5<br />
Cuba 11,393 0.0 ... ... ... . 3 6-16 6 6<br />
Curaçao 159 0.8 ... ... ... 4-5 … 6-18 … …<br />
Dominica 73 0.4 7,244 10,877 ... . . 5-16 7 4<br />
Dominican Republic 10,649 1.1 6,164 13,262 2.3 5-5 3 6-18 6 6<br />
Ecuador 16,385 1.4 6,346 11,372 4.4 5-5 3 6-18 6 6<br />
El Salvador 6,146 0.3 4,120 8,351 3.3 4-6 3 7-15 6 3<br />
Grenada 107 0.5 8,574 12,425 ... . 2 5-16 7 5<br />
Guatemala 16,673 1.9 3,673 7,454 11.5 5-6 2 7-15 6 5<br />
Guyana 771 0.5 4,054 ... ... . 2 6-15 6 5<br />
Haiti 10,848 1.2 824 1,732 53.9 . . 6-11 6 .<br />
Honduras 8,190 1.4 2,435 4,909 18.9 5-5 3 6-15 6 3<br />
Jamaica 6 2,803 0.3 5,105 8,875 1.7 . . 6-14 6 .<br />
Mexico 128,632 1.2 10,326 17,108 2.7 4-5 2 6-18 6 6<br />
Montserrat 8 5 0.5 ... ... ... . . 5-16 7 5<br />
Nicaragua 6,150 1.1 1,963 4,918 10.8 5-5 . 6-11 6 3<br />
Panama 3,990 1.5 11,949 20,895 2.9 4-5 2 6-15 6 3<br />
Paraguay 6,725 1.2 4,713 8,911 2.2 5-5 3 6-18 6 6<br />
Peru 31,774 1.2 6,541 11,989 3.7 3-5 3 6-18 6 5<br />
Saint Kitts <strong>and</strong> Nevis 56 1.0 15,510 23,239 ... . . 5-16 7 4<br />
Saint Lucia 6 186 0.7 7,648 10,733 ... . . 5-15 7 3<br />
Saint-Martin 8 … … ... ... ... . … … … …<br />
Saint Vincent <strong>and</strong> the Grenadines 110 0.2 6,669 10,727 ... . 2 5-16 7 5<br />
Sint-Maarten 8 40 1.3 ... ... ... . … … … …<br />
Suriname 548 0.8 9,680 16,638 ... . . 6-11 6 .<br />
Trinidad <strong>and</strong> Tobago 1,365 0.3 21,324 31,967 ... . … 5-11 6 …<br />
Turks <strong>and</strong> Caicos Isl<strong>and</strong>s 8 35 1.5 ... ... ... 4-5 … 6-17 … …<br />
Uruguay 3,444 0.4 16,807 20,884 0.3 4-5 2 6-17 6 6<br />
Venezuela, Bolivarian Republic of 31,519 1.3 ... ... 9.2 4-5 3 6-14 6 5<br />
Northern Africa <strong>and</strong> Western Asia<br />
Algeria 40,376 1.6 5,484 14,193 ... . 1 6-16 5 7<br />
Bahrain 6 1,397 1.5 24,855 45,500 ... . . 6-15 6 6<br />
Egypt 93,384 1.9 3,199 10,530 ... . . 6-14 6 6<br />
Iraq 37,548 2.8 6,420 15,057 ... . . 6-11 6 6<br />
Israel 8,192 1.6 37,208 33,230 ... . . 6-18 6 6<br />
Jordan 7,748 1.5 5,423 12,050 0.1 . . 6-16 6 6<br />
Kuwait 6 4,007 2.1 43,594 73,246 ... . . 6-14 5 4<br />
Lebanon 5,988 0.1 10,058 17,462 ... . 2 6-12 6 .<br />
Libya 6,330 1.3 6,573 15,597 ... 5-5 1 6-15 6 3<br />
Morocco 34,817 1.2 3,190 7,491 3.1 . . 6-15 6 3<br />
Oman 6 4,654 1.4 19,310 38,631 ... . . . 4 8<br />
Palestine 4,797 2.7 ... ... 0.3 . . 6-16 4 8<br />
Qatar 6 2,291 1.9 96,732 140,649 ... . . 6-18 6 3<br />
Saudi Arabia 32,158 1.7 24,161 51,924 ... . . 6-15 6 6<br />
Sudan 41,176 2.4 1,876 4,069 14.9 . . 6-13 6 2<br />
Syrian Arab Republic 18,564 2.5 ... ... ... . . 6-15 4 8<br />
Tunisia 11,375 1.0 4,421 11,436 2.0 . 3 6-16 6 7<br />
Turkey 79,622 0.9 10,515 19,199 0.3 . 3 6-18 4 8<br />
United Arab Emirates 6 9,267 1.4 43,963 67,674 ... . 2 6-12 5 7<br />
Yemen 27,478 2.3 ... ... ... . . 6-15 6 3<br />
The Pacific<br />
Australia 6 28,875 1.2 61,925 43,930 ... . 1 5-17 7 6<br />
Cook Isl<strong>and</strong>s 7 21 0.6 ... ... ... . 2 5-16 6 7<br />
Fiji 898 0.5 5,112 8,792 3.6 . . 6-18 6 6<br />
Kiribati 114 1.7 1,510 1,809 14.1 . . 6-15 6 3<br />
Marshall Isl<strong>and</strong>s 53 0.1 3,530 3,803 ... 5-5 1 6-14 6 2<br />
Micronesia (Federated States of) 532 1.0 3,057 3,331 ... . . 6-14 6 2<br />
Nauru 7 10 0.4 ... ... ... . 2 6-16 6 6<br />
New Zeal<strong>and</strong> 4,565 0.9 44,342 36,390 ... . . 6-16 6 7<br />
Niue 7 2 0.1 ... ... ... . 1 5-16 6 6<br />
Palau 7 22 1.1 11,880 14,757 ... . 3 6-17 6 6<br />
Papua New Guinea 7,776 2.0 2,268 2,855 39.3 . . . . .<br />
Samoa 195 0.6 4,172 5,789 0.8 . . 5-14 . .<br />
Solomon Isl<strong>and</strong>s 595 1.8 2,024 2,130 45.6 . . . . .<br />
Tokelau 7 1 1.6 ... ... ... . … 5-16 … …<br />
Tonga 107 0.8 4,114 5,211 1.1 4-5 . 6-18 . .
TABLE 1<br />
Part 1 (Continued)<br />
DEMOGRAPHY 1 GDP AND POVERTY 2 LEGAL GUARANTEE OF COMPULSORY AND FREE EDUCATION 4<br />
Total<br />
population<br />
(000)<br />
Average annual<br />
growth rate<br />
(%)<br />
Current<br />
US$<br />
GDP per capita<br />
PRE-PRIMARY EDUCATION<br />
PRIMARY AND SECONDARY EDUCATION<br />
Population living on<br />
Free education (years)<br />
Current<br />
PPP US$<br />
less than PPP US$1.90<br />
a day<br />
(%)<br />
Compulsory<br />
education<br />
(age group)<br />
Free<br />
education<br />
(years)<br />
Compulsory<br />
education<br />
(age group) Primary Secondary<br />
Country or territory<br />
2016 2016 2014 2014 2003–2013 3<br />
Tuvalu 7 10 0.4 3,827 3,765 ... . . 6-15 6 .<br />
Vanuatu 270 2.1 3,148 3,031 15.4 . . . . .<br />
Southern Asia<br />
Afghanistan 33,370 2.3 634 1,933 ... . 4 7-16 6 6<br />
Bangladesh 162,911 1.1 1,087 3,123 43.7 . . 6-10 5 .<br />
Bhutan 784 1.1 2,561 7,816 2.2 . . . 7 3<br />
India 1,326,802 1.2 1,582 5,701 21.3 . . 6-14 5 3<br />
Iran, Islamic Republic of 80,043 1.1 5,443 17,303 0.1 . . 6-14 6 2<br />
Maldives 6 370 1.6 7,635 12,530 5.6 . . . 7 5<br />
Nepal 28,851 1.1 702 2,374 15.0 . . . 5 .<br />
Pakistan 192,827 2.0 1,317 4,811 8.3 . . 5-16 5 7<br />
Sri Lanka 20,811 0.4 3,819 11,181 1.7 . 1 5-14 5 8<br />
Sub-Saharan Africa<br />
Angola 25,831 3.1 ... ... 30.1 . . 6-11 6 .<br />
Benin 11,167 2.6 903 2,030 53.1 . . 6-11 6 .<br />
Botswana 2,304 1.7 7,123 16,099 18.2 . . . . .<br />
Burkina Faso 18,634 2.8 713 1,620 55.3 . . 6-16 6 4<br />
Burundi 11,553 3.2 286 770 77.7 . . . 6 …<br />
Cabo Verde 527 1.2 3,641 6,520 17.6 . . 6-16 6 2<br />
Cameroon 23,924 2.4 1,407 2,972 29.3 . . 6-11 6 .<br />
Central African Republic 4,998 2.0 359 594 66.3 . 3 6-15 6 7<br />
Chad 14,497 3.1 1,025 2,182 38.4 . 3 6-16 6 7<br />
Comoros 807 2.3 810 1,429 13.5 . . 6-14 6 .<br />
Congo 4,741 2.6 3,147 6,277 28.7 . 3 6-16 6 7<br />
Côte d’Ivoire 23,254 2.4 1,546 3,258 29.0 . . . . .<br />
Democratic Rep. of the Congo 79,723 3.1 442 746 77.2 . . 6-15 6 .<br />
Djibouti 900 1.3 1,814 3,270 18.3 . 2 6-16 5 7<br />
Equatorial Guinea 870 2.8 18,918 34,739 ... . . 7-12 6 .<br />
Eritrea 5,352 2.4 ... ... ... . . 6-13 . .<br />
Ethiopia 101,853 2.4 574 1,500 33.5 . . . 6 .<br />
Gabon 1,763 2.1 10,772 19,430 8.0 . . 6-16 5 5<br />
Gambia 2,055 3.1 ... ... 45.3 . . … … …<br />
Ghana 28,033 2.2 1,442 4,082 25.2 4-5 2 6-15 6 3<br />
Guinea 12,947 2.6 540 1,221 35.3 . . 7-16 6 …<br />
Guinea-Bissau 1,888 2.3 568 1,386 67.1 . . 6-15 . .<br />
Kenya 47,251 2.5 1,358 2,954 33.6 . 3 6-18 6 6<br />
Lesotho 2,160 1.1 1,034 2,638 59.7 . . 6-12 7 …<br />
Liberia 4,615 2.5 458 841 68.6 . . 6-16 6 .<br />
Madagascar 24,916 2.7 449 1,439 81.8 . 3 6-10 5 7<br />
Malawi 17,750 3.0 255 822 70.9 . … . 6 …<br />
Mali 18,135 3.0 705 1,599 49.3 . 4 7-15 6 6<br />
Mauritania 4,166 2.3 1,275 3,912 10.9 . . 6-14 . .<br />
Mauritius 1,277 0.3 10,017 18,585 0.5 . … 5-16 6 7<br />
Mozambique 28,751 2.7 586 1,129 68.7 . . 6-12 . .<br />
Namibia 2,514 2.1 5,408 9,956 22.6 . . 7-16 7 .<br />
Niger 20,715 4.0 427 938 50.3 4-6 . 7-16 . .<br />
Nigeria 186,988 2.5 3,203 5,911 53.5 . . 6-15 6 3<br />
Rw<strong>and</strong>a 11,883 2.3 696 1,661 60.3 . . 7-16 6 3<br />
Sao Tome <strong>and</strong> Principe 194 2.1 1,811 3,176 33.9 . . 6-11 6 .<br />
Senegal 15,589 2.9 1,067 2,333 38.0 . . 6-16 6 4<br />
Seychelles 97 0.5 15,543 26,386 0.4 . . 6-16 6 7<br />
Sierra Leone 6,592 2.1 766 1,966 52.3 . . 6-15 6 3<br />
Somalia 11,079 2.8 543 ... ... . 3 . 6 6<br />
South Africa 54,979 0.8 6,483 13,046 16.6 . . 7-15 . .<br />
South Sudan 12,733 2.7 1,115 2,019 ... . . 6-11 6 .<br />
Swazil<strong>and</strong> 1,304 1.2 3,477 8,292 42.0 . . 6-12 7 .<br />
Togo 7,497 2.5 635 1,429 54.2 . . 6-15 6 .<br />
Ug<strong>and</strong>a 40,323 3.2 715 1,771 33.2 . . 6-12 7 .<br />
United Republic of Tanzania 55,155 3.0 955 2,538 46.6 . 2 7-13 7 6<br />
Zambia 16,717 3.1 1,722 3,904 64.4 . . . 7 …<br />
Zimbabwe 15,967 2.3 931 1,792 ... 4-5 2 6-14 7 2<br />
403
1 ANNEX<br />
TABLE 1<br />
Part 1 (Continued)<br />
DEMOGRAPHY 1 GDP AND POVERTY 2 LEGAL GUARANTEE OF COMPULSORY AND FREE EDUCATION 4<br />
Total<br />
population<br />
(000)<br />
Average annual<br />
growth rate<br />
(%)<br />
Current<br />
US$<br />
GDP per capita<br />
PRE-PRIMARY EDUCATION<br />
PRIMARY AND SECONDARY EDUCATION<br />
Population living on<br />
Free education (years)<br />
Current<br />
PPP US$<br />
less than PPP US$1.90<br />
a day<br />
(%)<br />
Compulsory<br />
education<br />
(age group)<br />
Free<br />
education<br />
(years)<br />
Compulsory<br />
education<br />
(age group) Primary Secondary<br />
Country or territory<br />
2016 2016 2014 2014 2003–2013 3<br />
Weighted<br />
Sum<br />
Median<br />
Median<br />
average<br />
World 7,406,355 1.1 5,484 11,989 8.3 … … … … …<br />
Countries in transition 305,006 0.2 4,790 10,305 0.6 … … … … …<br />
Developed countries 1,047,103 0.3 42,733 36,426 ... … … … … …<br />
Developing countries 6,054,245 1.2 3,673 7,816 15.6 … … … … …<br />
Caucasus <strong>and</strong> Central Asia 85,172 1.2 3,772 7,826 2.9 … … … … …<br />
Eastern <strong>and</strong> South-eastern Asia 2,236,001 0.5 5,977 14,471 8.7 … … … … …<br />
Eastern Asia 1,595,382 0.3 32,082 35,391 ... … … … … …<br />
South-eastern Asia 640,619 1.0 2,873 8,743 9.6 … … … … …<br />
Europe <strong>and</strong> Northern America 1,100,096 0.3 22,132 29,963 ... … … … … …<br />
Latin America <strong>and</strong> the Caribbean 636,133 1.0 7,648 12,425 ... … … … … …<br />
Caribbean 38,871 0.7 8,111 12,844 ... … … … … …<br />
Latin America 597,262 1.0 6,541 11,989 3.7 … … … … …<br />
Northern Africa <strong>and</strong> Western Asia 471,169 1.7 10,058 17,462 ... … … … … …<br />
Northern Africa 227,458 1.8 3,810 10,983 3.1 … … … … …<br />
Western Asia 243,711 1.7 24,161 38,631 ... … … … … …<br />
Pacific 44,045 1.3 3,827 3,803 ... … … … … …<br />
Southern Asia 1,846,768 1.2 1,582 5,701 6.9 … … … … …<br />
Sub-Saharan Africa 986,971 2.6 1,025 2,258 38.4 … … … … …<br />
Conflict-affected countries 3,109,793 1.4 1,449 5,256 15.4 … … … … …<br />
Countries with low income 655,764 2.6 665 1,599 53.1 … … … … …<br />
Countries with middle income 5,366,318 1.1 4,117 8,834 4.9 … … … … …<br />
Lower middle 2,958,865 1.4 2,052 4,918 15.6 … … … … …<br />
Upper middle 2,407,454 0.6 7,123 13,357 1.7 … … … … …<br />
Countries with high income 1,384,272 0.4 29,767 36,408 ... … … … … …<br />
404
STATISTICAL TABLES<br />
1<br />
TABLE 1<br />
Background demographic statistics, legal guarantee of compulsory <strong>and</strong> free education <strong>and</strong> structure of national education system – part 2<br />
STRUCTURE OF NATIONAL EDUCATION SYSTEM AND OFFICIAL SCHOOL-AGE POPULATION<br />
Age group<br />
Official school-age population<br />
(000)<br />
Pre-primary<br />
Primary<br />
Lower<br />
secondary<br />
Upper<br />
secondary Tertiary Pre-primary Primary<br />
Total<br />
secondary<br />
Tertiary<br />
Country or territory<br />
School year ending in<br />
2014<br />
School year ending in<br />
2014<br />
School year ending in<br />
2014<br />
School year ending in<br />
2014 5<br />
Caucasus <strong>and</strong> Central Asia<br />
Armenia 6 3-5 6-9 10-13 14-16 17-21 124 ... ... 256<br />
Azerbaijan 7 3-5 6-9 10-14 15-16 17-21 464 * 488 * 923 * 844 *<br />
Georgia 3-5 6-11 12-14 15-17 18-22 154 244 283 309<br />
Kazakhstan 3-6 7-10 11-15 16-17 18-22 1,334 1,008 1,575 1,501<br />
Kyrgyzstan 3-6 7-10 11-15 16-17 18-22 497 404 717 583<br />
Tajikistan 3-6 7-10 11-15 16-17 18-22 780 680 1,202 855<br />
Turkmenistan 3-5 6-9 10-14 15-17 18-22 300 402 763 556<br />
Uzbekistan 3-6 7-10 11-15 16-17 18-22 2,322 2,031 4,238 3,038<br />
Eastern <strong>and</strong> South-eastern Asia<br />
Brunei Darussalam 3-5 6-11 12-13 14-18 19-23 18 38 49 36<br />
Cambodia 3-5 6-11 12-14 15-17 18-22 1,032 1,829 1,885 1,652<br />
China 3-5 6-11 12-14 15-17 18-22 47,723 91,520 94,021 106,433<br />
Democratic People’s Republic of Korea 5-6 7-11 12-14 15-17 18-22 691 1,843 2,339 2,015<br />
Hong Kong, China 6 3-5 6-11 12-14 15-17 18-22 ... 292 413 443<br />
Indonesia 5-6 7-12 13-15 16-18 19-23 9,198 28,218 27,389 20,781<br />
Japan 3-5 6-11 12-14 15-17 18-22 3,228 6,633 7,103 6,096<br />
Lao People’s Democratic Republic 3-5 6-10 11-14 15-17 18-22 493 749 1,050 766<br />
Macao, China 6 3-5 6-11 12-14 15-17 18-22 ... ... 33 43<br />
Malaysia 4-5 6-11 12-14 15-18 19-23 904 2,974 3,845 2,896<br />
Mongolia 4-5 6-10 11-14 15-17 18-22 115 235 315 273<br />
Myanmar 3-4 5-9 10-13 14-15 16-20 1,933 5,195 6,221 4,784<br />
Philippines 5-5 6-11 12-14 15-15 16-20 2,132 12,436 8,175 9,967<br />
Republic of Korea 3-5 6-11 12-14 15-17 18-22 1,377 2,818 3,807 3,522<br />
Singapore 6 3-5 6-11 12-13 14-15 16-20 ... ... ... ...<br />
Thail<strong>and</strong> 3-5 6-11 12-14 15-17 18-22 2,386 4,998 5,317 4,634<br />
Timor-Leste 3-5 6-11 12-14 15-17 18-22 95 180 163 111<br />
Viet Nam 3-5 6-10 11-14 15-17 18-22 4,442 6,799 9,612 8,833<br />
Europe <strong>and</strong> Northern America<br />
Albania 3-5 6-10 11-14 15-17 18-22 92 174 346 277<br />
Andorra 8 3-5 6-11 12-15 16-17 18-22 ... ... ... 4<br />
Austria 3-5 6-9 10-13 14-17 18-22 236 320 702 527<br />
Belarus 3-5 6-9 10-14 15-16 17-21 311 373 606 582<br />
Belgium 9 3-5 6-11 12-13 14-17 18-22 393 738 734 676<br />
Bosnia <strong>and</strong> Herzegovina 3-5 6-10 11-14 15-18 19-23 110 161 335 235<br />
Bulgaria 3-6 7-10 11-14 15-18 19-23 290 261 514 400<br />
Canada 4-5 6-11 12-14 15-17 18-22 775 2,209 2,422 2,390<br />
Croatia 3-6 7-10 11-14 15-18 19-23 176 163 374 239<br />
Cyprus 7 3-5 6-11 12-14 15-17 18-22 30 * 54 * 59 * 63 *<br />
Czech Republic 9 3-5 6-10 11-14 15-18 19-23 350 516 743 634<br />
Denmark 9 3-5 6-12 13-15 16-18 19-23 198 461 426 370<br />
Estonia 9 3-6 7-12 13-15 16-18 19-23 63 78 71 84<br />
Finl<strong>and</strong> 9 3-6 7-12 13-15 16-18 19-23 245 347 369 345<br />
France 9 3-5 6-10 11-14 15-17 18-22 2,375 3,976 5,375 3,710<br />
Germany 9 3-5 6-9 10-15 16-18 19-23 2,006 2,770 7,030 4,448<br />
Greece 4-5 6-11 12-14 15-17 18-22 219 644 627 595<br />
Hungary 3-6 7-10 11-14 15-18 19-23 393 387 802 619<br />
Icel<strong>and</strong> 3-5 6-12 13-15 16-19 20-24 14 30 32 24<br />
Irel<strong>and</strong> 9 4-4 5-12 13-15 16-17 18-22 73 525 274 263<br />
Italy 3-5 6-10 11-13 14-18 19-23 1,681 2,819 4,479 2,939<br />
Latvia 3-6 7-12 13-15 16-18 19-23 87 114 105 134<br />
Liechtenstein 7,9 5-6 7-11 12-15 16-18 19-23 1 * 2 * 3 * 2 *<br />
Lithuania 3-6 7-10 11-16 17-18 19-23 112 106 260 217<br />
Luxembourg 3-5 6-11 12-14 15-18 19-23 18 36 46 34<br />
Malta 9 3-4 5-10 11-13 14-17 18-22 8 25 35 28<br />
Monaco 8,9 3-5 6-10 11-14 15-17 18-22 ... ... ... ...<br />
Montenegro 3-5 6-10 11-14 15-18 19-23 24 40 68 43<br />
Netherl<strong>and</strong>s 3-5 6-11 12-14 15-17 18-22 540 1,171 1,190 1,016<br />
Norway 9 3-5 6-12 13-15 16-18 19-23 190 425 390 344<br />
Pol<strong>and</strong> 3-6 7-12 13-15 16-18 19-23 1,638 2,140 2,443 2,588<br />
Portugal 9 3-5 6-11 12-14 15-17 18-22 289 621 660 552<br />
Republic of Moldova 7 3-6 7-10 11-15 16-17 18-22 155 * 149 * 281 * 280 *<br />
Romania 3-5 6-10 11-14 15-18 19-23 629 1,051 1,698 1,087<br />
Russian Federation 3-6 7-10 4 11-15 5 16-17 2 18-22 6,440 5,809 9,009 8,894<br />
San Marino 7 3-5 6-10 11-13 14-18 19-23 1 * 2 * 3 * 1 *<br />
Serbia 7 3-6 7-10 11-14 15-18 19-23 266 * 282 * 581 * 418 *<br />
Slovakia 3-5 6-9 10-14 15-18 19-23 172 212 506 374<br />
Slovenia 9 3-5 6-11 12-14 15-18 19-23 64 112 131 109<br />
Spain 9 3-5 6-11 12-15 16-17 18-22 1,472 2,828 2,526 2,225<br />
Sweden 9 3-6 7-12 13-15 16-18 19-23 461 626 622 689<br />
Switzerl<strong>and</strong> 5-6 7-12 13-15 16-19 20-24 158 469 618 506<br />
The former Yugoslav Rep. of Macedonia 3-5 6-10 11-14 15-18 19-23 66 120 217 153<br />
Ukraine 5-5 6-9 10-14 15-16 17-21 475 1,622 2,735 2,607<br />
United Kingdom 9 3-4 5-10 11-13 14-17 18-22 1,678 4,376 5,130 4,166<br />
United States 3-5 6-11 12-14 15-17 18-22 12,257 24,654 24,835 22,732<br />
Latin America <strong>and</strong> the Caribbean<br />
Anguilla 8 3-4 5-11 12-14 15-16 17-21 ... ... ... ...<br />
Antigua <strong>and</strong> Barbuda 3-4 5-11 12-14 15-16 17-21 3 10 8 8<br />
405
1 ANNEX<br />
TABLE 1<br />
Part 2 (Continued)<br />
STRUCTURE OF NATIONAL EDUCATION SYSTEM AND OFFICIAL SCHOOL-AGE POPULATION<br />
Age group<br />
Official school-age population<br />
(000)<br />
Pre-primary<br />
Primary<br />
Lower<br />
secondary<br />
Upper<br />
secondary Tertiary Pre-primary Primary<br />
Total<br />
secondary<br />
Tertiary<br />
406<br />
Country or territory<br />
School year ending in<br />
2014<br />
School year ending in<br />
2014<br />
School year ending in<br />
2014<br />
School year ending in<br />
2014 5<br />
Argentina 3-5 6-11 12-14 15-17 18-22 2,196 4,346 4,168 3,461<br />
Aruba 4-5 6-11 12-13 14-16 17-21 3 8 7 7<br />
Bahamas 3-4 5-10 11-13 14-16 17-21 12 30 34 33<br />
Barbados 3-4 5-10 11-13 14-15 16-20 7 23 19 19<br />
Belize 3-4 5-10 11-14 15-16 17-21 15 47 46 36<br />
Bermuda 4-4 5-10 11-13 14-17 18-22 1 5 6 4<br />
Bolivia, Plurinational States of 6 4-5 6-11 12-13 14-17 18-22 469 ,,, 1,325 1,011<br />
Brazil 7 4-5 6-10 11-14 15-17 18-22 5,579 * 14,974 * 23,761 * 16,380 *<br />
British Virgin Isl<strong>and</strong>s 7 3-4 5-11 12-14 15-16 1 * 3 * 2 * 2 *<br />
Cayman Isl<strong>and</strong>s 8 3-4 5-10 11-13 14-16 17-21 ... ... ... ...<br />
Chile 4-5 6-11 12-13 14-17 18-22 475 1,461 1,550 1,391<br />
Colombia 3-5 6-10 11-14 15-16 17-21 2,299 3,994 4,888 4,168<br />
Costa Rica 3-5 6-11 12-14 15-16 17-21 217 429 382 409<br />
Cuba 3-5 6-11 12-14 15-17 18-22 364 778 833 736<br />
Curaçao 4-5 6-11 12-13 14-17 18-22 4 12 12 11<br />
Dominica 3-4 5-11 12-14 15-16 17-21 2 7 6 7<br />
Dominican Republic 3-5 6-11 12-13 14-17 18-22 638 1,260 1,188 959<br />
Ecuador 3-5 6-11 12-14 15-17 18-22 953 1,825 1,802 1,459<br />
El Salvador 4-6 7-12 13-15 16-18 19-23 325 693 771 611<br />
Grenada 3-4 5-11 12-14 15-16 17-21 4 13 10 10<br />
Guatemala 5-6 7-12 13-15 16-17 18-22 792 2,334 1,835 1,641<br />
Guyana 4-5 6-11 12-14 15-16 17-21 25 100 98 81<br />
Haiti 3-5 6-11 12-14 15-18 19-23 743 1,425 1,583 1,044<br />
Honduras 3-5 6-11 12-14 15-16 17-21 506 1,054 906 877<br />
Jamaica 6 3-5 6-11 12-14 15-16 17-21 132 ,,, 325 269<br />
Mexico 4-5 6-11 12-14 15-17 18-22 6,957 14,148 14,349 11,420<br />
Montserrat 8 3-4 5-11 12-14 15-16 17-21 ... ... ... ...<br />
Nicaragua 3-5 6-11 12-14 15-16 17-21 373 736 608 603<br />
Panama 4-5 6-11 12-14 15-17 18-22 145 417 413 325<br />
Paraguay 3-5 6-11 12-14 15-17 18-22 406 792 816 663<br />
Peru 3-5 6-11 12-14 15-16 17-21 1,772 3,447 2,793 2,808<br />
Saint Kitts <strong>and</strong> Nevis 3-4 5-11 12-14 15-16 17-21 2 7 5 4<br />
Saint Lucia 6 3-4 5-11 12-14 15-16 17-21 6 ... 16 17<br />
Saint-Martin 8 … … … … … ... ... ... ...<br />
Saint Vincent <strong>and</strong> the Grenadines 3-4 5-11 12-14 15-16 17-21 4 13 10 10<br />
Sint-Maarten 8 3-4 5-11 12-13 14-17 18-22 ... ... ... ...<br />
Suriname 4-5 6-11 12-15 16-18 19-23 20 59 67 43<br />
Trinidad <strong>and</strong> Tobago 3-4 5-11 12-14 15-16 17-21 39 130 87 95<br />
Turks <strong>and</strong> Caicos Isl<strong>and</strong>s 8 4-5 6-11 12-14 15-16 17-21 ... ... ... ...<br />
Uruguay 3-5 6-11 12-14 15-17 18-22 146 296 307 263<br />
Venezuela, Bolivarian Republic of 3-5 6-11 12-14 15-16 17-21 1,763 3,464 2,802 2,757<br />
Northern Africa <strong>and</strong> Western Asia<br />
Algeria 5-5 6-10 11-14 15-17 18-22 761 3,171 4,140 3,600<br />
Bahrain 6 3-5 6-11 12-14 15-17 18-22 60 ... ... 103<br />
Egypt 4-5 6-11 12-14 15-17 18-22 3,880 10,707 9,533 8,031<br />
Iraq 4-5 6-11 12-14 15-17 18-22 2,017 5,283 4,601 3,287<br />
Israel 3-5 6-11 12-14 15-17 18-22 454 827 754 570<br />
Jordan 4-5 6-11 12-15 16-17 18-22 360 1,007 909 680<br />
Kuwait 6 4-5 6-10 11-14 15-17 18-22 ,,, 246 302 268<br />
Lebanon 3-5 6-11 12-14 15-17 18-22 220 511 601 535<br />
Libya 4-5 6-11 12-14 15-17 18-22 266 721 637 515<br />
Morocco 4-5 6-11 12-14 15-17 18-22 1,251 3,470 3,570 3,151<br />
Oman 6 4-5 6-9 10-15 16-17 18-22 127 212 ... ...<br />
Palestine 4-5 6-9 10-15 16-17 18-22 252 466 862 486<br />
Qatar 6 3-5 6-11 12-14 15-17 18-22 65 ... ... 160<br />
Saudi Arabia 3-5 6-11 12-14 15-17 18-22 1,871 3,437 3,158 2,449<br />
Sudan 4-5 6-11 12-13 14-16 17-21 2,219 6,184 4,479 3,783<br />
Syrian Arab Republic ... ... ... ... … 1,443 2,846 2,695 1,806<br />
Tunisia 3-5 6-11 12-14 15-18 19-23 528 963 1,164 959<br />
Turkey 3-5 6-9 10-13 14-17 18-22 3,950 5,268 10,628 6,341<br />
United Arab Emirates 6 4-5 6-10 11-14 15-17 18-22 180 384 ... 649<br />
Yemen 3-5 6-11 12-14 15-17 18-22 2.233 4.051 3.662 2.926<br />
The Pacific<br />
Australia 6 4-4 5-11 12-15 16-17 18-22 ... ... ... 1,610<br />
Cook Isl<strong>and</strong>s 7 3-4 5-10 11-14 15-17 18-22 1 * 2 * 2 * 1 *<br />
Fiji 3-5 6-11 12-15 16-18 19-23 54 101 108 78<br />
Kiribati 3-5 6-11 12-14 15-18 19-23 9 14 16 11<br />
Marshall Isl<strong>and</strong>s 4-5 6-11 12-13 14-17 18-22 3 9 7 3<br />
Micronesia (Federated States of) 3-5 6-11 12-13 14-17 18-22 7 15 16 12<br />
Nauru 7 3-5 6-11 12-15 16-17 18-22 1 * 2 * 1 * 1 *<br />
New Zeal<strong>and</strong> 3-4 5-10 11-14 15-17 18-22 127 365 418 322<br />
Niue 7 4-4 5-10 11-14 15-16 17-21 0.03 * 0.16 * 0.16 * 0.1 *<br />
Palau 7 3-5 6-11 12-13 14-17 18-22 0.7 * 1.4 * 1.4 * 1 *<br />
Papua New Guinea 3-5 6-12 13-14 15-18 19-23 584 1,278 986 694<br />
Samoa 3-4 5-10 11-12 13-17 18-22 10 30 30 18<br />
Solomon Isl<strong>and</strong>s 3-5 6-11 12-14 15-18 19-23 48 90 90 53<br />
Tokelau 7 3-4 5-10 11-13 14-15 16-20 0.1 * 0.1 * 0.2 * 0.1 *<br />
Tonga 4-5 6-11 12-14 15-16 17-21 5 16 17 10
STATISTICAL TABLES<br />
1<br />
TABLE 1<br />
Part 2 (Continued)<br />
STRUCTURE OF NATIONAL EDUCATION SYSTEM AND OFFICIAL SCHOOL-AGE POPULATION<br />
Age group<br />
Official school-age population<br />
(000)<br />
Pre-primary<br />
Primary<br />
Lower<br />
secondary<br />
Upper<br />
secondary Tertiary Pre-primary Primary<br />
Total<br />
secondary<br />
Tertiary<br />
Country or territory<br />
School year ending in<br />
2014<br />
School year ending in<br />
2014<br />
School year ending in<br />
2014<br />
School year ending in<br />
2014 5<br />
Tuvalu 7 3-5 6-11 12-15 16-18 19-23 0.8 * 1.4 * 1.5 * 1 *<br />
Vanuatu 3-5 6-11 12-15 16-18 19-23 14 37 37 23<br />
Southern Asia<br />
Afghanistan 3-6 7-12 13-15 16-18 19-23 3,996 5,564 4,676 3,035<br />
Bangladesh 3-5 6-10 11-13 14-17 18-22 9,237 16,034 22,895 15,389<br />
Bhutan 4-5 6-12 13-16 17-18 19-23 29 100 88 78<br />
India 3-5 6-10 11-13 14-17 18-22 76,420 127,694 174,269 118,681<br />
Iran, Islamic Republic of 5-5 6-11 12-13 14-17 18-22 1,280 6,815 6,554 7,104<br />
Maldives 6 3-5 6-12 13-15 16-17 18-22 ... ... 32 38<br />
Nepal 3-4 5-9 10-12 13-16 17-21 1,221 3,255 4,732 2,897<br />
Pakistan 3-4 5-9 10-12 13-16 17-21 9,326 20,768 27,106 18,656<br />
Sri Lanka 4-4 5-9 10-13 14-17 18-22 349 1,756 2,633 1,564<br />
Sub-Saharan Africa<br />
Angola 5-5 6-11 12-14 15-17 18-22 826 4,341 3,431 2,286<br />
Benin 4-5 6-11 12-15 16-18 19-23 625 1,699 1,650 976<br />
Botswana 3-5 6-12 13-15 16-17 18-22 148 317 220 220<br />
Burkina Faso 3-5 6-11 12-15 16-18 19-23 1,731 2,985 2,775 1,602<br />
Burundi 5-6 7-12 13-16 17-19 20-24 1,005 1,604 1,540 1,032<br />
Cabo Verde 3-5 6-11 12-14 15-17 18-22 31 59 65 58<br />
Cameroon 4-5 6-11 12-15 16-18 19-23 1,357 3,648 3,544 2,185<br />
Central African Republic 3-5 6-11 12-15 16-18 19-23 387 722 753 464<br />
Chad 3-5 6-11 12-15 16-18 19-23 1,396 2,373 2,195 1,232<br />
Comoros 3-5 6-11 12-15 16-18 19-23 66 117 116 73<br />
Congo 3-5 6-11 12-15 16-18 19-23 412 705 658 387<br />
Côte d’Ivoire 3-5 6-11 12-15 16-18 19-23 1,974 3,545 3,534 2,033<br />
Democratic Rep. of the Congo 3-5 6-11 12-13 14-17 18-22 7,407 12,652 10,087 6,893<br />
Djibouti 4-5 6-10 11-14 15-17 18-22 39 95 126 92<br />
Equatorial Guinea 4-6 7-12 13-16 17-18 19-23 67 115 99 75<br />
Eritrea 4-5 6-10 11-13 14-17 18-22 313 706 777 489<br />
Ethiopia 4-6 7-12 13-16 17-18 19-23 8,231 15,714 13,924 9,318<br />
Gabon 3-5 6-10 11-14 15-17 18-22 131 198 251 163<br />
Gambia 3-6 7-12 13-15 16-18 19-23 257 321 259 171<br />
Ghana 4-5 6-11 12-14 15-17 18-22 1,430 3,867 3,377 2,583<br />
Guinea 4-6 7-12 13-16 17-19 20-24 1,074 1,895 1,843 1,087<br />
Guinea-Bissau 3-5 6-11 12-14 15-17 18-22 156 273 236 174<br />
Kenya 3-5 6-11 12-13 14-17 18-22 4,092 7,323 6,012 4,241<br />
Lesotho 3-5 6-12 13-15 16-17 18-22 155 342 251 239<br />
Liberia 3-5 6-11 12-14 15-17 18-22 396 715 588 395<br />
Madagascar 3-5 6-10 11-14 15-17 18-22 2,054 3,142 3,887 2,367<br />
Malawi 3-5 6-11 12-15 16-17 18-22 1,630 2,796 2,330 1,650<br />
Mali 3-6 7-12 13-15 16-18 19-23 2,321 2,826 2,209 1,493<br />
Mauritania 3-5 6-11 12-15 16-18 19-23 336 605 598 361<br />
Mauritius 3-4 5-10 11-13 14-17 18-22 29 103 136 105<br />
Mozambique 3-5 6-12 13-15 16-17 18-22 2,679 5,445 3,197 2,635<br />
Namibia 5-6 7-13 14-16 17-18 19-23 118 385 266 252<br />
Niger 4-6 7-12 13-16 17-19 20-24 1,987 3,225 2,737 1,393<br />
Nigeria 3-5 6-11 12-14 15-17 18-22 16,707 28,768 23,212 16,040<br />
Rw<strong>and</strong>a 4-6 7-12 13-15 16-18 19-23 1,015 1,796 1,501 1,017<br />
Sao Tome <strong>and</strong> Principe 3-5 6-11 12-14 15-17 18-22 17 31 25 17<br />
Senegal 3-5 6-11 12-15 16-18 19-23 1,352 2,335 2,229 1,365<br />
Seychelles 4-5 6-11 12-14 15-18 19-23 3 8 9 7<br />
Sierra Leone 3-5 6-11 12-14 15-18 19-23 577 1,023 987 585<br />
Somalia 3-5 6-11 12-13 14-17 18-22 1,075 1,805 1,493 966<br />
South Africa 6-6 7-13 14-15 16-18 19-23 2,236 7,215 5,283 5,257<br />
South Sudan 3-5 6-11 12-13 14-17 18-22 1,085 1,925 1,672 1,139<br />
Swazil<strong>and</strong> 3-5 6-12 13-15 16-17 18-22 100 213 147 151<br />
Togo 3-5 6-11 12-15 16-18 19-23 645 1,130 1,070 658<br />
Ug<strong>and</strong>a 3-5 6-12 13-16 17-18 19-23 4,006 7,941 5,331 3,474<br />
United Republic of Tanzania 5-6 7-13 14-17 18-19 20-24 3,268 9,822 6,563 4,462<br />
Zambia 3-6 7-13 14-15 16-18 19-23 2,091 3,064 1,763 1,498<br />
Zimbabwe 4-5 6-12 13-14 15-18 19-23 909 2,739 2,026 1,605<br />
407
1 ANNEX<br />
TABLE 1<br />
Part 2 (Continued)<br />
STRUCTURE OF NATIONAL EDUCATION SYSTEM AND OFFICIAL SCHOOL-AGE POPULATION<br />
Age group<br />
Official school-age population<br />
(000)<br />
Pre-primary<br />
Primary<br />
Lower<br />
secondary<br />
Upper<br />
secondary Tertiary Pre-primary Primary<br />
Total<br />
secondary<br />
Tertiary<br />
Country or territory<br />
School year ending in<br />
2014<br />
School year ending in<br />
2014<br />
School year ending in<br />
2014<br />
School year ending in<br />
2014 5<br />
Sum<br />
World … … … … … 351,952 687,228 756,430 602,031<br />
Countries in transition … … … … … 13,936 14,049 24,258 21,447<br />
Developed countries … … … … … 33,234 64,987 75,870 63,682<br />
Developing countries … … … … … 304,782 608,193 656,301 516,901<br />
Caucasus <strong>and</strong> Central Asia … … … … … 5,975 5,403 9,990 8,008<br />
Eastern <strong>and</strong> South-eastern Asia … … … … … 76,092 167,109 171,918 173,672<br />
Eastern Asia … … … … … 53,294 103,339 107,946 118,900<br />
South-eastern Asia … … … … … 22,798 63,770 63,971 54,772<br />
Europe <strong>and</strong> Northern America … … … … … 37,230 64,001 80,417 68,738<br />
Latin America <strong>and</strong> the Caribbean … … … … … 27,397 60,023 67,846 53,650<br />
Caribbean … … … … … 1,965 4,027 4,157 3,242<br />
Latin America … … … … … 25,432 55,996 63,689 50,408<br />
Northern Africa <strong>and</strong> Western Asia … … … … … 22,260 49,984 52,835 40,751<br />
Northern Africa … … … … … 8,905 25,217 23,523 20,131<br />
Western Asia … … … … … 13,355 24,767 29,312 20,620<br />
Pacific … … … … … 1,175 4,006 ** 3,456 ** 2,835 **<br />
Southern Asia … … … … … 101,878 182,029 242,986 167,441<br />
Sub-Saharan Africa … … … … … 79,945 154,674 126,983 86,936<br />
Conflict-affected countries … … … … … 174,756 332,622 376,592 271,027<br />
Countries with low income … … … … … 53,977 101,309 86,962 57,909<br />
Countries with middle income … … … … … 250,174 498,346 568,226 456,231<br />
Lower middle … … … … … 162,693 315,291 366,407 264,781<br />
Upper middle … … … … … 87,481 183,055 201,819 191,450<br />
Countries with high income … … … … … 47,802 87,574 101,243 87,891<br />
Source: UIS database, except where noted.<br />
Note: The country groupings by level of income are as defined by the World Bank but include only countries listed in the<br />
table. They are based on the list of countries by income group as revised in July 2015.<br />
1. United Nations Population Division (UNPD) estimates, revision 2015 (United Nations, 2015), based on the median variant.<br />
2. World Bank (2015); World Bank WDI database, December 2015 release.<br />
3. Data are for the most recent year available during the period specified. For more details see World Bank (2015).<br />
4. Eurydice (2014, 2015, 2016); UNESCO-IBE (2012); national education ministry websites; UIS database.<br />
5. Data are for 2014 except for countries with a split calendar school year, in which case data are for 2013.<br />
6. School-age population data are not presented for some or all levels of education due to inconsistencies in population<br />
data.<br />
7. National population data are presented instead of UNPD populations estimates due to inconsistencies in, or lack of,<br />
UNPD population data.<br />
8. School-age population data are not presented due to lack of United Nations population data by age.<br />
9. For pre-primary education there is legal entitlement but it is not compulsory. Legal entitlement to early childhood<br />
care <strong>and</strong> education (ECCE) means providers have a statutory duty to ensure that publicly subsidized ECCE provision is<br />
available for all children living in a given catchment area whose parents, regardless of employment, socio-economic or<br />
family status, require a place for them. Children are entitled, but not obliged, to participate (Eurydice, 2014).<br />
(.) The category is not applicable or does not exist.<br />
(…) No data are available.<br />
408
STATISTICAL TABLES<br />
1<br />
TABLE 2<br />
SDG 4, Target 4.1 – Universal access, participation <strong>and</strong> completion, primary education – part 1<br />
By 2030, ensure that all girls <strong>and</strong> boys complete free, equitable <strong>and</strong> quality primary education leading to relevant <strong>and</strong> effective learning outcomes<br />
ACCESS TO AND PARTICIPATION IN PRIMARY EDUCATION<br />
PROGRESSION AND COMPLETION<br />
Percentage of<br />
pupils over-age<br />
for grade (%) 1<br />
Total enrolment in<br />
primary education<br />
Gross enrolment ratio (GER) in<br />
primary education (%)<br />
Primary adjusted<br />
net enrolment ratio (ANER) (%)<br />
Out-of-school<br />
children 2<br />
Gross intake rate (GIR) to<br />
last grade (%)<br />
Primary<br />
education<br />
completion rate 3<br />
School year<br />
ending in<br />
2014<br />
School year<br />
ending in<br />
2014<br />
School year ending in<br />
2014<br />
School year ending in<br />
2014<br />
School year<br />
ending in<br />
2014<br />
School year ending in<br />
2014<br />
Most recent<br />
survey year<br />
2009–2014 5<br />
Country or territory<br />
Total Total % F Total Male Female Total Male Female Total % F Total Male Female Total<br />
(000) (000)<br />
Caucasus <strong>and</strong> Central Asia<br />
Armenia 7,8 0.7 143 47 ... ... ... ... ... ... ... ... ... ... ... 100<br />
Azerbaijan 8,9 2.2 518 46 106 * 107 * 105 * 95 * 96 * 94 * 23 55 98 * 99 * 98 * …<br />
Georgia 8 1.0 285 47 117 116 118 ... ... ... ... ... 116 116 117 …<br />
Kazakhstan 0.2 1,196 111 111 111 100 100 100 1 32 113 113 113 100<br />
Kyrgyzstan 0.4 435 49 108 108 107 98 98 98 8 60 105 106 104 100<br />
Tajikistan 0.1 683 48 98 98 98 98 98 98 13 43 100 100 99 98<br />
Turkmenistan ... 359 49 89 90 89 ... ... ... ... ... ... ... ... …<br />
Uzbekistan ... ... ... ... ... ... ... ... ... ... ... ... ... ... …<br />
Eastern <strong>and</strong> South-eastern Asia<br />
Brunei Darussalam 1.5 41 49 107 107 108 ... ... ... ... ... 101 101 100 …<br />
Cambodia 22.9 2,129 48 116 120 113 95 96 94 97 59 96 96 96 67<br />
China 8 ... 95,107 46 104 104 104 ... ... ... ... ... ... ... ... 94<br />
DPR Korea ... ... ... ... ... ... ... ... ... ... ... ... ... ... …<br />
Hong Kong, China 8 1.0 324 48 111 112 110 99 100 99 2 69 99 100 99 …<br />
Indonesia 8 ... 29,838 48 106 107 104 93 93 92 2.008 52 103 106 100 95<br />
Japan 8 - z 6,802 z 49 z 102 z 102 z 101 z 100 z 100 z 100 z 3 z 49 z 102 y 102 y 102 y …<br />
Lao PDR 23.7 871 48 116 119 113 95 96 94 36 57 100 102 99 73<br />
Macao, China 7 4.1 23 48 ... ... ... ... ... ... ... ... ... ... ... …<br />
Malaysia - 3,178 49 107 ... ... 95 y ... ... 169 y ... 102 ... ... …<br />
Mongolia 2.0 239 49 102 103 101 96 96 95 10 57 110 111 108 98<br />
Myanmar 3.1 5,177 49 100 101 98 95 ... ... 284 ... 85 103 67 …<br />
Philippines 17.7 z 14,460 z 48 z 117 z 117 z 117 z 97 z 95 z 99 z 402 z 18 z 101 z 97 z 105 z 90<br />
Republic of Korea 8 0.3 2,791 48 99 99 99 96 z 97 z 96 z 104 z 52 z 103 104 103 …<br />
Singapore 8 ... ... ... ... ... ... ... ... ... ... ... ... ... ... …<br />
Thail<strong>and</strong> 3.1 5.182 49 104 103 104 92 93 92 380 52 94 94 93 …<br />
Timor-Leste 30.8 246 49 137 138 136 98 96 99 4 13 98 97 100 55<br />
Viet Nam - 7.435 48 109 110 109 98 z ... ... 127 z ... 106 104 108 96<br />
Europe <strong>and</strong> Northern America<br />
Albania 2.3 196 47 112 114 111 96 ... ... 7 ... 108 108 108 ...<br />
Andorra 7 3.0 4 47 ... ... ... ... ... ... ... ... ... ... ... …<br />
Austria ... 327 49 102 103 102 ... ... ... ... ... 99 99 99 …<br />
Belarus 1.2 369 49 99 99 99 94 94 94 22 48 98 98 98 100<br />
Belgium 1.6 774 49 105 105 105 99 99 99 7 44 88 87 90 …<br />
Bosnia <strong>and</strong> Herzegovina 0.6 161 49 100 100 100 99 98 99 2 24 97 97 97 99<br />
Bulgaria 1.8 259 48 99 99 99 96 96 97 10 45 99 99 99 …<br />
Canada 8 ... 2,206 z 49 z 101 z 100 z 101 z 99 z ... ... 12 z ... ... ... ... …<br />
Croatia 0.3 161 49 99 99 99 98 97 100 3 10 96 96 95 …<br />
Cyprus 9 0.5 53 49 99 * 99 * 100 97 * 97 * 98 * 2 * 37 * 100 * 100 * 100 * …<br />
Czech Republic 8 ... 511 49 99 99 99 ... ... ... ... ... 98 98 99 …<br />
Denmark 8 0.4 467 49 101 102 101 98 98 99 7 40 99 99 99 …<br />
Estonia 0.3 z 76 z 49 z 101 z 101 z 100 z 100 z 100 z 99 z 0.3 z 62 z 107 z 107 z 106 z …<br />
Finl<strong>and</strong> 8 ... 352 49 101 101 101 100 99 100 2 11 99 99 99 …<br />
France 8 ... 4,189 49 105 106 105 99 99 100 22 30 ... ... ... …<br />
Germany ... 2,863 49 103 104 103 100 ... ... 4 ... 100 101 100 …<br />
Greece ... 634 z 48 z 99 z 99 z 98 z 97 z 98 z 97 z 18 z 57 z 97 z 98 z 96 z …<br />
Hungary 1.5 393 48 102 102 101 96 96 96 16 49 97 97 96 …<br />
Icel<strong>and</strong> 8 ... 29 y 49 y 99 y 98 y 99 y 99 y 98 y 99 y 0.4 y 42 y 97 y 94 y 101 y …<br />
Irel<strong>and</strong> 8 0.0 z 528 z 49 z 103 z 103 z 103 z 99 z 99 z 100 z 4 z 25 z ... ... ... …<br />
Italy 8 0.5 z 2,861 z 48 z 102 z 102 z 101 z 99 z 100 z 99 z 15 z 70 z 100 z 100 z 100 z …<br />
Latvia 1.8 115 49 100 101 100 97 97 97 3 44 105 104 106 …<br />
Liechtenstein 0.2 2 49 103 * 103 * 102 * 97 * 97 * 98 * 0.05 * 38 * 92 * 100 * 84 * …<br />
Lithuania 0.4 108 49 102 102 103 99 99 100 0.6 12 101 102 101 …<br />
Luxembourg 1.8 z 35 z 49 z 97 z 96 z 97 z 95 z 94 z 96 z 2 z 39 z 82 z 79 z 85 z …<br />
Malta 8 0.1 24 49 97 100 95 97 99 94 0.8 86 92 94 90 …<br />
Monaco 7 - y 2 49 ... ... ... ... ... ... ... ... ... ... ... …<br />
Montenegro 0.9 38 48 94 95 93 94 94 93 3 52 93 92 93 99<br />
Netherl<strong>and</strong>s 8 ... 1,223 49 104 105 104 100 y ... ... 2 y ... ... ... ... …<br />
Norway 8 - 426 49 100 100 100 100 100 100 0.5 59 98 98 99 …<br />
Pol<strong>and</strong> 8 ... 2,161 z 49 z 101 z 101 z 101 z 97 z 97 z 97 z 62 z 48 z 98 z 98 z 98 z …<br />
Portugal 8 ... 674 48 109 111 106 99 99 99 8 54 * ... ... ... …<br />
Republic of Moldova 9 0.5 138 48 93 * 93 * 93 * 90 * 90 90 * 15 * 49 92 * 92 92 * 99<br />
Romania 8 ... 807 y 48 y 96 y 96 y 95 y 91 y 92 y 91 y 72 y 51 y 94 y 95 y 93 y …<br />
Russian Federation ... 5,726 49 99 98 99 96 96 97 220 40 100 100 101 100<br />
San Marino 9 0.3 y 2 y 46 y 93 *,y 94 *,y 93 *,y 93 *,y 93 *,y 93 *,y 0.1 *,y 47 *,y 95 *,y 98 *,y 93 *,y …<br />
Serbia 9 0.4 285 49 101 101 101 99 98 99 4 39 102 102 102 98<br />
Slovakia ... 214 49 101 102 100 ... ... ... ... ... 98 98 98 …<br />
Slovenia 8 0.6 112 49 99 99 99 98 97 98 2 37 99 99 99 …<br />
Spain 8 0.1 2,961 49 105 104 105 99 99 99 29 40 98 98 98 …<br />
Sweden 8 - 757 50 121 118 124 100 100 100 2 29 101 101 101 …<br />
Switzerl<strong>and</strong> 0.2 484 49 103 103 103 100 99 100 2 17 95 95 96 …<br />
TFYR Macedonia ... 107 y 48 y 86 y 86 y 85 y 88 y 89 y 88 y 15 y 52 y ... ... ... 97<br />
Ukraine 1.1 1,685 49 104 103 105 97 96 98 56 34 110 109 112 100<br />
United Kingdom ... 4,737 49 108 108 108 100 ... ... 6 ... ... ... ... …<br />
United States 8 2.9 24,538 49 100 100 99 94 94 94 1,471 46 ... ... ... …<br />
409
1 ANNEX<br />
TABLE 2<br />
Part 1 (Continued)<br />
ACCESS TO AND PARTICIPATION IN PRIMARY EDUCATION<br />
PROGRESSION AND COMPLETION<br />
Percentage of<br />
pupils over-age<br />
for grade (%) 1<br />
Total enrolment in<br />
primary education<br />
Gross enrolment ratio (GER) in<br />
primary education (%)<br />
Primary adjusted<br />
net enrolment ratio (ANER) (%)<br />
Out-of-school<br />
children 2<br />
Gross intake rate (GIR) to<br />
last grade (%)<br />
Primary<br />
education<br />
completion rate 3<br />
School year<br />
ending in<br />
2014<br />
School year<br />
ending in<br />
2014<br />
School year ending in<br />
2014<br />
School year ending in<br />
2014<br />
School year<br />
ending in<br />
2014<br />
School year ending in<br />
2014<br />
Most recent<br />
survey year<br />
2009–2014 5<br />
410<br />
Country or territory<br />
Total Total % F Total Male Female Total Male Female Total % F Total Male Female Total<br />
(000) (000)<br />
Latin America <strong>and</strong> the Caribbean<br />
Anguilla 8 ... ... ... ... ... ... ... ... ... ... ... ... ... ... …<br />
Antigua <strong>and</strong> Barbuda 7.1 10 48 97 101 93 86 87 85 1 54 102 112 93 …<br />
Argentina 5.2 z 4,792 z 49 z 111 z 111 z 110 z 99 z 100 z 99 z 28 z 89 z 101 z 101 z 100 z 97<br />
Aruba 9.0 10 48 117 119 115 99 99 99 0.1 40 101 101 101 …<br />
Bahamas ... ,,, ... ... ... ... ... ... ... ... ... ... ... ... …<br />
Barbados 5.1 21 49 94 93 94 91 91 92 2 43 96 92 99 99<br />
Belize 7.9 52 48 112 114 109 99 100 98 0.4 88 102 104 101 85<br />
Bermuda 0.0 y 4 48 87 89 86 83 y 85 y 82 y 0.8 y 55 y 79 ... ... …<br />
Bolivia, P.S. 7 10.4 z 1,349 z 48 z ... ... ... ... ... ... ... ... ... ... ... ...<br />
Brazil 8,9 10.6 z 16,761 z 48 z 110 *,z 112 *,z 107 *,z 94 *,z 94 *,z 94 *,z 950 *,z 48 *,z ... ... ... 80<br />
British Virgin Isl<strong>and</strong>s 9 5.7 3 47 98 * ... ... ... ... ... ... ... 78<br />
*<br />
... ... …<br />
Cayman Isl<strong>and</strong>s 7 0.3 z 4 z 50 z ... ... ... ... ... ... ... ... ... ... ... …<br />
Chile 5.8 1,469 48 101 102 99 93 93 93 101 50 96 96 96 98<br />
Colombia 8 15.5 4,543 48 114 116 112 92 92 92 309 48 101 101 100 92<br />
Costa Rica 9.3 476 49 111 111 110 96 96 96 16 49 99 99 98 94<br />
Cuba 0.4 763 47 98 100 96 93 93 94 53 46 98 96 100 …<br />
Curaçao ... 21 z 48 z 175 z 179 z 171 z ... ... ... ... ... ... ... ... …<br />
Dominica 3.9 8 49 118 118 118 ... ... ... ... ... 107 104 110 …<br />
Dominican Republic 20.1 1,268 47 101 105 96 86 86 85 179 51 91 91 90 92<br />
Ecuador 9.8 2,068 49 113 113 113 97 96 98 63 34 113 112 113 97<br />
El Salvador 17.8 777 48 112 115 110 94 94 94 41 46 105 104 105 …<br />
Grenada 1.4 13 48 103 104 102 97 97 97 0.3 50 89 89 90 …<br />
Guatemala 19.8 2,417 48 104 106 102 89 89 89 258 50 87 88 85 71<br />
Guyana 0.4 y 94 y 49 y 85 y 87 y 84 y 85 y 86 y 84 y 17 y 55 y 84 y 87 y 81 y 95<br />
Haiti ... ... ... ... ... ... ... ... ... ... ... ... ... ... 56<br />
Honduras 17.4 1,150 49 109 110 108 95 95 95 54 46 91 89 93 79<br />
Jamaica 1.1 266 48 ... ... ... ... ... ... ... ... ... ... ... 99<br />
Mexico 2.9 14,627 49 103 104 103 98 97 98 340 38 105 104 105 96<br />
Montserrat 7 - 0 49 ... ... ... ... ... ... ... ... ... ... ... …<br />
Nicaragua ... ... ... ... ... ... ... ... ... ... ... ... ... ... 72<br />
Panama 10.1 z 436 z 48 z 105 z 107 z 104 z 97 z 97 z 96 z 14 z 55 z 102 z 103 z 101 z 95<br />
Paraguay 16.0 y 838 y 48 y 106 y 108 y 104 y 89 y 89 y 89 y 85 y 50 y 89 y 89 y 90 y …<br />
Peru 8.2 3,496 49 101 101 101 95 95 96 162 45 96 95 97 93<br />
Saint Kitts <strong>and</strong> Nevis 0.3 6 50 84 83 84 81 80 83 1 46 82 78 86 …<br />
Saint Lucia 1.0 17 48 ... ... ... ... ... ... ... ... ... ... ... 99<br />
Saint Martin ... ... ... ... ... ... ... ... ... ... ... ... ... ... …<br />
St. Vincent <strong>and</strong> the Grenadines 1.1 13 49 105 106 103 91 92 91 1 51 101 102 99 …<br />
Sint-Maarten 7 15.4 4 49 ... ... ... ... ... ... ... ... ... ... ... …<br />
Suriname 21.5 70 49 120 122 118 91 91 92 5 47 94 87 100 81<br />
Trinidad <strong>and</strong> Tobago 8 ... ... ... ... ... ... ... ... ... ... ... ... ... ... …<br />
Turks <strong>and</strong> Caicos Isl<strong>and</strong>s 7 1.2 3 49 ... ... ... ... ... ... ... ... ... ... ... …<br />
Uruguay 5.6 z 327 z 48 z 110 z 111 z 108 z 99 z 100 z 99 z 2 z 58 z 103 z 104 z 102 z 97<br />
Venezuela, B.R. 7.8 3,493 48 101 102 100 93 93 93 243 48 96 96 97 …<br />
Northern Africa <strong>and</strong> Western Asia<br />
Algeria 6.5 3,765 48 119 122 115 ... ... ... ... ... 109 109 109 …<br />
Bahrain 7,8 2.1 104 49 ... ... ... ... ... ... ... ... ... ... ... …<br />
Egypt 2.2 11,128 48 104 104 104 99 99 99 113 29 104 z 103 z 104 z 91<br />
Iraq ... ... ... ... ... ... ... ... ... ... ... ... ... ... 60<br />
Israel 8 0.5 862 49 104 104 104 97 97 97 24 44 102 102 103 100<br />
Jordan 8 ... 849 y 49 y 89 y 89 y 88 y 88 y 88 y 87 y 119 y 51 y ... ... ... 98<br />
Kuwait 8 1.0 253 49 103 102 103 99 98 99 3 25 103 z 100 z 107 z …<br />
Lebanon 8 8.2 z 472 z 48 z 97 z 102 z 93 z 89 z 92 z 86 z 54 z 64 z 78 z 80 z 76 z …<br />
Libya ... ... ... ... ... ... ... ... ... ... ... ... ... ... …<br />
Morocco 8 14.1 4,030 48 116 119 113 99 99 99 37 54 102 103 101 70<br />
Oman 0.5 233 51 110 106 115 97 97 97 6 49 109 110 108 …<br />
Palestine 0.8 442 49 95 95 95 93 93 93 33 49 97 99 95 99<br />
Qatar 7,8 1.4 117 49 ... ... ... ... ... ... ... ... ... ... ... …<br />
Saudi Arabia 8 8.2 3,737 49 109 109 108 96 98 95 121 70 111 113 109 …<br />
Sudan 33.7 y 4,292 z 47 z 70 z 74 z 67 z 55 y 53 y 56 y 2,713 y 48 y 57 z 59 z 54 z 86<br />
Syrian Arab Republic 4.9 z 1,547 z 48 z 80 z 81 z 79 z 71 z 72 z 70 z 563 z 50 z 69 z 69 z 69 z …<br />
Tunisia 8 4.3 1,089 48 113 115 111 100 z ... ... 4 z ... 100 99 100 94<br />
Turkey ... 5,594 z 49 z 107 z 107 z 107 z 93 z 94 z 93 z 357 z 53 z 100 y 101 y 99 y …<br />
United Arab Emirates 1.4 410 49 107 106 107 96 96 96 15 46 103 102 104 …<br />
Yemen 8 17.1 z 3,875 z 45 z 97 z 106 z 89 z 85 z 92 z 78 z 583 z 73 z 69 z 77 z 61 z 63<br />
The Pacific<br />
Australia 7 0.2 2,169 49 ... ... ... 97 z 97 z 98 z 51 z 45 z ... ... ... …<br />
Cook Isl<strong>and</strong>s 9 0.5 2 49 106 * 108 * 104 * 98 * ... ... 0.03 * ... 103 * 102 * 105 * …<br />
Fiji 8 8 z 105 z 48 z 106 z 105 z 106 z 97 z 96 z 98 z 3 z 27 z 103 z 103 z 103 z …<br />
Kiribati 8 4 16 49 113 111 115 98 ... ... 0.3 ... 112 106 120 …<br />
Marshall Isl<strong>and</strong>s 8 ... ... ... ... ... ... ... ... ... ... ... ... ... ... …<br />
Micronesia F.S. 8 10 14 48 98 98 97 87 86 88 2 44 ... ... ... …<br />
Nauru 8,9 0.2 2 48 105 * 110 * 100 * 87 * 89 * 84 0.2 * 58 * 112 * 128 * 97 * …<br />
New Zeal<strong>and</strong> 8 0.2 360 49 99 99 98 98 99 98 5 53 ... ... ... …<br />
Niue 8,9 ... 0 54 126 * 127 * 125 * ... ... ... ... ... 131 * 91 * 160 * …
STATISTICAL TABLES<br />
1<br />
TABLE 2<br />
Part 1 (Continued)<br />
ACCESS TO AND PARTICIPATION IN PRIMARY EDUCATION<br />
PROGRESSION AND COMPLETION<br />
Percentage of<br />
pupils over-age<br />
for grade (%) 1<br />
Total enrolment in<br />
primary education<br />
Gross enrolment ratio (GER) in<br />
primary education (%)<br />
Primary adjusted<br />
net enrolment ratio (ANER) (%)<br />
Out-of-school<br />
children 2<br />
Gross intake rate (GIR) to<br />
last grade (%)<br />
Primary<br />
education<br />
completion rate 3<br />
School year<br />
ending in<br />
2014<br />
School year<br />
ending in<br />
2014<br />
School year ending in<br />
2014<br />
School year ending in<br />
2014<br />
School year<br />
ending in<br />
2014<br />
School year ending in<br />
2014<br />
Most recent<br />
survey year<br />
2009–2014 5<br />
Country or territory<br />
Total Total % F Total Male Female Total Male Female Total % F Total Male Female Total<br />
(000) (000)<br />
Palau 8,9 14 2 46 114 * 116 * 112 * 99 ... ... 0.01 * ... 96 * 97 * 94 * …<br />
Papua New Guinea 8 ... 1,427 y 46 y 115 y 120 y 109 y 87 y 90 y 84 y 160 y 61 y 79 y 84 y 72 y …<br />
Samoa 8 8 31 48 106 106 106 97 97 98 0.8 34 100 103 98 …<br />
Solomon Isl<strong>and</strong>s 8 ... 102 48 114 116 112 ... ... ... ... ... 87 87 88 …<br />
Tokelau 8 ... ... ... ... ... ... ... ... ... ... ... ... ... ... …<br />
Tonga 0.2 17 48 108 109 107 99 99 99 0.2 47 111 z 115 z 106 z …<br />
Tuvalu 8,9 - 1 47 101 * 101 * 102 * 96 * 95 * 98 * 0.06 * 27 * 93 * 89 * 98 * …<br />
Vanuatu ... 44 z 47 z 124 z 125 z 122 z ... ... ... ... ... 94 z 90 z 98 z …<br />
Southern Asia<br />
Afghanistan 6 6,218 40 112 131 92 ... ... ... ... ... ... ... ... 35<br />
Bangladesh ... ... ... ... ... ... ... ... ... ... ... ... ... ... 80<br />
Bhutan 8 15 102 50 102 101 103 89 88 90 11 44 97 91 103 56<br />
India 5 z 141,155 z 50 z 111 z 105 z 117 z 98 z 97 z 98 z 2,886 z 32 z 96 z 94 z 99 z 88<br />
Iran, Islamic Republic of 8 3 y 7,441 50 109 107 112 99 ... ... 45 ... 102 y 102 y 102 y …<br />
Maldives 7,8 2 40 48 ... ... ... ... ... ... ... ... ... ... ... 99<br />
Nepal 34 4,335 51 135 130 141 97 98 96 92 62 106 101 111 77<br />
Pakistan - 19,432 44 94 101 86 73 79 67 5,612 59 74 80 67 61<br />
Sri Lanka 8 1 z 1,778 49 101 102 100 97 98 96 47 66 98 99 97 …<br />
Sub-Saharan Africa<br />
Angola ... ... ... ... ... ... ... ... ... ... ... ... ... ... …<br />
Benin 12 2,133 47 126 131 120 96 ... ... 70 ... 76 82 70 55<br />
Botswana 8 20 z 340 z 49 z 109 z 110 z 107 z 91 z 91 z 92 z 27 z 46 z 100 z 98 z 101 z …<br />
Burkina Faso 37 2,594 48 87 89 85 68 70 66 957 52 61 59 62 30<br />
Burundi 38 2,047 51 128 127 128 96 95 97 69 39 67 63 70 32<br />
Cabo Verde 11 67 48 113 116 110 98 98 98 1 44 100 101 98 …<br />
Cameroon 16 4,143 47 114 120 107 95 100 90 193 96 72 77 68 66<br />
Central African Republic 38 y 662 y 43 y 93 y 107 y 80 y 71 y 79 y 62 y 207 y 65 y 44 y 55 y 34 y 38<br />
Chad ... 2,331 z 43 z 101 z 115 z 88 z 84 z 95 z 74 z 357 z 83 z 38 z 46 z 30 z 32<br />
Comoros 8 23 z 120 z 48 z 105 z 108 z 102 z 85 z 88 z 83 z 17 z 57 z 74 z 72 z 76 z 69<br />
Congo 23 y 734 y 52 y 111 y 107 y 115 y 93 y 89 y 97 y 47 y 23 y 74 y 70 y 79 y 74<br />
Côte d’Ivoire 23 3,177 46 90 96 84 75 80 71 879 59 57 63 50 50<br />
D.R. Congo ... 13,535 47 107 112 102 ... ... ... ... ... 67 z 73 z 60 z 71<br />
Djibouti 10 63 46 66 70 62 57 61 54 40 53 64 68 59 …<br />
Equatorial Guinea 46 y 92 y 49 y 84 y 85 y 84 y 58 y 58 y 58 y 46 y 50 y 51 y 51 y 52 y …<br />
Eritrea 33 z 350 z 45 z 51 z 55 z 47 z 41 z 43 z 38 z 405 z 51 z 37 z 40 z 34 z …<br />
Ethiopia 25 15,733 47 100 104 96 86 89 84 2,124 60 54 54 53 45<br />
Gabon ... ... ... ... ... ... ... ... ... ... ... ... ... ... 79<br />
Gambia 8 27 275 51 86 84 88 69 66 72 99 45 67 66 69 61<br />
Ghana 24 4,342 49 110 110 110 92 92 92 319 48 101 101 101 65<br />
Guinea 15 1,730 45 91 99 84 78 84 72 417 63 62 68 56 42<br />
Guinea-Bissau ... ... ... ... ... ... ... ... ... ... ... ... ... ... …<br />
Kenya ... 8,158 50 111 111 112 86 y 84 y 88 y 956 y 43 y 104 103 104 91<br />
Lesotho 8 38 366 49 107 108 106 81 79 82 66 45 76 67 85 69<br />
Liberia 86 684 47 96 100 92 38 39 37 442 50 59 63 54 51<br />
Madagascar ... 4,611 50 147 147 147 ... ... ... ... ... 69 67 71 ...<br />
Malawi 37 4,097 50 147 145 148 ... ... ... ... ... 79 79 80 54<br />
Mali 10 2,182 46 77 81 73 64 67 60 1.030 54 53 56 50 42<br />
Mauritania 43 592 51 98 95 101 75 73 77 151 46 68 66 69 49<br />
Mauritius 1 105 50 103 102 104 97 96 98 4 34 97 96 99 …<br />
Mozambique 40 5,670 48 104 109 100 88 90 85 678 58 48 51 45 32<br />
Namibia 27 z 425 z 49 z 111 z 113 z 110 z 91 z 89 z 92 z 36 z 42 z 86 z 84 z 89 z 82<br />
Niger 6 2,277 45 71 76 65 62 66 57 1.233 55 59 65 52 28<br />
Nigeria ... ... ... ... ... ... ... ... ... ... ... ... ... ... 72<br />
Rw<strong>and</strong>a 30 y 2,399 51 134 132 135 96 z 95 z 97 z 68 z 34 z 67 z 61 z 72 z 38<br />
Sao Tome <strong>and</strong> Principe 18 36 49 114 116 111 96 97 95 1 62 92 84 101 ...<br />
Senegal 13 1,888 52 81 78 84 73 70 76 634 44 59 55 63 51<br />
Seychelles ... 9 49 104 104 105 95 94 95 0.5 44 112 116 108 …<br />
Sierra Leone 14 z 1,300 z 50 z 130 z 130 z 130 z 99 y 100 y 99 y 7 y 98 y 70 z 71 z 68 z 67<br />
Somalia ... ... ... ... ... ... ... ... ... ... ... ... ... ... …<br />
South Africa 8 ... 7,195 49 100 102 97 ... ... ... ... ... ... ... ... 94<br />
South Sudan ... ... ... ... ... ... ... ... ... ... ... ... ... ... 28<br />
Swazil<strong>and</strong> 50 z 239 z 47 z 113 z 118 z 108 z 79 z 79 z 78 z 45 z 50 z 79 z 78 z 80 z 58<br />
Togo ... 1,413 48 125 129 121 93 96 90 79 73 85 91 79 55<br />
Ug<strong>and</strong>a 8 32 z 8,459 z 50 z 110 z 109 z 111 z 94 z 92 z 95 z 477 z 38 z 56 z 56 z 55 z 37<br />
U.R. Tanzania 8 7 z 8,232 51 z 87 z 86 z 87 z 82 z 81 z 82 z 1,715 z 49 z 74 z 70 z 77 z 71<br />
Zambia 28 3,075 z 50 z 104 z 103 z 104 z 89 z 88 z 90 z 325 z 45 z 81 z 82 z 80 z 77<br />
Zimbabwe 23 z 2,663 z 50 z 100 z 101 z 99 z 86 z 86 z 87 z 365 z 47 z 90 z 90 z 91 z 86<br />
411
1 ANNEX<br />
TABLE 2<br />
Part 1 (Continued)<br />
ACCESS TO AND PARTICIPATION IN PRIMARY EDUCATION<br />
PROGRESSION AND COMPLETION<br />
Percentage of<br />
pupils over-age<br />
for grade (%) 1<br />
Total enrolment in<br />
primary education<br />
Gross enrolment ratio (GER) in<br />
primary education (%)<br />
Primary adjusted<br />
net enrolment ratio (ANER) (%)<br />
Out-of-school<br />
children 2<br />
Gross intake rate (GIR) to<br />
last grade (%)<br />
Primary<br />
education<br />
completion rate 3<br />
School year<br />
ending in<br />
2014<br />
School year<br />
ending in<br />
2014<br />
School year ending in<br />
2014<br />
School year ending in<br />
2014<br />
School year<br />
ending in<br />
2014<br />
School year ending in<br />
2014<br />
Most recent<br />
survey year<br />
2009–2014 5<br />
Country or territory<br />
Total Total % F Total Male Female Total Male Female Total % F Total Male Female Total<br />
(000) (000)<br />
Median Sum % F Weighted average Weighted average Sum % F Weighted average Median<br />
World 4 718,801 48 105 105 104 91 92 90 60,901 53 90 91 90 …<br />
Countries in transition 0.8 14,066 49 100 100 100 95 95 96 654 46 102 101 102 99<br />
Developed countries 0.3 66,284 49 102 102 102 97 97 97 1,979 46 98 z 97 z 98 z …<br />
Developing countries 8 638,450 48 105 105 104 90 91 89 58,268 53 89 90 88 73<br />
Caucasus <strong>and</strong> Central Asia 0.6 5,491 48 102 102 101 94 95 94 309 51 101 102 101 100<br />
Eastern <strong>and</strong> South-eastern<br />
Asia<br />
3 176,047 47 105 106 105 96 96 96 6,247 47 98 99 98 …<br />
Eastern Asia 1.0 107,035 47 104 104 104 97 97 97 2,922 47 97 97 96 …<br />
South-eastern Asia 3 69,011 48 108 109 107 95 95 95 3,325 48 100 100 100 82<br />
Europe <strong>and</strong> Northern<br />
America<br />
0.5 65,012 49 102 102 101 97 96 97 2,238 45 97 97 98 …<br />
Latin America <strong>and</strong> the<br />
Caribbean<br />
6 65,090 48 108 110 107 94 94 94 3,591 47 100 100 100 94<br />
Caribbean 1 5,073 48 126 128 124 79 79 79 842 49 94 93 96 …<br />
Latin America 10 60,017 48 107 108 106 95 95 95 2,749 47 100 100 101 93<br />
Northern Africa <strong>and</strong> Western<br />
Asia<br />
3 50,312 47 101 103 98 89 90 88 5,474 54 90 92 87 …<br />
Northern Africa 7 25,192 48 100 102 98 89 88 89 2,897 47 93 93 92 94<br />
Western Asia 1 25,119 47 101 105 98 90 92 87 2,577 62 87 90 83 …<br />
Pacific 0.5 4,344 48 108 110 107 94 95 93 241 57 95 z 94 z 96 z …<br />
Southern Asia 4 198,559 49 109 106 112 94 94 93 11,367 52 92 91 93 77<br />
Sub-Saharan Africa 24 153,945 48 100 103 96 80 82 77 31,432 55 69 72 67 55<br />
Conflict-affected countries 10 346,658 48 104 104 104 81 ** 84 ** 79 ** 21,549 ** 55 ** 88 88 87 67<br />
Countries with low income 26 105,779 48 104 108 101 81 84 79 18,889 56 67 69 64 50<br />
Countries with middle<br />
income<br />
6 523,274 48 105 105 105 92 93 92 39,206 51 93 93 93 92<br />
Lower middle 11 329,787 49 105 103 106 90 91 89 30,918 52 91 90 91 74<br />
Upper middle 3 193,487 47 106 107 104 95 96 95 8,287 50 96 97 96 95<br />
Countries with high income 0.8 89,748 49 102 103 102 97 97 97 2,807 48 98 98 99 …<br />
412
STATISTICAL TABLES<br />
1<br />
TABLE 2<br />
SDG 4, Target 4.1 – Universal access, participation <strong>and</strong> completion, primary education – part 2<br />
By 2030, ensure that all girls <strong>and</strong> boys complete free, equitable <strong>and</strong> quality primary education leading to relevant <strong>and</strong> effective learning outcomes<br />
LEARNING ASSESSMENTS AND OUTCOMES 4<br />
Existence of nationally representative learning assessment<br />
In early grades (2 or 3) of<br />
primary education<br />
At the end of<br />
primary education<br />
Percentage of pupils in<br />
early primary education grades (2 or 3) achieving<br />
at least a minimum proficiency level (%) 6 in:<br />
Percentage of pupils at<br />
end of primary education achieving<br />
at least a minimum proficiency level (%) 6 in:<br />
Most recent survey year Most recent survey year Reading Mathematics Reading Mathematics<br />
2009–2014 5 2009–2014 5 2009–2014 5 2009–2014 5 2009–2014 5 2009–2014 5<br />
Country or territory<br />
Total Total Total Total<br />
Caucasus <strong>and</strong> Central Asia<br />
Armenia 7,8 No Yes I, N ... ... ... 71 I<br />
Azerbaijan 8,9 No Yes I, N ... ... 82 I 73 I<br />
Georgia 8 Yes I No 87 I 73 I ... ...<br />
Kazakhstan No Yes I, N ... ... ... 88 I<br />
Kyrgyzstan No Yes N ... ... ... ...<br />
Tajikistan No Yes N ... ... ... ...<br />
Turkmenistan ... ... ... ... ... ...<br />
Uzbekistan No Yes N ... ... ... ...<br />
Eastern <strong>and</strong> South-eastern Asia<br />
Brunei Darussalam ... ... ... ... ... ...<br />
Cambodia Yes I, N Yes I, N 88 I 88 I 85 I 81 I<br />
China 8 Yes N No ... ... ... ...<br />
DPR Korea ... ... ... ... ... ...<br />
Hong Kong, China 8 Yes I ... 99 I 99 I ... ...<br />
Indonesia 8 Yes I No 66 I ... ... ...<br />
Japan 8 Yes I Yes N ... 99 I ... ...<br />
Lao PDR Yes I, N Yes N 86 I 86 I 75 I 59 I<br />
Macao, China 7 ... ... ... ... ... ...<br />
Malaysia No No ... ... ... ...<br />
Mongolia No Yes N ... ... ... ...<br />
Myanmar Yes N Yes N ... ... ... ...<br />
Philippines Yes I, N Yes N ... ... ... ...<br />
Republic of Korea 8 Yes I Yes N ... 100 I ... ...<br />
Singapore 8 Yes I No 97 I 99 I ... ...<br />
Thail<strong>and</strong> 8 Yes I, N Yes N ... 78 I ... ...<br />
Timor-Leste Yes I No ... ... ... ...<br />
Viet Nam Yes I Yes I, N 100 I 100 I 100 I 100 I<br />
Europe <strong>and</strong> Northern America<br />
Albania ... ... ... ... ... ...<br />
Andorra 7 ... ... ... ... ... ...<br />
Austria No Yes I, N ... ... 98 I 96 I<br />
Belarus ... ... ... ... ... ...<br />
Belgium Yes N Yes N ... ... ... ...<br />
Bosnia <strong>and</strong> Herzegovina No No ... ... ... ...<br />
Bulgaria No Yes I, N ... ... 93 I ...<br />
Canada 8 Yes I No 98 I ... ... ...<br />
Croatia No Yes I, N ... ... 99 I 92 I<br />
Cyprus 9 Yes N Yes N ... ... ... ...<br />
Czech Republic 8 No Yes I ... ... 99 I 94 I<br />
Denmark 8 Yes I,N Yes N 99 I 97 I ... ...<br />
Estonia Yes N Yes N ... ... ... ...<br />
Finl<strong>and</strong> 8 Yes I,N Yes N 100 I 98 I ... ...<br />
France 8 Yes N Yes I, N ... ... 96 I ...<br />
Germany Yes N Yes I ... ... 98 I 98 I<br />
Greece ... ... ... ... ... ...<br />
Hungary No Yes I, N ... ... 95 I 90 I<br />
Icel<strong>and</strong> 8 Yes N Yes N ... ... ... ...<br />
Irel<strong>and</strong> 8 Yes I,N No 97 I 95 I ... ...<br />
Italy 8 Yes I,N Yes N 98 I 94 I ... ...<br />
Latvia Yes N Yes N ... ... ... ...<br />
Liechtenstein ... ... ... ... ... ...<br />
Lithuania No Yes I, N ... ... 97 I 96 I<br />
Luxembourg Yes N No ... ... ... ...<br />
Malta 8 Yes I No 78 I 89 I ... ...<br />
Monaco 7 ... ... ... ... ... ...<br />
Montenegro Yes N No ... ... ... ...<br />
Netherl<strong>and</strong>s 8 Yes I,N Yes N 100 I 100 I ... ...<br />
Norway 8 Yes I,N Yes N 96 I 92 I ... ...<br />
Pol<strong>and</strong> 8 Yes I Yes N 95 I 87 I ... ...<br />
Portugal 8 Yes I Yes N 98 97 ... ...<br />
Republic of Moldova 9 ... ... ... ... ... ...<br />
Romania 8 No Yes I, N ... ... 86 I 79 I<br />
Russian Federation No Yes I ... ... 99 I 98 I<br />
San Marino 9 ... ... ... ... ... ...<br />
Serbia 9 Yes N Yes I, N ... ... ... 91 I<br />
Slovakia No Yes I ... ... 96 I 91 I<br />
Slovenia 8 Yes I,N Yes N 96 I 95 I ... ...<br />
Spain 8 Yes I Yes N 95 88 ... ...<br />
Sweden 8 Yes I,N Yes N 98 I 94 I ... ...<br />
413
1 ANNEX<br />
TABLE 2<br />
Part 2 (Continued)<br />
Existence of nationally representative learning assessment<br />
In early grades (2 or 3) of<br />
primary education<br />
At the end of<br />
primary education<br />
LEARNING ASSESSMENTS AND OUTCOMES 4<br />
Percentage of pupils in<br />
early primary education grades (2 or 3) achieving<br />
at least a minimum proficiency level (%) 6 in:<br />
Percentage of pupils at<br />
end of primary education achieving<br />
at least a minimum proficiency level (%) 6 in:<br />
414<br />
Country or territory<br />
Most recent survey year Most recent survey year Reading Mathematics Reading Mathematics<br />
2009–2014 5 2009–2014 5 2009–2014 5 2009–2014 5 2009–2014 5 2009–2014 5<br />
Total Total Total Total<br />
Switzerl<strong>and</strong> ... ... ... ... ... ...<br />
TFYR Macedonia No No ... ... ... ...<br />
Ukraine No No ... ... ... ...<br />
United Kingdom Yes N Yes N ... ... ... ...<br />
United States 8 Yes I No ... 97 I ... ...<br />
Latin America <strong>and</strong> the Caribbean<br />
Anguilla 8 Yes N Yes N ... ... ... ...<br />
Antigua <strong>and</strong> Barbuda ... ... ... ... ... ...<br />
Argentina Yes R, N Yes R, N 62 R 61 R 83 R 63 R<br />
Aruba ... ... ... ... ... ...<br />
Bahamas Yes N Yes N ... ... ... ...<br />
Barbados Yes N No ... ... ... ...<br />
Belize Yes N Yes N ... ... ... ...<br />
Bermuda ... ... ... ... ... ...<br />
Bolivia, P.S. 7 Yes N Yes N ... ... ... ...<br />
Brazil 8,9 Yes R, N Yes N 66 R 63 R 89 R 60 R<br />
British Virgin Isl<strong>and</strong>s 9 ... ... ... ... ... ...<br />
Cayman Isl<strong>and</strong>s 7 ... ... ... ... ... ...<br />
Chile Yes R, N Yes R, N 90 R 85 R 95 R 84 R<br />
Colombia 8 Yes R, N Yes N 68 R 52 R 90 R 58 R<br />
Costa Rica Yes R, N Yes R, N 82 R 77 R 96 R 70 R<br />
Cuba Yes N Yes N ... ... ... ...<br />
Curaçao ... ... ... ... ... ...<br />
Dominica ... ... ... ... ... ...<br />
Dominican Republic Yes R, N Yes R 26 R 15 R 62 R 20 R<br />
Ecuador Yes R, N Yes R 62 R 52 R 79 R 55 R<br />
El Salvador Yes N Yes N ... ... ... ...<br />
Grenada ... ... ... ... ... ...<br />
Guatemala Yes R, N Yes R, N 54 R 40 R 80 R 44 R<br />
Guyana Yes N Yes N ... ... ... ...<br />
Haiti ... ... ... ... ... ...<br />
Honduras Yes R, N Yes R, N 54 R 44 R 75 R 38 R<br />
Jamaica Yes N Yes N ... ... ... ...<br />
Mexico Yes R, N Yes R, N 67 R 70 R 90 R 77 R<br />
Montserrat 7 ... ... ... ... ... ...<br />
Nicaragua Yes R, N Yes R, N 44 R 32 R 74 R 29 R<br />
Panama Yes R, N Yes R, N 51 R 40 R 74 R 33 R<br />
Paraguay Yes R, N Yes R, N 43 R 33 R 66 R 31 R<br />
Peru Yes R, N Yes R, N 68 R 60 R 82 R 62 R<br />
Saint Kitts <strong>and</strong> Nevis Yes N Yes N ... ... ... ...<br />
Saint Lucia ... ... ... ... ... ...<br />
Saint Martin ... ... ... ... ... ...<br />
St. Vincent <strong>and</strong> the Grenadines ... ... ... ... ... ...<br />
Sint-Maarten 7 ... ... ... ... ... ...<br />
Suriname ... ... ... ... ... ...<br />
Trinidad <strong>and</strong> Tobago 8 Yes I,N Yes I,N 78 I ... ... ...<br />
Turks <strong>and</strong> Caicos Isl<strong>and</strong>s 7 ... ... ... ... ... ...<br />
Uruguay Yes R, N Yes R, N 71 R 68 R 89 R 74 R<br />
Venezuela, B.R. Yes N Yes N ... ... ... ...<br />
Northern Africa <strong>and</strong> Western Asia<br />
Algeria ... ... ... ... ... ...<br />
Bahrain 7,8 Yes I,N Yes N … 67 I … …<br />
Egypt Yes I No … ... … …<br />
Iraq ... ... ... ... ... ...<br />
Israel 8 Yes I,N Yes N 93 I ... ... ...<br />
Jordan 8 Yes I Yes N … ... … …<br />
Kuwait 8 No Yes I ... ... 58 I 28 I<br />
Lebanon 8 Yes I Yes I 93 I 88 I 90 I 91 I<br />
Libya ... ... ... ... ... ...<br />
Morocco 8 Yes I,N Yes N 19 I 24 I ... ...<br />
Oman No Yes I,N … ... 46 I 45 I<br />
Palestine No Yes N … ... … …<br />
Qatar 7,8 Yes I Yes N 58 I 55 I ... ...<br />
Saudi Arabia 8 Yes I,N Yes N 65 I 54 I ... ...<br />
Sudan Yes N No ... ... ... ...<br />
Syrian Arab Republic No No ... ... ... ...<br />
Tunisia 8 Yes I Yes N ... 33 I ... ...<br />
Turkey No Yes I ... ... ... 78 I<br />
United Arab Emirates Yes N Yes I,N ... ... 63 I 64 I<br />
Yemen 8 Yes I No ... 8 I ... ...<br />
The Pacific<br />
Australia 7 Yes N Yes N 94 N 95 N 95 N 95 N
STATISTICAL TABLES<br />
1<br />
TABLE 2<br />
Part 2 (Continued)<br />
Existence of nationally representative learning assessment<br />
In early grades (2 or 3) of<br />
primary education<br />
At the end of<br />
primary education<br />
LEARNING ASSESSMENTS AND OUTCOMES 4<br />
Percentage of pupils in<br />
early primary education grades (2 or 3) achieving<br />
at least a minimum proficiency level (%) 6 in:<br />
Percentage of pupils at<br />
end of primary education achieving<br />
at least a minimum proficiency level (%) 6 in:<br />
Country or territory<br />
Most recent survey year Most recent survey year Reading Mathematics Reading Mathematics<br />
2009–2014 5 2009–2014 5 2009–2014 5 2009–2014 5 2009–2014 5 2009–2014 5<br />
Total Total Total Total<br />
Cook Isl<strong>and</strong>s 9 Yes N Yes R ... ... ... ...<br />
Fiji 8 Yes R, N Yes R, N ... ... ... ...<br />
Kiribati 8 Yes R, N Yes R, N ... ... ... ...<br />
Marshall Isl<strong>and</strong>s 8 Yes R Yes R ... ... ... ...<br />
Micronesia F.S. 8 Yes R Yes R ... ... ... ...<br />
Nauru 8,9 Yes R Yes R ... ... ... ...<br />
New Zeal<strong>and</strong> 8 Yes I No 92 I 85 I ... ...<br />
Niue 8,9 Yes R Yes R ... ... ... ...<br />
Palau 8,9 Yes R Yes R ... ... ... ...<br />
Papua New Guinea 8 Yes R Yes R ... ... ... ...<br />
Samoa 8 Yes R, N Yes R ... ... ... ...<br />
Solomon Isl<strong>and</strong>s 8 Yes R, N Yes R ... ... ... ...<br />
Tokelau 8 Yes R Yes R ... ... ... ...<br />
Tonga Yes I Yes N ... ... ... ...<br />
Tuvalu 8,9 Yes R, N Yes R ... ... ... ...<br />
Vanuatu Yes I Yes R ... ... ... ...<br />
Southern Asia<br />
Afghanistan No Yes N ... ... ... ...<br />
Bangladesh Yes N Yes N ... ... ... ...<br />
Bhutan 8 No Yes N ... ... ... ...<br />
India Yes N Yes N ... ... ... ...<br />
Iran, Islamic Republic of 8 Yes I No 76 I 64 I ... ...<br />
Maldives 7,8 Yes N Yes N ... ... ... ...<br />
Nepal Yes I, N Yes N ... ... ... ...<br />
Pakistan No Yes N ... ... ... ...<br />
Sri Lanka 8 No Yes N ... ... ... ...<br />
Sub-Saharan Africa<br />
Angola Yes I No ... ... ... ...<br />
Benin Yes I, N Yes I 85 I 72 I 95 I 75 I<br />
Botswana 8 Yes I No 55 I 59 I ... ...<br />
Burkina Faso Yes I, N Yes I, N 92 I 90 I 98 I 87 I<br />
Burundi Yes I, N Yes I 100 I 100 I 100 I 99 I<br />
Cabo Verde Yes N Yes N ... ... ... ...<br />
Cameroon Yes I Yes I 91 I 90 I 94 I 70 I<br />
Central African Republic ... ... ... ... ... ...<br />
Chad Yes I Yes I 89 I 82 I 80 I 56 I<br />
Comoros 8 Yes I Yes I ... ... 53 I 58 I<br />
Congo Yes I Yes I 95 I 97 I 96 I 72 I<br />
Côte d’Ivoire Yes I, N Yes I, N 92 I 83 I 95 I 71 I<br />
D.R. Congo No No ... ... ... ...<br />
Djibouti ... ... ... ... ... ...<br />
Equatorial Guinea ... ... ... ... ... ...<br />
Eritrea Yes N No ... ... ... ...<br />
Ethiopia Yes I, N No ... ... ... ...<br />
Gabon No No ... ... ... ...<br />
Gambia 8 Yes I, N Yes N ... ... ... ...<br />
Ghana Yes I, N Yes I, N ... ... ... ...<br />
Guinea Yes N Yes N ... ... ... ...<br />
Guinea-Bissau Yes N No ... ... ... ...<br />
Kenya Yes R, N Yes R 32 R 30 R 83 R 92 R<br />
Lesotho 8 Yes N Yes N ... ... ... ...<br />
Liberia Yes I No ... ... ... ...<br />
Madagascar Yes N Yes N ... ... ... ...<br />
Malawi Yes I, N Yes R ... ... ... ...<br />
Mali Yes I, N Yes N 78 I 79 I 84 I 55 I<br />
Mauritania No Yes N ... ... ... ...<br />
Mauritius Yes N No ... ... ... ...<br />
Mozambique Yes N No ... ... ... ...<br />
Namibia No Yes N ... ... ... ...<br />
Niger Yes I, N Yes I, N 67 I 61 I 68 I 32 I<br />
Nigeria Yes N Yes N ... ... ... ...<br />
Rw<strong>and</strong>a Yes I, N Yes I, N ... ... ... ...<br />
Sao Tome <strong>and</strong> Principe … ... ... ... ... ...<br />
Senegal Yes I, N Yes I, N 86 I 87 I 96 I 85 I<br />
Seychelles No Yes N ... ... ... ...<br />
Sierra Leone ... ... ... ... ... ...<br />
Somalia ... ... ... ... ... ...<br />
South Africa 8 Yes N Yes N 56 I ... ... ...<br />
South Sudan No Yes R ... ... ... ...<br />
Swazil<strong>and</strong> No Yes N ... ... ... ...<br />
Togo Yes I, N Yes I 79 I 76 I 94 I 79 I<br />
Ug<strong>and</strong>a 8 Yes R, N Yes R, N 27 R 18 R 73 R 71 R 415
1 ANNEX<br />
TABLE 2<br />
Part 2 (Continued)<br />
Existence of nationally representative learning assessment<br />
In early grades (2 or 3) of<br />
primary education<br />
At the end of<br />
primary education<br />
LEARNING ASSESSMENTS AND OUTCOMES 4<br />
Percentage of pupils in<br />
early primary education grades (2 or 3) achieving<br />
at least a minimum proficiency level (%) 6 in:<br />
Percentage of pupils at<br />
end of primary education achieving<br />
at least a minimum proficiency level (%) 6 in:<br />
Country or territory<br />
Most recent survey year Most recent survey year Reading Mathematics Reading Mathematics<br />
2009–2014 5 2009–2014 5 2009–2014 5 2009–2014 5 2009–2014 5 2009–2014 5<br />
Total Total Total Total<br />
U.R. Tanzania 8 Yes I, R, N Yes R 44 R 12 R 83 R 43 R<br />
Zambia No Yes N ... ... ... ...<br />
Zimbabwe Yes N No ... ... ... ...<br />
World … … … … … …<br />
Countries in transition … … … … … …<br />
Developed countries … … … … … …<br />
Developing countries … … … … … …<br />
Caucasus <strong>and</strong> Central Asia … … … … … …<br />
Eastern <strong>and</strong> South-eastern Asia … … … … … …<br />
Eastern Asia … … … … … …<br />
South-eastern Asia … … … … … …<br />
Europe <strong>and</strong> Northern America … … … … … …<br />
Latin America <strong>and</strong> the Caribbean … … … … … …<br />
Caribbean … … … … … …<br />
Latin America … … … … … …<br />
Northern Africa <strong>and</strong> Western Asia … … … … … …<br />
Northern Africa … … … … … …<br />
Western Asia … … … … … …<br />
Pacific … … … … … …<br />
Southern Asia … … … … … …<br />
Sub-Saharan Africa … … … … … …<br />
Conflict-affected countries … … … … … …<br />
Countries with low income … … … … … …<br />
Countries with middle income … … … … … …<br />
Lower middle … … … … … …<br />
Upper middle … … … … … …<br />
Countries with high income … … … … … …<br />
Source: UIS database, except where noted. GER <strong>and</strong> GIR to last grade are based on the United Nations Population Division<br />
estimates, revision 2015 (United Nations, 2015), median variant.<br />
Note: The country groupings by level of income are as defined by the World Bank but include only countries listed in the<br />
table. They are based on the list of countries by income group as revised in July 2015.<br />
1. Over-age pupils are defined as those whose age is at least two years higher than the official age of entry in a given grade.<br />
2. Data reflect the actual number of children not enrolled at all, derived from the age-specific or adjusted net enrolment<br />
ratio of primary school age children, which measures the proportion of those who are enrolled in either primary or<br />
secondary school.<br />
3. GEM Report team calculations based on data from national <strong>and</strong> international household surveys.<br />
4. Altinok (2013); Cheng <strong>and</strong> Omeova (2014); education ministry national reports <strong>and</strong> websites; EGMA/EGRA; PASEC;<br />
PILNA; PIRLS 2011; SACMEQ; TERCE; TIMSS 2011; Uwezo. ‘Nationally representative learning assessment’ refers to<br />
national (N), regional (R) <strong>and</strong> international (I) formative learning assessments. Information <strong>and</strong> data need to be used <strong>and</strong><br />
interpreted with caution since the different types of assessments are not necessarily comparable.<br />
5. Data are for the most recent year available in the period specified. For details see relevant sources.<br />
6. Refers to the percentage of pupils performing at or above level 1 of proficiency in reading <strong>and</strong> or mathematics.<br />
7. GIR, GER or NER were not calculated due to inconsistencies in the United Nations population data or lack of United<br />
Nations population by age.<br />
8. In the absence of assessments conducted in the proposed indicator grade, surveys of student learning achievement in<br />
the grade below or above the proposed indicator grade are used as placeholders to report on learning assessments <strong>and</strong>/or<br />
learning outcomes in early grades <strong>and</strong> at the end of primary education.<br />
9. National population data were used to calculate GIR, GER <strong>and</strong> NER due to inconsistencies in the United Nations<br />
population data or lack of United Nations population by age.<br />
Data in bold are for the school year ending in 2015.<br />
(z) Data are for the school year ending in 2013.<br />
(y) Data are for the school year ending in 2012.<br />
(x) Data are for the school year ending in 2011.<br />
(*) National estimate.<br />
(**) For country level data: UIS partial estimate; for regional <strong>and</strong> other country grouping sums <strong>and</strong> weighted averages:<br />
partial imputation due to incomplete country coverage (between 33% <strong>and</strong> 60% of population for the region or other<br />
country grouping).<br />
(-) Magnitude nil or negligible<br />
(.) The category is not applicable or does not exist.<br />
(…) No data are available.<br />
416
STATISTICAL TABLES<br />
1<br />
TABLE 3<br />
SDG 4, Target 4.1 - Universal access, participation <strong>and</strong> completion, secondary education – part 1<br />
By 2030, ensure that all girls <strong>and</strong> boys complete free, equitable <strong>and</strong> quality secondary education leading to relevant <strong>and</strong> effective learning outcomes<br />
ACCESS AND PARTICIPATION IN SECONDARY EDUCATION<br />
Effective transition from primary<br />
to lower secondary general<br />
education (%)<br />
Percentage of students over-age<br />
for grade in lower secondary<br />
education (%) 1<br />
Total enrolment<br />
in secondary<br />
education<br />
Gross enrolment ratio (GER) (%)<br />
Total secondary education<br />
Lower secondary adjusted<br />
net enrolment ratio<br />
(ANER) (%)<br />
School year ending in<br />
2013<br />
School year ending in<br />
2014<br />
School year ending in<br />
2014<br />
School year ending in<br />
2014<br />
School year ending in<br />
2014<br />
Country or territory<br />
Total Male Female Total Male Female<br />
Total<br />
(000) % F Total Male Female Total Male Female<br />
Caucasus <strong>and</strong> Central Asia<br />
Armenia 8 97 97 97 ... ... ... 245 48 ... ... ... ... ... ...<br />
Azerbaijan 9,10 99 98 100 4 4 4 949 47 103 * 103 * 102 * 87 * 88 * 86 *<br />
Georgia 10 100 100 100 2 3 2 282 48 99 99 100 99 ... ...<br />
Kazakhstan 100 99 100 0.7 0.8 0.5 1,679 50 109 107 111 100z ... ...<br />
Kyrgyzstan 100 99 100 0.7 0.8 0.6 651 49 91 90 91 92 92 92<br />
Tajikistan 99 100 98 0.1 0.1 0.1 1,063 z 46 z 88 z 92 z 83 z ... ... ...<br />
Turkmenistan ... ... ... ... ... ... 651 48 85 87 84 ... ... ...<br />
Uzbekistan 10 ... ... ... ... ... ... ... ... ... ... ... ... ... ...<br />
Eastern <strong>and</strong> South-eastern Asia<br />
Brunei Darussalam 100 99 100 4 4 3 49 48 99 99 99 98 ... ...<br />
Cambodia 80 76 84 27 30 24 ... ... ... ... ... 83 84 81<br />
China ... ... ... ... ... ... 88,692 47 94 93 95 ... ... ...<br />
DPR Korea ... ... ... ... ... ... ... ... ... ... ... ... ... ...<br />
Hong Kong, China 10 100 100 99 5 6 4 416 48 101 103 99 96 ** 97 ** 95 **<br />
Indonesia 89 88 90 11 11 11 22,587 49 82 83 82 86 ** 85 ** 88 **<br />
Japan 10 ... ... ... - z - z - z 7,281 z 49 z 102 z 102 z 102 z 100 z ... ...<br />
Lao PDR 90 92 89 37 42 31 601 47 57 60 55 79 81 77<br />
Macao, China 10 99 100 99 21 26 16 32 48 96 97 95 86 85 87<br />
Malaysia 10 89 89 89 - - - 3,038 50 79 ... ... 90 ... ...<br />
Mongolia 10 ... ... ... 2 2 2 286 50 91 90 92 100 ... ...<br />
Myanmar ... ... ... 14 14 14 3,191 50 51 51 52 56 ... ...<br />
Philippines ... ... ... 23 z 28 z 18 z 7,220 z 51 z 88 z 84 z 93 z 96 z 93 z 98 z<br />
Republic of Korea 10 100 100 100 0.4 0.5 0.4 3,720 z 48 z 98 z 98 z 97 z 99 z ... ...<br />
Singapore ... ... ... ... ... ... ... ... ... ... ... ... ... ...<br />
Thail<strong>and</strong> 10 99 100 98 4 5 3 4,655 z 51 z 86 z 83 z 89 z ... ... ...<br />
Timor-Leste 91 90 92 50 55 45 119 51 73 70 76 90 90 90<br />
Viet Nam 10 87 85 89 - - - ... ... ... ... ... ... ... ...<br />
Europe <strong>and</strong> Northern America<br />
Albania 10 100 100 100 4 5 3 333 47 96 100 93 96 97 94<br />
Andorra 8 ... ... ... 11 14 9 4 48 ... ... ... ... ... ...<br />
Austria 10 100 100 100 ... ... ... 697 48 99 102 97 ... ... ...<br />
Belarus 98 98 98 1 1 1 649 48 107 108 106 100 ... ...<br />
Belgium 10 ... ... ... 7 8 6 1,210 52 165 155 175 100 ... ...<br />
Bosnia <strong>and</strong> Herzegovina ... ... ... 0.4 0.5 0.4 297 49 89 87 90 ... ... ...<br />
Bulgaria 10 100 100 99 5 5 5 519 48 101 103 99 98 98 98<br />
Canada 10 ... ... ... ... ... ... 2,698 z 49 z 110 z 110 z 110 z ... ... ...<br />
Croatia 10 100 x 100 x 100 x 0.5 0.6 0.3 370 50 99 97 101 98 97 99<br />
Cyprus 9,10 99 99 100 2 2 1 59 49 99 * 99 * 99 * 100 * ... ...<br />
Czech Republic 10 100 99 100 ... ... ... 781 49 105 105 105 ... ... ...<br />
Denmark 100 100 100 0.8 1.0 0.7 554 50 130 128 132 97 97 98<br />
Estonia 100 y 100 y 99 y 4 z 5 z 3 z 81 z 48 z 109 z 109 z 108 z 99 z ... ...<br />
Finl<strong>and</strong> 100 100 100 ... ... ... 537 51 145 139 152 99 99 98<br />
France 10 ... ... ... 1 1 1 5,947 49 111 110 111 100 ... ...<br />
Germany 100 100 99 ... ... ... 7,201 47 102 105 100 ... ... ...<br />
Greece 10 99 y 100 y 98 y ... ... ... 695 z 48 z 108 z 110 z 106 z 99 z 100 z 98 z<br />
Hungary 10 100 100 100 3 4 3 858 49 107 107 107 99 99 98<br />
Icel<strong>and</strong> 100 x 100 x 99 x ... ... ... 36 y 49 y 111 y 112 y 111 y 98 y 98 y 97 y<br />
Irel<strong>and</strong> ... ... ... ... ... ... 341 y 49 y 126 y 125 y 127 y ... ... ...<br />
Italy 10 100 y 100 y 100 y 3 z 4 z 2 z 4,594 z 48 z 102 z 103 z 101 z 100 z ... ...<br />
Latvia 98 98 99 5 7 3 122 48 115 117 114 100 z ... ...<br />
Liechtenstein 9 ... ... ... 1 1 1 3 45 116 * 128 * 103 * 97 * ... ...<br />
Lithuania 10 99 99 100 3 4 2 277 48 107 109 105 100 ... ...<br />
Luxembourg 10 ... ... ... 9 z 9 z 8 z 46 z 49 z 102 z 101 z 104 z 95 z 94 z 95 z<br />
Malta 98 ... ... 1 2 1 30 50 85 91 81 87 94 82<br />
Monaco 8 ... ... ... ... ... ... 3 49 ... ... ... ... ... ...<br />
Montenegro 10 ... ... ... 0.5 0.6 0.4 61 48 90 90 90 ... ... ...<br />
Netherl<strong>and</strong>s 10 ... ... ... ... ... ... 1,574 ** ... 132 ** ... ... 100 y ... ...<br />
Norway 100 100 100 - - - 439 48 113 114 111 100 99 100<br />
Pol<strong>and</strong> ... ... ... ... ... ... 2,778 z 48 z 109 z 111 z 107 z 95 z 95 z 95 z<br />
Portugal 10 ... ... ... ... ... ... 769 49 116 118 115 99 ... ...<br />
Republic of Moldova 9 98 99 98 0.9 1.0 0.7 246 49 87 * 87 * 88 * 86 * 86 * 85 *<br />
Romania 10 99 x 100 x 99 x 5 6 4 1,609 48 95 95 94 94 y 94 y 93 y<br />
Russian Federation 100 100 100 ... ... ... 9,061 48 101 102 100 ... ... ...<br />
San Marino 9 99 x 98 x 100 x ... ... ... 2 y 48 y 95 *, y 93 *, y 96 *, y ... ... ...<br />
Serbia 9,10 100 100 100 0.5 0.6 0.4 548 49 94 * 93 * 95 * 99 * 99 * 99 *<br />
Slovakia 10 99 99 99 ... ... ... 465 49 92 92 92 ... ... ...<br />
Slovenia 10 100 99 100 0.8 1.0 0.6 145 48 111 111 111 99 99 99<br />
Spain 100 100 100 10 11 8 3,288 49 130 130 130 100 ... ...<br />
Sweden 100 100 100 - - - 827 52 133 125 142 100 ... ...<br />
Switzerl<strong>and</strong> 100 100 100 1 1 1 616 48 100 101 98 100 ... ...<br />
417
1 ANNEX<br />
TABLE 3<br />
Part 1 (Continued)<br />
ACCESS AND PARTICIPATION IN SECONDARY EDUCATION<br />
Effective transition from primary<br />
to lower secondary general<br />
education (%)<br />
Percentage of students over-age<br />
for grade in lower secondary<br />
education (%) 1<br />
Total enrolment<br />
in secondary<br />
education<br />
Gross enrolment ratio (GER) (%)<br />
Total secondary education<br />
Lower secondary adjusted<br />
net enrolment ratio<br />
(ANER) (%)<br />
School year ending in<br />
2013<br />
School year ending in<br />
2014<br />
School year ending in<br />
2014<br />
School year ending in<br />
2014<br />
School year ending in<br />
2014<br />
Country or territory<br />
Total Male Female Total Male Female<br />
Total<br />
(000) % F Total Male Female Total Male Female<br />
TFYR Macedonia 10 ... ... ... ... ... ... 186 y 48 y 82 y 83 y 81 y ... ... ...<br />
Ukraine 10 100 100 100 2 2 2 2,714 48 99 100 98 100 ** ... ...<br />
United Kingdom 10 ... ... ... ... ... ... 6,557 50 128 125 130 98 98 99<br />
United States 10 ... ... ... 4 6 3 24,230 49 98 97 98 99 ... ...<br />
Latin America <strong>and</strong> the Caribbean<br />
Anguilla ... ... ... ... ... ... ... ... ... ... ... ... ... ...<br />
Antigua <strong>and</strong> Barbuda ... ... ... 23 29 17 8 50 102 102 103 96 98 94<br />
Argentina 10 97 y 94 y 100 y 16 z 16 z 16 z 4,406 z 51 z 106 z 102 z 110 z 99 z ... ...<br />
Aruba ... ... ... 31 37 26 8 y 50 y 111 y 110 y 112 y ... ... ...<br />
Bahamas ... ... ... ... ... ... ... ... ... ... ... ... ... ...<br />
Barbados ... ... ... 11 13 10 21 50 109 108 111 99 ... ...<br />
Belize 98 97 99 16 21 12 37 51 80 78 82 90 91 90<br />
Bermuda 93 x 87 x 100 x ... ... ... 4 52 73 68 77 ... ... ...<br />
Bolivia, P.S. 97 y 97 y 96 y ... ... ... 1,113 z 49 z 85 z 85 z 84 z 97 z 97 z 96 z<br />
Brazil 9,10 ... ... ... 19 z 23 z 15 z 24,881 z 51 z 102 *, z 98 *, z 106 *, z 95 *, z 94 *, z 96 *, z<br />
British Virgin Isl<strong>and</strong>s 9 95 100 90 21 27 16 2 52 98 * ... ... ... ... ...<br />
Cayman Isl<strong>and</strong>s 8 97 y 93 y 100 y ... ... ... 3 z 50 z ... ... ... ... ... ...<br />
Chile 10 100 99 100 11 14 9 1,556 49 100 100 101 97 97 97<br />
Colombia 10 98 ... ... 23 27 19 4,828 51 99 95 103 97 97 98<br />
Costa Rica 10 85 86 83 29 32 26 460 50 120 117 124 94 94 94<br />
Cuba 99 99 99 0.8 1.2 0.5 830 49 100 98 101 99 z 98 z 100 z<br />
Curaçao ... ... ... ... ... ... 11 z 51 z 88 z 86 z 91 z ... ... ...<br />
Dominica 96 ... ... 12 17 6 ... ... ... ... ... ... ... ...<br />
Dominican Republic 97 96 99 22 28 16 931 52 78 74 82 95 96 94<br />
Ecuador 99 100 98 16 17 13 1,878 50 104 102 106 99 z ... ...<br />
El Salvador 93 93 93 22 26 18 625 50 81 81 81 99 ... ...<br />
Grenada 98 ... ... 10 14 6 10 49 101 101 101 91 94 89<br />
Guatemala 85 90 81 26 29 22 1,166 48 64 66 62 73 77 69<br />
Guyana ... ... ... ... ... ... 86 y 50 y 89 y 90 y 89 y ... ... ...<br />
Haiti ... ... ... ... ... ... ... ... ... ... ... ... ... ...<br />
Honduras 10 72 71 73 30 33 28 620 53 68 63 74 73 72 74<br />
Jamaica 94 91 98 4 5 3 224 51 69 66 72 83 80 86<br />
Mexico 10 97 97 96 4 5 3 12,993 51 91 88 93 86 y 86 y 86 y<br />
Montserrat 8 ... ... ... ... ... ... 0 48 ... ... ... ... ... ...<br />
Nicaragua ... ... ... ... ... ... ... ... ... ... ... ... ... ...<br />
Panama 10 99 x 100 x 97 x ... ... ... 310 z 51 z 75 z 73 z 78 z 89 y 88 y 89 y<br />
Paraguay 94 x 95 x 94 x ... ... ... 631 y 51 y 77 y 74 y 79 y 91 y 96 y 85 y<br />
Peru 10 94 95 94 13 15 12 2,671 49 96 96 96 92 91 92<br />
Saint Kitts <strong>and</strong> Nevis 99 100 99 2 2 1 4 50 92 90 93 91 90 91<br />
Saint Lucia 97 97 98 3 4 2 14 50 86 87 86 86 z 87 z 84 z<br />
Saint Martin ... ... ... ... ... ... ... ... ... ... ... ... ... ...<br />
St. Vincent <strong>and</strong> the Grenadines 99 99 100 14 19 9 10 49 105 106 103 ... ... ...<br />
Sint-Maarten 8 ... ... ... 18 18 18 3 50 ... ... ... ... ... ...<br />
Suriname 70 61 78 33 35 32 52 z 56 z 78 z 68 z 89 z 92 z 91 z 93 z<br />
Trinidad <strong>and</strong> Tobago 10 ... ... ... ... ... ... ... ... ... ... ... ... ... ...<br />
Turks <strong>and</strong> Caicos Isl<strong>and</strong>s 8 ... ... ... 3 5 1 2 52 ... ... ... ... ... ...<br />
Uruguay 10 ... ... ... 27 z 30 z 25 z 291 z 52 z 94 z 88 z 100 z 86 z 85 z 86 z<br />
Venezuela, B.R. 100 100 99 ... ... ... 2,567 51 92 88 95 92 91 93<br />
Northern Africa <strong>and</strong> Western Asia<br />
Algeria 99 100 99 30 37 23 ... ... ... ... ... ... ... ...<br />
Bahrain 8,10 100 100 100 5 6 5 90 49 ... ... ... ... ... ...<br />
Egypt 10 ... ... ... 5 z 6 z 5 z 8,208 49 86 86 86 94 93 95<br />
Iraq ... ... ... ... ... ... ... ... ... ... ... ... ... ...<br />
Israel 10 100 100 100 0.8 0.9 0.6 768 49 102 101 103 100 ... ...<br />
Jordan ... ... ... ... ... ... 724 y 50 y 84 y 82 y 86 y ... ... ...<br />
Kuwait 98 **, y 97 **, y 100 **, y 4 5 3 283 ** 50 ** 94 ** 89 ** 99 ** 93 y 89 y 98 y<br />
Lebanon 10 98 y 97 y 99 y ... ... ... 389 z 52 z 68 z 68 z 68 z 76 **, y 79 **, y 74 **, y<br />
Libya ... ... ... ... ... ... ... ... ... ... ... ... ... ...<br />
Morocco 10 89 92 85 ... ... ... 2,554 y 45 y 69 y 74 y 64 y 85 **, y 89 **, y 80 **, y<br />
Oman 8,10 100 100 100 4 5 4 391 49 ... ... ... 98 ... ...<br />
Palestine 10 99 100 99 2 3 2 709 51 82 78 86 86 84 88<br />
Qatar 8,10 100 100 100 4 4 4 88 48 ... ... ... ... ... ...<br />
Saudi Arabia 10 96 100 92 14 14 14 3,419 ** 43 ** 108 ** 123 ** 94 ** 93 **, z 96 **, z 90 **, z<br />
Sudan 96 y 95 y 97 y ... ... ... 1,871 z 48 z 43 z 44 z 41 z 63 y 76 y 49 y<br />
Syrian Arab Republic 10 57 y 57 y 57 y ... ... ... 1,857 z 49 z 50 z 50 z 51 z 59 z 60 z 58 z<br />
Tunisia 10 91 89 93 16 19 13 1,020 ... 88 ... ... ... ... ...<br />
Turkey 10 99 x 99 x 99 x ... ... ... 10,563 z 48 z 100 z 102 z 99 z 97 z 97 z 96 z<br />
United Arab Emirates 8,10 100 100 100 ... ... ... 411 49 ... ... ... ... ... ...<br />
Yemen 90 y 91 y 89 y ... ... ... 1,768 z 40 z 49 z 57 z 40 z 63 **, y 74 **, y 51 **, y<br />
The Pacific<br />
Australia 8 ... ... ... 3 4 3 2,371 47 ... ... ... 99 z ... ...<br />
418
STATISTICAL TABLES<br />
1<br />
TABLE 3<br />
Part 1 (Continued)<br />
ACCESS AND PARTICIPATION IN SECONDARY EDUCATION<br />
Effective transition from primary<br />
to lower secondary general<br />
education (%)<br />
Percentage of students over-age<br />
for grade in lower secondary<br />
education (%) 1<br />
Total enrolment<br />
in secondary<br />
education<br />
Gross enrolment ratio (GER) (%)<br />
Total secondary education<br />
Lower secondary adjusted<br />
net enrolment ratio<br />
(ANER) (%)<br />
School year ending in<br />
2013<br />
School year ending in<br />
2014<br />
School year ending in<br />
2014<br />
School year ending in<br />
2014<br />
School year ending in<br />
2014<br />
Country or territory<br />
Total Male Female Total Male Female<br />
Total<br />
(000) % F Total Male Female Total Male Female<br />
Cook Isl<strong>and</strong>s 9 92 ... ... 1 2 1 2 50 86 * 83 * 91 * 90 *, y 89 *, y 90 *, y<br />
Fiji 94 x 91 x 97 x 12 z 13 z 10 z 97 y 51 y 89 y 84 y 93 y 96 y ... ...<br />
Kiribati ... ... ... 7 9 6 ... ... ... ... ... ... ... ...<br />
Marshall Isl<strong>and</strong>s ... ... ... ... ... ... ... ... ... ... ... ... ... ...<br />
Micronesia F.S. ... ... ... 16 18 13 ... ... ... ... ... ... ... ...<br />
Nauru 9 ... ... ... ... ... ... 1 49 83 * 82 * 83 * 87 * 87 * 88 *<br />
New Zeal<strong>and</strong> 10 ... ... ... 0.3 0.3 0.2 492 50 117 114 121 99 98 99<br />
Niue ... ... ... - - - ... ... ... ... ... ... ... ...<br />
Palau 9 97 98 95 15 21 8 2 50 114 * 111 * 117 * ... ... ...<br />
Papua New Guinea ... ... ... ... ... ... 378 y 41 y 40 y 46 y 35 y ... ... ...<br />
Samoa 98 x 98 x 97 x 14 16 11 26 51 87 82 92 95 95 96<br />
Solomon Isl<strong>and</strong>s 93 92 95 ... ... ... 42 y 47 y 48 y 50 y 47 y ... ... ...<br />
Tokelau ... ... ... ... ... ... ... ... ... ... ... ... ... ...<br />
Tonga ... ... ... ... ... ... 15 50 90 86 94 89 85 93<br />
Tuvalu 9 ... ... ... 4 3 5 1 53 81 * 72 * 90 * 87 * 81 * 93 *<br />
Vanuatu ... ... ... 47 z 51 z 43 z ... ... ... ... ... ... ... ...<br />
Southern Asia<br />
Afghanistan ... ... ... 18 18 17 2,603 35 56 71 40 65 81 49<br />
Bangladesh ... ... ... 4 z 4 z 4 z 13,314 z 51 z 58 z 56 z 61 z ... ... ...<br />
Bhutan 99 98 100 35 37 33 74 51 84 81 87 84 80 88<br />
India ... ... ... 7 z 7 z 7 z 119,401 z 48 z 69 z 69 z 69 z 85 **, z 83 **, z 88 **, z<br />
Iran, Islamic Republic of 97 *, x 97 *, x 97 *, x 3 4 2 5,795 48 88 89 88 98 99 98<br />
Maldives 97 y 93 y 100 y 20 20 20 ... ... ... ... ... ... ... ...<br />
Nepal 87 88 86 27 32 22 3,176** 51** 67** 65** 70** ... ... ...<br />
Pakistan 81 82 80 - - - 11,287 42 42 46 37 52 57 47<br />
Sri Lanka 100 ** 99 ** 100 ** 1 z 2 z 1 z 2,606 z 51 z 100 z 97 z 102 z 95 z 95 z 95 z<br />
Sub-Saharan Africa<br />
Angola ... ... ... ... ... ... ... ... ... ... ... ... ... ...<br />
Benin 85 85 86 28 30 25 897 40 54 65 44 63 z 72 z 55 z<br />
Botswana 10 97 y 97 y 98 y 38 z 45 z 30 z 184 z 51 z 84 z 82 z 86 z 89 z 88 z 90 z<br />
Burkina Faso 69 71 67 58 58 58 842 46 30 32 28 53 z 55 z 52 z<br />
Burundi 77 80 75 78 80 75 583 47 38 41 35 69 68 70<br />
Cabo Verde 96 95 97 35 40 30 60 53 93 87 99 91 91 91<br />
Cameroon 65 **, x 62 **, x 69 **, x 28 31 25 2,000 46 56 61 52 63 67 58<br />
Central African Republic 75 x 81 x 68 x ... ... ... 126 y 34 y 17 y 23 y 12 y 45 y 56 y 34 y<br />
Chad 95 y 100 y 87 y ... ... ... 458 y 31 y 22 y 31 y 14 y ... ... ...<br />
Comoros ... ... ... ... ... ... 68 z 50 z 59 z 58 z 60 z 73 z 72 z 73 z<br />
Congo 76 x 78 x 75 x ... ... ... 339 y 46 y 55 y 58 y 51 y ... ... ...<br />
Côte d'Ivoire 88 90 85 29 29 29 1,418 41 40 47 33 ... ... ...<br />
D.R. Congo 72 y 73 y 71 y ... ... ... 4,388 38 44 54 33 ... ... ...<br />
Djibouti 80 82 79 22 22 22 59 44 47 52 42 ... ... ...<br />
Equatorial Guinea 96 x 100 x 92 x ... ... ... ... ... ... ... ... ... ... ...<br />
Eritrea 98 y 99 y 96 y ... ... ... 269 z 44 z 36 z 39 z 32 z 38 z 42 z 35 z<br />
Ethiopia 98 x 100 x 97 x 27 30 24 4,736 y 47 y 36 y 38 y 35 y 60 **, y 61 **, y 58 **, y<br />
Gabon ... ... ... ... ... ... ... ... ... ... ... ... ... ...<br />
Gambia 10 94 94 95 35 39 32 ... ... ... ... ... ... ... ...<br />
Ghana 10 98 98 99 40 41 39 2,440 48 71 73 69 93** 93** 93**<br />
Guinea 69 74 62 29 32 25 716 39 39 47 31 48 57 40<br />
Guinea-Bissau ... ... ... ... ... ... ... ... ... ... ... ... ... ...<br />
Kenya ... ... ... ... ... ... 3,833 y 48 y 68 y 70 y 65 y ... ... ...<br />
Lesotho 85 83 86 55 63 48 131 57 52 44 60 77 73 82<br />
Liberia ... ... ... ... ... ... 223 43 38 42 33 ... ... ...<br />
Madagascar 76 76 76 49 54 44 1,494 50 38 39 38 ... ... ...<br />
Malawi 86 x 88 x 84 x ... ... ... 920 47 39 41 38 80 80 79<br />
Mali 85 ** ... ... 18 18 18 961 42 44 49 37 53 59 48<br />
Mauritania 58 61 55 53 53 53 179 47 30 31 29 58 58 59<br />
Mauritius 90 88 93 8 9 7 133 50 98 97 99 ... ... ...<br />
Mozambique 61 59 64 48 54 43 784 48 25 26 24 56 60 52<br />
Namibia 96 y 95 y 97 y 48 z 55 z 42 z ... ... ... ... ... ... ... ...<br />
Niger 65 67 62 24 25 23 515 41 19 22 16 30 34 25<br />
Nigeria ... ... ... ... ... ... ... ... ... ... ... ... ... ...<br />
Rw<strong>and</strong>a 75 y 76 y 74 y ... ... ... 587 52 39 37 41 ... ... ...<br />
Sao Tome <strong>and</strong> Principe 100 100 99 44 49 39 22 52 85 81 89 ... ... ...<br />
Senegal 93 x 94 x 92 x 26 26 26 ... ... ... ... ... ... ... ...<br />
Seychelles ... ... ... 0.5 0.5 0.5 7 49 75 74 75 ... ... ...<br />
Sierra Leone 88 y 88 ty 88 y ... ... ... 417 z 47 z 43 z 47 z 40 z 69 y 71 y 67 y<br />
Somalia ... ... ... ... ... ... ... ... ... ... ... ... ... ...<br />
South Africa 10 ... ... ... ... ... ... 4,956 ** 51 ** 94 ** 85 ** 104 ** ... ... ...<br />
South Sudan ... ... ... ... ... ... ... ... ... ... ... ... ... ...<br />
Swazil<strong>and</strong> 99 y 100 y 98 y 70 z 77 z 64 z 93 z 49 z 63 z 64 z 62 z 88 z 89 z 87 z<br />
Togo 80 82 77 42 45 40 ... ... ... ... ... ... ... ...<br />
Ug<strong>and</strong>a ... ... ... ... ... ... 1,421 z 46 z 28 z 30 z 26 z ... ... ...<br />
419
1 ANNEX<br />
TABLE 3<br />
Part 1 (Continued)<br />
ACCESS AND PARTICIPATION IN SECONDARY EDUCATION<br />
Effective transition from primary<br />
to lower secondary general<br />
education (%)<br />
Percentage of students over-age<br />
for grade in lower secondary<br />
education (%) 1<br />
Total enrolment<br />
in secondary<br />
education<br />
Gross enrolment ratio (GER) (%)<br />
Total secondary education<br />
Lower secondary adjusted<br />
net enrolment ratio<br />
(ANER) (%)<br />
School year ending in<br />
2013<br />
School year ending in<br />
2014<br />
School year ending in<br />
2014<br />
School year ending in<br />
2014<br />
School year ending in<br />
2014<br />
Country or territory<br />
Total Male Female Total Male Female<br />
Total<br />
(000) % F Total Male Female Total Male Female<br />
U.R. Tanzania 56 y 59 y 54 y ... ... ... 2,052 z 48 z 32 z 34 z 31 z ... ... ...<br />
Zambia 64 y 66 y 62 y ... ... ... ... ... ... ... ... ... ... ...<br />
Zimbabwe 78 y 77 y 79 y 26 z 31 z 21 z 957 z 50 z 48 z 48 z 47 z 92 z 94 z 90 z<br />
Median Median Sum % F Weighted average Weighted average<br />
World 97 97 98 10 11 7 567,755 48 75 76 75 84 84 84<br />
Countries in transition 100 99 100 0,9 1 0,7 23,716 48 98 99 97 96 ... ...<br />
Developed countries 100 100 100 3 4 2 81,283 49 107 107 107 98 99 z 99 z<br />
Developing countries 95 100 89 17 19 15 462,755 48 71 71 70 82 82 82<br />
Caucasus <strong>and</strong> Central Asia 99 99 100 0,7 0,8 0,6 9,539 48 95 96 95 96 ... ...<br />
Eastern <strong>and</strong> South-eastern Asia 91 90 92 5 6 4 150,710 48 88 87 88 91 90 91<br />
Eastern Asia ... ... ... 2 2 2 102,689 48 95 94 96 94 94 94<br />
South-eastern Asia 90 90 90 12 12 12 48,021 49 75 75 75 86 85 87<br />
Europe <strong>and</strong> Northern America 100 100 100 2 2 1 84,867 49 106 105 106 98 98 z 98 z<br />
Latin America <strong>and</strong> the Caribbean 97 96 98 16 18 14 63,883 51 94 91 97 92 92 93<br />
Caribbean ... ... ... 12 16 7 2,906 51 70 68 72 88 88 89<br />
Latin America 97 97 96 20 24 17 60,976 51 96 93 99 93 92 93<br />
Northern Africa <strong>and</strong> Western Asia 99 98 99 5 5 4 41,982 47 79 82 77 86 89 83<br />
Northern Africa 93 92 95 16 19 13 18,387 49 78 79 78 90 92 87<br />
Western Asia 99 100 99 5 6 4 23,595 46 80 84 77 84 87 81<br />
Pacific ... ... ... 7 9 6 3,504 47 101 104 98 98 97 y 98 y<br />
Southern Asia 97 95 98 7 7 7 158,987 47 65 66 65 80 79 82<br />
Sub-Saharan Africa 85 ... ... 35 40 30 54,283 46 43 46 39 66 68 64<br />
Conflict-affected countries 95 100 87 16 16 16 245,411 47 65 66 64 76 ** 79 ** 74 **<br />
Countries with low income 79 80 77 ... ... ... 35,328 45 41 45 37 65 69 62<br />
Countries with middle income 97 96 97 12 14 10 425,760 48 75 75 75 85 84 85<br />
Lower middle 93 93 93 22 22 18 239,014 48 65 66 65 80 79 81<br />
Upper middle 97 97 98 7 7 5 186,746 49 93 91 94 93 93 93<br />
Countries with high income 100 100 99 4 4 3 106,667 49 105 105 105 98 98 z 98 z<br />
420
STATISTICAL TABLES<br />
1<br />
TABLE 3<br />
SDG 4, Target 4.1 - Universal access, participation <strong>and</strong> completion, secondary education – part 2<br />
By 2030, ensure that all girls <strong>and</strong> boys complete free, equitable <strong>and</strong> quality secondary education leading to relevant <strong>and</strong> effective learning outcomes<br />
ACCESS AND PARTICIPATION IN SECONDARY EDUCATION COMPLETION IN SECONDARY EDUCATION LEARNING ASSESSMENTS AND OUTCOMES 6<br />
Lower secondary<br />
out-of-school<br />
adolescents 2<br />
Upper secondary adjusted<br />
net enrolment ratio<br />
(ANER) (%)<br />
Upper secondary<br />
out-of-school<br />
adolescents<br />
<strong>and</strong> youth 3<br />
Gross intake rate (GIR)<br />
to last grade of lower<br />
secondary education<br />
(%)<br />
Lower<br />
secondary<br />
completion<br />
rate 4<br />
Upper<br />
secondary<br />
completion<br />
rate 4<br />
Existence of<br />
nationally<br />
representative<br />
learning<br />
assessment at<br />
the end of lower<br />
secondary<br />
education<br />
Percentage of students at end<br />
of lower secondary education<br />
achieving at least a minimum<br />
proficiency level (%) 7 in:<br />
Reading<br />
Mathematics<br />
School year ending<br />
in 2014<br />
School year ending<br />
in 2014<br />
School year ending<br />
in 2014<br />
School year ending<br />
in 2014<br />
2009<br />
2009<br />
2009<br />
2009<br />
2009<br />
–2014 5 –2014 5 –2014 5 –2014 5 –2014 5<br />
Country or territory<br />
Total<br />
(000) % F Total Male Female<br />
Total<br />
(000) % F Total Male Female Total Total Total Total<br />
Caucasus <strong>and</strong> Central Asia<br />
Armenia 8 ... ... ... ... ... ... ... ... ... ... 100 93 Yes I ... 77 I<br />
Azerbaijan 9,10 82 * 51 * 99 *, z ... ... 2 *, z ... 87 * 87 * 86 * … … Yes I 90 I 89 I<br />
Georgia 10 1 ... 88 87 89 19 45 101 103 100 99 96 Yes N ... I 61 I<br />
Kazakhstan 3z ... 95 ... ... 21 ... 108 107 109 99 93 Yes I, N 96 I 85 I<br />
Kyrgyzstan 42 48 57 58 56 93 50 91 90 91 97 86 Yes I 70 I 35 I<br />
Tajikistan ... ... ... ... ... ... ... 96 99 94 89 60 No ... ...<br />
Turkmenistan ... ... ... ... ... ... ... ... ... ... … … ... ... ...<br />
Uzbekistan 10 ... ... ... ... ... ... ... ... ... ... … … Yes N ... ...<br />
Eastern <strong>and</strong> South-eastern Asia<br />
Brunei Darussalam 0.3 ... 86 85 86 5 46 106 107 105 … … ... ... ...<br />
Cambodia 160 54 ... ... ... ... ... 45 45 45 41 19 Yes N ... ...<br />
China ... ... ... ... ... ... ... 98 97 100 81 43 Yes N ... ...<br />
DPR Korea ... ... ... ... ... ... ... ... ... ... … … ... ... ...<br />
Hong Kong, China 10 8 ** 60 ** 88 ** 88 ** 87 ** 27 ** 50 ** 93 94 92 … … Yes I 100 I 97 I<br />
Indonesia 1,937 ** 43 ** 70 ** 73 ** 67 ** 4,032 ** 54 ** 86 83 90 78 51 Yes I 96 I 58 I<br />
Japan 10 2 z ... 97 z 96 z 98 z 105 z 36 z ... ... ... … … Yes I, N 99 I 97 I<br />
Lao PDR 123 53 50 53 46 231 53 54 56 52 35 27 No ... ...<br />
Macao, China 10 2 45 81 81 81 4 48 96 92 101 … … Yes I 100 I 97 I<br />
Malaysia 10 170 ... 55 ... ... 993 ... 85 ... ... … … Yes I 94 I 77 I<br />
Mongolia 10 0.8 ... 89 84 93 16 30 114 112 116 84 65 Yes N ... ...<br />
Myanmar 1,857 ... 39 ... ... 1,217 49 ** 49 47 50 … … No ... ...<br />
Philippines 272 z 18 z 80 z 77 z 85 z 396 z 38 z 82 z 77 z 88 z 75 72 No ... ...<br />
Republic of Korea 10 10 z ... 94 z 95 z 94 z 117 z 52 z 97 z 98 z 97 z … … Yes I, N 100 I 97 I<br />
Singapore ... ... ... ... ... ... ... ... ... ... … … Yes I 100 I 98 I<br />
Thail<strong>and</strong> 10 ... ... ... ... ... ... ... 89 88 90 … … Yes I, N 99 I 81 I<br />
Timor-Leste 8 49 73 71 74 21 46 72 z 68 z 76 z 45 27 ... ... ...<br />
Viet Nam 10 ... ... ... ... ... ... ... 94 95 92 81 55 Yes I, N 100 I 96 I<br />
Europe <strong>and</strong> Northern America<br />
Albania 10 8 64 81 82 81 30 51 92 94 91 ... ... Yes I 88 I 67 I<br />
Andorra 8 ... ... ... ... ... ... ... ... ... ... … … ... ... ...<br />
Austria 10 ... ... ... ... ... ... ... 96 97 96 … 84 Yes I, N 99 I 94 I<br />
Belarus 0.4 ... 98 97 99 4 21 110 109 110 100 83 ... ... ...<br />
Belgium 10 0.3 ... 99 99 99 4 40 96 94 97 … 82 Yes I, N 98 I 93 I<br />
Bosnia <strong>and</strong> Herzegovina ... ... ... ... ... ... ... 84 83 86 94 69 No ... ...<br />
Bulgaria 10 5 51 81 84 79 49 54 47 52 43 … 84 Yes I, N 92 I 80 I<br />
Canada 10 ... ... ... ... ... ... ... ... ... ... … 86 Yes I, N 100 I 96 I<br />
Croatia 10 3 18 91 89 94 17 36 95 94 97 … 95 Yes I, N 99 I 91 I<br />
Cyprus 9,10 0.1 * ... 93 * 92 * 94 * 2 * 43 * 101 * 100 * 101 * … 93 Yes I 94 I 81 I<br />
Czech Republic 10 ... ... ... ... ... ... ... 98 98 99 … 90 Yes I 99 I 93 I<br />
Denmark 5 39 89 88 89 24 47 96 96 97 … 73 Yes I 99 I 96 I<br />
Estonia 0.3 z ... 87 z 85 z 89 z 5 z 40 z 106 z 108 z 104 z … 79 Yes I 100 I 98 I<br />
Finl<strong>and</strong> 3 64 92 92 92 15 50 97 98 97 … 85 Yes I, N 99 I 97 I<br />
France 10 2 ... 100 ... ... 5 ... 103 103 104 … 83 Yes I, N 98 I 91 I<br />
Germany ... ... ... ... ... ... ... 56 57 56 … 78 Yes I 99 I 94 I<br />
Greece 10 3 z 97 z 95 z 95 z 94 z 17 z 54 z 98 z 99 z 97 z … 93 Yes I 97 I 86 I<br />
Hungary 10 5 56 92 92 93 31 49 94 94 94 … 85 Yes I, N 99 I 90 I<br />
Icel<strong>and</strong> 0.3 y 67 y 82 y 81 y 84 y 3 y 45 y 97 y 98 y 96 y … 63 Yes I, N 98 I 93 I<br />
Irel<strong>and</strong> ... ... 99 y ... ... 1 y ... ... ... ... … … Yes I 100 I 95 I<br />
Italy 10 8 z ... 93 z 93 z 93 z 200 z 49 z 103 z 103 z 103 z … 83 Yes I, N 98 I 91 I<br />
Latvia 0.2 z ... 89 89 89 6 48 106 105 107 … 82 Yes I, N 99 I 95 I<br />
Liechtenstein 9 0.1 * ... 88 * ... ... 0.2 * ... 99 * 114 * 85 * … … Yes I 100 I 97 I<br />
Lithuania 10 0.0 ... 91 90 92 7 42 99 100 99 … 91 Yes I 99 I 91 I<br />
Luxembourg 10 1 z 41 z 83 z 82 z 85 z 4 z 44 z 99 z 99 z 98 z … 60 Yes I, N 98 I 91 I<br />
Malta 2 76 79 84 75 4 63 90 94 87 … 73 No ... ...<br />
Monaco 8 ... ... ... ... ... ... ... ... ... ... … … ... ... ...<br />
Montenegro 10 ... ... ... ... ... ... ... 90 89 90 94 85 Yes I, N 96 I 72 I<br />
Netherl<strong>and</strong>s 10 1 y ... 97 y 97 y 97 y 20 y 50 y ... ... ... … 73 Yes I, N 99 I 96 I<br />
Norway 1 33 91 91 91 18 47 97 97 98 … 68 Yes I 98 I 93 I<br />
Pol<strong>and</strong> 56 z 49 z 91 z 91 z 92 z 118 z 46 z 95 z 96 z 95 z … 83 Yes I 100 I 97 I<br />
Portugal 10 3 ... 99 ... ... 4 ... ... ... ... … 60 Yes I 99 I 91 I<br />
Republic of Moldova 9 27 * 50 * 61 * 60 * 62 * 35 * 47 * 85 * 86 * 84 * 95 66 ... ... ...<br />
Romania 10 54 y 51 y ... ... ... ... ... 89 88 89 … 82 Yes I 97 I 86 I<br />
Russian Federation ... ... ... ... ... ... ... 99 98 100 99 87 Yes I 99 I 93 I<br />
San Marino 9 ... ... ... ... ... ... ... 92 *, y 91 *, y 93 *, y … … ... ... ...<br />
Serbia 9,10 3 * 39 * 88 * 86 * 89 * 37 * 42 * 96 * 96 * 97 * 92 75 Yes I 97 I 85 I<br />
Slovakia 10 ... ... ... ... ... ... ... 88 88 88 … 93 Yes I, N 96 I 89 I<br />
Slovenia 10 1 48 95 95 96 4 45 94 93 95 … 89 Yes I, N 99 I 95 I<br />
Spain 2 ... 97 97 97 35 45 94 91 97 … 67 Yes I, N 99 I 92 I<br />
Sweden 0.5 ... 93 94 92 24 53 105 105 104 … 92 Yes I, N 97 I 90 I<br />
421
1 ANNEX<br />
TABLE 3<br />
Part 2 (Continued)<br />
ACCESS AND PARTICIPATION IN SECONDARY EDUCATION COMPLETION IN SECONDARY EDUCATION LEARNING ASSESSMENTS AND OUTCOMES 6<br />
Lower secondary<br />
out-of-school<br />
adolescents 2<br />
Upper secondary adjusted<br />
net enrolment ratio<br />
(ANER) (%)<br />
Upper secondary<br />
out-of-school<br />
adolescents<br />
<strong>and</strong> youth 3<br />
Gross intake rate (GIR)<br />
to last grade of lower<br />
secondary education<br />
(%)<br />
Lower<br />
secondary<br />
completion<br />
rate 4<br />
Upper<br />
secondary<br />
completion<br />
rate 4<br />
Existence of<br />
nationally<br />
representative<br />
learning<br />
assessment at<br />
the end of lower<br />
secondary<br />
education<br />
Percentage of students at end<br />
of lower secondary education<br />
achieving at least a minimum<br />
proficiency level (%) 7 in:<br />
Reading<br />
Mathematics<br />
School year ending<br />
in 2014<br />
School year ending<br />
in 2014<br />
School year ending<br />
in 2014<br />
School year ending<br />
in 2014<br />
2009<br />
2009<br />
2009<br />
2009<br />
2009<br />
–2014 5 –2014 5 –2014 5 –2014 5 –2014 5<br />
422<br />
Country or territory<br />
Total<br />
(000) % F Total Male Female<br />
Total<br />
(000) % F Total Male Female Total Total Total Total<br />
Switzerl<strong>and</strong> 0.1 ... 80 81 79 73 51 95 93 98 … 72 Yes I 99 I 96 I<br />
TFYR Macedonia 10 ... ... ... ... ... ... ... ... ... ... 81 75 Yes I, N ... 60 I<br />
Ukraine 10 8 ** ... 94 ** 92 ** 95 ** 53 ** 37 ** 96 96 95 99 95 Yes I ... I 82 I<br />
United Kingdom 10 32 48 99 ... ... 25 ... ... ... ... … 94 Yes I, N 99 I 92 I<br />
United States 10 115 ... 92 92 93 944 42 ... ... ... … 92 Yes I, N 99 I 92 I<br />
Latin America <strong>and</strong> the Caribbean<br />
Anguilla ... ... ... ... ... ... ... ... ... ... … … No ... ...<br />
Antigua <strong>and</strong> Barbuda 0.2 76 85 87 83 0.5 55 85 82 89 … … ... ... ...<br />
Argentina 10 15 z ... 89 z 83 z 94 z 234 z 26 z 89 z 88 z 91 z 75 66 Yes I, N 92 I 65 I<br />
Aruba ... ... ... ... ... ... ... 99 95 103 … … ... ... ...<br />
Bahamas ... ... ... ... ... ... ... ... ... ... … … No ... ...<br />
Barbados 0.1 ... 97 ... ... 0.2 ... ... ... ... 98 93 No ... ...<br />
Belize 3 53 56 55 58 7 48 64 60 69 43 20 No ... ...<br />
Bermuda ... ... ... ... ... ... ... 76 y 69 y 83 y … … ... ... ...<br />
Bolivia, P.S. 15 z 61 z 80 z 81 z 80 z 170 z 50 z 90 z 89 z 90 z ... ... Yes N ... ...<br />
Brazil 9,10 669 *, z 40 *, z 83 *, z 83 *, z 84 *, z 1,787 *, z 47 *, z ... ... ... 64 18 Yes I, N 96 I 65 I<br />
British Virgin Isl<strong>and</strong>s 9 ... ... ... ... ... ... ... 84 * ... ... … … ... ... ...<br />
Cayman Isl<strong>and</strong>s 8 ... ... ... ... ... ... ... ... ... ... … … ... ... ...<br />
Chile 10 16 52 94 93 95 63 44 97 96 97 88 51 Yes I, N 99 I 78 I<br />
Colombia 10 90 40 81 80 83 303 46 78 73 84 73 63 Yes I, N 95 I 58 I<br />
Costa Rica 10 14 49 83 81 85 27 44 59 55 63 61 33 Yes I, N 99 I 76 I<br />
Cuba 6 z 9 z 84 z 83 z 85 z 70 z 44 z 96 93 99 … … Yes N ... ...<br />
Curaçao ... ... ... ... ... ... ... ... ... ... … … ... ... ...<br />
Dominica ... ... ... ... ... ... ... 93 90 96 … … ... ... ...<br />
Dominican Republic 20 60 75 75 76 193 48 76 71 80 85 60 Yes N ... ...<br />
Ecuador 5 z ... 83 z 83 z 84 z 150 z 48 z 95 94 95 86 66 Yes N ... ...<br />
El Salvador 2 ... 73 74 72 105 52 85 84 87 … … Yes N ... ...<br />
Grenada 0.5 63 78 76 80 0.9 45 96 92 100 … … ... ... ...<br />
Guatemala 297 57 47 50 44 381 52 59 61 57 43 25 Yes N ... ...<br />
Guyana ... ... ... ... ... ... ... ... ... ... 56 12 Yes N ... ...<br />
Haiti ... ... ... ... ... ... ... ... ... ... 46 15 ... ... ...<br />
Honduras 10 148 47 53 49 56 172 46 54 49 59 43 31 Yes I, N ... 19 I<br />
Jamaica 27 40 64 62 67 60 45 86 84 89 96 79 No ... ...<br />
Mexico 10 1,005 y 48 y 58 y 57 y 59 y 2,984 y 48 y 81 79 82 84 53 Yes I, N 97 I 77 I<br />
Montserrat 8 ... ... ... ... ... ... ... ... ... ... … … ... ... ...<br />
Nicaragua ... ... ... ... ... ... ... ... ... ... 46 18 Yes N ... ...<br />
Panama 10 23 y 48 y 86 y 83 y 88 y 29 y 40 y 74 y 70 y 78 y 76 62 Yes I, N 87 I 49 I<br />
Paraguay 38 y 78 y 69 y 68 y 71 y 125 y 47 y 74 y 71 y 77 y … … Yes N ... ...<br />
Peru 10 142 45 81 81 82 207 47 85 84 87 80 74 Yes I 90 I 53 I<br />
Saint Kitts <strong>and</strong> Nevis 0.3 45 79 79 79 0.4 50 92 89 95 … … No ... ...<br />
Saint Lucia 1 z 55 z 83 z 81 z 85 z 1 z 44 z 87 86 87 92 79 ... ... ...<br />
Saint Martin ... ... ... ... ... ... ... ... ... ... … … ... ... ...<br />
St. Vincent <strong>and</strong> the Grenadines ... ... ... ... ... ... ... 91 90 91 … … ... ... ...<br />
Sint-Maarten 8 ... ... ... ... ... ... ... ... ... ... … … ... ... ...<br />
Suriname 3 z 42 z 70 z 66 z 74 z 8 z 43 z 48 33 63 44 22 ... ... ...<br />
Trinidad <strong>and</strong> Tobago 10 ... ... ... ... ... ... ... ... ... ... … … Yes I 90 I 70 I<br />
Turks <strong>and</strong> Caicos Isl<strong>and</strong>s 8 ... ... ... ... ... ... ... ... ... ... … … ... ... ...<br />
Uruguay 10 22 z 48 z 82 z 77 z 86 z 29 z 37 z 60 z 53 z 67 z 66 33 Yes I, N 94 I 71 I<br />
Venezuela, B.R. 135 41 72 68 76 311 42 76 72 81 … … Yes N ... ...<br />
Northern Africa <strong>and</strong> Western Asia<br />
Algeria ... ... ... ... ... ... ... 79 72 87 … … No ... ...<br />
Bahrain 8,10 ... ... 76 69 84 13 30 ... ... ... … … Yes I, N ... 53 I<br />
Egypt 10 286 39 77 79 76 1,058 52 83 ** 81 ** 85 ** 80 71 Yes N ... ...<br />
Iraq ... ... ... ... ... ... ... ... ... ... 31 19 ... ... ...<br />
Israel 10 0.8 ... 98 ... ... 7 ... 100 100 100 98 88 Yes I, N 96 I 84 I<br />
Jordan ... ... ... ... ... ... ... 87 y 86 y 89 y 89 59 Yes I, N 93 I 64 I<br />
Kuwait 12 y 15 y 73 y 74 y 72 y 35 y 53 y 89 **, z 83 **, z 96 **, z … … No ... ...<br />
Lebanon 10 63 **, y 56 **, y 66 **, y 66 **, y 66 **, y 94 **, y 51 **, y 59 z 56 z 62 z … … Yes I ... 73 I<br />
Libya ... ... ... ... ... ... ... ... ... ... … … ... ... ...<br />
Morocco 10 277 **, y 65 **, y 58 **, y 64 **, y 52 **, y 787 **, y 56 **, y 68 70 66 38 16 Yes I, N ... 33 I<br />
Oman 8,10 7 ... ... ... ... ... ... 94 88 102 … … Yes I, N ... 37 I<br />
Palestine 10 90 43 65 57 74 72 36 74 67 82 85 62 Yes I, N ... 51 I<br />
Qatar 8,10 ... ... ... ... ... ... ... ... ... ... … … Yes I, N 86 I 53 I<br />
Saudi Arabia 10 114 **, z 73 **, z 91 ** ... ... 135 ** ... 98 104 91 … … Yes I, N ... 45 I<br />
Sudan 660 y 68 y ... ... ... ... ... 50 z 53 z 48 z 53 21 No ... ...<br />
Syrian Arab Republic 10 979 z 50 z 33 z 33 z 33 z 874 z 48 z 51 z 51 z 52 z … … Yes I ... 41 I<br />
Tunisia 10 ... ... ... ... ... ... ... 70 62 78 67 49 Yes I 94 I 64 I<br />
Turkey 10 176 z 61 z 83 z 85 z 81 z 883 z 55 z 95 z 97 z 93 z … … Yes I, N 99 I 85 I<br />
United Arab Emirates 8,10 ... ... ... ... ... ... ... ... ... ... … … Yes I, N 97 I 79 I<br />
Yemen 679 **, y 64 **, y 41 **, y 49 **, y 32 **, y 1,070 **, y 56 **, y 48 z 57 z 40 z 45 30 No ... ...<br />
The Pacific<br />
Australia 8 9 z ... 91 z 89 z 93 z 54 z 38 z ... ... ... ... 85 Yes I 99 I 94 I
STATISTICAL TABLES<br />
1<br />
TABLE 3<br />
Part 2 (Continued)<br />
ACCESS AND PARTICIPATION IN SECONDARY EDUCATION COMPLETION IN SECONDARY EDUCATION LEARNING ASSESSMENTS AND OUTCOMES 6<br />
Lower secondary<br />
out-of-school<br />
adolescents 2<br />
Upper secondary adjusted<br />
net enrolment ratio<br />
(ANER) (%)<br />
Upper secondary<br />
out-of-school<br />
adolescents<br />
<strong>and</strong> youth 3<br />
Gross intake rate (GIR)<br />
to last grade of lower<br />
secondary education<br />
(%)<br />
Lower<br />
secondary<br />
completion<br />
rate 4<br />
Upper<br />
secondary<br />
completion<br />
rate 4<br />
Existence of<br />
nationally<br />
representative<br />
learning<br />
assessment at<br />
the end of lower<br />
secondary<br />
education<br />
Percentage of students at end<br />
of lower secondary education<br />
achieving at least a minimum<br />
proficiency level (%) 7 in:<br />
Reading<br />
Mathematics<br />
School year ending<br />
in 2014<br />
School year ending<br />
in 2014<br />
School year ending<br />
in 2014<br />
School year ending<br />
in 2014<br />
2009<br />
2009<br />
2009<br />
2009<br />
2009<br />
–2014 5 –2014 5 –2014 5 –2014 5 –2014 5<br />
Country or territory<br />
Total<br />
(000) % F Total Male Female<br />
Total<br />
(000) % F Total Male Female Total Total Total Total<br />
Cook Isl<strong>and</strong>s 9 0.1 *, y 44 *, y 86 *, y 85 *, y 87 *, y 0.1 *, y 42 *, y 97 * 95 * 98 * … … No ... ...<br />
Fiji 2 y ... 74 y 70 y 77 y 13 y 42 y 98 z 94 z 103 z … … No ... ...<br />
Kiribati ... ... ... ... ... ... ... 101 92 110 … … No ... ...<br />
Marshall Isl<strong>and</strong>s ... ... ... ... ... ... ... ... ... ... … … ... ... ...<br />
Micronesia F.S. ... ... ... ... ... ... ... ... ... ... … … ... ... ...<br />
Nauru 9 0 * 46 * 47 * 43 * 50 * 0.2 * 44 * 77 *, y 85 *, y 68 *, y … … ... ... ...<br />
New Zeal<strong>and</strong> 10 4 41 96 95 98 7 30 ... ... ... … … Yes I 99 I 92 I<br />
Niue ... ... ... ... ... ... ... 104 * 110 * 100 * … … ... ... ...<br />
Palau 9 ... ... 98 *, z ... ... 0.0 *, z ... 105 * 102 * 107 * … … ... ... ...<br />
Papua New Guinea ... ... ... ... ... ... ... 63 y 67 y 58 y … … ... ... ...<br />
Samoa 0.4 45 86 80 92 3 27 101 104 98 … … No ... ...<br />
Solomon Isl<strong>and</strong>s ... ... ... ... ... ... ... 66 67 65 … … No ... ...<br />
Tokelau ... ... ... ... ... ... ... ... ... ... … … No ... ...<br />
Tonga 1 31 44 39 48 3 44 ... ... ... … … No ... ...<br />
Tuvalu 9 0.1 * 26 * 47 * 37 * 59 * 0.3 * 37 * 100 * 93 * 108 * … … No ... ...<br />
Vanuatu ... ... ... ... ... ... ... 53 z 51 z 55 z … … No ... ...<br />
Southern Asia<br />
Afghanistan 852 72 48 61 34 1,148 62 ... ... ... 25 14 No ... ...<br />
Bangladesh ... ... ... ... ... ... ... 68 z 62 z 73 z 56 23 Yes N ... ...<br />
Bhutan 9 37 66 63 69 10 45 78 72 84 25 5 Yes N ... ...<br />
India 11,123 **, z 38 **, z 52 **, z 53 **, z 51 **, z 46,815 **, z 48 **, z 81 z 79 z 83 z 76 35 Yes N ... ...<br />
Iran, Islamic Republic of 33 57 77 77 77 1,012 48 96 *, y 96 *, y 97 *, y … … Yes I ... 54 I<br />
Maldives ... ... ... ... ... ... ... 93 92 95 90 63 Yes N ... ...<br />
Nepal ... ... 55 52 58 1,219 45 84 80 89 61 42 Yes N ... ...<br />
Pakistan 5,502 53 33 37 28 10,443 52 51 55 46 46 20 Yes N ... ...<br />
Sri Lanka 68 z 46 z ... ... ... ... ... 96 ** 96 ** 97 ** … … Yes N ... ...<br />
Sub-Saharan Africa<br />
Angola ... ... ... ... ... ... ... ... ... ... … … ... ... ...<br />
Benin 350 z 61 z 40 z 51 z 29 z 389 z 59 z 42 50 34 29 13 No ... ...<br />
Botswana 10 15 z 45 z 81 z 80 z 81 z 17 z 49 z 87 z 86 z 87 z … … Yes I ... 49 I<br />
Burkina Faso 758 z 51 z 23 z 25 z 21 z 830 z 50 z 25 26 23 8 3 No ... ...<br />
Burundi 275 49 34 36 31 425 53 26 29 23 10 4 No ... ...<br />
Cabo Verde 3 49 70 66 74 10 44 76 67 85 … … No ... ...<br />
Cameroon 788 55 43 48 39 814 54 36 36 35 34 13 Yes N ... ...<br />
Central African Republic 239 y 60 y 16 y 21 y 10 y 248 y 54 y 13 y 17 y 8 y 9 6 ... ... ...<br />
Chad ... ... ... ... ... ... ... 18 z 25 z 10 z 17 7 ... ... ...<br />
Comoros 19 z 48 z 44 z 43 z 45 z 26 z 49 z 45 z 42 z 49 z 43 25 ... ... ...<br />
Congo ... ... ... ... ... ... ... 52 y 53 y 51 y 36 15 ... ... ...<br />
Côte d'Ivoire ... ... ... ... ... ... ... 33 38 27 32 16 No ... ...<br />
D.R. Congo ... ... ... ... ... ... ... 48 62 34 57 30 ... ... ...<br />
Djibouti ... ... ... ... ... ... ... 45 49 41 … … ... ... ...<br />
Equatorial Guinea ... ... ... ... ... ... ... 32 y 34 y 30 y … … ... ... ...<br />
Eritrea 213 z 52 z 38 z 43 z 33 z 254 z 53 z 55 y 56 y 54 y … … No ... ...<br />
Ethiopia 3,635 **, y 51 **, y ... ... ... ... ... 29 31 28 17 13 Yes N ... ...<br />
Gabon ... ... ... ... ... ... ... ... ... ... 44 14 ... ... ...<br />
Gambia 10 ... ... ... ... ... ... ... 62 61 62 48 29 Yes N ... ...<br />
Ghana 10 121** 49** 62** 63** 60** 633** 51** 78 80 75 53 39 Yes I ... 19 I<br />
Guinea 567 58 32 40 24 507 55 35 42 28 25 16 No ... ...<br />
Guinea-Bissau ... ... ... ... ... ... ... ... ... ... … … No ... ...<br />
Kenya ... ... 81 **, y 85 **, y 76 **, y 709 **, y 60 **, y 83 83 84 79 44 No ... ...<br />
Lesotho 34 40 56 52 60 45 45 43 36 50 32 20 No ... ...<br />
Liberia ... ... ... ... ... ... ... 37 42 32 38 23 No ... ...<br />
Madagascar ... ... ... ... ... ... ... 37 37 37 ... ... No ... ...<br />
Malawi 327 50 41 44 38 432 53 21 z 22 z 20 z 29 18 No ... ...<br />
Mali 544 55 30 35 25 727 53 33 37 29 18 14 No ... ...<br />
Mauritania 148 48 27 28 25 178 50 29 29 28 28 17 No ... ...<br />
Mauritius ... ... ... ... ... ... ... 85 80 90 … … Yes N ... ...<br />
Mozambique 882 54 29 32 25 864 53 22 22 21 11 5 Yes N ... ...<br />
Namibia ... ... ... ... ... ... ... 59 z 56 z 63 z 55 35 No ... ...<br />
Niger 1,193 53 11 14 8 927 52 13 15 10 6 2 No ... ...<br />
Nigeria ... ... ... ... ... ... ... ... ... ... 53 44 Yes N ... ...<br />
Rw<strong>and</strong>a ... ... ... ... ... ... ... 36 y 34 y 38 y 16 10 No ... ...<br />
Sao Tome <strong>and</strong> Principe ... ... ... ... ... ... ... 74 70 78 ... ... No N ... ...<br />
Senegal ... ... ... ... ... ... ... 40 41 40 24 9 No ... ...<br />
Seychelles ... ... 89 87 91 1 41 109 103 116 … … Yes N ... ...<br />
Sierra Leone 132 y 54 y 44 y 47 y 40 y 219 y 54 y 52 z 57 z 48 z 41 20 ... ... ...<br />
Somalia ... ... ... ... ... ... ... ... ... ... … … ... ... ...<br />
South Africa 10 ... ... ... ... ... ... ... ... ... ... 83 45 Yes I, N ... 22 I<br />
South Sudan ... ... ... ... ... ... ... ... ... ... 16 6 ... ... ...<br />
Swazil<strong>and</strong> 10 z 54 z 69 z 72 z 67 z 18 z 54 z 49 z 49 z 50 z 47 30 Yes N ... ...<br />
Togo ... ... ... ... ... ... ... 38 47 29 25 14 No ... ...<br />
Ug<strong>and</strong>a ... ... ... ... ... ... ... 29 z 31 z 28 z 23 16 No ... ...<br />
423
1<br />
ANNEX<br />
TABLE 3<br />
Part 2 (Continued)<br />
ACCESS AND PARTICIPATION IN SECONDARY EDUCATION COMPLETION IN SECONDARY EDUCATION LEARNING ASSESSMENTS AND OUTCOMES 6<br />
Lower secondary<br />
out-of-school<br />
adolescents 2<br />
Upper secondary adjusted<br />
net enrolment ratio<br />
(ANER) (%)<br />
Upper secondary<br />
out-of-school<br />
adolescents<br />
<strong>and</strong> youth 3<br />
Gross intake rate (GIR)<br />
to last grade of lower<br />
secondary education<br />
(%)<br />
Lower<br />
secondary<br />
completion<br />
rate 4<br />
Upper<br />
secondary<br />
completion<br />
rate 4<br />
Existence of<br />
nationally<br />
representative<br />
learning<br />
assessment at<br />
the end of lower<br />
secondary<br />
education<br />
Percentage of students at end<br />
of lower secondary education<br />
achieving at least a minimum<br />
proficiency level (%) 7 in:<br />
Reading<br />
Mathematics<br />
School year ending<br />
in 2014<br />
School year ending<br />
in 2014<br />
School year ending<br />
in 2014<br />
School year ending<br />
in 2014<br />
2009<br />
2009<br />
2009<br />
2009<br />
2009<br />
–2014 5 –2014 5 –2014 5 –2014 5 –2014 5<br />
Country or territory<br />
Total<br />
(000) % F Total Male Female<br />
Total<br />
(000) % F Total Male Female Total Total Total Total<br />
U.R. Tanzania ... ... ... ... ... ... ... 35 z 38 z 32 z 14 3 No ... ...<br />
Zambia ... ... ... ... ... ... ... 55 z 59 z 51 z 55 27 Yes N ... ...<br />
Zimbabwe 56 z 60 z 47 z 49 z 45 z 703 z 52 z 66 z 64 z 67 z 71 9 No ... ...<br />
Sum % F Weighted average Sum % F Weighted average Median Median<br />
World 60,210 48 63 63 62 141,755 49 75 75 76 ... 53 ... ... ...<br />
Countries in transition 681 ... 85 84 z 86 z 1,271 45 z 98 97 98 97 85 ... ... ...<br />
Developed countries 607 49 z 93 92 93 2,717 45 92 92 92 … 83 ... ... ...<br />
Developing countries 58,923 48 59 59 58 137,767 49 73 72 73 46 25 ... ... ...<br />
Caucasus <strong>and</strong> Central Asia 284 ... 84 y 83 y 85 y 607 y 47 y 99 99 99 99 93 ... ... ...<br />
Eastern <strong>and</strong> South-eastern Asia 8,210 46 77 74 80 19,506 42 92 91 93 … … ... ... ...<br />
Eastern Asia 3,159 47 84 80 88 9,099 34 99 98 100 … … ... ... ...<br />
South-eastern Asia 5,050 45 63 63 63 10,407 49 81 79 84 60 39 ... ... ...<br />
Europe <strong>and</strong> Northern America 989 47 z 92 91 92 3,199 45 92 91 92 … 83 ... ... ...<br />
Latin America <strong>and</strong> the Caribbean 2,769 46 76 75 77 7,545 47 77 74 79 73 51 ... ... ...<br />
Caribbean 212 47 76 76 75 575 50 71 68 74 … … ... ... ...<br />
Latin America 2,557 46 76 75 77 6,970 47 77 75 80 65 33 ... ... ...<br />
Northern Africa <strong>and</strong> Western Asia 3,647 60 67 69 66 8,459 51 73 74 72 … … ... ... ...<br />
Northern Africa 1,185 60 66 67 66 4,017 49 72 71 73 60 35 ... ... ...<br />
Western Asia 2,462 59 68 71 65 4,442 53 74 77 71 … … ... ... ...<br />
Pacific 43 38 y 66 61 70 545 42 83 z 84 z 81 z … … ... ... ...<br />
Southern Asia 20,663 43 50 51 49 68,737 49 76 74 77 56 23 ... ... ...<br />
Sub-Saharan Africa 23,605 52 43 46 39 33,131 52 42 45 39 31 15 ... ... ...<br />
Conflict-affected countries 14,826 ** 55 ** 54 ** 56 ** 52 ** 25,515 ** 51 ** 70 70 70 45 20 ... ... ...<br />
Countries with low income 16,837 54 40 44 35 23,151 53 38 41 34 25 14 ... ... ...<br />
Countries with middle income 42,111 46 61 61 61 114,556 48 78 77 80 74 45 ... ... ...<br />
Lower middle 34,945 45 52 53 51 91,658 49 73 72 74 53 30 ... ... ...<br />
Upper middle 7,166 49 77 75 80 22,898 43 88 86 89 83 63 ... ... ...<br />
Countries with high income 1,262 47 z 92 91 93 4,048 44 92 92 92 … 83 ... ... ...<br />
Source: UIS database, except where noted. Enrolment ratios <strong>and</strong> gross intake rates to last grade are based on the United<br />
Nations Population Division estimates, revision 2015 (United Nations, 2015), median variant.<br />
Note: The country groupings by level of income are as defined by the World Bank but include only countries listed in the<br />
table. They are based on the list of countries by income group as revised in July 2015.<br />
1. Over-age pupils are defined as those whose age is at least two years higher than the official age of entry in a given grade.<br />
The percentage is calculated as the sum of the numbers of pupils who are two or more years above the theoretical age of<br />
their grade divided by total enrolment in lower secondary education.<br />
2. Data reflect the actual number of adolescents of lower secondary school age not enrolled at all, derived from the lower<br />
secondary ANER, which measures the proportion of lower secondary school age adolescents who are enrolled in primary,<br />
secondary, post-secondary or tertiary education.<br />
3. Data reflect the actual number of adolescents <strong>and</strong> youth of upper secondary school age not enrolled at all, derived from<br />
the upper secondary ANER, which measures the proportion of upper secondary school age adolescents <strong>and</strong> youth who are<br />
enrolled in primary, secondary, post-secondary or tertiary education.<br />
4. GEM Report team calculations based on data from national <strong>and</strong> international household surveys.<br />
5. Data are for the most recent year available in the period specified. For details see relevant sources.<br />
6. Altinok (2013); Cheng <strong>and</strong> Omeova (2014); Ministries of education national reports <strong>and</strong> websites; PISA 2012 (OECD, 2013),<br />
TIMSS 2011. ‘Nationally representative learning assessment’ refers to national (N) or international (I) formative learning<br />
assessments. Information <strong>and</strong> data need to be used <strong>and</strong> interpreted with caution since the different types of assessments<br />
are not necessarily comparable.<br />
7. Refers to the percentage of pupils performing at or above level 1 of proficiency in in reading <strong>and</strong> or mathematics.<br />
8. GER <strong>and</strong> GIR to last grade were not calculated due to inconsistencies in the United Nations population data or lack of<br />
United Nations population by age.<br />
9. National population data were used to calculate GER <strong>and</strong> GIR to last grade due to inconsistencies in the United Nations<br />
population data or lack of United Nations population by age.<br />
10. In the absence of assessments conducted in the proposed indicator grade, surveys of student learning achievement in<br />
the grade below or above the proposed indicator grade are used as placeholders to report on learning assessments <strong>and</strong>/or<br />
learning outcomes at the end of secondary education.<br />
Data in bold are for the school year ending in 2015.<br />
(z) Data are for the school year ending in 2013.<br />
(y) Data are for the school year ending in 2012.<br />
(*) National estimate.<br />
(**) For country level data: UIS partial estimate; for regional <strong>and</strong> other country grouping sums <strong>and</strong> weighted averages:<br />
partial imputation due to incomplete country coverage (between 33% <strong>and</strong> 60% of population for the region or other<br />
country grouping).<br />
(-) Magnitude nil or negligible<br />
(.) The category is not applicable or does not exist.<br />
(…) No data are available.<br />
424
STATISTICAL TABLES<br />
1<br />
TABLE 4<br />
SDG 4, Target 4.2 – Universal access to early childhood development, care <strong>and</strong> pre-primary education<br />
By 2030, ensure that all girls <strong>and</strong> boys have access to quality early childhood development, care <strong>and</strong> pre-primary education so that they are ready for primary education<br />
Country or territory<br />
CHILD MORTALITY 1 AND<br />
PARTICIPATION IN PRE-PRIMARY EDUCATION SCHOOL READINESS 5<br />
MALNUTRITION 2<br />
Under-5<br />
mortality rate<br />
(deaths per 1,000<br />
live births)<br />
Total<br />
2015<br />
Under-5<br />
moderate or<br />
severe<br />
stunting rate<br />
(%)<br />
Total enrolment in<br />
pre-primary education<br />
School year ending in<br />
2014<br />
Gross enrolment ratio (GER)<br />
in pre-primary education (%)<br />
School year ending in<br />
2014<br />
Adjusted net enrolment ratio<br />
(ANER)<br />
one year before the official<br />
primary school entry age (%) 4<br />
Percentage of<br />
children under 5<br />
experiencing positive<br />
<strong>and</strong> stimulating<br />
home learning<br />
environments (%) 6<br />
Percentage of<br />
children under 5<br />
living in households<br />
with<br />
three or more<br />
children’s books<br />
Percentage of<br />
children under 5<br />
who are<br />
developmentally on<br />
track in health,<br />
learning <strong>and</strong><br />
psychosocial<br />
well-being (%) 7<br />
School year ending in<br />
2014 2009–2015 3 2009–2015 3 2009–2015 3<br />
Total<br />
Total<br />
2009–2014 3 (000) % F Total Male Female Total Male Female Total Total Total<br />
Caucasus <strong>and</strong> Central Asia<br />
Armenia 14 21 64 y 49 y 52 y 46 y 60 y ... ... ... ... ... ...<br />
Azerbaijan 8 32 18 107 47 23 * 23 * 24 * 21 * 20 * 21 * ... ... ...<br />
Georgia 12 11 ... ... ... ... ... ... ... ... ... ... ...<br />
Kazakhstan 14 13 852 51 60 57 64 95 90 100 92 48 86<br />
Kyrgyzstan 21 13 126 49 25 25 25 67 66 69 72 27 78<br />
Tajikistan 45 … 86 46 11 11 10 12 12 11 ... ... ...<br />
Turkmenistan 51 27 189 49 63 64 62 ... ... ... ... ... ...<br />
Uzbekistan 39 … ... ... ... ... ... ... ... ...<br />
Eastern <strong>and</strong> South-eastern Asia<br />
Brunei Darussalam 10 20 13 49 74 73 74 100 99 100 ... ... ...<br />
Cambodia 29 32 182 48 18 18 18 33 34 32 59 4 68<br />
China 11 9 38,947 46 82 82 82 ... ... ... ... ... ...<br />
DPR Korea 25 … ... ... ... ... ... ... ... ... 91 79 75<br />
Hong Kong, China 9 ... … 171 48 ... ... ... ... ... ... ... ... ...<br />
Indonesia 27 36 5,349 49 58 57 59 99 ** 100 ** 99 ** ... ... ...<br />
Japan 3 7 2,910 z ... 90 z ... ... 96 z ... ... ... ... ...<br />
Lao PDR 67 44 150 50 30 30 31 50 50 51 57 5 81<br />
Macao, China 9 ... … 13 48 ... ... ... ... ... ... ... ... ...<br />
Malaysia 7 … 894 49 99 ... ... 96 ... ... ... ... ...<br />
Mongolia 22 11 133 y 50 y 86 y 85 y 86 y 71 y 71 y 71 y 55 33 76<br />
Myanmar 50 35 453 51 23 23 24 23 23 23 ... ... ...<br />
Philippines 28 30 ... ... ... ... ... ... ... ... ... ... ...<br />
Republic of Korea 3 … 1,262 49 92 z 92 z 92 z 99 z 99 z 99 z ... ... ...<br />
Singapore 3 … ... ... ... ... ... ... ... ... ... ... ...<br />
Thail<strong>and</strong> 12 16 1,737 48 73 73 73 96 96 96 93 43 92<br />
Timor-Leste 53 58 16 50 17 17 17 64 59 68 ... ... ...<br />
Viet Nam 22 19 3,614 47 81 83 80 95 **, z ... ... 96 26 89<br />
Europe <strong>and</strong> Northern America<br />
Albania 14 23 81 48 89 90 87 98 99 97 ... ... ...<br />
Andorra 9 3 … 2 51 ... ... ... ... ... ... ... ... ...<br />
Austria 4 … 240 48 102 102 101 ... ... ... ... ... ...<br />
Belarus 5 … 327 48 105 107 103 99 100 97 96 92 94<br />
Belgium 4 … 463 49 118 118 118 100 100 99 ... ... ...<br />
Bosnia <strong>and</strong> Herzegovina 5 9 16 47 15 15 14 15 y 16 y 15 y 95 56 96<br />
Bulgaria 10 … 241 48 83 83 83 93 94 92 ... ... ...<br />
Canada 5 … 556 z 49 z 74 z 74 z 73 z 97 z 97 z 96 z ... ... ...<br />
Croatia 4 … 108 48 61 62 61 95 96 95 ... ... ...<br />
Cyprus 8 3 … 23 49 77 * 77 * 77 * 92 * 93 * 92 * ... ... ...<br />
Czech Republic 3 … 367 48 105 106 104 ... ... ... ... ... ...<br />
Denmark 4 … 191 49 96 96 97 98 96 100 ... ... ...<br />
Estonia 3 … 52 y 48 y 88 y 90 y 87 y 92 y 94 y 91 y ... ... ...<br />
Finl<strong>and</strong> 2 … 196 49 80 80 79 98 99 98 ... ... ...<br />
France 4 … 2,584 49 109 109 109 100 100 100 ... ... ...<br />
Germany 4 … 2,225 48 111 111 110 ... ... ... ... ... ...<br />
Greece 5 … 167 z 48 z 76 z 77 z 76 z 95 z 96 z 94 z ... ... ...<br />
Hungary 6 … 330 48 84 85 83 92 92 91 ... ... ...<br />
Icel<strong>and</strong> 2 … 13 y 48 y 97 y 98 y 97 y 99 y 99 y 98 y ... ... ...<br />
Irel<strong>and</strong> 4 … 78 z 49 z 108 z 107 z 110 z 96 z 94 z 98 z ... ... ...<br />
Italy 4 … 1,686 z 48 z 100 z 101 z 99 z 99 z 99 z 98 z ... ... ...<br />
Latvia 8 … 79 49 91 91 90 99 98 100 ... ... ...<br />
Liechtenstein 8 ... … 0,8 44 106 * 109 * 102 * 100 * 99 * 100 * ... ... ...<br />
Lithuania 5 … 99 49 88 89 88 98 98 97 ... ... ...<br />
Luxembourg 2 … 16 z 49 z 93 z 93 z 94 z 98 z 96 z 100 z ... ... ...<br />
Malta 6 … 9 49 115 112 119 100 100 100 ... ... ...<br />
Monaco 9 4 … 0,9 47 ... ... ... ... ... ... ... ... ...<br />
Montenegro 5 9 13 47 55 57 54 66 68 63 98 73 94<br />
Netherl<strong>and</strong>s 4 … 512 49 95 95 95 100 ** 100 ** 100 ** ... ... ...<br />
Norway 3 … 187 49 98 98 98 100 100 100 ... ... ...<br />
Pol<strong>and</strong> 5 … 1,216 z 49 z 77 z 78 z 77 z 89 z 91 z 88 z ... ... ...<br />
Portugal 4 … 265 48 92 93 90 98 100 96 ... ... ...<br />
Republic of Moldova 8 16 6 130 48 84 * 84 * 83 * 97 * 96 * 97 * 89 68 84<br />
Romania 11 … 569 49 90 90 91 90 ** 90 ** 90 ** ... ... ...<br />
Russian Federation 10 … 5,397 48 84 84 83 89 90 89 ... ... ...<br />
San Marino 8 3 … 1 y 50 y 107 *, y 106 *, y 108 *, y 94 *, y 94 *, y 95 *, y ... ... ...<br />
Serbia 8 7 6 157 49 59 * 59 * 59 * 98 * 98 * 99 * 96 72 95<br />
Slovakia 7 … 158 48 92 93 91 ... ... ... ... ... ...<br />
Slovenia 3 … 60 48 93 95 92 98 98 97 ... ... ...<br />
Spain 4 … 1,443 48 98 98 98 100 100 100 ... ... ...<br />
Sweden 3 … 441 48 96 96 95 98 98 98 ... ... ...<br />
Switzerl<strong>and</strong> 4 … 166 48 105 106 104 100 99 100 ... ... ...<br />
TFYR Macedonia 6 5 20 y 49 y 29 y 28 y 29 y 36 y 35 y 38 y 92 52 93<br />
425
1 ANNEX<br />
TABLE 4<br />
(Continued)<br />
Country or territory<br />
CHILD MORTALITY 1 AND<br />
PARTICIPATION IN PRE-PRIMARY EDUCATION SCHOOL READINESS 5<br />
MALNUTRITION 2<br />
Under-5<br />
mortality rate<br />
(deaths per 1,000<br />
live births)<br />
Total<br />
2015<br />
Under-5<br />
moderate or<br />
severe<br />
stunting rate<br />
(%)<br />
Total enrolment in<br />
pre-primary education<br />
School year ending in<br />
2014<br />
Gross enrolment ratio (GER)<br />
in pre-primary education (%)<br />
School year ending in<br />
2014<br />
Adjusted net enrolment ratio<br />
(ANER)<br />
one year before the official<br />
primary school entry age (%) 4<br />
Percentage of<br />
children under 5<br />
experiencing positive<br />
<strong>and</strong> stimulating<br />
home learning<br />
environments (%) 6<br />
Percentage of<br />
children under 5<br />
living in households<br />
with<br />
three or more<br />
children’s books<br />
Percentage of<br />
children under 5<br />
who are<br />
developmentally on<br />
track in health,<br />
learning <strong>and</strong><br />
psychosocial<br />
well-being (%) 7<br />
School year ending in<br />
2014 2009–2015 3 2009–2015 3 2009–2015 3<br />
Total<br />
Total<br />
2009–2014 3 (000) % F Total Male Female Total Male Female Total Total Total<br />
Ukraine 9 … 1,354 y 48 y 104 y 105 y 103 y ... ... ... 98 91 89<br />
United Kingdom 4 … 1,480 49 88 88 88 100 100 99 ... ... ...<br />
United States 7 2 8,762 49 71 71 72 90 91 90 ... ... ...<br />
Latin America <strong>and</strong> the Caribbean<br />
Anguilla ... … ... ... ... ... ... ... ... ... ... ... ...<br />
Antigua <strong>and</strong> Barbuda 8 … 2 48 75 78 72 93 100 86 ... ... ...<br />
Argentina 13 … 1,567 z 49 z 72 z 71 z 72 z 96 z 96 z 97 z 84 61 85<br />
Aruba ... … 3 48 107 108 106 100 100 100 ... ... ...<br />
Bahamas 12 … ... ... ... ... ... ... ... ... ... ... ...<br />
Barbados 13 8 6 50 84 83 86 94 93 95 ... 85 97<br />
Belize 17 19 8 49 50 50 51 93 92 93 86 40 88<br />
Bermuda ... … 0.4 50 54 54 55 61 y 58 y 63 y ... ... ...<br />
Bolivia, Plurinational States of 38 18 298 z 49 z 63 z 64 z 63 z 81 z 82 z 80 z ... ... ...<br />
Brazil 8 16 … 4,870 z 49 z 86 *, z 86 *, z 86 *, z 88 *, z 87 *, z 89 *, z ... ... ...<br />
British Virgin Isl<strong>and</strong>s 8 ... … 0,9 50 89 * ... ... 98 * ... ... ... ... ...<br />
Cayman Isl<strong>and</strong>s 9 ... … 1 z 48 z ... ... ... ... ... ... ... ... ...<br />
Chile 8 2 609 49 128 130 126 99 99 99 ... ... ...<br />
Colombia 16 13 ... ... ... ... ... ... ... ... ... ... ...<br />
Costa Rica 10 … 115 49 53 53 53 93 93 94 68 37 81<br />
Cuba 6 … 357 49 98 98 99 97 96 98 ... 48 89<br />
Curaçao ... … ... ... ... ... ... ... ... ... ... ... ...<br />
Dominica 21 … 2 48 85 88 82 ... ... ... ... ... ...<br />
Dominican Republic 31 7 278 50 44 43 45 74 72 75 ... 10 84<br />
Ecuador 22 25 587 49 62 61 62 99 100 97 … ... ...<br />
El Salvador 17 14 233 50 72 71 73 94 92 95 ... 18 81<br />
Grenada 12 … 4 47 91 94 88 98 z 97 z 98 z ... ... ...<br />
Guatemala 29 48 521 50 66 65 66 76 76 76 ... ... ...<br />
Guyana 39 12 28 y 49 y 94 y 95 y 93 y 91 y 91 y 92 y ... 47 86<br />
Haiti 69 22 ... ... ... ... ... ... ... ... ... ... ...<br />
Honduras 20 23 238 50 47 47 48 96 95 97 ... ... ...<br />
Jamaica 16 6 138 51 105 102 108 96 92 100 88 55 89<br />
Mexico 13 14 4,798 49 69 68 70 99 98 100 ... ... ...<br />
Montserrat 9 ... … 0,1 52 ... ... ... ... ... ... ... ... ...<br />
Nicaragua 22 … ... ... ... ... ... ... ... ... ... ... ...<br />
Panama 17 … 102 z 49 z 71 z 71 z 72 z 84 z 83 z 84 z ... 26 80<br />
Paraguay 21 11 152 y 49 y 38 y 38 y 38 y 78 y 78 y 78 y ... ... ...<br />
Peru 17 18 1,551 49 88 87 88 99 98 99 ... ... ...<br />
Saint Kitts <strong>and</strong> Nevis 11 … 2 48 94 97 92 99 100 98 ... ... ...<br />
Saint Lucia 14 3 4 51 65 63 67 80 79 81 93 68 91<br />
Saint Martin ... … ... ... ... ... ... ... ... ... ... ... ...<br />
Saint Vincent <strong>and</strong> the<br />
Grenadines<br />
18 … 3 50 69 68 70 85 85 84 ... ... ...<br />
Sint-Maarten 9 ... … 1 48 ... ... ... ... ... ... ... ... ...<br />
Suriname 21 9 18 49 94 92 96 96 95 98 73 25 71<br />
Trinidad <strong>and</strong> Tobago 20 … ... ... ... ... ... ... ... ... ... ... ...<br />
Turks <strong>and</strong> Caicos Isl<strong>and</strong>s 9 ... … 1 49 ... ... ... ... ... ... ... ... ...<br />
Uruguay 10 11 103 z 49 z 70 z 70 z 70 z 96 z 96 z 96 z 93 59 87<br />
Venezuela, B.R. 15 13 1,288 49 73 73 73 90 90 90 ... ... ...<br />
Northern Africa <strong>and</strong> Western Asia<br />
Algeria 26 12 ... ... ... ... ... ... ... ... 78 11 70<br />
Bahrain 6 … 33 49 55 55 55 41 41 41 ... ... ...<br />
Egypt 24 22 1,177 48 30 31 30 ... ... ... ... ... ...<br />
Iraq 32 23 ... ... ... ... ... 72 77 67 58 5 72<br />
Israel 4 … 502 49 111 111 111 ... ... ... ... ... ...<br />
Jordan 18 8 110 y 48 y 32 y 33 y 31 y ... ... ... 82 23 69<br />
Kuwait 9 9 6 82 49 ... ... ... 79 79 78 ... ... ...<br />
Lebanon 8 … 172 z 48 z 84 z 87 z 82 z ... ... ... ... ... ...<br />
Libya 13 … ... ... ... ... ... 99 99 100 ... ... ...<br />
Morocco 28 15 746 44 60 65 53 51 y 52 y 50 y ... ... ...<br />
Oman 12 10 69 50 54 53 55 ... ... ... ... 25 68<br />
Palestine 21 7 127 49 51 50 51 97 z 100 z 95 z 78 20 72<br />
Qatar 8 … 38 49 58 58 58 77 75 79 88 40 83<br />
Saudi Arabia 15 … 306 55 16 14 18 57 56 57 ... ... ...<br />
Sudan 70 38 755 z 51 z 34 z 33 z 35 z 89 88 91 ... ... ...<br />
Syrian Arab Republic 13 28 87 z 48 z 6 z 6 z 6 z 14 13 15 ... ... ...<br />
Tunisia 14 10 226 49 43 42 43 41 z 42 z 40 z 71 18 76<br />
Turkey 14 10 1,078 z 48 z 28 z 28 z 27 z 73 z 73 z 72 z ... ... ...<br />
United Arab Emirates 7 … 166 49 92 92 92 79 82 76 ... ... ...<br />
Yemen 42 47 29 z 46 z 1 z 1 z 1 z 4 z 5 z 4 z ... ... ...<br />
The Pacific<br />
Australia 9 4 … 357 48 ... ... ... 80 z 80 z 80 z ... ... ...<br />
Cook Isl<strong>and</strong>s 8 8 … 0.5 50 78 * 75 * 81 * 94 * 88 * 100 * ... ... ...<br />
Fiji 22 … ... ... ... ... ... ... ... ... ... ... ...<br />
426
STATISTICAL TABLES<br />
1<br />
TABLE 4<br />
(Continued)<br />
Country or territory<br />
CHILD MORTALITY 1 AND<br />
PARTICIPATION IN PRE-PRIMARY EDUCATION SCHOOL READINESS 5<br />
MALNUTRITION 2<br />
Under-5<br />
mortality rate<br />
(deaths per 1,000<br />
live births)<br />
Total<br />
2015<br />
Under-5<br />
moderate or<br />
severe<br />
stunting rate<br />
(%)<br />
Total enrolment in<br />
pre-primary education<br />
School year ending in<br />
2014<br />
Gross enrolment ratio (GER)<br />
in pre-primary education (%)<br />
School year ending in<br />
2014<br />
Adjusted net enrolment ratio<br />
(ANER)<br />
one year before the official<br />
primary school entry age (%) 4<br />
Percentage of<br />
children under 5<br />
experiencing positive<br />
<strong>and</strong> stimulating<br />
home learning<br />
environments (%) 6<br />
Percentage of<br />
children under 5<br />
living in households<br />
with<br />
three or more<br />
children’s books<br />
Percentage of<br />
children under 5<br />
who are<br />
developmentally on<br />
track in health,<br />
learning <strong>and</strong><br />
psychosocial<br />
well-being (%) 7<br />
School year ending in<br />
2014 2009–2015 3 2009–2015 3 2009–2015 3<br />
Total<br />
Total<br />
2009–2014 3 (000) % F Total Male Female Total Male Female Total Total Total<br />
Kiribati 56 … ... ... ... ... ... ... ... ... ... ... ...<br />
Marshall Isl<strong>and</strong>s 36 … ... ... ... ... ... ... ... ... ... ... ...<br />
Micronesia F.S. 35 … ... ... ... ... ... ... ... ... ... ... ...<br />
Nauru 8 35 … 0.9 48 90 * 85 * 96 * 71 * 62 * 82 * ... ... ...<br />
New Zeal<strong>and</strong> 6 … 116 49 92 91 93 93 92 94 ... ... ...<br />
Niue 8 23 … 0.0 47 119 * 113 * 125 * ... ... ... ... ... ...<br />
Palau 8 16 … 0.5 52 74 * 71 * 77 * 91 * 100 * 81 * ... ... ...<br />
Papua New Guinea 57 50 ... ... ... ... ... ... ... ... ... ... ...<br />
Samoa 18 … 4 51 37 35 39 30 27 32 ... ... ...<br />
Solomon Isl<strong>and</strong>s 28 … 47 49 98 98 98 ... ... ... ... ... ...<br />
Tokelau ... … ... ... ... ... ... ... ... ... ... ... ...<br />
Tonga 17 8 2 48 39 39 38 ... ... ... ... ... ...<br />
Tuvalu 8 27 … 0.7 48 93 * 93 * 93 * ... ... ... ... ... ...<br />
Vanuatu 28 29 13 z 48 z 97 z 98 z 97 z ... ... ... ... ... ...<br />
Southern Asia<br />
Afghanistan 91 41 ... ... ... ... ... ... ... ... ... ... ...<br />
Bangladesh 38 36 2,961 z 49 z 32 z 32 z 32 z ... ... ... 78 9 64<br />
Bhutan 33 34 5 51 17 16 18 ... ... ... 54 6 72<br />
India 48 39 7,376 z 45 z 10 z 10 z 9 z ... ... ... ... ... ...<br />
Iran, Islamic Republic of 16 7 543 49 42 43 42 38 39 37 ... ... ...<br />
Maldives 9 9 20 23 49 ... ... ... ... ... ... ... ... ...<br />
Nepal 36 37 1,014 48 85 87 84 81 81 81 67 5 64<br />
Pakistan 81 45 6,550 45 70 74 66 94 100 89 ... ... ...<br />
Sri Lanka 10 15 335 z 49 z 95 z 95 z 95 z ... ... ... ... ... ...<br />
Sub-Saharan Africa<br />
Angola 157 … ... ... ... ... ... ... ... ... ... ... ...<br />
Benin 100 34 129 50 21 20 21 60 y 61 y 59 y ... 1 61<br />
Botswana 44 … 27 z 49 z 18 z 18 z 18 z 28 z 27 z 28 z ... ... ...<br />
Burkina Faso 89 33 72 51 4 4 4 9 9 9 ... ... ...<br />
Burundi 82 58 67 50 7 7 7 22 22 23 ... ... ...<br />
Cabo Verde 25 … 22 50 70 70 70 83 82 84 ... ... ...<br />
Cameroon 88 33 467 50 34 34 35 48 49 48 62 4 51<br />
Central African Republic 130 41 ... ... ... ... ... ... ... ... 74 1 47<br />
Chad 139 39 11 z 47 z 1 z 1 z 1 z ... ... ... 70 1 33<br />
Comoros 74 32 15 z 50 z 23 z 22 z 24 z 76 z 74 z 78 z ... ... ...<br />
Congo 45 25 54 y 49 y 14 y 14 y 14 y 23 y 22 y 25 y 56 1 49<br />
Côte d’Ivoire 93 30 129 50 7 7 7 19 21 18 ... ... ...<br />
Democratic Rep. of the Congo 98 43 309 51 4 4 4 ... ... ... 61 1 66<br />
Djibouti 65 34 2 46 5 +1 5 +1 4 +1 ... ... ... ... ... ...<br />
Equatorial Guinea 94 26 42 y 50 y 68 y 68 y 68 y 68 y 67 y 70 y ... ... ...<br />
Eritrea 47 50 46 z 49 z 15 z 15 z 15 z 16 z 16 z 16 z ... ... ...<br />
Ethiopia 59 40 2,496 48 30 31 30 25 **, y 24 **, y 26 **, y ... ... ...<br />
Gabon 51 18 ... ... ... ... ... ... ... ... ... ... ...<br />
Gambia 69 25 87 51 34 33 35 52 51 53 48 1 68<br />
Ghana 62 19 1,767 50 121 119 122 99 ** 98 ** 100 ** 40 6 74<br />
Guinea 94 31 ... ... ... ... ... ... ... ... ... ... ...<br />
Guinea-Bissau 93 28 ... ... ... ... ... ... ... ... ... 1 61<br />
Kenya 49 26 3,020 49 74 75 73 ... ... ... ... ... ...<br />
Lesotho 90 33 48 51 31 30 32 34 33 34 ... ... ...<br />
Liberia 70 32 ... ... ... ... ... ... ... ... ... ... ...<br />
Madagascar 50 49 285 51 14 13 14 ... ... ... ... ... ...<br />
Malawi 64 42 ... ... ... ... ... ... ... ... 29 1 60<br />
Mali 115 … 92 50 4 4 4 44 46 42 ... 0 62<br />
Mauritania 85 22 11 56 3 3 4 ... ... ... 55 ... 58<br />
Mauritius 14 … 30 50 102 101 104 94 94 94 ... ... ...<br />
Mozambique 79 43 ... ... ... ... ... ... ... ... ... ... ...<br />
Namibia 45 23 25 z 51 z 21 z 21 z 22 z 48 z 46 z 50 z ... ... ...<br />
Niger 96 43 142 50 7 7 7 17 z 17 z 16 z ... ... ...<br />
Nigeria 109 33 ... ... ... ... ... ... ... ... 65 6 57<br />
Rw<strong>and</strong>a 42 38 142 z 51 z 14 z 14 z 15 z 47 z 46 z 47 z ... ... ...<br />
Sao Tome <strong>and</strong> Principe 47 … 9 +1 52 51 49 54 57 56 58 63 6 55<br />
Senegal 47 19 199 52 15 14 16 18 17 19 ... ... ...<br />
Seychelles 14 8 3 49 93 93 93 96 98 93 ... ... ...<br />
Sierra Leone 120 38 54 z 52 z 10 z 9 z 10 z 24 z 24 z 25 z 54 2 45<br />
Somalia 137 26 ... ... ... ... ... ... ... ... ... ... ...<br />
South Africa 41 … 823 z 50 z 76 z 77 z 76 z ... ... ... ... ... ...<br />
South Sudan 93 31 ... ... ... ... ... ... ... ... ... ... ...<br />
Swazil<strong>and</strong> 61 26 ... ... ... ... ... ... ... ... 50 4 62<br />
Togo 78 28 97 51 15 15 15 75 74 75 62 2 55<br />
Ug<strong>and</strong>a 55 34 430 z 50 z 11 z 11 z 11 z ... ... ... ... ... ...<br />
United Republic of Tanzania 49 35 1,026 z 50 z 32 z 32 z 33 z 46 z 43 z 49 z ... ... ...<br />
Zambia 64 40 ... ... ... ... ... ... ... ... ... ... ...<br />
Zimbabwe 71 28 374 z 50 z 42 z 42 z 43 z 37 z 36 z 37 z 43 3 62<br />
427
1 ANNEX<br />
TABLE 4<br />
(Continued)<br />
Country or territory<br />
CHILD MORTALITY 1 AND<br />
PARTICIPATION IN PRE-PRIMARY EDUCATION SCHOOL READINESS 5<br />
MALNUTRITION 2<br />
Under-5<br />
mortality rate<br />
(deaths per 1,000<br />
live births)<br />
Total<br />
2015<br />
Under-5<br />
moderate or<br />
severe<br />
stunting rate<br />
(%)<br />
Total enrolment in<br />
pre-primary education<br />
School year ending in<br />
2014<br />
Gross enrolment ratio (GER)<br />
in pre-primary education (%)<br />
School year ending in<br />
2014<br />
Adjusted net enrolment ratio<br />
(ANER)<br />
one year before the official<br />
primary school entry age (%) 4<br />
Percentage of<br />
children under 5<br />
experiencing positive<br />
<strong>and</strong> stimulating<br />
home learning<br />
environments (%) 6<br />
Percentage of<br />
children under 5<br />
living in households<br />
with<br />
three or more<br />
children’s books<br />
Percentage of<br />
children under 5<br />
who are<br />
developmentally on<br />
track in health,<br />
learning <strong>and</strong><br />
psychosocial<br />
well-being (%) 7<br />
School year ending in<br />
2014 2009–2015 3 2009–2015 3 2009–2015 3<br />
Total<br />
Total<br />
2009–2014 3 (000) % F Total Male Female Total Male Female Total Total Total<br />
Weighted<br />
Median Sum % F Weighted average Weighted average Median Median Median<br />
average<br />
World 43 24 155,000 ** 48 ** 44 ** 44 ** 44 ** 67 ** 67 ** 66 ** … … …<br />
Countries in transition 19 12 8,661 48 62 62 62 73 73 73 … … …<br />
Developed countries 5 … 28,820 49 87 87 87 94 95 94 … … …<br />
Developing countries 48 26 117,519 ** 48 ** 39 ** 39 ** 38 ** 64 ** 62 **, z 62 **, z … … …<br />
Caucasus <strong>and</strong> Central Asia 32 16 2,008 ** 49 ** 34 ** 34 ** 34 ** 49 ** 49 ** 50 ** … … …<br />
Eastern <strong>and</strong> South-eastern Asia 17 25 57,653 47 76 76 76 79 ** ... ... … … …<br />
Eastern Asia 10 9 43,974 46 83 82 83 ... ... ... … … …<br />
South-eastern Asia 27 32 13,679 49 60 60 60 78 78 78 … … …<br />
Europe <strong>and</strong> Northern America 6 23 31,685 49 85 85 85 93 94 93 … … …<br />
Latin America <strong>and</strong> the<br />
Caribbean<br />
18 … 19,989 ** 49 ** 73 ** 73 ** 73 ** 90 ** 89 ** 91 ** … … …<br />
Caribbean … … 1,494 ** 50 ** 76 ** 75 ** 77 ** 81 ** 80 ** 83 ** … … …<br />
Latin America 17 14 18,495 ** 49 ** 73 ** 72 ** 73 ** 91 ** 90 ** 91 ** … … …<br />
Northern Africa <strong>and</strong> Western<br />
Asia<br />
29 12 6,500 ** 48 ** 29 ** 29 ** 29 ** 51 ** 51 ** 50 ** … … …<br />
Northern Africa 35 15 3,538 48 40 40 39 59 ** 60 ** 58 ** … … …<br />
Western Asia 22 10 2,962 ** 49 ** 22 ** 22 ** 22 ** 43 ** 43 ** 42 ** … … …<br />
Pacific 24 … 1,148 ** 48 ** 98 ** 98 ** 97 ** 76 ** 76 ** 76 ** … … …<br />
Southern Asia 51 36 18,810 ** 46 ** 18 ** 19 ** 18 ** ... ... ... … … …<br />
Sub-Saharan Africa 84 33 17,207 ** 50 ** 22 ** 21 ** 22 ** 41 **, z 40 **, z 42 **, z … … …<br />
Conflict-affected countries 57 35 39,512 ** 48 ** 23 ** 23 ** 22 ** 58 **, y 59 **, y 58 **, y … … …<br />
Countries with low income 76 35 9,277 ** 49 ** 17 ** 17 ** 17 ** 41 ** 41 ** 41 ** … … …<br />
Countries with middle income 42 19 106,272 ** 47 ** 42 ** 43 ** 42 ** 67 ** 65 **, y 65 **, y … … …<br />
Lower middle 53 28 42,487 ** 48 ** 26 ** 26 ** 26 ** 60 **, y 60 **, y 59 **, y … … …<br />
Upper middle 20 11 63,784 47 73 73 73 76 ** 75 **, z 77 **, z … … …<br />
Countries with high income 7 … 39,451 49 83 83 83 91 91 91 … … …<br />
Source: UIS database, except where noted. Enrolment ratios are based on the United Nations Population Division<br />
estimates, revision 2015 (United Nations, 2015), median variant.<br />
Note: The country groupings by level of income are as defined by the World Bank but include only countries listed in the<br />
table. They are based on the list of countries by income group as revised in July 2015.<br />
1. Under-5 mortality rates are the updated estimates generated by the UN Inter-agency Group for Child Mortality<br />
Estimation in September 2015. They are based on the median variant.<br />
2. UNICEF, WHO <strong>and</strong> World Bank (2015).<br />
3. Data are for the most recent year available during the period specified.<br />
4. ANER one year before the official primary school entry age is the percentage of children at the intended age a year<br />
before entry into primary education who are enrolled in either pre-primary or primary education.<br />
5. UNICEF-MICS 4 <strong>and</strong> 5, country reports.<br />
6. Data refer to the MICS indicator “Adult support for learning”, which is the percentage of children 36 to 59 months old<br />
with whom an adult has engaged in four or more of the following activities to promote learning <strong>and</strong> school readiness in<br />
the previous 3 days: (a) reading books to the child, (b) telling stories to the child, (c) singing songs to the child, (d) taking<br />
the child outside the home, (e) playing with the child, <strong>and</strong> (f) spending time with the child naming, counting or drawing<br />
things.<br />
7. Data refer to the MICS indicator “Early Child Development Index”, which is the percentage of children who are<br />
developmentally on track in at least three of the following domains: (a) literacy-numeracy, (b) physical development, (c)<br />
social-emotional development, <strong>and</strong> (d) learning (ability to follow simple instructions, ability to occupy herself/himself<br />
independently).<br />
8. National population data were used to calculate enrolment ratios due to inconsistencies in the United Nations<br />
population data or lack of United Nations population by age.<br />
9. Enrolment ratios was not calculated due to inconsistencies in the United Nations population data or lack of United<br />
Nations population by age.<br />
Data in bold are for the school year ending in 2015.<br />
(z) Data are for the school year ending in 2013.<br />
(y) Data are for the school year ending in 2012.<br />
(*) National estimate.<br />
(**) For country level data: UIS partial estimate; for regional <strong>and</strong> other country grouping sums <strong>and</strong> weighted averages:<br />
partial imputation due to incomplete country coverage (between 33% <strong>and</strong> 60% of population for the region or other<br />
country grouping).<br />
(-) Magnitude nil or negligible<br />
(.) The category is not applicable or does not exist.<br />
(…) No data are available.<br />
428
STATISTICAL TABLES<br />
1<br />
TABLE 5<br />
SDG 4, Target 4.3 – Universal access to technical, vocational <strong>and</strong> tertiary education<br />
By 2030, ensure equal access for all women <strong>and</strong> men to affordable quality technical, vocational <strong>and</strong> tertiary education, including university – part 1<br />
PARTICIPATION IN TECHNICAL AND VOCATIONAL EDUCATION PROGRAMMES<br />
Share of technical <strong>and</strong> vocational education in total enrolment (%) by level<br />
Total secondary education<br />
Post-secondary non-tertiary education<br />
Percentage of youth (15–24) enrolled in<br />
secondary technical <strong>and</strong> vocational education (%)<br />
School year ending in<br />
2014<br />
School year ending in<br />
2014<br />
School year ending in<br />
2014<br />
Country or territory<br />
Total Male Female Total Male Female Total Male Female<br />
Caucasus <strong>and</strong> Central Asia<br />
Armenia 11 12 10 . . . 3 y 4 y 3 y<br />
Azerbaijan 2 20 18 22 100 100 100 11 * 10 * 11 *<br />
Georgia 5 5 5 100 100 100 2 2 2<br />
Kazakhstan 11 12 11 100 100 100 7 7 7<br />
Kyrgyzstan 10 11 9 100 z 100 z 100 z 6 6 5<br />
Tajikistan 1 z 2 z 0.3 z ... ... ... ... ... ...<br />
Turkmenistan 8 9 6 . . . ... ... ...<br />
Uzbekistan ... ... ... ... ... ... ... ... ...<br />
Eastern <strong>and</strong> South-eastern Asia<br />
Brunei Darussalam 11 12 11 . . . 7 8 6<br />
Cambodia ... ... ... ... ... ... ... ... ...<br />
China 22 23 21 38 42 32 ... ... ...<br />
Democratic People’s Republic of Korea ... ... ... ... ... ... ... ... ...<br />
Hong Kong, China 2 3 0.5 68 79 53 1 * 1 * 0 *<br />
Indonesia 19 22 15 . . . 10 12 8<br />
Japan 12 z 13 z 10 z 100 y 100 y 100 y 6 y 7 y 5 y<br />
Lao People’s Democratic Republic 1 1 2 100 100 100 0 0 0<br />
Macao, China 4 5 4 . . . 2 2 1<br />
Malaysia 11 13 9 100 100 100 6 ... ...<br />
Mongolia 10 12 8 100 100 100 5 6 4<br />
Myanmar - - - ... ... ... - - -<br />
Philippines . z . z . z 100 z 100 z 100 z . z . z . z<br />
Republic of Korea 9 z 10 z 8 z . z . z . z 5 z 5 z 5 z<br />
Singapore 3 ... ... ... ... ... ... ... ... ...<br />
Thail<strong>and</strong> 16 z 19 z 13 z . . . 8 y 9 y 7 y<br />
Timor-Leste 5 5 4 . . . 2 3 2<br />
Viet Nam ... ... ... 100 100 100 ... ... ...<br />
Europe <strong>and</strong> Northern America<br />
Albania 8 12 4 100 100 100 4 7 2<br />
Andorra 3 8 9 8 100 100 100 ... ... ...<br />
Austria 36 39 34 100 100 100 ... ... ...<br />
Belarus 13 16 10 100 100 100 7 9 5<br />
Belgium 46 47 45 93 95 90 22 24 20<br />
Bosnia <strong>and</strong> Herzegovina 39 42 36 . y . y . y ... ... ...<br />
Bulgaria 32 36 28 100 100 100 15 18 12<br />
Canada 4 z 5 z 4 z ... ... ... ... ... ...<br />
Croatia 40 43 38 . . . 25 27 23<br />
Cyprus 2 8 12 3 100 100 100 4 * 6 * 2 *<br />
Czech Republic 39 42 36 16 24 12 ... ... ...<br />
Denmark 24 26 21 . . . 12 15 10<br />
Estonia 19 z 25 z 13 z 100 z 100 z 100 z 9 z 12 z 6 z<br />
Finl<strong>and</strong> 47 47 46 100 100 100 22 23 20<br />
France 19 20 17 51 40 57 14 16 12<br />
Germany 19 22 15 91 88 93 ... ... ...<br />
Greece 18 z 21 z 15 z ... ... ... 10 y 12 y 8 y<br />
Hungary 14 16 12 100 100 100 9 11 7<br />
Icel<strong>and</strong> 22 y 25 y 18 y 100 y 100 y 100 y 12 y 15 y 9 y<br />
Irel<strong>and</strong> 16 y 15 y 17 y 100 z 100 z 100 z 8 y 7 y 8 y<br />
Italy 36 z 42 z 30 z 100 z 100 z 100 z 23 z 28 z 19 z<br />
Latvia 22 26 18 100 100 100 11 13 9<br />
Liechtenstein 2 35 41 29 . . . 26 * 33 * 19 *<br />
Lithuania 10 12 7 100 100 100 6 8 4<br />
Luxembourg 32 z 33 z 31 z 100 z 100 z 100 z 22 z 22 z 21 z<br />
Malta 8 9 7 96 97 96 4 5 4<br />
Monaco 12 14 10 44 46 42 ... ... ...<br />
Montenegro 33 35 30 . y . y . y ... ... ...<br />
Netherl<strong>and</strong>s 48 y 50 y 46 y 100 100 100 25 y 27 y 24 y<br />
Norway 29 34 24 100 100 100 17 21 14<br />
Pol<strong>and</strong> 28 z 34 z 22 z 100 z 100 z 100 z 15 z 19 z 12 z<br />
Portugal 28 31 24 100 100 100 17 20 14<br />
Republic of Moldova 2 13 15 11 100 100 100 6 * 6 * 5 *<br />
Romania 29 32 25 100 100 100 21 z 24 z 18 z<br />
Russian Federation 16 19 13 100 100 100 ... ... ...<br />
San Marino 2 22 y 30 y 14 y . y . y . y ... ... ...<br />
Serbia 2 37 39 36 100 100 100 25 * 26 * 24 *<br />
Slovakia 32 34 30 100 100 100 ... ... ...<br />
Slovenia 42 46 37 . . . 26 29 22<br />
Spain 17 18 16 . . . 9 11 7<br />
Sweden 27 28 26 72 70 74 14 15 12<br />
Switzerl<strong>and</strong> 37 41 33 - - - 23 26 19<br />
The former Yugoslav Rep. of Macedonia 30 y 32 y 27 y . y . y . y ... ... ...<br />
Ukraine 9 11 7 100 y 100 y 100 y 4 6 3<br />
United Kingdom 32 32 32 . . . 18 19 17<br />
United States . . . 100 100 100 . . .<br />
429
1 ANNEX<br />
TABLE 5<br />
Part 1 (Continued)<br />
PARTICIPATION IN TECHNICAL AND VOCATIONAL EDUCATION PROGRAMMES<br />
Share of technical <strong>and</strong> vocational education in total enrolment (%) by level<br />
Total secondary education<br />
Post-secondary non-tertiary education<br />
Percentage of youth (15–24) enrolled in<br />
secondary technical <strong>and</strong> vocational education (%)<br />
School year ending in<br />
2014<br />
School year ending in<br />
2014<br />
School year ending in<br />
2014<br />
Country or territory<br />
Total Male Female Total Male Female Total Male Female<br />
Latin America <strong>and</strong> the Caribbean<br />
Anguilla ... ... ... ... ... ... ... ... ...<br />
Antigua <strong>and</strong> Barbuda 4 5 3 53 y 53 y 52 y 2 2 1<br />
Argentina . z . z . z . z . z . z . z . z . z<br />
Aruba 13 y 16 y 9 y . . . ... ... ...<br />
Bahamas ... ... ... ... ... ... ... ... ...<br />
Barbados . . . 66 72 60 . . .<br />
Belize 3 3 3 . z . z . z 2 2 2<br />
Bermuda . . . . . . . . .<br />
Bolivia, Plurinational States of - z - z - z . z . z . z - z - z - z<br />
Brazil 2 4 z 3 z 4 z 100 z 100 z 100 z 2 *, z 2 *, z 2 *, z<br />
British Virgin Isl<strong>and</strong>s 0,9 1 1 ... ... ... 0 * ... ...<br />
Cayman Isl<strong>and</strong>s . z . z . z . y . y . y ... ... ...<br />
Chile 21 22 20 . . . 10 10 10<br />
Colombia 7 7 8 . . . 4 4 4<br />
Costa Rica 22 21 23 . . . 7 7 7<br />
Cuba 24 29 19 100 100 100 14 z 17 z 11 z<br />
Curaçao 72 z 76 z 69 z 100 z 100 z 100 z ... ... ...<br />
Dominica ... ... ... - - - ... ... ...<br />
Dominican Republic 5 4 6 . . . 2 2 3<br />
Ecuador 32 z 33 z 32 z ... ... ... 19 z 19 z 18 z<br />
El Salvador 18 17 19 . . . 9 9 9<br />
Grenada . . . 100 100 100 . . .<br />
Guatemala 27 25 29 . . . 9 9 9<br />
Guyana 5 y 6 y 4 y 21 y 28 y 15 y ... ... ...<br />
Haiti ... ... ... ... ... ... ... ... ...<br />
Honduras 32 33 31 . . . 7 7 8<br />
Jamaica . . . 84 86 82 . . .<br />
Mexico 17 y 15 y 18 y . . . 3 y 3 y 3 y<br />
Montserrat . . . ... ... ... . . .<br />
Nicaragua ... ... ... ... ... ... ... ... ...<br />
Panama 14 y 15 y 13 y ... ... ... 8 y 8 y 7 y<br />
Paraguay 16 y 16 y 15 y . y . y . y 5 y 5 y 5 y<br />
Peru 1 1 2 . . . 0 0 0<br />
Saint Kitts <strong>and</strong> Nevis . . . 100 100 100 . . .<br />
Saint Lucia 1,0 1 0,4 66 67 66 - z - z - z<br />
Saint-Martin ... ... ... ... ... ... ... ... ...<br />
Saint Vincent <strong>and</strong> the Grenadines ... ... ... 40 y 58 y 31 y ... ... ...<br />
Sint-Maarten 59 67 51 . . . ... ... ...<br />
Suriname 29 z 43 z 18 z ... ... ... 15 z 19 z 11 z<br />
Trinidad <strong>and</strong> Tobago ... ... ... ... ... ... ... ... ...<br />
Turks <strong>and</strong> Caicos Isl<strong>and</strong>s 3 . . . . . . . . .<br />
Uruguay 23 z 28 z 19 z . z . z . z 9 z 10 z 7 z<br />
Venezuela, Bolivarian Republic of 5 5 5 . . . 2 2 2<br />
Northern Africa <strong>and</strong> Western Asia<br />
Algeria ... ... ... . . . ... ... ...<br />
Bahrain 8 14 2 99 99 98 3 5 1<br />
Egypt 21 23 18 18 22 12 10 12 9<br />
Iraq ... ... ... ... ... ... ... ... ...<br />
Israel 20 20 19 . . . 13 13 13<br />
Jordan ... ... ... . y . y . y ... ... ...<br />
Kuwait 2 ** 3 ** 2 ** 100 z 100 z 100 z - y - y - y<br />
Lebanon 15 z 18 z 11 z . z . z . z 5 **, y 6 **, y 4 **, y<br />
Libya ... ... ... ... ... ... ... ... ...<br />
Morocco 6 y 7 y 5 y 100 100 100 2 **, y ... 2 **, y<br />
Oman 3 0,02 0,04 - . . . - - -<br />
Palestine 0,4 0,7 0,1 100 100 100 0 0 0<br />
Qatar 0,7 1 - . . . ... ... ...<br />
Saudi Arabia 5 ** 8 ** 2 ** . . . 2 ** 2 ** 1 **<br />
Sudan 1 z 2 z 1 z . z . z . z ... ... ...<br />
Syrian Arab Republic 5 z 6 z 4 z 86 z 92 z 77 z 2 z 2 z 2 z<br />
Tunisia 6 ... ... 100 ... ... ... ... ...<br />
Turkey 21 z 23 z 20 z . z . z . z 13 z 14 z 12 z<br />
United Arab Emirates 2 2 1 . . . ... ... ...<br />
Yemen 0,7 z 1 z 0 z . z . z . z 0 **, y ... ...<br />
The Pacific<br />
Australia 33 37 30 100 100 100 11 z 14 z 8 z<br />
Cook Isl<strong>and</strong>s 2 4 y 6 y 2 y . . . 3 *, y 5 *, y 2 *, y<br />
Fiji 1 y 2 y 1 y 100 z 100 z 100 z 1 y 1 y 0 y<br />
Kiribati ... ... ... . . . ... ... ...<br />
Marshall Isl<strong>and</strong>s ... ... ... ... ... ... ... ... ...<br />
Micronesia (Federated States of) ... ... ... . . . ... ... ...<br />
Nauru . . . . . . . * . * . *<br />
New Zeal<strong>and</strong> 17 16 19 100 z 100 z 100 z 6 7 6<br />
Niue ... ... ... . . . ... ... ...<br />
Palau 2 . . . ... ... ... . * . * . *<br />
Papua New Guinea 8 y 10 y 5 y ... ... ... ... ... ...<br />
430
STATISTICAL TABLES<br />
1<br />
TABLE 5<br />
Part 1 (Continued)<br />
PARTICIPATION IN TECHNICAL AND VOCATIONAL EDUCATION PROGRAMMES<br />
Share of technical <strong>and</strong> vocational education in total enrolment (%) by level<br />
Total secondary education<br />
Post-secondary non-tertiary education<br />
Percentage of youth (15–24) enrolled in<br />
secondary technical <strong>and</strong> vocational education (%)<br />
School year ending in<br />
2014<br />
School year ending in<br />
2014<br />
School year ending in<br />
2014<br />
Country or territory<br />
Total Male Female Total Male Female Total Male Female<br />
Samoa . . . . . . . . .<br />
Solomon Isl<strong>and</strong>s . y . y . y . y . y . y . y . y . y<br />
Tokelau ... ... ... ... ... ... ... ... ...<br />
Tonga 3 6 1 ... ... ... 2 4 1<br />
Tuvalu - - - . . . - * - * - *<br />
Vanuatu ... ... ... ... ... ... ... ... ...<br />
Southern Asia<br />
Afghanistan 1,0 1 0,2 93 94 92 0 1 0<br />
Bangladesh 3 z 4 z 2 z 95 z 96 z 86 z 1 **, z 1 **, z 1 **, z<br />
Bhutan 2 2 1 100 z 100 z 100 z - - -<br />
India 1 z 2 z 0,5 z 100 z 100 z 100 z ... ... ...<br />
Iran, Islamic Republic of 15 19 11 100 y 100 y 100 y 6 7 4<br />
Maldives ... ... ... ... ... ... ... ... ...<br />
Nepal ... ... ... . . . - - -<br />
Pakistan 3 3 3 100 100 100 1 1 1<br />
Sri Lanka 6 z 6 z 5 z 100 z 100 z 100 z ... ... ...<br />
Sub-Saharan Africa<br />
Angola ... ... ... ... ... ... ... ... ...<br />
Benin 3 3 3 ... ... ... 1 z 1 z 1 z<br />
Botswana 5 z 6 z 4 z ... ... ... - z - z - z<br />
Burkina Faso 3 3 3 100 z 100 z 100 z 1 z 1 z 1 z<br />
Burundi 6 7 6 . . . 2 2 1<br />
Cabo Verde 3 4 2 100 100 100 1 2 1<br />
Cameroon 22 26 18 16 18 14 7 9 5<br />
Central African Republic 3 y 3 y 3 y . y . y . y 0 y 0 y 0 y<br />
Chad 1 y 1 y 2 y ... ... ... ... ... ...<br />
Comoros 0,5 z 1 z 0,1 z ... ... ... - z - z - z<br />
Congo 10 y 10 y 10 y ... ... ... ... ... ...<br />
Côte d’Ivoire 7 6 8 ... ... ... ... ... ...<br />
Democratic Rep. of the Congo 19 20 17 . . . ... ... ...<br />
Djibouti 7 8 6 . z . z . z ... ... ...<br />
Equatorial Guinea ... ... ... ... ... ... ... ... ...<br />
Eritrea 1 z 1 z 1 z 100 z 100 z 100 z 0 z 0 z 0 z<br />
Ethiopia 4 y 4 y 5 y ... ... ... ... ... ...<br />
Gabon ... ... ... ... ... ... ... ... ...<br />
Gambia ... ... ... 100 y 100 y 100 y ... ... ...<br />
Ghana 2 3 1 ... ... ... 1 ** 1 ** 0 **<br />
Guinea 4 3 4 . . . 1 1 1<br />
Guinea-Bissau ... ... ... ... ... ... ... ... ...<br />
Kenya ... ... ... 81 y 84 y 76 y - y - y - y<br />
Lesotho 2 2 2 100 100 100 - - -<br />
Liberia ... ... ... ... ... ... ... ... ...<br />
Madagascar 2 2 1 100 100 100 1 1 0<br />
Malawi . . . 100 y 100 y 100 y . . .<br />
Mali 13 15 12 100 100 100 4 5 3<br />
Mauritania 1 1 1 . . . 0 0 0<br />
Mauritius 14 18 10 32 45 20 ... ... ...<br />
Mozambique 5 6 4 . . . 1 1 0<br />
Namibia ... ... ... ... ... ... ... ... ...<br />
Niger 8 6 12 100 100 100 1 1 1<br />
Nigeria ... ... ... ... ... ... ... ... ...<br />
Rw<strong>and</strong>a 15 17 13 100 100 100 ... ... ...<br />
Sao Tome <strong>and</strong> Principe 7 8 7 . . . - y - y - y<br />
Senegal ... ... ... . y . y . y ... ... ...<br />
Seychelles 4 6 2 87 87 86 2 3 1<br />
Sierra Leone ... ... ... ... ... ... ... ... ...<br />
Somalia ... ... ... ... ... ... ... ... ...<br />
South Africa 7 ** 8 ** 7 ** 100 ** 100 ** 100 ** 3 z 3 z 3 z<br />
South Sudan ... ... ... ... ... ... ... ... ...<br />
Swazil<strong>and</strong> 0,4 z 0,6 z 0,3 z 100 z 100 z 100 z - z - z - z<br />
Togo ... ... ... ... ... ... ... ... ...<br />
Ug<strong>and</strong>a 4 z 5 z 4 z . z . z . z ... ... ...<br />
United Republic of Tanzania 12 z 12 z 12 z 84 y 83 y 85 y ... ... ...<br />
Zambia ... ... ... . z . z . z ... ... ...<br />
Zimbabwe . z . z . z ... ... ... . z . z . z 431
1 ANNEX<br />
TABLE 5<br />
Part 1 (Continued)<br />
PARTICIPATION IN TECHNICAL AND VOCATIONAL EDUCATION PROGRAMMES<br />
Share of technical <strong>and</strong> vocational education in total enrolment (%) by level<br />
Total secondary education<br />
Post-secondary non-tertiary education<br />
Percentage of youth (15–24) enrolled in<br />
secondary technical <strong>and</strong> vocational education (%)<br />
School year ending in<br />
2014<br />
School year ending in<br />
2014<br />
School year ending in<br />
2014<br />
Country or territory<br />
Total Male Female Total Male Female Total Male Female<br />
Weighted Average Median Median<br />
World 10.7 ** 11.6 ** 9.7 ** 95 96 92 3 4 2<br />
Countries in transition 15.8 17.5 13.9 100 100 100 6 7 5<br />
Developed countries 17.0 18.6 15.2 100 100 100 14 15 12<br />
Developing countries 9.3 ** 10.1 ** 8.5 ** . . . 1 1 1<br />
Caucasus <strong>and</strong> Central Asia 14.0 ** 14.3 ** 13.7 ** 100 100 100 6 6 5<br />
Eastern <strong>and</strong> South-eastern Asia 17.3 18.6 15.9 53 60 42 5 5 5<br />
Eastern Asia 19.9 20.8 18.9 53 60 42 5 5 4<br />
South-eastern Asia 11.7 13.9 9.6 50 50 50 4 ... ...<br />
Europe <strong>and</strong> Northern America 16.9 18.7 15.0 100 100 100 14 16 12<br />
Latin America <strong>and</strong> the Caribbean 8.9 ** 8.4 ** 9.4 ** . . . 2 2 2<br />
Caribbean 8.7 ** 10.0 ** 7.5 ** 46 56 42 . . .<br />
Latin America 8.9 ** 8.3 ** 9.4 ** . . . 6 6 6<br />
Northern Africa <strong>and</strong> Western Asia 12.8 ** 14.1 ** 11.3 ** . . . 2 4 2<br />
Northern Africa 13.3 ** 15.2 ** 11.4 ** 18 22 12 ... ... ...<br />
Western Asia 12.3 ** 13.3 ** 11.1 ** . . . 1.9 2.5 1.0<br />
Pacific 26.1 28.3 23.6 . . . 0.4 0.7 0.2<br />
Southern Asia 2.1 ** 2.9 ** 1.3 ** 100 100 100 0.7 0.9 0.3<br />
Sub-Saharan Africa 6.5 ** 7.2 ** 5.7 ** 82 84 81 0.6 0.7 0.4<br />
Conflict-affected countries 5.7 ** 6.8 ** 4.6 ** . . . 1.2 ... ...<br />
Countries with low income 5.8 ** 6.3 ** 5.2 ** 93 94 92 ... ... ...<br />
Countries with middle income 10.0 ** 10.9 ** 9.1 ** 21 25 15 2 3 2<br />
Lower middle 4.8 ** 5.7 ** 3.9 ** 19 25 15 1.0 1.2 0.9<br />
Upper middle 16.7 17.6 15.7 32 45 20 5 5 4<br />
Countries with high income 14.9 16.5 13.2 66 70 57 9 10 7<br />
432
STATISTICAL TABLES<br />
1<br />
TABLE 5<br />
SDG 4, Target 4.3 – Universal access to technical, vocational <strong>and</strong> tertiary education<br />
By 2030, ensure equal access for all women <strong>and</strong> men to affordable quality technical, vocational <strong>and</strong> tertiary education, including university – part 2<br />
ACCESS, PARTICIPATION IN TERTIARY EDUCATION<br />
PARTICIPATION IN EDUCATION AND<br />
TRAINING<br />
Transition from upper secondary to<br />
tertiary education<br />
(ISCED levels 5, 6 <strong>and</strong> 7 combined) (%)<br />
Gross intake rate (GIR)<br />
in tertiary education (%)<br />
Total students enrolled<br />
in tertiary education<br />
Gross enrolment ratio (GER)<br />
in tertiary education (%)<br />
Participation rate of adults (25–64) 1<br />
in formal or non-formal education <strong>and</strong><br />
training in the last 12 months<br />
School year ending in<br />
2014<br />
School year ending in<br />
2014<br />
School year ending in<br />
2014<br />
School year ending in<br />
2014<br />
Most recent survey year<br />
2011<br />
Country or territory<br />
Total Male Female Total Male Female Total (000) F % Total Male Female Total Male Female<br />
Caucasus <strong>and</strong> Central Asia<br />
Armenia ... ... ... ... ... ... 113 55 44 40 48 ... ... ...<br />
Azerbaijan 2 ... ... ... ... ... ... 195 52 23 * 22 * 25 * ... ... ...<br />
Georgia ... ... ... ... ... ... 121 55 39 35 44 ... ... ...<br />
Kazakhstan ... ... ... ... ... ... 658 55 46 40 52 ... ... ...<br />
Kyrgyzstan ... ... ... ... ... ... 268 56 46 40 52 ... ... ...<br />
Tajikistan ... ... ... ... ... ... 225 39 26 32 21 ... ... ...<br />
Turkmenistan ... ... ... ... ... ... 44 39 8 10 6 ... ... ...<br />
Uzbekistan ... ... ... ... ... ... ... ... ... ... ... ... ... ...<br />
Eastern <strong>and</strong> South-eastern Asia<br />
Brunei Darussalam ... ... ... ... ... ... 11 61 32 24 40 ... ... ...<br />
Cambodia ... ... ... ... ... ... ... ... ... ... ... ... ... ...<br />
China ... ... ... ... ... ... 41,924 51 39 37 43 ... ... ...<br />
DPR Korea ... ... ... ... ... ... ... ... ... ... ... ... ... ...<br />
Hong Kong, China ... ... ... ... ... ... 305 52 69 64 74<br />
Indonesia 44 39 49 30 29 32 6,463 52 31 29 33 ... ... ...<br />
Japan 85 83 88 ... ... ... 3,863 z 47 z 62 z 65 z 60 z ... ... ...<br />
Lao People’s Democratic Republic ... ... ... ... ... ... 132 48 17 18 17 ... ... ...<br />
Macao, China ... ... ... ... ... ... 30 56 69 60 79 ... ... ...<br />
Malaysia 41 37 43 35 ... ... 860 57 30 ... ... ... ... ...<br />
Mongolia ... ... ... 84 69 99 175 58 64 53 76 ... ... ...<br />
Myanmar ... ... ... ... ... ... 634 y 55 y 14 y 12 y 15 y ... ... ...<br />
Philippines ... ... ... ... ... ... 3,563 55 36 31 40 ... ... ...<br />
Republic of Korea ... ... ... ... ... ... 3,342 z 40 z 95 z 108 z 81 z ... ... ...<br />
Singapore 3 ... ... ... ... ... ... 255 z 50 z ... ... ... ... ... ...<br />
Thail<strong>and</strong> ... ... ... ... ... ... 2,433 57 53 45 60 ... ... ...<br />
Timor-Leste ... ... ... ... ... ... ... ... ... ... ... ... ... ...<br />
Viet Nam ... ... ... ... ... ... 2,692 50 30 30 31 ... ... ...<br />
Europe <strong>and</strong> Northern America<br />
Albania 99 96 102 64 55 72 174 57 63 52 74 ... ... ...<br />
Andorra 3 29 24 33 ... ... ... 0.5 57 ... ... ... ... ... ...<br />
Austria 75 67 82 75 68 82 421 53 80 73 88 48 49 48<br />
Belarus 78 z 63 z 98 z 90 z 80 z 101 z 518 56 89 76 102 ... ... ...<br />
Belgium 94 z 85 z 103 z ... ... ... 496 56 73 64 83 38 39 37<br />
Bosnia <strong>and</strong> Herzegovina ... ... ... ... ... ... 112 56 48 41 55 ... ... ...<br />
Bulgaria 105 98 111 81 76 86 283 54 71 63 79 26 28 25<br />
Canada ... ... ... ... ... ... ... ... ... ... ... ... ... ...<br />
Croatia ... ... ... ... ... ... 166 57 70 59 81 ... ... ...<br />
Cyprus 2 ... ... ... ... ... ... 34 57 53 * 44 * 63 * 42 43 42<br />
Czech Republic 125 115 134 77 63 92 419 57 66 55 77 37 37 37<br />
Denmark 92 89 94 87 78 97 301 57 82 68 95 59 55 62<br />
Estonia ... ... ... ... ... ... 65 z 58 z 73 z 59 z 88 z 50 46 53<br />
Finl<strong>and</strong> 40 z 39 z 40 z 54 z 48 z 61 z 306 54 89 81 97 56 49 63<br />
France ... ... ... ... ... ... 2,389 55 64 58 71 51 50 51<br />
Germany 78 75 82 67 66 69 2,912 47 65 68 63 50 53 51<br />
Greece ... ... ... ... ... ... 659 z 49 z 110 z 110 z 110 z 12 10 13<br />
Hungary 65 62 68 48 41 55 329 55 53 47 60 41 43 39<br />
Icel<strong>and</strong> ... ... ... ... ... ... 19 y 62 y 82 y 61 y 105 y ... ... ...<br />
Irel<strong>and</strong> ... ... ... ... ... ... 199 z 50 z 73 z 71 z 75 z 24 25 24<br />
Italy ... ... ... 47 z 40 z 54 z 1,873 z 57 z 63 z 53 z 74 z 36 37 34<br />
Latvia ... ... ... ... ... ... 90 58 67 55 79 32 27 37<br />
Liechtenstein 2 ... ... ... ... ... ... 0.8 32 37 * 51 * 24 * ... ... ...<br />
Lithuania ... ... ... 78 70 87 148 58 69 56 82 29 23 33<br />
Luxembourg 68 z 72 z 66 z 37 z 34 z 41 z 6 y 52 y 19 y 18 y 21 y 70 72 69<br />
Malta ... ... ... 67 65 68 13 55 45 42 48 36 38 34<br />
Monaco ... ... ... ... ... ... ... ... ... ... ... ... ... ...<br />
Montenegro ... ... ... ... ... ... ... ... ... ... ... ... ... ...<br />
Netherl<strong>and</strong>s ... ... ... ... ... ... 794 y 51 y 79 y 75 y 82 y 59 63 56<br />
Norway 133 144 125 81 72 90 264 58 77 63 91 60 59 61<br />
Pol<strong>and</strong> 102 99 104 ... ... ... 1,903 z 60 z 71 z 56 z 87 z 24 23 25<br />
Portugal 67 59 75 66 57 75 362 54 66 61 70 44 44 45<br />
Republic of Moldova 2 ... ... ... ... ... ... 122 z 55 z 41 *, z 36 *, z 47 *, z ... ... ...<br />
Romania 110 z 121 z 102 z 60 z 55 z 66 z 579 54 53 48 59 8 8 8<br />
Russian Federation ... ... ... 90 z ... ... 6,996 53 79 72 86 ... ... ...<br />
San Marino 2 ... ... ... ... ... ... 0.9 y 56 y 60 *, y 50 *, y 70 *, y ... ... ...<br />
Serbia 2 ... ... ... ... ... ... 243 55 58 * 51 * 66 * 17 17 16<br />
Slovakia 91 z 83 z 97 z 64 53 75 198 60 53 42 65 42 41 42<br />
Slovenia ... ... ... 79 z 72 z 87 z 91 58 83 68 98 36 35 38<br />
Spain 99 100 98 79 74 85 1,982 53 89 82 97 38 39 37<br />
Sweden 76 z 64 z 88 z 64 53 76 429 59 62 49 76 72 69 74<br />
Switzerl<strong>and</strong> 76 z 79 z 74 z 80 z 80 z 80 z 290 50 57 57 58 66 65 66<br />
TFYR Macedonia ... ... ... ... ... ... 61 z 55 z 39 z 35 z 44 z ... ... ...<br />
Ukraine ... ... ... ... ... ... 2,146 52 82 77 88 ... ... ...<br />
United Kingdom ... ... ... 64 56 72 2,353 56 56 49 64 36 34 38<br />
United States 65 63 67 52 49 56 19,700 56 87 73 101 ... ... ...<br />
433
1 ANNEX<br />
TABLE 5<br />
Part 2 (Continued)<br />
ACCESS, PARTICIPATION IN TERTIARY EDUCATION<br />
PARTICIPATION IN EDUCATION AND<br />
TRAINING<br />
Transition from upper secondary to<br />
tertiary education<br />
(ISCED levels 5, 6 <strong>and</strong> 7 combined) (%)<br />
Gross intake rate (GIR)<br />
in tertiary education (%)<br />
Total students enrolled<br />
in tertiary education<br />
Gross enrolment ratio (GER)<br />
in tertiary education (%)<br />
Participation rate of adults (25–64) 1<br />
in formal or non-formal education <strong>and</strong><br />
training in the last 12 months<br />
School year ending in<br />
2014<br />
School year ending in<br />
2014<br />
School year ending in<br />
2014<br />
School year ending in<br />
2014<br />
Most recent survey year<br />
2011<br />
434<br />
Country or territory<br />
Total Male Female Total Male Female Total (000) F % Total Male Female Total Male Female<br />
Latin America <strong>and</strong> the Caribbean<br />
Anguilla ... ... ... ... ... ... ... ... ... ... ... ... ... ...<br />
Antigua <strong>and</strong> Barbuda ... ... ... ... ... ... 2 y 69 y 23 y 15 y 31 y ... ... ...<br />
Argentina 103 z 105 z 101 z 61 z 52 z 70 z 2,768 z 61 z 80 z 62 z 99 z ... ... ...<br />
Aruba ... ... ... ... ... ... 1 68 17 10 24 ... ... ...<br />
Bahamas ... ... ... ... ... ... ... ... ... ... ... ... ... ...<br />
Barbados ... ... ... ... ... ... ... ... ... ... ... ... ... ...<br />
Belize ... ... ... ... ... ... 8 z 62 z 24 z 18 z 30 z ... ... ...<br />
Bermuda ... ... ... ... ... ... 1 65 27 19 36 ... ... ...<br />
Bolivia, Plurinational States of ... ... ... ... ... ... ... ... ... ... ...<br />
Brazil 2 ... ... ... ... ... ... 7,541 z 57 z 46 *, z 40 *, z 53 *, z ... ... ...<br />
British Virgin Isl<strong>and</strong>s ... ... ... ... ... ... ... ... ... ... ... ... ... ...<br />
Cayman Isl<strong>and</strong>s ... ... ... ... ... ... ... ... ... ... ... ... ... ...<br />
Chile 101 98 103 90 84 96 1,205 52 87 81 92 ... ... ...<br />
Colombia 55 59 52 ... ... ... 2,138 53 51 48 55 ... ... ...<br />
Costa Rica ... ... ... ... ... ... 217 54 53 48 59 ... ... ...<br />
Cuba 39 34 43 22 17 28 302 59 41 32 51 ... ... ...<br />
Curaçao ... ... ... ... ... ... 2 z 70 z 20 z 12 z 28 z ... ... ...<br />
Dominica ... ... ... ... ... ... ... ... ... ... ... ... ... ...<br />
Dominican Republic ... ... ... ... ... ... 456 61 48 36 59 ... ... ...<br />
Ecuador ... ... ... ... ... ... 586 z ... 40 z ... ... ... ... ...<br />
El Salvador 33 31 36 21 20 22 176 53 29 28 30 ... ... ...<br />
Grenada ... ... ... ... ... ... ... ... ... ... ... ... ... ...<br />
Guatemala ... ... ... ... ... ... 294 z 51 z 18 z 18 z 19 z ... ... ...<br />
Guyana ... ... ... ... ... ... 9 y 67 y 12 y 8 y 17 y ... ... ...<br />
Haiti ... ... ... ... ... ... ... ... ... ... ... ... ... ...<br />
Honduras ... ... ... 17 z 15 z 19 z 186 57 21 18 24 ... ... ...<br />
Jamaica ... ... ... ... ... ... 74 z 69 z 28 z 17 z 39 z ... ... ...<br />
Mexico ... ... ... ... ... ... 3,419 49 30 30 30 ... ... ...<br />
Montserrat ... ... ... ... ... ... ... ... ... ... ... ... ... ...<br />
Nicaragua ... ... ... ... ... ... ... ... ... ... ... ... ... ...<br />
Panama ... ... ... ... ... ... 124 z 59 z 39 z 31 z 47 z ... ... ...<br />
Paraguay ... ... ... ... ... ... ... ... ... ... ... ... ... ...<br />
Peru ... ... ... ... ... ... ... ... ... ... ... ... ... ...<br />
Saint Kitts <strong>and</strong> Nevis ... ... ... ... ... ... 3 50 79 78 80 ... ... ...<br />
Saint Lucia ... ... ... ... ... ... 3 67 17 11 23 ... ... ...<br />
Saint-Martin ... ... ... ... ... ... ... ... ... ... ... ... ... ...<br />
Saint Vincent <strong>and</strong> the Grenadines ... ... ... ... ... ... ... ... ... ... ... ... ... ...<br />
Sint-Maarten 14 14 14 ... ... ... 0.2 75 ... ... ... ... ... ...<br />
Suriname ... ... ... ... ... ... ... ... ... ... ... ... ... ...<br />
Trinidad <strong>and</strong> Tobago ... ... ... ... ... ... ... ... ... ... ... ... ... ...<br />
Turks <strong>and</strong> Caicos Isl<strong>and</strong>s 3 ... ... ... ... ... ... 0.3 ... ... ... ... ... ... ...<br />
Uruguay ... ... ... ... ... ... ... ... ... ... ... ... ... ...<br />
Venezuela, Bolivarian Republic of ... ... ... ... ... ... ... ... ... ... ... ... ... ...<br />
Northern Africa <strong>and</strong> Western Asia<br />
Algeria 109 131 98 34 26 42 1,245 60 35 27 42 ... ... ...<br />
Bahrain ... ... ... 54 41 70 38 60 37 24 57 ... ... ...<br />
Egypt 104 112 97 34 33 34 2,544 46 32 33 30 ... ... ...<br />
Iraq ... ... ... ... ... ... ... ... ... ... ... ... ... ...<br />
Israel ... ... ... ... ... ... 377 56 66 57 76 ... ... ...<br />
Jordan ... ... ... ... ... ... 307 y 53 y 48 y 44 y 52 y ... ... ...<br />
Kuwait ... ... ... ... ... ... 72 z 64 z 27 z 20 z 33 z ... ... ...<br />
Lebanon ... ... ... ... ... ... 229 56 43 40 46 ... ... ...<br />
Libya ... ... ... ... ... ... ... ... ... ... ... ... ... ...<br />
Morocco ... ... ... ... ... ... 774 48 25 25 24 ... ... ...<br />
Oman 3 9 10 8 ... ... ... 85 55 ... ... ... ... ... ...<br />
Palestine 91 87 95 58 48 69 214 60 44 35 54 ... ... ...<br />
Qatar ... ... ... ... ... ... 25 64 16 7 46 ... ... ...<br />
Saudi Arabia 110 110 111 78 85 72 1,497 49 61 62 60 ... ... ...<br />
Sudan ... ... ... 13 z 12 z 13 z 640 z 52 z 17 z 16 z 18 z ... ... ...<br />
Syrian Arab Republic ... ... ... ... ... ... 630 z 49 z 33 z 32 z 34 z ... ... ...<br />
Tunisia 116 ... ... 44 32 56 332 61 35 26 43 ... ... ...<br />
Turkey 138 147 130 ... ... ... 4,976 z 46 z 79 z 85 z 73 z 18 21 15<br />
United Arab Emirates 87 87 87 ... ... ... 143 55 22 15 35 ... ... ...<br />
Yemen ... ... ... ... ... ... ... ... ... ... ... ... ... ...<br />
The Pacific<br />
Australia ... ... ... ... ... ... 1,390 z 57 z 87 z 72 z 102 z ... ... ...<br />
Cook Isl<strong>and</strong>s 2 ... ... ... ... ... ... 0.7 74 60 * 29 * 96 * ... ... ...<br />
Fiji ... ... ... ... ... ... ... ... ... ... ... ... ... ...<br />
Kiribati ... ... ... ... ... ... . y . y . y . y . y ... ... ...<br />
Marshall Isl<strong>and</strong>s ... ... ... ... ... ... 1 y 49 y 43 y 45 y 41 y ... ... ...<br />
Micronesia (Federated States of) ... ... ... ... ... ... ... ... ... ... ... ... ... ...<br />
Nauru ... ... ... ... ... ... ... ... ... ... ... ... ... ...<br />
New Zeal<strong>and</strong> ... ... ... ... ... ... 261 57 81 68 94 ... ... ...<br />
Niue ... ... ... ... ... ... ... ... ... ... ... ... ... ...<br />
Palau 2 ... ... ... ... ... ... 0.9 z 58 z 62 *, z 49 *, z 76 *, z ... ... ...<br />
Papua New Guinea ... ... ... ... ... ... ... ... ... ... ... ... ... ...
STATISTICAL TABLES<br />
1<br />
TABLE 5<br />
Part 2 (Continued)<br />
ACCESS, PARTICIPATION IN TERTIARY EDUCATION<br />
PARTICIPATION IN EDUCATION AND<br />
TRAINING<br />
Transition from upper secondary to<br />
tertiary education<br />
(ISCED levels 5, 6 <strong>and</strong> 7 combined) (%)<br />
Gross intake rate (GIR)<br />
in tertiary education (%)<br />
Total students enrolled<br />
in tertiary education<br />
Gross enrolment ratio (GER)<br />
in tertiary education (%)<br />
Participation rate of adults (25–64) 1<br />
in formal or non-formal education <strong>and</strong><br />
training in the last 12 months<br />
School year ending in<br />
2014<br />
School year ending in<br />
2014<br />
School year ending in<br />
2014<br />
School year ending in<br />
2014<br />
Most recent survey year<br />
2011<br />
Country or territory<br />
Total Male Female Total Male Female Total (000) F % Total Male Female Total Male Female<br />
Samoa ... ... ... ... ... ... ... ... ... ... ... ... ... ...<br />
Solomon Isl<strong>and</strong>s ... ... ... ... ... ... ... ... ... ... ... ... ... ...<br />
Tokelau ... ... ... ... ... ... ... ... ... ... ... ... ... ...<br />
Tonga ... ... ... ... ... ... ... ... ... ... ... ... ... ...<br />
Tuvalu ... ... ... ... ... ... ... ... ... ... ... ... ... ...<br />
Vanuatu ... ... ... ... ... ... ... ... ... ... ... ... ... ...<br />
Southern Asia<br />
Afghanistan 41 51 23 15 23 6 263 20 9 13 4 ... ... ...<br />
Bangladesh ... ... ... ... ... ... 2,068 42 13 15 11 ... ... ...<br />
Bhutan 32 z 36 z 28 z 18 z 20 z 15 z 9 z 41 z 11 z 13 z 9 z ... ... ...<br />
India ... ... ... 39 z 40 z 37 z 28,175 z 46 z 24 z 25 z 23 z ... ... ...<br />
Iran, Islamic Republic of ... ... ... 69 73 65 4,685 47 66 68 64 ... ... ...<br />
Maldives ... ... ... ... ... ... ... ... ... ... ... ... ... ...<br />
Nepal ... ... ... ... ... ... 459 ... 16 ... ... ... ... ...<br />
Pakistan ... ... ... ... ... ... 1,932 50 10 10 11 ... ... ...<br />
Sri Lanka 57 z 61 z 54 z 29 19 39 324 60 21 17 25 ... ... ...<br />
Sub-Saharan Africa<br />
Angola ... ... ... ... ... ... 219 z 45 z 10 z 11 z 9 z ... ... ...<br />
Benin ... ... ... ... ... ... 145 z 27 z 15 z 22 z 8 z ... ... ...<br />
Botswana ... ... ... ... ... ... 61 57 28 23 32 ... ... ...<br />
Burkina Faso ... ... ... ... ... ... 74 z 32 z 5 z 6 z 3 z ... ... ...<br />
Burundi ... ... ... 8 z 13 z 4 z 45 z 31 z 4 z 6 z 3 z ... ... ...<br />
Cabo Verde 83 85 82 38 32 44 13 59 23 19 27 ... ... ...<br />
Cameroon ... ... ... ... ... ... ... ... ... ... ... ... ... ...<br />
Central African Republic ... ... ... ... ... ... 13 y 27 y 3 y 4 y 1 y ... ... ...<br />
Chad ... ... ... ... ... ... 42 ** 16 ** 3 ** 6 ** 1 ** ... ... ...<br />
Comoros ... ... ... 20 z ... ... 6 z 46 z 9 z 9 z 8 z ... ... ...<br />
Congo ... ... ... ... ... ... 37 z 43 z 10 z 11 z 8 z ... ... ...<br />
Côte d’Ivoire ... ... ... ... ... ... 177 37 9 11 6 ... ... ...<br />
Democratic Rep. of the Congo ... ... ... ... ... ... 443 z 31 z 7 z 9 z 4 z ... ... ...<br />
Djibouti ... ... ... ... ... ... ... ... ... ... ... ... ... ...<br />
Equatorial Guinea ... ... ... ... ... ... ... ... ... ... ... ... ... ...<br />
Eritrea ... ... ... 5 5 4 13 33 3 3 2 ... ... ...<br />
Ethiopia ... ... ... ... ... ... 757 32 8 11 5 ... ... ...<br />
Gabon ... ... ... ... ... ... ... ... ... ... ... ... ... ...<br />
Gambia ... ... ... ... ... ... 5 y 41 y 3 y 4 y 3 y ... ... ...<br />
Ghana ... ... ... 18 21 14 402 39 16 19 12 ... ... ...<br />
Guinea ... ... ... 17 23 11 118 30 11 15 7 ... ... ...<br />
Guinea-Bissau ... ... ... ... ... ... ... ... ... ... ... ... ... ...<br />
Kenya ... ... ... ... ... ... ... ... ... ... ... ... ... ...<br />
Lesotho ... ... ... 12 10 14 24 59 10 8 12 ... ... ...<br />
Liberia ... ... ... ... ... ... 44 y 38 y 12 y 14 y 9 y ... ... ...<br />
Madagascar ... ... ... ... ... ... 97 z 49 z 4 z 4 z 4 z ... ... ...<br />
Malawi ... ... ... ... ... ... ... ... ... ... ... ... ... ...<br />
Mali ... ... ... ... ... ... 97 y 29 y 7 y 10 y 4 y ... ... ...<br />
Mauritania ... ... ... 6 7 5 21 33 6 7 4 ... ... ...<br />
Mauritius ... ... ... ... ... ... 40 55 39 35 43 ... ... ...<br />
Mozambique ... ... ... ... ... ... 157 42 6 7 5 ... ... ...<br />
Namibia ... ... ... ... ... ... ... ... ... ... ... ... ... ...<br />
Niger ... ... ... ... ... ... 22 y 28 y 2 y 3 y 1 y ... ... ...<br />
Nigeria ... ... ... ... ... ... ... ... ... ... ... ... ... ...<br />
Rw<strong>and</strong>a ... ... ... ... ... ... 77 z 45 z 8 z 8 z 7 z ... ... ...<br />
Sao Tome <strong>and</strong> Principe ... ... ... ... ... ... 2 50 13 13 14 ... ... ...<br />
Senegal ... ... ... ... ... ... ... ... ... ... ... ... ... ...<br />
Seychelles ... ... ... 16 10 22 0.5 70 6 4 9 ... ... ...<br />
Sierra Leone ... ... ... ... ... ... ... ... ... ... ... ... ... ...<br />
Somalia ... ... ... ... ... ... ... ... ... ... ... ... ... ...<br />
South Africa ... ... ... ... ... ... 1,036 z 58 z 20 z 16 z 24 z ... ... ...<br />
South Sudan ... ... ... ... ... ... ... ... ... ... ... ... ... ...<br />
Swazil<strong>and</strong> ... ... ... ... ... ... 8 z 51 z 5 z 5 z 5 z ... ... ...<br />
Togo ... ... ... ... ... ... 67 29 10 14 6 ... ... ...<br />
Ug<strong>and</strong>a ... ... ... ... ... ... ... ... ... ... ... ... ... ...<br />
United Republic of Tanzania ... ... ... ... ... ... 158 z 35 z 4 z 5 z 2 z ... ... ...<br />
Zambia ... ... ... ... ... ... ... ... ... ... ... ... ... ...<br />
Zimbabwe ... ... ... 8 z 9 z 7 z 94 z 46 z 6 z 6 z 5 z ... ... ...<br />
435
1 ANNEX<br />
TABLE 5<br />
Part 2 (Continued)<br />
ACCESS, PARTICIPATION IN TERTIARY EDUCATION<br />
PARTICIPATION IN EDUCATION AND<br />
TRAINING<br />
Transition from upper secondary to<br />
tertiary education<br />
(ISCED levels 5, 6 <strong>and</strong> 7 combined) (%)<br />
Gross intake rate (GIR)<br />
in tertiary education (%)<br />
Total students enrolled<br />
in tertiary education<br />
Gross enrolment ratio (GER)<br />
in tertiary education (%)<br />
Participation rate of adults (25–64) 1<br />
in formal or non-formal education <strong>and</strong><br />
training in the last 12 months<br />
School year ending in<br />
2014<br />
School year ending in<br />
2014<br />
School year ending in<br />
2014<br />
School year ending in<br />
2014<br />
Most recent survey year<br />
2011<br />
Country or territory<br />
Total Male Female Total Male Female Total (000) F % Total Male Female Total Male Female<br />
Median Median Sum % F Weighted Average Median<br />
World ... ... ... ... ... ... 207,272 ** 51 ** 34 ** 33 ** 36 ** ... ... ...<br />
Countries in transition ... ... ... ... ... ... 12,396 53 58 53 63 ... ... ...<br />
Developed countries ... ... ... 67 63 75 47,264 55 74 66 83 ... ... ...<br />
Developing countries ... ... ... ... ... ... 147,612 ** 50 ** 29 ** 28 ** 29 ** ... ... ...<br />
Caucasus <strong>and</strong> Central Asia ... ... ... ... ... ... 1,956 50 24 24 25 ... ... ...<br />
Eastern <strong>and</strong> South-eastern Asia ... ... ... 20 18 25 67,351 51 39 37 41 ... ... ...<br />
Eastern Asia ... ... ... ... ... ... 50,250 50 42 40 44 ... ... ...<br />
South-eastern Asia ... ... ... ... ... ... 17,101 53 31 29 34 ... ... ...<br />
Europe <strong>and</strong> Northern America ... ... ... 67 ... ... 51,870 55 75 66 85 39 40 39<br />
Latin America <strong>and</strong> the Caribbean ... ... ... ... ... ... 23,845 ** 56 ** 44 ** 39 ** 50 ** ... ... ...<br />
Caribbean ... ... ... ... ... ... 935 ** 59 ** 29 ** 23 ** 35 ** ... ... ...<br />
Latin America ... ... ... ... ... ... 22,910 ** 56 ** 45 ** 40 ** 51 ** ... ... ...<br />
Northern Africa <strong>and</strong> Western Asia ... ... ... ... ... ... 15,261 ** 49 ** 37 ** 38 ** 37 ** ... ... ...<br />
Northern Africa 109 ... ... 34 29 38 5,866 51 29 28 30 ... ... ...<br />
Western Asia ... ... ... ... ... ... 9,395 ** 47 ** 46 ** 47 ** 44 ** ... ... ...<br />
Pacific ... ... ... ... ... ... 1,748 57 62 ** 52 ** 72 ** ... ... ...<br />
Southern Asia ... ... ... 29 23 37 38,097 ** 46 ** 23 ** 24 ** 22 ** ... ... ...<br />
Sub-Saharan Africa ... ... ... ... ... ... 7,145 ** 41 ** 8 ** 10 ** 7 ** ... ... ...<br />
Conflict-affected countries ... ... ... ... ... ... 70,521 ** 48 ** 26 ** 26 ** 26 ** ... ... ...<br />
Countries with low income ... ... ... ... ... ... 4,460 ** 35 ** 8 ** 10 ** 5 ** ... ... ...<br />
Countries with middle income ... ... ... ... ... ... 137,371 ** 50 ** 30 ** 29 ** 31 ** ... ... ...<br />
Lower middle ... ... ... ... ... ... 58,642 ** 48 ** 22 ** 22 ** 22 ** ... ... ...<br />
Upper middle ... ... ... ... ... ... 78,729 52 41 38 44 ... ... ...<br />
Countries with high income ... ... ... ... ... ... 65,441 54 74 66 83 ... ... ...<br />
Source: UIS database, except where noted. GIR <strong>and</strong> GER are based on the United Nations Population Division estimates,<br />
revision 2015 (United Nations, 2015), median variant.<br />
Note: The country groupings by level of income are as defined by the World Bank but include only countries listed in the<br />
table. They are based on the list of countries by income group as revised in July 2015.<br />
1. Data are from 2011 Eurostat Adult Education Survey, which focuses on <strong>people</strong> aged 25 to 64 living in private households.<br />
2. National population data were used to calculate GIR <strong>and</strong> GER due to inconsistencies in the United Nations population<br />
data or lack of United Nations population by age.<br />
3. GIR <strong>and</strong> GER were not calculated due to inconsistencies in the United Nations population data or lack of United Nations<br />
population by age.<br />
Data in bold are for the school year ending in 2015.<br />
(z) Data are for the school year ending in 2013.<br />
(y) Data are for the school year ending in 2012.<br />
(*) National estimate.<br />
(**) For country level data: UIS partial estimate; for regional <strong>and</strong> other country grouping sums <strong>and</strong> weighted averages:<br />
partial imputation due to incomplete country coverage (between 33% <strong>and</strong> 60% of population for the region or other<br />
country grouping).<br />
(-) Magnitude nil or negligible<br />
(.) The category is not applicable or does not exist.<br />
(…) No data are available.<br />
436
STATISTICAL TABLES<br />
1<br />
TABLE 6<br />
SDG 4, Target 4.4 – Youth <strong>and</strong> adult skills for employment, decent jobs <strong>and</strong> entrepreneurship<br />
By 2030, substantially increase the number of youth <strong>and</strong> adults who have relevant skills, including technical <strong>and</strong> vocational skills, for employment, decent jobs <strong>and</strong> entrepreneurship<br />
ICT SKILLS ACQUISITION<br />
Percentage of adults (15 <strong>and</strong> over)<br />
with ICT skills by type of skills (%) 1<br />
ADULT EDUCATIONAL ATTAINMENT<br />
Percentage of adults (25 <strong>and</strong> over) (%) who have attained at least:<br />
Sending email<br />
with attached<br />
files<br />
Using basic<br />
arithmetic<br />
formulas in a<br />
spreadsheet<br />
Finding, downloading,<br />
installing<br />
<strong>and</strong> configuring<br />
software<br />
Primary education Lower secondary education Upper secondary education Short-cycle tertiary education<br />
(ISCED level 1 to 8) (ISCED level 2 to 8) (ISCED level 3 to 8) (ISCED level 5 to 8)<br />
2014 2014 2014 2009–2015 2 2009–2015 2 2009–2015 2 2009–2015 2<br />
Country or territory<br />
Total Total Total Total Male Female Total Male Female Total Male Female Total Male Female<br />
Caucasus <strong>and</strong> Central Asia<br />
Armenia ... ... ... 99 100 99 97 97 96 90 90 90 44 42 45<br />
Azerbaijan ... ... ... 99 99 98 96 98 94 89 92 85 25 27 24<br />
Georgia ... ... ... 99 99 99 97 97 96 92 93 91 31 31 31<br />
Kazakhstan 48 17 19 ... ... ... ... ... ... ... ... ... ... ... ...<br />
Kyrgyzstan ... ... ... 98 99 97 96 97 95 88 90 87 18 16 19<br />
Tajikistan ... ... ... ... ... ... ... ... ... ... ... ... ... ... ...<br />
Turkmenistan ... ... ... ... ... ... ... ... ... ... ... ... ... ... ...<br />
Uzbekistan ... ... ... 100 100 100 100 100 100 92 93 90 . . .<br />
Eastern <strong>and</strong> South-eastern Asia<br />
Brunei Darussalam ... ... ... … … … … … … … … … … … …<br />
Cambodia ... ... ... 36 48 25 16 22 10 6 10 3 … … …<br />
China ... ... ... … … … 65 72 59 22 25 19 9 10 8<br />
DPR Korea ... ... ... … … … … … … … … … … … …<br />
Hong Kong, China ... ... ... 95 93 97 77 75 81 61 60 63 21 18 23<br />
Indonesia ... ... ... 77 81 72 47 52 43 31 35 27 9 9 8<br />
Japan ... ... ... 100 100 100 … … … 81 82 79 35 37 32<br />
Lao PDR ... ... ... … … … … … … … … … … … …<br />
Macao, China ... ... ... 88 90 85 69 71 66 45 47 43 17 18 17<br />
Malaysia ... ... ... 91 94 88 68 71 65 51 52 50 … … …<br />
Mongolia ... ... ... 95 95 96 85 84 85 68 64 71 24 20 27<br />
Myanmar ... ... ... … … … … … … … … … … … …<br />
Philippines ... ... ... 84 82 86 70 69 71 58 57 60 27 25 28<br />
Republic of Korea ... ... ... 94 98 91 83 89 77 73 80 66 35 41 30<br />
Singapore 55 24 23 85 88 82 79 82 76 70 72 67 42 46 39<br />
Thail<strong>and</strong> ... ... ... 61 65 58 41 44 39 29 31 28 17 16 17<br />
Timor-Leste ... ... ... … … … … … … … … … … … …<br />
Viet Nam ... ... ... … … … 65 71 59 26 30 21 7 8 6<br />
Europe <strong>and</strong> Northern America<br />
Albania ... ... ... 96 97 94 87 89 85 45 46 44 13 13 12<br />
Andorra ... ... ... 97 97 96 73 74 72 48 48 48 21 21 22<br />
Austria 71 49 38 … … … 99 99 99 78 85 72 26 30 23<br />
Belarus ... ... ... 99 100 99 92 95 89 85 88 82 52 48 54<br />
Belgium 72 43 21 94 95 93 82 85 80 64 66 62 32 31 32<br />
Bosnia <strong>and</strong> Herzegovina ... ... ... 78 87 69 … … … 60 73 48 11 13 10<br />
Bulgaria 42 27 8 … … … 94 96 93 74 75 73 24 20 28<br />
Canada ... ... ... … … … … … … 83 83 83 48 45 51<br />
Croatia 45 37 ... 97 99 95 89 94 85 71 79 63 18 18 18<br />
Cyprus 49 37 15 94 96 92 79 81 77 69 71 68 35 34 36<br />
Czech Republic 70 43 ... 100 100 100 100 100 100 90 94 85 19 20 18<br />
Denmark 83 58 38 100 100 100 91 91 92 77 77 76 33 37 29<br />
Estonia 65 52 33 … … … … … … 90 87 92 37 28 45<br />
Finl<strong>and</strong> 78 63 57 … … … … … … 73 72 73 34 30 37<br />
France 72 52 37 98 98 97 83 86 80 69 72 65 29 28 29<br />
Germany 69 48 37 100 100 100 97 97 97 83 88 78 25 30 20<br />
Greece 47 39 19 95 97 93 68 72 64 56 58 55 23 24 22<br />
Hungary 69 34 12 100 100 99 97 98 96 74 79 70 21 20 22<br />
Icel<strong>and</strong> 84 69 ... ... ... ... ... ... ... ... ... ... ... ... ...<br />
Irel<strong>and</strong> 64 41 ... … … … 83 82 85 66 64 69 32 29 34<br />
Italy 55 36 17 94 96 93 76 81 71 47 48 46 13 12 13<br />
Latvia 59 47 ... 100 100 100 99 99 99 87 85 90 29 22 34<br />
Liechtenstein ... ... ... … … … … … … … … … … … …<br />
Lithuania 57 49 23 99 99 98 93 96 91 83 86 81 31 28 34<br />
Luxembourg 79 63 43 … … … … … … 79 83 76 43 46 40<br />
Malta 55 43 17 98 99 98 77 81 73 36 37 34 16 17 16<br />
Monaco ... ... ... … … … … … … … … … … … …<br />
Montenegro ... ... ... 97 99 96 89 95 84 73 80 65 20 21 18<br />
Netherl<strong>and</strong>s 84 48 39 98 99 98 89 91 87 69 74 65 30 33 28<br />
Norway 81 65 50 100 100 100 99 99 99 77 78 76 36 34 38<br />
Pol<strong>and</strong> 50 36 25 99 99 98 84 87 81 83 86 81 24 21 26<br />
Portugal 53 47 ... 90 94 87 51 52 51 34 32 36 . . .<br />
Republic of Moldova ... ... ... 99 99 99 96 97 95 75 77 73 34 29 37<br />
Romania 43 16 4 99 99 98 89 92 86 63 69 58 14 14 13<br />
Russian Federation ... 20 3 99 100 99 94 95 92 85 86 83 62 60 64<br />
San Marino ... ... ... … … … … … … … … … … … …<br />
Serbia ... ... ... 94 97 91 87 92 82 69 75 62 19 19 19<br />
Slovakia 73 50 11 100 100 100 99 100 99 85 90 81 18 18 19<br />
Slovenia 58 48 26 100 100 100 97 98 96 80 85 75 25 23 28<br />
Spain 60 42 28 90 92 88 74 77 71 47 48 47 29 29 29<br />
Sweden 79 57 ... 100 100 100 89 90 89 74 75 74 31 27 35<br />
Switzerl<strong>and</strong> 74 ... ... … … … 97 98 96 85 89 81 36 43 28<br />
TFYR Macedonia 46 29 6 ... ... ... ... ... ... ... ... ... ... ... ...<br />
437
1 ANNEX<br />
TABLE 6<br />
(Continued)<br />
ICT SKILLS ACQUISITION<br />
Percentage of adults (15 <strong>and</strong> over)<br />
with ICT skills by type of skills (%) 1<br />
ADULT EDUCATIONAL ATTAINMENT<br />
Percentage of adults (25 <strong>and</strong> over) (%) who have attained at least:<br />
Sending email<br />
with attached<br />
files<br />
Using basic<br />
arithmetic<br />
formulas in a<br />
spreadsheet<br />
Finding, downloading,<br />
installing<br />
<strong>and</strong> configuring<br />
software<br />
Primary education Lower secondary education Upper secondary education Short-cycle tertiary education<br />
(ISCED level 1 to 8) (ISCED level 2 to 8) (ISCED level 3 to 8) (ISCED level 5 to 8)<br />
2014 2014 2014 2009–2015 2 2009–2015 2 2009–2015 2 2009–2015 2<br />
Country or territory<br />
Total Total Total Total Male Female Total Male Female Total Male Female Total Male Female<br />
Ukraine ... ... ... ... ... ... ... ... ... ... ... ... ... ... ...<br />
United Kingdom 78 53 ... 100 100 100 100 100 100 75 76 73 39 38 40<br />
United States ... ... ... 99 99 99 95 95 95 88 88 89 42 41 43<br />
Latin America <strong>and</strong> the Caribbean<br />
Anguilla ... ... ... ... ... ... ... ... ... ... ... ... ... ... ...<br />
Antigua <strong>and</strong> Barbuda ... ... ... … … … … … … … … … … … …<br />
Argentina ... ... ... ... ... ... ... ... ... ... ... ... ... ... ...<br />
Aruba ... ... ... ... ... ... ... ... ... ... ... ... ... ... ...<br />
Bahamas ... ... ... 95 95 95 89 89 89 82 81 82 23 18 27<br />
Barbados ... ... ... ... ... ... ... ... ... ... ... ... ... ... ...<br />
Belize ... ... ... 100 100 100 84 84 84 37 36 37 6 6 6<br />
Bermuda ... ... ... … … … … … … 77 73 80 37 33 41<br />
Bolivia, Plurinational States of ... ... ... 59 64 53 52 57 47 43 47 39 24 25 23<br />
Brazil 25 15 19 76 75 77 56 54 57 42 40 44 13 11 14<br />
British Virgin Isl<strong>and</strong>s ... ... ... … … … … … … … … … … … …<br />
Cayman Isl<strong>and</strong>s ... ... ... 100 100 100 95 95 94 88 89 88 41 38 44<br />
Chile ... ... ... 85 86 84 76 77 74 54 55 53 18 18 18<br />
Colombia ... ... ... 75 75 76 49 49 50 45 44 45 … … …<br />
Costa Rica ... ... ... 82 83 81 55 54 55 40 40 41 23 23 24<br />
Cuba ... ... ... 91 92 90 81 83 79 57 58 57 15 13 17<br />
Curaçao ... ... ... … … … … … … … … … … … …<br />
Dominica ... ... ... ... ... ... ... ... ... ... ... ... ... ... ...<br />
Dominican Republic ... ... ... 67 66 67 56 55 57 34 31 37 12 10 14<br />
Ecuador ... ... ... 81 82 80 49 49 48 39 39 38 … … …<br />
El Salvador ... ... ... 56 61 53 41 45 38 27 29 25 10 11 10<br />
Grenada ... ... ... … … … … … … … … … … … …<br />
Guatemala ... ... ... 62 62 61 37 36 37 27 26 27 9 10 7<br />
Guyana ... ... ... ... ... ... ... ... ... ... ... ... ... ... ...<br />
Haiti ... ... ... … … … … … … … … … … … …<br />
Honduras ... ... ... 59 58 59 32 31 33 23 21 24 10 10 10<br />
Jamaica ... ... ... 99 99 99 61 57 65 … … … … … …<br />
Mexico ... ... ... 79 80 78 57 59 56 32 33 31 14 16 13<br />
Montserrat ... ... ... … … … … … … … … … … … …<br />
Nicaragua ... ... ... … … … … … … … … … … … …<br />
Panama ... ... ... 83 83 82 61 60 63 43 40 46 21 18 24<br />
Paraguay ... ... ... 73 75 72 47 47 46 37 36 37 14 12 15<br />
Peru ... ... ... 80 85 74 62 67 56 55 60 51 21 21 21<br />
Saint Kitts <strong>and</strong> Nevis ... ... ... … … … … … … … … … … … …<br />
Saint Lucia ... ... ... … … … 46 43 49 40 38 43 10 8 12<br />
Saint Martin ... ... ... … … … … … … … … … … … …<br />
Saint Vincent/Grenadines ... ... ... … … … … … … … … … … … …<br />
Sint Maarten ... ... ... … … … … … … … … … … … …<br />
Suriname ... ... ... 90 93 88 62 63 61 25 23 26 . . .<br />
Trinidad <strong>and</strong> Tobago ... ... ... 95 96 93 60 60 60 57 57 57 10 9 10<br />
Turks <strong>and</strong> Caicos Isl<strong>and</strong>s ... ... ... … … … … … … … … … … … …<br />
Uruguay ... ... ... 89 89 89 53 52 55 28 25 32 12 10 14<br />
Venezuela, B.R. ... ... ... … … … 65 63 68 … … … 25 21 29<br />
Northern Africa <strong>and</strong> Western Asia<br />
Algeria ... ... ... ... ... ... ... ... ... ... ... ...<br />
Bahrain ... ... ... … … … … … … … … … … … …<br />
Egypt 4 2 1 … … … … … … … … … … … …<br />
Iraq ... ... ... … … … … … … … … … … … …<br />
Israel ... ... ... … … … … … … … … … … … …<br />
Jordan ... ... ... … … … 40 47 33 … … … … … …<br />
Kuwait ... ... ... 68 70 64 55 54 57 42 41 45 19 18 22<br />
Lebanon ... ... ... … … … … … … … … … … … …<br />
Libya ... ... ... 96 97 94 89 90 87 81 81 81 47 43 50<br />
Morocco 25 16 20 85 90 80 74 78 69 41 43 40 16 19 13<br />
Oman ... ... ... 58 56 62 51 48 56 28 25 34 … … …<br />
Palestine ... ... ... ... ... ... ... ... ... ... ... ... ... ... ...<br />
Qatar ... ... ... 64 68 59 52 53 51 41 40 43 … … …<br />
Saudi Arabia ... ... ... 93 96 89 59 61 56 38 39 37 23 24 22<br />
Sudan ... ... ... 84 84 86 68 68 71 44 41 58 … … …<br />
Syrian Arab Republic ... ... ... 81 86 74 67 70 60 49 51 46 21 21 21<br />
Tunisia ... ... ... 67 76 58 34 39 29 22 25 19 6 8 4<br />
Turkey 29 20 ... 88 94 81 55 66 44 35 42 29 16 18 13<br />
United Arab Emirates ... ... ... ... ... ... ... ... ... ... ... ... ... ... ...<br />
Yemen ... ... ... … … … … … … … … … … … …<br />
The Pacific<br />
Australia ... ... ... … … … 91 92 91 71 73 70 35 32 38<br />
Cook Isl<strong>and</strong>s ... ... ... … … … … … … … … … … … …<br />
Fiji ... ... ... ... ... ... ... ... ... ... ... ... ... ... ...<br />
Kiribati ... ... ... … … … … … … … … … … … …<br />
Marshall Isl<strong>and</strong>s ... ... ... 96 96 96 92 92 92 70 72 68 . . .<br />
Micronesia F.S. ... ... ... … … … … … … … … … … … …<br />
Nauru ... ... ... … … … … … … … … … … … …<br />
438
STATISTICAL TABLES<br />
1<br />
TABLE 6<br />
(Continued)<br />
ICT SKILLS ACQUISITION<br />
Percentage of adults (15 <strong>and</strong> over)<br />
with ICT skills by type of skills (%) 1<br />
ADULT EDUCATIONAL ATTAINMENT<br />
Percentage of adults (25 <strong>and</strong> over) (%) who have attained at least:<br />
Sending email<br />
with attached<br />
files<br />
Using basic<br />
arithmetic<br />
formulas in a<br />
spreadsheet<br />
Finding, downloading,<br />
installing<br />
<strong>and</strong> configuring<br />
software<br />
Primary education Lower secondary education Upper secondary education Short-cycle tertiary education<br />
(ISCED level 1 to 8) (ISCED level 2 to 8) (ISCED level 3 to 8) (ISCED level 5 to 8)<br />
Country or territory<br />
2014 2014 2014 2009–2015 2 2009–2015 2 2009–2015 2 2009–2015 2<br />
Total Total Total Total Male Female Total Male Female Total Male Female Total Male Female<br />
New Zeal<strong>and</strong> ... ... ... … … … 100 100 100 69 72 67 31 29 33<br />
Niue ... ... ... … … … … … … … … … … … …<br />
Palau ... ... ... … … … … … … … … … … … …<br />
Papua New Guinea ... ... ... … … … … … … … … … … … …<br />
Samoa ... ... ... 99 99 99 … … … 72 70 75 … … …<br />
Solomon Isl<strong>and</strong>s ... ... ... … … … … … … … … … … … …<br />
Tokelau ... ... ... … … … … … … … … … … … …<br />
Tonga ... ... ... 96 96 96 88 88 88 54 53 55 6 7 5<br />
Tuvalu ... ... ... … … … … … … … … … … … …<br />
Vanuatu ... ... ... … … … … … … … … … … … …<br />
Southern Asia<br />
Afghanistan ... ... ... … … … … … … … … … … … …<br />
Bangladesh ... ... ... ... ... ... ... ... ... ... ... ... ... ... ...<br />
Bhutan ... ... ... 20 26 15 10 13 6 6 8 3 5 7 3<br />
India ... ... ... … … … … … … … … … … … …<br />
Iran, Islamic Republic of 9 3 11 … … … 68 70 65 46 47 46 21 22 21<br />
Maldives ... ... ... ... ... ... ... ... ... ... ... ... ... ... ...<br />
Nepal ... ... ... … … … … … … … … … … … …<br />
Pakistan ... ... ... 49 61 35 35 45 25 26 33 19 8 11 5<br />
Sri Lanka ... ... ... … … … 74 76 73 … … … 14 13 15<br />
Sub-Saharan Africa<br />
Angola ... ... ... … … … … … … … … … … … …<br />
Benin ... ... ... ... ... ... ... ... ... ... ... ... ... ... ...<br />
Botswana ... ... ... … … … … … … … … … … … …<br />
Burkina Faso ... ... ... … … … 8 12 6 3 4 2 - - -<br />
Burundi ... ... ... … … … … … … … … … … … …<br />
Cabo Verde ... ... ... … … … … … … … … … … … …<br />
Cameroon ... ... ... 36 47 26 36 47 26 18 25 11 1 2 1<br />
Central African Republic ... ... ... … … … … … … … … … … … …<br />
Chad ... ... ... ... ... ... ... ... ... ... ... ... ... ... ...<br />
Comoros ... ... ... … … … … … … … … … … … …<br />
Congo ... ... ... … … … … … … … … … … … …<br />
Côte d’Ivoire ... ... ... … … … … … … … … … … … …<br />
Democratic Rep. of the Congo ... ... ... 57 74 41 42 59 28 20 31 10 5 9 3<br />
Djibouti ... ... ... … … … … … … … … … … … …<br />
Equatorial Guinea ... ... ... … … … … … … … … … … … …<br />
Eritrea ... ... ... … … … … … … … … … … … …<br />
Ethiopia ... ... ... 25 37 14 13 18 8 9 13 6 1 2 0<br />
Gabon ... ... ... … … … … … … … … … … … …<br />
Gambia ... ... ... … … … … … … … … … … … …<br />
Ghana ... ... ... 65 73 57 54 65 45 21 27 15 3 5 2<br />
Guinea ... ... ... … … … … … … … … … … … …<br />
Guinea-Bissau ... ... ... … … … … … … … … … … … …<br />
Kenya ... ... ... 51 55 47 29 32 25 22 26 18 - - -<br />
Lesotho ... ... ... ... ... ... ... ... ... ... ... ... ... ... ...<br />
Liberia ... ... ... … … … … … … … … … … … …<br />
Madagascar ... ... ... … … … … … … … … … … … …<br />
Malawi ... ... ... ... ... ... ... ... ... ... ... ... ... ... ...<br />
Mali ... ... ... 22 29 16 12 16 7 6 9 3 2 3 1<br />
Mauritania ... ... ... … … … … … … … … … … … …<br />
Mauritius ... ... ... 67 71 63 54 59 50 44 48 40 5 7 4<br />
Mozambique ... ... ... 23 28 17 16 19 12 5 7 4 2 3 2<br />
Namibia ... ... ... ... ... ... ... ... ... ... ... ... ... ... ...<br />
Niger ... ... ... … … … … … … … … … … … …<br />
Nigeria ... ... ... … … … … … … … … … … … …<br />
Rw<strong>and</strong>a ... ... ... 31 36 27 12 15 9 8 11 6 4 5 3<br />
Sao Tome <strong>and</strong> Principe ... ... ... … … … 39 46 32 … … … . . .<br />
Senegal ... ... ... 27 33 22 14 19 10 8 12 5 4 6 3<br />
Seychelles ... ... ... ... ... ... ... ... ... ... ... ... ... ... ...<br />
Sierra Leone ... ... ... … … … … … … … … … … … …<br />
Somalia ... ... ... … … … … … … … … … … … …<br />
South Africa ... ... ... 82 83 81 77 76 74 64 64 62 … … …<br />
South Sudan ... ... ... ... ... ... ... ... ... ... ... ... ... ... ...<br />
Swazil<strong>and</strong> ... ... ... … … … … … … … … … … … …<br />
Togo ... ... ... 30 11 10 18 11 10 9 11 10 … … …<br />
Ug<strong>and</strong>a ... ... ... 33 11 10 24 11 10 10 11 10 8 11 10<br />
United Republic of Tanzania ... ... ... 65 71 59 11 14 9 3 5 2 2 3 1<br />
Zambia ... ... ... … … … 52 60 43 32 39 23 15 18 11<br />
Zimbabwe ... ... ... 81 11 10 61 11 10 6 11 10 . . .<br />
439
1 ANNEX<br />
TABLE 6<br />
(Continued)<br />
ICT SKILLS ACQUISITION<br />
Percentage of adults (15 <strong>and</strong> over)<br />
with ICT skills by type of skills (%) 1<br />
ADULT EDUCATIONAL ATTAINMENT<br />
Percentage of adults (25 <strong>and</strong> over) (%) who have attained at least:<br />
Sending email<br />
with attached<br />
files<br />
Using basic<br />
arithmetic<br />
formulas in a<br />
spreadsheet<br />
Finding, downloading,<br />
installing<br />
<strong>and</strong> configuring<br />
software<br />
Primary education Lower secondary education Upper secondary education Short-cycle tertiary education<br />
(ISCED level 1 to 8) (ISCED level 2 to 8) (ISCED level 3 to 8) (ISCED level 5 to 8)<br />
Country or territory<br />
2014 2014 2014 2009–2015 2 2009–2015 2 2009–2015 2 2009–2015 2<br />
Total Total Total Total Male Female Total Male Female Total Male Female Total Male Female<br />
Median Median Median Median Median Median Median<br />
World ... ... ... 91 93 89 69 72 69 54 54 52 21 20 21<br />
Countries in transition ... ... ... 99 99 98 96 97 94 85 87 83 25 27 24<br />
Developed countries 69 48 26 99 99 98 91 92 91 75 77 73 31 29 29<br />
Developing countries ... ... ... … … … … … … … … … … … …<br />
Caucasus <strong>and</strong> Central Asia ... ... ... 99 99 99 97 97 96 90 92 90 28 29 27<br />
Eastern <strong>and</strong> South-eastern Asia ... ... ... 88 90 86 68 71 66 51 52 50 21 18 23<br />
Eastern Asia ... ... ... 95 95 96 77 75 77 64 62 65 22 19 25<br />
South-eastern Asia ... ... ... 80 82 77 65 69 59 31 35 28 … … …<br />
Europe <strong>and</strong> Northern America 67 47 24 99 99 98 89 94 89 74 77 73 29 28 28<br />
Latin America <strong>and</strong> the<br />
Caribbean<br />
... ... ... 82 83 81 57 57 57 40 40 41 … … …<br />
Caribbean ... ... ... … … … … … … … … … … … …<br />
Latin America ... ... ... 79 81 77 55 54 55 38 38 38 14 14 15<br />
Northern Africa <strong>and</strong> Western<br />
Asia<br />
... ... ... … … … … … … … … … … … …<br />
Northern Africa ... ... ... … … … … … … … … … … … …<br />
Western Asia ... ... ... 83 85 77 57 64 56 41 41 41 19 19 21<br />
Pacific ... ... ... … … … … … … … … … … … …<br />
Southern Asia ... ... ... … … … … … … … … … … … …<br />
Sub-Saharan Africa ... ... ... … … … … … … … … … … … …<br />
Conflict-affected countries ... ... ... … … … 45 50 41 … … … … … …<br />
Countries with low income ... ... ... … … … … … … … … … … … …<br />
Countries with middle income ... ... ... … … … … … … … … … … … …<br />
Lower middle ... ... ... … … … … … … … … … … … …<br />
Upper middle ... ... ... 88 92 82 65 70 65 45 46 46 15 16 14<br />
Countries with high income ... ... ... 97 98 96 84 88 83 73 74 70 30 29 29<br />
Source: UIS database, except where noted.<br />
Note: The country groupings by level of income are as defined by the World Bank but include only countries listed in the<br />
table. They are based on the list of countries by income group as revised in July 2015.<br />
1. Eurostat database; ITU World Telecommunication/ICT Indicators database.<br />
2. Data are for the most recent year available during the period specified.<br />
(…) No data are available.<br />
440
STATISTICAL TABLES<br />
1<br />
TABLE 7<br />
SDG 4, Target 4.5 – Gender – Eliminating gender disparity in education<br />
By 2030, eliminate gender disparities in education <strong>and</strong> ensure equal access at all levels of education <strong>and</strong> vocational training for the vulnerable, including persons with disabilities,<br />
indigenous <strong>people</strong>s <strong>and</strong> children in vulnerable situations<br />
GENDER DISPARITY<br />
IN PARTICIPATION IN EDUCATION<br />
GENDER DISPARITY<br />
IN SCHOOOL COMPLETION 1<br />
GENDER DISPARITY<br />
IN LEARNING OUTCOMES 2<br />
GENDER DISPARITY<br />
IN LITERACY<br />
GENDER DISPARITY<br />
IN ADULT LITERACY AND<br />
NUMERACY SKILLS 3<br />
Gender parity index (GPI)<br />
of gross enrolment ratio (GER) in:<br />
Gender disparity index (GPI)<br />
in completion rate in:<br />
Gender disparity index (GPI)<br />
in percentage of students with minimum level of<br />
proficiency in reading <strong>and</strong> mathematics<br />
Gender disparity index<br />
(GPI) in youth <strong>and</strong><br />
adult literacy rate<br />
Disparity in percentage of<br />
adults achieving at least a<br />
fixed level of proficiency in:<br />
Preprimary<br />
Primary Secondary Tertiary Primary<br />
Lower<br />
secondary<br />
Upper<br />
secondary<br />
Last grade of<br />
primary pupils<br />
Last grade of lower<br />
secondary school<br />
students<br />
Youth<br />
(15–24)<br />
Adult<br />
(15 <strong>and</strong> over)<br />
Functional<br />
literacy skills<br />
Numeracy<br />
skills<br />
School year ending in School year ending in Reading Mathematics Reading Mathematics literacy literacy<br />
Adults Adults<br />
(16 <strong>and</strong> over) (16 <strong>and</strong> over)<br />
2014 2014 2009–2014 4 2009–2014 4 2009–2014 4 2005–2014 4 2012–2015 4 2012–2015 4<br />
Country or territory<br />
GPI (F/M) GPI (F/M) GPI (F/M) GPI (F/M) GPI (F/M) GPI (F/M) GPI (F/M) GPI (F/M) GPI (F/M) GPI (F/M) GPI (F/M) GPI (F/M) GPI (F/M) GPI (F/M) GPI (F/M)<br />
Caucasus <strong>and</strong> Central Asia<br />
Armenia 1.30 y ... ... 1.21 1.00 1.011 1.087 ... 1.05 I ... 1.07 I 1.00 * 1.00 * ... ...<br />
Azerbaijan 5 1.04 * 0.99* 0.99* 1.14* … … … 1.06 I 1.03 I 1.07 I 0.97 I 1.00 * 1.00 * ... ...<br />
Georgia ... 1.01 1.00 1.26 … 1.000 1.001 ... ... ... I 1.02 I 1.00 ** 1.00 ** ... ...<br />
Kazakhstan 1.11 1.00 1.03 1.28 1.00 1.003 1.021 ... 1.02 I 1.06 I 1.02 I 1.00 * 1.00 * ... ...<br />
Kyrgyzstan 1.00 0.99 1.01 1.30 1.00 1.018 1.040 ... ... 1.37 I 1.05 I 1.00 * 0.99 * ... ...<br />
Tajikistan 0.91 1.00 0.90 z 0.67 0.99 0.903 0.637 ... ... ... ... 1.00 ** 1.00 ** ... ...<br />
Turkmenistan 0.97 0.98 0.96 0.64 … … … ... ... ... ... 1.00 ** 1.00 ** ... ...<br />
Uzbekistan ... ... ... ... … … … ... ... ... ... 1.00 * 1.00 * ... ...<br />
Eastern <strong>and</strong> South-eastern Asia<br />
Brunei Darussalam 1.02 1.00 1.00 1.69 … … … ... ... ... ... 1.00 * 0.97 * ... ...<br />
Cambodia 1.00 0.95 ... ... 1.21 0.979 1.115 ... ... ... ... 0.97 * 0.80 * ... ...<br />
China 1.00 1.00 1.02 1.16 1.02 1.011 0.952 ... ... ... ... 1.00 * 0.95 * ... ...<br />
DPR Korea ... ... ... ... … … … ... ... ... ... 1.00 * 1.00 * ... ...<br />
Hong Kong, China ... 0.99 0.96 1.15 … … … ... ... 1.00 I 1.00 I … … ... ...<br />
Indonesia 1.03 0.98 0.99 1.12 1.02 1.068 0.944 ... ... 1.04 I 0.97 I 1.00 * 0.97 * ... ...<br />
Japan ... 1.00z 1.00 z 0.91 z … … … ... ... 1.01 I 1.00 I … … 1.00 1.00<br />
Lao PDR 1.04 0.95 0.91 0.93 0.95 0.831 0.879 ... ... ... ... 0.88 * 0.77 * ... ...<br />
Macao, China ... ... 0.98 1.31 … … … ... ... 1.01 I 1.01 I 1.00 * 0.96 * ... ...<br />
Malaysia ... ... ... ... … … … ... ... 1.07 I 1.06 I 1.00 * 0.95 * ... ...<br />
Mongolia 1.01 y 0.98 1.03 1.44 1.02 1.115 1.366 ... ... ... ... 1.01 * 1.00 * ... ...<br />
Myanmar 1.04 0.97 1.03 1.23 y … … … ... ... ... ... 1.00 0.96 ** ... ...<br />
Philippines ... 1.00z 1.10 z 1.28 1.10 1.248 1.248 ... ... ... ... ** 1.01 * ... ...<br />
Republic of Korea 1.00 z 0.99z 0.99 z 0.75 z … … … ... ... 1.01 I 1.00 I 1.01 * … 0.99 0.98<br />
Singapore ... ... ... ... … … … ... ... 1.01 I 1.02 I … 0.96 * 0.98 0.97<br />
Thail<strong>and</strong> 0.99 1.01 1.07 z 1.33 … … … ... ... 1.02 I 1.06 I 1.00 * 0.97 * ... ...<br />
Timor-Leste 1.05 0.99 1.08 ... 1.15 1.106 1.058 ... ... ... ... 1.01 * 0.83 * ... ...<br />
Viet Nam 0.97 0.99 ... 1.05 1.01 1.096 1.172 ... ... 1.00 I 1.00 I 0.98 * 0.95 * ... ...<br />
Europe <strong>and</strong> Northern America<br />
Albania 0.98 0.98 0.93 1.41 ... ... ... ... ... 1.02 I 1.02 I 1.00 * 0.98 * ... ...<br />
Andorra ... ... ... ... … … … ... ... ... ... … … ... ...<br />
Austria 0.99 0.99 0.95 1.20 … … 0.954 1.00 I 0.99 I 1.01 I 0.98 I … … 1.00 1.00<br />
Belarus 0.96 1.00 0.98 1.33 0.99 1.004 1.079 ... ... ... ... 1.00 * 1.00 * ... ...<br />
Belgium 0.99 1.00 1.13 1.31 … … 1.072 ... ... 1.02 I 1.00 I … … ... ...<br />
Bosnia <strong>and</strong> Herzegovina 0.94 1.00 1.03 1.34 1.00 1.007 1.246 ... ... ... ... 1.00 ** 0.98 ** ... ...<br />
Bulgaria 0.99 0.99 0.97 1.25 … … 0.982 1.02 I ... 1.10 I 1.04 I 1.00 * 0.99 * ... ...<br />
Canada 0.99 z 1.01 z 1.00 z ... … … 1.081 ... ... 1.01 I 1.00 I … … 1.00 0.98<br />
Croatia 0.98 1.00 1.04 1.37 … … 0.974 1.01 I 1.00 I 1.01 I 1.00 I 1.00 * 0.99 * ... ...<br />
Cyprus 5 1.01 * 1.01* 1.00 * 1.42 * … … 1.083 ... ... 1.10 I 1.07 I 1.00 * 0.99 * 1.00 0.99<br />
Czech Republic 0.98 1.00 1.00 1.40 … … 1.012 1.00 I 0.99 I 1.01 I 1.00 I … … 0.99 0.99<br />
Denmark 1.01 0.99 1.04 1.40 … … 1.138 ... ... 1.01 I 0.99 I … … 1.01 1.00<br />
Estonia 0.97 y 0.99 z 0.99 z 1.50 z … … 1.063 ... ... 1.00 I 1.00 I 1.00 * 1.00 * 1.01 1.01<br />
Finl<strong>and</strong> 0.99 1.00 1.09 1.21 … … 1.042 ... ... 1.01 I 1.01 I … … 1.01 1.00<br />
France 1.00 0.99 1.01 1.23 … … 1.061 1.00 I ... 1.03 I 1.00 I … … 1.00 0.98<br />
Germany 0.99 0.99 0.95 0.94 … … 0.998 1.00 I 0.99 I 1.01 I 0.99 I … … 0.99 0.98<br />
Greece 0.98 z 0.99 z 0.96 z 1.00 z … … 1.022 ... ... 1.04 I 1.03 I 1.00 ** 0.98 ** 1.01 0.98<br />
Hungary 0.98 0.99 1.00 1.29 … … 1.004 1.03 I 1.02 I 1.01 I 1.00 I … … ... ...<br />
Icel<strong>and</strong> 0.98 y 1.00 y 0.99 y 1.72 y … … 1.327 ... ... 1.03 I 1.03 I … … ... ...<br />
Irel<strong>and</strong> 1.03 z 1.01 z 1.02 y 1.06 z … … … ... ... 1.00 I 0.99 I … … 1.01 0.99<br />
Italy 0.98 z 0.99 z 0.98 z 1.40 z … … 1.110 ... ... 1.02 I 0.99 I 1.00 * 0.99 * 1.01 0.98<br />
Latvia 0.99 0.99 0.98 1.43 … … 1.163 ... ... 1.01 I 1.01 I 1.00 * 1.00 * ... ...<br />
Liechtenstein 5 0.94 * 0.99* 0.81 * 0.48 * … … … ... ... 1.00 I 0.97 I … … ... ...<br />
Lithuania 0.99 1.00 0.96 1.47 … … 1.088 1.02 I 1.01 I 1.01 I 1.02 I 1.00 * 1.00 * 1.01 1.00<br />
Luxembourg 1.00 z 1.01 z 1.03 z 1.14 y … … 1.100 ... ... 1.02 I 0.96 I … … ... ...<br />
Malta 1.06 0.95 0.89 1.15 … … 1.300 ... ... ... ... 1.01 * 1.03 * ... ...<br />
Monaco ... ... ... ... … … … ... ... ... ... … … ... ...<br />
Montenegro 0.94 0.98 1.00 ... 1.01 0.979 1.037 ... ... 1.07 I 1.03 I 1.00 * 0.98 * ... ...<br />
Netherl<strong>and</strong>s 1.01 0.99 ... 1.10 … … 1.228 ... ... 1.01 I 0.99 I … … 1.00 0.99<br />
Norway 1.00 1.00 0.97<br />
y<br />
… … 1.018 ... ... 1.02 I 1.01 I … … 1.00 1.00<br />
Pol<strong>and</strong> 0.99 z 1.00 z 0.96 z 1.45 … … 1.121 ... ... 1.01 I 1.01 I … … 1.02 1.02<br />
Portugal 0.97 0.96 0.98 1.55 z … … 1.443 ... ... 1.02 I 1.01 I 1.00 * 0.96 * ... ...<br />
Republic of Moldova 5 0.99 * 1.00* 1.01 * 1.16 1.00 1.040 1.168 ... ... ... ... 1.00 ** 0.99 ** ... ...<br />
Romania 1.00 0.98 y 0.99 1.29 *, z … … 1.063 1.04 I 1.00 I 1.03 I 1.00 I 1.00 * 0.99 * ... ...<br />
Russian Federation 0.99 1.01 0.98 1.24 1.00 1.005 0.996 1.01 I 1.00 I 1.01 I 1.01 I 1.00 * 1.00 * 1.01 1.02<br />
San Marino 5 1.02 *, y 0.99 *, y 1.03 *, y 1.21 … … … ... ... ... ... … … ... ...<br />
Serbia 5 1.01 * 1.00* 1.02 * 1.38 *, y 1.00 1.028 1.167 ... 0.99 I 1.03 I 0.98 I 1.00 * 0.97 * ... ...<br />
Slovakia 0.98 0.99 1.01 1.31 * … … 1.037 1.01 I 0.99 I 1.02 I 0.99 I … … 1.00 1.00<br />
Slovenia 0.97 1.00 1.00 1.55 … … 1.062 ... ... 1.02 I 1.00 I 1.00 ** 1.00 ** 1.01 1.00<br />
441
1 ANNEX<br />
TABLE 7<br />
(Continued)<br />
GENDER DISPARITY<br />
IN PARTICIPATION IN EDUCATION<br />
GENDER DISPARITY<br />
IN SCHOOOL COMPLETION 1<br />
GENDER DISPARITY<br />
IN LEARNING OUTCOMES 2<br />
GENDER DISPARITY<br />
IN LITERACY<br />
GENDER DISPARITY<br />
IN ADULT LITERACY AND<br />
NUMERACY SKILLS 3<br />
Gender parity index (GPI)<br />
of gross enrolment ratio (GER) in:<br />
Gender disparity index (GPI)<br />
in completion rate in:<br />
Gender disparity index (GPI)<br />
in percentage of students with minimum level of<br />
proficiency in reading <strong>and</strong> mathematics<br />
Gender disparity index<br />
(GPI) in youth <strong>and</strong><br />
adult literacy rate<br />
Disparity in percentage of<br />
adults achieving at least a<br />
fixed level of proficiency in:<br />
Preprimary<br />
Primary Secondary Tertiary Primary<br />
Lower<br />
secondary<br />
Upper<br />
secondary<br />
Last grade of<br />
primary pupils<br />
Last grade of lower<br />
secondary school<br />
students<br />
Youth<br />
(15–24)<br />
Adult<br />
(15 <strong>and</strong> over)<br />
Functional<br />
literacy skills<br />
Numeracy<br />
skills<br />
School year ending in School year ending in Reading Mathematics Reading Mathematics literacy literacy<br />
Adults Adults<br />
(16 <strong>and</strong> over) (16 <strong>and</strong> over)<br />
Country or territory<br />
2014 2014 2009–2014 4 2009–2014 4 2009–2014 4 2005–2014 4 2012–2015 4 2012–2015 4<br />
GPI (F/M) GPI (F/M) GPI (F/M) GPI (F/M) GPI (F/M) GPI (F/M) GPI (F/M) GPI (F/M) GPI (F/M) GPI (F/M) GPI (F/M) GPI (F/M) GPI (F/M) GPI (F/M) GPI (F/M)<br />
Spain 1.00 1.01 1.00 1.44 … … 1.239 ... ... 1.02 I 0.99 I 1.00 * 0.99 * 1.00 0.97<br />
Sweden 1.00 1.06 1.14 1.54 … … 1.066 ... ... 1.04 I 1.03 I … … 0.99 0.98<br />
Switzerl<strong>and</strong> 0.98 1.00 0.97 1.02 … … 1.010 ... ... 1.01 I 1.00 I … … ... ...<br />
TFYR Macedonia 1.02 y 0.98 y 0.98 y 1.26 z 1.00 0.866 0.908 ... ... ... 1.06 I 1.00 ** 0.98 ** ... ...<br />
Ukraine 0.98 y 1.02 0.98 1.16 0.99 1.001 1.007 ... ... ... I 1.04 I 1.00 ** 1.00 ** ... ...<br />
United Kingdom 1.00 1.00 1.04 1.31 … … 1.061 ... ... 1.01 I 0.99 I … … ... ...<br />
United States 1.00 0.99 1.02 1.37 … … 1.032 ... ... 1.01 I 1.01 I … … 1.00 0.97<br />
Latin America <strong>and</strong> the Caribbean<br />
Anguilla ... ... ... ... … … … ... ... ... ... … … ... ...<br />
Antigua <strong>and</strong> Barbuda 0.93 0.92 1.01 2.07 y … … … ... ... ... ... … 1.01 ** ... ...<br />
Argentina 1.01 z 0.99 z 1.08 z 1.61 z 1.01 1.147 1.206 1.11 R 0.93 R 1.07 I 0.91 I 1.00 ** 1.00 ** ... ...<br />
Aruba 0.98 0.97 1.02 y 2.29 … … … ... ... ... ... 1.00 * 1.00 * ... ...<br />
Bahamas ... ... ... ... … … … ... ... ... ... … … ... ...<br />
Barbados 1.03 1.01 1.03 ... 1.01 0.995 1.102 ... ... ... ... … … ... ...<br />
Belize 1.02 0.95 1.05 1.64 z 1.09 1.316 1.312 ... ... ... ... … … ... ...<br />
Bermuda 1.03 0.97 1.14 1.89 … … … ... ... ... ... … … ... ...<br />
Bolivia, P.S. 0.98 z ... 0.99 z ... ... ... ... ... ... ... ... 1.00 * 0.95 * ... ...<br />
Brazil 5 1.01 *, z 0.95 *, z 1.09 *, z 1.35 *, z 1.12 1.240 1.428 1.07 R 0.92 R 1.04 I 0.88 I 1.01 * 1.01 * ... ...<br />
British Virgin Isl<strong>and</strong>s ... ... ... ... … … … ... ... ... ... … … ... ...<br />
Cayman Isl<strong>and</strong>s ... ... ... ... … … … ... ... ... ... 0.99 * 1.00 * ... ...<br />
Chile 0.98 0.97 1.02 1.14 1.01 1.031 1.084 1.03 R 1.01 R 1.01 I 0.90 I 1.00 * 1.00 * 0.95 0.83<br />
Colombia ... 0.97 1.08 1.15 0.98 1.011 1.078 1.02 R 0.87 R 1.04 I 0.81 I 1.01 * 1.01 * ... ...<br />
Costa Rica 1.01 0.99 1.05 1.24 1.02 1.310 1.259 1.02 R 0.96 R 1.01 I 0.89 I 1.00 * 1.00 * ... ...<br />
Cuba 1.01 0.96 1.03 1.59 … … … ... ... ... ... 1.00 * 1.00 * ... ...<br />
Curaçao ... 0.96 z 1.05 z 2.33 z … … … ... ... ... ... … … ... ...<br />
Dominica 0.93 1.00 ... ... … … … ... ... ... ... … … ... ...<br />
Dominican Republic 1.05 0.91 1.11 1.62 1.07 1.098 1.353 1.14 R 0.85 R ... ... 1.01 * 1.01 * ... ...<br />
Ecuador 1.02 1.00 1.04 ... 1.00 1.030 1.063 1.00 R 0.97 R ... ... 1.00 * 0.98 * ... ...<br />
El Salvador 1.03 0.96 1.01 1.09 … … … ... ... ... ... 1.01 * 0.95 * ... ...<br />
Grenada 0.94 0.98 0.99 ... … … … ... ... ... ... … … ... ...<br />
Guatemala 1.02 0.96 0.94 1.06 z 0.94 0.906 0.964 1.00 R 0.68 R ... ... 0.98 * 0.88 * ... ...<br />
Guyana 0.98 y 0.97 y 0.99 y 2.03 y 0.98 1.170 0.930 ... ... ... ... 1.01 **,a 1.06 **,a ... ...<br />
Haiti ... ... ... ... 1.20 0.957 0.730 ... ... ... ... 0.95 **,a 0.84 **,a ... ...<br />
Honduras 1.02 0.98 1.17 1.35 1.03 1.465 1.528 1.03 R 0.89 R ... 0.63 I 1.01 * 1.00 * ... ...<br />
Jamaica 1.06 ... 1.08 2.28 z 1.00 1.012 1.063 ... ... ... ... 1.05 ** 1.11 ** ... ...<br />
Mexico 1.02 1.00 1.07 1.01 1.02 1.019 1.037 1.00 R ... 1.02 I 0.95 I 1.00 * 0.98 * ... ...<br />
Montserrat ... ... ... ... … … … ... ... ... ... … … ... ...<br />
Nicaragua ... ... ... ... 1.16 1.321 1.275 1.03 R 0.89 R ... ... 1.04 * 1.00 * ... ...<br />
Panama 1.01 z 0.97 z 1.06 z 1.49 z 1.01 1.034 1.222 1.08 R 1.10 R 1.07 I 0.94 I 0.99 * 0.99 * ... ...<br />
Paraguay 1.00 y 0.97 y 1.07 y ... … … … 1.10 R 0.96 R ... ... 1.00 * 0.98 * ... ...<br />
Peru 1.01 1.00 1.00 ... 1.03 1.017 0.973 0.95 R 0.85 R 1.04 I 0.85 I 1.00 * 0.93 * ... ...<br />
Saint Kitts <strong>and</strong> Nevis 0.95 1.02 1.03 1.02 … … … ... ... ... ... … … ... ...<br />
Saint Lucia 1.07 ... 0.99 2.09 1.00 1.122 1.158 ... ... ... ... … … ... ...<br />
Saint-Martin ... ... ... ... … … … ... ... ... ... … … ... ...<br />
St. Vincent <strong>and</strong> the Grenadines 1.02 0.97 0.97 ... … … … ... ... ... ... … … ... ...<br />
Sint-Maarten ... ... ... ... … … … ... ... ... ... … … ... ...<br />
Suriname 1.04 0.97 1.31 z ... 1.07 1.466 1.582 ... ... ... ... 1.01 * 0.99 * ... ...<br />
Trinidad <strong>and</strong> Tobago ... ... ... ... … … … ... ... 1.11 I 1.05 I 1.00 ** 0.99 ** ... ...<br />
Turks <strong>and</strong> Caicos Isl<strong>and</strong>s ... ... ... ... … … … ... ... ... ... … … ... ...<br />
Uruguay 1.01 z 0.97 z 1.13 z ... 1.01 1.162 0.686 1.02 R 0.93 R 1.07 I 0.97 I 1.01 * 1.01 * ... ...<br />
Venezuela, B.R. 1.01 0.98 1.08 ... … … … ... ... ... ... 1.01 * 1.01 * ... ...<br />
Northern Africa <strong>and</strong> Western Asia<br />
Algeria ... 0.94 ... 1.53 … … … ... ... ... ... 0.96 0.82 * ... ...<br />
Bahrain 1.00 ... ... 2.33 … … … ... ... ... 1.48 I 0.99 0.95 * ... ...<br />
Egypt 0.98 1.00 0.99 0.90 … 1.03 0.97 ... ... ... ... 0.96 *,a 0.81 *,a ... ...<br />
Iraq ... ... ... ... … 0.92 0.98 ... ... ... ... 0.97 ** 0.86 ** ... ...<br />
Israel 1.00 1.00 1.02 1.34 … 1.03 1.11 ... ... 1.05 I 1.05 I … … 1.00 0.97<br />
Jordan 0.96 y 0.99 y 1.05 y 1.18 y 0.92 1.06 1.32 ... ... 1.14 I 1.24 I 1.00 *,a 0.99 *,a ... ...<br />
Kuwait ... 1.01 1.11 ** 1.62 z … … … 1.49 I 1.48 I ... ... 1.00 * 0.98 * ... ...<br />
Lebanon 0.94 z 0.91 z 1.01 z 1.16 1.00 … … ... ... ... 0.96 I 1.01 * 0.92 * ... ...<br />
Libya ... ... ... ... 1.02 … … ... ... ... ... 1.00 ** 0.88 ** ... ...<br />
Morocco 0.82 0.95 0.85 y 0.96 0.90 0.89 1.01 ... ... ... 1.00 I 0.83 * 0.76 * ... ...<br />
Oman 1.04 1.09 ... ... … … … 1.49 I 1.27 I ... 1.79 I 1.00 * 0.94 * ... ...<br />
Palestine 1.02 0.99 1.10 1.55 … 1.18 1.39 ... ... ... 1.21 I 1.00 * 0.96 * ... ...<br />
Qatar 1.00 ... ... 6.32 0.85 … … ... ... 1.25 I 1.17 I 1.01 * 1.00 * ... ...<br />
Saudi Arabia 1.29 0.99 0.76 ** 0.96 … … … ... ... ... 1.15 I 1.00 * 0.95 * ... ...<br />
Sudan 1.07 z 0.90 z 0.95 z 1.12 z 1.00 0.82 0.75 ... ... ... ... 0.91 * 0.78 * ... ...<br />
Syrian Arab Republic 0.97 z 0.97 z 1.00 z 1.04 z 1.02 … … ... ... ... 0.91 I 0.98 ** 0.88 ** ... ...<br />
Tunisia 1.02 0.97 ... 1.64 1.01 1.13 1.27 ... ... 1.05 I 0.88 I 0.98 * 0.82 * ... ...<br />
Turkey 0.96 z 0.99 z 0.97 z 0.86 z … … … ... 1.02 I 1.01 I 0.99 I 0.99 * 0.94 * 0.93 0.82<br />
442
STATISTICAL TABLES<br />
1<br />
TABLE 7<br />
(Continued)<br />
GENDER DISPARITY<br />
IN PARTICIPATION IN EDUCATION<br />
GENDER DISPARITY<br />
IN SCHOOOL COMPLETION 1<br />
GENDER DISPARITY<br />
IN LEARNING OUTCOMES 2<br />
GENDER DISPARITY<br />
IN LITERACY<br />
GENDER DISPARITY<br />
IN ADULT LITERACY AND<br />
NUMERACY SKILLS 3<br />
Gender parity index (GPI)<br />
of gross enrolment ratio (GER) in:<br />
Gender disparity index (GPI)<br />
in completion rate in:<br />
Gender disparity index (GPI)<br />
in percentage of students with minimum level of<br />
proficiency in reading <strong>and</strong> mathematics<br />
Gender disparity index<br />
(GPI) in youth <strong>and</strong><br />
adult literacy rate<br />
Disparity in percentage of<br />
adults achieving at least a<br />
fixed level of proficiency in:<br />
Preprimary<br />
Primary Secondary Tertiary Primary<br />
Lower<br />
secondary<br />
Upper<br />
secondary<br />
Last grade of<br />
primary pupils<br />
Last grade of lower<br />
secondary school<br />
students<br />
Youth<br />
(15–24)<br />
Adult<br />
(15 <strong>and</strong> over)<br />
Functional<br />
literacy skills<br />
Numeracy<br />
skills<br />
School year ending in School year ending in Reading Mathematics Reading Mathematics literacy literacy<br />
Adults Adults<br />
(16 <strong>and</strong> over) (16 <strong>and</strong> over)<br />
Country or territory<br />
2014 2014 2009–2014 4 2009–2014 4 2009–2014 4 2005–2014 4 2012–2015 4 2012–2015 4<br />
GPI (F/M) GPI (F/M) GPI (F/M) GPI (F/M) GPI (F/M) GPI (F/M) GPI (F/M) GPI (F/M) GPI (F/M) GPI (F/M) GPI (F/M) GPI (F/M) GPI (F/M) GPI (F/M) GPI (F/M)<br />
United Arab Emirates 1.01 1.01 ... 2.26 … … … 1.22 I 1.08 I 1.06 I 1.08 I 1.04 * 1.02 * ... ...<br />
Yemen 0.88 z 0.84 z 0.69 z ... 0.78 0.72 0.63 ... ... ... ... 0.83 ** 0.63 ** ... ...<br />
The Pacific<br />
Australia ... ... ... ... … 1.007 1.089 1.03 N 1.01 N 1.01 I 1.00 I … … 1.00 0.99<br />
Cook Isl<strong>and</strong>s 5 1.08 * 0.97 * 1.10 * 3.37 * … … … ... ... ... ... … … ... ...<br />
Fiji ... 1.01 z 1.11 y ... … … … ... ... ... ... … … ... ...<br />
Kiribati ... 1.04 ... . y … … … ... ... ... ... … … ... ...<br />
Marshall Isl<strong>and</strong>s ... ... ... 0.92 y … … … ... ... ... ... 1.01 * 1.00 * ... ...<br />
Micronesia F.S. ... 0.99 ... ... … … … ... ... ... ... … … ... ...<br />
Nauru 5 1.13 * 0.92 * 1.02 * ... … … … ... ... ... ... … … ... ...<br />
New Zeal<strong>and</strong> 1.02 1.00 1.06 1.38 … … … ... ... 1.02 I 1.01 I … … 1.01 1.00<br />
Niue 5 1.10 * 0.98 * ... ... … … … ... ... ... ... … … ... ...<br />
Palau 5 1.09 * 0.96 * 1.06 * 1.55 *, z … … … ... ... ... ... 1.00 * 1.00 * ... ...<br />
Papua New Guinea ... 0.91 y 0.76 y ... … … … ... ... ... ... 0.93 ** 0.94 ** ... ...<br />
Samoa 1.11 1.00 1.12 ... … … … ... ... ... ... 1.00 * 1.00 * ... ...<br />
Solomon Isl<strong>and</strong>s 1.01 0.97 0.94 y ... … … … ... ... ... ... … … ... ...<br />
Tokelau ... ... ... ... … … … ... ... ... ... … … ... ...<br />
Tonga 0.98 0.99 1.09 ... … … … ... ... ... ... 1.00 * 1.00 * ... ...<br />
Tuvalu 5 1.00 * 1.01 * 1.25 * ... … … … ... ... ... ... … … ... ...<br />
Vanuatu 0.99 z 0.98 z ... ... … … … ... ... ... ... … … ... ...<br />
Southern Asia<br />
Afghanistan ... 0.70 0.56 0.28 0.50 0.332 0.270 ... ... ... ... 0.52 * 0.39 * ... ...<br />
Bangladesh 1.00 z ... 1.08 z 0.74 1.13 1.029 0.799 ... ... ... ... 1.06 ** 0.89 ** ... ...<br />
Bhutan 1.08 1.01 1.07 0.74 z 1.05 0.940 1.140 ... ... ... ... 0.93 * 0.73 * ... ...<br />
India 0.92 z 1.12 z 1.01 z 0.94 z 0.99 0.960 0.925 ... ... ... ... 0.91 * 0.75 * ... ...<br />
Iran, Islamic Republic of 0.97 1.04 0.99 0.93 … … … ... ... ... 0.98 0.99 * 0.89 * ... ...<br />
Maldives ... ... ... ... 1.01 1.093 1.250 ... ... ... ... 1.00 * 1.00 * ... ...<br />
Nepal 0.97 1.08 1.07** 0.82 z 0.91 0.840 0.755 ... ... ... ... 0.89 * 0.68 * ... ...<br />
Pakistan 0.88 0.85 0.79 1.06 0.93 0.825 0.846 ... ... ... ... 0.80 * 0.61 * ... ...<br />
Sri Lanka 0.99 z 0.98 1.05 z 1.49 … … … ... ... ... ... 1.01 * 0.97 * ... ...<br />
Sub-Saharan Africa<br />
Angola ... ... ... 0.80 z … … … ... ... ... ... 0.85 ** 0.73 ** ... ...<br />
Benin 1.01 0.91 0.68 0.37 z 0.89 0.584 0.428 1.01 I 1.05 I ... ... 0.56 **,a 0.45 **,a ... ...<br />
Botswana 0.99 z 0.97 z 1.06 z 1.37 … … … ... ... ... 1.18 I 1.04 ** 1.02 ** ... ...<br />
Burkina Faso 1.04 0.96 0.87 0.49 z 0.94 0.441 0.308 1.01 I 0.99 I ... ... 0.77 * 0.59 * ... ...<br />
Burundi 1.01 1.01 0.85 0.42 z 0.99 0.474 0.577 1.00 I 1.01 I ... ... 0.98 * 0.95 * ... ...<br />
Cabo Verde 1.00 0.95 1.14 1.40 … … … ... ... ... ... 1.01 * 0.89 * ... ...<br />
Cameroon 1.02 0.89 0.85 ... 0.99 0.832 0.705 1.01 I 1.02 I ... ... 0.89 * 0.83 * ... ...<br />
Central African Republic ... 0.74 y 0.51 y 0.36 y 0.68 0.584 0.531 ... ... ... ... 0.55 **,a 0.48 **,a ... ...<br />
Chad 0.90 z 0.77 z 0.46 y 0.20 ** 0.59 0.327 0.329 0.91 I 0.85 I ... ... 0.88 ** 0.63 ** ... ...<br />
Comoros 1.05 z 0.94 z 1.04 z 0.87 z 1.07 1.073 1.432 ... I ... I ... ... 1.01 ** 0.90 ** ... ...<br />
Congo 0.99 y 1.07 y 0.87 y 0.75 z 0.97 0.915 0.915 1.02 I 0.86 I ... ... 0.90 **,a 0.84 **,a ... ...<br />
Côte d'Ivoire 1.00 0.87 0.71 0.58 … … … 1.00 I 0.92 I ... ... 0.66 **,a 0.59 **,a ... ...<br />
D.R. Congo 1.07 0.91 0.62 0.46 z 0.91 0.746 0.694 ... ... ... ... 0.84 *,a 0.72 *,a ... ...<br />
Djibouti 0.87 0.89 0.80 ... … … … ... ... ... ... … … ... ...<br />
Equatorial Guinea 1.01 y 0.98 y ... ... … … … ... ... ... ... 1.01 ** 0.95 ** ... ...<br />
Eritrea 1.00 z 0.85 z 0.80 z 0.50 … … … ... ... ... ... 0.97 ** 0.79 ** ... ...<br />
Ethiopia 0.95 0.92 0.91 y 0.48 0.95 0.954 0.850 ... ... ... ... 0.75 * 0.59 * ... ...<br />
Gabon ... ... ... ... 1.14 0.900 0.805 ... ... ... ... 1.02 **,a 0.94 **,a ... ...<br />
Gambia 1.06 1.05 ... 0.68 y 0.95 0.954 0.843 ... ... ... ... 0.92 ** 0.73 ** ... ...<br />
Ghana 1.03 1.00 0.95 0.67 1.05 1.019 0.832 ... ... ... 0.67 I 0.94 * 0.83 * ... ...<br />
Guinea ... 0.85 0.66 0.45 0.72 0.565 0.443 ... ... ... ... 0.58 * 0.33 * ... ...<br />
Guinea-Bissau ... ... ... ... … … … ... ... ... ... 0.89 ** 0.66 ** ... ...<br />
Kenya 0.97 1.00 0.93 y ... 1.05 1.038 0.841 1.01 R 1.02 R ... ... 0.98 **,a 0.86 **,a ... ...<br />
Lesotho 1.05 0.98 1.37 1.45 1.52 1.500 1.120 ... ... ... ... 1.24 **,a 1.30 **,a ... ...<br />
Liberia ... 0.92 0.78 0.63 y 0.88 0.669 0.459 ... ... ... ... 0.59 **,a 0.44 **,a ... ...<br />
Madagascar 1.06 1.00 0.98 0.94 z ... ... ... ... ... ... ... 0.97 **,a 0.91 **,a ... ...<br />
Malawi ... 1.02 0.91 ... 1.21 0.955 0.774 ... ... ... ... 0.94 **,a 0.71 **,a ... ...<br />
Mali 1.05 0.90 0.76 0.43 y 0.82 0.500 0.423 ... ... ... ... 0.69 * 0.57 * ... ...<br />
Mauritania 1.30 1.06 0.91 0.50 0.83 0.696 0.525 ... ... ... ... 0.72 **,a 0.62 **,a ... ...<br />
Mauritius 1.03 1.02 1.02 1.23 … … … ... ... ... ... 1.01 * 0.95 * ... ...<br />
Mozambique ... 0.92 0.92 0.71 0.74 0.448 0.279 ... ... ... ... 0.71 * 0.54 * ... ...<br />
Namibia 1.04 z 0.97 z ... ... 1.16 1.286 1.057 ... ... ... ... 1.02 * 0.99 * ... ...<br />
Niger 1.06 0.86 0.70 0.34 y 0.65 0.443 0.300 0.94 I 0.91 I ... ... 0.44 ** 0.38 **,a ... ...<br />
Nigeria ... ... ... ... 0.84 0.719 0.638 ... ... ... ... 0.77 ** 0.68 **,a ... ...<br />
Rw<strong>and</strong>a 1.05 z 1.02 1.10 0.79 z 1.22 1.029 0.884 ... ... ... ... 1.03 * 0.89 * ... ...<br />
Sao Tome <strong>and</strong> Principe 1.10 0.96 1.11 1.03 ... ... ... ... ... ... ... 0.99 * 0.90 * ... ...<br />
Senegal 1.13 1.09 ... ... 0.96 0.641 0.368 1.00 I 0.95 I ... ... 0.83 * 0.64 * ... ...<br />
Seychelles 1.00 1.01 1.02 2.49 … … … ... ... ... ... 1.01 * 1.01 * ... ...<br />
Sierra Leone 1.10 z 1.00 z 0.85 z ... 1.06 0.653 0.737 ... ... ... ... 0.77 ** 0.63 ** ... ...<br />
443
1 ANNEX<br />
TABLE 7<br />
(Continued)<br />
GENDER DISPARITY<br />
IN PARTICIPATION IN EDUCATION<br />
GENDER DISPARITY<br />
IN SCHOOOL COMPLETION 1<br />
GENDER DISPARITY<br />
IN LEARNING OUTCOMES 2<br />
GENDER DISPARITY<br />
IN LITERACY<br />
GENDER DISPARITY<br />
IN ADULT LITERACY AND<br />
NUMERACY SKILLS 3<br />
Gender parity index (GPI)<br />
of gross enrolment ratio (GER) in:<br />
Gender disparity index (GPI)<br />
in completion rate in:<br />
Gender disparity index (GPI)<br />
in percentage of students with minimum level of<br />
proficiency in reading <strong>and</strong> mathematics<br />
Gender disparity index<br />
(GPI) in youth <strong>and</strong><br />
adult literacy rate<br />
Disparity in percentage of<br />
adults achieving at least a<br />
fixed level of proficiency in:<br />
Preprimary<br />
Primary Secondary Tertiary Primary<br />
Lower<br />
secondary<br />
Upper<br />
secondary<br />
Last grade of<br />
primary pupils<br />
Last grade of lower<br />
secondary school<br />
students<br />
Youth<br />
(15–24)<br />
Adult<br />
(15 <strong>and</strong> over)<br />
Functional<br />
literacy skills<br />
Numeracy<br />
skills<br />
School year ending in School year ending in Reading Mathematics Reading Mathematics literacy literacy<br />
Adults Adults<br />
(16 <strong>and</strong> over) (16 <strong>and</strong> over)<br />
Country or territory<br />
2014 2014 2009–2014 4 2009–2014 4 2009–2014 4 2005–2014 4 2012–2015 4 2012–2015 4<br />
GPI (F/M) GPI (F/M) GPI (F/M) GPI (F/M) GPI (F/M) GPI (F/M) GPI (F/M) GPI (F/M) GPI (F/M) GPI (F/M) GPI (F/M) GPI (F/M) GPI (F/M) GPI (F/M) GPI (F/M)<br />
Somalia ... ... ... ... … … … ... ... ... ... … … ... ...<br />
South Africa 0.99 z 0.95 1.22 ** 1.47 z 1.05 1.119 1.220 ... ... ... 1.07 I 1.00 * 0.98 * ... ...<br />
South Sudan ... ... ... ... 0.61 0.297 0.343 ... ... ... ... 0.67 * 0.55 * ... ...<br />
Swazil<strong>and</strong> ... 0.92 z 0.98 z 1.05 z 1.24 1.226 1.022 ... ... ... ... 1.03 **,a 0.98 **,a ... ...<br />
Togo 1.03 0.94 ... 0.42 0.90 0.554 0.491 1.00 I 0.97 I ... ... 0.84 * 0.65 * ... ...<br />
Ug<strong>and</strong>a 1.04 z 1.02 z 0.87 z ... 1.29 0.843 0.594 0.99 R 1.05 R ... ... 0.95 * 0.78 * ... ...<br />
U.R. Tanzania 1.01 z 1.01 z 0.91 z 0.51 z 1.03 0.796 0.732 0.99 R 0.94 R ... ... 0.97 * 0.88 * ... ...<br />
Zambia ... 1.01 z ... ... 0.99 0.834 0.648 ... ... ... ... 0.95 * 0.88 * ... ...<br />
Zimbabwe 1.02 z 0.98 z 0.98 z 0.84 z 1.10 1.128 0.728 ... ... ... ... 1.03 **,a 0.91 **,a ... ...<br />
Weighted average Weighted average Median Median Weighted average Median<br />
World 0.99 ** 0.99 ** 0.99 ** 1.11 ** … … 1.04 ... ... ... ... 0.96 ** 0.91 ** … …<br />
1.00 **<br />
Countries in transition 0.99 1.00 0.98 1.17 1.00 1.02 1.04 ... ... ... ... 1.00 ** 0.88 ** … …<br />
Developed countries 1.00 1.00 1.00 1.26 … … 1.06 ... ... ... ... … ** 1.00 ** … …<br />
Developing countries 0.98 ** 0.99 ** 0.98 ** 1.05 ** 1.01 1.12 0.96 ... ... ... ... 0.95 ** 0.96 **<br />
1.01 ** 0.96 ** … …<br />
Caucasus <strong>and</strong> Central Asia 1.00 0.99 0.99 ** 1.04 1.00 1.00 1.06 ... ... ... ... 1.00 ** 0.96 ** … …<br />
Eastern <strong>and</strong> South-eastern Asia 1.00 0.99 1.01 1.11 … … … ... ... ... ... 1.00 ** … … …<br />
Eastern Asia 1.00 1.00 1.02 1.10 … … … ... ... ... ... 1.00 ** 0.99 ** … …<br />
South-eastern Asia 0.99 0.98 1.00 1.17 1.06 1.16 0.97 ... ... ... ... 1.00 ** 0.98 ** … …<br />
Europe <strong>and</strong> Northern America 1.01 ** 1.00 1.00 1.28 … … 1.07 ... ... ... ... … 0.99 ** … …<br />
Latin America <strong>and</strong> the Caribbean 1.04 ** 0.98 ** 1.07 ** 1.29 ** 1.01 1.06 1.08 ... ... ... ... 1.00 ** 0.86 ** … …<br />
Caribbean 1.01 ** 0.97 1.06 ** 1.50 ** … … … ... ... ... ... 0.99 ** 0.81 ** … …<br />
Latin America 0.99 ** 0.98 ** 1.07 ** 1.28 ** 1.02 1.20 0.92 ... ... ... ... 1.01 ** 0.90 ** … …<br />
Northern Africa <strong>and</strong> Western<br />
Asia<br />
0.97 0.95 ** 0.94 ** 0.99 ** … … … ... ... ... ... 0.96 ** … … …<br />
Northern Africa 1.01 ** 0.96 0.99 ** 1.08 1.01 0.98 1.08 ... ... ... ... 0.94 ** 0.76 ** … …<br />
Western Asia 0.98 ** 0.93 ** 0.91 ** 0.95 ** … … … ... ... ... ... 0.97 ** 0.76 ** … …<br />
Pacific 0.94 ** 0.97 ** 0.95 ** 1.39 ** … … … ... ... ... ... … 0.83 ** … …<br />
Southern Asia 1.01 ** 1.06 ** 0.99 ** 0.93 ** 0.99 1.02 0.80 ... ... ... ... 0.91 ** 0.74 … …<br />
Sub-Saharan Africa 0.97 ** 0.93 ** 0.86 ** 0.70 ** 0.97 0.96 0.63 ... ... ... ... 0.86 ** 0.90 … …<br />
0.99 ** 0.83<br />
Conflict-affected countries 0.98 ** 1.00 ** 0.97 ** 0.99 ** 0.97 0.77 0.79 ... ... ... ... 0.92 ** 0.95 … …<br />
0.98 ** …<br />
Countries with low income 1.00 0.93 0.82 ** 0.53 ** 1.01 0.44 0.35 ... ... ... ... 0.85 ** … …<br />
Countries with middle income 1.00 1.00 ** 1.00 ** 1.07 ** 1.01 1.05 1.01 ... ... ... ... 0.96 ** … …<br />
Lower middle 0.98 1.02 ** 0.98 ** 0.97 ** 1.00 1.01 0.96 ... ... ... ... 0.93 ** … …<br />
Upper middle 1.00 0.97 1.03 1.16 1.01 1.06 1.23 ... ... ... ... 1.00 ** … …<br />
Countries with high income 1.00 1.00 1.00 1.25 … … 1.07 ... ... ... ... … … …<br />
Source: UIS database, except where noted. Data presented in the present table come from previous <strong>and</strong> subsequent<br />
statistical tables in the longer <strong>and</strong> or the printed version where they are broken-down by gender (total, male, female).<br />
Gender parity indices in the table are based on those gender break-downs <strong>and</strong> are the ratio of female to male rates.<br />
Note A: The country groupings by level of income are as defined by the World Bank but include only countries listed in the<br />
table. They are based on the list of countries by income group as revised in July 2015.<br />
Note B: See previous <strong>and</strong> subsequent statistical tables for sources of data <strong>and</strong> detailed country notes.<br />
1. Global Education Monitoring Report team calculations, based on data from national <strong>and</strong> international household surveys<br />
compiled in the World Inequality Database in Education (WIDE).<br />
2. Altinok (2013); Cheng <strong>and</strong> Omeova (2014); ministries of education’s national reports <strong>and</strong> websites; EGMA/EGRA; PASEC;<br />
PILNA; PIRLS 2011; PISA 2012; SACMEQ, TERCE, TIMSS 2011; Uwezo. Data on learning outcomes are from nationally<br />
representative national (N), regional (R) <strong>and</strong> international (I) formative learning assessments. Information <strong>and</strong> data need to<br />
be used <strong>and</strong> interpreted with caution since the different types of assessments are not necessary comparable.<br />
3. PIACC 2012 (OECD, 2013).<br />
4. Data are for the most recent year available in the period specified. For details see relevant sources.<br />
5. National population data were used to calculate enrolment ratios due to inconsistencies in the United Nations population<br />
data or lack of United Nations population by age.<br />
Data in bold are for the school year ending in 2015.<br />
(z) Data are for the school year ending in 2013.<br />
(y) Data are for the school year ending in 2012.<br />
(*) National estimate.<br />
(**) For country level data: UIS partial estimate; for regional <strong>and</strong> other country grouping sums <strong>and</strong> weighted averages:<br />
partial imputation due to incomplete country coverage (between 33% <strong>and</strong> 60% of population for the region or other<br />
country grouping).<br />
(…) No data are available.<br />
444
STATISTICAL TABLES<br />
1<br />
TABLE 8<br />
SDG 4, Target 4.5 – Gender – Achieving gender equality in education<br />
By 2030, ensure “substantive gender equality in education through gender-sensitive school <strong>and</strong> learning processes <strong>and</strong> environments, education content <strong>and</strong> teacher training,<br />
<strong>and</strong> challenging gender discrimination <strong>and</strong> unequal social norms in education”<br />
GENDER EQUALITY IN EDUCATION<br />
Female presence in teaching staff Gender-sensitive national curriculum frameworks <strong>and</strong> learning environments 1 Gender discrimination <strong>and</strong> unequal<br />
social norms Child domestic work 7<br />
Preprimary<br />
Percentage of female teachers (%)<br />
Primary<br />
Total<br />
secondary<br />
School year ending in<br />
Tertiary<br />
Inclusion of<br />
gender<br />
equality<br />
issues 2<br />
in national<br />
curriculum<br />
frameworks<br />
3<br />
Percentage of schools<br />
with basic sanitation<br />
facilities or toilets (%)<br />
Total<br />
Of which:<br />
single-sex<br />
toilets<br />
Percentage of students aged 13–15 experiencing<br />
school-related gender-based violence by type of<br />
violence (%)<br />
Bullying<br />
Physical<br />
violence<br />
Early marriage <strong>and</strong> pregnancies<br />
Early marriage<br />
Percentage of<br />
the population<br />
aged 15–19<br />
who are currently<br />
married (%) 5<br />
Early pregnancies<br />
Age-specific<br />
fertility rate<br />
(births per 1,000<br />
women aged<br />
15–19) 6<br />
Percentage of<br />
adolescents ages<br />
12–14 involved in<br />
household chores<br />
during the<br />
previous week<br />
For 28 hours <strong>and</strong> more<br />
2014 2005–2015 4 2014 2014 2009–2015 4 2009–2015 4 2009–2014 4 2016 2009–2014 4<br />
Country or territory<br />
% F % F % F % F Total (%) GPI (F/M) Total GPI (F/M) Female Total GPI (F/M)<br />
Caucasus <strong>and</strong> Central Asia<br />
Armenia 100 y ... ... 57 0 86 … ... ... ... ... 6.4 20 … …<br />
Azerbaijan 100 90 ... 56 0 68 … ... ... ... ... 9.0 66 ... …<br />
Georgia ... 90 80 50 ... 70 … ... ... ... ... 10.6 a 33 ... …<br />
Kazakhstan 98 98 75 65 ... 85 … ... ... ... ... 4.6 a 24 ... …<br />
Kyrgyzstan ... 98 78 59 ... 53 15 ... ... ... ... 9.8 38 1.4 1.80<br />
Tajikistan ... 76 ... 38 ... 29 … ... ... ... ... 14.1 37 ... …<br />
Turkmenistan ... ... ... 50 ... … … ... ... ... ... ... 15 ... …<br />
Uzbekistan ... ... ... ... ... 100 … ... ... ... ... ... 17 ... …<br />
Eastern <strong>and</strong> South-eastern Asia<br />
Brunei Darussalam 96 77 67 47 0 … … 23.4 0.9 24.4 0.5 ... 20 ... …<br />
Cambodia 93 51 ... ... ... 81 … 22.4 1.0 13.8 0.8 9.9 54 ... …<br />
China 97 61 51 ... ... 62 … ... ... ... ... 2.1 7 ... …<br />
DPR Korea ... ... ... ... ... … … ... ... ... ... ... 0,4 ... …<br />
Hong Kong, China ... 78 57 ** ... LOW … … ... ... ... ... 0.3 3 ... …<br />
Indonesia 96 62 53 39 LOW 53 55 ... ... ... ... 13.9 48 ... …<br />
Japan ... ... ... ... ... … … ... ... ... ... 0.6 4 ... …<br />
Lao PDR 98 51 50 ** 36 ... 47 … 13.2 0.7 10.2 0.7 24.8 a 62 ... …<br />
Macao, China 99 87 59 36 ... … … ... ... ... ... 0.3 3 ... …<br />
Malaysia 96 70 65 52 ... 100 … 20.9 0.7 30.1 0.6 6.0 14 ... …<br />
Mongolia 98 y 95 73 60 ... 52 … 30.5 0.7 43.8 0.4 3.6 a 12 11.8 1.17<br />
Myanmar 99 84 87 80 y 0 23 … ... ... ... ... 12.5 15 ... …<br />
Philippines ... 87 z 73 z ... 0 53 … 47.7 1.0 37.7 0.7 10.0 a 66 ... …<br />
Republic of Korea 99 z 79 z 58 z 35 z LOW … … ... ... ... ... ... 1 ... …<br />
Singapore ... ... ... 35 z ... … … ... ... ... ... 0.4 4 ... …<br />
Thail<strong>and</strong> ... ... ... 61 LOW 45 … 33.2 0.7 29.0 0.6 11.3 45 ... …<br />
Timor-Leste ... ... ... ... ... 64 … ... ... ... ... 8.3 41 ... …<br />
Viet Nam 99 75 ... 49 ... 72 … 26.1 1.0 21.8 0.4 8.4 41 1.6 1.07<br />
Europe <strong>and</strong> Northern America<br />
Albania 100 84 65 52 ... 30 37 ... ... ... ... 7.0 23 … …<br />
Andorra 89 80 64 45 ... … … ... ... ... ... ... … ... …<br />
Austria 99 91 65 43 ... … … ... ... ... ... 2.7 a 6 ... …<br />
Belarus 99 100 81 61 ... 100 … ... ... ... ... 7.5 a 15 ... …<br />
Belgium 97 82 63 48 0 … … ... ... ... ... 2.2 a 7 ... …<br />
Bosnia <strong>and</strong> Herzegovina 98 y 85 61 43 ... 100 … ... ... ... ... 0.7 a 6 ... …<br />
Bulgaria 100 94 79 48 ... 100 … ... ... ... ... 1.2 33 ... …<br />
Canada ... ... ... ... ... … … ... ... ... ... 2.2 a 8 ... …<br />
Croatia 99 93 67 48 LOW 100 … ... ... ... ... 2.0 a 8 ... …<br />
Cyprus 99 84 66 39 ... … … ... ... ... ... 3.1 a 5 ... …<br />
Czech Republic ... ... ... ... ... … … ... ... ... ... 0.2 9 ... …<br />
Denmark ... ... ... ... ... … … ... ... ... ... 0.1 4 ... …<br />
Estonia ... 92 z 77 z ... LOW … … ... ... ... ... 0.4 10 ... …<br />
Finl<strong>and</strong> 97 z 79 z 65 z 51 z ... … … ... ... ... ... 0.4 6 ... …<br />
France 83 z 83 z 59 z 37 z LOW … … ... ... ... ... 2.7 a 8 ... …<br />
Germany 97 87 62 38 ... … … ... ... ... ... 0.3 5 ... …<br />
Greece 99 70 58 33 ... … … ... ... ... ... 1.8 a 6 ... …<br />
Hungary 100 97 71 43 LOW … … ... ... ... ... 0.6 a 17 ... …<br />
Icel<strong>and</strong> 94 z 82 z ... 48 y LOW … … ... ... ... ... 0.6 a 4 ... …<br />
Irel<strong>and</strong> ... 85 y ... ... LOW … … ... ... ... ... 0.3 9 ... …<br />
Italy 98 z 96 z 72 z 37 z ... … … ... ... ... ... 0.3 6 ... …<br />
Latvia 100 93 83 56 ... … … ... ... ... ... 0.8 12 ... …<br />
Liechtenstein 100 y 77 y ... 30 y ... … … ... ... ... ... 0.2 a … ... …<br />
Lithuania 99 97 82 56 LOW … … ... ... ... ... 0.0 8 ... …<br />
Luxembourg ... ... ... 49 y HIGH … … ... ... ... ... 1.0 a 5 ... …<br />
Malta 97 86 64 34 0 … … ... ... ... ... 0.5 15 ... …<br />
Monaco ... ... ... ... ... … … ... ... ... ... ... … ... …<br />
Montenegro ... ... ... ... ... 95 … ... ... ... ... 3.6 11 0 .<br />
Netherl<strong>and</strong>s 87 86 ... 40 y ... … … ... ... ... ... 0.2 3 ... …<br />
Norway ... 75 62 45 0 … … ... ... ... ... 0.1 a 6 ... …<br />
Pol<strong>and</strong> 98 z 85 z 70 z 44 z ... … … ... ... ... ... 1.2 a 12 ... …<br />
Portugal 99 80 70 44 z 0 … … ... ... ... ... 0.6 8 ... …<br />
Republic of Moldova 100 y 98 78 56 z ... 70 … ... ... ... ... 9.9 a 20 ... …<br />
Romania 100 89 70 49 ... 90 … ... ... ... ... 6.7 a 32 ... …<br />
Russian Federation ... 99 82 y 57 y ... 100 … ... ... ... ... 7.5 a 20 ... …<br />
San Marino 96 y 91 y ... ... ... … … ... ... ... ... 0.0 … ... …<br />
Serbia 98 85 64 43 LOW 95 … ... ... ... ... 5.2 a 17 1.5 1.07<br />
Slovakia 100 90 75 45 ... … … ... ... ... ... 1.2 19 ... ...<br />
Slovenia 98 z 97 z 73 z 40 z ... … … ... ... ... ... 0.3 3 ... ...<br />
445
1 ANNEX<br />
TABLE 8<br />
(Continued)<br />
GENDER EQUALITY IN EDUCATION<br />
Female presence in teaching staff Gender-sensitive national curriculum frameworks <strong>and</strong> learning environments 1 Gender discrimination <strong>and</strong> unequal<br />
social norms Child domestic work 7<br />
Preprimary<br />
Percentage of female teachers (%)<br />
Primary<br />
Total<br />
secondary<br />
School year ending in<br />
Tertiary<br />
Inclusion of<br />
gender<br />
equality<br />
issues 2<br />
in national<br />
curriculum<br />
frameworks<br />
3<br />
Percentage of schools<br />
with basic sanitation<br />
facilities or toilets (%)<br />
Total<br />
Of which:<br />
single-sex<br />
toilets<br />
Percentage of students aged 13–15 experiencing<br />
school-related gender-based violence by type of<br />
violence (%)<br />
Bullying<br />
Physical<br />
violence<br />
Early marriage <strong>and</strong> pregnancies<br />
Early marriage<br />
Percentage of<br />
the population<br />
aged 15–19<br />
who are currently<br />
married (%) 5<br />
Early pregnancies<br />
Age-specific<br />
fertility rate<br />
(births per 1,000<br />
women aged<br />
15–19) 6<br />
Percentage of<br />
adolescents ages<br />
12–14 involved in<br />
household chores<br />
during the<br />
previous week<br />
For 28 hours <strong>and</strong> more<br />
2014 2005–2015 4 2014 2014 2009–2015 4 2009–2015 4 2009–2014 4 2016 2009–2014 4<br />
Country or territory<br />
% F % F % F % F Total (%) GPI (F/M) Total GPI (F/M) Female Total GPI (F/M)<br />
Spain ... 76 y 55 y 40 y ... … … ... ... ... ... 3.5 a 8 ... ...<br />
Sweden ... 82 y 58 y 43 y LOW … … ... ... ... ... 0.4 a 6 ... ...<br />
Switzerl<strong>and</strong> 97 82 48 y 34 ... … … ... ... ... ... 0.4 a 2 ... ...<br />
TFYR Macedonia 99 y 81 z 57 z 48 z ... … … ... ... ... ... 4.3 a 16 0.3 .<br />
Ukraine 99 y 99 88 ... ... 100 … ... ... ... ... 6.4 a 20 0.5 3.00<br />
United Kingdom ... ... 61 44 0 … … ... ... ... ... 2.9 a 11 ... ...<br />
United States 94 87 62 49 ... … … ... ... ... ... ... 15 ... ...<br />
Latin America <strong>and</strong> the Caribbean<br />
Anguilla ... ... ... ... ... 100 … 27.8 1.2 35.7 0.7 ... … ... ...<br />
Antigua <strong>and</strong> Barbuda 100 y 93 73 54 y ... 100 … 24.9 1.1 47.5 0.7 ... 40 ... ...<br />
Argentina ... ... ... ... 0 68 … 24.5 1.0 34.1 0.6 12.7 a 64 ... ...<br />
Aruba 98 y 85 y 59 y 54 ... … … ... ... ... ... 0.8 18 0.5 2.67<br />
Bahamas ... ... ... ... ... … … 23.6 0.9 40.0 0.8 2.4 a 25 ... ...<br />
Barbados 94 84 ... ... ... 100 … 13.3 0.7 38.4 0.6 2.4 a 34 0 .<br />
Belize 99 74 63 51 LOW 21 32 30.7 1.0 36.0 0.7 3.3 62 1.5 0.93<br />
Bermuda 100 88 70 55 ... … … ... ... ... ... 0.1 … ... ...<br />
Bolivia, P.S. ... ... ... ... ... 74 … 30.2 0.9 33.0 0.5 11.6 a 69 ... ...<br />
Brazil 95 90 65 45 0 98 … ... ... ... ... 3.9 66 ... ...<br />
British Virgin Isl<strong>and</strong>s ... 89 69 ... ... 100 … 17.2 0.9 35.0 0.6 ... … ... ...<br />
Cayman Isl<strong>and</strong>s 9 90 y 88 z 67 y ... ... … … ... ... ... ... 1.1 … ... ...<br />
Chile ... 81 z 59 z 43 z LOW 90 … 15.1 0.9 28.5 0.5 5.7 a 46 ... ...<br />
Colombia 96 77 52 36 ... 100 … ... ... ... ... 13.7 a 43 ... ...<br />
Costa Rica 93 80 57 ... ... 53 … 19.0 1.1 22.1 0.4 9.0 a 54 1.4 0.53<br />
Cuba 100 y 80 61 54 ... 100 … ... ... ... ... 22.0 a 43 ... ...<br />
Curaçao ... ... ... ... ... … … ... ... ... ... ... 33 ... ...<br />
Dominica 100 87 73 ... LOW 100 … 27.4 0.9 39.1 0.6 ... … ... ...<br />
Dominican Republic 94 79 67 43 LOW 60 … ... ... ... ... 18.7 a 95 ... ...<br />
Ecuador 81 z 73 66 34 y ... 54 … ... ... ... ... 20.0 a 74 ... ...<br />
El Salvador 98 z 71 z 53 z 37 LOW 67 … ... ... ... ... ... 64 ... ...<br />
Grenada 100 79 63 ... LOW 100 … ... ... ... ... ... 26 ... ...<br />
Guatemala 92 y 65 47 ... MEDIUM 49 50 ... ... ... ... 19.8 a 77 ... ...<br />
Guyana 100 y 89 y 71 y 53 y ... 68 … 38.4 0.9 37.9 0.5 13.3 86 ... ...<br />
Haiti ... ... ... ... 0 60 … ... ... ... ... 10.6 37 ... ...<br />
Honduras 97 70 61 39 LOW 46 47 31.6 1.0 28.0 0.6 22.6 a 61 ... ...<br />
Jamaica ... 89 70 ... ... 80 85 40.2 1.0 50.1 0.6 3.4 a 55 0.2 1.00<br />
Mexico 95 68 ... ... LOW 68 69 ... ... ... ... 16.1 a 60 ... ...<br />
Montserrat ... 98 74 ... ... 100 … ... ... ... ... 0.0 … ... ...<br />
Nicaragua ... ... ... ... MEDIUM 26 … ... ... ... ... ... 85 ... ...<br />
Panama 95 z 73 z 59 z 47 z LOW 84 85 ... ... ... ... 18.1 a 71 ... ...<br />
Paraguay 89 y 71 y 62 y ... HIGH 70 … ... ... ... ... ... 55 ... ...<br />
Peru 96 y 67 44 ... LOW 51 55 47.4 1.0 36.9 0.4 10.6 a 46 ... ...<br />
Saint Kitts <strong>and</strong> Nevis 100 90 69 ... ... 100 … 22.7 0.8 37.8 0.7 ... … ... ...<br />
Saint Lucia 100 88 70 52 ... 100 … ... ... ... ... 5.0 a 52 0.2 .<br />
Saint Martin ... ... ... ... ... … … ... ... ... ... ... … ... ...<br />
St. Vincent <strong>and</strong> the Grenadines 100 z 80 66 ... ... 100 … ... ... ... ... ... 48 ... ...<br />
Sint Maarten ... 89 58 54 ... … … ... ... ... ... 0.6 … ... ...<br />
Suriname 100 94 71 z ... ... 65 68 26.3 1.0 20.5 0.4 2.3 44 0 .<br />
Trinidad <strong>and</strong> Tobago ... ... ... ... ... 100 … 15.4 0.7 35.9 0.6 2.1 28 ... ...<br />
Turks <strong>and</strong> Caicos Isl<strong>and</strong>s ... 93 60 ... ... 100 … ... ... ... ... ... … ... ...<br />
Uruguay ... ... ... ... LOW 100 … ... ... ... ... 11.1 a 54 ... ...<br />
Venezuela, B.R. ... ... ... ... 0 93 … ... ... ... ... ... 78 ... ...<br />
Northern Africa <strong>and</strong> Western Asia<br />
Algeria ... 65 ... 42 ... 100 … 51.7 1.1 47.7 0.6 ... 10 0.5 1.50<br />
Bahrain 100 75 58 36 ... 100 … ... ... ... ... 5.3 13 ... ...<br />
Egypt 98 59 45 44 ... 100 … 70.0 1.0 45.1 0.5 14.4 49 ... ...<br />
Iraq ... ... ... ... LOW 100 … 27.7 0.7 37.1 0.5 20.7 88 ... ...<br />
Israel 10 ... ... ... ... ... … … ... ... ... ... 2.8 8 4 2.68<br />
Jordan 100 y ... ... ... ... 50 68 ... ... ... ... 5.9 20 0.2 .<br />
Kuwait 100 91 ... ... ... 100 … 27.7 0.5 44.9 0.5 ... 8 ... ...<br />
Lebanon 98 87 66 48 ... … … 25.1 0.5 48.5 0.4 ... 11 1.7 7.75<br />
Libya ... ... ... ... ... 65 … ... ... ... ... ... 6 ... ...<br />
Morocco 71 55 35 z ... ... 73 … 19.0 1.2 42.6 0.4 11.0 30 ... ...<br />
Oman 100 ... ... 35 ... 94 … 47.4 1.1 50.0 0.8 4.1 5 ... ...<br />
Palestine 100 71 51 23 0 83 … ... ... ... ... 6.3 56 0.4 7.00<br />
Qatar 100 86 55 37 LOW 100 … 42.1 0.7 50.6 0.6 ... 10 ... ...<br />
Saudi Arabia 100 52 51 40 ... … … ... ... ... ... ... 7 ... ...<br />
Sudan 97 z 64 z 54 z 30 z ... 44 … ... ... ... ... 23.5 64 ... ...<br />
Syrian Arab Republic 98 z ... ... ... ... … … ... ... ... ... ... 37 ... ...<br />
Tunisia ... 59 ... 48 ... 99 60 ... ... ... ... 1.2 7 ... ...<br />
Turkey 94 z 58 z 48 z 42 z ... 99 … ... ... ... ... 6.6 24 ... ...<br />
United Arab Emirates 99 91 61 32 ... 100 … 22.8 0.8 46.6 0.6 ... 32 ... ...<br />
Yemen ... ... ... ... ... 53 … ... ... ... ... 16.7 58 ... ...<br />
446
STATISTICAL TABLES<br />
1<br />
TABLE 8<br />
(Continued)<br />
GENDER EQUALITY IN EDUCATION<br />
Female presence in teaching staff Gender-sensitive national curriculum frameworks <strong>and</strong> learning environments 1 Gender discrimination <strong>and</strong> unequal<br />
social norms Child domestic work 7<br />
Preprimary<br />
Percentage of female teachers (%)<br />
Primary<br />
Total<br />
secondary<br />
School year ending in<br />
Tertiary<br />
Inclusion of<br />
gender<br />
equality<br />
issues 2<br />
in national<br />
curriculum<br />
frameworks<br />
3<br />
Percentage of schools<br />
with basic sanitation<br />
facilities or toilets (%)<br />
Total<br />
Of which:<br />
single-sex<br />
toilets<br />
Percentage of students aged 13–15 experiencing<br />
school-related gender-based violence by type of<br />
violence (%)<br />
Bullying<br />
Physical<br />
violence<br />
Early marriage <strong>and</strong> pregnancies<br />
Early marriage<br />
Percentage of<br />
the population<br />
aged 15–19<br />
who are currently<br />
married (%) 5<br />
Early pregnancies<br />
Age-specific<br />
fertility rate<br />
(births per 1,000<br />
women aged<br />
15–19) 6<br />
Percentage of<br />
adolescents ages<br />
12–14 involved in<br />
household chores<br />
during the<br />
previous week<br />
For 28 hours <strong>and</strong> more<br />
Country or territory<br />
2014 2005–2015 4 2014 2014 2009–2015 4 2009–2015 4 2009–2014 4 2016 2009–2014 4<br />
% F % F % F % F Total (%) GPI (F/M) Total GPI (F/M) Female Total GPI (F/M)<br />
The Pacific<br />
Australia ... ... ... 44 z LOW … … ... ... ... ... 0.5 13 ... ...<br />
Cook Isl<strong>and</strong>s 100 87 55 47 0 … … 33.0 1.2 40.8 0.7 ... … ... ...<br />
Fiji ... 59 y 57 y ... 0 95 … 42.0 0.9 47.3 0.6 ... 47 ... ...<br />
Kiribati ... 82 ... . y LOW 4 … 36.8 0.8 35.3 0.7 15.4 13 ... ...<br />
Marshall Isl<strong>and</strong>s ... ... ... 44 y ... 10 … ... ... ... ... ... … ... ...<br />
Micronesia F.S. ... ... ... ... 0 … … ... ... ... ... ... 11 ... ...<br />
Nauru 100 93 58 ... 0 … … 38.9 1.0 45.2 0.9 ... … ... ...<br />
New Zeal<strong>and</strong> 98 84 62 49 0 … … ... ... ... ... ... 22 ... ...<br />
Niue ... ... ... ... ... 100 … 35.5 ... 32.9 ... ... … ... ...<br />
Palau 100 ... ... 54 z ... 100 … ... ... ... ... ... … ... ...<br />
Papua New Guinea ... ... 42 y ... LOW … … ... ... ... ... ... 53 ... ...<br />
Samoa 95 ... ... ... 0 … … ... ... ... ... 7.0 a 22 ... ...<br />
Solomon Isl<strong>and</strong>s 87 47 30 y ... ... 66 66 ... ... ... ... ... 43 ... ...<br />
Tokelau ... ... ... ... LOW … … 40.5 1.0 75.1 0.7 2.0 … ... ...<br />
Tonga 100 72 66 ... ... … … 50.3 1.1 49.1 1.0 4.6 a 14 ... ...<br />
Tuvalu 100 ... ... ... MEDIUM 60 … 26.9 0.4 71.1 0.9 ... … ... ...<br />
Vanuatu 95 z 56 z ... ... ... 69 70 67.3 1.0 50.5 0.7 11.5 a 41 ... ...<br />
Southern Asia<br />
Afghanistan ... 31 z ... 11 0 58 … 44.2 1.1 40.6 0.7 19.7 a 60 3.6 5.64<br />
Bangladesh ... ... 21 z 18 ... 60 … 23.6 0.6 21.1 0.4 44.7 81 ... ...<br />
Bhutan 99 41 39 27 y MEDIUM 74 73 ... ... ... ... 15.2 a 15 0.9 3.25<br />
India ... 48 z 45 z 39 z LOW 53 78 ... ... ... ... 21.1 19 ... ...<br />
Iran, Islamic Republic of ... 66 54 30 ... 86 … ... ... ... ... 21.1 25 ... ...<br />
Maldives 100 75 ... ... 0 73 … 30.1 1.0 31.7 0.6 5.0 4 ... ...<br />
Nepal 90 42 22 ** ... MEDIUM 68 … ... ... ... ... 23.1 69 7 3.22<br />
Pakistan ... 50 ... 37 LOW 63 … ... ... ... ... 13.1 37 ... ...<br />
Sri Lanka ... ... ... ... ... 82 … ... ... ... ... ... 12 ... ...<br />
Sub-Saharan Africa<br />
Angola ... ... ... ... ... 54 … ... ... ... ... ... 153 ... ...<br />
Benin 73 23 11 ... ... 74 … 42.1 1.0 32.0 0.8 15.3 76 ... ...<br />
Botswana 98 y 74 z 53 z ... ... 50 … ... ... ... ... ... 26 ... ...<br />
Burkina Faso 85 z 42 16 8 z ... 39 73 ... ... ... ... 31.1 102 ... ...<br />
Burundi 84 52 23 12 z ... 53 … ... ... ... ... 8.4 26 ... ...<br />
Cabo Verde 100 68 43 40 ... 100 … ... ... ... ... ... 72 ... ...<br />
Cameroon 97 53 33 ... ... 41 … ... ... ... ... 20.1 93 ... ...<br />
Central African Republic ... 20 y 11 y ... ... 44 … ... ... ... ... 54.9 a 86 3.3 2.67<br />
Chad 81 z ... ... ... ... 36 40 ... ... ... ... 47.8 a 115 3.8 2.57<br />
Comoros ... 43 z ... ... ... 50 … ... ... ... ... 13.1 62 ... ...<br />
Congo 99 y 54 y 9 y ... ... 15 … ... ... ... ... 18.3 a 110 ... ...<br />
Côte d’Ivoire 96 26 15 15 LOW 45 … ... ... ... ... 21.9 136 ... ...<br />
Democratic Rep. of the Congo 95 28 12 8 z 0 29 … ... ... ... ... 21.3 121 2 5.50<br />
Djibouti ... 26 25 ... LOW 85 83 ... ... ... ... ... 20 ... ...<br />
Equatorial Guinea 89 y 39 y ... ... ... 40 … ... ... ... ... 22.0 a 103 ... ...<br />
Eritrea 98 z 37 z 18 z ... ... 66 … ... ... ... ... ... 48 ... ...<br />
Ethiopia ... 42 24 **, y 12 ... 37 … ... ... ... ... 19.0 a 50 ... ...<br />
Gabon ... ... ... ... ... 61 … ... ... ... ... 10.1 89 ... ...<br />
Gambia 50 31 14 8 y LOW 71 … ... ... ... ... 25.0 110 ... ...<br />
Ghana 83 39 24 19 LOW 62 … 54.4 ... 27.1 0.8 7.6 63 ... ...<br />
Guinea ... 30 ... 3 ... 69 … ... ... ... ... 33.6 135 ... ...<br />
Guinea-Bissau ... ... ... ... ... 28 … ... ... ... ... 18.5 a 80 1.4 4.40<br />
Kenya 77 48 **, y 41 **, y ... ... 20 21 ... ... ... ... 14.6 88 ... ...<br />
Lesotho 98 76 56 **, z 50 MEDIUM 40 … ... ... ... ... 11.5 a 95 ... ...<br />
Liberia ... 14 5 12 y ... 82 … ... ... ... ... 14.5 100 ... ...<br />
Madagascar 89 56 44 32 z ... 29 … ... ... ... ... 27.4 109 7.6 0.99<br />
Malawi ... 41 20 ... ... 25 … ... ... ... ... 23.9 a 132 4.5 3.24<br />
Mali 92 29 18 9 y ... 24 … ... ... ... ... 42.2 170 ... ...<br />
Mauritania 96 36 12 7 z ... 27 33 47.2 1.0 57.8 0.7 25.7 75 6.4 3.28<br />
Mauritius 100 75 59 ... LOW 100 … ... ... ... ... 7.0 a 28 ... ...<br />
Mozambique ... 42 21 **, z 26 ... 50 53 ... ... ... ... 36.6 126 ... ...<br />
Namibia ... ... ... ... LOW 80 … 46.6 0.9 35.8 0.7 4.1 74 ... ...<br />
Niger 90 48 20 13 y LOW 14 … ... ... ... ... 59.8 a 196 ... ...<br />
Nigeria ... ... ... ... ... 32 59 ... ... ... ... 29.6 104 1.1 1.44<br />
Rw<strong>and</strong>a 85 z 53 29 z 17 z MEDIUM 95 … ... ... ... ... 3.4 23 ... ...<br />
Sao Tome <strong>and</strong> Principe 94 56 34 28 ... 87 … ... ... ... ... 22.8 80 9.2 2.18<br />
Senegal 75 32 ... ... ... 66 … ... ... ... ... 24.7 70 ... ...<br />
Seychelles 100 88 62 39 LOW 100 … ... ... ... ... ... 55 ... ...<br />
Sierra Leone 82 z 27 z 13 z ... ... 62 … ... ... ... ... 20.0 111 0.8 0.78<br />
Somalia ... ... ... ... ... 45 … ... ... ... ... ... 97 13.8 2.83<br />
South Africa 80 ** 78 ** ... ... 0 100 … ... ... ... ... 5.7 a 40 ... ...<br />
South Sudan ... ... ... ... MEDIUM 42 … ... ... ... ... 40.1 a 54 ... ...<br />
Swazil<strong>and</strong> ... 70 z 49 z 38 z ... 72 … 32.1 0.9 19.4 0.5 4.3 a 54 0.1 .<br />
447
1 ANNEX<br />
TABLE 8<br />
(Continued)<br />
GENDER EQUALITY IN EDUCATION<br />
Female presence in teaching staff Gender-sensitive national curriculum frameworks <strong>and</strong> learning environments 1 Gender discrimination <strong>and</strong> unequal<br />
social norms Child domestic work 7<br />
Preprimary<br />
Percentage of female teachers (%)<br />
Primary<br />
Total<br />
secondary<br />
School year ending in<br />
Tertiary<br />
Inclusion of<br />
gender<br />
equality<br />
issues 2<br />
in national<br />
curriculum<br />
frameworks<br />
3<br />
Percentage of schools<br />
with basic sanitation<br />
facilities or toilets (%)<br />
Total<br />
Of which:<br />
single-sex<br />
toilets<br />
Percentage of students aged 13–15 experiencing<br />
school-related gender-based violence by type of<br />
violence (%)<br />
Bullying<br />
Physical<br />
violence<br />
Early marriage <strong>and</strong> pregnancies<br />
Early marriage<br />
Percentage of<br />
the population<br />
aged 15–19<br />
who are currently<br />
married (%) 5<br />
Early pregnancies<br />
Age-specific<br />
fertility rate<br />
(births per 1,000<br />
women aged<br />
15–19) 6<br />
Percentage of<br />
adolescents ages<br />
12–14 involved in<br />
household chores<br />
during the<br />
previous week<br />
For 28 hours <strong>and</strong> more<br />
Country or territory<br />
2014 2005–2015 4 2014 2014 2009–2015 4 2009–2015 4 2009–2014 4 2016 2009–2014 4<br />
% F % F % F % F Total (%) GPI (F/M) Total GPI (F/M) Female Total GPI (F/M)<br />
Togo 94 16 ... 6 ... 22 … ... ... ... ... 13.2 92 1.8 3.00<br />
Ug<strong>and</strong>a 86 z 42 z 24 z ... ... 75 … ... ... ... ... 18.2 97 ... ...<br />
United Republic of Tanzania ... 52 z 28 y 30 y LOW 11 47 26.9 1.1 30.9 0.8 20.6 114 ... ...<br />
Zambia ... ... ... ... MEDIUM 45 40 ... ... ... ... 16.7 78 ... ...<br />
Zimbabwe 93 z 56 z 46 z 32 z ... 43 … ... ... ... ... 22.1 a 106 ... ...<br />
Weighted Average Median Median Median Weighted Average Median<br />
World 94 ** 64 ** 53 ** 42 ** ... 69 … … … … … 13.9 42 ... ...<br />
... ...<br />
Countries in transition 98 **, y 94 76 **, z 54 **, z ... 86 … … … … … 7.4 23 ... ...<br />
Developed countries 95 ** 83 ** 60 ** 41 ... … … … … … … 1.5 11 ... ...<br />
Developing countries 93 59 ** 49 ** 40 ** ... 67 … … … … … 15.2 46 ... ...<br />
Caucasus <strong>and</strong> Central Asia 98 ** 90 ** 70 **, y 54 ** ... 70 … … … … … 8.5 28 ... ...<br />
Eastern <strong>and</strong> South-eastern<br />
Asia<br />
97 64 52 40 **, y ... 53 … … … … … 5.2 22 ... ...<br />
Eastern Asia 98 62 50 38 **, y ... … … … … … … 2.0 7 ... ...<br />
South-eastern Asia 97 68 58 49 ... 53 … … … … … 11.5 45 ... ...<br />
Europe <strong>and</strong> Northern America 95 ** 86 67 ** 47 ** ... … … … … … … 3.4 13 ... ...<br />
Latin America <strong>and</strong> the<br />
Caribbean<br />
95 ** 77 58 ** 41 ** ... 87 … … … … … … 62 ... ...<br />
Caribbean 95 **, z 68 ** 54 51 ... 100 … … … … … … 57 ... ...<br />
Latin America 95 78 59 ** 40 ** ... 68 … … … … … 10.4 62 ... ...<br />
Northern Africa <strong>and</strong> Western<br />
Asia<br />
93 ** 60 ** 48 ** 39 ** ... 99 … … … … … … 40 ... ...<br />
Northern Africa 87 ** 60 44 ** 39 ... 86 … … … … … … 41 ... ...<br />
Western Asia 98 ** 61 ** 50 ** 39 ** ... 100 … … … … … … 39 ... ...<br />
Pacific ... ... ... 44 ** ... 68 … 38.9 40.1 … 47.3 … 27 ... ...<br />
Southern Asia ... 49 ** 42 ** 36 ** ... 68 … … … … … … 29 ... ...<br />
Sub-Saharan Africa 76 ** 44 ** 29 ** 21 ** ... 48 … … … … … 22.6 97 ... ...<br />
Conflict-affected countries 94 **, y 55 ** 49 ** 41 ** ... 53 … … … … … 19.5 44 ... ...<br />
Countries with low income 82 ** 40 23 ** 18 ** ... 48 … … … … … 23.2 91 ... ...<br />
Countries with middle income 94 61 ** 51 ** 42 ** ... 68 … … … … … 14.0 38 ... ...<br />
Lower middle 91 ** 56 ** 48 ** 40 ** ... 63 … … … … … 20.5 43 ... ...<br />
Upper middle 96 66 55 43 ** ... 85 … … … … … 5.4 30 ... ...<br />
Countries with high income 96 ** 82 ** 62 ** 42 ** ... … … … … … … 3.4 16 ... ...<br />
Source: UIS database, except where noted.<br />
Note: The country groupings by level of income are as defined by the World Bank but include only countries listed in the<br />
table. They are based on the list of countries by income group as revised in July 2015.<br />
1. UNESCO-IBE (2016); UNICEF-WASH-Report (2015); Global School-based Student Health Survey.<br />
2. Key terms included are a) gender equality, b) gender equity, c) empowerment of girls/women, d) gender sensitive(ity)<br />
<strong>and</strong> e) gender parity. The degree of inclusion of the issue in curricula is assessed as LOW if 1 or 2 of the 5 items are covered,<br />
MEDIUM if 3 are covered <strong>and</strong> HIGH if 4 or 5 are covered; 0 indicates no inclusion of any items.<br />
3. Curricula referred to are for primary education, lower secondary education or both.<br />
4. Data are for the most recent year available in the period specified. For details see relevant sources.<br />
5. United Nations, Department of Economic <strong>and</strong> Social Affairs, Population Division: World Marriage Data 2015 (POP/DB/<br />
Marr/Rev2015); GEM Report team calculations for total values <strong>and</strong> weighted averages.<br />
6. The fertility indicators are from the United Nations Population Division estimates, revision 2015 (United Nations, 2015).<br />
They are based on the median variant.<br />
7. UNICEF-MICS 4 <strong>and</strong> 5, country reports. Child domestic work refers to household chores such as cooking, cleaning <strong>and</strong><br />
caring for children, as well as collecting firewood <strong>and</strong> fetching water.<br />
a. Includes consensual unions<br />
Data in bold are for the school year ending in 2015.<br />
(z) Data are for the school year ending in 2013.<br />
(y) Data are for the school year ending in 2012.<br />
(*) National estimate.<br />
(**) For country level data: UIS partial estimate; for regional <strong>and</strong> other country grouping sums <strong>and</strong> weighted averages:<br />
partial imputation due to incomplete country coverage (between 33% <strong>and</strong> 60% of population for the region or other<br />
country grouping).<br />
(-) Magnitude nil or negligible<br />
(.) The category is not applicable or does not exist.<br />
(…) No data are available.<br />
448
STATISTICAL TABLES<br />
1<br />
TABLE 9<br />
SDG 4, Target 4.5 - Equity - Equal completion of school for vulnerable groups<br />
By 2030, eliminate gender disparities in education <strong>and</strong> ensure equal access at all levels of education <strong>and</strong> vocational training for the vulnerable, including persons with disabilities,<br />
indigenous <strong>people</strong>s <strong>and</strong> children in vulnerable situations<br />
DISPARITY IN SCHOOL COMPLETION 1<br />
Primary completion rate <strong>and</strong> disparity<br />
by location <strong>and</strong> wealth<br />
Lower secondary completion rate <strong>and</strong> disparity<br />
by location <strong>and</strong> wealth<br />
Upper secondary completion rate <strong>and</strong> disparity<br />
by location <strong>and</strong> wealth<br />
Location<br />
Wealth<br />
Completion rate (%) of the<br />
poorest students Location Wealth<br />
Completion rate (%) of the<br />
poorest students Location Wealth<br />
Completion rate (%) of the<br />
poorest students<br />
Location<br />
parity<br />
index 2<br />
Wealth<br />
parity<br />
index 3<br />
Poorest<br />
females<br />
Poorest<br />
males<br />
Location<br />
parity<br />
index 2<br />
Wealth<br />
parity<br />
index 3<br />
Poorest<br />
females<br />
Poorest<br />
males<br />
Location<br />
parity<br />
index 2<br />
Wealth<br />
parity<br />
index 3<br />
Poorest<br />
females<br />
Poorest<br />
males<br />
Country or territory<br />
2009–<br />
2014<br />
2009–<br />
2014<br />
2009–<br />
2014<br />
2009–<br />
2014<br />
2009–<br />
2014<br />
2009–<br />
2014<br />
2009–<br />
2014<br />
2009–<br />
2014<br />
2009–<br />
2014<br />
2009–<br />
2014<br />
2009–<br />
2014<br />
2009–<br />
2014<br />
Reference years<br />
<strong>and</strong> surveys<br />
Caucasus <strong>and</strong> Central Asia<br />
Armenia 1.00 1.00 100 100 0.99 0.99 100 98 0.96 0.90 94 82 2010 DHS<br />
Azerbaijan … … … … … … … … … … … … …<br />
Georgia … … … 0.99 0.99 96 100 0.98 0.89 92 85 2013 HIS<br />
Kazakhstan 1.00 1.00 100 100 1.00 1.00 99 100 0.95 0.89 88 88 2010 MICS<br />
Kyrgyzstan 1.00 1.00 100 99 0.99 1.01 98 99 0.90 0.92 89 86 2012 DHS<br />
Tajikistan 0.99 0.98 97 98 0.95 0.88 77 90 0.77 0.66 38 66 2012 DHS<br />
Turkmenistan … … … … … … … … … … … … …<br />
Uzbekistan … … … … … … … … … … … … …<br />
Eastern <strong>and</strong> South-eastern Asia<br />
Brunei Darussalam … … … … … … … … … … … … …<br />
Cambodia 0.80 0.46 49 33 0.57 0.27 19 17 0.28 0.09 5 3 2014 DHS<br />
China 0.93 0.91 89 88 0.81 0.71 66 60 0.47 0.49 32 21 2010 CFPS<br />
DPR Korea … … … … … … … … … … … … …<br />
Hong Kong, China … … … … … … … … … … … … …<br />
Indonesia 0.95 0.88 88 86 0.78 0.55 50 53 0.54 0.26 20 24 2012 DHS<br />
Japan … … … … … … … … … … … … …<br />
Lao PDR 0.72 0.35 29 40 0.35 0.05 2 5 0.26 0.03 1 3 2011 MICS<br />
Macao, China … … … … … … … … … … … … …<br />
Malaysia … … … … … … … … … … … … …<br />
Mongolia 0.97 0.94 97 92 0.72 0.54 62 46 0.47 0.29 45 14 2010 MICS<br />
Myanmar … … … … … … … … … … … … …<br />
Philippines 0.94 0.70 84 63 0.82 0.40 53 31 0.81 0.36 45 29 2013 DHS<br />
Republic of Korea … … … … … … … … … … … … …<br />
Singapore … … … … … … … … … … … … …<br />
Thail<strong>and</strong> … … … … … … … … … … … … …<br />
Timor-Leste 0.71 0.39 31 32 0.56 0.33 22 26 0.41 0.13 5 10 2009 DHS<br />
Viet Nam 0.98 0.89 88 86 0.88 0.57 61 51 0.68 0.21 19 19 2013 MICS<br />
Europe <strong>and</strong> Northern America<br />
Albania … … … … … … … … … … … … …<br />
Andorra … … … … … … … … … … … … …<br />
Austria … … … … … … … … 1.12 0.88 82 81 2013 EU-SILC<br />
Belarus 1.00 1.00 100 100 1.01 1.00 99 100 0.93 0.74 59 75 2012 MICS<br />
Belgium … … … … … … … … 0.65 71 49 2013 EU-SILC<br />
Bosnia <strong>and</strong> Herzegovina 1.02 0.99 98 100 0.94 0.89 89 89 0.81 0.50 61 35 2011 MICS<br />
Bulgaria … … … … … … … … 0.78 0.53 … … 2013 EU-SILC<br />
Canada … … … … … … … … 0.94 0.78 78 67 2010 SLID<br />
Croatia … … … … … … … … 0.99 0.94 88 98 2013 EU-SILC<br />
Cyprus … … … … … … … … 1.01 0.85 94 75 2013 EU-SILC<br />
Czech Republic … … … … … … … … 1.02 0.78 79 74 2013 EU-SILC<br />
Denmark … … … … … … … … 0.76 0.86 75 71 2013 EU-SILC<br />
Estonia … … … … … … … … 0.89 0.85 75 73 2013 EU-SILC<br />
Finl<strong>and</strong> … … … … … … … … 0.95 1.01 82 83 2013 EU-SILC<br />
France … … … … … … … … 0.98 0.84 79 74 2013 EU-SILC<br />
Germany … … … … … … … … 1.04 0.77 69 73 2013 EU-SILC<br />
Greece … … … … … … … … 0.90 0.89 92 83 2013 EU-SILC<br />
Hungary … … … … … … … … 0.91 0.64 63 63 2013 EU-SILC<br />
Icel<strong>and</strong> … … … … … … … … 0.79 1.04 71 55 2013 EU-SILC<br />
Irel<strong>and</strong> … … … … … … … … … … … … …<br />
Italy … … … … … … … … 0.99 0.73 80 64 2013 EU-SILC<br />
Latvia … … … … … … … … 0.90 0.68 74 55 2013 EU-SILC<br />
Liechtenstein … … … … … … … … … … … … …<br />
Lithuania … … … … … … … … 0.88 0.89 96 83 2013 EU-SILC<br />
Luxembourg … … … … … … … … 1.00 0.64 53 51 2013 EU-SILC<br />
Malta … … … … … … … … … 0.59 58 50 2013 EU-SILC<br />
Monaco … … … … … … … … … … … … …<br />
Montenegro 1.01 0.96 98 94 0.93 0.83 72 88 0.83 0.68 62 63 2013 MICS<br />
Netherl<strong>and</strong>s … … … … … … … … … 1.00 90 67 2013 EU-SILC<br />
Norway … … … … … … … … 0.79 0.96 67 68 2013 EU-SILC<br />
Pol<strong>and</strong> … … … … … … … … 0.99 0.81 82 69 2013 EU-SILC<br />
Portugal … … … … … … … … 0.90 0.42 45 28 2013 EU-SILC<br />
Republic of Moldova 0.99 0.98 97 98 0.97 0.79 … … 0.59 0.14 16 10 2012 MICS<br />
Romania … … … … … … … … 0.82 0.69 71 65 2013 EU-SILC<br />
Russian Federation 0.99 1.00 100 100 1.01 1.01 100 100 0.89 0.92 80 90 2013 RLMS-HES<br />
San Marino … … … … … … … … … … … … …<br />
Serbia 1.01 0.89 86 91 0.96 0.73 76 70 0.84 0.49 50 42 2014 MICS<br />
Slovakia … … … … … … … … 1.01 0.95 90 88 2013 EU-SILC<br />
Slovenia … … … … … … … … … 0.83 83 73 2013 EU-SILC<br />
Spain … … … … … … … … 0.84 0.56 55 49 2013 EU-SILC<br />
Sweden … … … … … … … … 0.99 0.93 93 82 2013 EU-SILC<br />
Switzerl<strong>and</strong> … … … … … … … … 1.04 0.85 69 64 2013 EU-SILC<br />
TFYR Macedonia 1.02 0.93 94 93 0.76 0.49 30 63 0.71 0.38 26 43 2011 MICS<br />
449
1 ANNEX<br />
TABLE 9<br />
Part 1 (Continued)<br />
Primary completion rate <strong>and</strong> disparity<br />
by location <strong>and</strong> wealth<br />
DISPARITY IN SCHOOL COMPLETION 1<br />
Lower secondary completion rate <strong>and</strong> disparity<br />
by location <strong>and</strong> wealth<br />
Upper secondary completion rate <strong>and</strong> disparity<br />
by location <strong>and</strong> wealth<br />
Location<br />
Wealth<br />
Completion rate (%) of the<br />
poorest students Location Wealth<br />
Completion rate (%) of the<br />
poorest students Location Wealth<br />
Completion rate (%) of the<br />
poorest students<br />
Location<br />
parity<br />
index 2<br />
Wealth<br />
parity<br />
index 3<br />
Poorest<br />
females<br />
Poorest<br />
males<br />
Location<br />
parity<br />
index 2<br />
Wealth<br />
parity<br />
index 3<br />
Poorest<br />
females<br />
Poorest<br />
males<br />
Location<br />
parity<br />
index 2<br />
Wealth<br />
parity<br />
index 3<br />
Poorest<br />
females<br />
Poorest<br />
males<br />
450<br />
Country or territory<br />
2009–<br />
2014<br />
2009–<br />
2014<br />
2009–<br />
2014<br />
2009–<br />
2014<br />
2009–<br />
2014<br />
2009–<br />
2014<br />
2009–<br />
2014<br />
2009–<br />
2014<br />
2009–<br />
2014<br />
2009–<br />
2014<br />
2009–<br />
2014<br />
2009–<br />
2014<br />
Reference years<br />
<strong>and</strong> surveys<br />
Ukraine 1.00 1.00 100 100 1.00 0.99 100 98 0.93 0.84 86 82 2012 MICS<br />
United Kingdom … … … … … … … … 0.99 0.95 98 92 2013 EU-SILC<br />
United States … … 98 98 … … 98 98 … 0.88 87 84 2013 CPS-ASEC<br />
Latin America <strong>and</strong> the Caribbean<br />
Anguilla … … … … … … … … … … … … …<br />
Antigua <strong>and</strong> Barbuda … … … … … … … … … … … … …<br />
Argentina … 0.97 96 95 … 0.72 70 57 … 0.54 51 38 2012 EPH<br />
Aruba … … … … … … … … … … … … …<br />
Bahamas … … … … … … … … … … … … …<br />
Barbados 1.00 0.98 … … 1.01 0.97 … … 1.05 0.92 … … 2012 MICS<br />
Belize 0.87 0.66 70 59 0.59 0.19 13 17 0.58 0.07 5 1 2011 MICS<br />
Bermuda … … … … … … … … … … … … …<br />
Bolivia, P.S. … … … … … … … … … … … … …<br />
Brazil 0.94 0.92 83 71 0.91 0.90 67 53 0.76 0.84 21 12 2011 PNAD<br />
British Virgin Isl<strong>and</strong>s … … … … … … … … … … … … …<br />
Cayman Isl<strong>and</strong>s … … … … … … … … … … … … …<br />
Chile 1.00 0.98 98 96 0.89 0.88 81 78 0.51 0.55 37 33 2011 CASEN<br />
Colombia 0.90 0.83 84 81 0.62 0.46 47 42 0.49 0.31 32 27 2010 DHS<br />
Costa Rica 0.91 0.84 84 81 0.74 0.40 46 29 0.64 0.05 1 6 2011 MICS<br />
Cuba … … … … … … … … … … … … …<br />
Curaçao … … … … … … … … … … … … …<br />
Dominica … … … … … … … … … … … … …<br />
Dominican Republic 0.95 0.81 85 75 0.96 0.64 66 59 0.81 0.30 26 24 2013 DHS<br />
Ecuador 0.98 0.98 98 95 0.86 0.87 80 81 0.63 0.60 50 47 2013 ENEMDU<br />
El Salvador … … … … … … … … … … … … …<br />
Grenada … … … … … … … … … … … … …<br />
Guatemala 0.76 0.50 37 54 0.45 0.16 9 15 0.30 0.04 1 3 2011 ENCOVI<br />
Guyana 0.95 0.84 79 90 0.68 0.33 29 19 0.30 0.09 3 3 2009 DHS<br />
Haiti 0.55 0.26 27 17 0.49 0.17 11 13 0.26 0.02 0 1 2012 DHS<br />
Honduras 0.82 0.62 66 58 0.48 0.15 19 11 0.33 0.07 11 3 2011 DHS<br />
Jamaica 1.00 0.98 98 98 1.00 0.95 94 91 0.94 0.57 54 55 2011 MICS<br />
Mexico 0.96 0.92 92 90 0.86 0.67 65 66 0.62 0.35 24 35 2012 ENIGH<br />
Montserrat … … … … … … … … … … … … …<br />
Nicaragua 0.70 0.66 69 62 0.37 0.29 25 25 0.26 0.14 6 9 2009 ENMV<br />
Panama 0.88 0.79 80 78 0.76 0.58 53 58 0.53 0.21 16 23 2013 MICS<br />
Paraguay … … … … … … … … … … … … …<br />
Peru 0.92 0.86 86 84 0.73 0.57 55 56 0.57 0.38 32 40 2012 DHS<br />
Saint Kitts <strong>and</strong> Nevis … … … … … … … … … … … … …<br />
Saint Lucia 0.99 … … … 1.01 … … … 1.11 … … … 2012 MICS<br />
Saint-Martin … … … … … … … … … … … … …<br />
St. Vincent <strong>and</strong> the Grenadines … … … … … … … … … … … … …<br />
Sint-Maarten … … … … … … … … … … … … …<br />
Suriname 0.91 0.54 59 46 0.80 0.18 14 12 0.42 0.07 3 3 2010 MICS<br />
Trinidad <strong>and</strong> Tobago … … … … … … … … … … … … …<br />
Turks <strong>and</strong> Caicos Isl<strong>and</strong>s … … … … … … … … … … … … …<br />
Uruguay 1.03 0.92 97 87 1.11 0.33 23 31 0.43 0.01 2 1 2012 MICS<br />
Venezuela, B. R. … … … … … … … … … … … … …<br />
Northern Africa <strong>and</strong> Western Asia<br />
Algeria … … … … … … … … … … … … …<br />
Bahrain … … … … … … … … … … … … …<br />
Egypt 0.97 0.89 87 86 0.89 0.75 70 71 0.84 0.65 52 63 2014 DHS<br />
Iraq 0.66 0.40 25 44 0.52 0.18 5 17 0.35 0.10 4 5 2011 MICS<br />
Israel 1.00 1.00 100 100 1.02 0.95 100 92 1.04 0.85 89 71 2012 HES<br />
Jordan 1.01 0.96 97 93 1.05 0.79 82 73 0.99 0.45 48 26 2012 DHS<br />
Kuwait … … … … … … … … … … … … …<br />
Lebanon … … … … … … … … … … … … …<br />
Libya … … … … … … … … … … … … …<br />
Morocco 0.58 0.36 31 38 0.30 0.16 5 17 0.24 0.12 … … 2009 HYS<br />
Oman … … … … … … … … … … … … …<br />
Palestine … … … … … … … … … … … … 2014 MICS<br />
Qatar … … … … … … … … … … … … …<br />
Saudi Arabia … … … … … … … … … … … … …<br />
Sudan 0.85 0.67 53 81 0.61 0.22 13 29 0.49 0.10 4 7 2010 MICS<br />
Syrian Arab Republic … … … … … … … … … … … … …<br />
Tunisia 0.91 0.84 84 81 0.74 0.47 44 41 0.55 0.30 28 20 2011 MICS<br />
Turkey … … … … … … … … … … … … …<br />
United Arab Emirates … … … … … … … … … … … … …<br />
Yemen 0.72 0.40 20 48 0.58 0.27 9 29 0.49 0.18 3 17 2013 DHS<br />
The Pacific<br />
Australia … … … … … 0.97 … … … 0.80 69 80 2010 HES/SIH<br />
Cook Isl<strong>and</strong>s … … … … … … … … … … … … …<br />
Fiji … … … … … … … … … … … … …<br />
Kiribati … … … … … … … … … … … … …<br />
Marshall Isl<strong>and</strong>s … … … … … … … … … … … … …
STATISTICAL TABLES<br />
1<br />
TABLE 9<br />
Part 1 (Continued)<br />
Primary completion rate <strong>and</strong> disparity<br />
by location <strong>and</strong> wealth<br />
DISPARITY IN SCHOOL COMPLETION 1<br />
Lower secondary completion rate <strong>and</strong> disparity<br />
by location <strong>and</strong> wealth<br />
Upper secondary completion rate <strong>and</strong> disparity<br />
by location <strong>and</strong> wealth<br />
Location<br />
Wealth<br />
Completion rate (%) of the<br />
poorest students Location Wealth<br />
Completion rate (%) of the<br />
poorest students Location Wealth<br />
Completion rate (%) of the<br />
poorest students<br />
Location<br />
parity<br />
index 2<br />
Wealth<br />
parity<br />
index 3<br />
Poorest<br />
females<br />
Poorest<br />
males<br />
Location<br />
parity<br />
index 2<br />
Wealth<br />
parity<br />
index 3<br />
Poorest<br />
females<br />
Poorest<br />
males<br />
Location<br />
parity<br />
index 2<br />
Wealth<br />
parity<br />
index 3<br />
Poorest<br />
females<br />
Poorest<br />
males<br />
Country or territory<br />
2009–<br />
2014<br />
2009–<br />
2014<br />
2009–<br />
2014<br />
2009–<br />
2014<br />
2009–<br />
2014<br />
2009–<br />
2014<br />
2009–<br />
2014<br />
2009–<br />
2014<br />
2009–<br />
2014<br />
2009–<br />
2014<br />
2009–<br />
2014<br />
2009–<br />
2014<br />
Reference years<br />
<strong>and</strong> surveys<br />
Micronesia, F.S. … … … … … … … … … … … … …<br />
Nauru … … … … … … … … … … … … …<br />
New Zeal<strong>and</strong> … … … … … … … … … … … … …<br />
Niue … … … … … … … … … … … … …<br />
Palau … … … … … … … … … … … … …<br />
Papua New Guinea … … … … … … … … … … … … …<br />
Samoa … … … … … … … … … … … … …<br />
Solomon Isl<strong>and</strong>s … … … … … … … … … … … … …<br />
Tokelau … … … … … … … … … … … … …<br />
Tonga … … … … … … … … … … … … …<br />
Tuvalu … … … … … … … … … … … … …<br />
Vanuatu … … … … … … … … … … … … …<br />
Southern Asia<br />
Afghanistan 0.51 0.30 8 31 0.41 0.17 0 15 0.36 0.10 0.4 5 2010 MICS<br />
Bangladesh 0.99 0.70 68 57 0.94 0.40 28 31 0.63 0.14 5 8 2014 DHS<br />
Bhutan 0.58 0.32 26 28 0.40 0.14 3 13 0.27 0.05 0.8 1 2010 MICS<br />
India 0.94 0.87 82 86 0.87 0.76 67 73 0.54 0.39 21 28 2011 HDS<br />
Iran, Islamic Republic of … … … … … … … … … … … … …<br />
Maldives 0.99 0.98 98 97 0.92 0.85 90 74 0.94 0.92 67 44 2009 DHS<br />
Nepal 0.86 0.64 56 65 0.74 0.41 27 49 0.55 0.15 7 18 2011 DHS<br />
Pakistan 0.71 0.27 16 30 0.62 0.14 5 18 0.42 0.07 1 6 2012 DHS<br />
Sri Lanka … … … … … … … … … … … … …<br />
Sub-Saharan Africa<br />
Angola … … … … … … … … … … … … …<br />
Benin 0.71 0.34 20 31 0.47 0.13 2 11 0.25 0.02 0 1 2011 DHS<br />
Botswana … … … … … … … … … … … … …<br />
Burkina Faso 0.34 0.16 9 11 0.15 0.04 1 1 0.02 0.02 0 0 2010 DHS<br />
Burundi 0.56 0.34 18 16 0.25 0.14 1 8 0.09 0.02 0 0 2010 DHS<br />
Cabo Verde … … … … … … … … … … … … …<br />
Cameroon 0.61 0.15 10 18 0.28 0.04 1 4 0.13 0.01 0 0 2011 DHS<br />
Central African Republic 0.40 0.17 8 16 0.07 0.01 0 1 0.04 0.02 0 0.9 2010 MICS<br />
Chad 0.45 0.24 10 18 0.19 0.07 1 5 0.07 0.05 0 3 2010 MICS<br />
Comoros 0.80 0.53 52 40 0.66 0.31 18 20 0.55 0.21 9 8 2012 DHS<br />
Congo 0.58 0.40 32 40 0.31 0.11 5 11 0.07 0.01 0 1 2011 DHS<br />
Côte d'Ivoire 0.39 0.26 12 24 0.22 0.03 2 2 0.17 0.06 0 4 2011 DHS<br />
DR Congo 0.67 0.50 39 53 0.54 0.35 22 41 0.33 0.14 3 14 2013 DHS<br />
Djibouti … … … … … … … … … … … … …<br />
Equatorial Guinea … … … … … … … … … … … … …<br />
Eritrea … … … … … … … … … … … … …<br />
Ethiopia 0.42 0.24 19 19 0.17 0.03 2 0.7 0.17 0.01 0 1 2011 DHS<br />
Gabon 0.47 0.39 40 37 0.39 0.24 12 20 0.38 0.03 0 2 2012 DHS<br />
Gambia 0.60 0.56 44 51 0.42 0.37 26 29 0.34 0.24 8 15 2013 DHS<br />
Ghana 0.74 0.48 39 40 0.61 0.37 27 29 0.57 0.21 10 17 2014 DHS<br />
Guinea 0.42 0.17 7 17 0.21 0.11 2 11 0.10 0.05 0.0 4 2012 DHS<br />
Guinea-Bissau … … … … … … … … … … … … …<br />
Kenya 0.94 0.78 79 75 0.80 0.55 52 51 0.55 0.17 8 16 2014 DHS<br />
Lesotho 0.73 0.52 69 24 0.45 0.10 11 4 0.36 0.06 4 1 2009 DHS<br />
Liberia 0.46 0.25 16 23 0.28 0.11 4 12 0.21 0.05 0.7 5 2013 DHS<br />
Madagascar … … … … … … … … … … … … …<br />
Malawi 0.67 0.44 43 28 0.34 0.11 7 7 0.28 0.07 3 3 2010 DHS<br />
Mali 0.52 0.33 16 26 0.23 0.07 0.3 7 0.19 0.01 0 0.6 2012 DHS<br />
Mauritania 0.60 0.24 14 23 0.36 0.08 2 7 0.34 0.05 2 2 2011 MICS<br />
Mauritius … … … … … … … … … … … … …<br />
Mozambique 0.44 0.15 6 16 0.22 0.02 0 2 0.10 0.00 0 0 2011 DHS<br />
Namibia 0.82 0.68 79 54 0.46 0.28 25 22 0.42 0.12 7 7 2013 DHS<br />
Niger 0.31 0.15 6 10 0.05 0.05 0 3 0.02 0.06 0 1 2012 DHS<br />
Nigeria 0.65 0.23 14 33 0.49 0.11 4 18 0.42 0.06 1 11 2013 DHS<br />
Rw<strong>and</strong>a 0.64 0.26 11 13 0.38 0.15 4 4 0.27 0.03 0.3 2 2010 DHS<br />
Sao Tome <strong>and</strong> Principe … … … … … … … … … … … … …<br />
Senegal 0.54 0.39 28 33 0.36 0.13 3 8 0.19 0.03 0 2 2014 DHS<br />
Seychelles … … … … … … … … … … … … …<br />
Sierra Leone 0.66 0.50 47 41 0.38 0.21 10 22 0.13 0.04 1 2 2013 DHS<br />
Somalia … … … … … … … … … … … … …<br />
South Africa 0.90 93 85 … 0.75 79 62 … 0.29 23 19 2013 GHS<br />
South Sudan 0.59 0.28 15 29 0.38 0.13 3 6 0.19 0.07 0 3 2010 MICS<br />
Swazil<strong>and</strong> 0.68 0.42 41 27 0.67 0.38 29 23 0.55 0.18 9 9 2010 MICS<br />
Togo 0.61 0.41 27 37 0.30 0.12 3 8 0.15 0.02 0.0 1 2013 DHS<br />
Ug<strong>and</strong>a 0.45 0.19 12 13 0.34 0.06 2 4 0.19 0.04 0.3 3 2011 DHS<br />
U.R. Tanzania 0.75 0.55 46 55 0.29 0.03 2 1 0.18 0.00 0.1 0.0 2010 DHS<br />
Zambia 0.71 0.48 44 49 0.49 0.24 14 31 0.26 0.02 0.4 2 2013 DHS<br />
Zimbabwe 0.86 0.76 80 67 0.70 0.50 51 40 0.15 0.01 0.0 0.9 2014 MICS<br />
451
1 ANNEX<br />
TABLE 9<br />
Part 1 (Continued)<br />
Primary completion rate <strong>and</strong> disparity<br />
by location <strong>and</strong> wealth<br />
DISPARITY IN SCHOOL COMPLETION 1<br />
Lower secondary completion rate <strong>and</strong> disparity<br />
by location <strong>and</strong> wealth<br />
Upper secondary completion rate <strong>and</strong> disparity<br />
by location <strong>and</strong> wealth<br />
Location<br />
Wealth<br />
Completion rate (%) of the<br />
poorest students Location Wealth<br />
Completion rate (%) of the<br />
poorest students Location Wealth<br />
Completion rate (%) of the<br />
poorest students<br />
Location<br />
parity<br />
index 2<br />
Wealth<br />
parity<br />
index 3<br />
Poorest<br />
females<br />
Poorest<br />
males<br />
Location<br />
parity<br />
index 2<br />
Wealth<br />
parity<br />
index 3<br />
Poorest<br />
females<br />
Poorest<br />
males<br />
Location<br />
parity<br />
index 2<br />
Wealth<br />
parity<br />
index 3<br />
Poorest<br />
females<br />
Poorest<br />
males<br />
Country or territory<br />
2009–<br />
2014<br />
2009–<br />
2014<br />
2009–<br />
2014<br />
2009–<br />
2014<br />
2009–<br />
2014<br />
2009–<br />
2014<br />
2009–<br />
2014<br />
2009–<br />
2014<br />
2009–<br />
2014<br />
2009–<br />
2014<br />
2009–<br />
2014<br />
2009–<br />
2014<br />
Reference years<br />
<strong>and</strong> surveys<br />
World 4 … … … … … … … … 0.55 0.30 23 21<br />
Countries in transition 1.00 0.99 99 99 0.99 0.99 97 98 0.89 0.74 62 75<br />
Developed countries … … … … … … … … 0.95 0.83 78 71<br />
Developing countries 0.74 0.52 47 49 0.56 0.27 18 22 0.39 0.10 4 6<br />
Caucasus <strong>and</strong> Central Asia 1.00 1.00 100 99 0.99 0.99 98 99 0.95 0.89 89 85<br />
Eastern <strong>and</strong> South-eastern<br />
Asia<br />
… … … … … … … … … … … …<br />
Eastern Asia … … … … … … … … … … … …<br />
South-eastern Asia 0.87 0.58 66 51 0.68 0.36 36 29 0.48 0.17 12 14<br />
Europe <strong>and</strong> Northern America … … … … … … … … 0.91 0.82 75 69<br />
Latin America <strong>and</strong> the<br />
Caribbean<br />
… … … … … … … … … … … …<br />
Caribbean … … … … … … … … … … … …<br />
Latin America 0.91 0.84 83 81 0.74 0.43 37 37 0.51 0.17 13 11<br />
Northern Africa <strong>and</strong> Western<br />
Asia<br />
… … … … … … … … … … … …<br />
Northern Africa 0.99 0.92 92 89 0.96 0.77 76 72 0.92 0.55 50 44<br />
Western Asia … … … … … … … … … … … …<br />
Pacific … … … … … … … … … … … …<br />
Southern Asia 0.86 0.64 56 57 0.74 0.40 27 31 0.54 0.14 5 8<br />
Sub-Saharan Africa 0.60 0.37 24 29 0.36 0.12 4 8 0.19 0.05 0 2<br />
Conflict-affected countries 0.69 0.37 20 40 0.56 0.22 7 24 0.42 0.12 2 12<br />
Countries with low income 0.58 0.32 19 27 0.34 0.12 2 8 0.19 0.04 0 2<br />
Countries with middle income 0.93 0.83 83 80 0.76 0.49 49 44 0.57 0.26 20 19<br />
Lower middle 0.74 0.52 66 54 0.61 0.33 25 26 0.46 0.14 6 10<br />
Upper middle 0.97 0.91 89 88 0.86 0.71 66 62 0.76 0.45 32 35<br />
Countries with high income … … … … … … … … 0.96 0.84 77 70<br />
Sources: GEM Report team calculations, based on data from national <strong>and</strong> international <strong>and</strong> household surveys compiled<br />
in the World Inequality Database in Education (WIDE).<br />
Note: The country groupings by level of income are as defined by the World Bank but include only countries listed in the<br />
table. They are based on the list of countries by income group as revised in July 2015.<br />
1. National averages of completion rates are presented in Statistical Tables 2 (primary) <strong>and</strong> 3 (lower <strong>and</strong> upper secondary)<br />
2. Location parity index is the ratio of completion rate of students living in rural areas to that of their urban counterparts.<br />
3. Wealth parity index is the ratio of completion rate of students living in the poorest households to that of their richest<br />
counterparts.<br />
4. All regional values shown are medians.<br />
(…) No data are available.<br />
452
STATISTICAL TABLES<br />
1<br />
TABLE 10<br />
SDG 4, Target 4.6 – Youth <strong>and</strong> adult literacy <strong>and</strong> numeracy<br />
By 2030, ensure that all youth <strong>and</strong> a substantial proportion of adults, both men <strong>and</strong> women, achieve literacy <strong>and</strong> numeracy<br />
YOUTH AND ADULT LITERACY 1 BASIC SKILLS ACQUISITION 3 PARTICIPATION IN LITERACY PROGRAMMES<br />
Youth literacy (15–24)<br />
Adult literacy (15 <strong>and</strong> over)<br />
Percentage of youth <strong>and</strong> adults achieving<br />
at least a fixed level of proficiency (%) in:<br />
Participation rate of youth <strong>and</strong> adults<br />
in literacy programmes (%)<br />
Youth<br />
literacy<br />
rate (%)<br />
Number of<br />
youth illiterates<br />
Adult<br />
literacy<br />
rate (%)<br />
Number of<br />
adult illiterates<br />
Functional literacy skills Numeracy skills Adults (15 <strong>and</strong> over)<br />
Youth<br />
(16–24)<br />
Adults (16<br />
<strong>and</strong> over)<br />
Youth<br />
(16–24)<br />
Adults (16<br />
<strong>and</strong> over)<br />
School year ending in<br />
2005–2014 2 2005–2014 2 2005–2014 2 2005–2014 2 2012-2015 2 2012-2015 2 2014<br />
Country or territory<br />
Total Total (000) % F Total Total (000) % F Total Total Total Total Total Male Female<br />
Caucasus <strong>and</strong> Central Asia<br />
Armenia 100 * 0.8 * 37 * 100 * 6 ** 62 ** ... ... ... ... … … …<br />
Azerbaijan 100 * 0.7 * 72 * 100 * 16 * 68 * ... ... ... ... … … …<br />
Georgia 100 ** 1 ** 35 ** 100 ** 8 ** 60 ** ... ... ... ... … … …<br />
Kazakhstan 100 * 5 * 41 * 100 * 33 * 62 * ... ... ... ... … … …<br />
Kyrgyzstan 100 * 3 * 40 * 99 * 29 * 69 * ... ... ... ... … … …<br />
Tajikistan 100 ** 2 ** 44 ** 100 ** 13 ** 61 ** ... ... ... ... … … …<br />
Turkmenistan 100 ** 2 ** 29 ** 100 ** 12 ** 63 ** ... ... ... ... … … …<br />
Uzbekistan 100 * - * - * 100 * 4 * 63 * ... ... ... ... … … …<br />
Eastern <strong>and</strong> South-eastern Asia<br />
Brunei Darussalam 99 * 0.5 * 35 * 96 * 12 * 66 * ... ... ... ... … … …<br />
Cambodia 87 * 396 * 54 * 74 * 2,438 * 69 * ... ... ... ... … … …<br />
China 100 * 843 * 54 * 95 * 53,767 * 74 * ... ... ... ... … … …<br />
DPR Korea 100 * 0.0 * 34 * 100 * 0.3 * 71 * ... ... ... ... … … …<br />
Hong Kong, China … … … … … … ... ... ... ...<br />
Indonesia 100 * 139 * 49 * 95 * 8,942 * 67 * ... ... ... ... … … …<br />
Japan … … … … … … … 99 99 99 … … …<br />
Lao People’s Democratic Republic 84 * 198 * 66 * 73 * 938 * 69 * ... ... ... ... … … …<br />
Macao, China 100 * 0.3 * 48 * 96 * 21 * 76 * ... ... ... ... … … …<br />
Malaysia 98 * 90 * 48 * 93 * 1,412 * 67 * ... ... ... ... … … …<br />
Mongolia 98 * 9 * 35 * 98 * 35 * 48 * ... ... ... ... … … …<br />
Myanmar 96 ** 357 ** 51 ** 93 ** 2,721 ** 67 ** ... ... ... ... … … …<br />
Philippines 98 * 364 * 31 * 96 * 2,371 * 45 * ... ... ... ... … … …<br />
Republic of Korea … … … … … … … 98 99 96 … … …<br />
Singapore 100 * 0.7 * 47 * 97 * 152 * 79 * 99 90 98 87 … … …<br />
Thail<strong>and</strong> 98 * 155 * 40 * 94 * 3,465 * 63 * ... ... ... ... … … …<br />
Timor-Leste 80 * 43 * 52 * 58 * 259 * 56 * ... ... ... ... … … …<br />
Viet Nam 97 * 515 * 54 * 94 * 4,297 * 68 * ... ... ... ... … … …<br />
Europe <strong>and</strong> Northern America<br />
Albania 99 * 4 * 59 * 97 * 64 * 70 * ... ... ... ... … … …<br />
Andorra … … … … … … ... ... ... ... … … …<br />
Austria … … … … … … 98 98 98 97 … … …<br />
Belarus 100 * 3 * 42 * 100 * 31 * 72 * ... ... ... ... … … …<br />
Belgium … … … … … … ... ... ... ... … … …<br />
Bosnia <strong>and</strong> Herzegovina 100 ** 2 ** 49 ** 98 ** 53 ** 86 ** ... ... ... ... … … …<br />
Bulgaria 98 * 18 * 53 * 98 * 105 * 63 * ... ... ... ... … … …<br />
Canada … … … … … … 97 96 96 94 … … …<br />
Croatia 100 * 1 * 47 * 99 * 32 * 80 * ... ... ... ... … … …<br />
Cyprus 100 * 0.3 * 43 * 99 * 12 * 72 * 99 98 97 97 … … …<br />
Czech Republic … … … … … … 99 98 98 98 … … …<br />
Denmark … … … … … … 98 96 98 97 … … …<br />
Estonia 100 * 0.1 * 39 * 100 * 1 * 43 * 99 98 99 98 … … …<br />
Finl<strong>and</strong> … … … … … … 99 97 98 97 … … …<br />
France … … … … … … 98 95 95 91 … … …<br />
Germany … … … … … … 99 97 97 95 … … …<br />
Greece 99 ** 7 ** 56 ** 98 ** 232 ** 70 ** 95 95 94 94 … … …<br />
Hungary … … … … … … ... ... ... ... … … …<br />
Icel<strong>and</strong> … … … … … … ... ... ... ... … … …<br />
Irel<strong>and</strong> … … … … … … 98 96 95 93 … … …<br />
Italy 100 * 8 * 46 * 99 * 590 * 64 * 97 94 94 92 … … …<br />
Latvia 100 * 0.4 * 39 * 100 * 2 * 49 * ... ... ... ... … … …<br />
Liechtenstein … … … … … … ... ... ... ...<br />
Lithuania 100 * 0.6 * 45 * 100 * 5 * 50 * … 98 99 97 … … …<br />
Luxembourg … … … … … … ... ... ... ... … … …<br />
Malta 99 * 0.6 * 26 * 93 * 23 * 39 * ... ... ... ... … … …<br />
Monaco … … … … … … ... ... ... ... … … …<br />
Montenegro 99 * 0.7 * 58 * 98 * 8 * 82 * ... ... ... ... … … …<br />
Netherl<strong>and</strong>s … … … … … … 99 97 98 97 … … …<br />
Norway … … … … … … 98 97 96 96 … … …<br />
Pol<strong>and</strong> … … … … … … 99 96 97 94 … … …<br />
Portugal 99 * 6 * 45 * 94 * 497 * 68 * ... ... ... ... … … …<br />
Republic of Moldova 100 ** - ** - ** 99 ** 23 ** 78 ** ... ... ... ... … … …<br />
Romania 99 * 24 * 49 * 99 * 236 * 67 * ... ... ... ... … … …<br />
Russian Federation 100 * 62 * 41 * 100 * 384 * 61 * 99 98 99 98 … … …<br />
San Marino … … … … … … ... ... ... ... … … …<br />
Serbia 99 * 8 * 51 * 98 * 152 * 83 * ... ... ... ... … … …<br />
Slovakia … … … … … … 98 98 97 97 … … …<br />
Slovenia 100 ** 0.3 ** 31 ** 100 ** 5 ** 54 ** 98 94 98 93 … … …<br />
Spain 100 * 12 * 55 * 98 * 751 * 68 * 97 93 95 90 … … …<br />
Sweden … … … … … … 98 96 97 96 … … …<br />
Switzerl<strong>and</strong> … … … … … … ... ... ... ... … … …<br />
TFYR Macedonia 99 ** 4 ** 54 ** 98 ** 39 ** 74 ** ... ... ... ... … … …<br />
453
1 ANNEX<br />
TABLE 10<br />
(Continued)<br />
YOUTH AND ADULT LITERACY 1 BASIC SKILLS ACQUISITION 3 PARTICIPATION IN LITERACY PROGRAMMES<br />
Youth literacy (15–24)<br />
Adult literacy (15 <strong>and</strong> over)<br />
Percentage of youth <strong>and</strong> adults achieving<br />
at least a fixed level of proficiency (%) in:<br />
Participation rate of youth <strong>and</strong> adults<br />
in literacy programmes (%)<br />
Youth<br />
literacy<br />
rate (%)<br />
Number of<br />
youth illiterates<br />
Adult<br />
literacy<br />
rate (%)<br />
Number of<br />
adult illiterates<br />
Functional literacy skills Numeracy skills Adults (15 <strong>and</strong> over)<br />
Youth<br />
(16–24)<br />
Adults (16<br />
<strong>and</strong> over)<br />
Youth<br />
(16–24)<br />
Adults (16<br />
<strong>and</strong> over)<br />
School year ending in<br />
454<br />
Country or territory<br />
2005–2014 2 2005–2014 2 2005–2014 2 2005–2014 2 2012-2015 2 2012-2015 2 2014<br />
Total Total (000) % F Total Total (000) % F Total Total Total Total Total Male Female<br />
Ukraine 100 ** 12 ** 40 ** 100 ** 95 ** 62 ** ... ... ... ... … … …<br />
United Kingdom … … … … … … ... ... ... ... … … …<br />
United States … … … … … … 98 96 93 91 … … …<br />
Latin America <strong>and</strong> the Caribbean<br />
Anguilla … … … … … … ... ... ... ...<br />
Antigua <strong>and</strong> Barbuda … … … 99 ** 1 ** 29 ** ... ... ... ... 4 y 0 y 15<br />
Argentina 99 ** 49 ** 37 ** 98 ** 631 ** 51 ** ... ... ... ... … … …<br />
Aruba 99 * 0.1 * 38 * 97 * 3 * 55 * ... ... ... ... … … …<br />
Bahamas … … … … … … ... ... ... ... … … …<br />
Barbados … … … … … … ... ... ... ... … … …<br />
Belize … … … … … … ... ... ... ... … … …<br />
Bermuda … … … … … … ... ... ... ... … … …<br />
Bolivia, Plurinational States of 99 * 20 * 58 * 94 * 374 * 74 * ... ... ... ... … … …<br />
Brazil 99 * 431 * 30 * 91 * 13,231 * 50 * ... ... ... ... 4 3 4<br />
British Virgin Isl<strong>and</strong>s … … … … … … ... ... ... ... … … …<br />
Cayman Isl<strong>and</strong>s 99 * 0.1 * 62 * 99 * 0.5 * 45 * ... ... ... ... … … …<br />
Chile 99 * 27 * 47 * 96 * 518 * 53 * 89 80 80 69 3 y … …<br />
Colombia 99 * 123 * 35 * 94 * 2,094 * 49 * ... ... ... ... 15 12 18<br />
Costa Rica 99 * 7 * 42 * 97 * 91 * 48 * ... ... ... ... 6 y 4 y 7<br />
Cuba 100 * 2 * 40 * 100 * 23 * 41 * ... ... ... ... 4 y 6 y 1<br />
Curaçao … … … … … … ... ... ... ... … … …<br />
Dominica … … … … … … ... ... ... ... … … …<br />
Dominican Republic 98 * 44 * 42 * 92 * 598 * 48 * ... ... ... ... 9 … …<br />
Ecuador 99 * 41 * 48 * 94 * 647 * 59 * ... ... ... ... 12 9 14<br />
El Salvador 97 * 34 * 46 * 87 * 579 * 63 * ... ... ... ... 17 18 16<br />
Grenada … … … … … … ... ... ... ... … … …<br />
Guatemala 94 * 186 * 60 * 81 * 1,880 * 66 * ... ... ... ... 7 3 9<br />
Guyana 93 **,a 8 **,a 45 **,a 85 **,a 75 **,a 42 **,a ... ... ... ... … … …<br />
Haiti 72 **,a 561 **,a 53 **,a 49 **,a 3,006 **,a 56 **,a ... ... ... ... … … …<br />
Honduras 96 * 75 * 42 * 87 * 687 * 51 * ... ... ... ... … … …<br />
Jamaica 96 ** 20 ** 16 ** 88 ** 251 ** 31 ** ... ... ... ... 3 y 2 y 3<br />
Mexico 99 * 231 * 45 * 95 * 4,879 * 60 * ... ... ... ... 11 7 13<br />
Montserrat … … … … … … ... ... ... ... … … …<br />
Nicaragua 87 * 154 * 42 * 78 * 758 * 52 * ... ... ... ... 16 y 15 y 16<br />
Panama 98 * 15 * 56 * 94 * 152 * 55 * ... ... ... ... … … …<br />
Paraguay 99 * 17 * 57 * 95 * 243 * 58 * ... ... ... ... 4 2 5<br />
Peru 99 * 57 * 58 * 94 * 1,409 * 76 * ... ... ... ... 10 y 9 y 11<br />
Saint Kitts <strong>and</strong> Nevis … … … … … … ... ... ... ... … … …<br />
Saint Lucia … … … … … … ... ... ... ... … … …<br />
Saint-Martin … … … … … … ... ... ... ... … … …<br />
Saint Vincent <strong>and</strong> the Grenadines … … … … … … ... ... ... ... … … …<br />
Sint-Maarten … … … … … … ... ... ... ... … … …<br />
Suriname 98 * 1 * 37 * 95 * 20 * 57 * ... ... ... ... … … …<br />
Trinidad <strong>and</strong> Tobago 100 ** 0.8 ** 48 ** 99 ** 12 ** 65 ** ... ... ... ... … … …<br />
Turks <strong>and</strong> Caicos Isl<strong>and</strong>s … … … … … … ... ... ... ... … … …<br />
Uruguay 99 * 6 * 26 * 98 * 42 * 40 * ... ... ... ... 3 … …<br />
Venezuela, Bolivarian Republic of 98 * 134 * 36 * 95 * 1,088 * 48 * ... ... ... ... … … …<br />
Northern Africa <strong>and</strong> Western Asia<br />
Algeria 94 474 65 75 * 6,279 * 65 * ... ... ... ... … … …<br />
Bahrain 98 3 57 95 * 55 * 54 * ... ... ... ... … … …<br />
Egypt 92 *,a 1,284 *,a 59 *,a 75 *,a 14,804 *,a 65 *,a ... ... ... ... … … …<br />
Iraq 82 ** 1,264 ** 52 ** 80 ** 4,252 ** 65 ** ... ... ... ... … … …<br />
Israel … … … … … … 96 92 90 89 … … …<br />
Jordan 99 *,a 12 *,a 43 *,a 98 *,a 92 *,a 61 *,a ... ... ... ... … … …<br />
Kuwait 99 * 5 * 56 * 96 * 125 * 54 * ... ... ... ... … … …<br />
Lebanon 99 * 10 * 38 * 90 * 307 * 67 * ... ... ... ... … … …<br />
Libya 100 ** 0.6 ** 67 ** 91 ** 394 ** 82 ** ... ... ... ... … … …<br />
Morocco 82 * 1,153 * 70 * 67 * 7,848 * 65 * ... ... ... ... … … …<br />
Oman 99 * 7 * 40 * 92 * 229 * 49 * ... ... ... ... … … …<br />
Palestine 99 * 6 * 52 * 96 * 97 * 77 * ... ... ... ... … … …<br />
Qatar 99 * 4 * 6 * 98 * 42 * 25 * ... ... ... ... … … …<br />
Saudi Arabia 99 * 39 * 54 * 94 * 1,198 * 64 * ... ... ... ... … … …<br />
Sudan 66 * 2,309 * 54 * 54 * 9,251 * 57 * ... ... ... ... … … …<br />
Syrian Arab Republic 96 ** 142 ** 59 ** 86 ** 1,671 ** 70 ** ... ... ... ... … … …<br />
Tunisia 97 * 60 * 67 * 80 * 1,658 * 72 * ... ... ... ... … … …<br />
Turkey 99 * 84 * 80 * 95 * 2,665 * 84 * 94 87 88 80 … … …<br />
United Arab Emirates 95 * 41 * 20 * 90 * 368 * 21 * ... ... ... ... … … …<br />
Yemen 89 ** 623 ** 87 ** 69 ** 4,849 ** 75 ** ... ... ... ... … … …<br />
The Pacific<br />
Australia … … … … … … 98 97 96 94 … … …<br />
Cook Isl<strong>and</strong>s … … … … … … ... ... ... ... … … …<br />
Fiji … … … … … … ... ... ... ... … … …<br />
Kiribati … … … … … … ... ... ... ... … … …<br />
Marshall Isl<strong>and</strong>s 98 * 0.1 * 41 * 98 * 1 * 52 * ... ... ... ... … … …
STATISTICAL TABLES<br />
1<br />
TABLE 10<br />
(Continued)<br />
YOUTH AND ADULT LITERACY 1 BASIC SKILLS ACQUISITION 3 PARTICIPATION IN LITERACY PROGRAMMES<br />
Youth literacy (15–24)<br />
Adult literacy (15 <strong>and</strong> over)<br />
Percentage of youth <strong>and</strong> adults achieving<br />
at least a fixed level of proficiency (%) in:<br />
Participation rate of youth <strong>and</strong> adults<br />
in literacy programmes (%)<br />
Youth<br />
literacy<br />
rate (%)<br />
Number of<br />
youth illiterates<br />
Adult<br />
literacy<br />
rate (%)<br />
Number of<br />
adult illiterates<br />
Functional literacy skills Numeracy skills Adults (15 <strong>and</strong> over)<br />
Youth<br />
(16–24)<br />
Adults (16<br />
<strong>and</strong> over)<br />
Youth<br />
(16–24)<br />
Adults (16<br />
<strong>and</strong> over)<br />
School year ending in<br />
Country or territory<br />
2005–2014 2 2005–2014 2 2005–2014 2 2005–2014 2 2012-2015 2 2012-2015 2 2014<br />
Total Total (000) % F Total Total (000) % F Total Total Total Total Total Male Female<br />
Micronesia (Federated States of) … … … … … … ... ... ... ... … … …<br />
Nauru … … … … … … ... ... ... ... … … …<br />
New Zeal<strong>and</strong> … … … … … … 98 97 96 95 … … …<br />
Niue … … … … … … ... ... ... ... … … …<br />
Palau 100 * … * … * 100 * 0.1 * 45 * ... ... ... ... … … …<br />
Papua New Guinea 67 ** 488 ** 52 ** 63 ** 1,720 ** 52 ** ... ... ... ... … … …<br />
Samoa 99 * 0.3 * 34 * 99 * 1 * 44 * ... ... ... ... … … …<br />
Solomon Isl<strong>and</strong>s … … … … … … ... ... ... ... … … …<br />
Tokelau … … … … … … ... ... ... ... … … …<br />
Tonga 99 * 0.1 * 42 * 99 * 0.4 * 47 * ... ... ... ... … … …<br />
Tuvalu … … … … … … ... ... ... ... … … …<br />
Vanuatu … … … … … … ... ... ... ... … … …<br />
Southern Asia<br />
Afghanistan 47 * 2,947 * 62 * 32 * 10,373 * 59 * ... ... ... ... … … …<br />
Bangladesh 82 ** 5,558 ** 42 ** 61 ** 43,916 ** 54 ** ... ... ... ... … … …<br />
Bhutan 87 * 19 * 61 * 57 * 223 * 56 * ... ... ... ... … … …<br />
India 86 * 32,620 * 62 * 69 * 265,568 * 65 * ... ... ... ... … … …<br />
Iran, Islamic Republic of 98 * 311 * 57 * 85 * 9,058 * 66 * ... ... ... ... … … …<br />
Maldives 99 * 0.5 * 46 * 98 * 3 * 49 * ... ... ... ... … … …<br />
Nepal 85 * 823 * 69 * 60 * 6,989 * 67 * ... ... ... ... … … …<br />
Pakistan 72 * 10,508 * 63 * 56 * 51,956 * 64 * ... ... ... ... … … …<br />
Sri Lanka 98 * 60 * 38 * 91 * 1,323 * 59 * ... ... ... ... … … …<br />
Sub-Saharan Africa<br />
Angola 73 ** 1,270 ** 61 ** 71 ** 3,665 ** 70 ** ... ... ... ... … … …<br />
Benin 42 **,a 945 **,a 61 **,a 29 **,a 3,320 **,a 59 **,a ... ... ... ... … … …<br />
Botswana 98 ** 10 ** 12 ** 88 ** 185 ** 46 ** ... ... ... ... … … …<br />
Burkina Faso 50 * 1,728 * 56 * 35 * 6,189 * 58 * ... ... ... ... … … …<br />
Burundi 89 * 215 * 55 * 87 * 656 * 59 * ... ... ... ... … … …<br />
Cabo Verde 98 * 2 * 43 * 85 * 51 * 68 * ... ... ... ... … … …<br />
Cameroon 81 * 812 * 62 * 71 * 3,319 * 62 * ... ... ... ... … … …<br />
Central African Republic 36 **,a 570 **,a 59 **,a 37 **,a 1,659 **,a 62 **,a ... ... ... ... … … …<br />
Chad 52 ** 1,320 ** 53 ** 39 ** 4,308 ** 57 ** ... ... ... ... … … …<br />
Comoros 87 ** 20 ** 47 ** 78 ** 103 ** 59 ** ... ... ... ... … … …<br />
Congo 81 **,a 147 **,a 62 **,a 79 **,a 491 **,a 67 **,a ... ... ... ... … … …<br />
Côte d’Ivoire 48 **,a 2,150 **,a 59 **,a 41 **,a 7,029 **,a 58 **,a ... ... ... ... … … …<br />
Democratic Rep. of the Congo 84 *,a 2,195 *,a 72 *,a 75 *,a 9,325 *,a 76 *,a ... ... ... ... … … …<br />
Djibouti … … … … … … ... ... ... ... … … …<br />
Equatorial Guinea 98 ** 3 ** 36 ** 95 ** 25 ** 72 ** ... ... ... ... … … …<br />
Eritrea 93 ** 74 ** 60 ** 73 ** 796 ** 67 ** ... ... ... ... … … …<br />
Ethiopia 55 * 7,176 * 59 * 39 * 26,847 * 59 * ... ... ... ... … … …<br />
Gabon 89 **,a 37 **,a 45 **,a 82 **,a 177 **,a 57 **,a ... ... ... ... … … …<br />
Gambia 72 ** 105 ** 55 ** 54 ** 472 ** 61 ** ... ... ... ... … … …<br />
Ghana 86 * 699 * 59 * 71 * 4,203 * 63 * ... ... ... ... … … …<br />
Guinea 31 * 1,524 * 55 * 25 * 4,716 * 58 * ... ... ... ... … … …<br />
Guinea-Bissau 76 ** 85 ** 59 ** 59 ** 439 ** 65 ** ... ... ... ... … … …<br />
Kenya 82 **,a 1,430 **,a 52 **,a 72 **,a 5,878 **,a 60 **,a ... ... ... ... … … …<br />
Lesotho 83 **,a 79 **,a 23 **,a 76 **,a 301 **,a 32 **,a ... ... ... ... … … …<br />
Liberia 49 **,a 338 **,a 63 **,a 43 **,a 1,120 **,a 65 **,a ... ... ... ... … … …<br />
Madagascar 65 **,a 1,419 **,a 51 **,a 64 **,a 4,093 **,a 55 **,a ... ... ... ... … … …<br />
Malawi 72 **,a 864 **,a 54 **,a 61 **,a 3,055 **,a 64 **,a ... ... ... ... … … …<br />
Mali 47 * 1,565 * 57 * 34 * 5,444 * 57 * ... ... ... ... … … …<br />
Mauritania 56 **,a 280 **,a 60 **,a 46 **,a 1,045 **,a 60 **,a ... ... ... ... … … …<br />
Mauritius 98 * 4 * 38 * 92 * 76 * 66 * ... ... ... ... … … …<br />
Mozambique 67 * 1,450 * 69 * 51 * 6,261 * 69 * ... ... ... ... … … …<br />
Namibia 94 * 27 * 42 * 89 * 148 * 55 * ... ... ... ... … … …<br />
Niger 24 **,a 2,332 **,a 58 **,a 15 **,a 7,366 **,a 55 **,a ... ... ... ... … … …<br />
Nigeria 66 **,a 9,675 **,a 62 **,a 51 **,a 41,214 **,a 60 **,a ... ... ... ... … … …<br />
Rw<strong>and</strong>a 82 * 384 * 47 * 68 * 1,985 * 60 * ... ... ... ... … … …<br />
Sao Tome <strong>and</strong> Principe 97 * 1 * 56 * 90 * 10 * 75 * ... ... ... ... … … …<br />
Senegal 56 * 1,246 * 56 * 43 * 4,576 * 61 * ... ... ... ... … … …<br />
Seychelles 99 * 0.2 * 29 * 94 * 4 * 45 * ... ... ... ... … … …<br />
Sierra Leone 66 ** 432 ** 63 ** 47 ** 1,913 ** 61 ** ... ... ... ... … … …<br />
Somalia … … … … … … ... ... ... ... … … …<br />
South Africa 99 * 119 * 38 * 94 * 2,226 * 61 * ... ... ... ... … … …<br />
South Sudan 37 * 1,143 * 56 * 27 * 3,779 * 56 * ... ... ... ... … … …<br />
Swazil<strong>and</strong> 94 **,a 19 **,a 40 **,a 83 **,a 123 **,a 54 **,a ... ... ... ... … … …<br />
Togo 80 * 265 * 68 * 60 * 1,478 * 68 * ... ... ... ... … … …<br />
Ug<strong>and</strong>a 84 * 1,162 * 56 * 70 * 5,362 * 65 * ... ... ... ... … … …<br />
United Republic of Tanzania 86 * 1,318 * 55 * 78 * 5,792 * 62 * ... ... ... ... … … …<br />
Zambia 89 * 317 * 60 * 83 * 1,251 * 67 * ... ... ... ... … … …<br />
Zimbabwe 91 **,a 296 **,a 44 **,a 84 **,a 1,349 **,a 63 **,a ... ... ... ... … … …<br />
455
1 ANNEX<br />
TABLE 10<br />
(Continued)<br />
YOUTH AND ADULT LITERACY 1 BASIC SKILLS ACQUISITION 3 PARTICIPATION IN LITERACY PROGRAMMES<br />
Youth literacy (15–24)<br />
Adult literacy (15 <strong>and</strong> over)<br />
Percentage of youth <strong>and</strong> adults achieving<br />
at least a fixed level of proficiency (%) in:<br />
Participation rate of youth <strong>and</strong> adults<br />
in literacy programmes (%)<br />
Youth<br />
literacy<br />
rate (%)<br />
Number of<br />
youth illiterates<br />
Adult<br />
literacy<br />
rate (%)<br />
Number of<br />
adult illiterates<br />
Functional literacy skills Numeracy skills Adults (15 <strong>and</strong> over)<br />
Youth<br />
(16–24)<br />
Adults (16<br />
<strong>and</strong> over)<br />
Youth<br />
(16–24)<br />
Adults (16<br />
<strong>and</strong> over)<br />
School year ending in<br />
Country or territory<br />
2005–2014 2 2005–2014 2 2005–2014 2 2005–2014 2 2012-2015 2 2012-2015 2 2014<br />
Total Total (000) % F Total Total (000) % F Total Total Total Total Total Male Female<br />
Weighted<br />
average Sum % F<br />
Weighted<br />
average Sum % F Median Median<br />
World 91 ** 114,127 ** 59 ** 85 ** 757,920 ** 63 ** … … … … … … …<br />
Countries in transition 100 ** 110 ** 43 ** 100 ** 993 ** 69 ** … … … … … … …<br />
Developed countries … ** … … … … … … … … … … … …<br />
Developing countries 89 ** 113,577 ** 59 ** 82 ** 748,926 ** 63 ** … … … … … … …<br />
Caucasus <strong>and</strong> Central Asia 100 ** 15 ** 41 ** 100 ** 120 ** 65 ** … … … … … … …<br />
Eastern <strong>and</strong> South-eastern Asia 99 ** 3,217 ** 51 ** 95 ** 84,135 ** 71 ** … … … … … … …<br />
Eastern Asia 100 ** 960 ** 54 ** 96 ** 57,130 ** 73 ** … … … … … … …<br />
South-eastern Asia 98 ** 2,257 ** 49 ** 94 ** 27,006 ** 65 ** … … … … … … …<br />
Europe <strong>and</strong> Northern America … … … … … … … … … … … … …<br />
Latin America <strong>and</strong> the Caribbean 98 ** 2,266 ** 44 ** 93 ** 33,373 ** 54 ** … … … … 6 6 11<br />
Caribbean 90 ** 638 ** 51 ** 85 ** 3,928 ** 53 ** ... ... ... ... … … …<br />
Latin America 98 ** 1,628 ** 41 ** 93 ** 29,445 ** 55 ** ... ... ... ... … … …<br />
Northern Africa <strong>and</strong> Western Asia 93 ** 6,073 ** 63 ** 82 ** 52,878 ** 67 ** ... ... ... ... … … …<br />
Northern Africa 91 ** 3,824 ** 63 ** 75 ** 36,784 ** 65 ** ... ... ... ... … … …<br />
Western Asia 95 ** 2,250 ** 62 ** 90 ** 16,094 ** 70 ** ... ... ... ... … … …<br />
Pacific … … … … … … ... ... ... ... … … …<br />
Southern Asia 84 ** 52,848 ** 60 ** 68 ** 389,408 ** 63 ** ... ... ... ... … … …<br />
Sub-Saharan Africa 71 ** 48,765 ** 59 ** 60 ** 188,315 ** 61 ** ... ... ... ... … … …<br />
... ... ... ...<br />
Conflict-affected countries 85 ** 78,749 ** 61 ** 75 ** 496,010 ** 64 ** ... ... ... ... … … …<br />
... ... ... ...<br />
Countries with low income 68 ** 35,078 ** 59 ** 57 134,811 61 ... ... ... ... … … …<br />
Countries with middle income 92 ** 78,258 ** 60 ** 84 608,126 64 ... ... ... ... … … …<br />
Lower middle 86 ** 72,405 ** 60 ** 74 493,776 63 ... ... ... ... … … …<br />
Upper middle 99 ** 5,854 ** 53 ** 94 114,350 67 ... ... ... ... … … …<br />
Countries with high income … … … … … … ... ... ... ... … … …<br />
Sources: UIS database, except where noted.<br />
Note A: The country groupings by level of income are as defined by the World Bank but include only countries listed in the<br />
table. They are based on the list of countries by income group as revised in July 2015.<br />
Note B: For countries indicated with (*), national observed literacy data are used. For all others, UIS literacy estimates are<br />
used (**). The estimates were generated using the UIS Global Age-specific Literacy Projections model. Those in the most<br />
recent period are for 2014 <strong>and</strong> are based on the most recent observed data available for each country.<br />
Note C: The population used to generate the number of illiterates is from the United Nations Population Division<br />
estimates, revision 2015 (United Nations, 2015). It is based on the median variant. For countries with national observed<br />
literacy data, the population corresponding to the year of the census or survey was used. For countries with UIS<br />
estimates, populations used are for 2014.<br />
1. Literacy data presented in these columns are based on conventional assessment methods – either self- <strong>and</strong> third-party<br />
declarations or educational attainment proxies – <strong>and</strong> thus should be interpreted with caution; they are not based on any<br />
test <strong>and</strong> may overestimate actual literacy levels.<br />
2. Data are for the most recent year available during the period specified. For literacy data, see the introduction to the<br />
statistical tables <strong>and</strong> the table of metadata on literacy statistics (published on the GEM Report Website) for a broader<br />
explanation of national literacy definitions, assessment methods, <strong>and</strong> sources <strong>and</strong> years of data.<br />
3. Data on basic skills acquisition are from Survey of Adult Skills (PIAAC 2012-2015) (OECD, 2013, 2016).<br />
(a) Literacy data are based on direct reading tests in national <strong>and</strong> international household surveys.<br />
(*) For country level data: national estimate.<br />
(**) For country level data: UIS estimate/projection; for regional <strong>and</strong> other country-grouping sums <strong>and</strong> weighted<br />
averages: partial imputation due to incomplete country coverage (between 33% <strong>and</strong> 60% of population for the region or<br />
other country grouping).<br />
(…) No data are available.<br />
456
STATISTICAL TABLES<br />
1<br />
TABLE 11<br />
SDG 4, Target 4.7 – Education for sustainable development <strong>and</strong> global citizenship<br />
By 2030, ensure all learners acquire knowledge <strong>and</strong> skills needed to promote sustainable development, including, among others, through education for sustainable development<br />
<strong>and</strong> sustainable lifestyles, human rights, gender equality, promotion of a culture of peace <strong>and</strong> non-violence, global citizenship <strong>and</strong> appreciation of cultural diversity <strong>and</strong> of<br />
culture’s contribution to sustainable development<br />
PROMOTING SUSTAINABLE DEVELOPMENT AND GLOBAL CITIZENSHIP IN CURRICULA<br />
KNOWLEDGE ACQUISITION ON SUSTAINABLE DEVELOPMENT AND GLOBAL CITIZENSHIP<br />
Inclusion in national curricula frameworks of issues relating<br />
to global citizenship <strong>and</strong> sustainable development 1,2<br />
Percentage<br />
of schools providing life<br />
skills-based<br />
Percentage of students <strong>and</strong> youth with adequate underst<strong>and</strong>ing of issues relating<br />
to global citizenship <strong>and</strong> sustainable development<br />
Gender<br />
equality 3<br />
Human<br />
rights 4<br />
Sustainable<br />
development 5<br />
Global<br />
citizenship 6 HIV/AIDS education 7 Science literacy 9,10 HIV/AIDS <strong>and</strong> sexuality education 7<br />
2005-2015 8 2005-2015 8 2005-2015 8 2005-2015 8 2009–2010 8 2012 2009–2015 8<br />
Country or territory<br />
Total Male Female Total Male Female<br />
Caucasus <strong>and</strong> Central Asia<br />
Armenia 0 MEDIUM LOW LOW ... ... ... ... 20 23 19<br />
Azerbaijan 0 MEDIUM 0 LOW 100 ... ... ... 15 … 15<br />
Georgia ... ... ... ... ... ... ... ... ... ... ...<br />
Kazakhstan ... ... ... ... 81 58 55 61 ... ... ...<br />
Kyrgyzstan ... ... ... ... 84 ... ... ... 23 29 22<br />
Tajikistan ... ... ... ... 5 ... ... ... 54 59 48<br />
Turkmenistan ... ... ... ... ... ... ... ... ... ... ...<br />
Uzbekistan ... ... ... ... 100 ... … ... 13 14 11<br />
Eastern <strong>and</strong> South-eastern Asia<br />
Brunei Darussalam 0 LOW 0 LOW ... ... ... ... ... ... ...<br />
Cambodia ... ... ... ... 34 ... ... ... 40 46 38<br />
China ... ... ... ... ... ... ... ... ... ... ...<br />
Democratic People’s Republic of Korea ... ... ... ... ... ... ... ... ... ... ...<br />
Hong Kong, China LOW MEDIUM MEDIUM LOW ... 94 94 95 ... ... ...<br />
Indonesia LOW LOW 0 0 ... 33 33 34 ... 10 11<br />
Japan ... ... ... ... 100 92 91 92 ... ... ...<br />
Lao People’s Democratic Republic ... ... ... ... 74 ... ... ... ... ... ...<br />
Macao, China ... ... ... ... ... 91 90 93 ... ... ...<br />
Malaysia ... ... ... ... ... 54 51 58 41 40 42<br />
Mongolia ... ... ... ... ... ... ... ... 18 19 16<br />
Myanmar 0 LOW LOW LOW ... ... ... ... ... ... ...<br />
Philippines 0 0 0 0 ... ... ... ... ... ... 15<br />
Republic of Korea LOW LOW LOW LOW ... 93 92 94 ... ... ...<br />
Singapore ... ... ... ... 100 90 89 92 ... ... ...<br />
Thail<strong>and</strong> LOW MEDIUM MEDIUM LOW ... 66 60 71 ... ... ...<br />
Timor-Leste ... ... ... ... 0 ... ... ... 14 20 12<br />
Viet Nam ... ... ... ... ... 93 92 94 42 44 41<br />
Europe <strong>and</strong> Northern America<br />
Albania ... ... ... ... ... 47 45 49 … 22 36<br />
Andorra ... ... ... ... ... ... ... ... ... ... ...<br />
Austria ... ... ... ... ... 84 84 85 ... ... ...<br />
Belarus ... ... ... ... 13 ... ... ... 70 68 72<br />
Belgium 0 MEDIUM LOW LOW ... 82 81 83 ... ... ...<br />
Bosnia <strong>and</strong> Herzegovina ... ... ... ... ... ... ... ... ... ... ...<br />
Bulgaria ... ... ... ... 17 63 58 68 23 21 25<br />
Canada ... ... ... ... ... 90 89 90 ... ... ...<br />
Croatia LOW MEDIUM MEDIUM LOW 5 83 81 85 ... ... ...<br />
Cyprus ... ... ... ... ... 62 58 66 ... ... ...<br />
Czech Republic ... ... ... ... 59 86 85 87 ... ... ...<br />
Denmark ... ... ... ... ... 83 84 83 ... ... ...<br />
Estonia LOW HIGH MEDIUM LOW ... 95 94 96 ... ... ...<br />
Finl<strong>and</strong> ... ... ... ... 100 92 90 94 ... ... ...<br />
France LOW MEDIUM MEDIUM LOW ... 81 79 83 ... ... ...<br />
Germany ... ... ... ... ... 88 87 89 ... ... ...<br />
Greece ... ... ... ... ... 74 70 79 38 27 50<br />
Hungary LOW LOW LOW LOW ... 82 81 83 ... ... ...<br />
Icel<strong>and</strong> LOW HIGH MEDIUM LOW ... 76 74 78 ... ... ...<br />
Irel<strong>and</strong> LOW LOW LOW LOW ... 89 88 89 ... ... ...<br />
Italy ... ... ... ... ... 81 80 82 ... ... ...<br />
Latvia ... ... ... ... ... 88 85 91 ... ... ...<br />
Liechtenstein ... ... ... ... ... 90 92 87 ... ... ...<br />
Lithuania LOW LOW LOW LOW ... 84 81 87 71 72 68<br />
Luxembourg HIGH LOW 0 LOW 100 78 80 76 ... ... ...<br />
Malta 0 HIGH LOW LOW ... ... ... ... ... ... ...<br />
Monaco ... ... ... ... ... ... ... ... ... ... ...<br />
Montenegro ... ... ... ... 27 49 45 53 ... ... ...<br />
Netherl<strong>and</strong>s ... ... ... ... ... 87 87 87 ... ... ...<br />
Norway 0 MEDIUM LOW LOW ... 80 79 82 ... ... ...<br />
Pol<strong>and</strong> ... ... ... ... ... 91 90 92 ... ... ...<br />
Portugal 0 MEDIUM MEDIUM LOW ... 81 80 82 ... ... ...<br />
Republic of Moldova ... ... ... ... 0 ... ... ... ... ... ...<br />
Romania ... ... ... ... 67 63 61 65 ... ... ...<br />
Russian Federation ... ... ... ... 92 81 80 83 37 35 39<br />
San Marino ... ... ... ... ... ... ... ... ... ... ...<br />
Serbia LOW HIGH LOW MEDIUM ... 65 63 67 ... ... ...<br />
Slovakia ... ... ... ... ... 73 73 73 ... ... ...<br />
Slovenia ... ... ... ... ... 87 85 89 ... ... ...<br />
Spain ... ... ... ... ... 84 84 84 ... ... ...<br />
Sweden LOW HIGH HIGH LOW 100 78 75 80 60 59 61<br />
Switzerl<strong>and</strong> ... ... ... ... ... 87 87 87 ... ... ...<br />
The former Yugoslav Rep. of Macedonia ... ... ... ... ... ... ... ... ... ... ...<br />
457
1 ANNEX<br />
TABLE 11<br />
(Continued)<br />
PROMOTING SUSTAINABLE DEVELOPMENT AND GLOBAL CITIZENSHIP IN CURRICULA<br />
KNOWLEDGE ACQUISITION ON SUSTAINABLE DEVELOPMENT AND GLOBAL CITIZENSHIP<br />
Inclusion in national curricula frameworks of issues relating<br />
to global citizenship <strong>and</strong> sustainable development 1,2<br />
Percentage<br />
of schools providing life<br />
skills-based<br />
Percentage of students <strong>and</strong> youth with adequate underst<strong>and</strong>ing of issues relating<br />
to global citizenship <strong>and</strong> sustainable development<br />
Gender<br />
equality 3<br />
Human<br />
rights 4<br />
Sustainable<br />
development 5<br />
Global<br />
citizenship 6 HIV/AIDS education 7 Science literacy 9,10 HIV/AIDS <strong>and</strong> sexuality education 7<br />
458<br />
Country or territory<br />
2005-2015 8 2005-2015 8 2005-2015 8 2005-2015 8 2009–2010 8 2012 2009–2015 8<br />
Total Male Female Total Male Female<br />
Ukraine ... ... ... ... 59 ... ... ... 23 25 21<br />
United Kingdom 0 LOW LOW 0 ... 85 86 84 ... ... ...<br />
United States ... ... ... ... ... 82 80 84 ... ... ...<br />
Latin America <strong>and</strong> the Caribbean<br />
Anguilla ... ... ... ... ... ... ... ... ... ... ...<br />
Antigua <strong>and</strong> Barbuda ... ... ... ... 100 ... ... ... ... ... ...<br />
Argentina 0 LOW 0 LOW ... 49 48 51 ... ... ...<br />
Aruba ... ... ... ... ... ... ... ... ... ... ...<br />
Bahamas ... ... ... ... 78 ... ... ... 4 6 3<br />
Barbados ... ... ... ... 85 ... ... ... 46 45 48<br />
Belize LOW LOW LOW 0 38 ... ... ... 76 76 77<br />
Bermuda ... ... ... ... ... ... ... ... ... ... ...<br />
Bolivia, Plurinational States of ... ... ... ... ... ... ... ... ... ... ...<br />
Brazil 0 HIGH LOW LOW ... 46 47 46 ... ... ...<br />
British Virgin Isl<strong>and</strong>s ... ... ... ... ... ... ... ... ... ... ...<br />
Cayman Isl<strong>and</strong>s ... ... ... ... ... ... ... ... ... ... ...<br />
Chile LOW HIGH MEDIUM LOW ... 66 67 64 82 78 85<br />
Colombia ... ... ... ... ... 44 48 40 ... ... 24<br />
Costa Rica ... ... ... ... ... 61 64 58 ... ... ...<br />
Cuba ... ... ... ... ... ... ... ... ... ... ...<br />
Curaçao ... ... ... ... ... ... ... ... ... ... ...<br />
Dominica LOW MEDIUM LOW LOW 100 ... ... ... ... ... ...<br />
Dominican Republic LOW MEDIUM MEDIUM MEDIUM 8 ... ... ... 43 41 45<br />
Ecuador ... ... ... ... 63 ... ... ... ... ... ...<br />
El Salvador LOW HIGH MEDIUM LOW 100 ... ... ... 37 34 40<br />
Grenada LOW LOW LOW LOW 94 ... ... ... ... ... ...<br />
Guatemala MEDIUM HIGH MEDIUM MEDIUM 2 ... ... ... ... ... ...<br />
Guyana ... ... ... ... ... ... ... ... 51 47 54<br />
Haiti 0 LOW 0 LOW 13 ... ... ... 32 28 35<br />
Honduras LOW HIGH MEDIUM LOW 11 ... ... ... 33 35 33<br />
Jamaica ... ... ... ... 44 ... ... ... ... ... ...<br />
Mexico LOW HIGH LOW LOW ... 53 55 51 ... ... ...<br />
Montserrat ... ... ... ... ... ... ... ... ... ... ...<br />
Nicaragua MEDIUM HIGH MEDIUM LOW 88 ... ... ... ... ... ...<br />
Panama LOW MEDIUM MEDIUM LOW ... ... ... ... 14 12 15<br />
Paraguay HIGH MEDIUM LOW LOW ... ... ... ... ... ... ...<br />
Peru LOW HIGH MEDIUM LOW ... 32 32 31 … … 27<br />
Saint Kitts <strong>and</strong> Nevis ... ... ... ... 45 ... ... ... ... ... ...<br />
Saint Lucia ... ... ... ... 59 ... ... ... ... ... ...<br />
Saint-Martin ... ... ... ... ... ... ... ... ... ... ...<br />
Saint Vincent <strong>and</strong> the Grenadines ... ... ... ... 100 ... ... ... ... ... ...<br />
Sint-Maarten ... ... ... ... ... ... ... ... ... ... ...<br />
Suriname ... ... ... ... 0 ... ... ... ... ... ...<br />
Trinidad <strong>and</strong> Tobago ... ... ... ... ... ... ... ... ... ... ...<br />
Turks <strong>and</strong> Caicos Isl<strong>and</strong>s ... ... ... ... ... ... ... ... ... ... ...<br />
Uruguay LOW HIGH LOW LOW 90 53 53 53 ... ... ...<br />
Venezuela, Bolivarian Republic of 0 HIGH LOW LOW 100 ... ... ...<br />
Northern Africa <strong>and</strong> Western Asia<br />
Algeria ... ... ... ... ... ... ... ... ... ... ...<br />
Bahrain ... ... ... ... ... ... ... ... ... ... ...<br />
Egypt ... ... ... ... ... ... ... ... ... ... 3<br />
Iraq LOW HIGH MEDIUM LOW ... ... ... ... ... ... ...<br />
Israel ... ... ... ... 13 71 68 74 ... ... ...<br />
Jordan ... ... ... ... ... 50 39 61 ... ... 9<br />
Kuwait ... ... ... ... ... ... ... ... ... ... ...<br />
Lebanon ... ... ... ... ... ... ... ... ... ... ...<br />
Libya ... ... ... ... ... ... ... ... ... ... ...<br />
Morocco ... ... ... ... ... ... ... ... 22 25 20<br />
Oman ... ... ... ... ... ... ... ... ... ... ...<br />
Palestine 0 LOW LOW LOW ... ... ... ... ... ... ...<br />
Qatar LOW MEDIUM MEDIUM LOW 100 37 32 43 ... ... ...<br />
Saudi Arabia ... ... ... ... ... ... ... ... ... ... ...<br />
Sudan ... ... ... ... ... ... ... ... ... ... ...<br />
Syrian Arab Republic ... ... ... ... ... ... ... ... ... ... ...<br />
Tunisia ... ... ... ... ... 45 45 45 8 5 11<br />
Turkey ... ... ... ... ... 74 70 77 ... ... ...<br />
United Arab Emirates ... ... ... ... ... 65 57 72 ... ... ...<br />
Yemen ... ... ... ... 4 ... ... ... ... ... ...<br />
The Pacific<br />
Australia LOW HIGH MEDIUM MEDIUM ... 86 86 87 ... ... ...<br />
Cook Isl<strong>and</strong>s 0 LOW LOW LOW ... ... ... ... ... ... ...<br />
Fiji 0 MEDIUM MEDIUM LOW ... ... ... ... ... ... ...<br />
Kiribati LOW 0 LOW 0 ... ... ... ... ... ... ...<br />
Marshall Isl<strong>and</strong>s ... ... ... ... ... ... ... ... ... ... ...<br />
Micronesia (Federated States of) 0 LOW LOW LOW ... ... ... ... ... ... ...<br />
Nauru 0 0 LOW LOW ... ... ... ... ... ... ...
STATISTICAL TABLES<br />
1<br />
TABLE 11<br />
(Continued)<br />
PROMOTING SUSTAINABLE DEVELOPMENT AND GLOBAL CITIZENSHIP IN CURRICULA<br />
KNOWLEDGE ACQUISITION ON SUSTAINABLE DEVELOPMENT AND GLOBAL CITIZENSHIP<br />
Inclusion in national curricula frameworks of issues relating<br />
to global citizenship <strong>and</strong> sustainable development 1,2<br />
Percentage<br />
of schools providing life<br />
skills-based<br />
Percentage of students <strong>and</strong> youth with adequate underst<strong>and</strong>ing of issues relating<br />
to global citizenship <strong>and</strong> sustainable development<br />
Gender<br />
equality 3<br />
Human<br />
rights 4<br />
Sustainable<br />
development 5<br />
Global<br />
citizenship 6 HIV/AIDS education 7 Science literacy 9,10 HIV/AIDS <strong>and</strong> sexuality education 7<br />
Country or territory<br />
2005-2015 8 2005-2015 8 2005-2015 8 2005-2015 8 2009–2010 8 2012 2009–2015 8<br />
Total Male Female Total Male Female<br />
New Zeal<strong>and</strong> 0 LOW MEDIUM LOW ... 84 83 85 ... ... ...<br />
Niue ... ... ... ... ... ... ... ... ... ... ...<br />
Palau ... ... ... ... ... ... ... ... ... ... ...<br />
Papua New Guinea LOW MEDIUM MEDIUM LOW 100 ... ... ... ... ... ...<br />
Samoa 0 LOW MEDIUM 0 ... ... ... ... 5 6 5<br />
Solomon Isl<strong>and</strong>s ... ... ... ... ... ... ... ... ... ... ...<br />
Tokelau LOW LOW MEDIUM 0 ... ... ... ... ... ... ...<br />
Tonga ... ... ... ... ... ... ... ... ... ... ...<br />
Tuvalu MEDIUM MEDIUM HIGH MEDIUM 100 ... ... ... ... ... ...<br />
Vanuatu ... ... ... ... 8 ... ... ... ... ... ...<br />
Southern Asia<br />
Afghanistan 0 LOW LOW LOW 1 ... ... ... ... ... ...<br />
Bangladesh ... ... ... ... ... ... ... ... ... ... 13<br />
Bhutan MEDIUM LOW MEDIUM MEDIUM ... ... ... ... 23 … 21<br />
India LOW HIGH HIGH LOW 31 ... ... ... 40 44 35<br />
Iran, Islamic Republic of ... ... ... ... ... ... ... ... 18 21 16<br />
Maldives 0 MEDIUM MEDIUM LOW ... ... ... ... ... 40 35<br />
Nepal MEDIUM MEDIUM LOW MEDIUM 8 ... ... ... 28 34 26<br />
Pakistan LOW HIGH LOW LOW ... ... ... ... 4 5 4<br />
Sri Lanka ... ... ... ... ... ... ... ... ... ... ...<br />
Sub-Saharan Africa<br />
Angola ... ... ... ... ... ... ... ... 28 32 25<br />
Benin ... ... ... ... ... ... ... ... 26 31 25<br />
Botswana ... ... ... ... 100 ... ... ... ... ... ...<br />
Burkina Faso ... ... ... ... 10 ... ... ... 32 36 31<br />
Burundi ... ... ... ... 66 ... ... ... 45 47 44<br />
Cabo Verde ... ... ... ... 100 ... ... ... 67 65 68<br />
Cameroon ... ... ... ... ... ... ... ... 63 67 60<br />
Central African Republic ... ... ... ... 27 ... ... ... ... ... ...<br />
Chad ... ... ... ... 75 ... ... ... ... ... ...<br />
Comoros ... ... ... ... 27 ... ... ... 22 27 21<br />
Congo ... ... ... ... ... ... ... ... 18 28 14<br />
Côte d’Ivoire LOW HIGH LOW LOW 2 ... ... ... 18 25 16<br />
Democratic Rep. of the Congo 0 LOW LOW LOW 68 ... ... ... 20 25 19<br />
Djibouti LOW 0 LOW LOW 38 ... ... ... 11 13 9<br />
Equatorial Guinea ... ... ... ... ... ... ... ... ... ... ...<br />
Eritrea ... ... ... ... 31 ... ... ... ... ... ...<br />
Ethiopia ... ... ... ... 38 ... ... ... 28 34 24<br />
Gabon ... ... ... ... ... ... ... ... 32 36 30<br />
Gambia LOW HIGH MEDIUM LOW ... ... ... ... 29 30 28<br />
Ghana LOW LOW LOW LOW 79 ... ... ... 22 27 20<br />
Guinea ... ... ... ... 82 ... ... ... 26 34 23<br />
Guinea-Bissau ... ... ... ... ... ... ... ... 22 22 23<br />
Kenya ... ... ... ... 100 ... ... ... … 64 54<br />
Lesotho MEDIUM HIGH LOW LOW 88 ... ... ... 36 31 38<br />
Liberia ... ... ... ... 2 ... ... ... 34 29 36<br />
Madagascar ... ... ... ... ... ... ... ... 34 26 23<br />
Malawi ... ... ... ... ... ... ... ... 42 45 41<br />
Mali ... ... ... ... 49 ... ... ... 26 33 24<br />
Mauritania ... ... ... ... ... ... ... ... ... ... ...<br />
Mauritius LOW HIGH HIGH LOW ... ... ... ... 32 30 4<br />
Mozambique ... ... ... ... ... ... ... ... 35 52 30<br />
Namibia LOW MEDIUM MEDIUM LOW ... ... ... ... 58 51 62<br />
Niger LOW 0 LOW 0 82 ... ... ... 17 25 14<br />
Nigeria ... ... ... ... 23 ... ... ... 24 27 22<br />
Rw<strong>and</strong>a MEDIUM 0 MEDIUM LOW ... ... ... ... 51 47 53<br />
Sao Tome <strong>and</strong> Principe ... ... ... ... ... ... ... ... ... 43 43<br />
Senegal ... ... ... ... ... ... ... ... 30 31 29<br />
Seychelles LOW HIGH LOW LOW ... ... ... ... ... ... ...<br />
Sierra Leone ... ... ... ... ... ... ... ... 29 30 29<br />
Somalia ... ... ... ... ... ... ... ... ... ... ...<br />
South Africa 0 HIGH LOW 0 100 ... ... ... ... ... ...<br />
South Sudan MEDIUM HIGH LOW 0 ... ... ... ... ... ... ...<br />
Swazil<strong>and</strong> ... ... ... ... 85 ... ... ... 56 54 58<br />
Togo ... ... ... ... 0 ... ... ... 26 32 23<br />
Ug<strong>and</strong>a ... ... ... ... ... ... ... ... 38 40 38<br />
United Republic of Tanzania LOW LOW 0 LOW ... ... ... ... 43 47 40<br />
Zambia MEDIUM LOW MEDIUM LOW ... ... ... ... 44 47 42<br />
Zimbabwe ... ... ... ... 100 ... ... ... 55 52 56<br />
459
1 ANNEX<br />
TABLE 11<br />
(Continued)<br />
PROMOTING SUSTAINABLE DEVELOPMENT AND GLOBAL CITIZENSHIP IN CURRICULA<br />
KNOWLEDGE ACQUISITION ON SUSTAINABLE DEVELOPMENT AND GLOBAL CITIZENSHIP<br />
Inclusion in national curricula frameworks of issues relating<br />
to global citizenship <strong>and</strong> sustainable development 1,2<br />
Percentage<br />
of schools providing life<br />
skills-based<br />
Percentage of students <strong>and</strong> youth with adequate underst<strong>and</strong>ing of issues relating<br />
to global citizenship <strong>and</strong> sustainable development<br />
Gender<br />
equality 3<br />
Human<br />
rights 4<br />
Sustainable<br />
development 5<br />
Global<br />
citizenship 6 HIV/AIDS education 7 Science literacy 9,10 HIV/AIDS <strong>and</strong> sexuality education 7<br />
Country or territory<br />
2005-2015 8 2005-2015 8 2005-2015 8 2005-2015 8 2009–2010 8 2012 2009–2015 8<br />
Total Male Female Total Male Female<br />
Median Median Median Median<br />
World ... ... ... ... ... ... ... ... ... ... ...<br />
Countries in transition ... ... ... ... ... ... ... ... ... ... ...<br />
Developed countries ... ... ... ... ... 84 83 85 ... ... ...<br />
Developing countries ... ... ... ... ... ... ... ... ... ... ...<br />
Caucasus <strong>and</strong> Central Asia ... ... ... ... 84 ... ... ... ... ... ...<br />
Eastern <strong>and</strong> South-eastern Asia ... ... ... ... ... ... ... ... ... ... ...<br />
Eastern Asia ... ... ... ... ... ... ... ... ... ... ...<br />
South-eastern Asia ... ... ... ... ... ... ... ... ... ... ...<br />
Europe <strong>and</strong> Northern America ... ... ... ... ... 82 81 83 ... ... ...<br />
Latin America <strong>and</strong> the Caribbean ... ... ... ... ... ... ... ... ... ... ...<br />
Caribbean ... ... ... ... ... ... ... ... ... ... ...<br />
Latin America ... ... ... ... ... ... ... ... ... ... ...<br />
Northern Africa <strong>and</strong> Western Asia ... ... ... ... ... ... ... ... ... ... ...<br />
Northern Africa ... ... ... ... ... ... ... ... ... ... ...<br />
Western Asia ... ... ... ... ... ... ... ... ... ... ...<br />
Pacific ... ... ... ... ... ... ... ... ... ... ...<br />
Southern Asia ... ... ... ... ... ... ... ... 23 ... ...<br />
Sub-Saharan Africa ... ... ... ... 67 ... ... ... 31 ... ...<br />
Conflict-affected countries ... ... ... ... ... ... ... ... ... ... ...<br />
Countries with low income ... ... ... ... ... ... ... ... 31 ... ...<br />
Countries with middle income ... ... ... ... ... ... ... ... ... ... ...<br />
Lower middle ... ... ... ... ... ... ... ... 24 ... ...<br />
Upper middle ... ... ... ... ... ... ... ... ... ... ...<br />
Countries with high income ... ... ... ... ... 84 83 84 ... ... ...<br />
Note: The country groupings by level of income are as defined by the World Bank but include only countries listed in the<br />
table. They are based on the list of countries by income group as revised in July 2015.<br />
1. Source: UNESCO-IBE (2016).<br />
2. Curricula referred to are for primary education, lower secondary education or both.<br />
3. Key terms included are a) gender equality, b) gender equity, c) empowerment of girls/women, d) gender sensitive(ity)<br />
<strong>and</strong> e) gender parity. The degree of inclusion of the issue in curricula is assessed as LOW if 1 or 2 of the 5 items are covered,<br />
MEDIUM if 3 are covered <strong>and</strong> HIGH if 4 or 5 are covered; 0 indicates no inclusion of any items.<br />
4. Key terms included are a) human rights, rights <strong>and</strong> responsibilities (children’s rights, cultural rights, indigenous rights,<br />
women’s rights, disability rights); b) freedom (of expression, of speech, of press, of association or organization) <strong>and</strong> civil<br />
liberties; c) social justice; d) democracy/democratic rule, democratic values/principles; e) human rights education. The<br />
degree of inclusion of the issue in curricula is assessed as LOW if 1 or 2 of the 5 items are covered, MEDIUM if 3 are covered<br />
<strong>and</strong> HIGH if 4 or 5 are covered; 0 indicates no inclusion of any items.<br />
5.Key terms included are a) sustainable, sustainability, sustainable development; b) economic sustainability, sustainable<br />
growth, sustainable production/consumption, green economy; c) social sustainability (social cohesion <strong>and</strong> sustainability);<br />
d) environmental sustainability/environmentally sustainable; e) climate change/variability (global warming, carbon<br />
emissions/footprint); f) renewable energy/fuels, alternative energy sources (solar, tidal, wind, wave, geothermal,<br />
biomass); g) ecosystems, ecology (biodiversity, biosphere, biomes, loss of diversity); h) waste management, recycling; i)<br />
education for sustainable development, sustainability education, education for sustainability; j) environmental education/<br />
studies, education for the environment, education for environmental sustainability. The degree of inclusion of the issue in<br />
curricula is assessed as LOW if 1 to 4 of the 10 items are covered, MEDIUM if 5 to 7 items are covered <strong>and</strong> HIGH if 8 to 10<br />
items are covered; 0 indicates no inclusion of any items.<br />
6. Key terms are a) globalization; b) global citizen(ship)/culture/identity/community; c) global-local thinking, local-global<br />
(think global[ly] act local[ly], glocal); d) multicultural(ism)/intercultural(ism) (<strong>and</strong> hyphenated forms); e) migration,<br />
immigration, mobility, movement of <strong>people</strong>; f) global competition/competitiveness, globally competitive, international<br />
competitiveness; g) global inequality(ies)/disparity(ies); h) national/local citizenship/culture/identity(ies)/culture(s)/<br />
heritage, global citizenship education; i) education for global citizenship. The degree of inclusion of the issue in curricula<br />
is assessed as LOW if 1 to 4 of these items are covered, MEDIUM if 5 to 7 are covered <strong>and</strong> HIGH if 8 or 9 are covered; 0<br />
indicates no inclusion of any items.<br />
7. Data are from UNAIDS (2011), 2015 UNAIDS AIDSInfo Online Database <strong>and</strong> DHS StatCompiler. For more detailed country<br />
notes see these sources.<br />
8. Data are for the most recent year available in the period specified. For details see relevant sources.<br />
9. Source: GEM Report team calculations (2016) based on PISA 2012 data (OECD, 2013). PISA defines scientific literacy as<br />
a) scientific knowledge <strong>and</strong> its use to identify questions, acquire new knowledge, explain scientific phenomena <strong>and</strong> draw<br />
evidence-based conclusions about science-related issues; b) underst<strong>and</strong>ing of the characteristic features of science as a<br />
form of human knowledge <strong>and</strong> enquiry; c) awareness of how science <strong>and</strong> technology shape the material, intellectual <strong>and</strong><br />
cultural environments; <strong>and</strong> d) willingness to engage in science-related issues, <strong>and</strong> with the ideas of science, as a reflective<br />
citizen. Science literacy is used in this table as a proxy measure of knowledge of environmental science, <strong>and</strong> geoscience<br />
<strong>and</strong> of sustainable development/sustainability more broadly, given the correlation between the two.<br />
(…) No data are available.<br />
460
STATISTICAL TABLES<br />
1<br />
TABLE 12<br />
SDG 4, Means of implementation 4.a <strong>and</strong> 4.b – Education facilities, learning environments <strong>and</strong> internationally inbound <strong>and</strong> outbound tertiary students<br />
by 2030, build <strong>and</strong> upgrade education facilities that are child, disability <strong>and</strong> gender sensitive <strong>and</strong> provide effective learning environments; enhance student international mobility<br />
EDUCATION FACILITIES AND INTERNATIONALLY INBOUND AND OUTBOUND TERTIARY STUDENTS<br />
SAFE, NON-VIOLENT, INCLUSIVE AND EFFECTIVE LEARNING ENVIRONMENTS<br />
Education facilities<br />
INTERNATIONALLY MOBILE STUDENTS IN TERTIARY EDUCATION<br />
Student international mobility<br />
Water, sanitation <strong>and</strong> hygiene in schools 1<br />
Information, communication <strong>and</strong> technology<br />
Internationally mobile students<br />
(inbound)<br />
Internationally mobile students<br />
(outbound)<br />
Percentage of schools (%) with:<br />
Percentage of schools (%) with:<br />
Basic<br />
drinking<br />
water<br />
Basic<br />
sanitation<br />
or toilets<br />
Of which:<br />
single-sex<br />
toilets<br />
Basic<br />
h<strong>and</strong>washing<br />
facilities<br />
Electricity<br />
Internet used<br />
for pedagogical<br />
purposes<br />
Computers used<br />
for pedagogical<br />
purposes<br />
Number enrolled<br />
in tertiary<br />
education (000)<br />
Inbound<br />
mobility rate (%) 2<br />
Number enrolled<br />
in tertiary<br />
education (000)<br />
Outbound<br />
mobility rate<br />
(%) 3<br />
2014 2014 2014<br />
School year<br />
ending in<br />
2014<br />
School year<br />
ending in<br />
2014<br />
School year<br />
ending in<br />
2014<br />
School year<br />
ending in<br />
2014<br />
School year<br />
ending in<br />
2014<br />
School year<br />
ending in<br />
2014<br />
School year<br />
ending in<br />
2014<br />
School year<br />
ending in<br />
2014<br />
Country or territory<br />
Total Total Total Total<br />
Caucasus <strong>and</strong> Central Asia<br />
Armenia 92 86 … … 100 y … 100 y 4 3.9 6.5 **, z 5.6 z<br />
Azerbaijan 3,4 5 68 … … 100 y 27 y 84 y 4 2.3 22.0 **, z 11.7 z<br />
Georgia 75 70 … … 100 y 100 y 100 y 3 2.8 9.9 **, z 8.8 z<br />
Kazakhstan 4 85 85 … … … … 100 *,y 10 1.5 48.9 **, z 6.3 z<br />
Kyrgyzstan 4 30 53 15 … 100 y 6 y 86 y 12 4.5 5.9 **, z 2.1 z<br />
Tajikistan 51 29 … … … … … 1.9 0.8 9.7 **, z 5.0 z<br />
Turkmenistan … … … … … … … 0.1 0.2 35.9 **, z …<br />
Uzbekistan 100 100 … … … … … ... ... 18.8 **, z …<br />
Eastern <strong>and</strong> South-eastern Asia<br />
Brunei Darussalam … … … … … 100 **,v 100 **,v 0.4 3.2 3.4 **, z 38.3 z<br />
Cambodia 58 81 … … … … 3 *,y ... ... 4.2 **, z …<br />
China 99 62 … … … … … 108 0.3 712.2 **, z 2.1 z<br />
Democratic People's Republic of Korea … … … … … … … ... ... 1.9 **, z …<br />
Hong Kong, China 3,4 … … … … 100 y 100 y 100 y 30 9.8 31.8 **, z 10.6 z<br />
Indonesia 83 53 55 … … … … 7 y 0.1 y 39.1 **, z 0.6 z<br />
Japan … … … … … … … 136 z 3.5 z 32.3 **, z 0.8 z<br />
Lao People's Democratic Republic 54 47 … … … … … 0.5 0.4 5.0 **, z 3.6 z<br />
Macao, China … … … … … … … 11 36.8 2.1 **, z 7.6 z<br />
Malaysia 3,4 100 100 … … 100 x 91 x 100 x 36 4.1 56.3 **, z 5.0 z<br />
Mongolia 48 52 … … 91 y … 100 y 1.1 0.6 8.0 **, z 4.5 z<br />
Myanmar 57 23 … … … … 5 y 0.1 y 0.0 y 6.4 **, z …<br />
Philippines 91 53 … … … … … ... ... 11.5 **, z 0.3 z<br />
Republic of Korea … … … … 100 **,y 100 **,y 100 **,y 56 z 1.7 z 116.9 **, z 3.5 z<br />
Singapore 3,4,5 … … … … 100 x 100 x 100 x 49 z 19.2 z 22.6 **, z 8.8 z<br />
Thail<strong>and</strong> 60 45 … … … 98 *,y 98 *,y 12 0.5 25.5 **, z 1.1 z<br />
Timor-Leste 52 64 … … … … … ... ... 3.5 **, z …<br />
Viet Nam 72 72 … … … … … 3 0.1 53.5 **, z 2.4 z<br />
Europe <strong>and</strong> Northern America<br />
Albania 51 30 37 … … … … 4 2.1 24.1 **, z 14.0 z<br />
Andorra … … … … … … … - ... 1.2 **, z 218.8 z<br />
Austria … … … … … … … 65 15.5 15.6 **, z 3.7 z<br />
Belarus 5 100 100 … … 100 w … … 15 2.9 35.9 **, z 6.4 z<br />
Belgium … … … … … … … 56 11.2 16.3 **, z 3.3 z<br />
Bosnia <strong>and</strong> Herzegovina 100 100 … … … … … 8 7.3 10.9 **, z 9.6 z<br />
Bulgaria 100 100 … … … … … 11 4.0 24.6 **, z 8.7 z<br />
Canada … … … … … … … 151 z ... 45.8 **, z …<br />
Croatia 100 100 … … … … … 0.6 0.4 8.6 **, z …<br />
Cyprus … … … … … … … 5 14.3 26.2 **, z 82.1 z<br />
Czech Republic … … … … … … … 41 9.8 12.5 **, z 2.9 z<br />
Denmark … … … … … … … 30 9.9 5.3 **, z 1.8 z<br />
Estonia … … … … … … … 2 z 2.9 z 4.2 **, z 6.4 z<br />
Finl<strong>and</strong> … … … … … … … 23 7.4 8.3 **, z 2.7 z<br />
France … … … … … … … 235 9.8 84.1 **, z 3.6 z<br />
Germany … … … … … … … 211 7.2 119.1 **, z 4.3 z<br />
Greece … … … … … … … 28 z 4.2 z 34.0 **, z 5.2 z<br />
Hungary … … … … … … … 23 7.0 8.5 **, z 2.4 z<br />
Icel<strong>and</strong> … … … … … … … 1.2 y 6.2 2.8 **, z …<br />
Irel<strong>and</strong> … … … … … … … 13 z 6.4 z 16.3 **, z 8.2 z<br />
Italy … … … … … … … 82 z 4.4 z 48.0 **, z 2.6 z<br />
Latvia … … … … … … … 4 5.0 6.3 **, z 6.7 z<br />
Liechtenstein … … … … … … … 0.7 85.3 1.0 **, z …<br />
Lithuania … … … … … … … 4 z 2.5 z 11.9 **, z 7.5 z<br />
Luxembourg … … … … … … … 3 z ... 9.0 **, z …<br />
Malta … … … … … … … 0.7 5.9 1.9 **, z 15.4 z<br />
Monaco … … … … … … … ... ... 0.3 **, z …<br />
Montenegro 95 95 … … … … … ... ... 4.8 **, z …<br />
Netherl<strong>and</strong>s … … … … … … … 69 z ... 13.0 **, z …<br />
Norway … … … … 100 v … … 9 3.5 17.9 **, z 7.0 z<br />
Pol<strong>and</strong> … … … … … … … 28 z 1.5 z 23.0 **, z 1.2 z<br />
Portugal … … … … … … … 15 4.1 9.5 **, z 2.6 z<br />
Republic of Moldova 51 70 … … … … … 2 z 1.9 z 17.4 **, z 14.2 z<br />
Romania 90 90 … … … … … 24 4.1 31.1 **, z 5.0 z<br />
Russian Federation 100 100 … … … … … 213 3.0 50.6 **, z 0.7 z<br />
San Marino … … … … … … … ... ... 3.7 **, z …<br />
Serbia 95 95 … … … … … 9 3.7 11.9 **, z 5.0 z<br />
Slovakia … … … … … … … 11 5.6 33.1 **, z 15.8 z<br />
Slovenia … … … … … … … 2 2.7 2.7 **, z 2.8 z 461
1 ANNEX<br />
TABLE 12<br />
(Continued)<br />
EDUCATION FACILITIES AND INTERNATIONALLY INBOUND AND OUTBOUND TERTIARY STUDENTS<br />
SAFE, NON-VIOLENT, INCLUSIVE AND EFFECTIVE LEARNING ENVIRONMENTS<br />
Education facilities<br />
INTERNATIONALLY MOBILE STUDENTS IN TERTIARY EDUCATION<br />
Student international mobility<br />
Water, sanitation <strong>and</strong> hygiene in schools 1<br />
Information, communication <strong>and</strong> technology<br />
Internationally mobile students<br />
(inbound)<br />
Internationally mobile students<br />
(outbound)<br />
Percentage of schools (%) with:<br />
Percentage of schools (%) with:<br />
Basic<br />
drinking<br />
water<br />
Basic<br />
sanitation<br />
or toilets<br />
Of which:<br />
single-sex<br />
toilets<br />
Basic<br />
h<strong>and</strong>washing<br />
facilities<br />
Electricity<br />
Internet used<br />
for pedagogical<br />
purposes<br />
Computers used<br />
for pedagogical<br />
purposes<br />
Number enrolled<br />
in tertiary<br />
education (000)<br />
Inbound<br />
mobility rate (%) 2<br />
Number enrolled<br />
in tertiary<br />
education (000)<br />
Outbound<br />
mobility rate<br />
(%) 3<br />
2014 2014 2014<br />
School year<br />
ending in<br />
2014<br />
School year<br />
ending in<br />
2014<br />
School year<br />
ending in<br />
2014<br />
School year<br />
ending in<br />
2014<br />
School year<br />
ending in<br />
2014<br />
School year<br />
ending in<br />
2014<br />
School year<br />
ending in<br />
2014<br />
School year<br />
ending in<br />
2014<br />
Country or territory<br />
Total Total Total Total<br />
Spain … … … … … … … 56 z 2.9 z 28.6 **, z 1.5 z<br />
Sweden … … … … … … … 25 5.9 17.7 **, z 4.1 z<br />
Switzerl<strong>and</strong> … … … … … … … 50 17.1 11.9 **, z 4.2 z<br />
TFYR Macedonia … … … … … … … 1.3 z 2.2 z 4.3 **, z 7.1 z<br />
Ukraine 100 100 … … … … … 60 2.8 39.7 **, z 1.8 z<br />
United Kingdom … … … … … … … 429 18.2 27.4 **, z 1.1 z<br />
United States … … … … … … … 842 4.3 60.3 **, z 0.3 z<br />
Latin America <strong>and</strong> the Caribbean<br />
Anguilla 3,4 100 100 … … 100 w 100 w 100 w ... ... 0.4 **, z …<br />
Antigua <strong>and</strong> Barbuda 100 100 … … 100 w … … 0.2 y 12.0 y 0.6 **, z …<br />
Argentina 70 68 … … … 23 v 45 v ... ... 7.2 **, z 0.3 z<br />
Aruba … … … … 100 w … 100 w 0.3 22.0 0.1 **, z 10.8 z<br />
Bahamas … … … … 100 v … … ... ... 2.4 **, z …<br />
Barbados 3,4 100 100 … … 100 v 100 v 100 v ... ... 1.2 **, z …<br />
Belize 64 21 32 … … … … ... ... 0.8 **, z 8.9 z<br />
Bermuda … … … … … … … 0.2 20.8 1.6 **, z 131.9 z<br />
Bolivia, Plurinational States of 87 74 … … … … … ... ... 9.1 **, z …<br />
Brazil 93 98 … … … 38 w 46 w 15 y 0.2 y 32.1 **, z 0.4 z<br />
British Virgin Isl<strong>and</strong>s 100 100 … … 100 w 100 w 100 w ... ... 0.4 **, z …<br />
Cayman Isl<strong>and</strong>s 3,4 … … … … 100 w 100 w 100 w ... ... 0.4 **, z …<br />
Chile 3,4 90 90 … … … 70 *z 82 *z 3 0.3 8.9 **, z 0.8 z<br />
Colombia 4,5 73 100 … … 94 x … 88 x 0.9 0.0 25.5 **, z 1.2 z<br />
Costa Rica 75 53 … 64 … … … ... ... 2.1 **, z 1.0 z<br />
Cuba 4 100 100 … … 100 w … 100 w 23 y 4.5 y 1.8 **, z 0.5 z<br />
Curaçao … … … … 100 w … … ... ... ... …<br />
Dominica 100 100 … … 100 w … 75 w ... ... 0.7 **, z …<br />
Dominican Republic 47 60 … … … … … 11 2.3 4.4 **, z …<br />
Ecuador 58 54 … … … 18 w 54 w 3 y 0.6 y 11.1 **, z 1.9 z<br />
El Salvador 100 67 … … … … 61 w 0.7 0.4 3.1 **, z 1.7 z<br />
Grenada 100 100 … … 100 w … … ... ... 0.5 **, z …<br />
Guatemala 4 70 49 50 … 37 v … 3 v ... ... 2.8 **, z 1.0 z<br />
Guyana 68 68 … … … … 0.0 y 0.4 y 1.4 **, z …<br />
Haiti 60 60 … … … … … ... ... 10.1 **, z …<br />
Honduras 66 46 47 … … … … 1.3 0.7 3.3 **, z 1.8 z<br />
Jamaica 88 80 85 … 100 w … … ... ... 4.0 **, z 5.4 z<br />
Mexico 95 68 69 … … … … 8 z 0.2 z 27.1 **, z 0.8 z<br />
Montserrat 100 100 … … 100 w 60 w 60 w ... ... 0.0 **, z …<br />
Nicaragua 50 26 … … … … … ... ... 2.5 **, z …<br />
Panama 90 84 85 … … … … ... ... 2.6 **, z 2.1 z<br />
Paraguay 64 70 … … … … 16 *,w ... ... 2.9 **, z …<br />
Peru 60 51 55 … … … … ... ... 14.2 **, z …<br />
Saint Kitts <strong>and</strong> Nevis 100 100 … … 100 w 100 w 100 w 2 73.2 0.4 **, z …<br />
Saint Lucia 100 100 … … 100 w 58 w 61 w 0.6 22.8 1.1 **, z 48.1 z<br />
Saint-Martin … … … … … … … ... ... ... …<br />
Saint Vincent <strong>and</strong> the Grenadines 100 100 … … 100 w 68 w … ... ... 0.8 **, z …<br />
Sint-Maarten … … … … 100 w … 100 w 0.1 43.3 ... …<br />
Suriname 80 65 68 … 100 v … … ... ... 0.8 **, z …<br />
Trinidad <strong>and</strong> Tobago 4 100 100 … … 100 v … 77 v ... ... 4.6 **, z …<br />
Turks <strong>and</strong> Caicos Isl<strong>and</strong>s 100 100 … … 100 w 7 w 100 w ... ... 0.1 **, z …<br />
Uruguay 100 100 … … 100 v 96 *,v 100 *,v ... ... 2.4 **, z …<br />
Venezuela, Bolivarian Republic of 96 93 … … … … 49 v ... ... 11.9 **, z …<br />
Northern Africa <strong>and</strong> Western Asia<br />
Algeria 95 100 … … … … … 8 0.6 20.7 **, z 1.7 z<br />
Bahrain 100 100 … … … … … 5 13.2 4.5 **, z 12.1 z<br />
Egypt 100 100 … … … … 98 w 48 1.9 19.7 **, z 0.8 z<br />
Iraq 97 100 … … … … … ... ... 16.0 **, z …<br />
Israel … … … … … … … 5 y 1.2 y 14.7 **, z 3.9 z<br />
Jordan 100 50 68 … … 73 x 89 x 28 y 9.1 y 19.4 **, z …<br />
Kuwait 100 100 … … … … … ... ... 16.8 **, z 23.4 z<br />
Lebanon … … … … … … … 17 7.6 12.0 **, z 5.2 z<br />
Libya 25 65 … … … … … ... ... 6.4 **, z …<br />
Morocco 86 73 … … … … … ... ... 38.6 **, z 5.5 z<br />
Oman 96 94 … … 100 w 77 x 100 x 3 3.0 11.3 **, z 14.5 z<br />
Palestine 6 89 83 … … 100 y 21 y 64 y . . 20.9 **, z 9.8 z<br />
Qatar 4 100 100 … … 100 w 61 x 100 x 10 39.9 5.0 **, z 24.1 z<br />
Saudi Arabia … … … … … … … 72 4.8 73.5 **, z 5.4 z<br />
Sudan 55 44 … … … … … ... ... ... …<br />
Syrian Arab Republic 70 … … … … … … ... ... 22.6 **, z 3.6 z<br />
462
STATISTICAL TABLES<br />
1<br />
TABLE 12<br />
(Continued)<br />
EDUCATION FACILITIES AND INTERNATIONALLY INBOUND AND OUTBOUND TERTIARY STUDENTS<br />
SAFE, NON-VIOLENT, INCLUSIVE AND EFFECTIVE LEARNING ENVIRONMENTS<br />
Education facilities<br />
INTERNATIONALLY MOBILE STUDENTS IN TERTIARY EDUCATION<br />
Student international mobility<br />
Water, sanitation <strong>and</strong> hygiene in schools 1<br />
Information, communication <strong>and</strong> technology<br />
Internationally mobile students<br />
(inbound)<br />
Internationally mobile students<br />
(outbound)<br />
Percentage of schools (%) with:<br />
Percentage of schools (%) with:<br />
Basic<br />
drinking<br />
water<br />
Basic<br />
sanitation<br />
or toilets<br />
Of which:<br />
single-sex<br />
toilets<br />
Basic<br />
h<strong>and</strong>washing<br />
facilities<br />
Electricity<br />
Internet used<br />
for pedagogical<br />
purposes<br />
Computers used<br />
for pedagogical<br />
purposes<br />
Number enrolled<br />
in tertiary<br />
education (000)<br />
Inbound<br />
mobility rate (%) 2<br />
Number enrolled<br />
in tertiary<br />
education (000)<br />
Outbound<br />
mobility rate<br />
(%) 3<br />
2014 2014 2014<br />
School year<br />
ending in<br />
2014<br />
School year<br />
ending in<br />
2014<br />
School year<br />
ending in<br />
2014<br />
School year<br />
ending in<br />
2014<br />
School year<br />
ending in<br />
2014<br />
School year<br />
ending in<br />
2014<br />
School year<br />
ending in<br />
2014<br />
School year<br />
ending in<br />
2014<br />
Country or territory<br />
Total Total Total Total<br />
Tunisia 66 99 60 … … … … 6 z 1.8 z 16.9 **, z 5.0 z<br />
Turkey 99 99 … … … … … 54 z 1.1 z 45.0 **, z 0.9 z<br />
United Arab Emirates 100 100 … … … … … 64 44.8 8.5 **, z 6.4 z<br />
Yemen 53 53 … … … … … ... ... 16.9 **, z …<br />
The Pacific<br />
Australia … … … … ... … … 266 ... 11.7 **, z 0.8 z<br />
Cook Isl<strong>and</strong>s … … … … ... … … ... ... 0.2 **, z …<br />
Fiji 100 95 … … ... … … ... ... 1.2 **, z …<br />
Kiribati 3 4 … … ... … … . y . y 1.1 **, z …<br />
Marshall Isl<strong>and</strong>s 20 10 … … ... … … 0.0 y 1.0 y 0.2 **, z …<br />
Micronesia (Federated States of) … … … … ... … … ... ... ... …<br />
Nauru … … … … ... … … ... ... 0.1 **, z …<br />
New Zeal<strong>and</strong> … … … … 100 x … … 49 18.7 5.4 **, z 2.1 z<br />
Niue 100 100 … … ... … … ... ... 0.0 **, z …<br />
Palau 100 100 … … ... … … 0.2 22.8 ... …<br />
Papua New Guinea … … … … ... … … ... ... 1.3 **, z …<br />
Samoa 95 … … … ... … … ... ... 0.8 **, z …<br />
Solomon Isl<strong>and</strong>s 50 66 66 … ... … … ... ... 3.2 **, z …<br />
Tokelau … … … … ... … … ... ... 0.1 **, z …<br />
Tonga … … … … ... … … ... ... 1.2 **, z …<br />
Tuvalu 65 60 … … ... … … ... ... 0.4 **, z …<br />
Vanuatu 82 69 70 … ... … … ... ... 1.9 **, z …<br />
Southern Asia<br />
Afghanistan 53 58 … 12 … … … - - 12.0 **, z …<br />
Bangladesh 83 60 … … … … … ... ... 24.1 **, z …<br />
Bhutan 3 81 74 73 … … 66 y … ... ... 3.5 **, z 40.5 z<br />
India 75 53 78 42 … … … 34 z 0.1 z 181.9 **, z 0.6 z<br />
Iran, Islamic Republic of 89 86 … … … 32 y 72 y 11 0.2 50.1 **, z 1.1 z<br />
Maldives 3,4 97 73 … … 100 y 40 **y 40 **y ... ... 4.1 **, z …<br />
Nepal 81 68 … … … … 3 x ... ... 30.2 **, z 6.3 z<br />
Pakistan 63 63 … … … … ... ... 37.6 **, z 2.0 z<br />
Sri Lanka 85 82 … … 82 x 18 x 60 x 0.9 0.3 16.0 **, z 5.4 z<br />
Sub-Saharan Africa<br />
Angola 7 54 … 0 … … ... ... 6.9 **, z 3.2 z<br />
Benin 33 74 … … … … ... ... 4.1 **, z 2.8 z<br />
Botswana 4 50 50 … 13 … 83 y 1.0 1.6 4.4 **, z 8.0 z<br />
Burkina Faso 48 39 73 … … … 2 z 2.9 z 3.7 **, z 4.9 z<br />
Burundi 36 53 … 10 … … … 0.4 z 1.0 z 2.0 **, z 4.5 z<br />
Cabo Verde 95 100 … … … … … 0.2 1.4 4.6 **, z 35.4 z<br />
Cameroon 4 31 41 … … ... … 6 **z 3 y ... 19.5 **, z …<br />
Central African Republic 25 44 … … ... … … 1.8 y 14.4 y 0.9 **, z …<br />
Chad 15 36 40 … ... … … ... ... 4.0 **, z …<br />
Comoros 42 50 … … ... … … - ... 4.2 **, z 66.6 z<br />
Congo 33 15 … … ... … … 0.3 z 0.9 z 8.1 **, z 21.8 z<br />
Côte d'Ivoire 70 45 … … ... … … 3 1.7 7.0 **, z 4.2 z<br />
Democratic Rep. of the Congo 20 29 … … ... … … 5 z 1.2 z 5.8 **, z 1.3 z<br />
Djibouti 86 85 83 … … … ... ... 1.8 **, z …<br />
Equatorial Guinea 59 40 … … ... … … ... ... 1.0 **, z …<br />
Eritrea 59 66 … … ... … … ... ... 1.6 **, z …<br />
Ethiopia 39 37 … 7 … … ... ... 5.6 **, z …<br />
Gabon 66 61 … … ... … … ... ... 5.9 **, z …<br />
Gambia 91 71 … … ... … 22 ** ... ... 1.3 **, z …<br />
Ghana 59 62 … … ... … … 16 3.9 8.9 **, z 2.5 z<br />
Guinea 20 69 … … ... … … 0.9 y 0.9 y 5.7 **, z 5.2 z<br />
Guinea-Bissau 25 28 … … ... … … ... ... 1.5 **, z …<br />
Kenya 42 20 21 … ... … … ... ... 12.1 **, z …<br />
Lesotho 30 40 … … ... … … 0.1 0.4 2.9 **, z 12.1 z<br />
Liberia 57 82 … … 6 … … ... ... 0.7 **, z …<br />
Madagascar 4 25 29 … … ... … - z 1.7 z 1.7 z 4.2 **, z 4.4 z<br />
Malawi 88 25 … 4 ... … … ... ... 1.9 **, z …<br />
Mali 48 24 … … ... … … ... ... 5.7 **, z …<br />
Mauritania 18 27 33 … ... … … 0.3 1.4 4.3 **, z 22.4 z<br />
Mauritius 100 100 … … 100 … 99 1.5 3.8 6.0 **, z 14.5 z<br />
Mozambique 68 50 53 … ... … … 0.6 0.4 1.8 **, z 1.4 z<br />
Namibia 81 80 … … ... … … ... ... 3.5 **, z …<br />
Niger 14 14 … … ... … … 1.2 y 5.4 y 2.4 **, z …<br />
Nigeria 67 32 59 … ... … … ... ... 52.1 **, z …<br />
Rw<strong>and</strong>a 89 95 … 37 ... … … 0.7 z 1.0 z 5.2 **, z 6.7 z<br />
463
1 ANNEX<br />
TABLE 12<br />
(Continued)<br />
EDUCATION FACILITIES AND INTERNATIONALLY INBOUND AND OUTBOUND TERTIARY STUDENTS<br />
SAFE, NON-VIOLENT, INCLUSIVE AND EFFECTIVE LEARNING ENVIRONMENTS<br />
Education facilities<br />
INTERNATIONALLY MOBILE STUDENTS IN TERTIARY EDUCATION<br />
Student international mobility<br />
Water, sanitation <strong>and</strong> hygiene in schools 1<br />
Information, communication <strong>and</strong> technology<br />
Internationally mobile students<br />
(inbound)<br />
Internationally mobile students<br />
(outbound)<br />
Percentage of schools (%) with:<br />
Percentage of schools (%) with:<br />
Basic<br />
drinking<br />
water<br />
Basic<br />
sanitation<br />
or toilets<br />
Of which:<br />
single-sex<br />
toilets<br />
Basic<br />
h<strong>and</strong>washing<br />
facilities<br />
Electricity<br />
Internet used<br />
for pedagogical<br />
purposes<br />
Computers used<br />
for pedagogical<br />
purposes<br />
Number enrolled<br />
in tertiary<br />
education (000)<br />
Inbound<br />
mobility rate (%) 2<br />
Number enrolled<br />
in tertiary<br />
education (000)<br />
Outbound<br />
mobility rate<br />
(%) 3<br />
2014 2014 2014<br />
School year<br />
ending in<br />
2014<br />
School year<br />
ending in<br />
2014<br />
School year<br />
ending in<br />
2014<br />
School year<br />
ending in<br />
2014<br />
School year<br />
ending in<br />
2014<br />
School year<br />
ending in<br />
2014<br />
School year<br />
ending in<br />
2014<br />
School year<br />
ending in<br />
2014<br />
Country or territory<br />
Total Total Total Total<br />
Sao Tome <strong>and</strong> Principe 86 87 … … ... … … ... ... 0.5 **, z …<br />
Senegal 55 66 … … ... … … ... ... 11.3 **, z …<br />
Seychelles 5 100 100 … … 100 y … … - - 0.5 **, z 198.3 z<br />
Sierra Leone 23 62 … … ... … … ... ... 0.9 **, z …<br />
Somalia 58 45 … … ... … … ... ... 4.1 **, z …<br />
South Africa 94 100 … … ... … … 42 z 4.1 z 6.7 **, z 0.6 z<br />
South Sudan 45 42 … … ... … … ... ... ... …<br />
Swazil<strong>and</strong> 65 72 … … ... … … 0.0 z 0.5 z 2.7 **, z 33.3 z<br />
Togo 42 22 … … ... … … ... ... 3.3 **, z 5.2 z<br />
Ug<strong>and</strong>a 74 75 … 37 ... … … ... ... 4.7 **, z …<br />
United Republic of Tanzania 59 11 47 1 ... … … ... ... 5.0 **, z 3.1 z<br />
Zambia 84 45 40 … ... … 11 y ... ... 4.0 **, z …<br />
Zimbabwe 52 43 … … ... … … 0.4 y 0.4 y 15.9 **, z 16.9 z<br />
Median Median Sum<br />
Weighted<br />
Weighted<br />
Sum<br />
average<br />
average<br />
World 75 69 … … ... … … 4,056 **, z 2.0 **, z 3,545 **, z 1.8 z<br />
Countries in transition 92 86 … … ... … … 238 **, z 1.8 z 249 **, z 1.9 z<br />
Developed countries … … … … ... … … 2,878 z 6.1 z 807 z 1.7 z<br />
Developing countries 72.5 67 … … ... … … 940 **, z 0.7 **, z 2,490 z 1.8 z<br />
Caucasus <strong>and</strong> Central Asia 75 70 … … ... … … 35 z 1.7 z 166 z 8.3 z<br />
Eastern <strong>and</strong> South Eastern Asia 60 53 … … ... … … 591 **, z 1.0 z 1,264 **, z 2.1 z<br />
Eastern Asia … … … … ... … … 451 z 1.1 z 1,033 **, z 2.4 z<br />
South-eastern Asia 60 53 … … ... … … 140 **, z 0.8 z 231 z 1.4 z<br />
Europe <strong>and</strong> Northern America … … … … ... … … 2,606 z 4.9 z 910 z 1.7 z<br />
Latin America <strong>and</strong> the Caribbean 91.5 87 … … ... … … 90 **, z 0.4 **, z 208 z 0.9 z<br />
Caribbean 100 100 … … ... … … ... ** ... ... ...<br />
Latin America 74 68 … … ... … … ... ... ... ...<br />
Northern Africa <strong>and</strong> Western Asia 96 99 … … ... … … 285 z 1.9 z 334 z 2.2 z<br />
Northern Africa 76 86 … … ... … … ... ... ... ...<br />
Western Asia 99 100 … … ... … … ... ... ... ...<br />
Pacific 82 68 … … ... … … 299 z 17.8 z 33 z 1.9 z<br />
Southern Asia 81 68 … … ... … … 38 **, z 0.1 **, z 359 z 1.0 z<br />
Sub-Saharan Africa 53.5 48 … … ... … … 112 **, z 1.6 **, z 271 z 3.9 z<br />
Conflict-affected countries 67 53 … … ... … … 314 **, z 0.4 **, z 733 z 1.0 z<br />
Countries with low income 48 48 … … ... … … 47 **, z 1.1 **, z 207 z 4.8 z<br />
Countries with middle income 81 68 … … ... … … 742 **, z 0.6 **, z 2,175 z 1.7 z<br />
Lower middle 70 63 … … ... … … 207 **, z 0.4 **, z 740 z 1.3 z<br />
Upper middle 90 85 … … ... … … 536 z 0.8 z 1,435 z 2.0<br />
Countries with high income … … … … ... … … 3,267 z 5.0 z 1,164 z 1.8<br />
Sources: UIS database; GEM Report team calculations for inbound <strong>and</strong> outbound mobility rates.<br />
Note: The country groupings by level of income are as defined by the World Bank but include only countries listed in the<br />
table. They are based on the list of countries by income group as revised in July (2015).<br />
1. UNICEF-WASH Report (2015).<br />
2. Number of students from abroad studying in a given country, expressed as a percentage of total tertiary enrolment in<br />
that country.<br />
3. Number of students from a given country abroad studying abroad, expressed as a percentage of total tertiary<br />
enrolment in that country.<br />
4. The percentage of schools with internet refer to public institutions only.<br />
5. The percentage of schools with computers refer to public institutions only.<br />
6. The percentage of schools with electricity refer to public institutions only.<br />
7. The percentages of schools with internet <strong>and</strong> computer refer to West Bank schools only.<br />
Data in bold are for the school year ending in 2015.<br />
(z) Data are for the school year ending in 2013.<br />
(y) Data are for the school year ending in 2012.<br />
(x) Data are for the school year ending in 2011.<br />
(w) Data are for the school year ending in 2010.<br />
(v) Data are for the school year ending in 2009.<br />
(…) No data available.<br />
(-) Magnitude nil or negligible<br />
464
STATISTICAL TABLES<br />
1<br />
TABLE 13<br />
SDG 4, Means of implementation 4.c – Teaching staff, teacher qualifications <strong>and</strong> training in pre-primary, primary, secondary <strong>and</strong> tertiary education – part 1<br />
By 2030, substantially increase the supply of qualified teachers, including through international cooperation for teacher training in developing countries, especially least<br />
developed countries <strong>and</strong> small isl<strong>and</strong> developing States<br />
PRE-PRIMARY EDUCATION<br />
PRIMARY EDUCATION<br />
Teaching staff Teacher qualifications Teacher training<br />
Number of<br />
classroom<br />
teachers<br />
Qualified<br />
classroom teachers (%) 1<br />
Trained<br />
classroom teachers (%) 2<br />
Pupil/<br />
teacher<br />
ratio 3<br />
Pupil/<br />
qualified<br />
teacher<br />
ratio 3<br />
Pupil/<br />
trained<br />
teacher<br />
ratio 3 Teaching staff<br />
Number of<br />
classroom teachers<br />
Teacher qualification<br />
Qualified<br />
classroom teachers (%) 1<br />
School year<br />
ending in<br />
2014<br />
School year ending in<br />
2014<br />
School year ending in<br />
2014<br />
School year<br />
ending in<br />
2014<br />
School year<br />
ending in<br />
2014<br />
School year<br />
ending in<br />
2014<br />
School year ending in<br />
2014<br />
School year ending in<br />
2014<br />
Country or territory<br />
Total (000) Total Male Female Total Male Female Total (000) Total Male Female<br />
Caucasus <strong>and</strong> Central Asia<br />
Armenia 7 y ... ... ... 80 y ... ... 9 y ... 12 y ... ... ... ...<br />
Azerbaijan 10 64 100 64 85 100 85 11 17 13 41 ... ... ...<br />
Georgia ... ... ... ... ... ... ... ... ... ... 31 ... ... ...<br />
Kazakhstan 82 100 100 100 100 100 100 9 9 9 74 100 100 100<br />
Kyrgyzstan ... ... ... ... ... ... ... ... 33 z 94 z 17 74 74 74<br />
Tajikistan 6 89 ... ... 100 ... ... 14 16 14 31 95 96 95<br />
Turkmenistan ... ... ... ... ... ... ... ... ... ... ... ... ... ...<br />
Uzbekistan ... ... ... ... ... ... ... ... ... ... ... ... ... ...<br />
Eastern <strong>and</strong> South-eastern Asia<br />
Brunei Darussalam 0,8 30 66 28 64 75 64 17 58 26 4 48 49 48<br />
Cambodia 6 100 100 100 100 100 100 31 31 31 48 100 100 100<br />
China 1,851 ... ... ... ... ... ... 21 ... ... 5,860 ... ... ...<br />
DPR Korea ... ... ... ... ... ... ... ... ... ... ... ... ... ...<br />
Hong Kong, China ... ... ... ... ... ... ... ... ... ... 23 100 100 100<br />
Indonesia 428 ... ... ... ... ... ... 13 ... ... 1,802 ... ... ...<br />
Japan 112 z ... ... ... ... ... ... 26 z ... ... 407 z ... ... ...<br />
Lao People’s Democratic Republic 8 48 31 48 91 93 91 19 40 21 35 83 80 86<br />
Macao, China 0.8 100 100 100 92 82 92 16 16 17 2 100 100 100<br />
Malaysia 50 100 100 100 100 100 100 18 18 18 278 100 100 100<br />
Mongolia 5 y ... ... ... 94 y 85 y 94 y 27 y ... 29 y 9 98 95 98<br />
Myanmar 16 ... ... ... 48 ... ... 28 ... 58 188 ... ... ...<br />
Philippines ... ... ... ... ... ... ... ... ... ... 461 z 99 z 98 z 100 z<br />
Republic of Korea 88 z ... ... ... ... ... ... 14 z ... ... 166 z ... ... ...<br />
Singapore ... ... ... ... ... ... ... ... ... ... ... ... ... ...<br />
Thail<strong>and</strong> ... ... ... ... ... ... ... ... ... ... 337 100 ... ...<br />
Timor-Leste ... ... ... ... ... ... ... ... ... ... ... ... ... ...<br />
Viet Nam 205 98 85 98 98 85 98 18 18 18 387 100 99 100<br />
Europe <strong>and</strong> Northern America<br />
Albania 4 71 . 71 ... ... ... 18 26 ... 10 72 51 77<br />
Andorra 0.2 100 100 100 100 100 100 14 14 14 0.4 100 100 100<br />
Austria 20 ... ... ... ... ... ... 12 ... ... 31 ... ... ...<br />
Belarus 42 45 5 45 92 84 92 8 17 8 22 99 99 99<br />
Belgium 34 ... ... ... ... ... ... 13 ... ... 69 ... ... ...<br />
Bosnia <strong>and</strong> Herzegovina 1 y ... ... ... ... ... ... 14 y ... ... 10 ... ... ...<br />
Bulgaria 19 ... ... ... ... ... ... 13 ... ... 15 ... ... ...<br />
Canada ... ... ... ... ... ... ... ... ... ... ... ... ... ...<br />
Croatia 8 ... ... ... ... ... ... 13 ... ... 12 ... ... ...<br />
Cyprus 1 ... ... ... ... ... ... 16 ... ... 4 ... ... ...<br />
Czech Republic 26 z ... ... ... ... ... ... 14 z ... ... 26 z ... ... ...<br />
Denmark ... ... ... ... ... ... ... ... ... ... ... ... ... ...<br />
Estonia 8 y ... ... ... ... ... ... 7 y ... ... 7 z ... ... ...<br />
Finl<strong>and</strong> 16 z ... ... ... ... ... ... 12 z ... ... 26 z ... ... ...<br />
France 126 z ... ... ... ... ... ... 20 z ... ... 229 z ... ... ...<br />
Germany 272 ... ... ... ... ... ... 8 ... ... 233 ... ... ...<br />
Greece 14 ... ... ... ... ... ... ... ... ... 67 ... ... ...<br />
Hungary 26 ... ... ... ... ... ... 13 ... ... 35 ... ... ...<br />
Icel<strong>and</strong> 3 z ... ... ... ... ... ... ... ... ... 3 z ... ... ...<br />
Irel<strong>and</strong> ... ... ... ... ... ... ... ... ... ... 32 y ... ... ...<br />
Italy 133 z ... ... ... ... ... ... 13 z ... ... 238 z ... ... ...<br />
Latvia 7 ... ... ... ... ... ... 11 ... ... 10 ... ... ...<br />
Liechtenstein 0,1 y ... ... ... ... ... ... 11 y ... ... 0.3 y ... ... ...<br />
Lithuania 13 ... ... ... ... ... ... 8 ... ... 8 ... ... ...<br />
Luxembourg 2 y ... ... ... ... ... ... 10 y ... ... 4 y ... ... ...<br />
Malta 0,9 ... ... ... ... ... ... 10 ... ... 2 ... ... ...<br />
Monaco ... ... ... ... ... ... ... ... ... ... ... ... ... ...<br />
Montenegro ... ... ... ... ... ... ... ... ... ... ... ... ... ...<br />
Netherl<strong>and</strong>s 33 ... ... ... ... ... ... 15 ... ... 105 ... ... ...<br />
Norway ... ... ... ... ... ... ... ... ... ... 48 ... ... ...<br />
Pol<strong>and</strong> 81 z ... ... ... ... ... ... 15 z ... ... 211 z ... ... ...<br />
Portugal 16 ... ... ... ... ... ... 17 ... ... 50 ... ... ...<br />
Republic of Moldova 12 y ... ... ... 92 y . y 92 y 10 y ... 11 y 8 ... ... ...<br />
Romania 35 ... ... ... ... ... ... 16 ... ... 51 ... ... ...<br />
Russian Federation ... ... ... ... ... ... ... ... ... ... 289 ... ... ...<br />
San Marino 0.1 y ... ... ... ... ... ... 8 y ... ... 0.3 y ... ... ...<br />
Serbia 12 100 100 100 69 y ... ... 13 13 19 y 18 100 100 100<br />
Slovakia 13 ... ... ... ... ... ... 13 ... ... 14 ... ... ...<br />
Slovenia 6 z ... ... ... ... ... ... 9 z ... ... 6 z ... ... ...<br />
Spain ... ... ... ... ... ... ... ... ... ... 224 y ... ... ...<br />
Sweden ... ... ... ... ... ... ... ... ... ... 62 y ... ... ...<br />
Switzerl<strong>and</strong> 14 ... ... ... ... ... ... 12 ... ... 48 ... ... ...<br />
TFYR Macedonia 2 y ... ... ... ... ... ... 8 y ... ... 7 z ... ... ...<br />
465
1 ANNEX<br />
TABLE 13<br />
Part 1 (Continued)<br />
PRE-PRIMARY EDUCATION<br />
PRIMARY EDUCATION<br />
Teaching staff Teacher qualifications Teacher training<br />
Number of<br />
classroom<br />
teachers<br />
Qualified<br />
classroom teachers (%) 1<br />
Trained<br />
classroom teachers (%) 2<br />
Pupil/<br />
teacher<br />
ratio 3<br />
Pupil/<br />
qualified<br />
teacher<br />
ratio 3<br />
Pupil/<br />
trained<br />
teacher<br />
ratio 3 Teaching staff<br />
Number of<br />
classroom teachers<br />
Teacher qualification<br />
Qualified<br />
classroom teachers (%) 1<br />
School year<br />
ending in<br />
2014<br />
School year ending in<br />
2014<br />
School year ending in<br />
2014<br />
School year<br />
ending in<br />
2014<br />
School year<br />
ending in<br />
2014<br />
School year<br />
ending in<br />
2014<br />
School year ending in<br />
2014<br />
School year ending in<br />
2014<br />
Country or territory<br />
Total (000) Total Male Female Total Male Female Total (000) Total Male Female<br />
Ukraine 145 y ... ... ... ... ... ... 9 y ... ... 100 85 82 85<br />
United Kingdom 74 ... ... ... ... ... ... 20 ... ... 272 ... ... ...<br />
United States 634 ... ... ... ... ... ... 14 ... ... 1,688 ... ... ...<br />
Latin America <strong>and</strong> the Caribbean<br />
Anguilla ... ... ... ... ... ... ... ... ... ... ... ... ... ...<br />
Antigua <strong>and</strong> Barbuda 0.1 y ... ... ... 71 y . y 71 y 21 y ... 30 y 0.7 ... ... ...<br />
Argentina ... ... ... ... ... ... ... ... ... ... ... ... ... ...<br />
Aruba 0.1 y ... ... ... 100 y 100 y 100 y 20 y ... 20 y 0.6 y ... ... ...<br />
Bahamas ... ... ... ... ... ... ... ... ... ... ... ... ... ...<br />
Barbados 0.3 100 100 100 ... ... ... 17 17 ... 1 100 100 100<br />
Belize 0.5 57 33 57 30 67 30 17 29 55 2 29 29 29<br />
Bermuda 0.0 100 . 100 100 . 100 9 9 9 0.6 100 100 100<br />
Bolivia, Plurinational States of ... ... ... ... ... ... ... ... ... ... ... ... ... ...<br />
Brazil 292 ... ... ... ... ... ... ... ... ... 795 ... ... ...<br />
British Virgin Isl<strong>and</strong>s ... ... ... ... ... ... ... ... ... ... 0.3 94 90 94<br />
Cayman Isl<strong>and</strong>s 0.1 y ... ... ... 77 y 100 y 75 y 8 y ... 11 y 0.3 z 88 z 94 z 87 z<br />
Chile ... ... ... ... ... ... ... ... ... ... 75 z ... ... ...<br />
Colombia 51 94 88 94 97 92 97 ... ... ... 187 94 91 95<br />
Costa Rica 9 ... ... ... 87 87 87 13 ... 15 36 ... ... ...<br />
Cuba 31 y ... ... ... 100 y . y 100 y 13 y ... 13 y 84 81 ... ...<br />
Curaçao ... ... ... ... ... ... ... ... ... ... ... ... ... ...<br />
Dominica 0.1 ... ... ... ... ... ... 13 ... ... 0.5 65 56 66<br />
Dominican Republic 13 75 78 75 85 y 79 y 85 y 21 28 30 y 62 81 84 81<br />
Ecuador 30 z ... ... ... 81 z 72 z 83 z 18 z ... 22 z 88 ... ... ...<br />
El Salvador 7 z ... ... ... ... ... ... 34 z ... ... 33 z ... ... ...<br />
Grenada 0.3 40 . 40 52 . 52 12 30 24 0.9 49 38 51<br />
Guatemala 26 y ... ... ... ... ... ... 19 y ... ... 105 ... ... ...<br />
Guyana 2 y ... ... ... 65 y 60 y 65 y 16 y ... 24 y 4 y ... ... ...<br />
Haiti ... ... ... ... ... ... ... ... ... ... ... ... ... ...<br />
Honduras 10 51 z 41 z 52 z 51 z 41 z 52 z 24 28 z 28 z 84 ... ... ...<br />
Jamaica ... ... ... ... ... ... ... ... ... ... 12 96 90 96<br />
Mexico 191 ... ... ... ... ... ... 25 ... ... 534 ... ... ...<br />
Montserrat ... ... ... ... ... ... ... ... ... ... 0.04 ... ... ...<br />
Nicaragua ... ... ... ... ... ... ... ... ... ... ... ... ... ...<br />
Panama 5 z ... ... ... 21 z 28 z 21 z 19 z ... 87 z 17 z 100 z 100 z 100 z<br />
Paraguay 6 y 53 y 32 y 56 y 92 y 84 y 93 y 24 y 46 y 26 y 35 y 87 y 83 y 88 y<br />
Peru 76 y ... ... ... ... ... ... 18 y ... ... 198 84 90 82<br />
Saint Kitts <strong>and</strong> Nevis 0.1 100 z . z 100 z 8 . 8 12 15 *, z 151 0.4 100 100 100<br />
Saint Lucia 0.4 ... ... ... 70 . 70 10 ... 15 1 ... ... ...<br />
Saint-Martin ... ... ... ... ... ... ... ... ... ... ... ... ... ...<br />
Saint Vincent <strong>and</strong> the Grenadines 0.4 z ... ... ... 14 z - z 14 z 7 **, z ... 50 **, z 0.9 16 9 18<br />
Sint-Maarten ... ... ... ... ... ... ... ... ... ... 0.3 69 ... ...<br />
Suriname 0.8 93 100 93 7 - 7 24 26 339 5 94 89 94<br />
Trinidad <strong>and</strong> Tobago ... ... ... ... ... ... ... ... ... ... ... ... ... ...<br />
Turks <strong>and</strong> Caicos Isl<strong>and</strong>s ... ... ... ... ... ... ... ... ... ... 0.3 90 ... ...<br />
Uruguay ... ... ... ... ... ... ... ... ... ... ... ... ... ...<br />
Venezuela, Bolivarian Republic of ... ... ... ... ... ... ... ... ... ... ... ... ... ...<br />
Northern Africa <strong>and</strong> Western Asia<br />
Algeria ... ... ... ... ... ... ... ... ... ... 159 ... ... ...<br />
Bahrain 2 53 100 53 50 100 50 15 29 31 9 96 98 96<br />
Egypt 42 90 24 91 73 13 74 28 31 38 481 85 81 88<br />
Iraq ... ... ... ... ... ... ... ... ... ... ... ... ... ...<br />
Israel ... ... ... ... ... ... ... ... ... ... ... ... ... ...<br />
Jordan 7 y ... ... ... ... ... ... 17 y ... ... ... ... ... ...<br />
Kuwait 8 74 - 74 75 - 75 10 13 13 29 77 51 80<br />
Lebanon 13 ... ... ... 93 z 93 z 93 z ... ... 15 z 39 ... ... ...<br />
Libya ... ... ... ... ... ... ... ... ... ... ... ... ... ...<br />
Morocco 40 100 100 100 100 100 100 19 19 19 157 100 100 100<br />
Oman 3 100 100 100 100 100 100 27 27 27 ... ... ... ...<br />
Palestine 7 ... ... ... 100 . 100 19 ... 19 19 47 40 50<br />
Qatar 3 100 100 100 ... ... ... 14 14 ... 10 100 100 100<br />
Saudi Arabia 28 100 . 100 100 . 100 11 11 11 347 100 100 100<br />
Sudan 29 z ... ... ... ... ... ... 26 z ... ... 169 z ... ... ...<br />
Syrian Arab Republic 5 z 47 z 92 z 46 z 35 z - z 35 z 16 z 34 z 46 z ... ... ... ...<br />
Tunisia 13 27 ... ... 49 ... ... 17 63 34 66 100 100 100<br />
Turkey 63 z ... ... ... ... ... ... 17 z ... ... 282 z ... ... ...<br />
United Arab Emirates 9 100 100 100 100 100 100 19 19 19 22 100 100 100<br />
Yemen ... ... ... ... ... ... ... ... ... ... ... ... ... ...<br />
The Pacific<br />
Australia ... ... ... ... ... ... ... ... ... ... ... ... ... ...<br />
Cook Isl<strong>and</strong>s 0.03 70 . 70 70 . 70 14 20 20 0.1 95 100 95<br />
Fiji ... ... ... ... ... ... ... ... ... ... 4 y ... ... ...<br />
Kiribati ... ... ... ... ... ... ... ... ... ... 0.6 97 95 97<br />
Marshall Isl<strong>and</strong>s ... ... ... ... ... ... ... ... ... ... ... ... ... ...<br />
Micronesia (Federated States of) ... ... ... ... ... ... ... ... ... ... ... ... ... ...<br />
Nauru 0.03 93 . 93 ... ... ... 33 35 ... 0.04 50 100 46<br />
466
STATISTICAL TABLES<br />
1<br />
TABLE 13<br />
Part 1 (Continued)<br />
PRE-PRIMARY EDUCATION<br />
PRIMARY EDUCATION<br />
Teaching staff Teacher qualifications Teacher training<br />
Number of<br />
classroom<br />
teachers<br />
Qualified<br />
classroom teachers (%) 1<br />
Trained<br />
classroom teachers (%) 2<br />
Pupil/<br />
teacher<br />
ratio 3<br />
Pupil/<br />
qualified<br />
teacher<br />
ratio 3<br />
Pupil/<br />
trained<br />
teacher<br />
ratio 3 Teaching staff<br />
Number of<br />
classroom teachers<br />
Teacher qualification<br />
Qualified<br />
classroom teachers (%) 1<br />
School year<br />
ending in<br />
2014<br />
School year ending in<br />
2014<br />
School year ending in<br />
2014<br />
School year<br />
ending in<br />
2014<br />
School year<br />
ending in<br />
2014<br />
School year<br />
ending in<br />
2014<br />
School year ending in<br />
2014<br />
School year ending in<br />
2014<br />
Country or territory<br />
Total (000) Total Male Female Total Male Female Total (000) Total Male Female<br />
New Zeal<strong>and</strong> 13 ... ... ... ... ... ... 9 ... ... 25 ... ... ...<br />
Niue 0.0 ... ... ... ... ... ... 5 ... ... 0.02 ... ... ...<br />
Palau 0.03 100 . 100 ... ... ... 18 18 ... ... ... ... ...<br />
Papua New Guinea ... ... ... ... ... ... ... ... ... ... ... ... ... ...<br />
Samoa 0.3 100 100 100 100 100 100 11 11 11 ... ... ... ...<br />
Solomon Isl<strong>and</strong>s 1 68 z 68 z 68 z 59 59 60 33 50 z 56 5 69 71 67<br />
Tokelau ... ... ... ... ... ... ... ... ... ... ... ... ... ...<br />
Tonga 0.2 ... ... ... 100 y . y 100 y 12 ... 11 y 0.8 100 z 99 z 100 z<br />
Tuvalu 0.1 100 . 100 75 . 75 13 13 17 ... ... ... ...<br />
Vanuatu 0.9 z 51 z 56 z 50 z ... ... ... 15 z 30 z ... 2 z 70 z 72 z 69 z<br />
Southern Asia<br />
Afghanistan ... ... ... ... ... ... ... ... ... ... 131 z ... ... ...<br />
Bangladesh ... ... ... ... ... ... ... ... ... ... ... ... ... ...<br />
Bhutan 0.4 ... ... ... ... ... ... 11 ... ... 4 ... ... ...<br />
India ... ... ... ... ... ... ... ... ... ... 4,368 z ... ... ...<br />
Iran, Islamic Republic of ... ... ... ... ... ... ... ... ... ... 287 100 100 100<br />
Maldives 1 73 - 73 73 - 73 17 23 23 3 86 88 85<br />
Nepal 46 82 36 87 88 38 93 22 27 25 188 94 94 94<br />
Pakistan ... ... ... ... ... ... ... ... ... ... 418 ... ... ...<br />
Sri Lanka ... ... ... ... ... ... ... ... ... ... 75 ** 93 **, z ... ...<br />
Sub-Saharan Africa<br />
Angola ... ... ... ... ... ... ... ... ... ... ... ... ... ...<br />
Benin 5 32 z 44 z 27 z 28 y 42 y 22 y 27 83 z 90 y 46 100 100 100<br />
Botswana 2 y 55 y 55 y 55 y 55 y 55 y 55 y 11 y 21 y 21 y 15 z 99 z 98 z 99 z<br />
Burkina Faso 3 z ... ... ... 20 y 76 y 8 y 25 z ... 120 y 58 86 z 83 z 90 z<br />
Burundi 2 69 37 75 72 39 79 35 51 49 47 91 88 94<br />
Cabo Verde 1 49 . 49 49 . 49 18 36 36 3 91 91 91<br />
Cameroon 22 ... ... ... 57 y 55 y 57 y 21 ... 39 y 94 58 59 56<br />
Central African Republic ... ... ... ... ... ... ... ... ... ... 8 y ... ... ...<br />
Chad 0.4 z ... ... ... 52 z 49 z 53 z 29 z ... 56 z 37 z ... ... ...<br />
Comoros ... ... ... ... ... ... ... ... ... ... 4 z 75 z 73 z 77 z<br />
Congo 2 y ... ... ... 92 y 100 y 91 y 26 y ... 28 y 17 y ... ... ...<br />
Côte d’Ivoire 6 89 84 89 89 84 89 22 25 25 75 88 87 93<br />
Democratic Rep. of the Congo 13 100 100 100 20 8 21 25 25 121 383 100 100 100<br />
Djibouti ... ... ... ... ... ... ... ... ... ... 2 100 100 100<br />
Equatorial Guinea 2 y ... ... ... ... ... ... 17 y ... ... 4 y ... ... ...<br />
Eritrea 1 z 50 z 35 z 51 z 50 z 35 z 51 z 34 z 67 z 67 z 9 z 100 z 100 z 100 z<br />
Ethiopia ... ... ... ... ... ... ... ... ... ... 245 54 48 63<br />
Gabon ... ... ... ... ... ... ... ... ... ... ... ... ... ...<br />
Gambia 3 70 73 66 70 73 66 34 49 49 7 84 83 87<br />
Ghana 52 46 43 46 46 43 46 34 75 75 139 55 48 65<br />
Guinea ... ... ... ... ... ... ... ... ... ... 38 71 75 61<br />
Guinea-Bissau ... ... ... ... ... ... ... ... ... ... ... ... ... ...<br />
Kenya 115 ... ... ... 82 90 80 26 ... 32 142 **, y ... ... ...<br />
Lesotho 4 100 100 100 ... ... ... 13 13 ... 11 76 67 79<br />
Liberia ... ... ... ... ... ... ... ... ... ... 26 ... ... ...<br />
Madagascar 15 83 69 84 16 25 15 19 23 120 111 99 99 99<br />
Malawi ... ... ... ... ... ... ... ... ... ... 67 ... ... ...<br />
Mali 5 ... ... ... ... ... ... 20 ... ... 51 ... ... ...<br />
Mauritania 2 ... ... ... 100 100 100 7 ... 7 17 ... ... ...<br />
Mauritius 2 ... ... ... 100 100 100 13 ... 13 6 100 100 100<br />
Mozambique ... ... ... ... ... ... ... ... ... ... 104 90 88 92<br />
Namibia ... ... ... ... ... ... ... ... ... ... ... ... ... ...<br />
Niger 5 100 100 100 90 y 81 y 91 y 28 28 35 y 64 100 100 100<br />
Nigeria ... ... ... ... ... ... ... ... ... ... ... ... ... ...<br />
Rw<strong>and</strong>a 3 z ... ... ... ... ... ... 41 z ... ... 41 ... ... ...<br />
Sao Tome <strong>and</strong> Principe 1 - - - 28 24 29 13 ... 46 0.9 ... ... ...<br />
Senegal 12 100 100 100 26 32 24 17 17 67 60 100 100 100<br />
Seychelles 0.2 68 . 68 36 y . y 33 y 14 20 27 y 0.7 76 68 78<br />
Sierra Leone 3 z 38 z 26 z 41 z 45 z 34 z 47 z 19 z 49 z 42 z 37 z 52 z 47 z 64 z<br />
Somalia ... ... ... ... ... ... ... ... ... ... ... ... ... ...<br />
South Africa 26 ** ... ... ... ... ... ... ... ... ... 223 ** ... ... ...<br />
South Sudan ... ... ... ... ... ... ... ... ... ... ... ... ... ...<br />
Swazil<strong>and</strong> ... ... ... ... ... ... ... ... ... ... 9 z 66 z 60 z 68 z<br />
Togo 3 61 z 49 z 62 z 37 z 33 z 37 z 30 48 z 79 z 34 66 z 67 z 60 z<br />
Ug<strong>and</strong>a 15 z ... ... ... ... ... ... 29<br />
z<br />
... ... 186 z ... ... ...<br />
United Republic of Tanzania ... ... ... ... ... ... ... ... 211 z 211 z 189 z 99 z 99 z 99 z<br />
Zambia ... ... ... ... ... ... ... ... ... ... 64 **, z 66 **, z ... ...<br />
Zimbabwe 10 z 25 z 41 z 24 z 27 z 46 z 26 z 37 z 150 z 138 z 73 z 74 z 71 z 77 z<br />
467
1 ANNEX<br />
TABLE 13<br />
Part 1 (Continued)<br />
PRE-PRIMARY EDUCATION<br />
PRIMARY EDUCATION<br />
Teaching staff Teacher qualifications Teacher training<br />
Number of<br />
classroom<br />
teachers<br />
Qualified<br />
classroom teachers (%) 1<br />
Trained<br />
classroom teachers (%) 2<br />
Pupil/<br />
teacher<br />
ratio 3<br />
Pupil/<br />
qualified<br />
teacher<br />
ratio 3<br />
Pupil/<br />
trained<br />
teacher<br />
ratio 3 Teaching staff<br />
Number of<br />
classroom teachers<br />
Teacher qualification<br />
Qualified<br />
classroom teachers (%) 1<br />
School year<br />
ending in<br />
2014<br />
School year ending in<br />
2014<br />
School year ending in<br />
2014<br />
School year<br />
ending in<br />
2014<br />
School year<br />
ending in<br />
2014<br />
School year<br />
ending in<br />
2014<br />
School year ending in<br />
2014<br />
School year ending in<br />
2014<br />
Country or territory<br />
Total (000) Total Male Female Total Male Female Total (000) Total Male Female<br />
Sum Median Median<br />
Weighted<br />
average<br />
Median Median Sum Sum<br />
World 9,356 ** ... ... ... ... ... ... 17 ** ... ... 30,251 ** ... ... ...<br />
Countries in transition 937 **, y ... ... ... ... ... ... 9 **, y ... ... 785<br />
Developed countries 2,017 ** ... ... ... ... ... ... 14 ** ... ... 4,644 ** ... ... ...<br />
Developing countries 6,405 ... ... ... ... ... ... 18 ** ... ... 24,821 ** ... ... ...<br />
Caucasus <strong>and</strong> Central Asia 193 ** ... ... ... 93 ... ... 10 ** 17 13 338 ** 100 100 100<br />
Eastern <strong>and</strong> South-eastern Asia 2,932 ... ... ... ... ... ... 20 ... ... 10,115 100 99 100<br />
Eastern Asia 2,094 ... ... ... ... ... ... 21 ... ... 6,544 ... ... ...<br />
South-eastern Asia 838 ... ... ... 94 ... ... 16 ... 24 3,572 100 99 100<br />
Europe <strong>and</strong> Northern America 2,606 ** ... ... ... ... ... ... 12 ** ... ... 4,504 ... ... ...<br />
Latin America <strong>and</strong> the Caribbean 1,023 ** ... ... ... ... ... ... 20 ** ... ... 3,025 ... ... ...<br />
Caribbean 73 **, z ... ... ... ... ... ... 20 **, z ... ... 258 ** 88 ... ...<br />
Latin America 946 ... ... ... ... ... ... 20 ** ... ... 2,767 ... ... ...<br />
Northern Africa <strong>and</strong> Western Asia 324 ** 95 ... ... 93 53 96 20 ** 23 19 2,525 ** ... ... ...<br />
Northern Africa 149 90 ... ... 73 ... ... 24 31 34 1,084 100 100 100<br />
Western Asia 175 ** 100 100 100 96 47 96 17 ** 19 19 1,441 ** ... ... ...<br />
Pacific ... ... ... ... ... ... ... ... ... ... ... ... ... ...<br />
Southern Asia ... ... ... ... ... ... ... ... ... ... 5,922 ** ... ... ...<br />
Sub-Saharan Africa 576 ** ... ... ... 49 45 50 30 ** ... 49 3,627 ** 87 87 91<br />
Conflict-affected countries 2,645 **, y ... ... ... ... ... ... 14 **, y ... ... 11,677 ** ... ... ...<br />
Countries with low income 335 ** ... ... ... ... ... ... 28 ** ... ... 2,469 91 88 93<br />
Countries with middle income 6,072 ... ... ... ... ... ... 18 ** ... ... 21,725 **<br />
Lower middle 2,927 ** ... ... ... ... ... ... 15 ** ... ... 11,246 ** ... ... ...<br />
Upper middle 3,144 ... ... ... ... ... ... 20 ... ... 10,479 ... ... ...<br />
Countries with high income 2,950 ** ... ... ... ... ... ... 13 ** ... ... 6,057 ** ... ... ...<br />
468
STATISTICAL TABLES<br />
1<br />
TABLE 13<br />
SDG 4, Means of implementation 4.c – Teaching staff, teacher qualifications <strong>and</strong> training in pre-primary, primary, secondary <strong>and</strong> tertiary education – part 2<br />
By 2030, substantially increase the supply of qualified teachers, including through international cooperation for teacher training in developing countries, especially least<br />
developed countries <strong>and</strong> small isl<strong>and</strong> developing States<br />
PRIMARY EDUCATION<br />
SECONDARY EDUCATION<br />
Teacher training<br />
Trained<br />
classroom teachers (%) 2<br />
Pupil/<br />
teacher<br />
ratio 3<br />
Pupil/<br />
qualified<br />
teacher<br />
ratio 3<br />
Pupil/<br />
trained<br />
teacher<br />
ratio 3<br />
Teaching<br />
staff Teacher qualification Teacher training<br />
Number of<br />
classroom<br />
teachers<br />
Qualified<br />
classroom teachers (%) 1<br />
Trained<br />
classroom teachers (%) 2<br />
Pupil/<br />
teacher<br />
ratio 3<br />
Pupil/<br />
qualified<br />
teacher<br />
ratio 3<br />
Pupil/<br />
trained<br />
teacher<br />
ratio 3<br />
School year ending in<br />
2014<br />
School year<br />
ending in<br />
2014<br />
School year<br />
ending in<br />
2014<br />
School year<br />
ending in<br />
2014<br />
School year<br />
ending in<br />
2014<br />
School year ending in<br />
2014<br />
School year ending in<br />
2014<br />
School year<br />
ending in<br />
2014<br />
School year<br />
ending in<br />
2014<br />
School year<br />
ending in<br />
2014<br />
Country or territory<br />
Total Male Female Total (000) Total Male Female Total Male Female<br />
Caucasus <strong>and</strong> Central Asia<br />
Armenia ... ... ... ... ... ... ... ... ... ... ... ... ... ... ... ...<br />
Azerbaijan 100 100 100 13 ... 13 ... ... ... ... ... ... ... ... ... ...<br />
Georgia ... ... ... 9 ... ... 39 ... ... ... ... ... ... 7 ... ...<br />
Kazakhstan 100 100 100 16 16 16 224 100 100 100 100 100 100 8 8 8<br />
Kyrgyzstan 72 y 73 y 72 y 25 34 33 y 57 ... ... ... ... ... ... 11 ... ...<br />
Tajikistan 100 100 100 22 23 22 ... ... ... ... ... ... ... ... ... ...<br />
Turkmenistan ... ... ... ... ... ... ... ... ... ... ... ... ... ... ... ...<br />
Uzbekistan ... ... ... ... ... ... ... ... ... ... ... ... ... ... ... ...<br />
Eastern <strong>and</strong> South-eastern Asia<br />
Brunei Darussalam 87 92 86 10 21 12 5 87 84 88 91 90 92 9 11 10<br />
Cambodia 100 100 100 45 45 45 ... ... ... ... ... ... ... ... ... ...<br />
China ... ... ... 16 ... ... 6,211 ... ... ... ... ... ... 14 ... ...<br />
DPR Korea ... ... ... ... ... ... ... ... ... ... ... ... ... ... ... ...<br />
Hong Kong, China 96 95 97 14 14 14 31 ** ... ... ... 96 ** 96 ** 96 ** 14 ** ... 14 **<br />
Indonesia ... ... ... 17 ... ... 1,460 ... ... ... ... ... ... 15 ... ...<br />
Japan ... ... ... 17 z ... ... 624 y ... ... ... ... ... ... 12 y ... ...<br />
Lao PDR 98 98 98 25 30 26 33 ** 79 ** ... ... 100 ** ... ... 18 ** 23 ** 18 **<br />
Macao, China 88 74 90 14 14 16 3 100 100 100 82 77 85 12 12 15<br />
Malaysia 99 99 99 11 11 12 260 100 100 100 98 100 98 12 12 12<br />
Mongolia 100 100 100 27 28 27 21 98 93 100 100 100 100 14 14 14<br />
Myanmar 100 ... ... 28 ... 28 100 ... ... ... 94 ... ... 32 ... 34<br />
Philippines 100 z 100 z 100 z 31 z 32 z 31 z 268 z 100 z 100 z 100 z 100 z 100 z 100 z 27 z 27 z 27 z<br />
Republic of Korea ... ... ... 17 z ... ... 238 z ... ... ... ... ... ... 16 z ... ...<br />
Singapore ... ... ... ... ... ... ... ... ... ... ... ... ... ... ... ...<br />
Thail<strong>and</strong> 100 ... ... 15 15 15 ... ... ... ... ... ... ... ... ... ...<br />
Timor-Leste ... ... ... ... ... ... ... ... ... ... ... ... ... ... ... ...<br />
Viet Nam 100 100 100 19 19 19 ... ... ... ... ... ... ... ... ... ...<br />
Europe <strong>and</strong> Northern America<br />
Albania ... ... ... 19 26 ... 23 94 91 96 ... ... ... 14 15 ...<br />
Andorra 100 100 100 10 10 10 0 100 100 100 100 100 100 9 9 9<br />
Austria ... ... ... 11 ... ... 73 ... ... ... ... ... ... 10 ... ...<br />
Belarus 99 99 99 16 17 17 81 98 98 98 96 95 96 8 8 8<br />
Belgium ... ... ... 11 ... ... 128 ... ... ... ... ... ... 9 ... ...<br />
Bosnia <strong>and</strong> Herzegovina ... ... ... 17 ... ... 28 ... ... ... ... ... ... 11 ... ...<br />
Bulgaria ... ... ... 18 ... ... 39 ... ... ... ... ... ... 13 ... ...<br />
Canada ... ... ... ... ... ... ... ... ... ... ... ... ... ... ... ...<br />
Croatia ... ... ... 14 ... ... 46 ... ... ... ... ... ... 8 ... ...<br />
Cyprus ... ... ... 13 ... ... 6 ... ... ... ... ... ... 10 ... ...<br />
Czech Republic ... ... ... 19 z ... ... 69 z ... ... ... ... ... ... 12 z ... ...<br />
Denmark ... ... ... ... ... ... ... ... ... ... ... ... ... ... ... ...<br />
Estonia ... ... ... 11 z ... ... 10 z ... ... ... ... ... ... 8 z ... ...<br />
Finl<strong>and</strong> ... ... ... 13 z ... ... 43 z ... ... ... ... ... ... 13 z ... ...<br />
France ... ... ... 18 z ... ... 457 z ... ... ... ... ... ... 13 z ... ...<br />
Germany ... ... ... 12 ... ... 590 ... ... ... ... ... ... 12 ... ...<br />
Greece ... ... ... ... ... ... 80 ... ... ... ... ... ... ... ... ...<br />
Hungary ... ... ... 11 ... ... 79 ... ... ... ... ... ... 11 ... ...<br />
Icel<strong>and</strong> ... ... ... ... ... ... ... ... ... ... ... ... ... ... ... ...<br />
Irel<strong>and</strong> ... ... ... 16 y ... ... ... ... ... ... ... ... ... ... ... ...<br />
Italy ... ... ... 12 z ... ... 404 z ... ... ... ... ... ... 11 z ... ...<br />
Latvia ... ... ... 11 ... ... 15 ... ... ... ... ... ... 8 ... ...<br />
Liechtenstein ... ... ... 7 y ... ... ... ... ... ... ... ... ... ... ... ...<br />
Lithuania ... ... ... 13 ... ... 34 ... ... ... ... ... ... 8 ... ...<br />
Luxembourg ... ... ... 8 y ... ... 6 y ... ... ... ... ... ... 8 y ... ...<br />
Malta ... ... ... 11 ... ... 4 ... ... ... ... ... ... 8 ... ...<br />
Monaco ... ... ... ... ... ... ... ... ... ... ... ... ... ... ... ...<br />
Montenegro ... ... ... ... ... ... ... ... ... ... ... ... ... ... ... ...<br />
Netherl<strong>and</strong>s ... ... ... 12 ... ... 108 ** ... ... ... ... ... ... 15 ** ... ...<br />
Norway ... ... ... 9 ... ... 51 ... ... ... ... ... ... 9 ... ...<br />
Pol<strong>and</strong> ... ... ... 10 z ... ... 291 z ... ... ... ... ... ... 10 z ... ...<br />
Portugal ... ... ... 13 ... ... 78 ... ... ... ... ... ... 10 ... ...<br />
Republic of Moldova 94 100 94 17 ... 18 26 ... ... ... ... ... ... 9 ... ...<br />
Romania ... ... ... ... ... ... 131 ... ... ... ... ... ... 12 ... ...<br />
Russian Federation ... ... ... 20 ... ... 1,046 y ... ... ... ... ... ... 9 y ... ...<br />
San Marino ... ... ... 6 y ... ... ... ... ... ... ... ... ... ... ... ...<br />
Serbia 56 y 35 y 60 y 16 16 28 y 63 100 100 100 40 y 30 y 46 y 9 9 ...<br />
Slovakia ... ... ... 15 ... ... 42 ... ... ... ... ... ... 11 ... ...<br />
Slovenia ... ... ... 17 z ... ... 15 z ... ... ... ... ... ... 10 z ... ...<br />
Spain ... ... ... 13 y ... ... 290 y ... ... ... ... ... ... 11 y ... ...<br />
Sweden ... ... ... 10 y ... ... 71 y ... ... ... ... ... ... 10 y ... ...<br />
Switzerl<strong>and</strong> ... ... ... 10 ... ... 65 y ... ... ... ... ... ... 9 y ... ...<br />
TFYR Macedonia ... ... ... ... ... ... 18 z ... ... ... ... ... ... ... ... ...<br />
469
1 ANNEX<br />
TABLE 13<br />
Part 2 (Continued)<br />
PRIMARY EDUCATION<br />
SECONDARY EDUCATION<br />
Teacher training<br />
Trained<br />
classroom teachers (%) 2<br />
Pupil/<br />
teacher<br />
ratio 3<br />
Pupil/<br />
qualified<br />
teacher<br />
ratio 3<br />
Pupil/<br />
trained<br />
teacher<br />
ratio 3<br />
Teaching<br />
staff Teacher qualification Teacher training<br />
Number of<br />
classroom<br />
teachers<br />
Qualified<br />
classroom teachers (%) 1<br />
Trained<br />
classroom teachers (%) 2<br />
Pupil/<br />
teacher<br />
ratio 3<br />
Pupil/<br />
qualified<br />
teacher<br />
ratio 3<br />
Pupil/<br />
trained<br />
teacher<br />
ratio 3<br />
School year ending in<br />
2014<br />
School year<br />
ending in<br />
2014<br />
School year<br />
ending in<br />
2014<br />
School year<br />
ending in<br />
2014<br />
School year<br />
ending in<br />
2014<br />
School year ending in<br />
2014<br />
School year ending in<br />
2014<br />
School year<br />
ending in<br />
2014<br />
School year<br />
ending in<br />
2014<br />
School year<br />
ending in<br />
2014<br />
470<br />
Country or territory<br />
Total Male Female Total (000) Total Male Female Total Male Female<br />
Ukraine 100 y ... ... 17 20 16 y 230 98 98 98 ... ... ... 12 12 ...<br />
United Kingdom ... ... ... 17 ... ... 414 ... ... ... ... ... ... 16 ... ...<br />
United States ... ... ... 15 ... ... 1,639 ... ... ... ... ... ... 15 ... ...<br />
Latin America <strong>and</strong> the Caribbean<br />
Anguilla ... ... ... ... ... ... ... ... ... ... ... ... ... ... ... ...<br />
Antigua <strong>and</strong> Barbuda 70 81 69 14 ... 20 1 53 48 55 55 60 53 12 23 22<br />
Argentina ... ... ... ... ... ... ... ... ... ... ... ... ... ... ... ...<br />
Aruba 100 y 98 y 100 y 15 y ... 15 y 1 y ... ... ... 96 y 93 y 98 y 15 y ... 16 y<br />
Bahamas ... ... ... ... ... ... ... ... ... ... ... ... ... ... ... ...<br />
Barbados 100 100 100 18 18 18 ... ... ... ... ... ... ... ... ... ...<br />
Belize 61 56 62 22 78 37 2 50 58 45 45 35 50 18 35 40<br />
Bermuda 100 100 100 7 7 7 1 100 100 100 100 100 100 5 5 5<br />
Bolivia, P.S. ... ... ... ... ... ... ... ... ... ... ... ... ... ... ... ...<br />
Brazil ... ... ... ... ... ... 1,451 ... ... ... ... ... ... ... ... ...<br />
British Virgin Isl<strong>and</strong>s 80 67 82 12 13 15 0 94 92 94 70 62 73 8 8 11<br />
Cayman Isl<strong>and</strong>s 88 z 94 z 87 z 13 z 15 z 15 z 1 y ... ... ... 99 y 99 y 99 y 5 y ... 5 y<br />
Chile ... ... ... 20 z ... ... 75 z ... ... ... ... ... ... 21 z ... ...<br />
Colombia 98 97 99 24 26 25 194 98 98 99 99 99 99 25 25 25<br />
Costa Rica 94 94 94 13 ... 14 32 ... ... ... 96 96 95 14 ... 15<br />
Cuba 100 100 100 9 11 9 94 79 ... ... 100 100 100 9 11 9<br />
Curaçao ... ... ... ... ... ... ... ... ... ... ... ... ... ... ... ...<br />
Dominica 65 56 66 14 22 22 1 46 42 48 46 42 48 ... ... ...<br />
Dominican Republic 85 y 79 y 87 y 21 25 28 y 44 75 75 75 90 y 89 y 90 y 21 28 ...<br />
Ecuador 82 82 82 24 ... 29 101 ... ... ... 81 81 82 19 ... 23<br />
El Salvador ... ... ... 24 z ... ... 16 z ... ... ... ... ... ... 38 z ... ...<br />
Grenada 63 70 61 14 30 23 1 33 29 35 40 40 40 13 38 31<br />
Guatemala ... ... ... 23 ... ... 92 ... ... ... ... ... ... 13 ... ...<br />
Guyana 70 y 63 y 71 y 23 y ... 33 y 4 y ... ... ... ... ... ... 20 y ... ...<br />
Haiti ... ... ... ... ... ... ... ... ... ... ... ... ... ... ... ...<br />
Honduras ... ... ... 14 ... ... 72 ... ... ... ... ... ... 9 ... ...<br />
Jamaica 96 90 96 22 23 23 14 84 77 87 84 77 87 16 20 20<br />
Mexico ... ... ... 27 ... ... 806 ... ... ... ... ... ... 16 ... ...<br />
Montserrat ... ... ... 11 ... ... 0.03 ... ... ... ... ... ... 13 ... ...<br />
Nicaragua ... ... ... ... ... ... ... ... ... ... ... ... ... ... ... ...<br />
Panama 90 y 93 y 90 y 25 z 25 z 25 y 20 z 100 z 100 z 100 z 88 y 87 y 89 y 16 z 16 z ...<br />
Paraguay 92 y 90 y 93 y 24 y 28 y 26 y 34 y ... ... ... 81 y 78 y 83 y 18 y ... 23 y<br />
Peru ... ... ... 18 21 ... 188 85 85 86 81 80 83 14 17 17<br />
Saint Kitts <strong>and</strong> Nevis 68 60 69 14 14 20 1 100 100 100 51 46 53 8 8 17<br />
Saint Lucia 79 73 80 14 ... 18 1 ... ... ... 71 61 76 13 ... 18<br />
Saint-Martin ... ... ... ... ... ... ... ... ... ... ... ... ... ... ... ...<br />
Saint Vincent/Grenadines 76 68 78 16 97 21 1 37 34 38 50 47 52 15 42 31<br />
Sint-Maarten ... ... ... 11 16 ... 0 93 97 90 ... ... ... 8 8 ...<br />
Suriname 6 11 6 14 15 236 5 z ... ... ... 19 z 21 z 18 z 11 z ... 61 z<br />
Trinidad <strong>and</strong> Tobago ... ... ... ... ... ... ... ... ... ... ... ... ... ... ... ...<br />
Turks <strong>and</strong> Caicos Isl<strong>and</strong>s 90 ... ... 9 10 10 0.2 98 ... ... 98 ... ... 10 10 10<br />
Uruguay ... ... ... ... ... ... ... ... ... ... ... ... ... ... ... ...<br />
Venezuela, B.R. ... ... ... ... ... ... ... ... ... ... ... ... ... ... ... ...<br />
Northern Africa <strong>and</strong> Western Asia<br />
Algeria 95 97 93 24 ... 25 ... ... ... ... ... ... ... ... ... ...<br />
Bahrain 83 81 83 12 12 14 9 97 99 96 83 81 85 10 10 12<br />
Egypt 73 69 75 23 27 32 572 85 83 88 63 59 68 14 17 23<br />
Iraq ... ... ... ... ... ... ... ... ... ... ... ... ... ... ... ...<br />
Israel ... ... ... ... ... ... ... ... ... ... ... ... ... ... ... ...<br />
Jordan ... ... ... ... ... ... ... ... ... ... ... ... ... ... ... ...<br />
Kuwait 79 52 82 9 11 11 ... ... ... ... ... ... ... ... ... ...<br />
Lebanon 97 96 97 ... ... 13 z 48 ... ... ... 99 98 99 ... ... ...<br />
Libya ... ... ... ... ... ... ... ... ... ... ... ... ... ... ... ...<br />
Morocco 100 100 100 26 26 26 135 z ... ... ... ... ... ... ... ... ...<br />
Oman ... ... ... ... ... ... ... ... ... ... ... ... ... ... ... ...<br />
Palestine 100 100 100 24 51 24 36 28 24 31 100 100 100 20 71 20<br />
Qatar ... ... ... 11 11 ... 9 100 100 100 ... ... ... 10 10 ...<br />
Saudi Arabia 100 100 100 11 11 11 312 100 100 100 100 100 100 11 ** 11 ** 11 **<br />
Sudan ... ... ... 25 z ... ... 51 z ... ... ... 66 y 65 y 67 y 37 z ... 13 z<br />
Syrian Arab Republic ... ... ... ... ... ... ... ... ... ... ... ... ... ... ... ...<br />
Tunisia 100 100 100 17 17 17 ... ... ... ... ... ... ... ... ... ...<br />
Turkey ... ... ... 20 z ... ... 525 z ... ... ... ... ... ... 20 z ... ...<br />
United Arab Emirates 100 100 100 19 19 19 31 100 100 100 100 100 100 13 13 13<br />
Yemen ... ... ... ... ... ... ... ... ... ... ... ... ... ... ... ...<br />
The Pacific<br />
Australia ... ... ... ... ... ... ... ... ... ... ... ... ... ... ... ...<br />
Cook Isl<strong>and</strong>s 89 93 89 17 17 19 0 89 89 88 94 89 97 14 16 15<br />
Fiji 100 y 100 y 100 y 28 y ... 28 y 5 y ... ... ... 100 y 100 y 100 y 19 y ... 19 y<br />
Kiribati ... ... ... 26 27 ... ... ... ... ... ... ... ... ... ... ...<br />
Marshall Isl<strong>and</strong>s ... ... ... ... ... ... ... ... ... ... ... ... ... ... ... ...
STATISTICAL TABLES<br />
1<br />
TABLE 13<br />
Part 2 (Continued)<br />
PRIMARY EDUCATION<br />
SECONDARY EDUCATION<br />
Teacher training<br />
Trained<br />
classroom teachers (%) 2<br />
Pupil/<br />
teacher<br />
ratio 3<br />
Pupil/<br />
qualified<br />
teacher<br />
ratio 3<br />
Pupil/<br />
trained<br />
teacher<br />
ratio 3<br />
Teaching<br />
staff Teacher qualification Teacher training<br />
Number of<br />
classroom<br />
teachers<br />
Qualified<br />
classroom teachers (%) 1<br />
Trained<br />
classroom teachers (%) 2<br />
Pupil/<br />
teacher<br />
ratio 3<br />
Pupil/<br />
qualified<br />
teacher<br />
ratio 3<br />
Pupil/<br />
trained<br />
teacher<br />
ratio 3<br />
School year ending in<br />
2014<br />
School year<br />
ending in<br />
2014<br />
School year<br />
ending in<br />
2014<br />
School year<br />
ending in<br />
2014<br />
School year<br />
ending in<br />
2014<br />
School year ending in<br />
2014<br />
School year ending in<br />
2014<br />
School year<br />
ending in<br />
2014<br />
School year<br />
ending in<br />
2014<br />
School year<br />
ending in<br />
2014<br />
Country or territory<br />
Total Male Female Total (000) Total Male Female Total Male Female<br />
Micronesia F.S. ... ... ... ... ... ... ... ... ... ... ... ... ... ... ... ...<br />
Nauru ... ... ... 39 79 ... 0 89 100 81 ... ... ... 23 26 ...<br />
New Zeal<strong>and</strong> ... ... ... 14 ... ... 35 ... ... ... ... ... ... 14 ... ...<br />
Niue ... ... ... 13 ... ... 0 ... ... ... ... ... ... ... ... ...<br />
Palau ... ... ... ... ... ... ... ... ... ... ... ... ... ... ... ...<br />
Papua New Guinea ... ... ... ... ... ... 14 y ... ... ... 100 y 100 y 100 y 27 y ... 27 y<br />
Samoa ... ... ... ... ... ... ... ... ... ... ... ... ... ... ... ...<br />
Solomon Isl<strong>and</strong>s 65 66 63 20 30 31 2 y ... ... ... 70 y 69 y 72 y 26 y ... 37 y<br />
Tokelau ... ... ... ... ... ... ... ... ... ... ... ... ... ... ... ...<br />
Tonga 97 98 97 22 26 z 23 1 85 100 77 48 54 45 11 13 24<br />
Tuvalu ... ... ... ... ... ... ... ... ... ... ... ... ... ... ... ...<br />
Vanuatu ... ... ... 23 z 33 z ... ... ... ... ... ... ... ... ... ... ...<br />
Southern Asia<br />
Afghanistan ... ... ... 46 z ... ... ... ... ... ... ... ... ... ... ... ...<br />
Bangladesh ... ... ... ... ... ... 378 z 98 z 99 z 97 z 58 z 56 z 67 z 35 z 36 z 61 z<br />
Bhutan ... ... ... 27 ... ... 5 ... ... ... ... ... ... 14 ... ...<br />
India ... ... ... 32 z ... ... 3,879 z ... ... ... ... ... ... 31 z ... ...<br />
Iran, Islamic Republic of 100 100 100 26 26 26 331 95 95 95 100 100 100 18 18 18<br />
Maldives 86 88 85 12 14 14 ... ... ... ... ... ... ... ... ... ...<br />
Nepal 94 95 94 23 25 24 111 ** 78 ** 78 ** 77 ** 82 ** 82 ** 80 ** 29 ** ... 35 **<br />
Pakistan 84 93 74 47 ... 55 ... ... ... ... ... ... ... ... ... ...<br />
Sri Lanka 80 **, z ... ... 24 ** 26 z 30 z 150 y ... ... ... ... ... ... 17 y ... ...<br />
Sub-Saharan Africa<br />
Angola ... ... ... ... ... ... ... ... ... ... ... ... ... ... ... ...<br />
Benin 68 68 64 46 46 68 90 59 58 65 9 9 9 10 17 114<br />
Botswana 99 z 98 z 99 z 23 z 23 z 23 z 17 z 97 z 97 z 96 z 100 z 100 z 100 z 11 z 12 z 11 z<br />
Burkina Faso 86 z 83 z 90 z 44 54 z 54 z 31 47 46 50 47 46 50 27 58 58<br />
Burundi 92 89 95 44 48 47 16 72 75 63 72 75 63 37 51 51<br />
Cabo Verde 96 95 96 23 25 24 4 71 67 76 87 84 91 16 23 18<br />
Cameroon 79 y 79 y 78 y 44 77 58 y 98 54 49 63 54 49 63 20 38 38<br />
Central African Republic 58 y 51 y 86 y 80 y ... 138 y 2 y ... ... ... ... ... ... 68 y ... ...<br />
Chad 65 z ... ... 62 z ... 96 z 15 z ... ... ... 53 z ... ... ... ... ...<br />
Comoros 75 z 73 z 77 z 28 z 37 z 37 z 8 z ... ... ... ... ... ... 9 z ... ...<br />
Congo 80 y 72 y 88 y 44 y ... 55 y 18 y ... ... ... 59 y 55 y 96 y 19 y ... 32 y<br />
Côte d'Ivoire 85 84 87 43 48 50 64 100 100 100 100 100 100 22 22 22<br />
D.R. Congo 95 94 95 35 35 37 301 100 100 100 24 24 22 15 15 62<br />
Djibouti 100 100 100 33 33 33 3 100 100 100 100 100 100 23 23 23<br />
Equatorial Guinea ... ... ... 26 y ... ... ... ... ... ... ... ... ... ... ... ...<br />
Eritrea 80 z ... ... 40 z 40 z 50 z 7 z 83 z 82 z 87 z 83 z 82 z 87 z 38 z 46 z 46 z<br />
Ethiopia 95 95 95 64 118 68 122 **, y ... ... ... 75 **, y 79 **, y 65 **, y 39 **, y ... 52 **, y<br />
Gabon ... ... ... ... ... ... ... ... ... ... ... ... ... ... ... ...<br />
Gambia 84 83 87 37 44 44 5 92 92 90 92 92 90 ... ... ...<br />
Ghana 55 48 65 31 57 57 147 73 70 82 74 71 83 17 23 23<br />
Guinea 75 73 80 46 64 61 ... ... ... ... ... ... ... ... ... ...<br />
Guinea-Bissau ... ... ... ... ... ... ... ... ... ... ... ... ... ... ... ...<br />
Kenya ... ... ... 57 **, y ... ... 93 **, y ... ... ... ... ... ... 41 **, y ... ...<br />
Lesotho 76 67 79 33 43 43 5 **, z ... ... ... ... ... ... 25 **, z ... ...<br />
Liberia 56 55 63 26 ... 47 15 ... ... ... 55 54 57 15 ... 27<br />
Madagascar 17 13 20 42 42 250 65 91 90 92 21 19 22 23 25 112<br />
Malawi 91 **, z 90 **, z 91 **, z 61 ... 76 **, z 13 ... ... ... 66 **, z 61 **, z 78 **, z 70 ... ...<br />
Mali ... ... ... 42 ... ... 51 ... ... ... ... ... ... 19 ... ...<br />
Mauritania 91 91 92 34 ... 38 5 ... ... ... 87 86 91 33 ... 38<br />
Mauritius 100 100 100 19 19 19 9 ... ... ... 44 y ... ... 15 ... ...<br />
Mozambique 90 88 92 54 61 61 24 **, z 76 **, z 75 **, z 80 **, z 87 **, z 86 **, z 89 **, z 31 **, z 41 z 36 z<br />
Namibia ... ... ... ... ... ... ... ... ... ... ... ... ... ... ... ...<br />
Niger 50 47 54 36 36 71 21 100 100 100 16 13 26 25 25 160<br />
Nigeria ... ... ... ... ... ... ... ... ... ... ... ... ... ... ... ...<br />
Rw<strong>and</strong>a 95 z 95 z 95 z 58 ... 63 z 26 z ... ... ... 89 z 93 z 81 z 23 z ... 26 z<br />
Sao Tome <strong>and</strong> Principe 34 33 36 39 ... 113 1 26 27 23 36 26 57 21 80 57<br />
Senegal 70 72 66 32 32 45 ... ... ... ... ... ... ... ... ... ...<br />
Seychelles ... ... ... 13 16 ... 1 92 92 92 ... ... ... 12 14 ...<br />
Sierra Leone 57 z 53 z 69 z 35 z 67 z 61 z 20 z 57 z 56 z 67 z 64 z 63 z 75 z 21 z 36 z 32 z<br />
Somalia ... ... ... ... ... ... ... ... ... ... ... ... ... ... ... ...<br />
South Africa ... ... ... 32 ** ... ... ... ... ... ... ... ... ... ... ... ...<br />
South Sudan ... ... ... ... ... ... ... ... ... ... ... ... ... ... ... ...<br />
Swazil<strong>and</strong> 79 z 77 z 80 z 28 z 43 z 35 z 6 z 76 z 77 z 74 z 76 z 78 z 75 z 16 z 21 z 21 z<br />
Togo 76 z 77 z 69 z 41 62 z 54 z ... ... ... ... ... ... ... ... ... ...<br />
Ug<strong>and</strong>a ... ... ... 46 z ... ... 67 z ... ... ... ... ... ... 21 z ... ...<br />
United Republic of Tanzania 99 z 99 z 99 z 43 z 44 z 44 z 80 y ... ... ... ... ... ... 26 y ... ...<br />
Zambia 93 **, y 89 **, y 96 **, y 48 **, z 73 z 53 **, y ... ... ... ... ... ... ... ... ... ...<br />
Zimbabwe 86 z 84 z 88 z 36 z 49 z 42 z 43 z 49 z 45 z 54 z 73 z 71 z 75 z 22 z 46 z 31 z 471
1 ANNEX<br />
TABLE 13<br />
Part 2 (Continued)<br />
PRIMARY EDUCATION<br />
SECONDARY EDUCATION<br />
Teacher training<br />
Trained<br />
classroom teachers (%) 2<br />
Pupil/<br />
teacher<br />
ratio 3<br />
Pupil/<br />
qualified<br />
teacher<br />
ratio 3<br />
Pupil/<br />
trained<br />
teacher<br />
ratio 3<br />
Teaching<br />
staff Teacher qualification Teacher training<br />
Number of<br />
classroom<br />
teachers<br />
Qualified<br />
classroom teachers (%) 1<br />
Trained<br />
classroom teachers (%) 2<br />
Pupil/<br />
teacher<br />
ratio 3<br />
Pupil/<br />
qualified<br />
teacher<br />
ratio 3<br />
Pupil/<br />
trained<br />
teacher<br />
ratio 3<br />
School year ending in<br />
2014<br />
School year<br />
ending in<br />
2014<br />
School year<br />
ending in<br />
2014<br />
School year<br />
ending in<br />
2014<br />
School year<br />
ending in<br />
2014<br />
School year ending in<br />
2014<br />
School year ending in<br />
2014<br />
School year<br />
ending in<br />
2014<br />
School year<br />
ending in<br />
2014<br />
School year<br />
ending in<br />
2014<br />
Country or territory<br />
Total Male Female Total (000) Total Male Female Total Male Female<br />
Weighted<br />
Weighted<br />
Median<br />
Median Median Sum Median Median<br />
Median Median<br />
Average<br />
Average<br />
World ... ... ... 24 ** ... ... 32,094 ** ... ... ... ... ... ... 18 ** … …<br />
Countries in transition 18 2,424 **, z ... ... ... ... ... ... 10 **, z … …<br />
Developed countries ... ... ... 14 ** ... ... 6,344 ** ... ... ... ... ... ... 13 ** … …<br />
Developing countries 97 96 97 26 ** ... 28 23,407 ** ... ... ... ... ... ... 20 ** … …<br />
Caucasus <strong>and</strong> Central Asia 100 100 100 16 ** 23 19 829 **, y ... ... ... ... ... ... 12 **, y … …<br />
Eastern <strong>and</strong> Southeastern<br />
Asia<br />
100 ... ... 17 20 19 9,861 ... ... ... ... ... ... 15 … …<br />
Eastern Asia ... ... ... 16 ... ... 7,238 ... ... ... ... ... ... 14 … …<br />
South-eastern Asia 100 99 99 19 21 22 2,623 ... ... ... ... ... ... 18 … …<br />
Europe <strong>and</strong> Northern<br />
America<br />
... ... ... 14 ... ... 7,022 ... ... ... ... ... ... 12 … …<br />
Latin America <strong>and</strong> the<br />
Caribbean<br />
85 79 87 22 ** ... 21 3,887 ... ... ... 81 ... ... 16 ** … …<br />
Caribbean 85 79 87 20 ** 16 18 200 81 ... ... 78 62 76 15 ** … 16<br />
Latin America ... ... ... 22 ** ... ... 3,687 ... ... ... ... ... ... 17 ** … …<br />
Northern Africa <strong>and</strong><br />
Western Asia<br />
98 98 99 20 ** ... 18 2,600 ** ... ... ... ... ... ... 16 ** … …<br />
Northern Africa 97 99 97 23 26 25 1,090 ** ... ... ... ... ... ... 17 ** … …<br />
Western Asia ... ... ... 17 ** ... ... 1,509 ** ... ... ... ... ... ... 16 ** … …<br />
Pacific ... ... ... ... ... ... ... ... ... ... ... ... ... ... … …<br />
Southern Asia 86 ... ... 34 ** ... ... 5,498 ** ... ... ... ... ... ... 29 ** … …<br />
Sub-Saharan Africa 80 72 88 42 ** 44 53 2,195 ** ... ... ... 72 71 75 25 ** … …<br />
Conflict-affected<br />
countries<br />
95 ... ... 30 ** ... 30 10,587 ** ... ... ... ... ... ... 23 ** … …<br />
Countries with low<br />
income<br />
84 83 88 43 45 54 1,496 ** ... ... ... 66 61 78 24 ** … …<br />
Countries with middle<br />
income<br />
94 97 94 24 ** ... 26 22,022 ** ... ... ... ... ... ... 19 ** … …<br />
Lower middle 85 ... ... 29 ** ... 33 9,847 ** ... ... ... ... ... ... 24 ** … …<br />
Upper middle 97 96 97 18 ... 23 12,175 ... ... ... ... ... ... 15 … …<br />
Countries with high<br />
income<br />
... ... ... 15 ** ... ... 8,576 ** ... ... ... ... ... ... 12 ** … …<br />
Sources: UIS database; Global Education Monitoring Report team calculations for pupil/qualified <strong>and</strong> pupil/trained teacher<br />
ratios.<br />
Note: The country groupings by level of income are as defined by the World Bank but include only countries listed in the<br />
table. They are based on the list of countries by income group as revised in July 2015.<br />
1. Qualified teachers are defined according to national st<strong>and</strong>ards.<br />
2. Trained teachers are defined as those who have received at least the minimum organized <strong>and</strong> recognized pre-service<br />
<strong>and</strong> in-service pedagogical training required to teach at a given level of education. Data on trained classroom teachers are<br />
not collected for countries whose education statistics are gathered through the OECD, Eurostat or the World Education<br />
Indicators questionnaires.<br />
3. Based on headcounts of pupils <strong>and</strong> teachers.<br />
Data in bold are for the school year ending in 2015.<br />
(z) Data are for the school year ending in 2013.<br />
(y) Data are for the school year ending in 2012.<br />
(*) National estimate.<br />
(**) For country level data: UIS partial estimate; for regional <strong>and</strong> other country grouping sums <strong>and</strong> weighted averages:<br />
partial imputation due to incomplete country coverage (between 33% <strong>and</strong> 60% of the population of the region or other<br />
country grouping).<br />
(-) Magnitude nil or negligible<br />
(.) The category is not applicable or does not exist.<br />
(…) No data are available.<br />
472
STATISTICAL TABLES<br />
1<br />
TABLE 14<br />
Domestic financial commitment to education: public spending<br />
Government<br />
expenditure<br />
on education<br />
as % of GDP<br />
Expenditure<br />
on education<br />
as % of total<br />
government<br />
expenditure<br />
Government<br />
expenditure<br />
on preprimary<br />
education<br />
per pupil<br />
in constant<br />
2013 PPP$<br />
Government<br />
expenditure<br />
on preprimary<br />
education<br />
per pupil as<br />
% of GDP per<br />
capita<br />
Government<br />
expenditure<br />
on primary<br />
education<br />
per pupil<br />
in constant<br />
2013 PPP$<br />
Government<br />
expenditure<br />
on primary<br />
education<br />
per pupil as<br />
% of GDP per<br />
capita<br />
Government<br />
expenditure<br />
on secondary<br />
education<br />
per student<br />
in constant<br />
2013 PPP$<br />
Government<br />
expenditure<br />
on secondary<br />
education<br />
per student<br />
as % of GDP<br />
per capita<br />
Government<br />
expenditure<br />
on tertiary<br />
education<br />
per student<br />
in constant<br />
2013 PPP$<br />
Government<br />
expenditure<br />
on tertiary<br />
education<br />
per student<br />
as % of GDP<br />
per capita<br />
Primary<br />
education<br />
expenditure<br />
on textbooks<br />
<strong>and</strong> teaching<br />
materials<br />
as % of<br />
current<br />
expenditure<br />
on primary<br />
education<br />
in public<br />
institutions<br />
Primary<br />
education<br />
teaching staff<br />
compensation<br />
as % of<br />
current<br />
expenditure<br />
on primary<br />
education<br />
in public<br />
institutions<br />
Country or territory<br />
2014 2014 2014 2014 2014 2014 2014 2014 2014 2014 2014 2014<br />
Caucasus <strong>and</strong> Central Asia<br />
Armenia 2.2 9.4 989 y 13.2 y 875 z 11.3 z 1.193 15.0 645 8.1 0.2 y ...<br />
Azerbaijan 2.5 z 6.5 z 2,594 x 15.9 x ... ... ... ... 2,938 x 18.0 x ... ...<br />
Georgia 2.0 y 6.7 y ... ... 737 y 10.6 y ... ... 1,190 y 17.2 y ... ...<br />
Kazakhstan ... ... 1,531 6.4 ... ... 4.743 19.9 2,240 9.4 2.3 ...<br />
Kyrgyzstan 6.8 z 17.8 z 1,088 z 33.7 z ... ... 1.070 z 33.2 z 561 z 17.4 z ... ...<br />
Tajikistan 4.0 y 16.4 y 560 x 24.3 x ... ... ... ... 486 z 19.1 z ... ...<br />
Turkmenistan 3.0 y 20.8 y ... ... ... ... ... ... ... ... ... ...<br />
Uzbekistan ... ... ... ... ... ... ... ... ... ... ... ...<br />
Eastern <strong>and</strong> South-eastern Asia<br />
Brunei Darussalam 3.8 10.0 ... ... ... ... 8.320 11.6 40.376 56.2 ... ...<br />
Cambodia 2.0 z 9.9 z 170 z 5.6 z 208 z 6.8 z ... ... ... ... 10.1 y 47.5 y<br />
China ... ... ... ... ... ... ... ... ... ... ... ...<br />
DPR Korea ... ... ... ... ... ... ... ... ... ... ... ...<br />
Hong Kong, China 3.6 17.6 3,319 6.3 7,852 14.9 10,162 19.3 12,944 24.6 ... ...<br />
Indonesia 3.3 17.5 285 2.8 1,273 12.3 1,032 10.0 2,025 19.5 ... ...<br />
Japan 3.8 9.3 1,611 z 4.5 z 8,514 z 23.9 z 9,137 z 25.7 z 8,977 z 25.2 z ... ...<br />
Lao PDR 4.2 15.4 ... ... ... ... ... ... ... ... ... ...<br />
Macao, China 2.1 z 14.3 z ... ... ... ... 26,708 z 19.0 z 26,619 z 18.9 z ... ...<br />
Malaysia 6.1 z 21.5 z 779 z 3.2 z 4,055 z 16.8 z 5,391 z 22.3 z 13,231 z 54.7 z ... 76.0 x<br />
Mongolia 4.6 x 12.2 x 2,272 x 24.7 x 1,439 x 15.7 x ... ... 261 x 2.8 x 2.3 x 40.9 x<br />
Myanmar ... ... ... ... ... ... ... ... ... ... ... ...<br />
Philippines ... ... ... ... ... ... ... ... ... ... ... ...<br />
Republic of Korea 4.6 y ... 2,261 z 7.1 z 7,963 z 24.9 z 7,609 z 23.8 z 4,140 z 12.9 z ... 56.7 z<br />
Singapore 2.9 z 19.9 z - y - y ... ... ... ... 17,213 z 22.4 z ... ...<br />
Thail<strong>and</strong> 4.1 z 18.9 z ... ... 3,564 z 23.1 z 2,751 z 17.8 z 2,778 z 18.0 z ... ...<br />
Timor-Leste 7.7 7.7 149 6.8 539 24.6 512 23.3 ... ... 8.5 47.3<br />
Viet Nam 6.3 y 21.4 y 844 y 16.6 y 1,207 y 23.8 y ... ... 2,093 y 41.2 y 12.0 x 68.0 x<br />
Europe <strong>and</strong> Northern America<br />
Albania 3.5 z 12.1 z ... ... 2,882 z 29.3 z 576 z 5.9 z 1,276 z 13.0 z ... ...<br />
Andorra 3.1 ... ... 13.8 ... 13.5 ... 11.7 ... 30.0 0.1 53.4<br />
Austria 5.6 z 11.0 z 7,532 z 16.7 z 10,608 z 23.5 z 12,418 z 27.5 z 16,285 z 36.1 z ... 61.9 z<br />
Belarus 5.0 12.4 5,581 x 32.5 x ... ... ... ... 2,763 15.4 ... ...<br />
Belgium 6.4 x 11.9 x 6,838 y 16.5 y 9,598 y 23.1 y 16,031 y 38.6 y 13,862 y 33.4 y ... 65.8 y<br />
Bosnia <strong>and</strong> Herzegovina ... ... ... ... ... ... ... ... ... ... ... ...<br />
Bulgaria 3.5 y 10.7 y 4,331 y 27.5 y 2,997 y 19.0 y 3,156 y 20.0 y 2,536 y 16.1 y ... 60.2 y<br />
Canada 5.3 x 12.2 x ... ... ... ... 7,545 x 18.3 x ... ... ... 64.5 y<br />
Croatia 4.2 x 8.6 x 5,409 x 24.7 x ... ... ... ... 5,609 x 25.6 x ... ...<br />
Cyprus 6.6 x 15.5 x 5,057 x 14.8 x 11,142 x 32.6 x 13,101 x 38.3 x 12,313 x 36.0 x ... 81.1 x<br />
Czech Republic 4.3 y 9.7 y 4,566 y 15.7 y 4,592 y 15.8 y 7,393 y 25.4 y 6,952 y 23.9 y ... 43.9 y<br />
Denmark 8.5 x 15.0 x 17,235 x 38.6 x 9,751 x 21.8 x 13,143 x 29.4 x 22,905 x 51.3 x ... 64.2 x<br />
Estonia 4.7 y 12.1 y 2,784 y 10.8 y 5,807 y 22.6 y 6,821 y 26.5 y 5,152 y 20.0 y ... ...<br />
Finl<strong>and</strong> 7.2 z 12.5 z 8,642 z 21.6 z 8,349 z 20.9 z 4,337 z 10.8 z 14,180 z 35.4 z ... 54.0 z<br />
France 5.5 y 9.7 y 6,545 y 17.4 y 6,929 y 18.5 y 10,084 y 26.9 y 13,256 y 35.3 y ... 56.3 y<br />
Germany 4.9 y 11.2 y 6,405 y 14.5 y 7,634 y 17.3 y 10,217 y 23.2 y ... ... ... ...<br />
Greece ... ... ... ... ... ... ... ... ... ... ... ...<br />
Hungary 4.6 x 9.3 x 4,254 y 18.5 y 4,338 y 18.9 y 4,526 y 19.7 y 4,801 y 20.9 y ... ...<br />
Icel<strong>and</strong> 7.0 x 15.4 x 7,069 x 17.4 x 10,425 x 25.7 x 8,215 x 20.3 x 9,392 x 23.2 x ... ...<br />
Irel<strong>and</strong> 5.8 y 13.8 y 3,144 y 6.8 y 8,740 y 18.9 y 12,040 y 26.0 y 13,632 y 29.4 y ... 71.6 y<br />
Italy 4.1 x 8.4 x 5,665 y 15.7 y 7,452 y 20.7 y 8,232 y 22.8 y 8,998 x 24.2 x ... 62.0 y<br />
Latvia 4.9 z 13.1 z 4,598 z 20.9 z 5,738 z 26.0 z 5,623 z 25.5 z 4,491 z 20.4 z ... 72.9 z<br />
Liechtenstein 2.6 x ... ... 9.2 x ... 17.9 x ... 13.4 x ... ... ... 62.3 x<br />
Lithuania 4.8 y 13.5 y 5,139 y 20.9 y 4,801 y 19.5 y 4,559 y 18.5 y 5,800 y 23.6 y ... 65.8 y<br />
Luxembourg ... ... 23,613 x 24.9 x 23,795 x 25.1 x 17,159 x 18.1 x ... ... ... 79.6 x<br />
Malta 6.8 y 15.3 y 6,270 y 21.9 y 7,812 y 27.3 y 11,874 y 41.6 y 14,719 y 51.5 y ... 73.8 y<br />
Monaco 1.0 5.0 ... 1.8 x ... 4.0 x ... 9.9 x . . ... ...<br />
Montenegro ... ... ... ... ... ... ... ... ... ... ... ...<br />
Netherl<strong>and</strong>s 5.6 z 12.1 z 5,798 z 12.4 z 8,242 **, z 17.6 **, z 11,403 **, z 24.4 **, z 15,676 y 33.3 y ... ...<br />
Norway 7.4 y 17.5 y 13,111 y 19.9 y 12,697 y 19.3 y 16,769 x 25.8 x 27,058 x 41.6 x ... 79.8 x<br />
Pol<strong>and</strong> 4.8 y 11.3 y 4,262 y 18.1 y 6,021 y 25.5 y 5,620 y 23.8 y 5,036 y 21.3 y ... ...<br />
Portugal 5.1 x 10.2 x 4,180 x 14.5 x 5,994 x 20.8 x 9,399 x 32.6 x 7,758 x 26.9 x ... 80.0 x<br />
Republic of Moldova 7.5 18.8 2,118 43.1 2,143 43.6 1,901 38.7 1,794 y 41.8 y 0.4 34.1<br />
Romania 2.9 y 8.4 y 1,962 z 10.2 z 2,145 y 11.6 y 2,573 z 13.4 z 4,433 z 23.1 z ... 76.4 z<br />
Russian Federation 4.2 y 11.1 y ... ... ... ... ... ... 3,902 y 15.8 y ... ...<br />
San Marino 2.4 x 10.6 x ... 15.2 x ... 17.0 x ... 12.0 x ... 9.2 x ... ...<br />
Serbia 4.4 y 9.6 y 299 x 2.4 x 6,471 x 51.0 x 1,658 x 13.1 x 5,061 y 40.1 y ... ...<br />
Slovakia 4.1 z 10.0 z 4,125 z 15.5 z 5,493 z 20.7 z 5,240 z 19.7 z 6,673 z 25.1 z ... 52.4 z<br />
Slovenia 5.7 y 12.6 y 7,044 y 24.3 y 8,695 y 30.0 y 9,206 x 30.8 x 6,901 y 23.8 y ... ...<br />
Spain 4.3 z 9.6 z 4,988 z 15.3 z 5,810 z 17.9 z 7,309 z 22.5 z 7,437 z 22.9 z ... 68.7 z<br />
Sweden 7.7 z 15.2 z 12,865 z 28.9 z 10,081 z 22.6 z 10,987 z 24.6 z 19,186 z 43.0 z ... 52.6 z<br />
Switzerl<strong>and</strong> 5.1 y 16.1 y 5,460 y 9.7 y 13,866 y 24.5 y 14,750 y 26.1 y 22,304 y 39.4 y ... 66.0 y<br />
TFYR Macedonia ... ... ... ... ... ... ... ... ... ... ... ...<br />
Ukraine 6.7 z 13.9 z 3,013 y 35.1 y 2,787 z 32.3 z 2,623 z 30.4 z 3,777 z 43.9 z ... ...<br />
United Kingdom 5.7 z 13.0 z 5,858 z 15.6 z 8,779 z 23.3 z 8,416 z 22.4 z 13,677 z 36.4 z ... 68.8 z<br />
473
1 ANNEX<br />
TABLE 14<br />
(Continued)<br />
Government<br />
expenditure<br />
on education<br />
as % of GDP<br />
Expenditure<br />
on education<br />
as % of total<br />
government<br />
expenditure<br />
Government<br />
expenditure<br />
on preprimary<br />
education<br />
per pupil<br />
in constant<br />
2013 PPP$<br />
Government<br />
expenditure<br />
on preprimary<br />
education<br />
per pupil as<br />
% of GDP per<br />
capita<br />
Government<br />
expenditure<br />
on primary<br />
education<br />
per pupil<br />
in constant<br />
2013 PPP$<br />
Government<br />
expenditure<br />
on primary<br />
education<br />
per pupil as<br />
% of GDP per<br />
capita<br />
Government<br />
expenditure<br />
on secondary<br />
education<br />
per student<br />
in constant<br />
2013 PPP$<br />
Government<br />
expenditure<br />
on secondary<br />
education<br />
per student<br />
as % of GDP<br />
per capita<br />
Government<br />
expenditure<br />
on tertiary<br />
education<br />
per student<br />
in constant<br />
2013 PPP$<br />
Government<br />
expenditure<br />
on tertiary<br />
education<br />
per student<br />
as % of GDP<br />
per capita<br />
Primary<br />
education<br />
expenditure<br />
on textbooks<br />
<strong>and</strong> teaching<br />
materials<br />
as % of<br />
current<br />
expenditure<br />
on primary<br />
education<br />
in public<br />
institutions<br />
Primary<br />
education<br />
teaching staff<br />
compensation<br />
as % of<br />
current<br />
expenditure<br />
on primary<br />
education<br />
in public<br />
institutions<br />
Country or territory<br />
2014 2014 2014 2014 2014 2014 2014 2014 2014 2014 2014 2014<br />
United States 5.2 x 13.1 x 5,902 y 11.6 y 10,421 y 20.6 y 11,561 y 22.8 y 10,092 x 20.1 x ... 54.6 y<br />
Latin America <strong>and</strong> the Caribbean<br />
Anguilla ... ... ... ... ... ... ... ... ... ... ... ...<br />
Antigua <strong>and</strong> Barbuda ... ... ... ... ... ... 2,022 x 9.8 x ... ... ... ...<br />
Argentina 5.3 z 15.1 z ... 11.9 z ... 14.2 z ... 21.4 z ... 16.6 z ... 71.3 z<br />
Aruba 6.0 x 21.8 x ... ... ... ... ... ... ... ... ... ...<br />
Bahamas ... ... ... ... ... ... ... ... ... ... ... ...<br />
Barbados 6.7 14.2 ... ... ... ... 3,230 20.7 ... ... . z ...<br />
Belize 6.2 z 22.9 z 330 z 4.1 z 1,295 z 15.9 z 1,762 z 21.7 z 2,723 z 33.5 z ... ...<br />
Bermuda 1.8 7.8 11,345 22.0 4,364 8.5 6,474 12.6 9,837 19.1 ... ...<br />
Bolivia, P.S. 7.3 16.9 608 z 9.7 z 1,070 z 17.0 z 1,226 z 19.5 z ... ... ... 90.3<br />
Brazil 5.9 y 15.6 y 3,927 y 25.4 y 3,311 y 21.4 y 3,566 y 23.1 y 4,179 y 27.1 y ... 72.0 x<br />
British Virgin Isl<strong>and</strong>s ... ... ... ... ... ... ... ... ... ... ... ...<br />
Cayman Isl<strong>and</strong>s ... ... ... ... ... ... ... ... ... ... ... ...<br />
Chile 4.6 z 19.1 z 4,658 z 21.2 z 3,490 z 15.9 z 3,320 z 15.1 z 3,839 z 17.5 z ... ...<br />
Colombia 4.7 15.9 1,138 x 9.6 x 2,303 17.5 2,282 17.3 2,853 21.7 4.2 83.7<br />
Costa Rica 7.0 23.1 2,595 17.7 3,744 25.5 3,564 24.2 4,906 33.4 ... 72.9<br />
Cuba ... ... ... ... ... ... ... ... ... ... ... ...<br />
Curaçao 4.9 z ... ... ... ... 10.0 z ... 23.0 z ... 18.2 z 6.0 z 81.0 z<br />
Dominica ... ... 262 y 2.5 y 1,409 y 13.6 y ... ... ... ... ... 100.0 y<br />
Dominican Republic ... ... 1,266 9.7 2,041 15.6 1,886 14.4 ... ... 1.9 56.1<br />
Ecuador 4.2 y 10.3 y 1,702 15.2 1,604 14.3 703 6.3 3,116 y 29.2 y 10.3 81.0<br />
El Salvador 3.4 x 15.9 x 549 x 7.0 x ... ... ... ... 849 x 10.8 x ... ...<br />
Grenada ... ... ... ... ... ... ... ... ... ... ... ...<br />
Guatemala 2.8 z 20.6 z 666 z 9.3 z 677 z 9.4 z 396 z 5.5 z 1,343 z 18.7 z 3.9 ...<br />
Guyana 3.2 y 10.3 y 659 y 10.1 y 514 y 7.8 y 615 y 9.4 y 908 y 13.8 y ... 84.6 y<br />
Haiti ... ... ... ... ... ... ... ... ... ... ... ...<br />
Honduras 5.9 z 19.2 z 672 z 14.1 z 910 z 19.1 z 864 z 18.1 z 2,042 42.2 . z 81.2 z<br />
Jamaica 6.0 21.8 343 4.0 1,920 22.4 1,972 23.0 3,432 z 40.1 z 1.8 78.1<br />
Mexico 5.2 x 19.0 x 2,179 x 13.8 x 2,322 x 14.7 x 2,530 x 16.1 x 5,938 x 37.7 x ... 86.4 x<br />
Montserrat ... ... ... ... ... ... ... ... ... ... ... ...<br />
Nicaragua ... ... ... ... ... ... ... ... ... ... ... ...<br />
Panama 3.3 x 13.0 x 684 x 4.0 x 1,104 x 6.5 x 1,623 x 9.5 x 3,665 y 19.8 y ... ...<br />
Paraguay 5.0 y 19.6 y 968 y 12.8 y 1,092 y 14.4 y 1,251 y 16.6 y ... ... 2.8 y 64.5 y<br />
Peru 3.7 16.2 1,433 12.1 1,475 12.5 1,542 13.0 ... ... 0.7 52.5<br />
Saint Kitts <strong>and</strong> Nevis ... ... ... ... ... ... ... ... ... ... 1.6 z 67.0 z<br />
Saint Lucia 4.8 15.3 349 y 3.3 y 1,897 18.1 2,743 26.2 1,559 **, x 14.5 **, x ... 72.9<br />
Saint Martin ... ... ... ... ... ... ... ... ... ... ... ...<br />
St. Vincent <strong>and</strong> the Grenadines ... ... 450 4.3 1,934 18.3 2,323 22.0 ... ... 1.1 y 92.2 y<br />
Sint Maarten ... ... ... ... ... ... ... ... ... ... ... ...<br />
Suriname ... ... ... ... ... ... ... ... ... ... ... ...<br />
Trinidad <strong>and</strong> Tobago ... ... ... ... ... ... ... ... ... ... ... ...<br />
Turks <strong>and</strong> Caicos Isl<strong>and</strong>s 3.3 +1 ... ... ... ... ... ... ... ... ... ... ...<br />
Uruguay 4.4 x 14.9 x ... ... ... ... ... ... ... ... ... ...<br />
Venezuela, B.R. ... ... ... ... ... ... ... ... ... ... ... ...<br />
Northern Africa <strong>and</strong> Western Asia<br />
Algeria ... ... ... ... ... ... ... ... ... ... ... 94.5 z<br />
Bahrain 2.6 y 8.9 y - x - x ... ... ... ... ... ... 2.0 92.0<br />
Egypt ... ... ... ... ... ... ... ... ... ... ... ...<br />
Iraq ... ... ... ... ... ... ... ... ... ... ... ...<br />
Israel 5.9 z 14.3 z 3,901 z 11.9 z 7,239 z 22.1 z 5,282 z 16.2 z 6,535 z 20.0 z ... ...<br />
Jordan ... ... 193 x 1.7 x 1,428 x 12.2 x 1,757 x 15.1 x ... ... ... 93.7 x<br />
Kuwait ... ... 16,026 x 21.4 x 13,370 x 17.8 x 16,690 **, x 22.2 **, x ... ... 5.0 x 73.9 x<br />
Lebanon 2.6 z 8.6 z ... ... ... ... 877 z 5.1 z 2,670 z 15.6 z ... ...<br />
Libya ... ... ... ... ... ... ... ... ... ... ... ...<br />
Morocco ... ... - z - z 1,411 z 19.3 z 2,558 y 36.1 y ... ... ... ...<br />
Oman 5.0 z 11.1 z - x - x 6,770 x 15.4 x 8,617 z 21.5 z ... ... 1.4 x 61.7 x<br />
Palestine ... ... ... ... ... ... ... ... ... ... ... ...<br />
Qatar 3.5 11.1 ... ... ... ... ... ... ... ... ... ...<br />
Saudi Arabia ... ... ... ... ... ... ... ... ... ... ... ...<br />
Sudan ... ... ... ... ... ... ... ... ... ... ... ...<br />
Syrian Arab Republic ... ... - y - y ... 18.3 y ... 15.4 y ... ... ... ...<br />
Tunisia 6.2 y 21.6 y ... ... ... ... ... ... 6,053 53.7 ... ...<br />
Turkey ... ... ... ... ... ... ... ... ... ... ... 89.3 x<br />
United Arab Emirates ... ... 6,868 y 11.1 y 6,456 y 10.4 y 11,024 y 17.8 y ... ... 0.6 z 62.2 z<br />
Yemen ... ... 1,483 x 39.7 x 723 x 19.4 x 471 x 12.6 x ... ... 3.4 z 93.0 z<br />
The Pacific<br />
Australia 5.3 z 14.0 z 4,318 z 10.0 z 8,142 z 18.8 z 7,321 z 16.9 z 9,851 z 22.7 z ... 63.5 z<br />
Cook Isl<strong>and</strong>s 3.9 ... ... 9.7 z ... 9.9 z ... 10.2 z . x 5.8 ... ...<br />
Fiji 3.9 z 14.0 z ... ... 1,024 z 12.5 z 442 x 5.7 x ... ... ... ...<br />
Kiribati ... ... ... ... ... ... ... ... ... ... ... ...<br />
Marshall Isl<strong>and</strong>s ... ... ... ... ... ... ... ... ... ... ... ...<br />
474
STATISTICAL TABLES<br />
1<br />
TABLE 14<br />
(Continued)<br />
Government<br />
expenditure<br />
on education<br />
as % of GDP<br />
Expenditure<br />
on education<br />
as % of total<br />
government<br />
expenditure<br />
Government<br />
expenditure<br />
on preprimary<br />
education<br />
per pupil<br />
in constant<br />
2013 PPP$<br />
Government<br />
expenditure<br />
on preprimary<br />
education<br />
per pupil as<br />
% of GDP per<br />
capita<br />
Government<br />
expenditure<br />
on primary<br />
education<br />
per pupil<br />
in constant<br />
2013 PPP$<br />
Government<br />
expenditure<br />
on primary<br />
education<br />
per pupil as<br />
% of GDP per<br />
capita<br />
Government<br />
expenditure<br />
on secondary<br />
education<br />
per student<br />
in constant<br />
2013 PPP$<br />
Government<br />
expenditure<br />
on secondary<br />
education<br />
per student<br />
as % of GDP<br />
per capita<br />
Government<br />
expenditure<br />
on tertiary<br />
education<br />
per student<br />
in constant<br />
2013 PPP$<br />
Government<br />
expenditure<br />
on tertiary<br />
education<br />
per student<br />
as % of GDP<br />
per capita<br />
Primary<br />
education<br />
expenditure<br />
on textbooks<br />
<strong>and</strong> teaching<br />
materials<br />
as % of<br />
current<br />
expenditure<br />
on primary<br />
education<br />
in public<br />
institutions<br />
Primary<br />
education<br />
teaching staff<br />
compensation<br />
as % of<br />
current<br />
expenditure<br />
on primary<br />
education<br />
in public<br />
institutions<br />
Country or territory<br />
2014 2014 2014 2014 2014 2014 2014 2014 2014 2014 2014 2014<br />
Micronesia F.S. ... ... ... ... ... ... ... ... ... ... ... ...<br />
Nauru ... ... ... ... ... ... ... ... ... ... ... ...<br />
New Zeal<strong>and</strong> 6.4 17.8 5,700 17.0 6,120 18.3 7,467 22.3 9,167 27.4 ... ...<br />
Niue ... ... ... ... ... ... ... ... ... ... ... ...<br />
Palau ... ... ... ... ... ... ... ... ... ... ... ...<br />
Papua New Guinea ... ... ... ... ... ... ... ... ... ... ... ...<br />
Samoa ... ... ... ... ... ... ... ... ... ... ... ...<br />
Solomon Isl<strong>and</strong>s ... ... ... ... ... ... ... ... ... ... ... ...<br />
Tokelau ... ... ... ... ... ... ... ... ... ... ... ...<br />
Tonga ... ... ... ... ... ... ... ... ... ... ... ...<br />
Tuvalu ... ... ... ... ... ... ... ... ... ... ... ...<br />
Vanuatu 4.9 21.8 ... ... ... ... ... ... ... ... ... ...<br />
Southern Asia<br />
Afghanistan 4.8 ** 18.4 ** ... ... ... ... ... ... ... ... ... ...<br />
Bangladesh 2.0 **,z 13.8 **,z - x - x ... ... 304 x 12.2 x 437 x 17.5 x ... ...<br />
Bhutan 5.9 17.8 - x - x 996 13.7 2,631 36.1 3,930 53.9 ... ...<br />
India 3.8 y 14.1 y 453 y 9.5 y 443 y 9.3 y 740 y 15.5 y 2,563 y 53.7 y ... ...<br />
Iran, Islamic Republic of 3.0 19.7 137 0.8 1,337 8.2 2,534 15.5 2,247 13.8 ... ...<br />
Maldives 5.2 y 15.3 y ... ... ... ... ... ... ... ... ... ...<br />
Nepal 4.7 22.1 76 3.4 334 15.1 324 ** 14.6 ** 723 32.6 ... ...<br />
Pakistan 2.5 11.3 ... ... 368 8.1 602 13.2 2,353 51.6 ... ...<br />
Sri Lanka 1.6 z 9.8 z - y - y 459 z 4.3 z 665 z 6.3 z 2,504 z 23.6 z ... 85.5 y<br />
Sub-Saharan Africa<br />
Angola ... ... ... ... ... ... ... ... ... ... ... ...<br />
Benin 4.4 22.2 306 15.3 213 10.7 272 13.6 1,316 z 68.2 z 1.2 70.8<br />
Botswana ... ... ... ... ... ... ... ... ... ... ... ...<br />
Burkina Faso 4.5 19.4 6 0.4 319 20.0 254 15.9 3,576 z 226.3 z 6.7 44.7<br />
Burundi 5.4 z 17.2 z 2 z 0.3 z 96 z 12.8 z 232 z 31.0 z 2,293 z 306.0 z 0.6 x 87.4 x<br />
Cabo Verde 5.0 z 15.0 z 51 z 0.8 z 917 z 14.5 z 1,046 z 16.5 z 1,959 z 30.9 z 0.4 z 95.5 z<br />
Cameroon 3.0 z 13.8 z 159 y 5.8 y 166 y 6.0 y 543 y 19.7 y 1,076 x 39.8 x 2.0 x 81.9 z<br />
Central African Republic 1.2 x 7.8 x ... ... ... ... ... ... 1,056 x 114.3 x ... ...<br />
Chad 2.9 z 12.5 z 77 x 4.0 x 113 x 5.9 x 409 x 21.3 x 3,573 x 185.7 x ... 71.0 x<br />
Comoros 5.1 y 18.5 y ... ... 245 x 17.6 x ... ... 702 y 50.1 y ... ...<br />
Congo ... ... ... ... ... ... ... ... 4,971 z 83.7 z ... ...<br />
Côte d’Ivoire 4.7 20.7 701 21.8 413 12.9 880 27.4 4,000 124.5 4.7 68.7<br />
Democratic Rep. of the Congo 2.2 z 16.8 z 41 z 5.9 z 55 z 8.0 z 41 z 5.9 z 562 z 80.7 z ... ...<br />
Djibouti ... ... ... ... ... ... ... ... ... ... 1.1 ...<br />
Equatorial Guinea ... ... ... ... ... ... ... ... ... ... ... ...<br />
Eritrea ... ... ... ... ... ... ... ... ... ... ... ...<br />
Ethiopia 4.5 z 27.0 z 15 y 1.2 y 100 y 8.4 y 317 y 26.7 y 4,008 y 337.9 y 1.3 z ...<br />
Gabon ... ... ... ... ... ... ... ... ... ... ... ...<br />
Gambia 2.8 z 10.3 z - z - z 172 z 10.5 z ... ... 1,765 y 108.8 y ... 89.2 z<br />
Ghana 6.0 z 21.7 z 257 z 6.5 z 382 z 9.6 z 1,286 z 32.5 z 3,496 z 88.3 z ... 80.0 z<br />
Guinea 3.5 z 14.1 z - x - x 126 z 10.2 z 124 y 10.0 y 1,649 z 133.9 z ... 59.4 z<br />
Guinea-Bissau 2.4 z 16.2 z ... ... ... ... ... ... ... ... 1.4 y 89.1 z<br />
Kenya ... ... ... ... ... ... ... ... ... ... ... ...<br />
Lesotho ... ... ... ... ... ... ... ... ... ... ... ...<br />
Liberia 2.8 y 8.1 y ... ... ... ... ... ... 603 **, y 80.9 **,y ... ...<br />
Madagascar 2.1 z 14.0 z ... ... 93 y 6.6 y 119 y 8.4 y 1,457 y 102.6 y ... 71.0 z<br />
Malawi 6.9 16.3 - - 105 13.4 232 29.8 13,164 x 1,725.5 x 1.0 ...<br />
Mali 4.3 18.2 30 1.9 232 14.7 416 26.4 2,163 y 141.1 y 4.0 75.6<br />
Mauritania 3.3 z 11.4 z - z - z 358 z 9.6 z 642 z 17.3 z 2,835 z 76.3 z ... ...<br />
Mauritius 5.0 20.9 440 z 2.5 z 2,476 13.5 5,334 29.1 2,009 11.0 2.1 ...<br />
Mozambique 6.5 z 19.0 z ... ... 163 z 15.3 z 739 z 69.2 z 1,957 z 183.3 z 19.1 z 65.6 z<br />
Namibia ... ... ... ... ... ... ... ... ... ... ... ...<br />
Niger 6.8 21.7 380 41.1 274 29.7 677 73.2 5,535 y 617.7 y 7.5 81.6 z<br />
Nigeria ... ... ... ... ... ... ... ... ... ... ... ...<br />
Rw<strong>and</strong>a 5.0 z 16.6 z 9 z 0.6 z 103 z 6.8 z 589 z 39.0 z 1,493 z 98.9 z ... ...<br />
Sao Tome <strong>and</strong> Principe 3.9 12.3 386 12.3 366 11.7 264 8.4 1,292 41.3 ... ...<br />
Senegal ... ... ... ... ... ... ... ... ... ... ... ...<br />
Seychelles 3.6 x 10.4 x ... ... 2,025 x 8.7 x 1,572 **, x 6.7 **, x 126,427 x 542.5 x 1.5 x 68.7 x<br />
Sierra Leone 2.8 15.1 - - 106 z 5.6 z 150 z 7.9 z ... ... ... 87.8 x<br />
Somalia ... ... ... ... ... ... ... ... ... ... ... ...<br />
South Africa 6.1 19.1 761 6.0 2,242 17.7 2,532 20.0 4,802 37.9 1.8 76.9<br />
South Sudan 0.8 x 3.9 x ... 0.4 x ... 3.6 x ... ... ... ... ... ...<br />
Swazil<strong>and</strong> 8.6 x 22.4 x 62 x 0.8 x 1,617 x 20.8 x 3,321 x 42.7 x ... ... ... ...<br />
Togo 4.8 19.4 72 5.1 202 14.4 203 x 15.6 x 1,581 112.2 0.3 85.5<br />
Ug<strong>and</strong>a 2.2 z 11.8 z - z - z 104 y 6.2 y 318 y 19.0 y 1,280 y 76.3 y 3.0 z ...<br />
United Republic of Tanzania 3.5 17.3 ... ... ... ... ... ... ... ... ... ...<br />
Zambia ... ... ... ... ... ... ... ... ... ... ... ...<br />
Zimbabwe ... ... ... ... ... ... ... ... ... ... ... ...<br />
475
1 ANNEX<br />
TABLE 14<br />
(Continued)<br />
Government<br />
expenditure<br />
on education<br />
as % of GDP<br />
Expenditure<br />
on education<br />
as % of total<br />
government<br />
expenditure<br />
Government<br />
expenditure<br />
on preprimary<br />
education<br />
per pupil<br />
in constant<br />
2013 PPP$<br />
Government<br />
expenditure<br />
on preprimary<br />
education<br />
per pupil as<br />
% of GDP per<br />
capita<br />
Government<br />
expenditure<br />
on primary<br />
education<br />
per pupil<br />
in constant<br />
2013 PPP$<br />
Government<br />
expenditure<br />
on primary<br />
education<br />
per pupil as<br />
% of GDP per<br />
capita<br />
Government<br />
expenditure<br />
on secondary<br />
education<br />
per student<br />
in constant<br />
2013 PPP$<br />
Government<br />
expenditure<br />
on secondary<br />
education<br />
per student<br />
as % of GDP<br />
per capita<br />
Government<br />
expenditure<br />
on tertiary<br />
education<br />
per student<br />
in constant<br />
2013 PPP$<br />
Government<br />
expenditure<br />
on tertiary<br />
education<br />
per student<br />
as % of GDP<br />
per capita<br />
Primary<br />
education<br />
expenditure<br />
on textbooks<br />
<strong>and</strong> teaching<br />
materials<br />
as % of<br />
current<br />
expenditure<br />
on primary<br />
education<br />
in public<br />
institutions<br />
Primary<br />
education<br />
teaching staff<br />
compensation<br />
as % of<br />
current<br />
expenditure<br />
on primary<br />
education<br />
in public<br />
institutions<br />
Country or territory<br />
2014 2014 2014 2014 2014 2014 2014 2014 2014 2014 2014 2014<br />
World 2 4.6 14.2 1,038 10.1 1,979 16.8 2,546 19.7 3,721 29.7 ... ...<br />
Countries in transition 4.1 12.3 1,531 24.3 … … … … 2,017 17.3 … …<br />
Developed countries 5.1 12.1 5,665 15.7 7,723 20.6 8,232 22.8 9,167 25.1 … 64.4<br />
Developing countries 4.4 16.2 … … … 14.2 … … … … … …<br />
Caucasus <strong>and</strong> Central Asia 2.8 12.9 1,088 15.9 … … … … 918 17.3 … …<br />
Eastern <strong>and</strong> South-eastern<br />
Asia<br />
3.9 15.4 812 5.9 2,502 19.9 7,609 19.3 8,977 22.4 … …<br />
Eastern Asia 3.8 13.2 2,266 6.7 7,908 19.8 9,650 21.5 8,977 18.9 … …<br />
South-eastern Asia 4.1 17.5 227 4.4 1,240 19.9 ... ... 2,778 22.4 … …<br />
Europe <strong>and</strong> Northern America 5.0 12.1 5,460 16.5 7,543 20.8 8,232 23.2 7,195 25.4 … 64.5<br />
Latin America <strong>and</strong> the<br />
Caribbean<br />
4.9 16.1 … 9.9 ... 15.2 1,972 17.3 ... ... ...<br />
Caribbean ... ... ... ... ... ... ... ... ... ... ... ...<br />
Latin America 4.7 16.2 968 12.0 1,385 14.7 1,582 16.6 2,985 21.7 … 81.0<br />
Northern Africa <strong>and</strong> Western<br />
Asia<br />
... ... ... ... ... ... ... ... ... ... ... ...<br />
Northern Africa ... ... ... ... ... ... ... ... ... ... ... ...<br />
Western Asia ... ... 838 6.4 ... 17.8 5,282 15.8 ... ... ... 89.3<br />
Pacific ... ... ... ... ... ... ... ... ... ... ... ...<br />
Southern Asia 3.8 15.3 38 0.4 451 8.7 665 14.6 2,353 32.6 … …<br />
Sub-Saharan Africa 4.3 16.6 46 1.2 208 10.7 412 19.8 1,959 102.6 … …<br />
Conflict-affected countries 3.8 16.6 … 1.6 351 10.8 537 15.5 2.353 53.7 … …<br />
Countries with low income 3.9 16.7 15 0.9 144 10.5 272 19.0 1.615 113.3 … …<br />
Countries with middle income 4.5 15.7 663 9.4 … … … … … … … …<br />
Lower middle 4.1 15.6 453 9.3 … 12.9 … 17.3 … … … …<br />
Upper middle 4.6 15.7 … … … … … … … … … …<br />
Countries with high income 4.9 11.9 5,409 15.3 7,812 19.1 8,368 22.2 9,614 24.0 … …<br />
Source: UIS database.<br />
Note: The country groupings by level of income are as defined by the World Bank but include countries listed in the table<br />
only. They are based on the list of countries by income group as revised in July 2015.<br />
1. World Bank WDI database, December 2015 release.<br />
2. All regional values shown are medians.<br />
Data in bold are for the school year ending in 2015.<br />
(z) Data are for the school year ending in 2013.<br />
(y) Data are for the school year ending in 2012.<br />
(x) Data are for the school year ending in 2011.<br />
(*) National estimate.<br />
(**) UIS partial estimate.<br />
(-) Magnitude nil or negligible<br />
(…) No data available.<br />
476
477
Somali students<br />
walk to attend<br />
classes at Shabelle<br />
Boarding School in<br />
Mogadishu.<br />
CREDIT: Kate Holt/GEM Report<br />
478<br />
ANNEX | AID TABLES
5<br />
Aid tables<br />
INTRODUCTION 1<br />
The data on aid used in this Report are derived<br />
from the Organisation for Economic Co-operation<br />
<strong>and</strong> Development (OECD) International Development<br />
Statistics (IDS) databases, which record information<br />
provided annually by all member countries of the OECD<br />
Development Assistance Committee (DAC), as well<br />
as a growing number of donors that are not members<br />
of the committee. In this Report, total figures for net<br />
official development assistance (ODA) comes from<br />
the DAC database while those for gross ODA, sectorallocable<br />
aid <strong>and</strong> aid to education come from the<br />
Creditor Reporter System (CRS). Both are available at<br />
www.oecd.org/dac/stats/idsonline.<br />
ODA is public funds provided to developing countries to<br />
promote their economic <strong>and</strong> social development. It is<br />
concessional; that is, it takes the form of either a grant<br />
or a loan carrying a lower rate of interest than is available<br />
on the market <strong>and</strong>, usually, a longer repayment period.<br />
A more extensive version of the aid tables including<br />
ODA per recipient is available on the Report’s website,<br />
www.unesco.org/gemreport.<br />
AID RECIPIENTS AND DONORS<br />
Developing countries are those in Part 1 of the DAC List<br />
of Aid Recipients: all low <strong>and</strong> middle income countries<br />
except twelve Central <strong>and</strong> Eastern European countries<br />
<strong>and</strong> a few more advanced developing countries.<br />
Bilateral donors are countries that provide development<br />
assistance directly to recipient countries. Most are<br />
members of the DAC, a forum of major bilateral donors<br />
established to promote aid <strong>and</strong> its effectiveness. Bilateral<br />
donors also contribute substantially to the financing of<br />
multilateral donors through contributions recorded as<br />
multilateral ODA.<br />
Multilateral donors are international institutions with<br />
government membership that conduct all or a significant<br />
part of their activities in favour of developing countries.<br />
They include multilateral development banks (e.g. the<br />
World Bank <strong>and</strong> Inter-American Development Bank),<br />
United Nations agencies <strong>and</strong> regional groupings (e.g.<br />
the European Commission). The development banks also<br />
make non-concessional loans to several middle <strong>and</strong> higher<br />
income countries; these are not counted as part of ODA.<br />
TYPES OF AID<br />
Total ODA: bilateral <strong>and</strong> multilateral aid for all sectors, as<br />
well as aid that is not allocable by sector, such as general<br />
budget support <strong>and</strong> debt relief. In Table 1, total ODA<br />
from bilateral donors is bilateral aid only, while aid as a<br />
percentage of gross national income (GNI) is bilateral <strong>and</strong><br />
multilateral ODA.<br />
Sector-allocable ODA: aid allocated to a specific sector,<br />
such as education or health. It does not include aid<br />
for general development purposes (e.g. general budget<br />
support), balance-of-payments support, debt relief or<br />
emergency assistance.<br />
Debt relief: includes debt forgiveness, i.e. the extinction<br />
of a loan by agreement between the creditor (donor) <strong>and</strong><br />
debtor (aid recipient), <strong>and</strong> other action on debt, including<br />
debt swaps, buy-backs <strong>and</strong> refinancing. In the DAC<br />
database, debt forgiveness is reported as a grant <strong>and</strong><br />
therefore counts as ODA.<br />
2016 • GLOBAL EDUCATION MONITORING REPORT 479
5<br />
Country programmable aid: defined by subtracting from<br />
total gross ODA aid that:<br />
■■<br />
is unpredictable by nature (humanitarian aid <strong>and</strong><br />
debt relief);<br />
■■<br />
entails no cross-border flows (administrative<br />
costs, imputed student costs, <strong>and</strong> costs related to<br />
promotion of development awareness, research in<br />
donor countries);<br />
■■<br />
is not part of cooperation agreements between<br />
governments (food aid <strong>and</strong> aid from local<br />
governments);<br />
■■<br />
is not country programmable by donor (core funding<br />
of non-governmental organization).<br />
Country programmable aid is not included in the aid<br />
tables, but is used in a few places in the Report.<br />
EDUCATION AID<br />
Direct aid to education: aid to education reported in the<br />
CRS database as direct allocations to the education<br />
sector. It is the total of direct aid, as defined by the<br />
DAC, to:<br />
■■<br />
basic education, defined by the DAC as covering<br />
primary education, basic life skills for youth <strong>and</strong><br />
adults, <strong>and</strong> early childhood education;<br />
■■<br />
secondary education, both general secondary<br />
education <strong>and</strong> vocational training;<br />
■■<br />
post-secondary education, including advanced<br />
technical <strong>and</strong> managerial training;<br />
■■<br />
education, ‘level unspecified’, which refers to any<br />
activity that cannot be attributed solely to the<br />
development of a particular level of education, such<br />
as education research <strong>and</strong> teacher training. General<br />
education programme support is often reported<br />
within this subcategory.<br />
Total aid to basic education: direct aid to basic education,<br />
plus 10% of general budget support, plus 50% of<br />
education, ‘level unspecified’.<br />
Commitments <strong>and</strong> disbursements: A commitment is a firm<br />
obligation by a donor, expressed in writing <strong>and</strong> backed<br />
by necessary funds to provide specified assistance to a<br />
country or a multilateral organization. Disbursements<br />
record the actual international transfer of financial<br />
resources or of goods <strong>and</strong> services. Starting with the<br />
2011 Report, disbursement figures are used in the text<br />
<strong>and</strong> tables, while in previous years commitments were<br />
reported. As the aid committed in a given year can<br />
be disbursed later, sometimes over several years, the<br />
annual aid figures based on commitments cannot be<br />
directly compared to disbursements. Reliable figures on<br />
aid disbursements have only been available since 2002,<br />
which consequently is used as the base year.<br />
Current <strong>and</strong> constant prices: Aid figures in the DAC<br />
databases are expressed in US dollars. When comparing<br />
aid figures between years, adjustment is required to<br />
compensate for inflation <strong>and</strong> changes in exchange<br />
rates. Such adjustments result in aid being expressed in<br />
constant dollars, i.e. in dollars fixed at the value they held<br />
in a given reference year, including their external value in<br />
terms of other currencies. This Report presents most aid<br />
data in constant 2014 US dollars.<br />
Source: OECD-DAC, 2016.<br />
ENDNOTES<br />
1. A full set of statistics <strong>and</strong> indicators related to the introduction is<br />
posted in Excel format on the Global Education Monitoring Report website<br />
at www.unesco.org/gemreport.<br />
Total aid to education: direct aid to education plus 20% of<br />
general budget support (aid provided to governments<br />
without being earmarked for specific projects or sectors)<br />
to represent the estimated 15% to 25% of budget support<br />
that typically benefits the education sector.<br />
480<br />
ANNEX | AID TABLES
TABLE 1<br />
Bilateral <strong>and</strong> multilateral ODA<br />
TOTAL ODA<br />
SECTOR-ALLOCABLE ODA<br />
DEBT RELIEF AND OTHER ACTIONS<br />
RELATING TO DEBT<br />
CONSTANT 2014 US$ MILLIONS ODA AS % OF GNI<br />
CONSTANT 2014 US$ MILLIONS CONSTANT 2014 US$ MILLIONS<br />
2002–2003<br />
annual average 2013 2014 2015*<br />
2002–2003<br />
annual average 2013 2014 2015*<br />
2002–2003<br />
annual average 2013 2014<br />
2002–2003<br />
annual average 2013 2014<br />
Australia 1,887 3,889 3,498 3,216 0.25 0.33 0.31 0.27 1,294 2,999 2,916 12 10 7<br />
Austria 481 552 637 789 0.23 0.27 0.28 0.32 224 344 327 29 46 109<br />
Belgium 1,662 1,316 1,321 1,338 0.52 0.45 0.46 0.42 739 865 913 740 18 10<br />
Canada 2,498 3,334 3,278 3,454 0.26 0.27 0.24 0.28 1,066 2,191 2,091 6 ... ...<br />
Czech Republic** 94 55 63 83 0.09 0.11 0.11 0.12 ... 35 37 ... ... ...<br />
Denmark 1,687 2,150 2,131 2,217 0.90 0.85 0.86 0.85 276 1,311 1,264 0 53 0<br />
Finl<strong>and</strong> 438 835 938 826 0.35 0.54 0.59 0.56 299 526 621 0 ... ...<br />
France 6,581 6,836 6,514 6,327 0.39 0.41 0.37 0.37 3,037 5,759 6,272 3,482 1,172 108<br />
Germany 5,438 9,616 11,589 16,324 0.28 0.38 0.42 0.52 4,108 9,538 11,367 1,877 623 1,110<br />
Greece 246 42 46 139 0.21 0.10 0.11 0.14 213 14 16 ... ... ...<br />
Icel<strong>and</strong>** 11 32 31 33 0.16 0.25 0.22 0.24 ... 27 24 ... ... ...<br />
Irel<strong>and</strong> 411 546 519 497 0.40 0.46 0.38 0.36 291 340 327 ... 0 0<br />
Italy 1,627 874 1,371 1,958 0.18 0.17 0.19 0.21 212 383 432 959 39 28<br />
Japan 6,630 8,071 6,012 7,024 0.22 0.23 0.19 0.22 3,348 10,454 10,341 622 3,768 ...<br />
Kuwait** 91 186 229 ... ... ... ... ... ... 490 525 ... ... ...<br />
Luxembourg 241 301 300 288 0.82 1.00 1.06 0.93 ... 200 207 ... ... ...<br />
Netherl<strong>and</strong>s 3,989 3,673 4,027 5,069 0.80 0.67 0.64 0.76 1,755 2,933 2,588 473 62 63<br />
New Zeal<strong>and</strong> 230 362 409 419 0.22 0.26 0.27 0.27 150 258 298 ... ... ...<br />
Norway 2,558 4,045 3,889 4,273 0.90 1.07 1.00 1.05 1,282 3,043 2,765 14 22 18<br />
Pol<strong>and</strong>** 23 128 82 117 0.02 0.10 0.09 0.10 ... 69 96 ... ... ...<br />
Portugal 289 305 246 168 0.25 0.23 0.19 0.16 252 185 206 ... 9 12<br />
Republic of Korea 323 1,369 1,396 1,534 0.06 0.13 0.13 0.14 ... 1,299 1,286 ... ... ...<br />
Slovak Republic** 13 16 16 21 0.03 0.09 0.09 0.10 ... 12 9 ... ... ...<br />
Slovenia** ... 21 20 28 ... 0.13 0.12 0.15 ... 13 13 ... ... ...<br />
Spain 1,681 941 464 681 0.25 0.17 0.13 0.13 983 643 432 173 243 ...<br />
Sweden 2,335 3,777 4,343 5,799 0.82 1.01 1.09 1.40 1,104 2,268 2,327 118 ... ...<br />
Switzerl<strong>and</strong> 1,450 2,520 2,779 2,903 0.34 0.46 0.50 0.52 769 1,328 1,627 29 ... ...<br />
United Arab Emirates** 1,037 5,401 4,950 4,852 ... 1.34 1.26 1.09 ... 2,308 2,353 ... ... ...<br />
United Kingdom 5,113 11,289 11,233 12,534 0.33 0.70 0.70 0.71 2,101 9,098 8,822 511 89 5<br />
United States 15,948 26,804 27,509 26,473 0.14 0.18 0.19 0.17 8,904 17,843 18,137 1,887 338 47<br />
Estonia 1 12 15 19 ... 0.13 0.14 0.15 ... 7 9 ... ... ...<br />
Hungary 10 34 30 47 ... 0.10 0.11 0.13 ... ... 17 ... ... ...<br />
Kazakhstan ... 5 27 ... ... - 0.02 ... ... 2 19 ... ... ...<br />
Lithuania 1 18 6 11 0.02 0.11 0.10 0.11 ... ... 2 ... ... ...<br />
Romania ... 20 70 ... ... 0.07 0.11 ... ... ... 69 ... ... ...<br />
TOTAL bilaterals**** 68,632 108,593 117,955 115,364 0.25 0.31 0.31 0.32 32,406 76,783 78,753 10,933 6,492 1,518<br />
African Development Bank 131 144 137 ... ... ... ... ... ... 9 13 131 134 124<br />
African Development Fund 787 2,188 1,904 ... ... ... ... ... 715 1,851 1,791 157 1 0<br />
Arab Fund for Economic <strong>and</strong><br />
Social Development<br />
... 388 358 ... ... ... ... ... ... 894 878 ... ... ...<br />
Asian Development Bank<br />
Special Funds<br />
1,234 1,008 1,477 ... ... ... ... ... ... 2,696 2,773 ... 5 6<br />
Asian Development Fund** ... ... ... ... ... ... ... ... ... ... ... ... ... ...<br />
BADEA ... 82 56 ... ... ... ... ... ... 133 126 ... ... ...<br />
Climate Investment Funds [CIF] ... 152 350 ... ... ... ... ... ... 152 349 ... ... ...<br />
EU Institutions 8,780 15,757 16,389 ... ... ... ... ... 1,531 13,254 13,854 4 2 1<br />
World Bank (IDA) 8,324 8,202 10,262 ... ... ... ... ... 10,073 11,956 13,337 529 101 10<br />
Inter-American Development<br />
Bank Special Fund<br />
320 1,937 1,720 ... ... ... ... ... ... 1,309 1,222 ... ... ...<br />
International Monetary Fund<br />
(Concessional Trust Funds)<br />
936 623 180 ... ... ... ... ... ... ... ... 490 ... ...<br />
OPEC Fund for International<br />
Development<br />
102 214 249 ... ... ... ... ... ... 402 447 ... ... 11<br />
UNDP 405 467 459 ... ... ... ... ... ... 417 391 ... ... ...<br />
UNICEF 847 1,234 1,295 ... ... ... ... ... 510 764 834 ... ... ...<br />
UN Peacebuilding Fund ... 43 64 ... ... ... ... ... ... 47 64 ... ... ...<br />
UN Relief <strong>and</strong> Works Agency for<br />
Palestine Refugees<br />
583 541 680 ... ... ... ... ... ... 441 499 ... ... ...<br />
World Food Programme 477 365 309 ... ... ... ... ... ... 71 53 ... ... ...<br />
TOTAL multilaterals**** 26,165 42,395 43,151 … … … … … 13,696 42,167 42,684 1,311 245 154<br />
TOTAL 94,797 150,988 161,105 … … … … … 46,102 118,950 121,437 12,245 6,738 1,671<br />
Source: OECD-DAC, DAC <strong>and</strong> CRS databases (2015).<br />
*Preliminary data.<br />
**Kuwait <strong>and</strong> the United Arab Emirates are not part of the Development Assistance Committee (DAC) but are included in its Creditor Reporting System (CRS) database. Icel<strong>and</strong><br />
became a member of the DAC in 2012 <strong>and</strong> now reports to the CRS. The Czech Republic, Pol<strong>and</strong>, the Slovak Republic <strong>and</strong> Slovenia became members of the DAC in 2013.<br />
***The Asian Development Fund is a donor to education but does not report to the OECD on disbursements.<br />
**** The total includes ODA from other bilaterals <strong>and</strong> multilaterals not listed above.<br />
(…) indicates that data are not available, (-) represents a nil value<br />
Total ODA data represent net disbursements. Sector-allocable ODA <strong>and</strong> debt relief <strong>and</strong> other actions relating to debt represent gross disbursements<br />
Total ODA from DAC donors is bilateral ODA only, while ODA as % of GNI includes multilateral ODA.<br />
2016 • GLOBAL EDUCATION MONITORING REPORT 481
TABLE 2<br />
Bilateral <strong>and</strong> multilateral aid to education<br />
TOTAL AID TO EDUCATION TOTAL AID TO BASIC EDUCATION DIRECT AID TO EDUCATION DIRECT AID TO BASIC EDUCATION<br />
CONSTANT 2014 US$ MILLIONS CONSTANT 2014 US$ MILLIONS CONSTANT 2014 US$ MILLIONS CONSTANT 2014 US$ MILLIONS<br />
DIRECT AID TO SECONDARY<br />
EDUCATION<br />
CONSTANT 2014<br />
US$ MILLIONS<br />
2002–2003<br />
annual<br />
average 2013 2014<br />
2002–2003<br />
annual<br />
average 2013 2014<br />
2002–2003<br />
annual<br />
average 2013 2014<br />
2002–2003<br />
annual<br />
average 2013 2014<br />
2002–2003<br />
annual<br />
average 2013 2014<br />
Australia 198 391 529 64 221 306 195 390 529 43 116 126 30 19 9<br />
Austria 71 145 147 6 3 3 71 144 146 3 0 0 3 23 20<br />
Belgium 154 109 101 29 34 30 149 109 101 16 17 18 18 31 29<br />
Canada 258 262 245 107 137 140 254 255 242 74 92 95 11 53 34<br />
Czech Republic* ... 8 10 ... 1 1 ... 8 10 ... 1 0 ... 1 1<br />
Denmark 28 150 122 15 67 72 26 138 114 5 22 37 1 5 4<br />
Finl<strong>and</strong> 43 59 80 24 28 42 41 52 74 9 11 14 2 3 3<br />
France 1,444 1,519 1,477 185 224 125 1,399 1,466 1,433 25 141 47 37 147 211<br />
Germany 851 1,770 1,815 136 279 297 850 1,762 1,808 105 152 167 74 120 149<br />
Greece 58 11 11 28 1 1 58 11 11 23 ... ... 20 ... ...<br />
Icel<strong>and</strong>* ... 4 2 ... 3 2 ... 4 2 ... 3 2 ... 0 0<br />
Irel<strong>and</strong> 70 53 48 40 25 25 64 48 46 16 8 13 1 5 6<br />
Italy 48 56 72 18 22 31 45 54 71 1 12 15 2 11 13<br />
Japan 492 1,139 588 139 471 181 440 657 515 79 102 54 36 49 70<br />
Kuwait* ... 29 42 ... 5 4 ... 29 42 ... 0 ... ... 12 13<br />
Luxembourg ... 48 53 ... 14 25 ... 48 53 ... 9 21 ... 29 24<br />
Netherl<strong>and</strong>s 337 229 170 222 92 55 305 224 170 185 81 52 1 22 11<br />
New Zeal<strong>and</strong> 98 83 77 27 28 25 96 79 74 11 24 21 11 3 3<br />
Norway 205 291 305 120 214 216 191 275 291 93 179 181 10 5 8<br />
Pol<strong>and</strong>* ... 29 46 ... 1 9 ... 29 46 ... 0 1 ... 1 0<br />
Portugal 76 54 57 11 12 11 76 53 56 7 0 0 8 7 6<br />
Republic of Koreay ... 226 227 ... 48 45 ... 226 227 ... 23 25 ... 69 78<br />
Slovak Republic* ... 5 4 ... 1 1 ... 5 4 ... 0 0 ... 1 1<br />
Slovenia* ... 5 7 ... 1 1 ... 5 7 ... 0 0 ... 0 0<br />
Spain 197 80 53 65 35 21 197 78 53 43 11 8 45 12 9<br />
Sweden 114 137 178 74 79 112 95 115 169 46 46 85 3 6 8<br />
Switzerl<strong>and</strong> 72 98 120 34 42 53 65 91 113 26 32 42 29 34 43<br />
United Arab Emirates* ... 713 184 ... 356 94 ... 100 140 ... 1 22 ... 1 4<br />
United Kingdom 308 1,582 1,374 212 801 636 189 1,536 1,356 126 382 326 8 233 302<br />
United States 428 977 1,084 271 714 878 241 858 1,049 166 604 820 0 30 15<br />
Estonia ... 1 2 ... 0 0 ... 1 2 ... ... 0 ... 0 0<br />
Hungary ... - 8 ... - 0 ... ... 8 ... ... 0 ... ... 0<br />
Kazakhstan ... 0 18 ... 0 8 ... ... 18 ... ... ... ... ... ...<br />
Lithuania ... - 1 ... - 0 ... ... 1 ... ... ... ... ... 0<br />
Romania ... - 57 ... - 17 ... ... 57 ... ... 0 ... ... 0<br />
Total bilaterals 5,549 10,260 9,315 1,829 3,957 3,467 5,046 8,853 9,039 1,103 2,067 2,192 352 930 1,076<br />
African Development Bank ... 0 0 ... - 0 ... 0 0 ... ... ... ... ... ...<br />
African Development Fund 98 182 112 53 56 26 75 95 69 11 ... ... 2 53 37<br />
Arab Fund for Economic <strong>and</strong><br />
Social Development<br />
... 5 4 ... 1 2 ... 5 4 ... ... ... ... 0 ...<br />
Asian Development Bank<br />
Special Funds<br />
... 222 223 ... 80 61 ... 222 223 ... 31 21 ... 74 99<br />
Asian Development Fund** ... ... ... ... - - ... ... ... ... ... ... ... ... ...<br />
BADEA ... 8 5 ... 2 1 ... 8 5 ... 0 0 ... 0 1<br />
Climate Investment<br />
Funds [CIF]<br />
... - 0 ... - - ... ... 0 ... ... ... ... ... 0<br />
EU Institutions 220 1,050 1,016 105 400 429 78 862 773 26 166 161 14 90 71<br />
World Bank (IDA) 1,153 1,149 1,629 775 477 737 1,153 1,148 1,622 646 339 546 105 366 520<br />
Inter-American Development<br />
Bank Special Fund<br />
... 42 54 ... 36 40 ... 42 54 ... 34 30 ... 1 1<br />
International Monetary Fund<br />
(Concessional Trust Funds)<br />
421 243 166 211 122 83 ... ... ... ... ... ... ... ... ...<br />
OPEC Fund for International<br />
Development<br />
... 17 21 ... 7 5 ... 17 21 ... 6 3 ... 6 13<br />
UNDP ... 2 2 ... 1 1 ... 2 2 ... 0 0 ... 0 0<br />
UNICEF 75 74 82 74 54 53 75 74 82 74 35 25 0 0 0<br />
UN Peacebuilding Fund ... - - ... - - ... ... ... ... ... ... ... ... ...<br />
UN Relief <strong>and</strong> Works Agency<br />
for Palestine Refugees<br />
... 351 395 ... 351 395 ... 351 395 ... 351 395 ... ... ...<br />
World Food Programme ... 41 31 ... 41 30 ... 41 31 ... 41 30 ... ... ...<br />
Total multilaterals 1,967 3,386 3,740 1,218 1,628 1,863 1,381 2,867 3,281 757 1,003 1,211 121 591 742<br />
Total 7,516 13,646 13,055 3,047 5,585 5,330 6,427 11,720 12,320 1,860 3,070 3,403 473 1,520 1,818<br />
Source: OECD-DAC, CRS database (2015).<br />
* Estonia, Hungary, Kazakhstan, Kuwait, Lithuania, Romania <strong>and</strong> the United Arab Emirates are not part of the DAC but are included in its CRS database. Icel<strong>and</strong> became a member of<br />
the DAC in 2012 <strong>and</strong> now reports to the CRS. The Czech Republic, Pol<strong>and</strong>, the Slovak Republic <strong>and</strong> Slovenia became members of the DAC in 2013.<br />
** The Asian Development Fund is a donor to education but does not report to the OECD on disbursements.<br />
Aid from France, the United Kingdom <strong>and</strong> New Zeal<strong>and</strong> includes funds disbursed to overseas territories (see Table 3).<br />
(…) indicates that data are not available, (-) represents a nil value<br />
All data represent gross disbursements. The share of ODA disbursed to the education sector is as a percentage of gross ODA disbursements as reported in the CRS statistical tables.<br />
Total ODA figures in Table 1 represent net disbursements as reported in the DAC statistical tables.<br />
482<br />
ANNEX | AID TABLES
DIRECT AID TO POST-SECONDARY<br />
EDUCATION<br />
DIRECT AID TO EDUCATION, LEVEL<br />
UNSPECIFIED<br />
CONSTANT 2014 US$ MILLIONS<br />
CONSTANT 2014 US$ MILLIONS<br />
SHARE OF EDUCATION IN TOTAL ODA (%)<br />
SHARE OF DIRECT AID TO EDUCATION IN<br />
TOTAL SECTOR-ALLOCABLE ODA (%)<br />
SHARE OF BASIC EDUCATION IN TOTAL<br />
AID TO EDUCATION (%)<br />
2002–2003<br />
annual<br />
average 2013 2014<br />
2002–2003<br />
annual<br />
average 2013 2014<br />
2002–2003<br />
annual<br />
average 2013 2014<br />
2002–2003<br />
annual<br />
average 2013 2014<br />
2002–2003<br />
annual<br />
average 2013 2014<br />
83 47 34 39 209 359 11 10 15 15 13 18 32 56 58<br />
60 116 120 5 5 6 15 26 23 32 42 45 8 2 2<br />
92 28 31 23 33 22 9 8 8 20 13 11 19 31 29<br />
106 27 26 62 84 86 10 8 7 24 12 12 42 52 57<br />
... 6 8 ... 1 1 ... 15 16 ... 24 27 ... 14 7<br />
1 32 10 19 80 62 2 7 6 9 11 9 56 45 59<br />
2 11 7 28 28 50 10 7 9 14 10 12 56 48 52<br />
1,062 1,066 1,062 274 112 113 22 22 23 46 25 23 13 15 8<br />
611 1,244 1,239 61 247 253 16 18 16 21 18 16 16 16 16<br />
4 9 9 10 1 1 23 25 24 27 78 67 49 6 7<br />
... ... ... ... 0 0 ... 11 7 ... 13 9 ... 90 92<br />
4 6 6 43 29 21 17 10 9 22 14 14 57 47 51<br />
11 12 11 31 20 32 3 6 5 21 14 16 38 40 43<br />
257 250 211 68 257 180 7 14 10 13 6 5 28 41 31<br />
... 8 21 ... 10 9 ... 16 18 ... 6 8 ... 17 10<br />
... 0 0 ... 9 8 ... 16 18 ... 24 26 ... 29 47<br />
77 104 101 42 17 7 8 6 4 17 8 7 66 40 32<br />
43 48 46 30 4 4 42 23 19 64 31 25 28 34 32<br />
49 36 46 39 56 57 8 7 8 15 9 11 58 74 71<br />
... 27 28 ... 1 16 ... 23 56 ... 42 48 ... 3 21<br />
52 23 28 9 23 22 26 18 23 30 29 27 15 22 20<br />
... 83 84 ... 50 41 ... 16 16 ... 17 18 ... 21 20<br />
... 3 3 ... 1 1 ... 30 27 ... 42 49 ... 19 15<br />
... 3 5 ... 1 1 ... 24 32 ... 37 51 ... 12 10<br />
64 9 10 45 46 26 12 8 11 20 12 12 33 43 40<br />
8 19 31 37 44 45 5 4 4 9 5 7 65 58 63<br />
1 11 12 10 13 15 5 4 4 8 7 7 47 43 44<br />
... 1 13 ... 96 101 ... 13 4 ... 4 6 ... 50 51<br />
1 129 126 53 792 602 6 14 12 9 17 15 69 51 46<br />
53 123 133 22 102 81 3 4 4 3 5 6 63 73 81<br />
... 0 1 ... 0 1 ... 7 11 ... 12 19 ... 13 25<br />
... ... 7 ... ... 0 ... - 25 ... ... 44 ... ... 3<br />
... ... 1 ... ... 17 ... 2 65 ... ... 91 ... 50 47<br />
... ... 1 ... ... 1 ... - 22 ... ... 58 ... ... 29<br />
... ... 22 ... ... 34 ... - 82 ... ... 83 ... ... 30<br />
2,641 3,484 3,497 950 2,373 2,274 8 9 8 16 12 11 33 39 37<br />
... 0 0 ... ... 0 ... 0 0 ... 1 4 ... - 10<br />
0 17 24 61 25 8 12 8 6 10 5 4 54 31 23<br />
... 3 ... ... 2 4 ... 1 1 ... 1 0 ... 16 50<br />
... 20 22 ... 98 81 ... 22 15 ... 8 8 ... 36 27<br />
... ... ... ... ... ... ... ... ... ... ... ... ... ... ...<br />
... 3 3 ... 5 2 ... 9 10 ... 6 4 ... 32 19<br />
... ... ... ... ... ... ... - 0 ... ... 0 ... ... -<br />
22 325 249 17 281 293 3 7 6 5 7 6 48 38 42<br />
145 168 182 257 274 374 14 14 16 11 10 12 67 41 45<br />
... 2 2 ... 5 21 ... 2 3 ... 3 4 ... 86 75<br />
... ... ... ... ... ... 45 39 93 ... ... ... 50 50 50<br />
... 3 1 ... 2 4 ... 8 8 ... 4 5 ... 41 23<br />
... 0 0 ... 1 1 ... 0 0 ... 1 0 ... 50 42<br />
0 ... ... ... 38 56 9 6 6 15 10 10 99 74 65<br />
... ... ... ... ... ... ... - - ... ... ... ... ... ...<br />
... ... ... ... ... ... ... 65 58 ... 80 79 ... 100 100<br />
... ... ... ... ... 0 ... 11 10 ... 57 57 ... 100 100<br />
167 541 483 336 732 844 8 8 9 11 8 9 62 48 50<br />
2,809 4,025 3,980 1,286 3,105 3,119 8 9 8 14 11 11 41 41 41<br />
2016 • GLOBAL EDUCATION MONITORING REPORT 483
TABLE 3<br />
Recipients of aid to education<br />
TOTAL AID TO EDUCATION<br />
TOTAL AID TO BASIC EDUCATION<br />
TOTAL AID TO BASIC EDUCATION PER<br />
PRIMARY SCHOOL-AGE CHILD DIRECT AID TO EDUCATION DIRECT AID TO BASIC EDUCATION<br />
484<br />
CONSTANT 2014 US$ MILLIONS CONSTANT 2014 US$ MILLIONS CONSTANT 2014 US$ CONSTANT 2014 US$ MILLIONS CONSTANT 2014 US$ MILLIONS<br />
2002–2003<br />
annual<br />
average 2013 2014<br />
2002–2003<br />
annual<br />
average 2013 2014<br />
2002–2003<br />
annual<br />
average 2013 2014<br />
2002–2003<br />
annual<br />
average 2013 2014<br />
2002–2003<br />
annual<br />
average 2013 2014<br />
Caucasus <strong>and</strong> Central Asia 94 239 213 30 45 47 5 7 7 59 224 208 8 15 19<br />
Unallocated within the region - 20 18 - 1 3 … … … - 20 18 - 0 2<br />
Armenia 18 40 29 7 8 6 43 … … 8 31 28 1 1 2<br />
Azerbaijan 12 24 20 4 5 4 7 9 7 6 24 20 1 2 2<br />
Georgia 26 47 42 6 9 11 23 36 43 20 47 42 3 4 5<br />
Kazakhstan 6 25 21 1 3 1 1 3 1 6 25 21 1 1 0<br />
Kyrgyzstan 12 32 40 4 10 14 9 24 35 5 26 37 0 2 4<br />
Tajikistan 8 13 13 4 5 4 6 8 7 2 13 13 1 4 3<br />
Turkmenistan 1 4 4 0 0 0 1 0 0 1 4 4 0 0 0<br />
Uzbekistan 12 35 27 2 5 5 1 3 2 11 35 27 1 2 1<br />
Europe <strong>and</strong> Northern America 195 426 503 68 54 110 15 12 26 184 422 411 38 19 18<br />
Unallocated within the region 20 119 70 5 17 14 … … … 19 118 70 1 4 3<br />
Albania 75 36 37 36 7 7 140 36 40 73 33 31 24 2 3<br />
Belarus - 31 32 - 2 3 - 5 9 - 31 32 - 0 1<br />
Bosnia <strong>and</strong> Herzegovina 31 38 38 10 4 4 … … … 31 38 38 6 1 1<br />
Croatia 9 - - 0 - - 1 - - 9 - - - - -<br />
Montenegro - 9 5 - 1 1 - 37 22 - 9 5 - 0 0<br />
Republic of Moldova 9 21 73 2 4 21 9 25 … 7 21 73 0 2 2<br />
Serbia 36 64 58 10 9 9 29 30 31 34 64 56 4 2 3<br />
TFYR Macedonia 13 21 15 5 3 3 37 26 24 9 21 15 2 2 2<br />
Ukraine - 88 174 - 8 49 - 5 30 - 88 89 - 5 3<br />
Eastern <strong>and</strong> South-eastern Asia 869 2,104 1,601 164 644 420 1 4 3 825 1,624 1,562 97 174 219<br />
Unallocated within the region 11 30 21 3 4 4 … … … 12 33 21 2 2 2<br />
Cambodia 47 85 93 18 28 30 8 15 16 39 85 93 7 12 9<br />
China 364 518 490 17 30 21 0 0 0 364 518 490 10 4 4<br />
DPR Korea 2 4 13 0 2 0 0 1 0 2 4 13 0 2 0<br />
Indonesia 149 373 238 49 150 90 2 5 3 142 305 238 35 28 28<br />
Lao PDR 28 68 69 8 22 15 10 30 20 23 67 68 5 14 10<br />
Malaysia 15 32 33 1 2 2 0 1 1 15 32 33 0 0 0<br />
Mongolia 27 57 46 9 18 11 37 81 45 25 57 46 6 11 7<br />
Myanmar 11 463 103 6 236 60 1 45 12 11 81 103 5 27 47<br />
Philippines 36 61 99 8 31 62 1 3 5 35 61 99 5 23 44<br />
Thail<strong>and</strong> 30 47 45 2 7 6 0 1 1 30 47 45 0 3 3<br />
Timor-Leste 20 34 34 4 12 14 26 64 76 16 34 34 2 2 4<br />
Viet Nam 128 332 318 39 100 105 4 15 16 112 300 280 20 45 59<br />
Latin America <strong>and</strong> the Caribbean 575 899 882 224 330 306 5 7 6 554 882 866 169 203 170<br />
Unallocated within the region 48 86 65 12 14 14 … … … 48 86 65 8 8 10<br />
Antigua <strong>and</strong> Barbuda 0 0 0 0 0 0 7 0 0 0 0 0 - - -<br />
Argentina 19 31 28 2 6 4 1 1 1 19 31 28 1 2 0<br />
Aruba … … … … … … … … … … … … … … …<br />
Barbados 0 - - - - - - - - 0 - - - - -<br />
Belize 0 2 1 0 1 0 5 26 11 0 2 1 0 1 0<br />
Bolivia, P.S. 87 44 48 56 16 16 44 12 11 84 43 48 46 6 4<br />
Brazil 39 119 113 4 18 17 … … … 39 119 113 2 5 4<br />
Chile 15 30 30 1 7 5 1 5 3 15 30 30 0 3 0<br />
Colombia 33 78 77 5 23 19 1 … … 33 78 77 2 10 7<br />
Costa Rica 3 16 11 0 5 4 1 11 9 3 16 11 0 3 2<br />
Cuba 12 7 7 3 1 1 3 1 1 12 7 7 3 0 0<br />
Dominica 1 2 1 0 1 0 34 107 43 0 0 0 - 0 0<br />
Dominican Republic 19 39 53 12 21 24 10 17 19 19 37 53 12 8 9<br />
Ecuador 17 38 37 3 15 14 2 8 8 17 38 37 2 6 4<br />
El Salvador 8 19 24 3 10 12 4 14 17 8 17 24 2 8 9<br />
Grenada 0 1 3 - 0 1 - 2 115 0 1 0 - 0 -<br />
Guatemala 30 27 27 16 13 13 8 6 6 29 26 27 13 11 12<br />
Guyana 17 4 4 6 1 1 51 13 15 15 4 4 3 1 1<br />
Haiti 24 72 107 12 37 64 9 26 45 24 68 97 9 23 41<br />
Honduras 37 51 44 28 43 33 26 41 32 36 51 42 24 42 30<br />
Jamaica 12 15 9 9 7 6 27 … … 9 10 9 7 4 5<br />
Mexico 31 60 63 2 10 8 0 1 1 31 60 63 1 3 1<br />
Nicaragua 59 53 36 33 33 13 41 45 18 50 53 36 22 27 9<br />
Panama 5 4 4 0 2 2 1 4 … 5 4 4 0 1 1<br />
Paraguay 7 25 15 4 18 8 4 23 11 7 25 15 3 16 7<br />
Peru 33 44 47 9 16 19 3 5 6 33 44 47 7 10 14<br />
Saint Kitts <strong>and</strong> Nevis 0 1 - 0 1 - 2 97 - 0 0 - - 0 -<br />
Saint Lucia 1 6 3 0 2 1 10 … … 1 6 2 0 0 0<br />
Saint Vincent <strong>and</strong> the Grenadines 0 3 1 0 1 1 5 99 52 0 3 1 0 0 -<br />
Suriname 3 2 3 1 0 1 19 2 16 3 2 3 1 0 0<br />
Trinidad <strong>and</strong> Tobago 1 - - 0 - - 0 - - 1 - - - - -<br />
Uruguay 3 5 5 1 2 1 2 7 4 3 5 5 0 1 0<br />
Venezuela, B.R. 9 16 16 1 4 2 0 1 1 9 16 16 1 2 0<br />
Northern Africa <strong>and</strong> Western Asia 1,071 2,731 2,108 216 1,179 889 5 25 19 912 2,002 1,948 99 630 633<br />
Unallocated within the region 11 115 49 4 27 18 … … … 12 104 47 3 22 16<br />
Algeria 135 136 127 1 3 2 0 1 1 135 136 127 0 1 1<br />
Bahrain 0 - - 0 - - … … … 0 - - - - -<br />
Egypt 106 832 154 56 388 49 7 37 5 87 191 154 45 22 27<br />
Iraq 8 60 68 1 19 20 0 4 4 8 60 68 1 14 14<br />
Jordan 131 254 365 58 178 254 80 181 252 21 210 267 0 138 182<br />
Lebanon 41 160 180 1 95 92 3 195 180 41 159 180 1 89 68<br />
Libya - 11 10 - 1 1 - 1 2 - 11 10 - 0 -<br />
Morocco 286 343 311 17 88 45 4 25 13 286 342 311 6 50 14<br />
Oman 0 - - 0 - - 0 - - 0 - - 0 - -<br />
ANNEX | AID TABLES
DIRECT AID TO SECONDARY<br />
EDUCATION<br />
DIRECT AID TO POST-SECONDARY<br />
EDUCATION<br />
DIRECT AID TO EDUCATION, LEVEL<br />
UNSPECIFIED<br />
CONSTANT 2014 US$ MILLIONS CONSTANT 2014 US$ MILLIONS CONSTANT 2014 US$ MILLIONS<br />
SHARE OF EDUCATION IN TOTAL<br />
ODA (%)<br />
SHARE OF DIRECT AID TO EDUCATION<br />
IN SECTOR-ALLOCABLE ODA (%)<br />
SHARE OF BASIC EDUCATION IN<br />
TOTAL AID TO EDUCATION (%)<br />
2002–2003<br />
annual<br />
average 2013 2014<br />
2002–2003<br />
annual<br />
average 2013 2014<br />
2002–2003<br />
annual<br />
average 2013 2014<br />
2002–2003<br />
annual<br />
average 2013 2014<br />
2002–2003<br />
annual<br />
average 2013 2014<br />
2002–2003<br />
annual<br />
average 2013 2014<br />
8 43 23 35 121 114 8 45 52 5 9 8 5 9 8 32 19 22<br />
- 4 4 - 13 11 - 2 1 … 9 8 … 9 9 … 6 15<br />
0 8 1 4 18 19 3 3 6 5 12 9 3 11 10 39 19 20<br />
0 1 0 4 16 14 1 5 4 4 9 7 4 9 7 36 19 19<br />
3 9 1 14 24 25 1 10 12 7 7 6 8 7 7 25 19 25<br />
0 2 2 4 18 17 1 4 2 3 18 23 4 19 24 21 11 6<br />
1 5 7 2 10 8 1 10 18 5 8 10 3 8 10 39 30 35<br />
0 3 2 0 4 5 0 3 3 5 3 3 3 3 4 52 40 35<br />
0 1 1 0 2 2 0 0 0 3 15 13 6 15 14 35 5 3<br />
3 10 5 6 16 14 2 7 7 6 11 7 9 11 7 17 15 17<br />
28 28 29 69 309 272 49 66 92 4 9 9 8 9 9 35 13 22<br />
1 9 9 10 79 36 6 26 23 3 8 5 6 10 6 25 14 20<br />
20 7 6 8 18 20 21 6 4 19 11 10 24 11 10 48 18 19<br />
- 0 0 - 27 27 - 4 4 … 30 27 … 30 28 … 6 10<br />
2 4 3 15 27 29 9 5 6 6 6 5 8 7 6 33 10 10<br />
0 - - 8 - - 0 - - 6 … … 9 … … 2 … …<br />
- 1 1 - 5 3 - 2 1 - 7 4 - 7 4 … 17 16<br />
0 1 4 5 14 30 2 3 37 6 6 13 7 6 14 23 18 28<br />
3 3 3 18 46 40 9 13 11 2 7 8 4 7 9 27 13 15<br />
1 0 1 4 17 11 2 2 1 4 8 5 4 8 5 36 15 19<br />
- 1 2 - 76 78 - 7 6 … 11 12 … 12 10 … 9 28<br />
76 152 170 563 846 814 90 457 364 9 10 10 14 12 12 19 31 26<br />
2 4 2 6 28 18 3 4 2 6 5 3 11 6 4 25 15 17<br />
3 18 14 16 23 29 14 31 40 10 10 11 10 10 11 37 33 32<br />
20 21 35 320 443 416 13 51 35 15 30 35 20 32 36 5 6 4<br />
1 - 0 1 2 13 0 0 0 1 5 15 3 9 23 14 47 4<br />
22 23 7 63 77 80 22 177 123 7 16 11 15 16 12 33 40 38<br />
2 21 33 14 16 17 2 15 8 10 15 14 10 16 15 29 33 21<br />
3 0 0 10 28 28 2 4 4 8 17 23 33 18 26 5 8 7<br />
0 11 10 16 20 22 2 15 7 12 12 13 16 13 13 32 32 23<br />
0 4 14 4 13 15 1 37 28 10 6 5 16 5 13 54 51 58<br />
5 5 4 20 16 15 4 16 36 3 6 6 8 9 11 23 52 63<br />
2 1 2 24 34 33 3 8 7 4 6 7 8 6 8 6 15 14<br />
6 5 4 7 7 7 2 20 19 7 14 14 7 14 15 22 34 41<br />
10 38 45 60 139 121 22 78 55 8 7 6 9 7 6 30 30 33<br />
75 99 107 221 342 333 89 239 255 8 8 8 12 9 9 39 37 35<br />
2 4 4 31 62 42 7 11 8 8 3 3 11 5 4 24 16 22<br />
- 0 - 0 0 0 0 0 0 3 4 3 3 5 3 40 4 8<br />
1 4 5 14 16 15 3 10 8 17 38 35 27 41 36 12 21 15<br />
… … … … … … … … … … … … … … … … … …<br />
- - - 0 - - - - - 4 … … 5 … … - … …<br />
0 0 0 0 0 0 0 0 1 3 4 3 5 4 4 60 62 41<br />
15 10 12 7 8 8 16 19 24 8 6 7 13 6 7 64 37 33<br />
4 10 4 29 78 79 5 26 26 9 9 10 16 9 10 11 15 15<br />
1 2 4 11 17 16 2 9 10 19 32 11 21 35 12 9 24 17<br />
3 6 8 21 36 38 6 26 24 4 9 6 5 10 6 15 29 24<br />
0 4 2 3 5 4 0 4 3 5 22 13 7 24 14 11 30 33<br />
1 0 1 7 5 5 1 2 1 15 7 6 18 8 7 26 14 12<br />
0 0 - 0 0 0 - 0 - 8 7 4 4 2 3 29 42 34<br />
3 1 2 2 3 13 2 25 29 10 18 23 16 19 24 66 55 45<br />
5 3 4 9 10 10 1 20 19 6 17 16 8 18 18 18 41 38<br />
2 4 6 2 3 3 1 2 6 4 8 16 6 9 18 38 53 49<br />
0 1 - 0 0 0 0 - 0 0 2 6 7 2 7 1 - 3 49<br />
5 8 9 6 4 3 4 3 4 9 5 9 12 5 9 53 49 49<br />
7 0 0 1 2 2 4 1 1 19 3 2 26 3 3 33 40 36<br />
1 8 8 7 13 12 6 24 37 12 6 10 17 8 11 52 51 60<br />
2 5 5 2 1 2 9 3 5 9 8 6 15 8 7 77 85 76<br />
0 4 1 0 1 1 2 1 1 11 11 7 12 10 7 75 48 69<br />
6 4 6 22 39 42 1 13 14 14 8 7 15 8 7 6 17 13<br />
3 11 16 13 3 3 12 11 9 8 10 8 13 11 8 55 63 36<br />
3 1 0 1 2 2 0 1 1 11 8 10 14 9 11 9 42 42<br />
1 3 3 2 2 2 2 3 3 8 13 11 14 14 11 49 74 57<br />
7 4 5 15 17 17 5 12 12 5 8 9 8 9 10 27 37 41<br />
- 0 - 0 0 - 0 0 - 1 9 … 1 2 … 28 47 …<br />
0 2 0 0 0 0 0 4 2 4 20 16 4 21 19 31 33 42<br />
0 0 - 0 0 0 0 2 1 4 22 15 7 34 25 25 50 47<br />
0 - - 1 2 1 0 0 1 7 8 21 7 8 21 43 5 32<br />
0 - - 1 - - 0 - - 15 … … 15 … … 1 … …<br />
0 1 1 2 1 1 1 2 2 20 12 5 23 12 5 16 37 25<br />
1 1 2 6 9 9 1 5 5 11 41 40 15 46 45 10 24 14<br />
58 171 164 677 832 803 73 374 355 13 10 8 20 12 11 20 43 42<br />
1 3 4 3 80 30 1 4 4 7 8 4 12 13 6 36 23 37<br />
1 3 3 131 129 120 2 4 3 51 43 50 80 49 55 1 2 2<br />
0 - - 0 - - 0 - - 54 … … 57 … … 1 … …<br />
12 13 8 27 66 74 4 90 45 6 14 3 9 7 6 53 47 32<br />
1 18 17 6 19 27 0 9 11 1 4 5 1 4 9 18 31 29<br />
3 14 3 12 22 35 5 36 46 13 16 13 6 21 18 44 70 70<br />
2 10 15 36 50 49 2 10 47 30 21 19 39 32 31 3 59 51<br />
- 2 0 - 7 7 - 1 3 … 8 5 … 8 8 … 6 13<br />
4 59 66 253 160 168 22 74 63 36 13 11 54 13 11 6 26 15<br />
0 - - 0 - - 0 - - 10 … … 11 … … 26 … …<br />
2016 • GLOBAL EDUCATION MONITORING REPORT 485
TABLE 3<br />
Recipients of aid to education (Continued)<br />
TOTAL AID TO EDUCATION<br />
TOTAL AID TO BASIC EDUCATION<br />
TOTAL AID TO BASIC EDUCATION PER<br />
PRIMARY SCHOOL-AGE CHILD DIRECT AID TO EDUCATION DIRECT AID TO BASIC EDUCATION<br />
486<br />
ANNEX | AID TABLES<br />
CONSTANT 2014 US$ MILLIONS CONSTANT 2014 US$ MILLIONS CONSTANT 2014 US$ CONSTANT 2014 US$ MILLIONS CONSTANT 2014 US$ MILLIONS<br />
2002–2003<br />
annual<br />
average 2013 2014<br />
2002–2003<br />
annual<br />
average 2013 2014<br />
2002–2003<br />
annual<br />
average 2013 2014<br />
2002–2003<br />
annual<br />
average 2013 2014<br />
2002–2003<br />
annual<br />
average 2013 2014<br />
Palestine 51 334 354 21 271 293 48 592 629 51 310 343 15 237 262<br />
Saudi Arabia 2 - - 0 - - 0 - - 2 - - - - -<br />
Sudan* 21 27 30 11 11 16 2 2 3 18 27 30 7 7 12<br />
Syrian Arab Republic 32 96 72 1 32 19 1 16 … 32 96 72 1 22 18<br />
Tunisia 100 146 170 2 21 34 2 22 35 100 139 136 1 2 2<br />
Turkey 101 127 124 17 10 8 3 2 2 76 127 124 3 2 0<br />
Yemen 44 89 95 23 37 37 6 9 9 43 89 80 17 24 17<br />
Pacific 221 269 228 84 106 105 72 66 64 180 225 226 32 44 64<br />
Unallocated within the region 12 25 21 2 3 3 … … … 12 25 21 1 2 1<br />
Cook Isl<strong>and</strong>s 4 4 4 1 3 3 568 1,542 1,631 4 4 4 0 3 3<br />
Fiji 11 19 18 3 5 4 28 55 37 11 19 18 2 2 0<br />
Kiribati 10 11 12 3 5 8 242 395 540 10 11 12 0 5 7<br />
Marshall Isl<strong>and</strong>s 12 15 9 6 7 9 797 857 979 1 2 9 0 0 8<br />
Micronesia, F.S. 24 24 38 12 13 29 696 864 1,994 2 2 38 0 1 21<br />
Nauru 0 5 4 0 1 0 16 484 149 0 5 4 - - -<br />
Niue 6 4 2 2 2 1 14,094 10,932 4,541 4 3 0 0 0 0<br />
Palau 4 4 1 2 2 1 1,069 1,366 370 1 2 1 0 0 0<br />
Papua New Guinea 89 66 55 40 27 23 47 21 18 88 66 55 24 2 2<br />
Samoa 13 20 15 5 6 4 157 194 125 13 18 15 2 2 2<br />
Solomon Isl<strong>and</strong>s 8 33 19 2 14 11 34 156 118 7 33 19 0 12 10<br />
Tonga 8 11 7 2 7 2 130 415 137 8 10 7 1 6 1<br />
Tuvalu 2 7 5 1 3 2 619 1,919 1,144 2 6 5 0 0 0<br />
Vanuatu 17 20 19 3 9 8 109 266 213 17 20 19 0 9 7<br />
Southern Asia 953 2,178 2,687 589 967 1,234 3 5 7 766 2,092 2,660 457 606 945<br />
Unallocated within the region 14 50 40 6 13 14 … … … 13 48 40 3 10 12<br />
Afghanistan 39 443 388 25 239 278 7 44 50 33 442 388 16 131 257<br />
Bangladesh 148 528 449 97 311 207 6 19 13 139 444 421 89 227 152<br />
Bhutan 9 4 2 5 2 1 44 16 6 9 4 2 3 1 0<br />
India 376 384 806 277 28 270 2 0 2 355 384 806 257 9 247<br />
Iran, Islamic Republic of 39 79 77 1 2 1 0 0 0 39 79 77 1 1 0<br />
Maldives 9 2 2 3 1 1 52 … … 9 2 2 3 0 0<br />
Nepal 51 137 165 33 74 77 10 22 24 49 137 165 25 55 60<br />
Pakistan 218 454 643 126 252 342 7 12 16 77 454 643 48 148 199<br />
Sri Lanka 51 97 116 17 47 43 11 26 25 44 97 116 12 23 17<br />
Sub-Saharan Africa 2,810 3,395 3,233 1,478 1,627 1,489 13 11 9 2,224 2,854 2,841 922 896 821<br />
Unallocated within the region 86 114 115 65 40 44 … … … 84 108 102 50 24 25<br />
Angola 41 18 31 23 4 15 12 1 3 41 18 31 16 2 6<br />
Benin 44 75 42 16 38 17 13 23 10 39 59 35 11 21 12<br />
Botswana 3 19 38 0 9 19 1 29 59 3 19 38 0 0 0<br />
Burkina Faso 90 105 89 54 65 52 27 22 17 63 76 66 35 44 36<br />
Burundi 14 38 32 6 18 15 5 12 9 10 30 25 2 6 5<br />
Cameroon 99 97 101 18 7 5 6 2 1 86 97 101 10 4 3<br />
Cape Verde 38 27 29 5 3 3 59 49 49 36 24 26 2 0 0<br />
Central African Republic 9 6 21 1 1 9 2 2 12 9 6 4 1 0 0<br />
Chad 28 13 18 14 7 8 9 3 3 19 13 14 5 5 4<br />
Comoros 13 16 16 4 3 1 44 22 10 13 14 16 4 1 0<br />
Congo 26 21 21 2 2 2 5 3 3 26 21 21 1 2 1<br />
Côte d’Ivoire 93 84 81 33 30 27 12 9 8 55 40 41 9 7 6<br />
D. R. Congo 123 132 103 55 87 58 6 7 5 31 131 103 5 74 49<br />
Djibouti 30 25 18 8 11 5 63 119 53 27 20 12 5 8 1<br />
Equatorial Guinea 9 2 2 5 1 0 62 9 4 9 2 2 3 0 0<br />
Eritrea 19 14 9 8 0 1 16 0 2 19 14 9 5 0 0<br />
Ethiopia 104 359 439 58 211 259 5 14 16 80 325 422 31 104 134<br />
Gabon 31 27 25 5 1 1 27 8 5 30 27 25 4 0 0<br />
Gambia 10 5 9 6 3 5 29 11 16 8 5 9 5 2 2<br />
Ghana 127 146 88 81 92 42 26 24 11 79 132 85 47 73 39<br />
Guinea 45 43 54 27 13 20 18 7 11 41 37 35 23 7 9<br />
Guinea-Bissau 10 10 19 4 7 10 19 24 38 10 10 15 4 5 5<br />
Kenya 86 152 99 57 80 57 11 11 8 81 108 99 51 45 50<br />
Lesotho 24 10 3 12 5 3 34 16 7 20 3 3 7 2 2<br />
Liberia 3 41 48 2 24 29 5 34 41 3 36 33 2 14 15<br />
Madagascar 84 65 85 37 35 37 15 11 12 66 65 58 21 29 13<br />
Malawi 75 72 87 44 44 51 21 16 18 70 64 83 30 23 30<br />
Mali 101 107 102 54 51 48 29 19 17 78 50 67 30 20 24<br />
Mauritania 35 31 25 14 9 2 30 16 4 30 20 25 8 3 1<br />
Mauritius 17 21 14 0 6 1 3 53 13 17 14 13 0 2 1<br />
Mozambique 153 223 218 85 121 121 22 23 22 110 170 166 45 51 58<br />
Namibia 27 68 47 14 30 17 39 79 43 27 68 47 12 3 2<br />
Niger 56 49 89 29 26 45 15 8 14 35 33 62 8 15 18<br />
Nigeria 33 157 147 17 63 56 1 2 2 32 157 147 12 40 12<br />
Rw<strong>and</strong>a 64 129 87 28 64 36 21 37 20 44 119 86 5 20 18<br />
Sao Tome <strong>and</strong> Principe 6 7 7 1 1 1 47 43 17 6 7 7 1 0 0<br />
Senegal 117 146 172 37 59 63 22 26 27 111 130 162 19 44 42<br />
Seychelles 1 3 1 0 1 0 49 155 41 1 3 1 - 0 0<br />
Sierra Leone 24 29 44 15 17 27 21 17 26 11 18 21 7 11 14<br />
Somalia 5 28 33 4 20 23 3 11 13 5 28 33 3 18 16<br />
South Africa 119 68 45 54 24 14 7 3 2 119 54 45 43 6 8<br />
South Sudan* - 64 55 - 36 37 … 20 19 - 64 55 - 16 26<br />
Swazil<strong>and</strong> 3 5 6 2 4 5 7 20 23 3 5 6 0 4 5<br />
Togo 15 23 23 1 6 2 2 6 2 14 19 23 1 4 1<br />
U. R. Tanzania 299 262 135 228 120 67 33 13 7 225 165 108 178 36 34
DIRECT AID TO SECONDARY<br />
EDUCATION<br />
DIRECT AID TO POST-SECONDARY<br />
EDUCATION<br />
DIRECT AID TO EDUCATION, LEVEL<br />
UNSPECIFIED<br />
CONSTANT 2014 US$ MILLIONS CONSTANT 2014 US$ MILLIONS CONSTANT 2014 US$ MILLIONS<br />
SHARE OF EDUCATION IN TOTAL<br />
ODA (%)<br />
SHARE OF DIRECT AID TO EDUCATION<br />
IN SECTOR-ALLOCABLE ODA (%)<br />
SHARE OF BASIC EDUCATION IN<br />
TOTAL AID TO EDUCATION (%)<br />
2002–2003<br />
annual<br />
average 2013 2014<br />
2002–2003<br />
annual<br />
average 2013 2014<br />
2002–2003<br />
annual<br />
average 2013 2014<br />
2002–2003<br />
annual<br />
average 2013 2014<br />
2002–2003<br />
annual<br />
average 2013 2014<br />
2002–2003<br />
annual<br />
average 2013 2014<br />
8 9 10 15 21 19 13 43 51 8 13 15 11 17 21 41 81 83<br />
1 - - 2 - - 0 - - 49 … … 51 … … 4 … …<br />
1 4 1 6 9 7 3 8 9 5 2 3 16 5 7 50 40 55<br />
0 3 0 29 51 52 1 20 2 28 5 4 41 31 24 5 33 26<br />
16 9 10 81 97 94 2 32 30 23 14 15 34 14 15 2 15 20<br />
3 9 10 66 99 98 4 17 16 19 4 3 28 4 3 17 8 6<br />
6 15 15 8 23 22 12 27 25 13 8 7 19 11 9 52 42 39<br />
19 23 17 66 77 65 63 82 81 19 13 13 20 13 13 38 40 46<br />
1 0 0 9 20 17 0 2 2 14 10 9 18 11 10 13 14 12<br />
1 0 0 1 1 1 1 0 0 42 21 13 44 21 13 32 67 76<br />
0 1 2 6 9 9 3 7 7 21 21 20 27 23 21 28 28 20<br />
0 3 2 3 2 2 6 1 1 37 17 16 37 17 16 32 51 62<br />
0 - - 0 1 0 0 1 0 18 16 15 10 6 17 47 48 97<br />
0 - - 1 0 0 0 0 17 18 17 32 7 5 33 48 53 77<br />
- 3 3 0 1 0 0 1 0 0 19 17 1 19 18 46 14 6<br />
- - 0 1 1 0 3 2 0 42 23 12 64 25 6 45 41 43<br />
0 0 - 1 1 0 0 1 1 14 13 5 7 8 5 45 45 50<br />
7 2 2 26 12 9 31 51 41 19 10 9 19 10 9 45 41 42<br />
1 2 2 4 9 8 6 5 3 24 16 15 25 18 17 36 28 25<br />
1 9 2 3 9 6 3 4 2 7 12 9 8 12 10 29 41 56<br />
1 0 0 4 4 3 2 1 2 24 13 8 26 13 9 26 60 32<br />
0 0 - 1 1 2 1 5 3 20 25 14 21 27 14 36 39 32<br />
5 3 3 5 7 7 6 2 1 34 22 18 37 23 19 20 47 42<br />
57 410 655 176 431 505 76 638 551 8 11 13 11 12 14 62 44 46<br />
2 5 5 4 20 14 3 7 5 3 5 4 6 7 5 40 27 35<br />
1 37 39 4 59 50 12 215 43 3 9 8 5 10 9 64 54 72<br />
24 81 141 18 53 46 7 83 82 10 15 14 12 16 15 65 59 46<br />
2 1 0 1 1 1 3 1 1 14 3 1 17 3 1 53 38 31<br />
13 227 356 66 111 157 19 37 44 11 9 16 13 9 16 74 7 33<br />
1 0 1 38 77 74 0 2 2 27 62 59 41 71 68 2 2 1<br />
2 0 0 3 1 1 0 1 2 41 5 7 57 5 8 33 35 36<br />
3 19 41 8 26 29 13 37 34 11 13 16 12 14 16 64 54 47<br />
1 26 37 12 72 120 16 209 287 6 15 15 7 18 16 58 56 53<br />
7 15 34 21 12 13 3 46 52 7 11 12 11 13 13 34 48 37<br />
142 412 454 637 623 617 526 918 943 9 7 7 15 8 8 53 48 46<br />
3 13 12 7 45 35 28 21 24 4 3 2 8 3 3 75 35 38<br />
1 7 3 11 4 4 13 4 17 8 5 11 18 6 11 56 24 48<br />
4 5 3 19 14 16 4 19 4 12 11 7 16 10 6 37 51 42<br />
1 0 0 1 1 1 1 18 37 6 15 32 8 15 33 14 48 49<br />
7 9 11 10 10 10 11 12 9 13 9 8 15 9 7 60 62 58<br />
0 4 4 3 4 5 4 15 11 5 7 6 7 6 6 44 48 45<br />
2 6 11 71 82 83 3 5 4 9 12 11 25 15 13 18 7 5<br />
3 11 10 28 10 14 2 3 2 27 10 11 31 12 12 12 11 10<br />
1 0 0 7 4 3 1 2 1 13 3 3 18 7 2 11 22 42<br />
1 1 2 5 4 4 7 3 4 8 2 4 7 5 6 48 53 44<br />
1 0 1 8 12 13 0 1 2 36 9 22 40 24 23 31 15 7<br />
0 3 4 22 15 15 3 1 1 24 12 16 43 17 21 9 11 9<br />
2 6 8 34 24 25 10 2 1 8 4 7 17 9 6 35 36 33<br />
4 17 20 14 15 15 9 25 19 3 5 4 4 7 6 45 66 57<br />
6 1 3 14 9 6 2 2 2 31 15 10 36 18 11 25 45 29<br />
1 0 0 1 1 1 4 2 0 28 25 16 35 34 22 49 39 29<br />
3 10 3 3 3 4 8 0 2 6 17 11 11 19 13 45 2 13<br />
5 24 38 15 17 17 29 180 233 6 9 12 8 11 14 55 59 59<br />
2 2 3 22 22 21 1 3 2 20 25 19 40 26 20 18 6 4<br />
1 1 0 1 1 1 1 1 6 13 4 9 15 5 9 63 59 54<br />
2 23 30 10 13 12 20 23 5 11 10 7 12 10 7 64 63 48<br />
4 1 2 11 24 22 3 5 2 13 7 9 18 13 9 60 30 37<br />
1 0 0 5 2 3 0 2 7 7 10 16 17 11 18 41 64 56<br />
5 20 13 18 17 22 7 26 14 12 4 3 16 4 4 66 53 58<br />
5 1 - 2 0 0 6 1 0 21 3 2 23 1 2 50 56 89<br />
0 6 2 0 2 3 1 14 13 3 8 6 15 8 6 70 58 61<br />
2 6 8 30 18 17 14 12 20 12 10 14 15 14 13 44 54 43<br />
16 6 9 2 2 5 23 33 38 12 6 8 17 7 9 59 61 59<br />
6 9 14 17 17 17 24 4 12 14 7 8 16 6 8 54 48 47<br />
2 2 5 14 13 17 6 2 2 9 9 8 16 10 11 38 30 8<br />
- 3 3 17 9 8 0 1 1 35 12 11 37 10 11 2 27 10<br />
4 20 22 26 11 12 36 88 74 6 9 10 10 9 9 55 54 55<br />
7 10 13 4 1 3 4 54 29 18 22 17 20 24 18 52 44 35<br />
3 8 12 4 4 5 20 6 28 11 6 9 13 7 11 51 52 50<br />
2 40 31 10 29 16 9 48 88 8 6 6 9 6 6 51 40 38<br />
5 11 19 7 10 14 27 77 36 13 12 8 16 12 9 44 50 42<br />
1 2 2 3 3 4 0 2 0 14 14 17 19 17 19 18 18 8<br />
3 12 28 59 61 59 30 13 32 17 14 14 20 15 15 32 40 37<br />
0 0 - 0 1 1 1 2 0 18 10 7 18 10 6 37 43 34<br />
1 3 3 1 1 1 2 3 3 5 5 5 6 5 5 63 61 61<br />
- 5 3 0 1 1 2 5 13 2 3 3 9 7 6 78 71 69<br />
9 3 4 45 23 19 22 21 13 21 5 3 24 4 3 46 35 32<br />
- 4 4 - 4 3 - 40 22 … 5 3 … 9 9 … 57 67<br />
0 0 0 0 0 0 3 1 1 11 4 6 15 4 6 46 82 86<br />
0 4 10 12 10 11 1 2 1 17 10 10 25 11 11 9 28 8<br />
6 27 5 15 32 30 25 71 39 15 7 5 21 6 4 76 46 50<br />
2016 • GLOBAL EDUCATION MONITORING REPORT 487
TABLE 3<br />
Recipients of aid to education (Continued)<br />
TOTAL AID TO EDUCATION<br />
TOTAL AID TO BASIC EDUCATION<br />
TOTAL AID TO BASIC EDUCATION PER<br />
PRIMARY SCHOOL-AGE CHILD DIRECT AID TO EDUCATION DIRECT AID TO BASIC EDUCATION<br />
CONSTANT 2014 US$ MILLIONS CONSTANT 2014 US$ MILLIONS CONSTANT 2014 US$ CONSTANT 2014 US$ MILLIONS CONSTANT 2014 US$ MILLIONS<br />
2002–2003<br />
annual<br />
average 2013 2014<br />
2002–2003<br />
annual<br />
average 2013 2014<br />
2002–2003<br />
annual<br />
average 2013 2014<br />
2002–2003<br />
annual<br />
average 2013 2014<br />
2002–2003<br />
annual<br />
average 2013 2014<br />
Ug<strong>and</strong>a 222 122 126 156 47 40 29 6 5 190 122 120 109 43 31<br />
Zambia 134 55 77 84 34 47 38 12 15 92 45 72 46 18 20<br />
Zimbabwe 14 59 62 6 44 44 2 16 16 14 59 62 4 37 39<br />
Overseas territories** 247 75 72 123 25 24 2,198 7,180 7,262 241 71 69 1 12 13<br />
Anguilla (UK) 1 1 - 0 0 - … … … 1 0 - - 0 -<br />
Mayotte (France) 173 - - 86 - - … … … 173 - - - - -<br />
Montserrat (UK) 5 4 3 3 2 1 6,525 … … 0 2 2 0 0 -<br />
Saint Helena (UK) 0 1 1 0 0 0 … … … 0 1 1 - 0 -<br />
Tokelau (New Zeal<strong>and</strong>) 6 2 2 3 1 1 13,883 7,180 7,262 5 - 0 0 - 0<br />
Turks <strong>and</strong> Caicos Isl<strong>and</strong>s (UK) 1 - - 1 - - 242 … … 1 - - 1 - -<br />
Wallis <strong>and</strong> Futuna (France) 61 67 66 31 21 22 … … … 61 67 66 - 12 13<br />
Unallocated by region or country 482 1,329 1,528 72 607 705 … … … 481 1,324 1,528 35 471 502<br />
Total 7,516 13,646 13,055 3,047 5,585 5,330 5 9 9 6,427 11,720 12,320 1,860 3,070 3,403<br />
Low income countries 1,786 2,831 2,810 1,029 1,488 1,509 14 15 15 1,352 2,468 2,487 631 832 961<br />
Lower middle income countries 3,048 6,133 5,504 1,368 2,658 2,267 5 9 7 2,578 4,702 5,256 934 1,305 1,477<br />
Upper middle income countries 1,669 2,620 2,655 346 660 694 2 4 4 1,495 2,519 2,511 183 367 376<br />
High income countries 327 173 158 138 52 41 10 4 3 320 167 154 7 22 16<br />
Unallocated by income 685 1,888 1,927 167 727 818 … … … 682 1,865 1,912 105 544 573<br />
Total 7,516 13,646 13,055 3,047 5,585 5,330 5 10 9 6,427 11,720 12,320 1,860 3,070 3,403<br />
Caucasus <strong>and</strong> Central Asia 94 239 213 30 45 47 5 9 9 59 224 208 8 15 19<br />
Europe <strong>and</strong> Northern America 195 426 503 68 54 110 184 422 411 38 19 18<br />
Eastern <strong>and</strong> South-eastern Asia 869 2,104 1,601 164 644 420 1 4 3 825 1,624 1,562 97 174 219<br />
Latin America <strong>and</strong> the Caribbean 575 899 882 224 330 306 5 8 8 554 882 866 169 203 170<br />
Northern Africa <strong>and</strong> Western Asia 1,071 2,731 2,108 216 1,179 889 5 25 20 912 2,002 1,948 99 630 633<br />
Pacific 221 269 228 84 106 105 73 68 66 180 225 226 32 44 64<br />
Southern Asia 953 2,178 2,687 589 967 1,234 3 5 7 766 2,092 2,660 457 606 945<br />
Sub-Saharan Africa 2,810 3,395 3,233 1,478 1,627 1,489 13 11 10 2,224 2,854 2,841 922 896 821<br />
Overseas territories 247 75 72 123 25 24 … … … 241 71 69 1 12 13<br />
Unallocated by region or country 482 1,329 1,528 72 607 705 … … … 481 1,324 1,528 35 471 502<br />
… … …<br />
Total 7,516 13,646 13,055 3,047 5,585 5,330 5 10 9 6,427 11,720 12,320 1,860 3,070 3,403<br />
Source: OECD-DAC CRS database (2014).<br />
* Aid disbursement figures for 2002–2003 refer to the former Sudan, before the separation of the South in 2011. Aid<br />
disbursements for 2011 onwards have been separated out by the OECD <strong>and</strong> refer to Sudan <strong>and</strong> South Sudan.<br />
** As defined on the OECD-DAC list of ODA recipients.<br />
(…) indicates that data are not available, (-) represents a nil value<br />
The share of education in total ODA does not match that in Table 2 because the DAC database is used for donors <strong>and</strong> the CRS<br />
database for recipients in total ODA figures.<br />
Malta <strong>and</strong> Slovenia are not listed in the table because they were removed from the OECD-DAC list of ODA recipients in 2005.<br />
However, the aid they received in 2002–2003 is included in the totals.<br />
The classification by income is based on the World Bank list as of July 2014.<br />
All data represent gross disbursements.<br />
488<br />
ANNEX | AID TABLES
DIRECT AID TO SECONDARY<br />
EDUCATION<br />
DIRECT AID TO POST-SECONDARY<br />
EDUCATION<br />
DIRECT AID TO EDUCATION, LEVEL<br />
UNSPECIFIED<br />
CONSTANT 2014 US$ MILLIONS CONSTANT 2014 US$ MILLIONS CONSTANT 2014 US$ MILLIONS<br />
SHARE OF EDUCATION IN TOTAL<br />
ODA (%)<br />
SHARE OF DIRECT AID TO EDUCATION<br />
IN SECTOR-ALLOCABLE ODA (%)<br />
SHARE OF BASIC EDUCATION IN<br />
TOTAL AID TO EDUCATION (%)<br />
2002–2003<br />
annual<br />
average 2013 2014<br />
2002–2003<br />
annual<br />
average 2013 2014<br />
2002–2003<br />
annual<br />
average 2013 2014<br />
2002–2003<br />
annual<br />
average 2013 2014<br />
2002–2003<br />
annual<br />
average 2013 2014<br />
2002–2003<br />
annual<br />
average 2013 2014<br />
6 60 65 13 11 13 62 8 11 19 7 7 25 7 7 70 39 31<br />
4 1 2 9 3 3 33 23 48 10 5 7 15 4 7 62 62 61<br />
0 5 8 5 5 5 4 12 11 6 7 8 10 8 9 44 73 71<br />
1 37 35 1 1 1 238 20 20 64 22 25 69 22 25 50 33 34<br />
0 - - 0 - - 0 - - 23 12 … 23 1 … 18 50 …<br />
- - - 0 - - 172 - - 76 … … 77 … … 50 … …<br />
- 0 0 0 0 0 - 0 2 1 10 6 7 1 5 5 52 46 43<br />
0 0 - - 0 0 0 1 1 7 1 0 7 1 0 6 32 47<br />
- - - 1 - - 4 - - 52 8 11 68 - 0 49 50 51<br />
- - - - - - - - - 19 … … 19 … … 100 … …<br />
- 37 35 0 1 0 61 18 18 75 63 66 75 64 67 50 32 33<br />
9 144 163 365 443 456 71 265 407 5 4 5 10 9 10 15 46 46<br />
473 1,520 1,818 2,809 4,025 3,980 1,286 3,105 3,119 9 8 8 14 10 10 41 41 41<br />
87 325 371 271 361 381 363 951 774 8 8 8 13 9 9 58 53 54<br />
220 773 1,005 1,026 1,349 1,442 397 1,275 1,331 10 9 9 14 10 11 45 43 41<br />
137 190 191 1,024 1,477 1,452 151 485 493 10 12 11 15 12 12 21 25 26<br />
8 45 48 51 48 44 255 52 45 36 25 19 43 26 19 42 30 26<br />
20 187 204 436 791 660 120 343 476 5 5 4 10 8 8 24 38 42<br />
473 1,520 1,818 2,809 4,025 3,980 1,286 3,105 3,119 9 8 8 14 10 10 41 41 41<br />
8 43 23 35 121 114 8 45 52 5 9 8 5 9 8 32 19 22<br />
28 28 29 69 309 272 49 66 92 4 9 9 8 9 9 35 13 22<br />
76 152 170 563 846 814 90 457 364 9 10 10 14 12 12 19 31 26<br />
75 99 107 221 342 333 89 239 255 8 8 8 12 9 9 39 37 35<br />
58 171 164 677 832 803 73 374 355 13 10 8 20 12 11 20 43 42<br />
19 23 17 66 77 65 63 82 81 19 13 13 20 13 13 38 40 46<br />
57 410 655 176 431 505 76 638 551 8 11 13 11 12 14 62 44 46<br />
142 412 454 637 623 617 526 918 943 9 7 7 15 8 8 53 48 46<br />
1 37 35 1 1 1 238 20 20 64 22 25 69 22 25 50 33 34<br />
9 144 163 365 443 456 71 265 407 5 4 5 10 9 10 15 46 46<br />
473 1,520 1,818 2,809 4,025 3,980 1,286 3,105 3,119 9 8 8 14 10 10 41 41 41<br />
2016 • GLOBAL EDUCATION MONITORING REPORT 489
TABLE 4<br />
ODA recipients<br />
TOTAL ODA PER CAPITA ODA SECTOR-ALLOCABLE ODA<br />
DEBT RELIEF AND OTHER ACTIONS RELATED<br />
TO DEBT<br />
CONSTANT 2014 US$ MILLIONS CONSTANT 2014 US$ CONSTANT 2014 US$ MILLIONS CONSTANT 2014 US$ MILLIONS<br />
2002–2003<br />
annual average 2013 2014<br />
2002–2003<br />
annual average 2013 2014<br />
2002–2003<br />
annual average 2013 2014<br />
2002–2003<br />
annual average 2013 2014<br />
Caucasus <strong>and</strong> Central Asia 1,879 2,809 2,727 26 35 33 1,144 2,589 2,584 6 - -<br />
Unallocated within the region - 221 210 … … … - 214 197 - - -<br />
Armenia 338 326 309 111 109 103 246 273 291 - - -<br />
Azerbaijan 352 272 268 42 29 28 159 267 264 - - -<br />
Georgia 345 714 676 75 172 165 237 642 622 - - -<br />
Kazakhstan 224 135 93 15 8 5 141 131 90 - - -<br />
Kyrgyzstan 212 388 402 42 69 70 143 338 379 6 - -<br />
Tajikistan 171 399 370 26 50 46 82 376 353 - - -<br />
Turkmenistan 26 24 26 6 5 5 13 23 25 - - -<br />
Uzbekistan 211 331 373 8 12 13 123 326 362 - - -<br />
Europe <strong>and</strong> Northern America 4,387 4,971 5,790 50 59 69 2,245 4,549 4,733 1,177 1 17<br />
Unallocated within the region 627 1,482 1,496 … … … 307 1,154 1,188 33 - -<br />
Albania 400 326 354 128 113 123 305 293 315 - - -<br />
Belarus - 104 119 - 11 13 - 102 114 - - -<br />
Bosnia <strong>and</strong> Herzegovina 536 583 706 141 152 185 382 571 617 7 1 1<br />
Croatia 145 - - 33 - - 99 - - - - -<br />
Montenegro 5 133 148 9 213 236 5 129 120 - - 17<br />
Republic of Moldova 146 353 551 35 87 135 106 342 535 1 - -<br />
Serbia 2,223 966 724 239 108 81 806 948 652 1,137 - -<br />
TFYR Macedonia 295 257 293 145 124 141 225 253 290 0 - -<br />
Ukraine - 767 1,399 - 17 31 - 759 901 - - -<br />
Eastern <strong>and</strong> South-eastern Asia 10,014 20,706 15,571 5 10 8 6,059 13,566 12,957 373 3,663 1,175<br />
Unallocated within the region 177 592 679 … … … 112 536 588 - - -<br />
Cambodia 484 853 854 38 57 57 368 835 825 - 1 -<br />
China 2,500 1,713 1,389 2 1 1 1,842 1,633 1,354 - - -<br />
DPR Korea 191 78 88 8 3 4 76 43 60 - - -<br />
Indonesia 2,023 2,334 2,104 9 9 8 972 1,912 1,997 347 9 32<br />
Lao PDR 276 451 488 50 70 74 231 427 451 2 - -<br />
Malaysia 185 186 144 8 6 5 46 179 126 - - -<br />
Mongolia 218 469 358 89 167 125 150 449 344 - - -<br />
Myanmar 111 7,302 2,125 2 139 40 67 1,521 794 14 3,650 1,136<br />
Philippines 1,180 1,019 1,544 14 11 16 424 653 940 9 3 6<br />
Thail<strong>and</strong> 766 822 628 12 12 9 355 755 569 - - -<br />
Timor-Leste 268 249 246 294 226 218 229 244 232 - - -<br />
Viet Nam 1,634 4,639 4,923 20 51 54 1,186 4,379 4,676 0 0 0<br />
Latin America <strong>and</strong> the Caribbean 7,208 11,518 11,339 13 19 18 4,764 9,747 9,867 707 31 19<br />
Unallocated within the region 607 2,594 2,348 … … … 423 1,579 1,483 1 - -<br />
Antigua <strong>and</strong> Barbuda 7 3 2 83 29 23 7 2 2 - 0 -<br />
Argentina 110 82 81 3 2 2 70 76 79 6 2 -<br />
Aruba … … … … … … - - - - - -<br />
Barbados 3 - - 11 - - 2 - - - - -<br />
Belize 13 50 35 47 149 103 8 44 32 3 0 0<br />
Bolivia, P.S. 1,144 728 714 131 71 69 621 705 700 392 - -<br />
Brazil 422 1,339 1,132 2 7 6 245 1,320 1,116 - 4 1<br />
Chile 77 94 260 5 5 15 69 85 255 1 - -<br />
Colombia 832 904 1,282 20 19 27 728 816 1,205 0 0 0<br />
Costa Rica 64 74 84 16 16 18 46 67 79 - 5 1<br />
Cuba 79 102 104 7 9 9 65 88 91 - - 5<br />
Dominica 15 24 19 212 331 259 11 16 16 - - -<br />
Dominican Republic 183 211 231 21 21 23 119 193 217 - - -<br />
Ecuador 308 226 228 23 15 15 227 207 205 10 - -<br />
El Salvador 239 231 158 41 38 26 130 192 137 4 1 1<br />
Grenada 11 15 40 107 138 378 11 12 17 - - -<br />
Guatemala 335 550 323 27 36 21 253 519 291 - 0 0<br />
Guyana 90 118 168 121 156 221 57 117 165 17 - -<br />
Haiti 202 1,140 1,058 23 111 101 139 858 847 1 1 1<br />
Honduras 430 659 676 65 85 86 237 621 638 59 1 -<br />
Jamaica 114 130 125 43 47 45 69 96 120 11 6 0<br />
Mexico 222 790 940 2 6 8 212 782 932 0 - -<br />
Nicaragua 708 519 460 136 88 77 376 482 434 179 1 -<br />
Panama 46 52 38 14 14 10 35 47 35 5 0 0<br />
Paraguay 94 185 136 17 29 21 54 179 133 - 0 0<br />
Peru 685 527 519 26 17 17 408 491 477 13 8 9<br />
Saint Kitts <strong>and</strong> Nevis 5 15 - 101 287 - 5 9 - - - -<br />
Saint Lucia 17 27 17 107 151 92 17 26 11 - - -<br />
Saint Vincent <strong>and</strong> the Grenadines 7 12 10 68 105 88 5 8 6 3 - -<br />
Suriname 41 32 14 84 60 26 38 31 13 - - -<br />
Trinidad <strong>and</strong> Tobago 6 - - 4 - - 5 - - 0 - -<br />
Uruguay 17 46 97 5 13 28 15 44 96 2 - -<br />
Venezuela, B.R. 77 39 40 3 1 1 59 36 35 - - -<br />
Northern Africa <strong>and</strong> Western Asia 8,023 26,282 26,293 23 63 62 4,501 17,017 17,520 455 142 99<br />
Unallocated within the region 164 1,450 1,361 … … … 102 800 796 2 0 2<br />
Algeria 264 319 254 8 9 7 170 280 229 - - -<br />
Bahrain 1 - - 1 - - 1 - - - - -<br />
Egypt 1,678 5,937 4,490 23 69 51 1,021 2,576 2,480 187 131 97<br />
Iraq 1,450 1,487 1,343 57 45 39 784 1,329 758 - - -<br />
Jordan 1,039 1,618 2,897 208 231 401 331 1,001 1,459 68 - -<br />
Lebanon 138 775 961 38 157 182 104 496 581 - - -<br />
Libya - 142 198 - 23 32 - 130 130 - - -<br />
Morocco 803 2,590 2,794 27 79 84 532 2,541 2,759 179 9 -<br />
490<br />
ANNEX | AID TABLES
TABLE 4<br />
ODA recipients (Continued)<br />
TOTAL ODA PER CAPITA ODA SECTOR-ALLOCABLE ODA<br />
DEBT RELIEF AND OTHER ACTIONS RELATED<br />
TO DEBT<br />
CONSTANT 2014 US$ MILLIONS CONSTANT 2014 US$ CONSTANT 2014 US$ MILLIONS CONSTANT 2014 US$ MILLIONS<br />
2002–2003<br />
annual average 2013 2014<br />
2002–2003<br />
annual average 2013 2014<br />
2002–2003<br />
annual average 2013 2014<br />
2002–2003<br />
annual average 2013 2014<br />
Oman 5 - - 2 - - 5 - - - - -<br />
Palestine 635 2,518 2,411 186 586 546 472 1,826 1,661 - 0 -<br />
Saudi Arabia 5 - - 0 - - 5 - - - - -<br />
Sudan* 423 1,556 928 14 41 24 107 541 443 5 1 0<br />
Syrian Arab Republic 112 2,041 1,901 7 102 98 76 309 294 1 - -<br />
Tunisia 432 1,045 1,101 44 96 100 292 973 900 - 0 0<br />
Turkey 525 3,624 4,366 8 48 57 266 3,444 4,160 - - -<br />
Yemen 348 1,181 1,287 18 47 50 234 772 868 14 1 -<br />
Pacific 1,186 2,031 1,815 153 215 189 892 1,731 1,719 1 0 -<br />
Unallocated within the region 85 262 236 … … … 68 227 204 - - -<br />
Cook Isl<strong>and</strong>s 9 19 29 474 938 1,418 8 19 28 - - -<br />
Fiji 51 89 93 63 102 106 40 83 89 - - -<br />
Kiribati 28 63 80 315 593 733 27 63 79 - - -<br />
Marshall Isl<strong>and</strong>s 66 97 58 1,261 1,834 1,095 10 25 52 - - -<br />
Micronesia, F.S. 136 145 119 1,270 1,405 1,148 21 30 116 - - -<br />
Nauru 29 27 22 2,909 2,699 2,169 4 27 21 - - -<br />
Niue 13 18 14 7,409 11,416 8,436 7 12 7 - - -<br />
Palau 31 34 23 1,554 1,654 1,114 14 21 23 - - -<br />
Papua New Guinea 481 672 617 84 94 84 459 666 612 - - -<br />
Samoa 53 125 101 297 664 528 51 101 88 - 0 -<br />
Solomon Isl<strong>and</strong>s 110 279 205 250 508 366 95 269 194 1 - -<br />
Tonga 32 82 82 319 781 781 29 76 72 - - -<br />
Tuvalu 12 26 35 1,289 2,671 3,530 11 23 33 - - -<br />
Vanuatu 51 91 102 258 368 403 46 88 100 0 0 -<br />
Southern Asia 12,145 19,254 20,871 8 11 12 6,825 17,115 19,059 1,344 43 25<br />
Unallocated within the region 443 958 1,048 … … … 231 715 812 - - -<br />
Afghanistan 1,545 5,179 4,826 70 174 157 693 4,556 4,219 38 7 10<br />
Bangladesh 1,515 3,413 3,164 11 22 20 1,134 2,834 2,813 141 3 3<br />
Bhutan 62 137 147 103 184 195 53 129 144 - - -<br />
India 3,384 4,515 5,185 3 4 4 2,666 4,432 5,052 2 - -<br />
Iran, Islamic Republic of 146 127 131 2 2 2 96 111 112 - - -<br />
Maldives 21 32 37 72 93 104 15 32 33 - - -<br />
Nepal 483 1,041 1,040 20 38 37 409 996 1,010 13 1 1<br />
Pakistan 3,846 2,990 4,343 26 17 24 1,115 2,541 3,966 1,142 31 11<br />
Sri Lanka 699 863 951 37 42 46 413 768 897 8 - -<br />
Sub-Saharan Africa 29,960 49,350 48,051 44 56 53 14,690 37,536 37,449 8,173 2,764 271<br />
Unallocated within the region 1,944 4,092 5,750 … … … 1,117 3,220 3,861 1 19 9<br />
Angola 536 339 290 33 15 12 226 272 273 - - -<br />
Benin 366 687 632 49 68 61 246 564 566 65 2 6<br />
Botswana 51 127 116 28 59 53 39 125 115 2 1 0<br />
Burkina Faso 679 1,107 1,177 54 67 69 426 819 944 70 10 10<br />
Burundi 254 567 524 35 56 50 131 461 432 5 3 14<br />
Cameroon 1,146 781 927 67 36 42 345 645 784 705 82 -<br />
Cape Verde 141 268 257 308 535 507 114 191 221 0 0 0<br />
Central African Republic 69 208 618 18 45 131 51 92 240 13 5 5<br />
Chad 366 514 442 40 40 34 256 269 237 39 6 5<br />
Comoros 38 176 76 65 240 100 33 59 69 3 103 2<br />
Congo 111 178 127 34 42 29 61 121 99 26 43 0<br />
Côte d’Ivoire 1,137 2,103 1,219 66 100 56 316 444 637 582 1,356 2<br />
D. R. Congo 4,766 2,634 2,487 92 37 34 699 1,981 1,816 3,390 138 145<br />
Djibouti 97 162 178 129 190 206 76 114 114 0 0 0<br />
Equatorial Guinea 34 10 10 58 13 12 27 7 7 5 1 1<br />
Eritrea 316 83 82 82 17 16 172 72 69 - - -<br />
Ethiopia 1,841 3,937 3,639 26 43 38 1,013 3,047 2,932 119 2 0<br />
Gabon 159 106 130 122 66 79 76 101 126 75 3 3<br />
Gambia 75 124 109 56 69 59 56 101 99 6 0 0<br />
Ghana 1,184 1,411 1,186 59 55 45 645 1,310 1,160 217 9 -<br />
Guinea 358 655 588 39 56 49 232 277 404 55 324 5<br />
Guinea-Bissau 142 106 113 103 62 64 58 88 82 65 12 4<br />
Kenya 688 3,626 2,977 21 85 68 513 2,959 2,612 16 15 6<br />
Lesotho 117 346 133 62 168 64 89 296 125 0 2 0<br />
Liberia 99 535 755 32 128 176 20 450 562 8 1 -<br />
Madagascar 690 655 627 41 29 27 439 450 460 125 175 2<br />
Malawi 598 1,173 1,020 50 75 63 427 984 913 60 11 3<br />
Mali 744 1,448 1,294 63 90 78 497 843 849 87 19 13<br />
Mauritania 377 337 311 129 89 80 189 189 238 123 6 1<br />
Mauritius 49 180 122 40 143 97 47 141 116 - - -<br />
Mozambique 2,395 2,423 2,202 122 94 83 1,070 1,929 1,844 966 90 11<br />
Namibia 152 306 273 77 133 116 135 287 268 - - -<br />
Niger 527 808 947 43 46 52 264 471 568 122 7 6<br />
Nigeria 413 2,695 2,613 3 16 15 343 2,654 2,548 27 - -<br />
Rw<strong>and</strong>a 478 1,101 1,036 55 102 93 281 1,002 1,007 38 2 1<br />
Sao Tome <strong>and</strong> Principe 43 53 40 294 296 218 31 42 35 9 0 0<br />
Senegal 688 1,054 1,190 65 76 84 542 859 1,072 89 11 10<br />
Seychelles 7 30 15 78 315 155 7 30 14 - - -<br />
Sierra Leone 493 530 929 109 88 150 189 344 434 90 97 -<br />
Somalia 194 948 1,038 24 95 101 52 426 521 2 1 1<br />
South Africa 556 1,473 1,312 12 28 25 489 1,381 1,295 - - -<br />
South Sudan* - 1,405 1,961 - 128 171 - 699 593 - - -<br />
Swazil<strong>and</strong> 32 126 97 30 102 77 23 123 92 - - -<br />
2016 • GLOBAL EDUCATION MONITORING REPORT 491
TABLE 4<br />
ODA recipients (Continued)<br />
TOTAL ODA PER CAPITA ODA SECTOR-ALLOCABLE ODA<br />
DEBT RELIEF AND OTHER ACTIONS RELATED<br />
TO DEBT<br />
CONSTANT 2014 US$ MILLIONS CONSTANT 2014 US$ CONSTANT 2014 US$ MILLIONS CONSTANT 2014 US$ MILLIONS<br />
2002–2003<br />
annual average 2013 2014<br />
2002–2003<br />
annual average 2013 2014<br />
2002–2003<br />
annual average 2013 2014<br />
2002–2003<br />
annual average 2013 2014<br />
Togo 84 228 237 16 34 34 57 179 218 15 4 4<br />
U. R. Tanzania 1,951 3,637 2,710 54 75 54 1,059 2,871 2,507 392 203 1<br />
Ug<strong>and</strong>a 1,179 1,844 1,731 46 52 47 754 1,736 1,608 89 0 -<br />
Zambia 1,356 1,157 1,042 120 78 68 622 1,085 1,003 471 0 0<br />
Zimbabwe 246 858 762 19 59 51 138 727 662 - - -<br />
Overseas territories** 385 346 289 1,723 1,189 969 352 319 272 1 - -<br />
Anguilla (UK) 3 8 - 252 576 - 3 0 - - - -<br />
Mayotte (France) 226 - - 1,378 - - 226 - - - - -<br />
Montserrat (UK) 53 59 39 12,067 11,640 7,722 25 51 33 1 - -<br />
Saint Helena (UK) 6 148 131 1,344 36,218 32,561 6 147 131 - - -<br />
Tokelau (New Zeal<strong>and</strong>) 11 25 19 8,187 21,187 15,646 8 15 9 - - -<br />
Turks <strong>and</strong> Caicos Isl<strong>and</strong>s (UK) 3 - - 118 - - 3 - - - - -<br />
Wallis <strong>and</strong> Futuna (France) 82 107 100 5,676 7,993 7,526 82 106 100 - - -<br />
Unallocated by region or country 10,040 29,712 32,730 … … … 4,630 14,781 15,278 8 95 66<br />
Total 85,226 166,979 165,476 17 29 28 46,102 118,950 121,437 12,245 6,738 1,671<br />
Low income countries 21,850 36,682 35,603 48 62 59 10,304 28,228 27,596 5,876 1,224 249<br />
Lower middle income countries 31,754 65,490 59,130 13 23 21 18,152 46,345 48,207 4,976 5,367 1,307<br />
Upper middle income countries 16,622 22,744 24,048 8 10 10 9,909 20,510 20,432 1,335 30 38<br />
High income countries 912 703 836 8 5 6 748 641 795 14 4 1<br />
Unallocated by income 14,088 41,361 45,858 … … … 6,990 23,226 24,407 44 114 76<br />
Total 85,226 166,979 165,476 17 29 28 46,102 118,950 121,437 12,245 6,738 1,671<br />
CCA 1,879 2,809 2,727 26 35 33 1,144 2,589 2,584 6 - -<br />
ENA 4,387 4,971 5,790 50 59 69 2,245 4,549 4,733 1,177 1 17<br />
ESEA 10,014 20,706 15,571 5 10 8 6,059 13,566 12,957 373 3,663 1,175<br />
LAC 7,208 11,518 11,339 13 19 18 4,764 9,747 9,867 707 31 19<br />
NAWA 8,023 26,282 26,293 23 63 62 4,501 17,017 17,520 455 142 99<br />
P 1,186 2,031 1,815 153 215 189 892 1,731 1,719 1 0 -<br />
SA 12,145 19,254 20,871 8 11 12 6,825 17,115 19,059 1,344 43 25<br />
SSA 29,960 49,350 48,051 44 56 53 14,690 37,536 37,449 8,173 2,764 271<br />
Overseas territories 385 346 289 1,723 1,189 969 352 319 272 1 - -<br />
Unallocated by region or country 10,040 29,712 32,730 … … … 4,630 14,781 15,278 8 95 66<br />
Total 85,226 166,979 165,476 17 29 28 46,102 118,950 121,437 12,245 6,738 1,671<br />
Source: OECD-DAC CRS database (2014).<br />
* Aid disbursement figures for 2002–2003 refer to the former Sudan, before the separation of the South in 2011.<br />
Aid disbursements for 2011 onwards have been separated out by the OECD <strong>and</strong> refer to Sudan <strong>and</strong> South Sudan.<br />
** As defined on the OECD-DAC list of ODA recipients.<br />
(…) indicates that data are not available, (-) represents a nil value<br />
The share of education in total ODA does not match that in Table 2 because the DAC database is used for donors<br />
<strong>and</strong> the CRS database for recipients in total ODA figures.<br />
Malta <strong>and</strong> Slovenia are not listed in the table because they were removed from the OECD-DAC list of ODA recipients<br />
in 2005. However, the aid they received in 2002–2003 is included in the totals.<br />
The classification by income is based on the World Bank list as of July 2014.<br />
All data represent gross disbursements.<br />
492<br />
ANNEX | AID TABLES
Glossary<br />
Adjusted net enrolment ratio (ANER). Enrolment of<br />
the official age group for a given level of education<br />
either at that level or the levels above, expressed as a<br />
percentage of the population in that age group.<br />
Adult literacy rate. Number of literate persons aged<br />
15 <strong>and</strong> above, expressed as a percentage of the total<br />
population in that age group.<br />
Age-specific enrolment ratio (ASER). Enrolment of<br />
a given age or age group, regardless of the level of<br />
education in which pupils or students are enrolled,<br />
expressed as a percentage of the population of the<br />
same age or age group.<br />
Child or under-5 mortality rate. Probability of dying<br />
between birth <strong>and</strong> the fifth birthday, expressed per<br />
1,000 live births.<br />
Completion rate by level. Percentage of children aged<br />
three to five years older than the official age of entry<br />
into the last grade of an education level who have<br />
reached the last grade of that level. For example, the<br />
primary attainment rate in a country with a 6-year<br />
cycle where the official age of entry into the last grade<br />
is 11 years is the percentage of 14 -16 year olds who<br />
have reached grade 6.<br />
Conflict affected country. For a given year, any country<br />
with 1,000 or more battle-related deaths (including<br />
fatalities among civilians <strong>and</strong> military actors) over the<br />
preceding 10-year period <strong>and</strong>/or more than 200 battlerelated<br />
deaths in any one year over the preceding<br />
3-year period, according to the Uppsala Conflict Data<br />
Program Battle-Related Deaths Dataset.<br />
Constant prices. Prices of a particular item adjusted<br />
to remove the overall effect of general price changes<br />
(inflation) since a given baseline year.<br />
Dropout rate by grade. Percentage of students who drop<br />
out of a given grade in a given school year.<br />
Early childhood care <strong>and</strong> education (ECCE). Services<br />
<strong>and</strong> programmes that support children’s survival,<br />
growth, development <strong>and</strong> learning – including health,<br />
nutrition <strong>and</strong> hygiene, <strong>and</strong> cognitive, social, emotional<br />
<strong>and</strong> physical development – from birth to entry into<br />
primary school.<br />
Early Childhood Development Index (ECDI). Index of<br />
fulfilment of developmental potential that assesses<br />
children aged 36-59 months in four domains: literacy/<br />
numeracy, physical, socio-emotional, <strong>and</strong> cognitive<br />
development. The information is collected through the<br />
UNICEF Multiple Indicators Cluster Surveys. A child is<br />
‘on track’ overall if it is ‘on track’ in at least three of the<br />
four domains.<br />
Education levels according to the International<br />
St<strong>and</strong>ard Classification of Education (ISCED), which<br />
is the classification system designed to serve as an<br />
instrument for assembling, compiling <strong>and</strong> presenting<br />
comparable indicators <strong>and</strong> statistics of education<br />
both within countries <strong>and</strong> internationally. The system,<br />
introduced in 1976, was revised in 1997 <strong>and</strong> 2011.<br />
■■<br />
Pre-primary education (ISCED level 0). Programmes<br />
at the initial stage of organized instruction, primarily<br />
designed to introduce very young children, aged<br />
at least 3 years, to a school-type environment<br />
<strong>and</strong> provide a bridge between home <strong>and</strong> school.<br />
Variously referred to as infant education, nursery<br />
education, pre-school education, kindergarten or<br />
early childhood education, such programmes are the<br />
more formal component of ECCE. Upon completion<br />
of these programmes, children continue their<br />
education at ISCED 1 (primary education).<br />
■■<br />
Primary education (ISCED level 1). Programmes<br />
generally designed to give pupils a sound basic<br />
education in reading, writing <strong>and</strong> mathematics, <strong>and</strong><br />
an elementary underst<strong>and</strong>ing of subjects such as<br />
history, geography, natural sciences, social sciences,<br />
art <strong>and</strong> music.<br />
■■<br />
Secondary education (ISCED levels 2 <strong>and</strong> 3).<br />
Programmes made up of two stages: lower <strong>and</strong><br />
upper secondary. Lower secondary education<br />
(ISCED 2) is generally designed to continue the basic<br />
programmes of the primary level but the teaching<br />
is typically more subject- focused, requiring more<br />
2016 • GLOBAL EDUCATION MONITORING REPORT 493
specialized teachers for each subject area. The<br />
end of this level often coincides with the end<br />
of compulsory education. In upper secondary<br />
education (ISCED 3), the final stage of secondary<br />
education in most countries, instruction is often<br />
organized even more along subject lines <strong>and</strong><br />
teachers typically need a higher or more subjectspecific<br />
qualification than at ISCED level 2.<br />
■■<br />
Post-secondary non-tertiary education (ISCED<br />
level 4). It provides learning experiences building on<br />
secondary education, preparing for labour market<br />
entry as well as tertiary education.<br />
■■<br />
Tertiary education (ISCED levels 5-8): It builds on<br />
secondary education, providing learning activities<br />
in specialized fields of education. It aims at learning<br />
at a high level of complexity <strong>and</strong> specialization.<br />
It comprises:<br />
■■<br />
Level 5: Short-cycle tertiary education,<br />
often designed to provide participants with<br />
professional knowledge, skills <strong>and</strong> competencies.<br />
It is practically based, occupationally-specific <strong>and</strong><br />
prepares students to enter the labour market.<br />
■■<br />
Level 6: Bachelor’s, often designed to provide<br />
participants with intermediate academic <strong>and</strong>/or<br />
professional knowledge, skills <strong>and</strong> competencies,<br />
leading to a first degree or equivalent<br />
qualification.<br />
■■<br />
Level 7: Master’s or equivalent level, often<br />
designed to provide participants with advanced<br />
academic <strong>and</strong>/or professional knowledge, skills<br />
<strong>and</strong> competencies, leading to a second degree or<br />
equivalent qualification.<br />
■■<br />
Level 8: Doctoral or equivalent level, designed<br />
primarily to lead to an advanced research<br />
qualification.<br />
Education for Sustainable Development (ESD). A<br />
type of education that aims to enable learners to<br />
constructively <strong>and</strong> creatively address present <strong>and</strong><br />
future global challenges <strong>and</strong> create more sustainable<br />
<strong>and</strong> resilient societies.<br />
Global Citizenship Education (GCED). A type of education<br />
that aims to empower learners to assume active roles<br />
to face <strong>and</strong> resolve global challenges <strong>and</strong> to become<br />
proactive contributors to a more peaceful, tolerant,<br />
inclusive <strong>and</strong> secure world.<br />
Gross domestic product (GDP). The value of all final<br />
goods <strong>and</strong> services produced in a country in one year<br />
(see also Gross national product).<br />
Gross enrolment ratio (GER). Total enrolment in a specific<br />
level of education, regardless of age, expressed as a<br />
percentage of the population in the official age group<br />
corresponding to this level of education. The GER can<br />
exceed 100% because of early or late entry <strong>and</strong>/or<br />
grade repetition.<br />
Gross intake rate (GIR). Total number of new entrants to<br />
a given grade of primary education, regardless of age,<br />
expressed as a percentage of the population at the<br />
official school entrance age for that grade.<br />
Gross national income (GNI). The value of all final goods<br />
<strong>and</strong> services produced in a country in one year (gross<br />
domestic product) plus income that residents have<br />
received from abroad, minus income claimed by nonresidents.<br />
Gross national product (GNP). Former denomination of<br />
gross national income.<br />
Information <strong>and</strong> communications technology (ICT)<br />
skills. Individuals possess such skills if they have<br />
undertaken certain computer-related activities in<br />
the last three months: copying or moving a file or<br />
folder; using copy <strong>and</strong> paste tools to duplicate or<br />
move information within a document; sending e-mails<br />
with attached files (e.g. document, picture, video);<br />
using basic arithmetic formulae in a spreadsheet;<br />
connecting <strong>and</strong> installing new devices (e.g. a modem,<br />
camera, printer); finding, downloading, installing <strong>and</strong><br />
configuring software; creating electronic presentations<br />
with presentation software (including text, images,<br />
sound, video or charts); transferring files between a<br />
computer <strong>and</strong> other devices; <strong>and</strong> writing a computer<br />
program using a specialized programming language.<br />
Literacy. According to UNESCO’s 1958 definition, the<br />
term refers to the ability of an individual to read <strong>and</strong><br />
write with underst<strong>and</strong>ing a simple short statement<br />
related to his/her everyday life. The concept of literacy<br />
has since evolved to embrace several skill domains,<br />
each conceived on a scale of different mastery levels<br />
<strong>and</strong> serving different purposes.<br />
494<br />
ANNEX | GLOSSARY
Net attendance rate (NAR). Number of pupils in the<br />
official age group for a given level of education who<br />
attend school at that level, expressed as a percentage<br />
of the population in that age group.<br />
Net enrolment ratio (NER). Enrolment of the official age<br />
group for a given level of education, expressed as a<br />
percentage of the population in that age group.<br />
Net intake rate (NIR). New entrants to the first grade<br />
of primary education who are of the official primary<br />
school entrance age, expressed as a percentage of the<br />
population of that age.<br />
New entrants. Pupils entering a given level of education<br />
for the first time; the difference between enrolment<br />
<strong>and</strong> repeaters in the first grade of the level.<br />
Never been to school rate. Percentage of children aged<br />
three to five years older than the official entrance age<br />
into primary education who have never been to school.<br />
For example, in a country where the official entrance<br />
age is 6 years, the indicator is calculated over the age<br />
group 9 to 11 years.<br />
Out-of-school adolescents <strong>and</strong> youth: Those of lower<br />
or upper secondary school age who are not enrolled<br />
either in primary, secondary, post-secondary non<br />
tertiary or tertiary education.<br />
Out-of-school children. Children in the official primary<br />
school age range who are not enrolled in either primary<br />
or secondary school.<br />
Over-age for grade rate. The percentage of pupils in<br />
each level of education (primary, lower secondary, <strong>and</strong><br />
upper secondary) who are 2 years or more above the<br />
intended age for their grade.<br />
Parity index. It is a measure of inequality defined as the<br />
ratio of the values of an education indicator of two<br />
population groups. Typically, the numerator is the<br />
value of the advantaged group <strong>and</strong> the denominator<br />
is the value of the advantaged group). An index value<br />
between 0.97 <strong>and</strong> 1.03 indicates parity. A value below<br />
0.97 indicates a disparity in favour of the advantaged<br />
group. A GPI above 1.03 indicates a disparity in favour<br />
of the disadvantaged group. Groups can be defined by:<br />
■■<br />
Gender: Ratio of female to male values of a<br />
given indicator.<br />
■■<br />
Location. Ratio of rural to urban values of a<br />
given indicator.<br />
■■<br />
Wealth / income. Ratio of the poorest 20% to the<br />
richest 20% of a given indicator.<br />
Private institutions. Institutions that are not operated<br />
by public authorities but are controlled <strong>and</strong> managed,<br />
whether for profit or not, by private bodies such as<br />
non-governmental organizations, religious bodies,<br />
special interest groups, foundations or business<br />
enterprises.<br />
Public expenditure on education. Total current <strong>and</strong><br />
capital expenditure on education by local, regional<br />
<strong>and</strong> national governments, including municipalities.<br />
Household contributions are excluded. The term<br />
covers public expenditure for both public <strong>and</strong> private<br />
institutions.<br />
Pupil/teacher ratio (PTR). Average number of pupils per<br />
teacher at a specific level of education.<br />
Pupil/qualified teacher ratio. Average number of pupils<br />
per qualified teacher at a specific level of education.<br />
Pupil/trained teacher ratio (PTTR). Average number<br />
of pupils per trained teacher at a specific level of<br />
education.<br />
Purchasing power parity (PPP). An exchange rate<br />
adjustment that accounts for price differences<br />
between countries, allowing international comparisons<br />
of real output <strong>and</strong> income.<br />
Repetition rate by grade. Number of repeaters in a given<br />
grade in a given school year, expressed as a percentage<br />
of enrolment in that grade the previous school year.<br />
School age population. Population of the age group<br />
officially corresponding to a given level of education,<br />
whether enrolled in school or not.<br />
Skills. Non-innate capabilities that can be learned <strong>and</strong><br />
transmitted, <strong>and</strong> have economic or social benefits both<br />
to individuals <strong>and</strong> their societies.<br />
Technical <strong>and</strong> vocational education <strong>and</strong> training (TVET).<br />
Programmes designed mainly to prepare students for<br />
direct entry into a particular occupation or trade (or<br />
class of occupations or trades).<br />
2016 • GLOBAL EDUCATION MONITORING REPORT 495
Transition rate to secondary education. New entrants to<br />
the first grade of secondary education in a given year,<br />
expressed as a percentage of the number of pupils<br />
enrolled in the final grade of primary education in the<br />
previous year. The indicator measures transition to<br />
secondary general education only.<br />
Youth literacy rate. Number of literate persons aged<br />
15 to 24, expressed as a percentage of the total<br />
population in that age group.<br />
496<br />
ANNEX | GLOSSARY
Abbreviations<br />
AAPS<br />
AES<br />
AHELO<br />
AIDS<br />
ALLS<br />
ASER<br />
ATM<br />
BADEA<br />
BRAC<br />
BRN<br />
BRT<br />
CALOHEE<br />
CAPIEMP<br />
CEDAW<br />
CGS-LGA<br />
CLASS<br />
CLTS<br />
COP21<br />
CRS<br />
CSO<br />
DAC<br />
DFID<br />
DHS<br />
EAP-CDS<br />
ECCE<br />
ECDI<br />
ECERS<br />
Association of African Planning Schools<br />
Adult Education Survey<br />
Assessment of Higher Education Learning Outcomes<br />
Acquired immunodeficiency syndrome<br />
Adult Literacy <strong>and</strong> Lifeskills Survey<br />
Annual Status of Education Report (India, Pakistan)<br />
Automatic teller machine<br />
Banque Arabe pour le Développement Economique en Afrique<br />
(formerly) Bangladesh Rural Advancement Committee<br />
Big Results Now (United Republic of Tanzania)<br />
Bus rapid transit<br />
Measuring <strong>and</strong> Comparing Achievements of Learning Outcomes<br />
in Higher Education in Europe<br />
Certificat d’Aptitudes Pédagogiques d’Instituteur de l’Enseignement Maternel<br />
et Primaire (Cameroon)<br />
Convention on the Elimination of all forms of Discrimination Against Women<br />
Conditional Grants Scheme to Local Government Areas (Nigeria)<br />
Classroom Assessment Scoring System<br />
Community-led total sanitation<br />
21st Conference of the Parties to the UN Framework Convention on Climate Change<br />
Creditor Reporting System (OECD)<br />
Civil society organization<br />
Development Assistance Committee (OECD)<br />
Department for International Development (United Kingdom)<br />
Demographic <strong>and</strong> Health Survey<br />
East Asia Pacific Child Development Scales<br />
Early childhood care <strong>and</strong> education<br />
Early Childhood Development Index<br />
Early Childhood Environment Rating Scale<br />
ECERS-R Early Childhood Environment Rating Scale Revised in 1998<br />
ECERS3 Early Childhood Environment Rating Scale Revised in 2015<br />
EDI<br />
EFA<br />
EGMA<br />
EGRA<br />
EFA Development Index<br />
Education for All<br />
Early Grade Mathematics Assessment<br />
Early Grade Reading Assessment<br />
2016 • GLOBAL EDUCATION MONITORING REPORT 497
ENADE<br />
ESD<br />
EU<br />
Eurostat<br />
F/M<br />
FAO<br />
GCED<br />
GDP<br />
GEI<br />
GEM Report<br />
GER<br />
GET<br />
GGA<br />
GME<br />
GMR<br />
GNI<br />
GNLC<br />
GNP<br />
GPE<br />
GPI<br />
GRALE<br />
GSHS<br />
HIV<br />
HLPF<br />
HRLS<br />
IAEG-SDGs<br />
IALS<br />
IAR4D<br />
IBE<br />
ICCA<br />
ICCS<br />
ICF<br />
ICILS<br />
ICLEI<br />
ICT<br />
IDA<br />
IDP<br />
IEA<br />
IIEP<br />
Exame Nacional de Desempenho dos Estudantes<br />
Education for sustainable development<br />
European Union<br />
Statistical office of the European Union<br />
Female/male<br />
Food <strong>and</strong> Agriculture Organization of the United Nations<br />
Global citizenship education<br />
Gross domestic product<br />
Gender-specific EFA Index<br />
Global Education Monitoring Report<br />
Gross enrolment ratio<br />
Global Employment Trends (ILO)<br />
Global Guidelines Assessment<br />
GET Model Extension (ILO)<br />
Global Monitoring Report<br />
Gross national income<br />
Global Network of Learning Cities<br />
Gross national product<br />
Global Partnership for Education<br />
Gender parity index<br />
Global Report on Adult Learning <strong>and</strong> Education<br />
Global School-based Student Health Survey<br />
Human immunodeficiency virus<br />
High-Level Political Forum on Sustainable Development<br />
Human Rights <strong>and</strong> Legal Aid Services<br />
Inter-agency <strong>and</strong> Expert Group on SDG Indicators<br />
International Adult Literacy Survey<br />
Integrated Agricultural Research for Development<br />
International Bureau of Education (UNESCO)<br />
Indigenous <strong>and</strong> Community-Conserved Areas<br />
International Civics <strong>and</strong> Citizen Survey<br />
International Classification of Functioning, Disability <strong>and</strong> Health<br />
International Computer <strong>and</strong> Information Literacy Study<br />
Local Governments for Local Sustainability<br />
Information <strong>and</strong> communication technology<br />
International Development Association (World Bank)<br />
Internally displaced <strong>people</strong><br />
International Association for the Evaluation of Educational Achievement<br />
International Institute for Educational Planning (UNESCO)<br />
498<br />
ANNEX | ABBREVIATIONS
ILO<br />
IMF<br />
INES<br />
ISCED<br />
ISSA<br />
LAMP<br />
LEARNigeria<br />
LFS<br />
LLECE<br />
MDG<br />
MELQO<br />
MICS<br />
MLA<br />
NALABE<br />
NEA<br />
NEET<br />
NER<br />
NESLI<br />
NGO<br />
ODA<br />
OECD<br />
OHCHR<br />
OWG<br />
PAL<br />
PASEC<br />
PCEP<br />
PEFA<br />
PEPFAR<br />
PIAAC<br />
PIRLS<br />
PISA<br />
PPP<br />
PRIDI<br />
RCE<br />
R&D<br />
SABER<br />
International Labour Office/Organization<br />
International Monetary Fund<br />
Indicators of Education Systems (OECD)<br />
International St<strong>and</strong>ard Classification of Education<br />
International Step By Step Association<br />
Literacy Assessment <strong>and</strong> Monitoring Programme (UIS)<br />
Let’s Assess, Engage <strong>and</strong> Report Nigeria<br />
Labour Force Survey (European Union)<br />
Laboratorio Latinoamericano de Evaluación de la Calidad de la Educación<br />
(Latin American Laboratory for Assessment of the Quality of Education)<br />
Millennium Development Goal<br />
Measuring Early Learning Quality <strong>and</strong> Outcomes<br />
Multiple Indicator Cluster Survey<br />
Monitoring Learning Achievement<br />
National Assessment of Learning Achievement in Basic Education (Nigeria)<br />
National education account<br />
Not in education, employment or training<br />
Net enrolment ratio<br />
Network for System-Level Indicators (OECD, INES)<br />
Non-government organization<br />
Official development assistance<br />
Organisation for Economic Co-operation <strong>and</strong> Development<br />
Office of the United Nations High Commissioner for Human Rights<br />
Open Working Group<br />
People’s Action for Learning<br />
Programme d’Analyse des Systèmes Educatifs de la CONFEMEN<br />
(Programme of Analysis of Education Systems of the CONFEMEN –<br />
Conference of Education Ministers of Countries Using French as a Common Language)<br />
Pacific Isl<strong>and</strong>s Climate Education Partnership<br />
Public Expenditure <strong>and</strong> Accountability<br />
President’s Emergency Plan For AIDS Relief (United States)<br />
Programme for the International Assessment of Adult Competencies (OECD)<br />
Progress in International Reading Literacy Study<br />
Programme for International Student Assessment (OECD)<br />
Purchasing power parity<br />
Regional Project on Child Development Indicators<br />
Regional Center of Expertise<br />
Research <strong>and</strong> development<br />
Systems Approach for Better Education Results (World Bank)<br />
2016 • GLOBAL EDUCATION MONITORING REPORT 499
SACMEQ<br />
SDG<br />
SDI<br />
SERCE<br />
SIGI<br />
SNA<br />
STEM<br />
STEP<br />
SULITEST<br />
TALIS<br />
TEDS-M<br />
TERCE<br />
TIMSS<br />
TVET<br />
UCLG<br />
UIL<br />
UIS<br />
UK<br />
UN<br />
UNAIDS<br />
UNDP<br />
UNESCO<br />
UNGEI<br />
UNICEF<br />
UNPD<br />
UNSC<br />
UNU-IAS<br />
UOE<br />
US<br />
USAID<br />
WEF<br />
WEI<br />
WFP<br />
WHO<br />
WIDE<br />
WSSD<br />
WVS<br />
Southern <strong>and</strong> Eastern Africa Consortium for Monitoring Educational Quality<br />
Sustainable Development Goal<br />
Shack/Slum Dwellers International<br />
Segundo Estudio Regional Comparativo y Explicativo<br />
(Second Regional Comparative <strong>and</strong> Explanatory Study)<br />
Social Institutions <strong>and</strong> Gender Index<br />
System of National Accounts (United Nations)<br />
Science, technology, engineering <strong>and</strong> mathematics<br />
Skills Toward Employment <strong>and</strong> Productivity (World Bank)<br />
Sustainability Literacy Test (United Nations)<br />
Teaching <strong>and</strong> Learning International Survey (OECD)<br />
Teacher Education <strong>and</strong> Development Study in Mathematics<br />
Tercer Estudio Regional Comparativo y Explicativo<br />
(Third Regional Comparative <strong>and</strong> Explanatory Study)<br />
Trends in International Mathematics <strong>and</strong> Science Study<br />
Technical <strong>and</strong> vocational education <strong>and</strong> training<br />
United Cities <strong>and</strong> Local Governments<br />
UNESCO Institute for Lifelong Learning<br />
UNESCO Institute for Statistics<br />
United Kingdom<br />
United Nations<br />
Joint United Nations Programme on HIV/AIDS<br />
United Nations Development Programme<br />
United Nations Educational, Scientific <strong>and</strong> Cultural Organization<br />
United Nations Girls’ Education Initiative<br />
United Nations Children’s Fund<br />
United Nations Population Division<br />
United Nations Statistical Commission<br />
United Nations University Institute for the Advanced Study of Sustainability<br />
UIS/OECD/Eurostat<br />
United States<br />
United States Agency for International Development<br />
World Education Forum<br />
World Education Indicators<br />
World Food Programme (United Nations)<br />
World Health Organization (United Nations)<br />
World Inequality Database on Education<br />
World Summit on Sustainable Development<br />
World Values Survey<br />
500<br />
ANNEX | ABBREVIATIONS
Index<br />
This index covers the Introduction <strong>and</strong><br />
Chapters 1 to 24. It is in word-by-word<br />
order which takes account of spaces,<br />
so ‘teacher training’ comes before<br />
‘teachers’’. Page numbers in italics<br />
indicate figures <strong>and</strong> tables; those in<br />
bold refer to material in boxes <strong>and</strong><br />
panels; bold italics indicates a figure or<br />
table in a box or panel..<br />
Subheadings are arranged<br />
alphabetically by the significant term,<br />
ignoring prepositions <strong>and</strong> insignificant<br />
words (e.g. ‘effect on achievement’ is<br />
alphabetized as ‘achievement’).<br />
Definitions of terms can be found<br />
in the glossary, <strong>and</strong> additional<br />
information on countries can be found<br />
in the aid tables <strong>and</strong> statistical annex.<br />
A<br />
‘3Ps 4<br />
see also climate change; economic growth;<br />
environment; <strong>people</strong>; prosperity;<br />
social development<br />
2030 Agenda for Sustainable Developments see<br />
SDG 4; Sustainable Development<br />
Goals<br />
absenteeism<br />
pupils 109<br />
teachers 85, 329<br />
abuse see cyberbullying; gender-based violence;<br />
intimate partner violence; sexual<br />
abuse<br />
access to education 272–277<br />
adult education 237, 237, 238, 238, 239<br />
early childhood care <strong>and</strong> education 206–210,<br />
207, 208, 209, 210<br />
marginalized groups 73–77<br />
primary enrolment see primary education,<br />
enrolment<br />
<strong>and</strong> reducing inequality 53–62<br />
secondary enrolment see secondary<br />
education, enrolment<br />
technical <strong>and</strong> vocational education <strong>and</strong><br />
training 223–225, 223, 224<br />
tertiary education 227–233, 228, 229, 230–231,<br />
231, 232<br />
see also educational attainment;<br />
marginalization; out-of-school<br />
children; primary education,<br />
enrolment; school completion; school<br />
dropout; secondary education,<br />
enrolment; wealth disparities; within<br />
country disparities<br />
accountability<br />
in health care 78<br />
in national education 234, 342–346, 379<br />
in SDG process 388–389<br />
Action Research on Measuring Literacy<br />
Programme Participants’ Learning<br />
Outcomes 278<br />
Addis Ababa Action Agenda 133–134, 138<br />
adjusted net enrolment ratio 182, 183, 208, 209<br />
measure 181–182<br />
adolescents, see also young <strong>people</strong>; youth<br />
literacy<br />
adult education<br />
access 237, 237, 238, 238, 239<br />
funding <strong>and</strong> financial assistance 239–240<br />
monitoring 381<br />
participation 237–239, 237, 238, 239<br />
quality of education 240–241<br />
teacher training 240<br />
types 236–237<br />
see also informal education; lifelong learning;<br />
non-formal education; second<br />
chance programmes<br />
Adult Education Survey (AES) 237–238, 238,<br />
239, 239<br />
adult literacy<br />
integrated gender equality approach 92<br />
literacy rates 278, 279, 280–282, 280, 282<br />
marginalized groups 73, 73–74<br />
monitoring 277–278, 378<br />
programme participation 277–278, 278, 279,<br />
279<br />
see also illiteracy; literacy; youth literacy<br />
advanced economies<br />
tax revenue 135<br />
unemployment 57<br />
see also developed countries; high income<br />
countries; OECD countries; richer<br />
countries<br />
Afghanistan<br />
aid for domestic resource mobilization 137<br />
attacks on schools 317<br />
basic education 138, 138, 139<br />
conflict 104<br />
discrimination <strong>and</strong> secondary completion 87<br />
education aid 138, 138, 139<br />
education expenditure 347<br />
educational attainment 74, 74, 104, 186<br />
female literacy 83<br />
gender disparity 74, 74, 87<br />
literacy 83, 281<br />
out-of-school children 182<br />
primary education 182, 186<br />
school completion 87, 186<br />
secondary education 87, 186<br />
students abroad 323<br />
tertiary education 228<br />
TVET enrolment 223<br />
under-5 mortality rate 83<br />
within country disparity 186<br />
years of education 186<br />
Africa<br />
children with disabilities out-of-school 76<br />
education expansion 54<br />
green technology 272<br />
nomadic populations 72<br />
student support 321<br />
see also Central Africa; Northern Africa;<br />
South Africa; Southern <strong>and</strong> Eastern<br />
Africa; sub-Saharan Africa; Western<br />
Africa; individual countries<br />
Agenda 21 5, 386<br />
agricultural extension 46–47<br />
agriculture<br />
conventional methods 44–45<br />
education for sustainability 34, 44–47<br />
effect of climate change 33, 40<br />
effect of environmental degradation 44–45<br />
productivity 45, 46, 47<br />
role of literacy 45<br />
sustainable farming <strong>and</strong> employment 41<br />
AHELO (Assessment of Higher Education<br />
Learning Outcomes) 236<br />
aid<br />
debt relief 141<br />
MDG <strong>and</strong> SDG Funds 144<br />
multi-sector programmes 144–145<br />
official development assistance (ODA) 143–<br />
145, 324, 355–356, 356, 403<br />
policy coherence for development 143–144<br />
see also donors; education aid; finance for<br />
education; OECD, Development<br />
Assistance Committee<br />
aid delivery channels 355<br />
AIDS epidemic 85<br />
see also HIV education<br />
Alaska Rural Systemic Initiative 28<br />
Albania<br />
early childhood care <strong>and</strong> education 213, 213<br />
educational attainment 74, 186<br />
gender disparity 74<br />
literacy 281<br />
primary education completion 186<br />
pupil/teacher ratios 213<br />
secondary education completion 186<br />
tertiary education 228, 229, 231, 232<br />
within country disparity 186<br />
years of education 186<br />
Algeria<br />
child development 219<br />
childhood obesity 80<br />
early childhood care <strong>and</strong> education 210<br />
electricity provision 312<br />
employment 70<br />
gender disparity 70<br />
home learning environment 215<br />
literacy 219<br />
numeracy 219<br />
pre-primary education 330<br />
primary education 312<br />
qualified teachers 330<br />
scholarship aid 324, 324<br />
secondary education 312<br />
tertiary education 228<br />
violence in schools 316<br />
within country disparity 210<br />
All Children Together (Northern Irel<strong>and</strong>) 107<br />
Allianz Insurance, green policies 30<br />
Alphabétisation de Base par Cellulaire or ABC<br />
(Niger) 279<br />
Analysis Programme of the CONFEMEN<br />
Education Systems (PASEC) 202–<br />
203, 270<br />
Angola<br />
malaria prevalence <strong>and</strong> educational<br />
attainment 371<br />
students abroad 323<br />
Anguilla<br />
ICT facilities 313<br />
violence in schools 316<br />
Annual Status of Education Report (ASER) 195,<br />
196, 197<br />
Antigua <strong>and</strong> Barbuda<br />
electricity provision 313<br />
HIV education 292<br />
ICT <strong>and</strong> internet access in schools 313<br />
students abroad 322<br />
tertiary education 231<br />
violence in schools 316<br />
antiretroviral therapy 85<br />
‘apartheid schools’ 124<br />
aquifer depletion 44<br />
Arab Spring 101<br />
Arab States<br />
violence in schools 315<br />
see also individual countries<br />
Argentina<br />
child development 219<br />
early childhood care <strong>and</strong> education 210<br />
educational attainment 73, 75, 186<br />
electricity provision 312, 313<br />
environmental education 31, 301<br />
2016 • GLOBAL EDUCATION MONITORING REPORT 501
gender disparity 75<br />
global citizenship education 294<br />
home learning environment 215<br />
ICT facilities 314<br />
internet access 313<br />
literacy 219<br />
mathematics achievement 195<br />
numeracy 219<br />
pre-primary education 209<br />
primary education 186, 195, 312, 314<br />
psychological bullying in schools 315<br />
reading proficiency 195<br />
school completion 186<br />
secondary education 186, 312, 314<br />
socio-economic background <strong>and</strong><br />
perseverance 249<br />
sustainable transport 121<br />
tertiary education 228, 230, 231, 232<br />
violence in schools 315<br />
within country disparity 186, 210, 231<br />
women in politics 99<br />
years of education 186<br />
armed conflict see conflict; conflict-affected<br />
areas<br />
armed forces, use of school 317<br />
Armenia<br />
education aid 200<br />
educational attainment 57, 58, 75, 186<br />
electricity provision 313<br />
employment 58, 89, 245<br />
employment skills 59<br />
gender disparity 75, 89<br />
ICT facilities <strong>and</strong> internet access in schools<br />
313<br />
literacy 75, 281, 282<br />
national assessments 199<br />
primary education 187, 313<br />
reading proficiency 245<br />
rural areas 75<br />
school completion 187<br />
secondary education 187, 313<br />
tertiary education 59, 230, 231<br />
TVET participation 224<br />
within country disparity 186, 231<br />
working poverty 57<br />
years of education 186<br />
Aruba<br />
ICT facilities in schools 313<br />
tertiary education 231<br />
ASEAN 364<br />
ASER 195, 196, 197<br />
Asia<br />
agriculture 45<br />
disabled access to schools 311<br />
gender disparity 70<br />
global citizenship knowledge 300<br />
green technology 272<br />
illiteracy 136<br />
tax evasion 136<br />
teacher contracts 336<br />
women in politics 70<br />
see also Central Asia; Eastern Asia; Southeastern<br />
Asia; Southern Asia; Western<br />
Asia; individual countries<br />
Asia <strong>and</strong> Pacific Regional Bureau for Education,<br />
education system profiles 361<br />
Asia Summit on Climate Change <strong>and</strong> Indigenous<br />
Peoples 28<br />
Assessment of Higher Education Learning<br />
Outcomes (AHELO) 236<br />
Assessment <strong>and</strong> Teaching of 21st Century Skills<br />
project 247<br />
Assessment Tools <strong>and</strong> Indicators for<br />
Entrepreneurship Education 252<br />
Association of Southeast Asian Nations (ASEAN)<br />
education systems conformity 364<br />
qualifications frameworks 227<br />
attacks on educational facilities 317<br />
attitudes for supportiveness, monitoring<br />
303–304<br />
Australia<br />
digital literacy skills 247<br />
ecological footprint 22<br />
education aid donor 333, 354, 355, 355<br />
education expenditure 234<br />
education research 365<br />
environmental education 301<br />
financial literacy 251<br />
household expenditure 234<br />
human rights education 290<br />
indigenous culture loss 29<br />
literacy 282<br />
mathematics achievement 109<br />
migration 271<br />
multicultural attitudes 304<br />
national assessments 247<br />
pre-primary enrolment 207<br />
pregnancy education 84<br />
primary education completion 187<br />
Project Atlas on students abroad 324<br />
secondary education completion 187<br />
socio-economic background <strong>and</strong><br />
perseverance 249<br />
tertiary education 229, 230, 234<br />
TVET enrolment 223, 225<br />
urban planning 126<br />
violence in schools 109<br />
Australian National Assessment 304<br />
Austria<br />
adult education 238<br />
environmental education 301<br />
gender disparity 230<br />
human rights education 300<br />
ICT facilities 314<br />
ICT skills 246<br />
literacy 282<br />
primary education 187, 314<br />
school completion 187<br />
secondary education 187, 238, 314<br />
socio-economic background <strong>and</strong><br />
perseverance 249<br />
special educational needs 266<br />
tertiary education 228, 229, 230, 238<br />
women in politics 71<br />
authoritarian regimes<br />
teaching methods 102<br />
transition to democracy 101<br />
automation, effect on employment 49<br />
Avaaz environmental group 31<br />
awareness campaigns 29, 164, 165<br />
Aymara community concept suma qamaña<br />
(Plurinational State of Bolivia) 27<br />
Azerbaijan<br />
childhood obesity 80<br />
educational attainment 75, 81<br />
electricity provision 313<br />
environmental education 301, 301<br />
gender disparity 75, 230<br />
HIV education 292<br />
internet access 312, 313<br />
intimate partner violence 81<br />
teacher induction 335<br />
tertiary education 229, 230<br />
TVET enrolment 223<br />
Bahamas<br />
HIV education 292<br />
ICT facilities in schools 313<br />
Bahrain<br />
early childhood care <strong>and</strong> education 212<br />
mathematics achievement 109<br />
psychological bullying in schools 315<br />
scientific researchers 372<br />
tertiary education 228<br />
violence in schools 109, 315<br />
women in politics 71<br />
Balkans<br />
teacher mentoring 335<br />
Bangalore technology innovation cluster 119<br />
B<br />
Bangladesh<br />
child development 219<br />
climate change 34<br />
climate change events 33<br />
computer access 245<br />
early childhood care <strong>and</strong> education 210, 212<br />
early childhood care programmes 85<br />
education expenditure 347<br />
educational attainment 74, 83, 86, 88, 186<br />
electricity provision 86, 312<br />
employment 89, 270<br />
enrolment 106<br />
environmental education 33<br />
fertility rate 84<br />
floating schools programme 33<br />
gender disparity 74, 75, 89, 230<br />
green economy 270<br />
home learning environment 215<br />
income level 354<br />
legal rights education 110<br />
linguistic diversity 268<br />
literacy 75, 219, 281<br />
natural disasters 33, 33, 310<br />
numeracy 75, 219, 283, 284<br />
out-of-school children 272<br />
population growth 21<br />
primary education 34, 106, 186, 312<br />
private schools 188<br />
refugees 106, 272<br />
rural areas 75<br />
school completion 34, 186<br />
school leadership training 332<br />
secondary education 34, 106, 186, 188, 272,<br />
312<br />
students abroad 323<br />
stunted children 85<br />
teacher motivation 334<br />
tertiary education 229, 230, 231<br />
textbooks 189<br />
under-5 mortality rate 371<br />
underweight children 80<br />
within country disparity 186, 210, 231<br />
years of education 186<br />
Barbados<br />
child development 219<br />
educational attainment 75, 186<br />
gender disparity 75<br />
HIV education 292<br />
home learning environment 215<br />
human rights education 290<br />
ICT facilities 313, 314<br />
literacy 219<br />
numeracy 219<br />
pre-primary education 209<br />
primary education 187, 313, 314<br />
school completion 187<br />
secondary education 187, 313, 314<br />
students abroad 322<br />
tertiary education 229, 231<br />
violence in schools 316<br />
within country disparity 186<br />
years of education 186<br />
Barbuda see Antigua <strong>and</strong> Barbuda<br />
basic education<br />
benefits for mothers <strong>and</strong> children 83<br />
education aid 138, 138, 139, 353<br />
green industry needs 42<br />
see also lower secondary education; primary<br />
education; universal primary<br />
education; universal secondary<br />
education<br />
Basic literacy Teaching by Mobile Phone (Niger)<br />
279<br />
basic needs <strong>and</strong> services for living 68<br />
behavioural change, for environmental<br />
sustainability 11, 23, 23–24<br />
Belarus<br />
child development 219<br />
early childhood care <strong>and</strong> education 210<br />
educational attainment 75, 186<br />
gender disparity 75, 230<br />
HIV education 292<br />
502<br />
ANNEX | INDEX
home learning environment 215<br />
ICT facilities 313<br />
literacy 219, 281<br />
numeracy 219<br />
pre-primary education 209<br />
primary education 187, 313<br />
school completion 187<br />
secondary education 187, 313<br />
tertiary education 228, 228, 229, 230<br />
within country disparity 186, 210<br />
years of education 186<br />
Belém Framework for Action 239, 240<br />
Belgium<br />
adult education 238<br />
education expenditure 233<br />
environmental education 301<br />
gender disparity 230<br />
global citizenship education 294<br />
household expenditure 233<br />
human rights education 300<br />
ICT facilities 314<br />
literacy 282<br />
parent governors 294<br />
primary education 187, 314<br />
school completion 187<br />
secondary education 187, 238, 314<br />
socio-economic background <strong>and</strong><br />
perseverance 249<br />
special educational needs 266, 266<br />
student support 233<br />
teacher education 336<br />
tertiary education 230, 231, 233, 238<br />
within country disparity 231<br />
Belize<br />
child development 219<br />
early childhood care <strong>and</strong> education 210,<br />
213, 213<br />
educational attainment 74, 186<br />
electricity provision 312<br />
gender disparity 74<br />
global citizenship education 294<br />
HIV education 292<br />
home learning environment 215<br />
literacy 219<br />
national school census 309<br />
numeracy 219<br />
pre-primary education 209<br />
primary education 186, 312<br />
pupil/teacher ratios 213<br />
school completion 186<br />
secondary education 186, 312<br />
students abroad 322<br />
tertiary education 229, 231<br />
violence in schools 316<br />
within country disparity 186, 210<br />
years of education 186<br />
Benin<br />
child development 219<br />
early childhood care <strong>and</strong> education 210<br />
education expenditure 347<br />
educational attainment 74, 74, 75, 76, 82,<br />
100, 186, 371<br />
electricity provision 312<br />
ethnic minorities 76<br />
female genital mutilation 82<br />
gender disparity 74, 74, 75, 76<br />
home learning environment 215<br />
literacy 75, 219, 281<br />
literacy programme participation 278<br />
malaria prevalence 371<br />
mathematics achievement 202<br />
national assessments 202<br />
numeracy 219<br />
political participation 100, 101–102<br />
pre-primary education 209<br />
primary education 186, 312, 335<br />
reading proficiency 202<br />
rural areas 75<br />
school completion 186<br />
secondary education 186, 312<br />
teacher education 335, 336<br />
tertiary education 101–102, 231<br />
textbooks 190<br />
violence in schools 316<br />
within country disparity 76, 186, 210, 231<br />
years of education 186<br />
Bhutan<br />
child development 219<br />
educational attainment 186<br />
electricity provision 312, 313<br />
home learning environment 215<br />
internet access 313<br />
literacy 219, 281<br />
numeracy 219<br />
primary education 186, 312<br />
school completion 186<br />
secondary education 186, 312<br />
students abroad 323<br />
tertiary education 228<br />
within country disparity 186<br />
years of education 186<br />
bias see discrimination; gender disparity;<br />
prejudice<br />
Big Results Now programme (United Republic of<br />
Tanzania) 201<br />
bike-sharing schemes 121<br />
bilingual schools 106, 269<br />
Bill <strong>and</strong> Melinda Gates Foundation, integrated<br />
aid for local agriculture 140<br />
biodiverse habitats, management by indigenous<br />
<strong>people</strong>s 28<br />
biodiversity loss 19–20, 20<br />
birth rate<br />
adolescents 370, 370<br />
see also population growth<br />
Bokamoso preschool programme (Botswana)<br />
28–29<br />
Bolivarian Republic of Venezuela<br />
child health 82<br />
electricity provision 312<br />
global citizenship education 294<br />
HIV education 292<br />
literacy 82<br />
primary education 312<br />
secondary education 312<br />
Bolivia see Plurinational State of Bolivia<br />
books in home environment 215, 215<br />
BOOST (World Bank) initiative 350<br />
Bosnia <strong>and</strong> Herzegovina<br />
child development 219<br />
childhood obesity 80<br />
early childhood care <strong>and</strong> education 210<br />
educational attainment 75, 186<br />
ethnic minorities 106–107<br />
gender disparity 75<br />
home learning environment 215<br />
literacy 219, 281<br />
numeracy 219<br />
Pre-primary education 209<br />
primary education completion 186<br />
school curriculum following conflict 107<br />
secondary education completion 186<br />
segregation in schools 106–107<br />
teacher mentoring 335<br />
teaching methods 107<br />
tertiary education 231<br />
within country disparity 186, 210, 231<br />
years of education 186<br />
Botswana<br />
electricity provision in schools 312<br />
HIV education 292, 292<br />
ICT facilities in schools 314<br />
language of instruction 28–29<br />
sustainable living 27–28<br />
teacher training 332<br />
boys<br />
literacy 74, 75<br />
school participation 74<br />
victims of bullying 315<br />
see also gender disparity; gender equality<br />
Brazil<br />
access to education 122<br />
adult education 237<br />
agriculture 45, 47<br />
childhood obesity 79<br />
city leadership 129<br />
early childhood care <strong>and</strong> education 85, 212<br />
economic growth 49<br />
education aid donor 353<br />
education system data exchange 364<br />
educational attainment 56, 58, 74, 75, 76, 84<br />
electricity provision 86, 312, 313<br />
employment 51, 56, 58, 270<br />
environmental education 301<br />
ethnic minorities 75, 76<br />
gender disparity 74, 76<br />
gender equality initiatives 92<br />
global citizenship education 294<br />
green economy 270<br />
health <strong>and</strong> nutrition programmes 79<br />
ICT facilities 314<br />
ICT skills 246, 246<br />
instructional teaching time 191<br />
integrated programmes 144<br />
internet access 313<br />
learning cities 126, 127, 127<br />
learning outcomes 236<br />
linguistic diversity 268<br />
male mortality interventions 84<br />
manufacturing industry 51<br />
mathematics achievement 195<br />
national assessments 200<br />
numeracy 86, 283, 284<br />
out-of-school children 183<br />
peaceful civil movements 101<br />
population growth 21<br />
pre-primary education 338<br />
primary education 183, 186, 195, 237, 312,<br />
314, 338<br />
private education 233<br />
psychological bullying in schools 315<br />
reading proficiency 195<br />
Rio de Janeiro Earth Summits 5, 6<br />
scholarship aid 324<br />
school completion 86, 186<br />
secondary education 183, 186, 312, 314, 338<br />
socio-economic background <strong>and</strong><br />
perseverance 249<br />
stunted children 85<br />
sustainable transport 121<br />
teacher contracts 336<br />
teacher salaries 338<br />
tertiary education 233, 236, 272<br />
violence in schools 109, 315<br />
within country disparity 76<br />
women in politics 71, 99<br />
Breakthrough Fund (Education Cannot Wait<br />
fund) 147<br />
breastfeeding programmes 82–83<br />
BRIC economies see emerging economies<br />
British Virgin Isl<strong>and</strong>s<br />
ICT facilities in schools 313<br />
violence in schools 316<br />
Broadb<strong>and</strong> Commission 312<br />
Brundtl<strong>and</strong> Report Our Common Future 3–4<br />
Brunei Darussalam<br />
electricity <strong>and</strong> internet provision 313<br />
sexuality education 291<br />
tertiary education 229, 231<br />
buen vivir movement (South America) 4, 27, 28<br />
Bulgaria<br />
adult education 238<br />
early childhood care <strong>and</strong> education 213, 213<br />
education expenditure 233<br />
education funding 350<br />
environmental concern 304<br />
environmental education 301<br />
equity improvement 350<br />
gender disparity 230<br />
HIV education 292<br />
household expenditure 233<br />
human rights education 300<br />
ICT facilities 314<br />
primary education 187, 314, 335<br />
pupil/teacher ratios 213<br />
school completion 187<br />
2016 • GLOBAL EDUCATION MONITORING REPORT 503
secondary education 187, 238, 314<br />
socio-economic background <strong>and</strong><br />
perseverance 249<br />
special educational needs 266<br />
student support 233<br />
teacher induction 335<br />
tertiary education 228, 229, 230, 231, 231,<br />
233, 238<br />
within country disparity 231<br />
bullying 109, 315–316, 315, 316<br />
see also school-related violence<br />
Burkina Faso<br />
agriculture 34<br />
climate change adaptation 10<br />
early childhood care <strong>and</strong> education 213, 213<br />
educational attainment 10, 74, 81, 82, 186, 371<br />
female genital mutilation 82<br />
gender disparity 74, 74, 75<br />
health <strong>and</strong> nutrition programmes 78<br />
HIV education 292, 292<br />
intimate partner violence 81<br />
literacy 74, 75, 202, 281<br />
malaria prevalence 371<br />
mathematics achievement 202<br />
national assessments 202<br />
out-of-school children 183<br />
primary education 183, 186<br />
pupil/teacher ratios 213<br />
reading proficiency 202<br />
rural areas 74, 75<br />
school completion 186<br />
secondary education 183, 186<br />
solar lighting project 29–30<br />
students abroad 323<br />
tertiary education 231<br />
textbooks 190<br />
within country disparity 185, 186, 231<br />
years of education 185, 186<br />
Burundi<br />
conflict 104<br />
education expenditure 136, 347<br />
educational attainment 74, 104, 186, 371<br />
electricity provision 312<br />
gender disparity 74, 75, 230<br />
HIV education 292<br />
language proficiency 202, 203<br />
literacy 75, 202, 203, 281<br />
malaria prevalence 371<br />
mathematics achievement 202<br />
national assessments 202, 203<br />
primary education 186, 312<br />
reading proficiency 202, 203<br />
rural areas 75<br />
school completion 186<br />
secondary education 186, 312<br />
students abroad 323<br />
tertiary education 228, 229, 230, 231<br />
textbooks 189, 190<br />
within country disparity 186, 231<br />
years of education 186<br />
bus rapid transport system 121<br />
business<br />
role in sustainability 43–44<br />
see also corporate initiatives;<br />
entrepreneurship skills; own-account<br />
employment (self-employment);<br />
private sector<br />
C<br />
C40 (climate change group) 128<br />
Cabo Verde<br />
electricity provision in schools 312<br />
gender disparity 230<br />
HIV education 292<br />
students abroad 322<br />
tertiary education 228, 230<br />
Caicos Isl<strong>and</strong>s see Turks <strong>and</strong> Caicos Isl<strong>and</strong>s<br />
CALOHEE (Measuring <strong>and</strong> Comparing<br />
Achievements of Learning Outcomes<br />
in Higher Education in Europe) 236<br />
Cambodia<br />
adolescent birth rate 370<br />
adult education 240<br />
child development 217, 219<br />
early childhood care <strong>and</strong> education 212<br />
education expenditure 347<br />
educational attainment 81, 186, 370<br />
electricity provision 313<br />
employment 70, 369<br />
gender disparity 70, 75<br />
HIV education 292<br />
home learning environment 215<br />
internet access 313<br />
intimate partner violence 81<br />
literacy 75, 219, 281<br />
NEET rates 369<br />
numeracy 219<br />
primary education 186, 335<br />
professional development of teachers 336<br />
rural areas 75, 122<br />
school completion 186<br />
secondary education 186<br />
sexuality education 291<br />
students abroad 323<br />
teacher education 240, 335, 335, 336<br />
teaching methods 192<br />
tertiary education 231<br />
underweight children 80<br />
urban areas 122<br />
wealth disparities 122<br />
within country disparity 186, 231<br />
years of education 186<br />
Cameroon<br />
adaption to climate change 10<br />
adolescent birth rate 370<br />
agriculture 34<br />
child development 218, 219<br />
educational attainment 10, 75, 76, 81, 186,<br />
370, 371<br />
ethnic minorities 76<br />
gender disparity 74, 75, 75, 76<br />
home learning environment 215<br />
intimate partner violence 81<br />
language of instruction 270<br />
literacy 74, 75, 219, 281<br />
literacy programme participation 278<br />
malaria prevalence 371<br />
mathematics achievement 202<br />
national assessments 202<br />
numeracy 202, 219<br />
primary education completion 186<br />
reading proficiency 202<br />
rural areas 74, 75<br />
scholarship aid 324<br />
secondary education completion 186<br />
students abroad 323<br />
teacher contracts 337<br />
tertiary education 231<br />
textbooks 190<br />
TVET enrolment 223<br />
within country disparity 76, 186, 231<br />
years of education 186<br />
Canada<br />
education aid donor 333, 355<br />
environmental concern 304<br />
environmental education 301, 301<br />
global citizenship education 294<br />
indigenous culture loss 29<br />
literacy 282<br />
primary education completion 187<br />
Project Atlas on students abroad 324<br />
secondary education completion 187<br />
socio-economic background <strong>and</strong><br />
perseverance 249<br />
tertiary education 27, 233<br />
TVET enrolment 223<br />
urban planning 126<br />
women in politics 71<br />
capacity building<br />
for education monitoring 380–381<br />
for financial data 357<br />
in justice system 110–111<br />
for sustainable development 24, 25, 371–372<br />
Caribbean<br />
countries listed 399<br />
early childhood care <strong>and</strong> education 212<br />
educational attainment 74<br />
gender disparity 74<br />
primary education 331<br />
trained teachers in pre-primary <strong>and</strong><br />
secondary education 331<br />
violence in schools 316<br />
see also Latin America <strong>and</strong> the Caribbean;<br />
individual countries<br />
Caribbean Community (CARICOM), qualifications<br />
frameworks 227<br />
cash transfer programmes 91, 352<br />
caste groups<br />
equality programmes 108<br />
marginalization 73, 123<br />
Caucasus<br />
adult literacy 280<br />
with Central Asia, countries listed 398<br />
education aid 354<br />
education expenditure 346, 346<br />
enrolment 182<br />
environmental education 301<br />
gender disparity 262, 280<br />
HIV education 292<br />
out-of-school children 181, 182<br />
population growth 21<br />
primary education 153, 182, 183, 187, 262, 331<br />
private education 187<br />
repetition rate 183<br />
school completion 154, 156<br />
secondary education 153, 153, 154, 155, 156,<br />
182, 262, 331<br />
teacher education 331, 335<br />
tertiary education 229<br />
TVET enrolment 223<br />
under-5 mortality rate 156<br />
universal primary <strong>and</strong> secondary education<br />
153, 153, 154, 155, 156<br />
youth literacy 280<br />
Cayman Isl<strong>and</strong>s<br />
ICT facilities in schools 313, 314<br />
Ceará Multi-Sector Inclusion Development<br />
Project (Brazil) 144<br />
CEDAW 265<br />
Central Africa<br />
adolescent birth rate 370<br />
educational attainment 370<br />
under-5 mortality rate 371<br />
see also individual countries<br />
Central African Republic<br />
child development 219<br />
early childhood care <strong>and</strong> education 210<br />
education expenditure 347<br />
educational attainment 74, 75, 76, 186<br />
electricity provision 312, 312<br />
ethnic minorities 75, 76<br />
gender disparity 74, 76<br />
HIV education 292<br />
home learning environment 215<br />
literacy 219, 281<br />
numeracy 219<br />
out-of-school children 183<br />
primary education 183, 186, 312<br />
school completion 186<br />
secondary education 183, 186, 312<br />
students abroad 323<br />
tertiary education 231<br />
within country disparity 76, 186, 210, 231<br />
years of education 186<br />
Central Asia<br />
adult literacy 280<br />
with Caucasus, countries listed 398<br />
education aid 354<br />
education expenditure 346, 346<br />
educational attainment 60<br />
employment 60<br />
environmental education 301<br />
gender disparity 60, 262, 280<br />
504<br />
ANNEX | INDEX
HIV education 292<br />
NGOs 211<br />
out-of-school children 181, 182<br />
population growth 21<br />
primary education 153, 182, 183, 187, 262, 331<br />
private education 187<br />
repetition rate 183<br />
school completion 154, 156<br />
secondary education 153, 153, 154, 155, 156,<br />
182, 262, 331<br />
teacher education 331<br />
tertiary education 229<br />
textbooks 190<br />
TVET enrolment 223<br />
under-5 mortality rate 156<br />
universal primary <strong>and</strong> secondary education<br />
153, 153, 154, 155, 156<br />
youth literacy 280<br />
see also individual countries<br />
Centre for Disaster Mitigation (Indonesia) 310<br />
Centre for Research <strong>and</strong> Development of<br />
Structures <strong>and</strong> Construction<br />
Materials (CIDEM) (Cuba) 42<br />
CGS-LTA scheme (Nigeria) 141<br />
Chad<br />
basic education 138, 138, 139<br />
child development 219<br />
education aid 138, 138, 139<br />
education expenditure 347<br />
educational attainment 74, 74, 186<br />
enrolment 106<br />
female literacy 83<br />
gender disparity 74, 74<br />
HIV education 292<br />
home learning environment 215<br />
literacy 83, 202, 219, 281<br />
mathematics achievement 202<br />
national assessments 202<br />
numeracy 219<br />
pre-primary education 209<br />
primary education 106, 138, 186<br />
reading proficiency 202<br />
refugees 106, 272<br />
school completion 138, 186<br />
secondary education 106, 186<br />
students abroad 323<br />
tertiary education 231<br />
textbooks 189, 190<br />
under-5 mortality rate 83<br />
within country disparity 186, 231<br />
years of education 186<br />
youth literacy 280<br />
Chevening Scholarships 321<br />
child development<br />
‘developmentally on track’ concept 214<br />
influences 215<br />
measurement tools 217–218, 217–219, 218, 219<br />
monitoring at population level 213–214<br />
self-control 249–250<br />
skills <strong>and</strong> competencies 216<br />
child-friendly environments 308–317<br />
child labour<br />
affected by natural disaster 310<br />
increase due to electrification 86<br />
child marriage, not addressed in school curricula<br />
291<br />
child mortality<br />
reduction through improved maternal<br />
education 82–83, 155, 156, 370–371,<br />
371<br />
see also under-5 mortality<br />
Child-Parent Centers (Chicago) 120<br />
child soldiers, forced recruitment 105<br />
childcare see early childhood care <strong>and</strong> education;<br />
mothers; parents; pre-primary<br />
education<br />
childhood employment see child labour<br />
childhood obesity 79, 80<br />
children with disabilities see <strong>people</strong> with<br />
disabilities<br />
Chile<br />
access to education 122<br />
buen vivir approach 27<br />
childhood obesity 80<br />
digital literacy skills 247, 247<br />
education expenditure 234<br />
educational attainment 75<br />
environmental education 301<br />
gender disparity 75, 230<br />
gender equality initiatives 92<br />
global citizenship education 294<br />
household expenditure 234<br />
human rights education 290, 300<br />
ICT facilities 314<br />
inequality in education 123<br />
language of instruction 269<br />
literacy 282<br />
m participatory budgeting 92<br />
mathematics achievement 109, 194, 195<br />
migration 271<br />
multicultural attitudes 304<br />
national assessments 199<br />
pre-primary education 338<br />
primary education 186, 195, 314, 338<br />
private education 123, 233<br />
psychological bullying in schools 315<br />
quality of education 122<br />
reading proficiency 195<br />
research <strong>and</strong> development expenditure 273<br />
school completion 186<br />
secondary education 186, 314, 335, 338, 338<br />
socio-economic background <strong>and</strong><br />
perseverance 249<br />
student support 234<br />
sustainable living 27<br />
teacher education 332, 332, 335<br />
teacher salaries 338, 338<br />
tertiary education 228, 230, 233, 234, 234<br />
violence in schools 109, 315<br />
within country disparities 247<br />
women in politics 71<br />
China<br />
agriculture 47<br />
childhood obesity 79<br />
climate change 44<br />
computer access 245, 313<br />
discrimination against marginalized groups<br />
123<br />
early childhood development 217<br />
ecological footprint 21<br />
economic growth 49, 118<br />
education aid donor<br />
educational attainment 57, 58, 75, 101, 186<br />
employment 49, 58, 119, 120<br />
employment skills 59<br />
gender disparity 75, 230<br />
green economy 40<br />
health <strong>and</strong> nutrition programmes 78, 79<br />
income inequality 52<br />
linguistic diversity 268<br />
natural disasters 310<br />
peaceful civil movements 101<br />
population growth 21<br />
poverty 52, 57<br />
primary education 186, 330<br />
Project Atlas on students abroad 324<br />
qualified teachers 330<br />
renewable energy 40<br />
rural areas 313–314, 330<br />
rural-urban migration 116, 117, 117, 271<br />
scholarship aid 324, 324<br />
school completion 186<br />
secondary education 186<br />
social skills 250<br />
student outcomes assessment 236<br />
teacher deployment 330<br />
tertiary education 59, 229, 230, 231, 272<br />
TVET enrolment 223, 224<br />
university ranking system 235<br />
within country disparity 186, 231<br />
women in politics 71<br />
years of education 186<br />
CIDEM 42<br />
cities<br />
concentration of central facilities 122, 123<br />
effects of education 115, 118–121<br />
incorporation of SDGs into plans 141<br />
leadership 128<br />
wealth disparities 121–122, 122, 124<br />
see also urban entries; urbanization<br />
Citizen Security Survey (Caribbean) 316<br />
citizen-led learning assessments 196, 201<br />
citizenship education 289–290, 290, 292–296,<br />
293, 294, 295, 296<br />
see also civic education<br />
Citizenship Education Longitudinal Study (UK)<br />
299<br />
city centres, concentration of facilities 122, 123<br />
city-level leadership 128<br />
civic education 98, 100–101<br />
civil society, multisectoral approaches 163<br />
Civil Society Education Fund 145<br />
civil society organizations (CSOs)<br />
attitude to early grade assessment 194–195<br />
auditing of facilities for <strong>people</strong> with<br />
disabilities 311<br />
human rights education monitoring 290<br />
role in SDG agenda 145, 166<br />
CLASS 212<br />
class sizes 328–329, 330<br />
Classroom Assessment Scoring System (CLASS)<br />
212<br />
classroom construction <strong>and</strong> rebuilding 310<br />
classroom environment see learning<br />
environments<br />
classroom experience, <strong>and</strong> teacher induction<br />
programmes 335, 335<br />
classroom observations 191–193, 192, 265, 298<br />
climate change<br />
agricultural models for 46<br />
city-level leadership 128<br />
combating essential for SDGs 10<br />
community education 27–29, 34, 35<br />
disaster preparedness 34, 157<br />
education level <strong>and</strong> knowledge of problem<br />
25<br />
educational approach 10, 32–35, 33, 34, 35,<br />
164<br />
effects 7, 32, 33, 40, 44, 70, 310<br />
fossil fuel subsidy removal 136<br />
public concerns 304<br />
summits, agreements <strong>and</strong> groups 28, 32, 128<br />
<strong>and</strong> urban consumption 120<br />
see also natural disasters<br />
CLTS, sanitation programme 93<br />
coalitions see informal coalitions; partnerships<br />
cognitive skills 244–250, 248<br />
see also ICT skills; literacy; numeracy<br />
collaboration skills 248<br />
Colombia<br />
attacks on schools 317<br />
crime rate 120, 128<br />
ecological footprint 23<br />
education planning 141–142<br />
education system review 364<br />
educational attainment 57, 58, 58, 60, 74, 81,<br />
120, 186<br />
electricity provision 313<br />
employment 58, 58, 60, 89<br />
employment skills 59<br />
environmental education 26, 301<br />
financial literacy 251, 251<br />
gender disparity 74, 89, 230<br />
human rights education 300<br />
instructional teaching time 191<br />
integrated programmes 141<br />
internet access 313<br />
intimate partner violence 81<br />
learning cities 126, 127–128, 128<br />
literacy 195, 245, 281, 282<br />
management information system 232<br />
mathematics achievement 195<br />
multicultural attitudes 304<br />
national assessments 200<br />
national development plans 141<br />
2016 • GLOBAL EDUCATION MONITORING REPORT 505
out-of-school civic activities 26<br />
parent governors 294<br />
primary education 186, 195, 329<br />
private education 233<br />
psychological bullying in schools 315<br />
pupil/teacher ratio <strong>and</strong> class size 329<br />
reading proficiency 195, 245<br />
school completion 186<br />
secondary education 186<br />
socio-economic background 60, 249<br />
sustainable living 27, 28<br />
tertiary education 59, 229, 229, 230, 231, 232,<br />
232, 233<br />
TVET participation 224, 226<br />
under-5 mortality rate 371<br />
violence in schools 315<br />
within country disparity 186, 231<br />
working poverty 57, 60<br />
years of education 186<br />
Commission on the Status of Women 265<br />
Commonwealth, qualification frameworks 227<br />
Commonwealth Scholarship 321<br />
community cohesion see desegregation;<br />
integrated approaches<br />
community education<br />
on environment <strong>and</strong> climate change 27–29,<br />
34, 35<br />
legal rights programmes 110<br />
community health workers 85, 372<br />
community knowledge 27–29, 30<br />
community ownership projects 93<br />
community-led total sanitation (CLTS)<br />
programme 93<br />
Comoros<br />
educational attainment 74, 81, 186<br />
electricity provision 312<br />
gender disparity 74, 75<br />
gender-based violence 109<br />
HIV education 292<br />
intimate partner violence 81<br />
literacy 75, 281<br />
primary education 186, 312<br />
rural areas 75<br />
school completion 186<br />
secondary education 186, 312<br />
students abroad 322<br />
tertiary education 228, 229, 231<br />
within country disparity 186, 231<br />
years of education 186<br />
comparative education monitoring 184–185<br />
completion rates see school completion<br />
composition effect (education expansion) 54<br />
Comprehensive Safe Schools Self-Assessment<br />
Suite 310<br />
comprehensive sexuality education 291–292, 292<br />
training for teachers 297<br />
see also family planning advice; sexual <strong>and</strong><br />
reproductive health education<br />
compression effect (education expansion) 54<br />
compulsory education<br />
<strong>and</strong> conflict 104<br />
effect on crime 120<br />
years of education 185, 187<br />
see also free <strong>and</strong>/or compulsory education;<br />
universal primary education;<br />
universal secondary education<br />
computer literacy 92<br />
computer programming skills 246<br />
computer to pupil ratios 312–313, 314<br />
concentration index, in inequality measurement<br />
258, 258<br />
Concepción metropolitan area (Chile), education<br />
inequality 122<br />
Conditional Grant Scheme to Local Government<br />
Areas (Nigeria) 141<br />
conflict<br />
destruction of education facilities 105<br />
over language of instruction 104<br />
<strong>and</strong> poverty 103<br />
relationship with education 103–109, 166<br />
see also peacebuilding<br />
conflict-affected areas<br />
countries listed 399<br />
Education Cannot Wait fund 147<br />
out-of-school children 104–105, 105, 182–183<br />
refugees 117<br />
schools 105, 106–107<br />
see also internally displaced persons;<br />
refugees<br />
Congo<br />
child development 219<br />
educational attainment 74, 186<br />
gender disparity 74, 74, 75<br />
home learning environment 215<br />
literacy 74, 75, 202, 219, 281<br />
literacy programme participation 278<br />
mathematics achievement 202<br />
national assessments 202<br />
numeracy 202, 219<br />
pre-primary education 209<br />
primary education completion 186<br />
reading proficiency 202<br />
rural areas 74, 75<br />
secondary education completion 186<br />
students abroad 323<br />
tertiary education 231<br />
textbooks 190<br />
within country disparity 186, 231<br />
years of education 186<br />
Congo, Democratic Republic see Democratic<br />
Republic of the Congo<br />
construction industry, green development 41,<br />
42<br />
construction of schools see school buildings;<br />
school construction<br />
consumer goods, change for sustainability 31<br />
consumption of world resources, inequality 3,<br />
21, 22–23, 22, 23, 24, 120, 157, 162<br />
Convention on the Elimination of All Forms<br />
of Discrimination against Women<br />
(CEDAW) 265<br />
Convention on the Rights of Persons with<br />
Disabilities 2006 265<br />
Cook Isl<strong>and</strong>s<br />
students abroad 322<br />
violence in schools 316<br />
coordinating mechanisms for education system<br />
data 365<br />
corporal punishment 108, 316<br />
corporate initiatives<br />
for environmental education 30<br />
sustainable finance 43<br />
see also large businesses<br />
Costa Rica<br />
child development 217, 219<br />
early childhood care <strong>and</strong> education 210<br />
education expenditure 347<br />
educational attainment 74, 186<br />
electricity provision 312<br />
gender disparity 74<br />
home learning environment 215<br />
ICT facilities 314<br />
literacy 195, 219, 281<br />
numeracy 195, 219<br />
pre-primary education 208, 209, 338<br />
pre-primary enrolment 208<br />
primary education 186, 195, 312, 314, 338<br />
psychological bullying in schools 315<br />
reading proficiency 195<br />
school completion 186<br />
secondary education 186, 312, 314, 338<br />
socio-economic background <strong>and</strong><br />
perseverance 249<br />
teacher salaries 338<br />
tertiary education 229, 231<br />
violence in schools 315, 316<br />
within country disparity 186, 210<br />
years of education 186<br />
costs of education see education expenditure;<br />
household expenditure on education<br />
Côte d’Ivoire<br />
attacks on schools 317<br />
educational attainment 74, 81, 82, 186, 371<br />
electricity provision 312<br />
female genital mutilation 82<br />
female literacy 83<br />
gender disparity 74<br />
global citizenship education 294<br />
HIV education 292, 292<br />
human rights education 290<br />
intimate partner violence 81<br />
literacy 83, 202, 281<br />
malaria prevalence 371<br />
mathematics achievement 202<br />
national assessments 202<br />
national education accounts 343, 344, 344,<br />
345<br />
political participation 100<br />
primary education 186, 312, 330, 335<br />
reading proficiency 202<br />
school completion 186<br />
secondary education 186, 312<br />
students abroad 323<br />
teacher education 330, 335<br />
tertiary education 231<br />
textbooks 190<br />
under-5 mortality rate 83<br />
within country disparity 186, 231<br />
years of education 186<br />
Council of Europe Charter on Education for<br />
Democratic Citizenship <strong>and</strong> Human<br />
Rights Education 294<br />
creativity 248<br />
crime<br />
<strong>and</strong> divided cities 122<br />
<strong>and</strong> educational attainment 108, 120<br />
effect on school participation 123<br />
integrated city initiatives 127–128, 128<br />
role of education in reduction 120<br />
crisis areas<br />
Education Cannot Wait fund 147<br />
see also conflict-affected areas; disasters<br />
critical thinking 248, 303, 303<br />
Croatia<br />
digital literacy skills 247<br />
education expenditure 233<br />
environmental education 301<br />
financial literacy 251<br />
gender disparity 230<br />
gendered attitudes 264<br />
global citizenship education 294<br />
HIV education 292<br />
household expenditure 233<br />
ICT facilities 314<br />
primary education 187, 314<br />
professional development of teachers 336<br />
school completion 187<br />
secondary education 187, 314<br />
socio-economic background <strong>and</strong><br />
perseverance 249<br />
student support 233<br />
tertiary education 229, 230, 233<br />
cross-country opinion surveys 304<br />
CSOs see civil society organizations (CSOs)<br />
Cuba<br />
child development 219<br />
disaster preparedness 34<br />
ecological footprint 23<br />
green technology 272<br />
home learning environment 215<br />
ICT facilities 313, 314<br />
literacy <strong>and</strong> numeracy 219<br />
primary education 313, 314<br />
secondary education 313, 314<br />
students abroad 322<br />
sustainability 22<br />
tertiary education 228, 231<br />
cultural contexts<br />
in child development measurement 216<br />
<strong>and</strong> non-cognitive skills needed 248<br />
social skills 250<br />
cultural heritage<br />
loss through education bias 77<br />
506<br />
ANNEX | INDEX
see also traditional knowledge<br />
Curaçao, ICT facilities in schools 313<br />
Curitiba (Brazil), green city initiative 126–127, 127<br />
curricula see school curricula<br />
Cyberabad Development Authority (India) 119<br />
cyberbullying 315<br />
cycling, for urban sustainability 121<br />
cyclones 33, 310<br />
Cyprus<br />
adult education 238<br />
civic education 100<br />
education expenditure 233, 234<br />
household expenditure 233<br />
human rights education 300<br />
ICT facilities 314<br />
political participation 100<br />
primary education 187, 314<br />
school completion 187<br />
secondary education 187, 238, 314<br />
socio-economic background <strong>and</strong><br />
perseverance 249<br />
special educational needs 266<br />
student support 233, 234<br />
tertiary education 229, 231, 233, 234, 238<br />
Czech Republic<br />
adult education 238<br />
civic education 100<br />
digital literacy skills 247, 247<br />
early childhood care <strong>and</strong> education 331<br />
education expenditure 233<br />
environmental education 301<br />
financial literacy 251<br />
gender disparity 230<br />
HIV education 292<br />
household expenditure 233<br />
human rights education 300<br />
language of instruction 269<br />
literacy 282<br />
political participation 100<br />
primary education completion 187<br />
secondary education completion 187, 238<br />
socio-economic background <strong>and</strong><br />
perseverance 249<br />
special educational needs 266<br />
student support 233<br />
teacher contracts 336<br />
teacher education 331, 336<br />
tertiary education 228, 229, 230, 233, 238<br />
D<br />
Dalit children 108<br />
Dalit populations 68, 73<br />
data needs for education monitoring 383<br />
debt relief, application of aid to achieve MDGs<br />
141<br />
decent work<br />
defined 55–56, 55, 244, 245<br />
<strong>and</strong> educational attainment 58, 58, 88<br />
see also employment; employment skills<br />
Deer Leap programme (Georgia) 313<br />
deforestation 45<br />
management by traditional communities 28<br />
democracies, regime change 101<br />
democracy, importance of education 101<br />
Democracy for All programme (South Africa) 102<br />
Democratic People’s Republic of Korea<br />
home learning environment 215<br />
literacy, numeracy <strong>and</strong> child development<br />
219<br />
Democratic Republic of the Congo<br />
agriculture 47<br />
attacks on schools 317<br />
child development 219<br />
civic education 98<br />
early childhood care <strong>and</strong> education 213, 213<br />
education expenditure 347<br />
educational attainment 74, 186, 371<br />
electricity provision 29–30, 86, 312<br />
equity improvement 352<br />
gender disparity 74, 74, 75<br />
gendered attitudes 264<br />
global citizenship education 290, 294<br />
HIV education 292<br />
home learning environment 215<br />
internally displaced persons 272<br />
literacy 74, 75, 219, 281<br />
literacy programme participation 278<br />
malaria prevalence 371<br />
numeracy 219<br />
out-of-school children 182<br />
political participation 98<br />
pre-primary education 209<br />
primary education 182, 186, 312<br />
rural areas 74, 75<br />
school completion 186<br />
school curriculum 290<br />
secondary education 186, 312<br />
solar lighting project 29–30<br />
students abroad 323<br />
teaching methods 191<br />
tertiary education 231<br />
underweight children 80<br />
within country disparity 186, 231<br />
years of education 186<br />
Demographic <strong>and</strong> Health Survey (DHS) 263, 277<br />
Denmark<br />
adult education 238<br />
aid donor 137<br />
civic education 100<br />
education expenditure 233<br />
environmental concern 304<br />
environmental education 301<br />
gender disparity 230<br />
household expenditure 233<br />
human rights education 297, 300<br />
ICT facilities 314<br />
language of instruction 269<br />
literacy 282<br />
political participation 71, 100<br />
primary education 186, 314<br />
school completion 186<br />
scientific researchers 372<br />
secondary education 186, 238, 314, 338<br />
socio-economic background <strong>and</strong><br />
perseverance 249<br />
special educational needs 266<br />
student support 233<br />
sustainable transport 121<br />
teacher education 297<br />
teacher salaries 337, 338<br />
teacher skills 333<br />
teaching methods 298<br />
tertiary education 228, 229, 230, 232, 233, 238<br />
women in politics 71<br />
deprivation see extreme poverty; inequality;<br />
marginalization; poverty; wealth<br />
disparities<br />
desegregation of schools 123–124<br />
see also integrated schools<br />
deskilling of migrants 117–118<br />
developed countries<br />
employment <strong>and</strong> education 57<br />
ethnic immigrant enclaves 124<br />
food waste 45<br />
gender disparity 60<br />
listed 398<br />
scholarship funding beneficiaries 320<br />
water <strong>and</strong> sanitation provision 309<br />
see also advanced economies; high income<br />
countries; OECD countries<br />
developing countries<br />
economic growth 40<br />
effect of educational attainment 55–56<br />
employment 51, 56, 119–120<br />
food waste 45<br />
gender disparity 60<br />
green industry development 41<br />
ICT facilities 313<br />
informal employment 119–120<br />
listed 398<br />
manufacturing 51<br />
scholarships 323<br />
‘split site’ university education 321<br />
students abroad 322, 322<br />
tax revenue 135<br />
teacher training requirements 333<br />
technological transfer 42–43<br />
tertiary education <strong>and</strong> political activism 100<br />
urban planning 125<br />
voter education campaigns 98, 99<br />
water <strong>and</strong> sanitation provision 309, 372<br />
working poverty 52<br />
see also emerging economies; least<br />
developed countries; low income<br />
countries; middle income countries;<br />
poorer countries; small isl<strong>and</strong><br />
developing States<br />
deworming campaigns 79, 85, 140, 140<br />
DHS (Demographic <strong>and</strong> Health Survey) 263, 277<br />
difficulties category, OECD special needs<br />
monitoring 266<br />
digital literacy skills 246–247, 247<br />
adaptation of monitoring to digital<br />
development 247<br />
see also ICT skills<br />
disabilities category, OECD special needs<br />
monitoring 266<br />
disability see <strong>people</strong> with disabilities<br />
disadvantages category, OECD special needs<br />
monitoring 266<br />
disasters<br />
disaster preparedness 34, 157<br />
GEM policy recommendations 164<br />
risk reduction through education 157<br />
see also conflict; conflict-affected areas;<br />
natural disasters<br />
discrimination<br />
against girls in education 87, 87<br />
against marginalized groups 72–73, 123<br />
by teachers 123<br />
elimination for social development 68<br />
gender-biases legislation 87, 89<br />
see also gender disparity; prejudice;<br />
stereotyping<br />
disease<br />
from poor sanitation <strong>and</strong> hygiene 68<br />
malaria reduction 371<br />
disparity see gender disparity; inequality; parity<br />
index<br />
displaced persons<br />
due to conflict 106<br />
urban populations 117<br />
see also internally displaced persons;<br />
refugees<br />
Displacement Tracking Matrix of the<br />
International Organization for<br />
Migration 272<br />
distance learning 232–233, 321, 322<br />
Djibouti<br />
educational attainment 74<br />
gender disparity 74<br />
global citizenship education 294<br />
HIV education 292<br />
out-of-school children 183<br />
primary education 183, 335<br />
secondary education 183<br />
students abroad 323<br />
teacher education 335, 336<br />
doctor/patient relationships, effect of education<br />
78<br />
domestic abuse see intimate partner violence<br />
domestic expenditure on education see<br />
education expenditure; public<br />
education expenditure<br />
domestic resources for education 135–137<br />
support from development aid 137–138<br />
domestic violence see intimate partner violence<br />
domestic workers<br />
in economy 120<br />
unpaid workers 89, 89<br />
2016 • GLOBAL EDUCATION MONITORING REPORT 507
Dominica<br />
electricity provision 313<br />
global citizenship education 294<br />
HIV education 292<br />
ICT facilities <strong>and</strong> internet access 313, 314<br />
primary education 313, 314<br />
secondary education 313, 314<br />
violence in schools 316<br />
Dominican Republic<br />
child development 219<br />
civic education 100<br />
disaster risk education 34<br />
early childhood care <strong>and</strong> education 210<br />
ecological footprint 23<br />
education system reviews 364<br />
educational attainment 74, 81, 186<br />
environmental education 26<br />
gender disparity 74, 75<br />
global citizenship education 294<br />
HIV education 292<br />
home learning environment 215<br />
human rights education 300, 300<br />
intimate partner violence 81<br />
literacy 75, 195, 219, 281<br />
mathematics achievement 194, 195<br />
multicultural attitudes 304<br />
national assessments 199<br />
numeracy 194, 195, 219<br />
out-of-school civic activities 26<br />
political participation 100<br />
pre-primary education 209, 338, 338<br />
primary education 186, 195, 338, 338<br />
psychological bullying in schools 315, 315<br />
reading proficiency 195<br />
rural areas 75<br />
school completion 186<br />
secondary education 186, 338, 338<br />
teacher salaries 338, 338<br />
tertiary education 229, 231<br />
violence in schools 315, 315<br />
within country disparity 186, 210, 231<br />
years of education 186<br />
donors<br />
accessed by Education Cannot Wait<br />
Breakthrough Fund 147<br />
agenda in allocating aid 138, 139, 139<br />
aid disbursements to low income countries<br />
355<br />
aid for learning assessment systems 201<br />
aid for teacher training 333<br />
aid to basic <strong>and</strong> secondary education<br />
352–353, 353<br />
development aid 137<br />
failure in allocation 388<br />
policy coherence for development 143–144<br />
see also multilateral aid; OECD, Development<br />
Assistance Committee<br />
dropout see out-of-school children; school<br />
completion; school dropout<br />
E<br />
EAP-CDS 217, 217–218, 218<br />
early childhood care <strong>and</strong> education 85, 120<br />
access <strong>and</strong> participation 206–210, 207, 208,<br />
209, 210<br />
aid provision programmes 138–139, 139<br />
child development outcomes 213–219, 215,<br />
217–218, 218, 219<br />
global <strong>and</strong> thematic indicators 205<br />
home environment 197, 214, 215, 215<br />
integration of programme delivery 143<br />
investment in 165<br />
monitoring 213, 377<br />
quality of provision 210–213<br />
trained staff 331<br />
see also pre-primary education<br />
Early Childhood Development Index (ECDI)<br />
217–218, 218<br />
Early Childhood Environment Rating Scale<br />
(ECERS) 212<br />
Early Grade Math Assessment (EGMA) 195, 201<br />
Early Grade Reading Assessment (EGRA) 195,<br />
196, 201<br />
earmarked finance for education 136<br />
earnings<br />
<strong>and</strong> educational attainment 57–59, 88<br />
integrated interventions 92<br />
teacher salaries 337–339, 338<br />
Earth Summits 5<br />
earthquakes 33, 310<br />
East Asia Pacific Child Development Scales (EAP-<br />
CDS) 217, 217–218, 218<br />
Eastern Africa see Southern <strong>and</strong> Eastern Africa<br />
Eastern Africa<br />
adolescent birth rate 370<br />
educational attainment 370<br />
Eastern Asia<br />
adolescent birth rate 370<br />
adult literacy 280<br />
agriculture 45<br />
discrimination of marginalized groups 73<br />
early childhood care <strong>and</strong> education 212<br />
ecological footprint 21<br />
economic growth 49<br />
education aid 354<br />
education expenditure 346<br />
educational attainment 48, 86, 370<br />
electricity provision 86<br />
environmental education 301<br />
gender disparity 259, 260, 262, 280<br />
global citizenship education 295<br />
HIV education 292<br />
literacy 280<br />
out-of-school children 182, 182<br />
population growth 21<br />
pre-primary enrolment 207<br />
primary education 153, 182, 260, 262<br />
quality of education 49<br />
school completion 154, 156, 259, 260<br />
secondary education 153, 154, 155, 156, 182,<br />
182, 259, 260, 262<br />
sexuality education 291<br />
with South-eastern Asia, countries listed<br />
398<br />
teacher education 296<br />
teaching methods 102, 298<br />
tertiary education 229<br />
under-5 mortality rate 156, 371<br />
universal primary <strong>and</strong> secondary education<br />
153, 154, 155, 156<br />
wealth disparities 260<br />
youth literacy 280<br />
see also individual countries<br />
Eastern Europe<br />
deskilling of women migrants to EU<br />
countries 117–118<br />
educational attainment 60<br />
employment 60, 117–118<br />
gender disparity 60<br />
teacher education 335<br />
tertiary education 231<br />
TVET enrolment 223<br />
see also individual countries<br />
Ebola crisis, management 372<br />
ECDI 217–218, 218<br />
ECERS 212<br />
ecological footprint<br />
<strong>and</strong> human development/lifestyle 21, 22–23,<br />
22, 23<br />
whole school approach 27<br />
economic growth<br />
agricultural improvements 44–47<br />
effect of secondary school completion 120<br />
<strong>and</strong> environmental damage 40<br />
<strong>and</strong> environmental sustainability 39<br />
<strong>and</strong> extreme poverty decline 52<br />
global 161–162<br />
green industry 40–44<br />
importance of lifelong learning 48–52<br />
<strong>and</strong> inclusive society 39–40, 53–62<br />
<strong>and</strong> internal migration 117<br />
knowledge economy 124<br />
<strong>and</strong> prosperity 51–53<br />
urban areas 118–119<br />
see also agriculture; business; industry<br />
economic instability, public concerns 304<br />
economic models, for 21st Century 53<br />
Ecuador<br />
buen vivir approach 4, 27<br />
childhood obesity 80<br />
early childhood care <strong>and</strong> education 212<br />
educational attainment 75, 186<br />
electricity provision 312, 313<br />
gender disparity 75<br />
HIV education 292<br />
ICT facilities 314<br />
internet access 313<br />
mathematics achievement 195<br />
national assessments 200<br />
pre-primary education 338<br />
pre-primary enrolment 208<br />
primary education 186, 195, 312, 314, 338<br />
psychological bullying in schools 315<br />
reading proficiency 195<br />
school completion 186<br />
secondary education 186, 312, 314, 338<br />
sustainable living 27, 28<br />
teacher salaries 338<br />
tertiary education 231<br />
TVET enrolment 223<br />
violence in schools 315<br />
within country disparity 186, 231<br />
years of education 186<br />
educated populations, impact on rest of world<br />
157, 162<br />
education<br />
aid see education aid main entry<br />
<strong>and</strong> behavioural change 87<br />
<strong>and</strong> conflict 103–109, 166<br />
cross-sector delivery <strong>and</strong> funding 143, 163,<br />
167<br />
<strong>and</strong> decent work opportunities 55, 56<br />
effect on cities 115, 118–121, 121–124<br />
effect on doctor/patient relationships 78<br />
effect on gender disparity 80–82<br />
expansion 54, 55, 162<br />
factors limiting progress 162<br />
financing 133–139<br />
<strong>and</strong> green energy choices 78, 88<br />
health care benefits 84–85<br />
for inclusion 53–62<br />
<strong>and</strong> inequality 53–62, 103, 121–124<br />
integrated interventions see deworming<br />
campaigns; sanitation, schemes;<br />
school meals<br />
intra-urban disparity 121–122, 122<br />
local government disengagement 129, 129<br />
national qualifications frameworks 142, 227<br />
in other SDGs 367–373, 379, 388<br />
<strong>and</strong> participatory politics 97–102, 99<br />
for peace 107–108<br />
prioritised by MyWorld survey respondents<br />
6<br />
relationship with climate change 157<br />
right to 8<br />
role in health care 77–80, 82–84<br />
role in justice system 110–111<br />
role in social development 67, 77–84<br />
role in sustainability 11, 11, 24, 25–26, 25, 26,<br />
44, 46, 61, 78, 115, 164, 165, 378<br />
rural-urban disparity 121–122, 122<br />
SDG structures 146<br />
<strong>and</strong> self-control development 250<br />
transformative effect 162, 163<br />
for urban planning 115, 125–126, 166<br />
see also early childhood care <strong>and</strong><br />
education; education aid; education<br />
expenditure; pre-primary education;<br />
primary education; school entries;<br />
secondary education; tertiary<br />
508<br />
ANNEX | INDEX
education<br />
Education 2030 Framework for Action<br />
adoption 7, 180<br />
co-ordination structures 146<br />
domestic education finance 135<br />
guiding principle of gender equality 264<br />
need for motivated teachers 333<br />
private sector finance 146<br />
role 386<br />
education aid 137–139, 138, 139<br />
defined 404<br />
delivery channels 355<br />
dependent on learning improvements 201<br />
disbursements 141, 354<br />
donors see donors main entry<br />
expected effect of GEM reporting 388<br />
failure to target greatest needs 138, 138, 139<br />
humanitarian aid 356, 356–357<br />
for integrated projects 140–141<br />
international NGOs 145<br />
partnerships 146–147, 167<br />
private sector funding 145–146, 167<br />
for scholarships 324–325, 324<br />
share of total aid 353<br />
for teacher training 333<br />
Education for All see EFA<br />
Education Blueprint 2013-25 (Malaysia) 142<br />
Education Cannot Wait fund 147<br />
education costs 233, 233, 342, 344, 352, 356–357,<br />
381<br />
education expansion<br />
aim of quality 162<br />
for climate change 33<br />
composition <strong>and</strong> compression effects 55<br />
<strong>and</strong> SDG 4 151<br />
education expenditure<br />
adult education 239<br />
decentralization (Colombia) 141–142<br />
Education 2030 Framework<br />
recommendations 135<br />
failure of governments on target 388<br />
funding shares 345, 346, 346, 347, 347, 348,<br />
348, 349<br />
global indicator 368<br />
low to middle income countries 136, 136<br />
missing data 344, 347, 348, 349<br />
monitoring 379, 381<br />
tertiary education 233, 233<br />
education level see educational attainment<br />
education management information systems<br />
231, 232, 380<br />
education planning 116–118, 166, 167<br />
education policies<br />
integrated multi-sector approaches 139–143,<br />
140<br />
reviews 364<br />
education systems<br />
21st Century employment requirements 52<br />
curricula 77, 79, 104, 107<br />
see also school curricula<br />
data collection tools 350<br />
early childhood care <strong>and</strong> education quality<br />
213, 213<br />
effect of violent attacks 317<br />
failure of resource allocation 388<br />
monitoring 361–363, 363–365, 379, 381<br />
see also national learning assessments<br />
need for flexible skills 49, 51<br />
SABER approach 362<br />
see also quality of education; school<br />
infrastructure<br />
Education <strong>and</strong> Training Sector Strategy<br />
(Democratic Republic of the Congo)<br />
352<br />
educational achievement, impact of conflict 104<br />
educational attainment<br />
<strong>and</strong> adult education participation 238, 238<br />
conflict risk 103<br />
effect of education level 120, 186<br />
effect of electrification 86<br />
effect on higher levels of education 152<br />
emphasis in SDGs 184<br />
<strong>and</strong> employment 55, 57–60, 58, 59, 81,<br />
88–89, 89, 101<br />
<strong>and</strong> fertility rate reduction 85<br />
gender disparity 60, 61, 74, 74–75, 88–89,<br />
139, 152, 257, 259<br />
health programme benefits 77, 85<br />
immigrants 271<br />
integrated interventions for achievement<br />
125<br />
<strong>and</strong> intimate partner violence reduction<br />
81, 81<br />
<strong>and</strong> literacy rates 280<br />
marginalized groups 73–76, 74–75, 76, 124<br />
mothers 82–84<br />
<strong>and</strong> payment of taxes 135<br />
<strong>and</strong> political activism 98, 99, 100, 101–102<br />
at primary level 46, 83, 186<br />
projections to 2030 <strong>and</strong> beyond 151–153, 152,<br />
152, 153<br />
relationship with other development<br />
outcomes 9–10, 369–370, 370<br />
relationship with sustainability 10, 162<br />
<strong>and</strong> school meal programmes 79<br />
tertiary education 228–230, 229, 230–231<br />
<strong>and</strong> under-5 mortality 82, 155, 156, 370–371,<br />
371<br />
wealth disparities 73–75, 185, 186, 230, 231<br />
years of education 74, 74–75, 76, 185, 186<br />
see also learning outcomes; mathematics<br />
achievement; reading proficiency<br />
educational facilities<br />
destruction in conflict 105<br />
see also school buildings; school construction<br />
educational outcomes see learning outcomes<br />
EFA Fast Track Initiative see Global Partnership<br />
for Education<br />
EFA Global Monitoring Report<br />
goals 180–181<br />
role 387<br />
EFA goals, scope <strong>and</strong> differences from SDGs<br />
180–181<br />
EGMA 195, 201<br />
EGRA (Early Grade Reading Assessment) 195,<br />
196, 201<br />
Egypt<br />
adaption to climate change 10<br />
adolescent birth rate 370<br />
agriculture 34<br />
childhood obesity 80<br />
educational attainment 10, 75, 82, 186, 370<br />
electricity provision 313<br />
female genital mutilation 82<br />
gender disparity 75, 230<br />
health <strong>and</strong> nutrition programmes 80<br />
ICT facilities 313, 314<br />
ICT skills 246<br />
internet access 313<br />
linguistic diversity 268<br />
literacy 281<br />
primary education 106, 106, 186, 313, 314<br />
refugees 106, 106<br />
rural areas 122<br />
school completion 186<br />
secondary education 106, 186, 313, 314<br />
sexual <strong>and</strong> reproductive health interventions<br />
80<br />
teacher education 336<br />
tertiary education 228, 229, 230, 231<br />
TVET 224, 224, 225<br />
under-5 mortality rate 371<br />
urban areas 122<br />
violence in schools 316<br />
wealth disparities 122<br />
within country disparity 186, 231<br />
women in politics 99<br />
years of education 186<br />
El Salvador<br />
child development 219<br />
early childhood care <strong>and</strong> education 210<br />
educational attainment 86<br />
electricity provision 86, 312, 313<br />
female literacy 83<br />
gender disparity 230<br />
global citizenship education 294<br />
HIV education 292<br />
home learning environment 215<br />
ICT facilities 314<br />
internet access 313<br />
literacy 83<br />
literacy <strong>and</strong> numeracy 219<br />
pre-primary education 209, 338<br />
primary education 312, 314, 338<br />
secondary education 312, 314, 338<br />
teacher salaries 338<br />
tertiary education 228, 229, 230<br />
under-5 mortality rate 83<br />
within country disparity 210<br />
electoral participation 98–99<br />
electricity provision 69<br />
effects 86<br />
<strong>and</strong> ICT facilities 312, 312–313<br />
integrated approach 141<br />
emergency contexts see conflict; conflictaffected<br />
areas; disasters<br />
emerging economies<br />
dem<strong>and</strong> for agriculture 45<br />
educational attainment <strong>and</strong> employment 56<br />
manufacturing employment 51<br />
tax revenue 135<br />
see also developing countries<br />
emotional abuse 82, 109, 315, 315<br />
employment<br />
in agriculture 45–46<br />
attitudes of women as gender equality<br />
indicator 264, 264<br />
discrimination against marginalized groups<br />
72–73<br />
<strong>and</strong> educational attainment 55–56, 57–60,<br />
58, 59, 81, 88, 89, 101<br />
effect of school health campaigns 85<br />
gender disparity 56, 60, 69, 69–70, 70, 71, 88,<br />
89, 89, 120<br />
green industries 40, 41<br />
<strong>and</strong> non-cognitive skills 248<br />
<strong>and</strong> optimal skill levels 248<br />
polarization of skills 49–51, 50<br />
<strong>and</strong> quality of education 56<br />
reducing impact of technological change 164<br />
teacher contracts 336–337, 336<br />
trends 49<br />
underemployment of migrant skills 117<br />
vulnerable <strong>and</strong> informal work 57, 58, 58<br />
women 56, 57, 60, 61, 69–70, 70, 81, 88, 89,<br />
89, 165<br />
youth global indicator 369<br />
see also employment skills; unemployment;<br />
workers; workplace-based TVET<br />
employment regulation, benefits to women 61<br />
employment skills<br />
for agriculture 46<br />
<strong>and</strong> decent work 55<br />
<strong>and</strong> educational attainment 59<br />
for green economy 41–42, 42, 61–62, 162,<br />
165, 292<br />
migrants deskilled 117–118<br />
monitoring 377<br />
polarization of jobs 49–51, 50<br />
training for migrants 117<br />
TVET programme 142<br />
see also skills for decent work<br />
ENADE (Exame Nacional de Desempenho dos<br />
Estudantes) (Brazil) 236<br />
energy<br />
education for green energy use 78, 88<br />
provision to communities 68, 86<br />
religious energy reduction initiative 30<br />
solar energy initiatives 29–30, 31–32<br />
engineering, impact of female teachers on<br />
girls 91<br />
Engl<strong>and</strong><br />
crime 120<br />
2016 • GLOBAL EDUCATION MONITORING REPORT 509
extracurricular activity participation 299<br />
global citizenship education <strong>and</strong> knowledge<br />
300, 300<br />
intimate partner violence 82<br />
national surveys 299<br />
special educational needs 266, 266<br />
whole school environmental approach 26, 27<br />
enrolment<br />
effects in conflict-affected areas 104, 106<br />
effects of electricity provision 86<br />
government approaches to gender disparity<br />
139<br />
internally displaced children 272<br />
private education share 187<br />
refugees 117, 272–273<br />
tertiary education 228, 228, 229, 230, 230–231<br />
TVET 223–224, 223<br />
see also primary education, enrolment;<br />
secondary education, enrolment<br />
entrepreneurship skills 252, 252<br />
environment<br />
attitudes towards 26, 304<br />
challenges <strong>and</strong> crises 20–23, 20, 21, 22<br />
<strong>and</strong> damaging economies 40<br />
decreasing concern 304<br />
effect on agriculture 44–45<br />
link between public awareness <strong>and</strong><br />
educational attainment 10<br />
world summits 5<br />
see also climate change; environmental<br />
education<br />
environmental education 25, 25<br />
extracurricular activities 299<br />
knowledge assessments 301, 301<br />
teacher education 297<br />
textbook content 295, 296<br />
through community learning 27–29<br />
through formal schooling 24–27, 25<br />
through lifelong learning 29–32<br />
use of internet 31<br />
whole school approach 26–27, 294<br />
see also nature conservation education;<br />
sustainable development, role of<br />
education<br />
environmental/genetic effects on development<br />
214<br />
Equatorial Guinea<br />
income level 354<br />
out-of-school children 183<br />
equity<br />
in public expenditure 350–352, 351, 352<br />
SDG Target !4.5 7, 256, 378<br />
in sustainable agenda 4<br />
use of management information systems<br />
380<br />
see also discrimination; gender disparity;<br />
gender equality; inequality; justice;<br />
<strong>people</strong> with disabilities; socioeconomic<br />
background; wealth<br />
disparities; within country disparities<br />
Eritrea<br />
ecological footprint 22, 22<br />
electricity provision 312<br />
HIV education 292<br />
out-of-school children 183<br />
primary education 183, 312<br />
secondary education 183, 312<br />
students abroad 323<br />
teacher training 333<br />
tertiary education 228, 228<br />
Estonia<br />
adult education 238<br />
educational attainment 88<br />
employment <strong>and</strong> earnings 70, 88<br />
environmental education 25, 301, 301<br />
financial literacy 251, 251<br />
gender disparity 70, 88<br />
global citizenship education 294, 297, 300<br />
ICT facilities 314<br />
literacy 282<br />
primary education 187, 314<br />
pupil/teacher ratio <strong>and</strong> class size 329<br />
school completion 187<br />
secondary education 187, 238, 314, 329, 334<br />
socio-economic background <strong>and</strong><br />
perseverance 249<br />
special educational needs 266, 266<br />
teacher education 297, 334<br />
tertiary education 229, 231, 238<br />
Ethiopia<br />
adolescent birth rate 370<br />
agriculture 34, 46<br />
climate change adaptation 10<br />
education aid 355<br />
education expenditure 136, 136, 143, 347<br />
education plans 143<br />
educational attainment 10, 74, 74, 82, 86,<br />
186, 370<br />
electricity provision 86<br />
employment 140<br />
fertility rate 84<br />
gender disparity 74, 74, 75<br />
global citizenship knowledge 303<br />
health <strong>and</strong> nutrition programmes 78, 292<br />
integrated programmes 140<br />
learning cities 126<br />
literacy 75, 281<br />
literacy programme participation 277, 278<br />
nomad-specific education plans 9<br />
out-of-school children 183<br />
primary education 84, 106, 183, 186<br />
refugees 106<br />
rural areas 75<br />
school completion 186<br />
school-based interventions 78<br />
secondary education 106, 183, 186<br />
sexuality education 292, 297<br />
solar lighting project 29, 30<br />
students abroad 323<br />
teacher education 297<br />
teaching methods 102, 192<br />
tertiary education 231<br />
textbooks 189<br />
underweight children 80<br />
within country disparity 186, 231<br />
women <strong>and</strong> politics 82<br />
years of education 186<br />
ethnic minority groups<br />
<strong>and</strong> conflict 101, 103<br />
educational disparities 75, 76, 103<br />
educational level <strong>and</strong> non-violent protest 101<br />
marginalization 73, 76, 76<br />
segregated education 106–107, 123–124<br />
trained teacher allocation shortage 332<br />
see also immigrants; indigenous <strong>people</strong>s;<br />
migrants<br />
EU see European Union<br />
Europe<br />
adult literacy 280<br />
agriculture 45<br />
discrimination of marginalized groups 73<br />
early childhood care <strong>and</strong> education 212<br />
ecological footprint 22<br />
education aid 354<br />
education expenditure 233, 346, 346, 350<br />
educational attainment 74<br />
employment 49<br />
entrepreneurship skills 252<br />
environmental education 301<br />
equity improvement 350<br />
ethnic minority groups 73, 124, 267<br />
gender disparity 74, 260, 262, 280<br />
global citizenship education <strong>and</strong> knowledge<br />
290, 294, 295, 300<br />
HIV education 292<br />
human rights education 295<br />
immigrants 267<br />
knowledge economies 124<br />
migration 271<br />
NGOs 211<br />
with Northern America, countries listed 398<br />
out-of-school children 182<br />
population growth 21<br />
pre-primary enrolment 207<br />
primary education 153, 182, 260, 262<br />
school completion 154, 156, 260<br />
school curriculum 290<br />
school textbooks 295<br />
secondary education 153, 153, 154, 155, 156,<br />
182, 260, 262<br />
segregation 123<br />
tertiary education 53–54, 101, 229, 233<br />
under-5 mortality rate 156<br />
universal primary <strong>and</strong> secondary education<br />
153, 153, 154, 155, 156<br />
wealth disparities 260<br />
youth literacy 280<br />
see also Eastern Europe; European Union;<br />
Western Europe; individual countries<br />
Europe 2000 363<br />
European Social Survey 304<br />
European Union<br />
adult education 237, 238<br />
education aid donor 355<br />
education strategy 382<br />
environmental campaigns 31<br />
extracurricular activities 299<br />
formal <strong>and</strong> informal education rates 237<br />
gender disparity 230<br />
green industry 40<br />
ICT skills 246, 246<br />
NEET rates 369<br />
qualifications 227<br />
tertiary education 230, 363<br />
unemployment 56<br />
upper secondary school completion 152<br />
European Union (EU)<br />
bee campaign 31<br />
educational attainment <strong>and</strong> employment 56<br />
Eurydice Network on Education Systems<br />
<strong>and</strong> Policies 363<br />
Policy Coherence for Development Tool 143<br />
qualification frameworks 227<br />
recycling of waste 40<br />
Eurydice Network on Education Systems <strong>and</strong><br />
Policies 363<br />
Exame Nacional de Desempenho dos<br />
Estudantes (ENADE) (Brazil) 236<br />
exclusion see access to education; discrimination;<br />
ethnic minority groups; gender<br />
disparity; inclusive education;<br />
inequality; marginalization; wealth<br />
disparities<br />
executive function development 216, 218<br />
extracurricular activities 298–299<br />
see also out-of-school civic activities<br />
extreme climate events, disaster preparedness<br />
157<br />
extreme poverty<br />
<strong>and</strong> conflict 97, 104<br />
effect of education expansion 156–157<br />
effect of literacy 53<br />
populations 52<br />
family planning advice 24, 84<br />
see also sexual <strong>and</strong> reproductive health<br />
education<br />
FAO 253<br />
farmer field schools 46<br />
farmers/farming see agriculture<br />
fathers<br />
Men Care parenting campaign 92<br />
see also parents<br />
feeding programmes 78–79, 85, 140, 140<br />
fees for education<br />
TVET 226<br />
see also grants; household expenditure on<br />
education; scholarships; students,<br />
financial assistance<br />
female genital mutilation 71<br />
effect of education 81, 82<br />
fertility rate, reduction 83<br />
F<br />
510<br />
ANNEX | INDEX
Fiji<br />
TVET enrolment 223<br />
violence in schools 316<br />
finance, GDP for SDGs 133<br />
finance for education<br />
aid expenditure 352–356<br />
domestic resources 135–137<br />
grants 226, 239–240, 355<br />
household expenditure 233, 233, 342, 344,<br />
352, 356–357, 381<br />
monitoring 379, 381<br />
need for global information 342<br />
NGOs 344, 345<br />
public expenditure 346–352<br />
sources <strong>and</strong> uses 343<br />
see also education aid; education<br />
expenditure; fees; funding;<br />
scholarships<br />
financial capability 251<br />
financial literacy 250–251, 251<br />
financial management information systems<br />
349–350<br />
financing for development<br />
development aid 137–139<br />
domestic resources for education 135–137<br />
financing gap 134<br />
policy coherence in aid agencies 143–145<br />
role of partnerships 145–147<br />
financing gap, education 134, 352<br />
Finl<strong>and</strong><br />
adult education 238, 238<br />
early childhood care <strong>and</strong> education 212<br />
ecological footprint 23<br />
employment 89<br />
environmental education 301, 301<br />
ethnic minorities 75<br />
gender disparity 230<br />
gender disparity <strong>and</strong> equality 70, 89<br />
health <strong>and</strong> nutrition programmes 79<br />
HIV education 292<br />
human rights education 300, 300<br />
ICT facilities 314<br />
ICT skills 246, 246<br />
literacy 282<br />
primary education 187, 314<br />
school completion 187<br />
secondary education 187, 238, 314, 334<br />
socio-economic background <strong>and</strong><br />
perseverance 249<br />
special educational needs 266<br />
student outcomes assessment 236<br />
sustainability initiatives 273<br />
teacher education 334, 336<br />
tertiary education 228, 229, 230, 232, 238<br />
women in politics 70<br />
floating schools (Bangladesh) 33<br />
Focusing Resources on Effective School health<br />
(FRESH), international organisation<br />
intervention 140<br />
Food <strong>and</strong> Agriculture Organization 253<br />
food consumption, effect of changing patterns<br />
45<br />
food prices, increase 45<br />
food waste 45<br />
forced sexual acts 109<br />
see also gender-based violence<br />
forcibly displaced persons 117<br />
see also internally displaced persons;<br />
refugees<br />
foreign languages<br />
assessment 199, 199<br />
see also language of instruction; mother<br />
tongue<br />
foreign students, scholarships for 321<br />
formal education<br />
adult education 238, 238<br />
combating climate change 33<br />
description 8, 236<br />
impact on loss of indigenous knowledge 29<br />
role in sustainability 24–27, 25, 33<br />
see also compulsory education; primary<br />
education; secondary education;<br />
technical <strong>and</strong> vocational education<br />
<strong>and</strong> training (TVET); tertiary<br />
education<br />
former Yugoslav Republic of Macedonia, The<br />
child development 219<br />
early childhood care <strong>and</strong> education 210<br />
educational attainment 57, 58, 75, 110, 186<br />
employment 58<br />
employment skills 59<br />
gender disparity 75<br />
home learning environment 215<br />
justice system 110<br />
literacy 219, 281<br />
mathematics achievement 109<br />
numeracy 219<br />
pre-primary education 209<br />
primary education 187, 335<br />
school completion 187<br />
secondary education 187<br />
teacher induction 335<br />
tertiary education 59, 229, 230, 231, 231<br />
violence in schools 109<br />
within country disparity 186, 210, 231<br />
working poverty 57<br />
years of education 186<br />
formula funding, for equity 351<br />
Forum on China-Africa Cooperation 324<br />
fossil fuel subsidies, removal in favour of<br />
education expenditure 136<br />
France<br />
adoption of Education 2030 Framework for<br />
Action (Paris) 7<br />
adult education 238, 239<br />
education aid donor 355<br />
education expenditure 233<br />
environmental education 301<br />
financial literacy 251<br />
gender disparity 230<br />
global citizenship education 294<br />
household expenditure 233<br />
ICT facilities 314<br />
literacy 59, 282<br />
multicultural attitudes 304<br />
numeracy 283, 284<br />
primary education 187, 314<br />
professional development of teachers 336<br />
Project Atlas on students abroad 324<br />
scholarship aid 324<br />
school completion 187<br />
secondary education 187, 238, 314, 338<br />
socio-economic background <strong>and</strong><br />
perseverance 249<br />
special educational needs 266<br />
student support 233<br />
sustainable transport 121<br />
teacher earnings gap 338<br />
teacher skills 333<br />
tertiary education 229, 230, 231, 233, 238<br />
within country disparity 231<br />
women in politics 71<br />
free <strong>and</strong>/or compulsory education<br />
pre-primary 206, 207<br />
primary education 185<br />
see also compulsory education; household<br />
expenditure on education<br />
FRESH (Focusing Resources on Effective School<br />
health), international organisation<br />
intervention 140<br />
Fulbright programme 321<br />
functional literacy 277, 278, 279<br />
Functional Literacy Programme for Women <strong>and</strong><br />
Girls (Niger) 279<br />
funding<br />
multisectoral approaches for education<br />
143, 163<br />
for national assessments 200<br />
private sector 145–146, 167<br />
for research 43, 47, 164, 372<br />
tertiary, adult <strong>and</strong> TVET education 225–226,<br />
233–234, 233, 234, 239–240, 377<br />
see also finance for education; financing for<br />
development<br />
G<br />
Gabon<br />
educational attainment 74, 81, 186<br />
gender disparity 74, 75<br />
intimate partner violence 81<br />
language of instruction 270<br />
literacy 75, 281<br />
primary education 186<br />
rural areas 75<br />
school completion 186<br />
secondary education 186<br />
within country disparity 186<br />
years of education 186<br />
Gambia<br />
child development 219<br />
early childhood care <strong>and</strong> education 210,<br />
213, 213<br />
educational attainment 74, 81, 82, 186<br />
electricity provision 312, 313<br />
female genital mutilation 82<br />
gender disparity 74, 75<br />
global citizenship education 294<br />
home learning environment 215<br />
human rights education 297<br />
ICT facilities 314<br />
internet access 313<br />
intimate partner violence 81<br />
literacy 75, 219, 281<br />
numeracy 219<br />
pre-primary education 209<br />
primary education 186, 312, 314<br />
rural areas 75<br />
school completion 186<br />
secondary education 186, 312, 314<br />
teacher education 297, 333<br />
tertiary education 231<br />
within country disparity 186, 210, 231<br />
years of education 186<br />
gang membership, in schools 316<br />
gated communities/cities 122<br />
Gates Foundation, integrated aid for local<br />
agriculture 140<br />
GCPEA 317<br />
GDP (gross domestic product)<br />
education finance 135, 344, 346, 346, 347, 348,<br />
348, 349<br />
global 7, 118, 133<br />
gender-based violence 72, 90, 109<br />
see also intimate partner violence<br />
gender bias reduction 91–92<br />
gender disparity 230<br />
agricultural training 46<br />
attitudes <strong>and</strong> norms 264–265, 264<br />
<strong>and</strong> conflict 104<br />
<strong>and</strong> discriminatory legislation 86–87, 89<br />
educational attainment 60, 61, 74, 75, 87, 87,<br />
88, 104, 257, 259<br />
projections 152<br />
employment 56, 60, 69, 69–70, 70, 71, 88,<br />
89, 89, 120<br />
equity programmes 352<br />
government awareness of contributory<br />
factors 139<br />
literacy 60, 74, 75, 120, 278, 279, 280<br />
literacy programme participation by adults<br />
278, 279, 279<br />
marginalized groups 73, 75, 76<br />
out-of-school children 180–181, 181, 182,<br />
259, 260<br />
over-age children in education 183, 184<br />
<strong>and</strong> parental attitudes 90<br />
primary education 182, 183, 184, 184, 185, 259,<br />
260, 262, 262<br />
<strong>and</strong> progress towards equality 69–72, 70,<br />
71, 91–92<br />
role of education 80–82<br />
school completion 104, 165, 259, 259, 260<br />
secondary education 183, 184, 185, 259, 259,<br />
260, 262, 262<br />
<strong>and</strong> success of scholarship programmes 98<br />
tertiary education 229–230, 229, 230–231<br />
2016 • GLOBAL EDUCATION MONITORING REPORT 511
TVET programmes 223<br />
<strong>and</strong> wealth disparity 259<br />
within country disparities 74, 74–75, 75<br />
working poverty 60<br />
gender equality<br />
attitude measurement 303–304<br />
domains for monitoring <strong>and</strong> improvement<br />
264, 266<br />
education 91–92, 165, 293, 293, 296<br />
effect of school-based health interventions<br />
80<br />
gender bias reduction 91–92<br />
global indicator 368–369<br />
holistic view 72<br />
integrated interventions 92<br />
limitations of education impact 88–90<br />
measurement 264–265<br />
prerequisite for social development 68<br />
progress <strong>and</strong> disparity 69–72, 70, 71<br />
in school curricula 293, 293<br />
<strong>and</strong> success of scholarship programmes 98<br />
textbook content 296<br />
gender parity index (GPI) 76<br />
genetic/environmental effects on development<br />
214<br />
Georg Eckert Institute for International Textbook<br />
Research 290<br />
Georgia<br />
ecological footprint 23<br />
education expenditure 347<br />
education funding 351<br />
educational attainment 57, 58, 75<br />
electricity provision <strong>and</strong> internet access 313<br />
employment 58, 89<br />
employment skills 59<br />
equity improvement 351<br />
gender disparity 75, 89, 230<br />
ICT facilities <strong>and</strong> internet access 313, 313<br />
literacy 282<br />
primary education 187, 313<br />
school completion 187<br />
secondary education 187, 313<br />
sustainability 22<br />
teacher induction 335<br />
teacher skills 333<br />
tertiary education 59, 229, 230<br />
working poverty 57<br />
Germany<br />
adult education 238, 239, 239<br />
digital literacy skills 247<br />
early childhood care <strong>and</strong> education 212<br />
education aid donor 324, 355<br />
employment 270<br />
employment skills 59<br />
environmental education 301<br />
global citizenship knowledge 303<br />
green economy 270<br />
green energy 31<br />
integrated interventions 125<br />
literacy 282<br />
policy coherence 143<br />
primary education completion 187<br />
Project Atlas on students abroad 324<br />
secondary education 187, 238<br />
socio-economic background <strong>and</strong><br />
perseverance 249<br />
special educational needs 266, 266<br />
sustainability initiatives 31, 121, 273<br />
teacher shortages 331–332<br />
tertiary education 59, 228, 231, 238<br />
urban planning 125, 126<br />
within country disparity 231<br />
women in politics 71<br />
Ghana<br />
adaption to climate change 10<br />
adolescent birth rate 370<br />
agriculture 34<br />
child development 219<br />
educational attainment 10, 57, 58, 60, 61, 74,<br />
75, 76, 81, 82, 186, 370, 371<br />
electricity provision 312<br />
employment <strong>and</strong> earnings 58, 59, 60, 61, 89,<br />
140, 245<br />
employment skills 59<br />
ethnic minorities 75, 76<br />
female genital mutilation 82<br />
gender disparity 60, 61, 74, 76, 89, 183, 184,<br />
230<br />
global citizenship education 294<br />
health interventions 85, 372<br />
HIV education 292<br />
home learning environment 215, 215<br />
integrated programmes 140, 144<br />
intimate partner violence 81<br />
literacy 59, 196, 219, 245, 281, 282<br />
literacy programme participation 278<br />
malaria prevalence 371<br />
mathematics achievement 109<br />
national assessments 199<br />
numeracy 109, 219<br />
over-age children 183, 184<br />
political participation 99, 100, 101–102<br />
pre-primary education 209<br />
primary education 184, 186, 196, 312<br />
psychological bullying in schools 315<br />
reading proficiency 196, 245<br />
school completion 186<br />
secondary education 184, 186, 312<br />
socio-economic disadvantage 60<br />
students abroad 323<br />
tertiary education 59, 101–102, 228, 229,<br />
230, 231<br />
textbooks 189<br />
violence in schools 109, 109, 315<br />
water <strong>and</strong> sanitation programmes 85, 372<br />
within country disparity 76, 184, 186, 231<br />
women in politics 99<br />
working poverty 57, 60, 61<br />
years of education 186<br />
Gini index 52, 53<br />
girls<br />
disaster preparedness 33<br />
discrimination in education 87, 87<br />
educational attainment <strong>and</strong> earnings 88<br />
effect of female role models 91<br />
literacy 74, 75, 279, 280, 280<br />
marriage 291<br />
mathematics participation 91, 165, 265<br />
menstrual hygiene programmes 80<br />
multiple disadvantage 75<br />
out-of-school 180–181, 181, 182<br />
over-age children in education 183, 184<br />
political participation 98<br />
scholarship programmes 98<br />
school completion 104<br />
school participation 73, 74, 109<br />
sexual abuse of 109<br />
water <strong>and</strong> sanitation programme benefits<br />
10, 80, 308<br />
see also gender disparity; gender equality;<br />
women<br />
Global Alliance for Disaster Risk Reduction <strong>and</strong><br />
Resilience in the Education Sector<br />
310<br />
Global Campaign for Education 145<br />
global citizenship<br />
global <strong>and</strong> thematic indicators 287<br />
in school curricula 293, 293, 294<br />
school textbook content 294–296, 295, 296<br />
training for teachers 296–298<br />
see also gender equality; human rights;<br />
peacebuilding; sustainable<br />
development<br />
Global Coalition to Protect Education from<br />
Attack (GCPEA) 317<br />
Global Database on the Right to Education 361<br />
global economy<br />
wealth disparity 161–162<br />
see also economic growth; green economy<br />
Global Education Monitoring Report<br />
aims 387–388<br />
guide to report 12–15<br />
policy recommendations 165–167<br />
role in monitoring SDGs 183–184<br />
see also SDG 4; Sustainable Development<br />
Goals<br />
Global Entrepreneurship Monitor 252<br />
Global Facility for Disaster Reduction <strong>and</strong><br />
Recovery, guidelines 310<br />
global GDP 7, 118, 133<br />
Global Geographic Literacy Survey 302–303<br />
Global Guidelines Assessment 212<br />
global indicators 379, 395–397<br />
adoption of 181<br />
early childhood care <strong>and</strong> education 205<br />
for education in other SDGs 367–373<br />
education systems 307, 359<br />
equity 255<br />
literacy <strong>and</strong> numeracy 275, 276<br />
primary <strong>and</strong> secondary education 179<br />
scholarships 319<br />
skills for work 243<br />
sustainable development <strong>and</strong> global<br />
citizenship 287, 288<br />
teachers 327, 330<br />
technical, vocational <strong>and</strong> adult education<br />
221, 222, 236, 239<br />
Global Initiative to End All Corporal Punishment<br />
of Children 316<br />
Global Network of Learning Cities (UNESCO) 126<br />
Global Partnership for Education (GPE) 146–147<br />
Assessment for Learning initiative 201<br />
disbursements of aid 201, 355<br />
gender equality collaborations 265<br />
Literacy <strong>and</strong> Numeracy Education Support<br />
programme 201<br />
global population see population growth<br />
Global Programme for Safer Schools 310<br />
Global Report on Adult Learning <strong>and</strong> Education<br />
(GRALE) 239, 240, 241, 277<br />
Global School-based Student Health Survey<br />
315–316<br />
governance<br />
importance of good governance 4<br />
incorporation into SDGs 7<br />
Government Spending Watch (Oxfam) 350<br />
governments<br />
expenditure see public expenditure<br />
planning 116–118, 166, 167<br />
see also donors<br />
GPE see Global Partnership for Education<br />
GPI 76<br />
Graça Machel SASOL Scholarships 321<br />
grade repetition 183, 310<br />
graduate deficit (tertiary education) 50<br />
graduates<br />
<strong>and</strong> education-based segregation in cities<br />
124<br />
enrolment ratio 229–230, 229, 230–231<br />
necessary for city competitiveness 119<br />
percentage of population 228, 229<br />
graduation 228–230, 228, 229, 230–231, 232<br />
GRALE 239, 240, 241, 277<br />
grants for education 226, 239–240, 352, 355<br />
Greece<br />
adult education 238<br />
early childhood care <strong>and</strong> education 212<br />
education funding 350<br />
environmental education 301<br />
HIV education 292<br />
human rights education 300<br />
ICT facilities 314<br />
ICT skills 246<br />
literacy 282<br />
primary education 187, 314, 329<br />
pupil/teacher ratio <strong>and</strong> class size 329<br />
school completion 187<br />
secondary education 187, 238, 314<br />
socio-economic background <strong>and</strong><br />
perseverance 249<br />
special educational needs 266<br />
teacher education 336<br />
tertiary education 231, 238<br />
women in politics 71<br />
green economy<br />
green industries 40–43, 42, 61–62<br />
512<br />
ANNEX | INDEX
ole of education 61, 78, 88, 165<br />
green energy<br />
consumer initiatives 31<br />
education for 35, 78, 88<br />
renewable sources 35, 40–41<br />
solar lighting initiatives 29–30<br />
green industries 40–43, 42, 61–62<br />
green revolution 44<br />
Grenada<br />
electricity provision 313<br />
global citizenship education 294<br />
HIV education 292<br />
ICT facilities <strong>and</strong> internet access 313<br />
primary education 313<br />
secondary education 313<br />
Grenadines see Saint Vincent <strong>and</strong> the Grenadines<br />
Grit Scale 248–249<br />
gross domestic product(GDP) see GDP<br />
gross enrolment ratio<br />
pre-primary education 207, 208<br />
tertiary education 228, 229, 230–231<br />
gross intake rate, survival to final grade 184<br />
Gruma populations, educational attainment<br />
75, 76<br />
Guatemala<br />
child health 82<br />
climate change 34<br />
conflict 104, 105<br />
curriculum 107<br />
early childhood care <strong>and</strong> education 212<br />
education expenditure 347<br />
educational attainment 74, 76, 105, 186<br />
electricity provision 313<br />
environmental education 26<br />
ethnic minorities 76, 102, 105<br />
gender disparity 74, 76<br />
global citizenship education 294, 300<br />
HIV education 292<br />
human rights education 300<br />
indigenous <strong>people</strong>s 102, 105<br />
internet access 313<br />
language of instruction 104, 270<br />
literacy 82, 195<br />
mathematics achievement 195<br />
multicultural attitudes 304<br />
national assessments 200<br />
natural disasters 33<br />
out-of-school civic activities 26<br />
political participation 102<br />
primary education 34, 186, 195<br />
psychological bullying in schools 315<br />
reading proficiency 195<br />
rural areas 102<br />
school completion 34, 186<br />
school construction 310<br />
secondary education 34, 186<br />
teaching methods 102, 107<br />
tertiary education 231<br />
violence in schools 315<br />
within country disparity 76, 186, 231<br />
years of education 186<br />
Guinea<br />
agriculture 136<br />
computer/pupil ratio 313, 314<br />
discrimination <strong>and</strong> secondary completion 87<br />
early childhood care <strong>and</strong> education 213, 213<br />
education expenditure 136, 347<br />
educational attainment 74, 82, 186, 280, 371<br />
electricity provision 312, 313<br />
female genital mutilation 82<br />
gender disparity 74, 74, 75, 87<br />
HIV education 292<br />
ICT facilities 314<br />
internet access 313<br />
literacy 74, 75, 281<br />
literacy programme participation 278<br />
malaria prevalence 371<br />
national education accounts 343<br />
out-of-school children 183<br />
primary education 183, 186, 280, 312, 314<br />
rural areas 74, 75<br />
school completion 87, 186<br />
secondary education 87, 183, 186, 312, 314<br />
tertiary education 228, 231<br />
under-5 mortality rate 370, 371<br />
within country disparity 186, 231<br />
years of education 186<br />
youth literacy 280<br />
Guinea-Bissau<br />
child development 219<br />
early childhood care <strong>and</strong> education 210<br />
home learning environment 215<br />
literacy <strong>and</strong> numeracy 219<br />
primary education 335<br />
teacher induction 335<br />
within country disparity 210<br />
Guyana<br />
child development 219<br />
early childhood care <strong>and</strong> education 210<br />
education expenditure 136<br />
educational attainment 74, 186<br />
gender disparity 74<br />
home learning environment 215<br />
literacy 195, 196, 219, 281<br />
literacy programme participation 278<br />
numeracy 219<br />
pre-primary education 209<br />
primary education 186, 196, 335<br />
reading proficiency 195, 196<br />
school completion 186<br />
secondary education 186<br />
students abroad 322<br />
teacher induction 335<br />
tertiary education 231<br />
within country disparity 186, 210, 231<br />
years of education 186<br />
H<br />
Haiti<br />
basic education 138<br />
climate change 34<br />
disaster preparedness 34<br />
education aid 138<br />
educational attainment 74, 81, 186<br />
gender disparity 74, 75<br />
global citizenship education 294<br />
HIV education 292<br />
integrated programmes 140<br />
intimate partner violence 81<br />
late entry into primary education 183<br />
literacy 75, 281<br />
literacy programme participation 278<br />
natural disasters 33, 310<br />
over-age children 183, 184<br />
police training 110–111<br />
primary education 34, 183, 184, 186<br />
rural areas 75<br />
school completion 34, 186<br />
school health programmes 140<br />
secondary education 34, 184, 186<br />
tertiary education 231<br />
underweight children 80<br />
within country disparity 184, 186, 231<br />
years of education 186<br />
‘h<strong>and</strong>print’ programme (India) 26<br />
h<strong>and</strong>washing facilities 308, 309<br />
Harlem Children’s Zone (United States) 125<br />
Haussa populations, educational attainment<br />
75, 76<br />
heads of schools, preparation <strong>and</strong> training 332,<br />
332<br />
Health Behaviour in School-Aged Children<br />
Survey 315<br />
health care<br />
aid 137, 138<br />
capacity building for crises 372<br />
community health workers 85, 372<br />
domestic resource mobilization 138<br />
effect of improvement 78, 84–85<br />
integrated approaches 77–80, 82–84, 85,<br />
140, 140, 141<br />
multistakeholder finance partnerships 147<br />
national health accounts for financing 343,<br />
345<br />
need for improved maternity provision 72<br />
role of education 77–80, 87–88<br />
school-based interventions 78–80, 85, 140,<br />
140<br />
see also sanitation; water provision<br />
health education 79, 165<br />
HIV/AIDS 79, 85, 87, 291, 292, 297<br />
need for educational campaigns 373<br />
sex education 79, 140<br />
health professionals, global employment 372<br />
Herzegovina see Bosnia <strong>and</strong> Herzegovina<br />
high income countries<br />
basic skills for economic growth 49<br />
child mortality rate 83<br />
childhood obesity 79, 80<br />
countries listed 399–400<br />
early childhood education quality 211<br />
ecological footprint 19, 21–22<br />
education aid disbursements 354<br />
education expenditure 136, 136, 234, 234,<br />
239, 346, 346, 349<br />
education outcomes 68, 69<br />
educational attainment 59, 59, 75<br />
employment 49, 53, 53, 59, 59, 81<br />
gender disparity 81, 259, 262<br />
government incapacity for urban planning<br />
129<br />
gross intake rate 184<br />
health interventions 69<br />
household expenditure on education 234,<br />
234<br />
income inequality 53, 81<br />
intimate partner violence 82<br />
literacy 280<br />
literacy monitoring 280<br />
marginalized groups 75<br />
migrants 21, 271<br />
occupation <strong>and</strong> earnings 59<br />
out-of-school children 259<br />
parental gender attitudes 90<br />
population growth 20, 116<br />
primary completion rate 69, 184<br />
primary education 185, 259, 262<br />
pupil/teacher ratio <strong>and</strong> class size 328, 329<br />
school completion 184, 185, 185, 259<br />
school meal policies 79<br />
secondary education 182, 182, 183, 184, 185,<br />
185, 259, 262<br />
teacher attrition 339<br />
tertiary education 229, 232, 234<br />
under-5 mortality 69<br />
wealth disparities 259<br />
working poverty 52<br />
High Level Political Forums (HLPF) 2016 <strong>and</strong><br />
2019 182, 386–387, 388<br />
high skilled employment<br />
definition 50<br />
<strong>and</strong> educational level 59–60, 59<br />
effect on higher education 41<br />
green industry needs 41, 42, 292<br />
High-Level Political Forum on Sustainable<br />
Development 182<br />
higher education<br />
<strong>and</strong> adolescent birth rate 370, 370<br />
disbursement of aid to scholarships abroad<br />
325, 325<br />
<strong>and</strong> gender-based violence 81, 82<br />
human rights education 290<br />
<strong>and</strong> knowledge of justice 110<br />
need to produce innovators 42<br />
scholarships 320–325<br />
see also post-secondary education; technical<br />
<strong>and</strong> vocational education <strong>and</strong><br />
training (TVET); tertiary education<br />
Higher Education for Sustainable Development<br />
initiative 27<br />
history teaching, post conflict 107<br />
HIV education 79, 87, 291, 292, 297<br />
see also AIDS epidemic<br />
2016 • GLOBAL EDUCATION MONITORING REPORT 513
HLPFs (High Level Political Forums) 182, 386–<br />
387, 388<br />
Holocaust education 290<br />
home environment, effect on development 197,<br />
214, 215, 215<br />
home language see language of instruction;<br />
mother tongue; mother tongue<br />
instruction<br />
home-based workers 120<br />
see also own-account employment (selfemployment)<br />
Honduras<br />
climate change 34<br />
educational attainment 81, 86, 186<br />
electricity provision 86<br />
employment 140<br />
gender disparity 75, 230<br />
global citizenship education 294<br />
HIV education 292<br />
human rights education 297<br />
instructional teaching time 191<br />
integrated programmes 140<br />
intimate partner violence 81<br />
literacy 75, 195, 281<br />
literacy programme participation 277, 278<br />
mathematics achievement 195<br />
natural disasters 33<br />
pre-primary education 338<br />
pre-primary enrolment 208<br />
primary education 34, 186, 195, 261, 261, 338<br />
psychological bullying in schools 315<br />
reading proficiency 195<br />
rural areas 75, 122<br />
school completion 34, 186, 261, 261<br />
secondary education 34, 186, 338<br />
teacher education 297<br />
teacher salaries 338<br />
tertiary education 228, 229, 230, 231<br />
urban areas 122<br />
violence in schools 315, 316<br />
wealth disparities 122<br />
within country disparity 186, 231<br />
years of education 186<br />
Hong Kong, China<br />
educational attainment 76<br />
electricity provision <strong>and</strong> internet access in<br />
schools 312, 313<br />
environmental education 301<br />
ethnic minorities 76<br />
socio-economic background <strong>and</strong><br />
perseverance 249<br />
household expenditure on education 233, 233,<br />
342, 344, 352, 356–357, 381<br />
household survey data<br />
access to education 181<br />
adult education 237<br />
expenditure 356–357<br />
Inter-Agency Group on Education Inequality<br />
Indicators 263<br />
international programme 382<br />
late entry <strong>and</strong> over-age in education 183<br />
literacy information 277–278, 278, 279,<br />
280–281, 280<br />
pre-primary education 209<br />
primary completion rate 263, 263<br />
private education 187<br />
as relative wealth indicator 257<br />
school completion 184, 185, 263, 263<br />
TVET reporting needs 225<br />
UNICEF MIC surveys 196, 197, 208, 209, 215,<br />
219, 257, 263, 278, 280<br />
HRLS (BRAC) (Bangladesh) 110<br />
human potential, GEM policy recommendations<br />
165<br />
human rights<br />
assessments on knowledge 300, 300<br />
education 289–290, 290, 295<br />
extracurricular activities 299<br />
monitoring 289–290, 290, 297, 300, 300<br />
teacher education 296–297<br />
Human Rights <strong>and</strong> Legal Aid Services (HRLS)<br />
(BRAC) (Bangladesh) 110<br />
humanitarian aid 356, 356–357<br />
Hungary<br />
adult education 238<br />
earnings 88<br />
education funding 350<br />
educational attainment 88<br />
environmental education 301<br />
financial literacy 250<br />
gender disparity 88, 230<br />
global citizenship education 294<br />
ICT facilities 314<br />
language of instruction 269<br />
mathematics achievement 109<br />
primary education 187, 314, 329<br />
pupil/teacher ratio <strong>and</strong> class size 329<br />
school completion 187<br />
secondary education 187, 238, 314<br />
socio-economic background <strong>and</strong><br />
perseverance 249<br />
special educational needs 266<br />
teacher education 336<br />
teacher salaries 337<br />
tertiary education 228, 229, 230, 231, 238<br />
violence in schools 109<br />
within country disparity 231<br />
hydro-electrification 86<br />
hygiene<br />
education 79–80, 88<br />
h<strong>and</strong>washing facilities 308, 309<br />
I<br />
ICCS 26, 100, 293–294, 298, 299, 300, 303–304<br />
Icel<strong>and</strong><br />
environmental education 301<br />
global citizenship education 294<br />
primary <strong>and</strong> secondary school completion<br />
186<br />
socio-economic background <strong>and</strong><br />
perseverance 249<br />
tertiary education 229, 231<br />
ICF 266<br />
ICILS 246<br />
ICT<br />
access <strong>and</strong> use 245<br />
effect on economies 49<br />
ICT cluster (Hyderabad) 119<br />
ICT skills<br />
facilities in schools 311–314, 311, 312–313, 314<br />
for improved service delivery 92<br />
in knowledge economy 124<br />
monitoring 245, 245, 246, 378<br />
IDELA 217–218, 218<br />
IEA 100<br />
IIEP, Country Reports 364<br />
illiteracy<br />
marginalized populations 73<br />
part-time female workers 120<br />
replaced by literacy skill proficiency as<br />
measure 278<br />
youth 280<br />
see also adult literacy; literacy; youth literacy<br />
ILO see International Labour Organization (ILO)<br />
immigrants<br />
attitudes towards 304<br />
educational attainment 124<br />
enclaves in cities 124<br />
languages spoken 269–270<br />
marginalization 73, 75–76<br />
see also ethnic minority groups; migrants;<br />
migration; refugees<br />
imputed student costs, aid 324, 324, 325, 325<br />
in-country disparity see within country<br />
disparities<br />
in-service training for teachers 335–336<br />
on global citizenship 296<br />
Incheon Declaration 7, 12<br />
inclusion<br />
contribution of education to inclusive<br />
economies 39–40, 53–62, 120<br />
early childhood education 211<br />
integrated approaches 90–93, 124–128, 125,<br />
126, 127, 139–143, 140<br />
social development for 67–77<br />
Inclusive Education Rating System tools, school<br />
buildings 310–311<br />
income inequality 53, 81, 124<br />
India<br />
adult education 237<br />
agriculture 47<br />
caste system 73, 123<br />
climate change 44<br />
curriculum 104<br />
disabled access to schools 311<br />
discrimination against marginalized groups<br />
69, 123<br />
early childhood care programmes 85<br />
economic growth 49, 118<br />
educational attainment 74, 81, 86, 89, 103,<br />
135, 186<br />
electricity provision 86, 312<br />
employment 51, 89, 120, 140<br />
environmental education 25, 26<br />
food waste 45<br />
gender disparity 69, 74, 89, 90, 92, 120<br />
gender equality initiatives 71, 92<br />
gender-based violence 90<br />
gendered attitudes 264<br />
health care 78, 80<br />
HIV education 292<br />
illiteracy 120<br />
income inequality 52<br />
integrated programmes 92, 140<br />
intimate partner violence 81<br />
linguistic diversity 268<br />
literacy programme participation 278<br />
manufacturing 51<br />
out-of-school children 182, 183<br />
parental gender attitudes 90<br />
peace education 108<br />
police training 110<br />
population growth 21<br />
pre-primary enrolment 207<br />
primary education 182, 183, 186, 187, 237,<br />
312, 337<br />
private education 118, 187<br />
quality of education 122<br />
renewable energy 40<br />
rural areas 122<br />
scholarship aid 324, 324<br />
school completion 186<br />
school dropout 90<br />
secondary education 183, 186, 312<br />
sexual <strong>and</strong> reproductive health interventions<br />
80, 292<br />
stunted children 85<br />
tax attitudes 135<br />
teacher contracts 336, 337<br />
teacher deployment 122<br />
teacher motivation 334<br />
teaching methods 191<br />
tertiary education 228, 231<br />
urban areas 122<br />
urban planning 126, 126<br />
urban population growth 116<br />
voter education campaigns 99<br />
water <strong>and</strong> sanitation programmes 85<br />
wealth disparities 122<br />
within country disparity 186, 231<br />
women in politics 71, 71<br />
years of education 186<br />
youth unemployment 103<br />
indicators see global indicators; thematic<br />
indicators<br />
Indicators of Education Systems (INES) 363–<br />
364, 364<br />
indigenous language see language of instruction;<br />
mother tongue; mother tongue<br />
instruction<br />
indigenous <strong>people</strong>s<br />
attitudes towards 304<br />
culture <strong>and</strong> cultural loss 29, 77, 164<br />
514<br />
ANNEX | INDEX
educational attainment 75, 76, 105<br />
language of instruction conflict 104<br />
marginalization 72, 73<br />
school infrastructure index 308<br />
school teaching methods 102<br />
sustainable living <strong>and</strong> climate change 27–29,<br />
27, 35<br />
vulnerable environments 28<br />
Indonesia<br />
adolescent birth rate 370<br />
early childhood care <strong>and</strong> education 213, 213<br />
ecological footprint 23<br />
education expenditure 136, 136<br />
education system review 364<br />
educational attainment 74, 186, 370<br />
electricity provision 312<br />
environmental education 26, 301, 301<br />
equity improvement 351<br />
gender disparity 74, 75, 230<br />
gender equality initiatives 92<br />
health care 78<br />
human rights education 290, 300<br />
language of instruction 269<br />
linguistic diversity 268<br />
literacy 75, 281, 282<br />
literacy programme participation 278<br />
mathematics achievement 109<br />
multicultural supportiveness 299<br />
out-of-school children 183<br />
out-of-school civic activities 26<br />
parent governors 294<br />
parental health 85<br />
population growth 21<br />
pre-primary enrolment 207<br />
primary education 183, 186, 312, 329, 329,<br />
330, 337<br />
private education 233<br />
pupil/teacher ratio <strong>and</strong> class size 329<br />
rural areas 75<br />
scholarship aid 324<br />
school completion 186<br />
school construction 310<br />
school dropout 85<br />
secondary education 183, 186, 312<br />
sexuality education 291<br />
socio-economic background <strong>and</strong><br />
perseverance 249<br />
sustainable development education 297<br />
teacher absenteeism 329<br />
teacher contracts 337<br />
teacher education 297, 330<br />
teaching methods 298<br />
tertiary education 228, 229, 230, 231, 233<br />
TVET participation 226<br />
under-5 mortality rate 371<br />
underweight children 80<br />
violence in schools 109<br />
within country disparity 186, 231<br />
women in politics 71<br />
years of education 186<br />
induction of teachers 334, 335, 335<br />
industry, development of clean <strong>and</strong> green<br />
restructuring 40–43<br />
inequality<br />
of education in cities 122<br />
of education globally 162<br />
effect of education 54–55, 103, 121–124<br />
effect of GEM highlighting of problems 388<br />
household share of education expenditure<br />
342<br />
<strong>and</strong> marginalization 72–73<br />
monitoring 378<br />
see also inequality measurement<br />
per capita income 53, 53, 59, 81<br />
reduction through early childhood<br />
development programmes 213<br />
risks from private sector funding 145–146<br />
rural-urban divide 121, 122<br />
women’s employment 56, 57, 60, 61, 69–70,<br />
70, 81, 88–89, 88<br />
see also discrimination; equity; ethnic<br />
minority groups; gender disparity;<br />
gender equality; inequality; justice;<br />
marginalization; <strong>people</strong> with<br />
disabilities; wealth disparities<br />
inequality measurement<br />
calculations 258<br />
disability 265–267<br />
gender 262–265<br />
language 267–270<br />
migration 271–273<br />
parity indices 257–262<br />
INES Network for System-Level Indicators<br />
(NESLI), data tool 363–364, 364<br />
informal coalitions, for environmental<br />
sustainability 32<br />
informal education 9, 237<br />
informal employment 57, 58, 58<br />
<strong>and</strong> educational level 58<br />
gender disparity 60, 69, 70, 89<br />
reducing through education access 60<br />
urban economies 119–120<br />
informal healthcare, inadequacies 78<br />
information literacy see digital literacy<br />
information schemes 91, 92<br />
infrastructure data collection 308, 309<br />
INJAZ Palestine 253<br />
institution-based TVET 223, 223–224, 223,<br />
224–225, 224<br />
instructional time 191–192, 192, 329<br />
Integrated Agricultural Research for<br />
Development (IAR4D) 47<br />
integrated approaches<br />
need for more development 163<br />
school services 165<br />
for social inclusion 90–93, 124–128, 125, 126,<br />
127, 139–143, 140<br />
for sustainable development agenda 134,<br />
141–142, 167<br />
see also partnership; policy coherence for<br />
development; social protection<br />
programmes<br />
integrated schools 28–29, 106, 107<br />
see also desegregation of schools<br />
Inter-agency <strong>and</strong> Expert Group on SDG<br />
Indicators 181<br />
ICT skills 244<br />
Inter-agency Group for Child Mortality<br />
Estimation 263<br />
Inter-agency Group on Education Inequality<br />
Indicators 263, 378, 380<br />
Inter-agency Network for Education in<br />
Emergencies, guidelines 310<br />
Inter-American Development Bank, funding for<br />
infrastructure census 308<br />
interculturalism, extracurricular activities 299<br />
intergenerational learning, for climate change<br />
28–29<br />
Intergovernmental Panel on Climate Change,<br />
value of indigenous knowledge 28<br />
internal migration 117<br />
internally displaced persons 33, 166, 271–272<br />
international aid see aid; donors; education aid<br />
International Association for the Evaluation of<br />
Educational Achievement 302<br />
see also International Civic <strong>and</strong> Citizenship<br />
Education Study (ICCS)<br />
International Association for the Evaluation of<br />
Educational Achievement (IEA) Civic<br />
Education Study 100<br />
International Association of Universities,<br />
Higher Education for Sustainable<br />
Development initiative 27<br />
International Civic <strong>and</strong> Citizenship Education<br />
Study (ICCS) 26, 100, 293–294, 298,<br />
299, 300, 303–304<br />
International Classification of Functioning,<br />
Disability <strong>and</strong> Health (ICF) 266<br />
International Commission on the Financing of<br />
Global Education Opportunities 134<br />
International Computer <strong>and</strong> Information<br />
Literacy Study (ICILS) 246<br />
International Conference on Population <strong>and</strong><br />
Development, Programme of Action<br />
291<br />
International Covenant on Economic, Social <strong>and</strong><br />
Cultural Rights 244<br />
International Development <strong>and</strong> Early Learning<br />
Assessment (IDELA) 217–218, 218<br />
International Household Survey Network<br />
356–357<br />
International Institute for Educational Planning<br />
(IIEP), County Reports 364<br />
International Labour Organization (ILO)<br />
International Training Centre on green<br />
issues 31<br />
School-to-Work Transition Survey 225<br />
International Men <strong>and</strong> Gender Equality Survey<br />
91<br />
international migration 271<br />
see also refugees<br />
international opinion surveys 303<br />
International Planned Parenthood Federation<br />
questionnaire 291<br />
International Recommendation concerning<br />
Education for International<br />
Underst<strong>and</strong>ing, Co-operation <strong>and</strong><br />
Peace <strong>and</strong> Education relating to<br />
Human Rights <strong>and</strong> Fundamental<br />
Freedoms 289<br />
International Social Survey Programme (ISSP)<br />
25–26, 304<br />
International Society for the Prevention of<br />
Child Abuse <strong>and</strong> Neglect screening<br />
tool 316<br />
International Step by Step Association 211<br />
International Telecommunication Union (ITU)<br />
245<br />
internet<br />
access in schools 312, 313<br />
for environmental education 31<br />
for literacy programme delivery 279<br />
internet abuse 315<br />
Interpersonal Competence Questionnaire 250<br />
interpersonal violence 108–109<br />
intimate partner violence 81, 82, 92<br />
attitudes of women as gender equality<br />
indicator 264–265, 264<br />
not addressed in school curricula 291<br />
see also gender-based violence<br />
intra-urban disparity in education 121–122, 122<br />
IPCC 28<br />
Iran, Islamic Republic of see Islamic Republic of<br />
Iran<br />
Iraq<br />
access to education 272<br />
attacks on schools 317<br />
child development 219<br />
childhood obesity 80<br />
conflict 103, 105, 272<br />
early childhood care <strong>and</strong> education 210<br />
educational attainment 186<br />
home learning environment 215, 215<br />
internally displaced persons 272<br />
literacy 195, 196, 219, 281<br />
loss of educational facilities 105<br />
national school census 309<br />
numeracy 219<br />
primary education 186, 196, 272<br />
reading proficiency 195, 196<br />
school completion 186<br />
secondary education 186<br />
tertiary education 231<br />
violence in schools 316<br />
within country disparity 186, 210, 231<br />
years of education 186<br />
Irel<strong>and</strong><br />
adult education 238<br />
environmental education 301<br />
global citizenship education 294, 300<br />
literacy 282<br />
pre-primary enrolment 208, 208<br />
secondary education 238<br />
socio-economic background <strong>and</strong><br />
perseverance 249<br />
special educational needs 266<br />
teacher education 336<br />
tertiary education 232, 238<br />
2016 • GLOBAL EDUCATION MONITORING REPORT 515
urban planning 126<br />
women in politics 71<br />
Islamic Republic of Iran<br />
electricity provision 312, 313<br />
enrolment 106<br />
gender disparity 230<br />
ICT facilities 313, 314<br />
ICT skills 246, 246<br />
internet access 313<br />
language of instruction 269<br />
primary education 106, 312, 314<br />
refugees 106<br />
scholarship aid 324<br />
school construction 310<br />
secondary education 106, 312, 314<br />
sexuality education 291<br />
tertiary education 228, 229, 230<br />
TVET enrolment 223<br />
Israel<br />
attacks on schools 317<br />
bilingual schools 107<br />
early childhood care <strong>and</strong> education 331<br />
environmental education 301, 301<br />
financial literacy 251, 251<br />
gender disparity 230<br />
language of instruction 269<br />
literacy 282<br />
mathematics achievement 109<br />
political participation 71, 102<br />
primary education 187<br />
school completion 187<br />
secondary education 187<br />
socio-economic background <strong>and</strong><br />
perseverance 249<br />
teacher education 331<br />
teaching methods 102<br />
tertiary education 229, 230<br />
violence in schools 109<br />
women in politics 71<br />
ISSP 25–26, 304<br />
Istanbul Programme of Action for the Least<br />
Developed Countries for the Decade<br />
2011-2020 320<br />
Italy<br />
adult education 238, 239, 239<br />
crime 108<br />
early childhood care <strong>and</strong> education 212, 331<br />
education expenditure 233<br />
educational attainment 108<br />
employment 70<br />
environmental education 301<br />
financial literacy 251<br />
gender disparity 70, 230<br />
household expenditure 233<br />
human rights education 300<br />
ICT facilities 314<br />
literacy 282, 282<br />
political participation 71, 102<br />
primary education 187, 314<br />
pupil/teacher ratio <strong>and</strong> class size 329<br />
reading proficiency 281<br />
school completion 187<br />
secondary education 187, 238, 314, 329, 335<br />
socio-economic background <strong>and</strong><br />
perseverance 249<br />
special educational needs 266, 266<br />
student support 233<br />
teacher education 331, 335<br />
teaching methods 102, 298<br />
tertiary education 228, 229, 230, 233, 238<br />
women in politics 71<br />
ITU 245<br />
Ivory Coast see Cote d’Ivoire<br />
Jamaica<br />
adult education 240<br />
child development 219<br />
J<br />
early childhood care <strong>and</strong> education 85, 210,<br />
213, 213<br />
ecological footprint 23<br />
education funding 351<br />
educational attainment 75, 186<br />
equity improvement 351<br />
gender disparity 75<br />
HIV education 292<br />
home learning environment 215<br />
ICT facilities 313<br />
instructional teaching time 191<br />
literacy 219, 281<br />
numeracy 219<br />
pre-primary education 209<br />
primary education 187, 313<br />
school completion 187<br />
secondary education 187, 313<br />
students abroad 322<br />
stunted children 85<br />
tax education 136<br />
teacher education 240<br />
violence in schools 316, 316<br />
within country disparity 186, 210<br />
years of education 186<br />
Japan<br />
competitive economy 119<br />
education aid donor 355<br />
education expenditure 234<br />
employment 70, 89<br />
environmental education 301, 301<br />
gender disparity 70, 89, 230<br />
global citizenship knowledge 303<br />
health <strong>and</strong> nutrition programmes 79<br />
HIV education 292<br />
household expenditure 234<br />
knowledge economy 119<br />
literacy 282, 282<br />
migrants 125<br />
primary education 328, 329<br />
private education 232, 233<br />
psychological bullying in schools 315<br />
pupil/teacher ratio <strong>and</strong> class size 329<br />
reading proficiency 281<br />
secondary schools 334<br />
social skills 250<br />
socio-economic background <strong>and</strong><br />
perseverance 249<br />
sustainable development initiatives 43, 297<br />
teacher education 297, 334<br />
tertiary education 229, 230, 232, 233, 234<br />
urban planning 125<br />
violence in schools 315<br />
women in politics 71<br />
job losses, due to green industry restructuring<br />
41<br />
job polarization see employment, polarization<br />
of skills<br />
Johannesburg, World Summit on Sustainable<br />
Development 5<br />
Joint United Nations Programme on HIV/AIDS<br />
(UNAIDS) Inter-Agency Task Team on<br />
Education, indicators 291, 297<br />
Jordan<br />
child development 219<br />
educational attainment 75, 81, 186<br />
electricity provision 312, 313<br />
environmental education 301<br />
gender disparity 75, 230<br />
home learning environment 215, 215<br />
ICT facilities 314<br />
internet access 313<br />
intimate partner violence 81<br />
learning cities 126<br />
literacy 195, 196, 219, 281<br />
numeracy 219, 283<br />
primary education 186, 196, 312, 314, 335<br />
reading proficiency 195, 196<br />
refugees in education 272<br />
rural areas 122<br />
school completion 186<br />
secondary education 186, 312, 314<br />
socio-economic background <strong>and</strong><br />
perseverance 249<br />
teacher induction 335<br />
tertiary education 230, 231<br />
TVET participation 224<br />
urban areas 122<br />
wealth disparities 122<br />
within country disparity 186, 231<br />
years of education 186<br />
Junior Farmer Field <strong>and</strong> Life Schools programme<br />
253<br />
justice system<br />
role of education 110–111<br />
see also crime<br />
K<br />
Kazakhstan<br />
child development 219<br />
early childhood care <strong>and</strong> education 210<br />
educational attainment 75, 185, 186<br />
gender disparity 75<br />
HIV education 292<br />
home learning environment 215<br />
ICT skills 246<br />
literacy 219, 281<br />
national assessments 199<br />
numeracy 219<br />
parent governors 294<br />
pre-primary education 209<br />
primary education 187, 335<br />
school completion 187<br />
secondary education 187<br />
socio-economic background <strong>and</strong><br />
perseverance 249<br />
teacher education 335, 336<br />
tertiary education 231<br />
within country disparity 186, 210, 231<br />
years of education 185, 186<br />
Kenya<br />
access to education 122, 123<br />
class sizes 329<br />
climate change adaptation 10<br />
conflict 99<br />
education aid 138<br />
educational attainment 10, 57, 58, 61, 74, 81,<br />
82, 86, 186<br />
electricity provision 86<br />
employment <strong>and</strong> earnings 58, 59, 60, 61,<br />
85, 89<br />
employment skills 59<br />
enrolment 106, 106<br />
ethnic minority groups 98<br />
female genital mutilation 82<br />
gender disparity 61, 74, 89, 98<br />
gender equality education 98, 291<br />
health interventions 79, 85<br />
HIV education 292<br />
income level 354<br />
intimate partner violence 81<br />
language of instruction 269, 270<br />
literacy 59, 281, 282<br />
literacy programme participation 278<br />
numeracy 283, 284<br />
out-of-school children 272<br />
political participation 98, 101–102<br />
primary education 106, 186, 329, 335<br />
refugees 106, 106, 272<br />
school completion 186<br />
secondary education 87, 106, 186, 272<br />
sexual <strong>and</strong> reproductive health interventions<br />
79, 292<br />
socio-economic disadvantage 60<br />
solar lighting project 30<br />
teacher induction 335<br />
teacher skills 333<br />
teaching methods 107, 191<br />
tertiary education 59, 101–102<br />
TVET 224, 226<br />
underweight children 80<br />
within country disparity 186<br />
516<br />
ANNEX | INDEX
working poverty 57, 61<br />
years of education 186<br />
Kichwa concept sumak kawsay (Ecuador) 27<br />
Kiribati<br />
early childhood care <strong>and</strong> education 213, 213<br />
TVET fees 226<br />
violence in schools 316<br />
Know About Business programme 253<br />
knowledge economies 124, 161–162, 166<br />
see also ICT<br />
Korea see Democratic People’s Republic of Korea;<br />
Republic of Korea<br />
küme mongen concept 27<br />
Kuwait<br />
discrimination <strong>and</strong> gender disparity in<br />
secondary education completion<br />
87, 87<br />
tertiary education 229, 231<br />
violence in schools 316<br />
women in politics 71<br />
Kyrgyzstan<br />
adult education 239<br />
child development 219<br />
childhood obesity 80<br />
early childhood care <strong>and</strong> education 210,<br />
213, 213<br />
education expenditure 136, 136, 239<br />
educational attainment 75, 186<br />
electricity provision 313<br />
environmental education 301, 301<br />
gender disparity 75, 230<br />
HIV education 292<br />
home learning environment 215<br />
ICT facilities <strong>and</strong> internet access 312, 313<br />
literacy 75, 219, 281<br />
numeracy 219<br />
pre-primary education 209<br />
primary education 187, 313<br />
rural areas 75<br />
school completion 187<br />
secondary education 187, 313<br />
tertiary education 229, 230<br />
textbooks 190<br />
within country disparity 186, 210<br />
years of education 186<br />
L<br />
labour see employment; employment skills<br />
Labour Force Survey (EU) 237, 238–239, 238, 239<br />
LAMP 283, 283, 284<br />
language acquisition, effect of home<br />
environment 214<br />
language diversity, <strong>and</strong> instruction 267–268, 268<br />
language of instruction<br />
bilingual schools 107<br />
cause of conflicts 104<br />
education barrier for refugees 117<br />
monitoring 377<br />
second language introduction 267<br />
spoken at home 269, 270<br />
see also foreign languages; mother tongue<br />
instruction<br />
language skills<br />
assessment 199, 199, 202<br />
migrant schemes 125<br />
see also literacy; reading proficiency<br />
Lao People’s Democratic Republic<br />
child development 219<br />
early childhood care <strong>and</strong> education 210<br />
education expenditure 136, 136, 347<br />
educational attainment 58, 74, 76, 186<br />
electricity provision 312<br />
employment 58<br />
employment skills 59<br />
ethnic minorities 76<br />
gender disparity 76, 230<br />
HIV education 292<br />
home learning environment 215<br />
literacy 219, 281<br />
national education accounts 343<br />
numeracy 219<br />
pre-primary education 209, 209<br />
primary education 186, 312, 336, 337<br />
school completion 186<br />
school construction 310<br />
secondary education 186, 312<br />
students abroad 323<br />
teacher contracts 336, 337<br />
tertiary education 59, 229, 230<br />
TVET enrolment 223<br />
within country disparity 76, 186, 210<br />
years of education 186<br />
large businesses<br />
cognitive skills of owners 252<br />
see also corporate initiatives<br />
late entry into school 183<br />
Latin America <strong>and</strong> the Caribbean<br />
adult literacy 280<br />
buen vivir approach 27<br />
cash transfer programmes 91<br />
countries listed 399<br />
crime 123<br />
discrimination of marginalized groups 7<br />
early childhood care <strong>and</strong> education 212<br />
ecological footprint 21–22<br />
education aid 354<br />
education expenditure 346, 368<br />
educational attainment 60, 88<br />
employment 51, 57, 60, 88<br />
enrolment 182<br />
environmental concerns 304<br />
environmental education 301<br />
gender disparity 60, 88, 260, 280<br />
global citizenship education <strong>and</strong> knowledge<br />
294, 300<br />
green economy 40, 272<br />
health care 72, 79<br />
HIV education 292<br />
illiteracy 73, 136<br />
language of instruction 270<br />
learning cities 126–128, 127, 128<br />
mathematics achievement 195<br />
multicultural attitudes 304<br />
national assessments 194, 200<br />
out-of-school children 123, 181, 182<br />
population growth 21<br />
pre-primary education 207, 338, 338<br />
primary education 72, 91, 153, 182, 187, 237,<br />
260, 338, 338<br />
private education 187<br />
quality of education 49<br />
renewable energy 40<br />
repetition rate 183<br />
scholarships 321<br />
school completion 154, 156, 237, 260<br />
school construction 310<br />
secondary education 153, 154, 155, 156, 182,<br />
183, 237, 260, 338, 338<br />
sexuality education 291, 292<br />
sustainable living 27<br />
sustainable transport 121<br />
taxation 136<br />
teacher salaries gap 338, 338<br />
tertiary education 229<br />
TVET enrolment 223<br />
under-5 mortality rate 156, 371<br />
unemployment 56<br />
universal primary <strong>and</strong> secondary education<br />
153, 154, 155, 156<br />
violence 123<br />
wealth disparities 260<br />
youth literacy 280<br />
see also individual countries<br />
Latvia<br />
adult education 238, 239, 239–240, 239<br />
education expenditure 233<br />
environmental education 301<br />
financial literacy 251<br />
global citizenship education 296<br />
household expenditure 233<br />
human rights education 300<br />
ICT facilities 314<br />
primary education 187, 314<br />
private education 232<br />
school completion 187<br />
secondary education 187, 238, 314<br />
socio-economic background <strong>and</strong><br />
perseverance 249<br />
special educational needs 266<br />
student support 233, 239–240<br />
teacher education 296<br />
tertiary education 229, 231, 232, 233, 238<br />
law enforcement, training for 110<br />
LEARNigeria 198<br />
learning assessment systems, aid donor<br />
involvement 201<br />
learning cities 126–128, 127, 128<br />
learning environments<br />
class sizes 328–329, 330<br />
classroom practices 191–193, 192, 265, 298<br />
classrooms in rural areas 308<br />
ICT facilities 311–314<br />
INES programme 363<br />
monitoring 378<br />
school infrastructure 26, 308–311, 308, 309,<br />
378, 381<br />
teaching practices 191–193, 191, 192, 298<br />
textbook availability 189–191, 190<br />
learning <strong>and</strong> life skills see adult education;<br />
informal education; lifelong learning;<br />
non-formal education<br />
learning outcomes<br />
global citizenship <strong>and</strong> sustainability<br />
knowledge 299–302, 303<br />
literacy 202, 277, 278, 280–282, 282<br />
measuring 193–198, 195, 196, 197, 197, 381<br />
monitoring 299–302, 303, 377, 383<br />
national learning assessments 196, 198–203,<br />
198, 199, 201<br />
numeracy 202, 283–284, 283<br />
tertiary education quality measure 235–236<br />
see also measurement tools<br />
least developed countries<br />
education aid 354, 354<br />
scholarship aid 324<br />
students abroad 322, 323<br />
teacher training requirements 333<br />
water <strong>and</strong> sanitation provision 309, 309<br />
see also low income countries; poorer<br />
countries<br />
Lebanon<br />
armed groups 103<br />
computer access 245<br />
educational attainment 103<br />
gender disparity 230<br />
mathematics achievement 109<br />
peacebuilding 108<br />
primary education 335<br />
teacher induction 335, 335<br />
tertiary education 229, 230<br />
violence in schools 109, 316<br />
legal rights<br />
education 110<br />
project for street vendors 120<br />
Lesotho<br />
educational attainment 186<br />
gender disparity 230<br />
gender equality education 291<br />
global citizenship education 294<br />
HIV education 292<br />
literacy 281<br />
literacy programme participation 278<br />
primary education completion 186<br />
scientific researcher deficiency 372, 372<br />
secondary education completion 186<br />
sexuality education 292, 297<br />
students abroad 323<br />
teacher education 297<br />
tertiary education 228, 230, 231<br />
within country disparity 186, 231<br />
years of education 186<br />
Let’s Engage, Assess <strong>and</strong> Report Nigeria 198<br />
2016 • GLOBAL EDUCATION MONITORING REPORT 517
Liberia<br />
basic education 138, 138, 139<br />
education aid 138, 139<br />
educational attainment 81, 186, 371<br />
electricity provision <strong>and</strong> internet access 313<br />
employment 70<br />
gender disparity 70, 74, 75<br />
HIV education 292, 292<br />
intimate partner violence 81<br />
literacy 74, 75, 281<br />
literacy programme participation 278<br />
malaria prevalence 371<br />
out-of-school children 183<br />
parenting interventions 108<br />
primary education 183, 186<br />
rural areas 74, 75<br />
school completion 186<br />
secondary education 183, 186<br />
solar lighting project 30<br />
tertiary education 231<br />
within country disparity 186, 231<br />
years of education 186<br />
library provision, integrated learning city<br />
initiative 127, 127<br />
Libya<br />
attacks on schools 317<br />
Liechtenstein<br />
environmental education 301<br />
gender disparity 230<br />
human rights education 300<br />
tertiary education 229, 230<br />
life expectancy, <strong>and</strong> education 155, 156<br />
lifelong learning<br />
in agriculture 46<br />
civic education 98<br />
contribution to economic growth 48–52<br />
description 8–9, 8<br />
effect on cities 115, 118–121<br />
need for campaigns 373<br />
role in sustainability 29–32, 43, 61<br />
sustainability data gaps 288<br />
through literacy programmes 279<br />
see also non-formal education<br />
Lighting Africa 29–30<br />
literacy 73, 81, 277–278, 279, 280, 280<br />
in agricultural development 45<br />
for behavioural sustainability change 11<br />
child development 216, 217, 219<br />
contribution to participatory politics 97–102<br />
EFA GMR concepts 276<br />
effect on earnings 59<br />
effect of electricity provision 86<br />
effect of water provision 85<br />
gender disparity 60, 74, 75, 120, 278, 279,<br />
280<br />
importance for democracy 101<br />
learning outcomes 202, 277, 278, 280–282,<br />
282<br />
<strong>and</strong> maternal education 82, 83<br />
monitoring 277–278, 280–282, 282, 283, 283,<br />
284, 378<br />
<strong>and</strong> socio-economic disadvantage 60<br />
statistical data 394<br />
<strong>and</strong> tax revenue 135–136<br />
see also language skills; reading proficiency<br />
Literacy Assessment Monitoring Programme<br />
(LAMP) 283, 283, 284<br />
Literacy <strong>and</strong> Numeracy Education Support<br />
programme 201<br />
literacy rates 279, 279, 279, 280–282, 280, 281,<br />
282<br />
Lithuania<br />
adult education 238<br />
digital literacy skills 247<br />
education system review 364<br />
environmental education 301<br />
gender disparity 230<br />
global citizenship education 294, 300<br />
HIV education 292<br />
ICT facilities 314<br />
ICT skills 246<br />
literacy 282<br />
primary education 187, 314<br />
school completion 187<br />
secondary education 187, 238, 314<br />
socio-economic background <strong>and</strong><br />
perseverance 249<br />
special educational needs 266, 266<br />
tertiary education 228, 229, 229, 230, 238<br />
Livelihood Empowerment Against Poverty<br />
programme (Ghana) 144<br />
loans for education 225–226, 355, 356<br />
local government, data gaps on financing 345<br />
local languages see mother tongue instruction<br />
location disparity<br />
inequality indicators 257<br />
out-of-school children 259<br />
primary education 259<br />
school completion 259<br />
secondary education 259<br />
see also cities; nomadic communities;<br />
pastoralists; rural areas; urban areas<br />
London, city leadership 129<br />
low income countries<br />
2030 educational attainment target 152–153<br />
<strong>and</strong> adolescent birth rate 370<br />
basic education 53, 352–353, 354<br />
breastfeeding 82–83<br />
child mortality rate 83<br />
childhood obesity interventions 79<br />
climate change 10, 33, 33<br />
countries listed 399<br />
difficulties of economic growth 51<br />
doctor/patient relationships 78<br />
early childhood education attendance 209<br />
earnings 59<br />
education aid 137, 145, 325, 325, 352–353,<br />
354, 356<br />
education expenditure 136, 136, 346, 346, 349<br />
education outcomes 68, 69<br />
educational attainment 58, 59, 59, 74–75,<br />
152–153, 257, 259<br />
effect of education expansion on economic<br />
growth 156, 157<br />
employment 58, 59, 59, 81<br />
gender disparity 71, 81, 89, 257, 259, 262<br />
GPD needed for 2030 SDGs 133<br />
gross intake rate 184<br />
health education 77–78<br />
health interventions 68, 69, 140<br />
higher education investment 164<br />
ICT provision 92<br />
illicit financial flows (tax avoidance) 135<br />
income inequality 52, 53, 59<br />
literacy 59, 195, 278, 280<br />
loans 355<br />
multi-sector v. single sector projects 144–145<br />
national assessments 203<br />
national plans 142<br />
NEET youth 369<br />
out-of-school children 181, 181, 259<br />
population growth 20, 21, 44, 116<br />
primary education 69, 121, 182, 182, 184, 185,<br />
259, 259, 261, 262, 354<br />
problems of service sector economies 51<br />
quality education costs 134<br />
reading proficiency 195<br />
refugee hosting 272<br />
rural areas 121, 122, 258<br />
school completion 121, 122, 184, 185, 185, 259,<br />
259, 261<br />
secondary education 48, 54, 55, 58, 121, 122,<br />
182, 182, 184, 185, 185, 259, 259, 262,<br />
352–353<br />
status definition 354<br />
teacher salaries 338<br />
teaching methods 191<br />
tertiary education 48, 54, 55, 58, 229<br />
under-5 mortality 69<br />
underweight children 80<br />
urban areas 115, 116, 121, 122<br />
urban planning needs 126<br />
use of direct literacy assessments 281<br />
voter education campaigns 99<br />
wealth disparities 258–259, 259, 259, 261<br />
working poverty 52, 52, 57, 57, 89<br />
years of education 185, 186<br />
see also poorer countries<br />
low skill employment<br />
definition 50<br />
<strong>and</strong> educational attainment 59, 60<br />
<strong>and</strong> green industry 41, 62<br />
surplus of workers 50<br />
effect of technology 49, 50<br />
lower middle income countries<br />
basic skills for economic growth 49<br />
child mortality rate 83<br />
countries listed 399–400<br />
education aid 325, 325, 354<br />
education expenditure 136, 136, 346, 346, 349<br />
education outcomes 68, 69<br />
gender disparity 259, 262<br />
GPD needed for 2030 SDGs 133<br />
health interventions 68, 69<br />
literacy 280<br />
loans 355<br />
out-of-school children 259<br />
population growth 20, 21, 44, 116<br />
primary completion rate 69<br />
primary education 184, 185, 259, 262<br />
quality education costs 134<br />
school attendance 259<br />
school completion 184, 185, 185, 259, 259<br />
secondary education 185, 185, 259, 259, 262<br />
secondary <strong>and</strong> tertiary education expansion<br />
48<br />
teacher salaries 338<br />
tertiary education 48, 229<br />
under-5 mortality 69<br />
wealth disparities 259<br />
working poverty 52, 52<br />
lower secondary education<br />
adjusted net enrolment ratio 181–182<br />
effect on child mortality levels 155, 156<br />
effect on poverty reduction 156–157, 157<br />
<strong>and</strong> employment 56, 58, 59, 59, 89<br />
enrolment 182<br />
enrolment of refugees 117, 272<br />
gender disparity 185, 259, 259, 260, 262, 262<br />
ICT facilities 313, 314<br />
in-service training for teachers 335<br />
induction <strong>and</strong> mentoring for teachers<br />
334–335<br />
out-of-school children 182, 182, 183<br />
pupil/teacher ratio <strong>and</strong> class size 328, 329<br />
rural areas 259<br />
school completion 87, 121, 122, 184, 185, 185,<br />
186–187, 259, 259, 260<br />
2030 target 151, 153, 153, 154, 155<br />
teacher salaries 338<br />
urban areas 259<br />
urban rural disparity 121, 122<br />
wealth disparities 185, 185, 259, 259, 260,<br />
261, 262<br />
<strong>and</strong> working poverty 57<br />
see also basic education<br />
Luxembourg<br />
adult education 238<br />
aid donor 137<br />
environmental education 301<br />
gender disparity 230<br />
global citizenship education 294<br />
HIV education 292<br />
human rights education 300<br />
secondary education 238<br />
socio-economic background <strong>and</strong><br />
perseverance 249<br />
special educational needs 266<br />
tertiary education 228, 230, 238<br />
518<br />
ANNEX | INDEX
M<br />
Macao, China<br />
environmental education 301<br />
gender disparity 230<br />
socio-economic background <strong>and</strong><br />
perseverance 249<br />
tertiary education 229, 230<br />
Madagascar<br />
adolescent birth rate 370<br />
educational attainment 74, 83, 186, 370<br />
electricity provision 312, 313<br />
fertility rate 84<br />
gender disparity 74, 230<br />
ICT facilities 313, 314<br />
internet access 313<br />
literacy 281<br />
literacy programme participation 278<br />
NEET rates 369<br />
primary education 186, 312, 314, 330<br />
school completion 186<br />
secondary education 186, 312, 314<br />
teacher recruitment 330<br />
teaching methods 191<br />
tertiary education 229, 229, 230, 231<br />
within country disparity 186, 231<br />
years of education 186<br />
malaria, role of education in reducing prevalence<br />
371<br />
Malawi<br />
child development 219<br />
early childhood care <strong>and</strong> education 213, 213<br />
educational attainment 81, 88, 186, 371<br />
electricity provision 312<br />
employment 88<br />
fertility rate 84<br />
gender disparity 75, 88, 183, 184<br />
gender equality education 291<br />
gender insensitive teaching 265<br />
home learning environment 215<br />
integrated programmes 140<br />
intimate partner violence 81<br />
language of instruction 270<br />
literacy 75, 196, 219, 281<br />
literacy programme participation 278<br />
malaria prevalence 371<br />
microfinance schemes 91<br />
numeracy 219<br />
over-age children 183, 184<br />
political participation 98<br />
primary education 84, 184, 186, 196, 261,<br />
261, 312<br />
reading proficiency 196<br />
rural areas 75<br />
school completion 186, 261, 261<br />
secondary education 98, 184, 186, 312<br />
sexual violence 81, 315<br />
sexuality education 297<br />
students abroad 323<br />
teacher education 297<br />
teaching methods 265<br />
tertiary education 98, 231<br />
violence in schools 316, 316<br />
wealth disparities 261, 261<br />
within country disparity 184, 185, 186, 231<br />
years of education 185, 186<br />
Malaysia<br />
education system review 364<br />
educational attainment 89<br />
electricity provision 312, 313<br />
enrolment 106<br />
ICT facilities 314<br />
integrated programmes 142<br />
internet access 313<br />
language of instruction 269<br />
mathematics achievement 109<br />
primary education 106, 312, 314, 336, 337<br />
refugees 106<br />
secondary education 106, 312, 314<br />
secondary schools 334<br />
sexuality education 291<br />
socio-economic background <strong>and</strong><br />
perseverance 249<br />
teacher contracts 336, 337<br />
teacher induction 334<br />
tertiary education 89, 228, 229<br />
TVET 142, 227<br />
violence in schools 109, 316<br />
women in politics 71, 89–90<br />
Maldives<br />
educational attainment 74, 186<br />
electricity provision <strong>and</strong> internet access for<br />
schools 312, 313<br />
gender disparity 74<br />
school completion disparities 186<br />
violence in schools 316<br />
years of education 186<br />
male stereotypes<br />
benefits of education 84<br />
see also boys; men<br />
Mali<br />
child development 219<br />
early childhood care <strong>and</strong> education 210,<br />
213, 213<br />
educational attainment 46, 74, 81, 82, 186, 371<br />
electricity provision 312<br />
female genital mutilation 82<br />
female literacy 83<br />
gender disparity 74, 74, 75<br />
global citizenship knowledge 303<br />
HIV education 292<br />
home learning environment 215<br />
intimate partner violence 81<br />
literacy 74, 75, 83, 196, 219, 281<br />
literacy programme participation 278, 278<br />
malaria prevalence 371<br />
mother tongue instruction 268–269<br />
numeracy 219<br />
pre-primary education 208, 209<br />
primary education 46, 186, 196, 312, 335<br />
reading proficiency 196<br />
rural areas 74, 75<br />
school completion 186<br />
secondary education 186, 312<br />
students abroad 323<br />
teacher induction 335<br />
tertiary education 228, 231<br />
under-5 mortality rate 83<br />
within country disparity 186, 210, 231<br />
years of education 186<br />
youth literacy 280<br />
malnutrition<br />
effect of education 85<br />
effects 68<br />
see also stunting; underweight children<br />
Malta<br />
adult education 238<br />
gender disparity 230<br />
global citizenship education 294, 300<br />
ICT facilities 314<br />
primary education 187, 314<br />
school completion 187<br />
school leadership training 332<br />
secondary education 187, 238, 314<br />
special educational needs 266<br />
teaching methods 298<br />
tertiary education 228, 229, 230, 231, 238<br />
within country disparity 231<br />
management information systems<br />
financial data 349–350<br />
tertiary education data 231, 232<br />
managerial skills, requirements of green<br />
industry 42<br />
manufacturing, industry stagnation 49, 51<br />
Mapuche community concept küme mongen<br />
(Chile) 27<br />
marginalization<br />
addressed through education financing 351,<br />
352<br />
assessment for social development 68<br />
<strong>and</strong> conflict 97<br />
discrimination in schools 123<br />
<strong>and</strong> education 73–77<br />
gender disparity 73, 75, 76<br />
<strong>and</strong> inequality 72–73, 165, 166<br />
missing statistics 72<br />
<strong>people</strong> with disabilities 72, 76, 265<br />
religious groups 72<br />
see also access to education; ethnic minority<br />
groups; gender disparity; inclusive<br />
education; inequality; internally<br />
displaced persons; refugees; rural<br />
areas; wealth disparities; within<br />
country disparities<br />
marriage 264, 291<br />
Marshall Isl<strong>and</strong>s<br />
students abroad 322<br />
Mastercard Foundation scholarships 320, 321<br />
maternal education 82–84, 85, 165<br />
effect on child development 217<br />
maternal mortality rates, benefits of education<br />
84<br />
mathematics<br />
language of instruction 270<br />
participation of girls 91, 165, 265<br />
teachers 331, 333<br />
mathematics achievement<br />
assessment 195, 195, 197, 197, 199, 199, 202<br />
effect of bullying 109, 109<br />
immigrants 76, 271<br />
integrated initiatives 125<br />
see also numeracy<br />
Mauritania<br />
basic education 138, 139<br />
child development 219<br />
education aid 138, 139<br />
educational attainment 74, 186<br />
gender disparity 74<br />
home learning environment 215<br />
literacy 219, 281<br />
national assessments 200<br />
numeracy 219<br />
out-of-school children 183<br />
pre-primary education 330<br />
primary education 183, 186, 261, 261<br />
school completion 186, 261, 261<br />
secondary education 183, 186<br />
students abroad 323<br />
teacher attrition 339<br />
teacher education 330<br />
tertiary education 231<br />
violence in schools 316<br />
within country disparity 186, 231<br />
years of education 186<br />
Mauritius<br />
early childhood care <strong>and</strong> education 213, 213<br />
electricity provision <strong>and</strong> internet access in<br />
schools 312, 313<br />
global citizenship education 294<br />
national assessments 199<br />
students abroad 322<br />
measurement tools<br />
child development 217–219, 218, 219, 377<br />
digital literacy 246–247, 247, 378<br />
education systems 350, 351, 363–364, 364<br />
entrepreneurship 252<br />
financial literacy 250–251<br />
learning environments 378, 381<br />
learning outcomes 198–203, 218, 218, 236<br />
literacy 277, 278, 280, 280–283, 282<br />
non-cognitive skills 249, 249, 250<br />
numeracy 283–284, 283<br />
parity index 257–262, 258, 258, 259, 260, 261<br />
quality of education 211–212, 217, 218, 218<br />
sexuality education 291, 297<br />
social skills 250<br />
teacher education 296–298, 298<br />
teaching 379<br />
TVET 377<br />
see also inequality measurement; monitoring<br />
Measuring <strong>and</strong> Comparing Achievements<br />
of Learning Outcomes in Higher<br />
Education in Europe (CALOHEE) 236<br />
Measuring Early Learning Quality <strong>and</strong> Outcomes<br />
(MELQO) 218, 218<br />
2016 • GLOBAL EDUCATION MONITORING REPORT 519
Medellin (Colombia), learning city transformation<br />
126–127, 127–128, 128<br />
medium skill employment<br />
definition 50<br />
<strong>and</strong> educational attainment 59, 60<br />
flexible skills needs 50<br />
green industry need for continuing<br />
education 41, 42<br />
effect of technology 49, 50<br />
worker surplus 50<br />
Mekhe Solar Cooker Project (Senegal) 31–32<br />
MELQO 218, 218<br />
men<br />
health benefits of education 84<br />
health problems 71<br />
impact of education on gender equality 91<br />
tertiary education 230, 230–231<br />
young men <strong>and</strong> risk of conflict 103<br />
see also boys; gender disparity; gender<br />
equality<br />
menstrual hygiene programmes 80<br />
mentoring of teachers 334–335, 335<br />
Mercosur, education system reviews 364<br />
Metas Educativas 2021 (‘Education Goals 2021’)<br />
364<br />
Mexico<br />
adult education 237, 240<br />
attacks on schools 317<br />
child health 82<br />
childhood obesity 80<br />
educational attainment 74, 186<br />
employment 70<br />
environmental education 301<br />
gender disparity 70, 74, 230<br />
global citizenship education 294, 300<br />
instructional teaching time 191<br />
linguistic diversity 268<br />
literacy 82, 195<br />
mathematics achievement 195<br />
multicultural attitudes 304<br />
national assessments 200<br />
out-of-school children 183<br />
population growth 21<br />
primary education 183, 186, 187, 195<br />
private education 187, 233<br />
psychological bullying in schools 315<br />
pupil/teacher ratio <strong>and</strong> class size 329<br />
reading proficiency 195<br />
school completion 186<br />
second chance programmes 237<br />
secondary education 183, 186, 328, 329<br />
socio-economic background <strong>and</strong><br />
perseverance 249<br />
sustainable transport 121<br />
teacher attrition 339<br />
teacher education 240, 335<br />
tertiary education 229, 230, 231, 233<br />
violence in schools 315<br />
within country disparity 186, 231<br />
women in politics 71<br />
years of education 186<br />
micro-firms, cognitive skills of owners 252<br />
microfinance programmes<br />
effect on business skills 252<br />
effects on gender equality 91<br />
Middle East<br />
conflict 103, 104<br />
deskilling of women migrants 117<br />
educational attainment 88<br />
employment 88, 117<br />
gender disparity 70, 88<br />
green technology 272<br />
out-of-school children 104<br />
women in politics 70<br />
see also Bahrain; Egypt; Iraq; Israel; Jordan;<br />
Kuwait; Lebanon; Qatar; Saudi<br />
Arabia; Syrian Arab Republic<br />
middle income countries<br />
2030 educational attainment target 153<br />
<strong>and</strong> adolescent birth rate 370<br />
changes in food consumption patterns 45<br />
child mortality rates 69, 83<br />
climate-related events 33<br />
computer use 245<br />
decent work 245<br />
doctor/patient relationships 78<br />
early childhood education attendance 209<br />
earnings <strong>and</strong> literacy 59<br />
ecological footprint 19, 21–22<br />
education aid 325, 325<br />
education expenditure 136, 346, 346<br />
education outcomes 68, 69<br />
educational attainment 59, 59, 81, 153<br />
effect of education on crime 120<br />
employment 59, 59, 81<br />
gender disparity 81, 89, 259, 262<br />
government incapacity for urban planning<br />
129<br />
GPD needed for 2030 SDGs 133<br />
green industry development 41<br />
gross intake rate 184<br />
health education 77–78<br />
health interventions 68, 69, 79<br />
income inequality 52, 53, 81<br />
internet access 245<br />
literacy 59, 195, 245, 280, 282, 282<br />
national plans 142<br />
NEET youth 369<br />
out-of-school children 181, 181, 259<br />
population growth 20, 116<br />
primary completion rate 69, 261<br />
primary education 185, 259, 261, 262<br />
public education expenditure percentages<br />
346, 346<br />
pupil/teacher ratio <strong>and</strong> class size 328, 329<br />
reading proficiency 195<br />
scholarship aid 324, 324<br />
school completion 184, 185, 185, 259, 261<br />
secondary education 185, 185, 259, 262<br />
teaching methods 191<br />
tertiary education 229<br />
TVET students 226<br />
vulnerable <strong>and</strong> informal employment 58<br />
wealth disparities 259<br />
working poverty 57, 57, 89<br />
years of education 185, 186<br />
see also lower middle income countries;<br />
upper middle income countries<br />
migrants<br />
discrimination by teachers 123<br />
employment skills not utilised 117–118<br />
integration in cities 125<br />
see also immigrants; refugees<br />
migration<br />
from natural disasters 33<br />
future impact 21<br />
monitoring 271–273<br />
rural-to-urban 116, 117, 271<br />
military organizations, use of schools 317<br />
Millennium Development Goals (MDGs)<br />
compared to SDGs 180, 184<br />
failure on environmental sustainability 5<br />
focus 180<br />
public awareness of 303<br />
role in retrospect 386<br />
Millennium Development Goals Achievement<br />
Fund 144<br />
minority groups see ethnic minority groups;<br />
girls; indigenous <strong>people</strong>s; internally<br />
displaced persons; marginalization;<br />
migrants; <strong>people</strong> with disabilities;<br />
refugees; women<br />
mobile phones, for literacy programmes 279<br />
Module on Child Functioning (UNICEF with<br />
WGDS) 266–267, 267<br />
Moldova see Republic of Moldova<br />
Mongolia<br />
basic education 138, 138<br />
child development 217, 219<br />
early childhood care <strong>and</strong> education 210<br />
ecological footprint 23<br />
education aid 138<br />
educational attainment 75, 186<br />
electricity provision 313<br />
gender disparity 75<br />
home learning environment 215<br />
internet access 312, 313<br />
literacy 219, 281<br />
numeracy 219, 283<br />
pre-primary education 209<br />
primary education 138, 186<br />
school completion 138, 186<br />
secondary education 186<br />
tertiary education 228, 228, 231<br />
within country disparity 186, 210, 231<br />
years of education 186<br />
monitoring<br />
accessibility for <strong>people</strong> with disabilities<br />
310–311<br />
adult education 381<br />
adult literacy 277–278, 378<br />
agenda for 376–377<br />
challenges of SDG education targets 179–185<br />
classroom observations 191–193, 192, 192,<br />
265, 298<br />
comparative education 184–185<br />
data needs 383<br />
disabilities 265–267, 266, 267<br />
early childhood care <strong>and</strong> education 213–214,<br />
377<br />
education expenditure 379, 381<br />
education systems 360–365, 379<br />
extracurricular activities 298–299<br />
finance for education 379, 381<br />
gender equality 263, 264–265<br />
global citizenship knowledge 300–303, 300,<br />
303<br />
global indicators for education 307, 327, 330,<br />
368–373<br />
human rights 289, 289–290, 290, 297, 300,<br />
300<br />
ICT skills 245, 245, 246, 378<br />
language of instruction 267–268<br />
literacy 277–278, 280–283, 282, 283, 283,<br />
284, 378<br />
m<strong>and</strong>atory reporting 379<br />
migration 271–273<br />
mother tongue instruction 377<br />
national learning assessments 378, 380<br />
need for regional indicators 181, 382, 387<br />
numeracy 283–284, 283<br />
out-of-school children 196–197, 377, 381<br />
problems with scholarship data 322–324<br />
progress towards SDG goals 256<br />
quality of education 188, 188, 381<br />
refugees 272<br />
role of GEM 388<br />
school curricula 289–293, 378, 381<br />
school governance 294<br />
school infrastructure 310, 378<br />
school-related violence 315, 317, 378<br />
teachers <strong>and</strong> teacher education 378, 379<br />
textbook content 294–296<br />
TVET 377<br />
UNICEF tools 310, 310–311<br />
use of labour force surveys 338–339<br />
use of national education accounts 379<br />
water, sanitation <strong>and</strong> hygiene facilities<br />
308–309<br />
see also global indicators; measurement<br />
tools; thematic indicators<br />
Montenegro<br />
child development 219<br />
childhood obesity 80<br />
early childhood care <strong>and</strong> education 210<br />
educational attainment 75, 186<br />
environmental education 301<br />
gender disparity 75<br />
HIV education 292<br />
home learning environment 215<br />
literacy 219, 281<br />
numeracy 219<br />
pre-primary education 209<br />
primary education completion 187<br />
secondary education completion 187<br />
socio-economic background <strong>and</strong><br />
520<br />
ANNEX | INDEX
perseverance 249<br />
tertiary education 231<br />
within country disparity 186, 210, 231<br />
years of education 186<br />
Montserrat, electricity provision, ICT <strong>and</strong><br />
internet access in schools 313<br />
Morocco<br />
educational attainment 74, 186<br />
electricity provision 312<br />
equity improvement 351, 352<br />
female literacy 83<br />
gender disparity 74<br />
literacy 83<br />
primary education 186, 312<br />
scholarship aid 324, 324<br />
school completion disparities 186<br />
secondary education 186, 312<br />
under-5 mortality rate 83<br />
violence in schools 316<br />
years of education 186<br />
mortality<br />
children 68, 82, 83, 91, 156, 370–371, 371<br />
from disaster related deaths 157<br />
increased life expectancy through education<br />
155, 156<br />
mother tongue, <strong>and</strong> educational attainment 76<br />
mother tongue instruction<br />
early childhood education 211<br />
in early education 267, 268–269, 268, 270<br />
effect in national learning assessments 202,<br />
203<br />
monitoring 377<br />
segregated schools 107<br />
for traditional knowledge acquisition 28–29<br />
training for 164, 166<br />
mothers<br />
effect of gender attitudes on children 90<br />
effect of maternal education 82–84, 85, 91,<br />
165, 217<br />
motor development, young children 216, 217<br />
Mozambique<br />
adult education 240<br />
agriculture 46<br />
early childhood development 217<br />
education aid 138, 355<br />
education expenditure 347<br />
educational attainment 74, 81, 186, 371<br />
gender disparity 74, 75<br />
gender-based violence 81, 109<br />
health interventions 140<br />
integrated programmes 140<br />
intimate partner violence 81<br />
literacy 75, 281<br />
malaria prevalence 371<br />
national assessments 200<br />
out-of-school children 183<br />
over-age children 183<br />
primary education 183, 183, 186<br />
rural areas 75<br />
scholarships 321<br />
school completion 186<br />
secondary education 183, 186<br />
students abroad 323<br />
teacher absenteeism 191<br />
teacher skills 198, 333<br />
teaching methods 191<br />
tertiary education 231<br />
violence in schools 316<br />
voter education 98<br />
within country disparity 186, 231<br />
years of education 186<br />
multiculturalism<br />
attitudes towards 304<br />
extracurricular activities 299<br />
multilateral aid mechanisms 137<br />
multilingual education 269<br />
see also language of instruction; mother<br />
tongue instruction<br />
Multiple Indicator Cluster Surveys (MICS) 196,<br />
197, 208, 209, 215, 219, 257, 263, 278,<br />
280<br />
Module on Child Functioning 267, 267<br />
multisectoral aid programmes 144–145<br />
multisectoral approaches see integrated<br />
approaches<br />
municipal development plans, incorporation of<br />
SDGs 141<br />
Muscat Declaration on EFA targets 180<br />
Myanmar<br />
early childhood care <strong>and</strong> education 210<br />
education expenditure 346, 348, 348<br />
electricity provision 312<br />
gender disparity 230<br />
income level 354<br />
national school census 309<br />
natural disasters 33<br />
out-of-school children 183<br />
pre-primary education 209<br />
primary education 183, 312<br />
secondary education 183, 312<br />
students abroad 323<br />
tertiary education 230<br />
within country disparity 210<br />
MyWorld survey 6<br />
N<br />
NALABE 198<br />
Namibia<br />
basic education 138<br />
climate change education 34–35<br />
education aid 138<br />
educational attainment 74, 81, 186<br />
electricity provision 312<br />
gender disparity 74, 75<br />
global citizenship education 290, 294<br />
intimate partner violence 81<br />
literacy 75, 281<br />
pre-primary enrolment 207<br />
primary education 186, 312<br />
rural areas 75<br />
school completion 186<br />
secondary education 186, 312<br />
sexuality education 297<br />
teacher education 297<br />
teaching methods 102<br />
tertiary education 231<br />
textbooks 189<br />
within country disparity 186, 231<br />
years of education 186<br />
National Assessment of Educational Progress<br />
(United States) 300<br />
National Assessment of Learning Achievement<br />
in Basic Education (NALABE) 198<br />
national development plans<br />
incorporation of SDGs 141<br />
see also education planning; national plans<br />
national education accounts 234, 342–346<br />
for monitoring 379<br />
National Foundation for Education Research,<br />
citizenship education 299<br />
National Geographic–Roper 2002 Global<br />
Geographic Literacy Survey 302–303<br />
National Geographic–Roper Public Affairs 2006<br />
Geographic Literacy Study 303<br />
national indicators 181<br />
national learning assessments 198–203, 198, 199<br />
characteristics 198–199, 199<br />
citizen-led 196, 201<br />
on environmental knowledge 301–302<br />
frameworks 200<br />
funding 201<br />
in inequality measurement 257<br />
monitoring 378, 380<br />
in mother tongue 202, 203<br />
organization <strong>and</strong> delivery 200<br />
primary education 198<br />
quality 199–201<br />
reliability 360<br />
national plans, implementation 80, 142–143, 147<br />
national qualifications frameworks 142, 227<br />
national reviews 387<br />
National School Lunch Program (United States)<br />
79<br />
National Survey on Household Living Conditions<br />
<strong>and</strong> Agriculture (Niger) 279<br />
native language see mother tongue; mother<br />
tongue instruction<br />
natural disasters<br />
disaster preparedness initiatives 34, 157<br />
education for resilience 157<br />
effects 33, 273, 310<br />
natural resources decline 22<br />
nature conservation education 24, 25<br />
Nauru<br />
violence in schools 316<br />
neighbourhood management projects 125<br />
Nepal<br />
adolescent birth rate 370<br />
child development 219<br />
child health 82<br />
climate change 33<br />
conflict 104<br />
early childhood care <strong>and</strong> education 210,<br />
213, 213<br />
education aid 355<br />
educational attainment 81, 186, 370<br />
electricity provision 86, 312, 313<br />
female literacy 83<br />
gender disparity 75, 230<br />
gender equality initiatives 92<br />
HIV education 292<br />
home learning environment 215<br />
internet access 313<br />
intimate partner violence 81<br />
language of instruction 104<br />
literacy 75, 82, 83, 196, 219, 281<br />
literacy programme participation 277, 278<br />
national education accounts 343, 344, 344,<br />
345<br />
natural disasters 33, 33, 310<br />
numeracy 219<br />
peacebuilding 108<br />
pre-primary education 209<br />
pregnancy education 84<br />
primary education 186, 187, 196, 312<br />
private education 187<br />
reading proficiency 196<br />
rural areas 75, 122<br />
school completion 186<br />
secondary education 186, 312<br />
students abroad 323<br />
tertiary education 229, 230<br />
TVET participation 224<br />
under-5 mortality rate 83<br />
underweight children 80<br />
urban areas 122<br />
wealth disparities 122<br />
within country disparity 186, 210<br />
years of education 186<br />
NESLI 364, 364<br />
net enrolment ratio, pre-primary education<br />
207–208, 208<br />
Netherl<strong>and</strong>s<br />
adult education 238<br />
education aid donor 355<br />
education expenditure 233<br />
education funding 351<br />
environmental education 301<br />
equity improvement 351, 352<br />
gender disparity 230<br />
household expenditure 233<br />
integrated interventions 125<br />
literacy 282<br />
parent governors 294<br />
primary education 187<br />
private education 232<br />
school completion 187<br />
secondary education 187, 238<br />
socio-economic background <strong>and</strong><br />
perseverance 249<br />
special educational needs 266<br />
student support 233<br />
sustainable transport 121<br />
2016 • GLOBAL EDUCATION MONITORING REPORT 521
teacher contracts 337<br />
tertiary education 229, 230, 231, 232, 233, 238<br />
TVET 223, 224<br />
urban planning 125<br />
within country disparity 231<br />
women in politics 71<br />
see also Curaçao<br />
New Opportunities Initiative (Portugal) 238<br />
New York, city leadership 129<br />
New Zeal<strong>and</strong><br />
childhood obesity 79<br />
discrimination <strong>and</strong> secondary completion 87<br />
environmental education 301<br />
financial literacy 251<br />
gender disparity 87, 230<br />
health <strong>and</strong> nutrition programmes 79<br />
human rights education 300<br />
literacy 282<br />
parent governors 294<br />
pre-primary enrolment 207<br />
school completion 87<br />
school-based interventions 79<br />
secondary education 87<br />
socio-economic background <strong>and</strong><br />
perseverance 249<br />
tertiary education 229, 230, 232, 233<br />
women in politics 71<br />
Ngobe community concept ti nûle kûin (Panama)<br />
27<br />
NGOs<br />
education financing 344, 345<br />
entrepreneurship programmes 253<br />
environmental education programme 31<br />
justice programmes 110<br />
peace education programmes 108<br />
role in SDF agenda 145<br />
Solar-Powered Floating Schools programme<br />
(Bangladesh) 33<br />
teacher motivation diagnostic tool 334<br />
Nicaragua<br />
early childhood development 217<br />
educational attainment 74<br />
electricity provision 312<br />
gender disparity 74<br />
global citizenship education 294<br />
HIV education 292<br />
mathematics achievement 195<br />
natural disasters 33, 310<br />
primary education 186, 195, 196, 312<br />
psychological bullying in schools 315<br />
reading proficiency 195, 196<br />
school completion 186<br />
secondary education 186, 312<br />
tertiary education 231<br />
violence in schools 315<br />
within country disparity 231<br />
Niger<br />
agriculture 46<br />
basic education 138<br />
climate change adaptation 10<br />
education aid 138<br />
education expenditure 347<br />
educational attainment 10, 74, 82, 186<br />
electricity provision 312<br />
female genital mutilation 82<br />
gender disparity 74, 74, 75<br />
global citizenship education 294<br />
health programmes 140<br />
HIV education 292<br />
integrated programmes 140<br />
literacy 74, 75, 281<br />
literacy programme participation 278, 278,<br />
279, 279<br />
mathematics achievement 202<br />
national assessments 202<br />
out-of-school children 183<br />
primary education 183, 186, 312, 330<br />
reading proficiency 202<br />
rural areas 74, 75<br />
school completion 186<br />
secondary education 183, 186, 312<br />
students abroad 323<br />
teacher recruitment 330<br />
teaching methods 191<br />
tertiary education 231<br />
textbooks 190<br />
within country disparity 185, 186, 231<br />
years of education 185, 186<br />
Nigeria<br />
agriculture 47<br />
aid 141<br />
attacks on schools 317<br />
child development 219<br />
conflict 99, 105, 271<br />
early childhood care <strong>and</strong> education 210,<br />
213, 213<br />
education aid 138<br />
educational attainment 73, 74, 76, 81, 82,<br />
83, 186<br />
environmental education 30<br />
ethnic minorities 76<br />
female genital mutilation 82<br />
fertility rate 83<br />
gender disparity 74, 74, 75, 76<br />
gender insensitive teaching 265<br />
health interventions 88<br />
HIV education 292<br />
home learning environment 215<br />
instructional teaching time 192, 192<br />
integrated programmes 141<br />
internally displaced persons 272<br />
intimate partner violence 81<br />
linguistic diversity 268<br />
literacy 74, 75, 219, 281<br />
loss of educational facilities 105<br />
national assessments 198<br />
nomad-specific education plans 9<br />
numeracy 219<br />
out-of-school children 182<br />
population growth 21<br />
pre-primary education 118<br />
primary education 83, 118, 182, 186, 187, 263,<br />
335<br />
private education 187<br />
private schools 118<br />
pupil/teacher ratios 213<br />
RCE Minna 30<br />
rural areas 74, 75<br />
school completion 186, 263<br />
secondary education 186<br />
sustainable initiatives 30, 121<br />
teacher induction 335<br />
teaching methods 191<br />
tertiary education 231<br />
textbooks 190–191<br />
under-5 mortality rate 371<br />
underweight children 80<br />
urban planning 126<br />
voter education campaigns 99<br />
within country disparity 76, 185, 186, 210, 231<br />
years of education 185, 186<br />
Niue, violence in schools 316<br />
nomadic communities 9, 72<br />
non-cognitive skills 247–250, 248, 250–252<br />
non-formal education 8, 9<br />
adult education 45, 236–237, 238<br />
for gender equality 163<br />
<strong>and</strong> political engagement 100<br />
for sexual health 84, 291<br />
non-government organisations see NGOs<br />
non-OECD countries<br />
basic skills for economic growth 49<br />
lost revenue due to tax treaties 135<br />
Nordic Countries see Denmark; Finl<strong>and</strong>; Icel<strong>and</strong>;<br />
Norway; Sweden<br />
Northern Africa<br />
adolescent birth rate 370<br />
adult literacy 280<br />
conflict 104, 183<br />
countries listed 399<br />
ecological footprint 21<br />
education aid 354<br />
education expenditure 346<br />
educational attainment 55, 88, 370<br />
employment 88<br />
enrolment 182<br />
environmental education 301<br />
gender disparity 88, 260, 262, 280<br />
HIV education 292<br />
human rights education 295<br />
out-of-school children 104, 182, 183<br />
population growth 21<br />
pre-primary education 207, 331, 331<br />
primary education 153, 153, 182, 183, 260, 262<br />
repetition rate 183<br />
school completion 154, 156, 260<br />
school textbooks 295<br />
secondary education 153, 154, 155, 156, 182,<br />
260, 262, 331<br />
teacher education 331, 331<br />
tertiary education 229<br />
TVET enrolment 223<br />
under-5 mortality rate 156, 371<br />
unemployment 55<br />
universal primary education 153, 153<br />
universal secondary education 153, 154, 155,<br />
156<br />
wealth disparities 251, 260<br />
youth literacy 280<br />
see also individual countries<br />
Northern America<br />
adult literacy 280<br />
agriculture 45<br />
childhood obesity 79<br />
ecological footprint 22<br />
education aid 354<br />
education expenditure 346, 346<br />
electoral participation 98<br />
employment 49<br />
enrolment 182<br />
environmental education 301<br />
ethnic minority groups 124, 267<br />
with Europe, countries listed 398<br />
gender disparity 260, 262, 280<br />
global citizenship education 294<br />
health <strong>and</strong> nutrition programmes 79<br />
HIV education 292<br />
Holocaust in curriculum 290<br />
human rights education 295<br />
migration 271<br />
out-of-school children 182<br />
population growth 21<br />
pre-primary enrolment 207<br />
primary education 153, 182, 260, 262<br />
school completion 154, 156, 260<br />
school curriculum 290<br />
school textbooks 295<br />
secondary education 153, 153, 154, 155, 156,<br />
182, 260, 262<br />
tertiary education 101, 229<br />
under-5 mortality rate 156<br />
universal primary <strong>and</strong> secondary education<br />
153, 153, 154, 155, 156<br />
wealth disparities 260<br />
youth literacy 280<br />
Northern Irel<strong>and</strong><br />
conflict <strong>and</strong> segregation in schools 107<br />
Norway<br />
crime rate 120<br />
digital literacy skills 247<br />
education expenditure 233, 234<br />
education funding 350<br />
educational attainment 88, 120<br />
employment <strong>and</strong> earnings 88, 89, 120<br />
environmental education 301<br />
equity improvement 350<br />
financial literacy 251<br />
gender disparity 70, 88, 230<br />
gender equality 89<br />
global citizenship education 294, 300<br />
household expenditure 233<br />
ICT facilities 314<br />
intimate partner violence 82<br />
language of instruction 269<br />
literacy 282<br />
mathematics achievement 109<br />
522<br />
ANNEX | INDEX
primary education 314<br />
secondary education 314, 334<br />
socio-economic background <strong>and</strong><br />
perseverance 249<br />
special educational needs 266, 266<br />
student outcomes assessment 236<br />
student support 233, 234<br />
teacher induction 334<br />
tertiary education 228, 229, 230, 233, 234<br />
violence in schools 109<br />
women in politics 70<br />
Nourishing Bodies, Nourishing Minds initiative<br />
140<br />
Nueva Escuela Unitaria (Guatemala) 102<br />
numeracy<br />
<strong>and</strong> economic growth 48<br />
effect on earnings 49<br />
effect of home environment 86<br />
<strong>and</strong> ICT skills 246<br />
learning outcomes 202, 283–284, 283<br />
level of skill 283, 284<br />
on-track development 216, 217, 219<br />
see also functional literacy; mathematics;<br />
mathematics achievement<br />
nutrition<br />
school-based interventions 78–80<br />
see also malnutrition; stunting; underweight<br />
children<br />
O<br />
occupational employment, <strong>and</strong> educational<br />
attainment 60<br />
ODA see official development assistance (ODA)<br />
odds ratio, in inequality measurement 258, 258<br />
OECD<br />
Assessment of Higher Education Learning<br />
Outcomes (AHELO) 236<br />
Development Assistance Committee (DAC)<br />
aid for basic <strong>and</strong> secondary education<br />
352–353<br />
development aid 137<br />
scholarship aid 324<br />
disabilities classification for monitoring 266<br />
INES Network for System-Level Indicators<br />
(NESLI), data tool 363–364, 364<br />
International Network on Financial<br />
Education questionnaire 250<br />
PIACC 60–61, 247, 280, 281, 282, 283, 283,<br />
333<br />
Teaching <strong>and</strong> Learning International Survey<br />
379<br />
OECD countries<br />
educational attainment 56, 59, 75, 75–76<br />
employment 56, 58, 59, 60–61<br />
gender disparity 60, 61, 70, 88, 88<br />
immigrants 75–76<br />
literacy 59, 74<br />
poverty reduction through public services<br />
targeting 368<br />
effect of socio-economic background 74<br />
teacher attrition 339<br />
teacher salaries 337<br />
see also developed countries; high income<br />
countries<br />
OEI 364, 364<br />
official development assistance (ODA) 143–145,<br />
324, 355–356, 356, 404<br />
see also aid; donors; education aid<br />
official language<br />
<strong>and</strong> political engagement 98<br />
see also language of instruction<br />
Oman<br />
child development 219<br />
early childhood care <strong>and</strong> education 210<br />
electricity provision 313<br />
HIV education 292<br />
home learning environment 215<br />
ICT facilities <strong>and</strong> internet access in schools<br />
313, 314<br />
internet access 313<br />
literacy 219<br />
numeracy 219<br />
pre-primary education 209<br />
teacher education 332<br />
TVET enrolment 223<br />
violence in schools 316<br />
within country disparity 210<br />
women in politics 71<br />
One Laptop per Child project (Rw<strong>and</strong>a) 313<br />
One Million Schoolbags initiative (Morocco) 352<br />
one-to-one approaches, for environmental<br />
change 32<br />
open defecation sanitation projects 93<br />
Open Working Group for SDGs 180<br />
opinion surveys, for data collection 303, 304<br />
organic farming 46<br />
Organization of Ibero-American States (OEI)<br />
364, 364<br />
originality, as employment skill 50<br />
Oslo Summit on Education for Development<br />
2015 134–135<br />
Ottawa Charter for Health Promotion 291<br />
Our Common Future (Brundtl<strong>and</strong> Report) 3–4<br />
out-of-school children<br />
categories 180<br />
children with disabilities 76<br />
conflict-affected areas 104–105, 105, 182–183<br />
dropout 85, 90, 117, 181<br />
effect of violence against schools 317<br />
effect of violence in schools 123<br />
flexible approaches for 9<br />
gender disparity 180–181, 181, 182, 259, 260<br />
global perspective 162, 182, 182<br />
internally displaced children 272<br />
marginalized populations 73<br />
never enrolled 180–181, 181<br />
reading proficiency 196<br />
rural areas 196<br />
skills monitoring 196, 377, 381<br />
wealth disparities 259, 260<br />
within country disparities 181, 181<br />
see also school completion; school dropout;<br />
second chance programmes<br />
out-of-school civic activities<br />
environmental education 26<br />
see also extracurricular activities<br />
over-age children, primary <strong>and</strong> secondary<br />
education 183, 184, 259<br />
overweight children<br />
prevalence 80<br />
see also childhood obesity<br />
own-account employment (self-employment)<br />
58, 58, 89<br />
improvement interventions 140<br />
see also entrepreneurship skills; home-based<br />
workers<br />
ozone depletion 20<br />
Pacific<br />
adult literacy 280<br />
climate change education 35<br />
countries listed 399<br />
disabled access to schools 311<br />
discrimination of marginalized groups 73<br />
education aid 354<br />
education expenditure 346<br />
enrolment 182<br />
environmental education 301<br />
gender disparity 262, 280<br />
global citizenship education 296<br />
HIV education 292<br />
linguistic diversity 267<br />
migration 271<br />
out-of-school children 182<br />
population growth 21<br />
pre-primary enrolment 207<br />
primary education 153, 182, 262<br />
P<br />
secondary education 153, 182, 262<br />
sexuality education 291, 292<br />
teacher education 296<br />
tertiary education 229<br />
TVET 223, 226<br />
under-5 mortality rate 156<br />
universal primary <strong>and</strong> secondary education<br />
153<br />
youth literacy 280<br />
see also individual countries<br />
Pacific Community, qualification frameworks<br />
227<br />
Pacific Isl<strong>and</strong>s Climate Education Partnership<br />
(PCEP) 35<br />
Pakistan<br />
adolescent birth rate 370<br />
attacks on schools 317<br />
climate change 34<br />
computer access 245<br />
conflict 104<br />
curriculum 104<br />
early childhood care programmes 85<br />
education aid 200<br />
education expenditure 136, 136, 347<br />
educational attainment 73, 74, 186, 370<br />
employment 70, 140<br />
enrolment 106, 106<br />
gender disparity 70, 74, 75<br />
health programmes 140<br />
integrated programmes 140, 140<br />
linguistic diversity 268<br />
literacy 74, 75, 281<br />
national assessments 199<br />
out-of-school children 183, 196, 272<br />
population growth 21<br />
pregnancy education 84<br />
primary education 34, 106, 183, 186, 197, 261,<br />
261<br />
reading proficiency 196, 197<br />
refugees 106, 106, 272<br />
rural areas 74, 75, 122, 196<br />
scholarships 321<br />
school completion 34, 186, 261, 261<br />
secondary education 34, 106, 183, 186, 197,<br />
272<br />
sexuality education 291<br />
stunted children 85<br />
sustainable development education 297<br />
teacher attrition 339<br />
teacher education 297<br />
tertiary education 231<br />
under-5 mortality rate 371<br />
underweight children 80<br />
urban areas 122<br />
violence in schools 316<br />
voter education 98<br />
wealth disparities 122, 261, 261<br />
within country disparity 186, 231<br />
years of education 186<br />
PAL Network 194–195<br />
Palau<br />
gender disparity 230<br />
tertiary education 229, 230<br />
Palestine<br />
attacks on schools 317<br />
child development 219<br />
conflict <strong>and</strong> education 103<br />
educational attainment 75, 103, 186<br />
electricity provision 312, 313<br />
entrepreneurship skills 253<br />
gender disparity 75, 230<br />
home learning environment 215<br />
ICT facilities 314<br />
internet access 312, 313<br />
literacy 219, 281<br />
numeracy 219, 283<br />
pre-primary education 209<br />
primary education 186, 312, 314, 330, 335<br />
refugees from 272<br />
rural areas 122<br />
school completion 186<br />
secondary education 186, 312, 314<br />
2016 • GLOBAL EDUCATION MONITORING REPORT 523
teacher education 330, 335, 336<br />
tertiary education 228, 229, 230, 231<br />
urban areas 122<br />
violence in schools 316<br />
wealth disparities 122<br />
within country disparity 186, 231<br />
years of education 186<br />
Palestine Education for Employment initiative<br />
253<br />
Panama<br />
buen vivir approach 27<br />
child development 219<br />
early childhood care <strong>and</strong> education 210<br />
educational attainment 186<br />
global citizenship education 294<br />
home learning environment 215<br />
literacy 195, 219<br />
mathematics achievement 195<br />
numeracy 195, 219<br />
pre-primary education 209, 338<br />
primary education 186, 195, 338<br />
psychological bullying in schools 315<br />
reading proficiency 195<br />
school completion 186<br />
scientific researchers 372<br />
secondary education 186, 338<br />
sustainable living 27<br />
teacher salaries 338<br />
tertiary education 229, 231<br />
violence in schools 315<br />
within country disparity 186, 210<br />
years of education 186<br />
Papua New Guinea<br />
HIV education 292<br />
pre-primary enrolment 207<br />
TVET fees 226<br />
underweight children 80<br />
Paraguay<br />
early childhood development 217<br />
electricity provision 312, 313<br />
global citizenship education 294, 300<br />
health care 78<br />
ICT facilities 314<br />
internet access 313<br />
language of instruction 270<br />
learning cities 126<br />
mathematics achievement 195<br />
multicultural attitudes 304<br />
numeracy 195, 283<br />
pre-primary education 338<br />
pre-primary enrolment 208<br />
primary education 195, 312, 314, 338<br />
psychological bullying in schools 315<br />
reading proficiency 195<br />
school infrastructure index 308<br />
secondary education 312, 314, 338<br />
teacher salaries 338<br />
violence in schools 315<br />
parents<br />
effect of health on children’s education 85<br />
effect of home environment 197, 214, 215,<br />
215<br />
effect of parental gender attitudes on<br />
women’s employment 90<br />
effect of school choice on education 123<br />
involvement in school governance 294<br />
parenting skill interventions 108<br />
see also mothers<br />
Parents Make the Difference (Liberia) 108<br />
Paris, bike-sharing scheme 121<br />
Paris Agreement on climate change 2015 32<br />
parity index 257–262, 258, 258, 259, 260, 261<br />
see also gender disparity; location disparity;<br />
wealth disparities; within country<br />
disparities<br />
part-time study, tertiary education 232<br />
participation indicators, tertiary education 228,<br />
228<br />
participatory budgeting 92<br />
participatory politics, effect of education <strong>and</strong><br />
literacy 97–102<br />
Partnership for Higher Education in Africa 321<br />
partnerships<br />
civic <strong>and</strong> private partnerships 145–146<br />
climate change education 34, 35<br />
development financing 145–147<br />
GEM policy recommendations 167<br />
global 146–147<br />
health <strong>and</strong> education 165<br />
policy coherence in integrated approaches<br />
139–145<br />
working through agency 11<br />
see also integrated approaches<br />
Paryavaran Mitra programme (India) 26<br />
PASEC 202–203, 270<br />
pastoralists 9, 72, 77<br />
PCEP 35<br />
peacebuilding<br />
GEM policy recommendations 166<br />
international framework recommendations<br />
289<br />
role of education <strong>and</strong> literacy 97–102,<br />
107–108<br />
in school curricula 293<br />
see also conflict; justice; participatory politics<br />
pedagogy see learning environment; teaching<br />
methods<br />
PEFA 349<br />
pension programmes, effects 90<br />
<strong>people</strong> see human potential; individual named<br />
groups; social development<br />
<strong>people</strong> with disabilities<br />
access to school buildings 310–311<br />
marginalization 72, 76, 265<br />
rights <strong>and</strong> access 265–267, 266, 267<br />
<strong>people</strong>, <strong>planet</strong> <strong>and</strong> prosperity’, in 2030<br />
sustainability agenda 4<br />
People’s Action for Learning (PAL) Network<br />
194–195<br />
peri-urban areas, private schools 118<br />
perseverance, as a work skill 248–249<br />
Peru<br />
childhood obesity 80<br />
conflict 103<br />
early childhood development 217<br />
educational attainment 74, 81, 186<br />
electricity provision 86<br />
employment 140<br />
entrepreneurship skills 252<br />
equity improvement 351<br />
gender disparity 74<br />
global citizenship education 294<br />
instructional teaching time 191<br />
integrated programmes 140<br />
intimate partner violence 81<br />
literacy 92, 195, 281<br />
mathematics achievement 195<br />
national assessments 200<br />
participatory budgeting 92<br />
pre-primary education 338<br />
primary education 187, 187, 195, 338<br />
private education 187<br />
psychological bullying in schools 315<br />
reading proficiency 195<br />
school completion 187<br />
school curriculum 107<br />
secondary education 187, 338<br />
socio-economic background <strong>and</strong><br />
perseverance 249<br />
teacher salaries 338<br />
tertiary education 231<br />
TVET enrolment 223<br />
urban planning 126<br />
violence in schools 315, 316<br />
within country disparity 186, 231<br />
years of education 186<br />
Pew Research Centre surveys 304<br />
Philippines<br />
climate change 34<br />
conflict 104–105, 105<br />
deskilling of women migrating abroad 117<br />
disaster preparedness 34<br />
ecological footprint 23<br />
educational attainment 74, 81, 104–105,<br />
105, 186<br />
electricity provision 86, 312<br />
environmental concern 304<br />
gender disparity 74, 104–105, 105<br />
intimate partner violence 81<br />
learning cities 126<br />
literacy 86, 281<br />
mother tongue instruction 269<br />
natural disasters 33, 310<br />
out-of-school children 105<br />
primary education 34, 186, 312<br />
rural areas 122<br />
school completion 34, 186<br />
secondary education 34, 186, 312<br />
teacher education 332<br />
tertiary education 231<br />
under-5 mortality rate 370, 371<br />
underweight children 80<br />
urban areas 122<br />
violence in schools 316<br />
wealth disparities 122<br />
within country disparity 186, 231<br />
years of education 186<br />
physical punishment 108, 316<br />
physical violence<br />
bullying 315, 315–316, 315, 316<br />
in partnerships 81, 81<br />
PIACC see Programme for the International<br />
Assessment of Adult Competencies<br />
(PIACC)<br />
PIACC countries (OECD), skill levels <strong>and</strong> income<br />
60–61<br />
PIRLS 269<br />
PISA see Programme for International Student<br />
Assessment (PISA)<br />
PISA for Development tool 198<br />
<strong>planet</strong>ary boundaries (environment) 20, 20<br />
Plurinational State of Bolivia<br />
adult education 237, 237<br />
buen vivir approach 4, 27<br />
discrimination <strong>and</strong> secondary completion 87<br />
educational attainment 57, 58, 74, 186<br />
employment 58, 70, 89<br />
employment skills 59<br />
gender disparity 70, 74, 87, 89<br />
literacy 59, 281, 282<br />
pre-primary education 338<br />
primary education 186, 338<br />
school completion 87, 186<br />
second chance programmes 237, 237<br />
secondary education 87, 186, 338<br />
sustainable living 27, 28<br />
teacher salaries 338<br />
tertiary education 59, 231<br />
under-5 mortality rate 370, 371<br />
violence in schools 316<br />
within country disparity 186, 231<br />
working poverty 57<br />
years of education 186<br />
Pol<strong>and</strong><br />
adult education 238, 238<br />
civic education 100<br />
digital literacy skills 247<br />
education expenditure 233<br />
environmental education 301<br />
equity improvement 351<br />
financial literacy 251<br />
gender disparity 230<br />
household expenditure 233<br />
human rights education 300, 300<br />
ICT facilities 314<br />
language of instruction 269<br />
literacy 282<br />
political participation 71, 100<br />
primary education 187, 314<br />
professional development of teachers 336<br />
school completion 187<br />
secondary education 187, 238, 314<br />
socio-economic background <strong>and</strong><br />
perseverance 249<br />
special educational needs 266<br />
student support 233<br />
524<br />
ANNEX | INDEX
tertiary education 228, 229, 230, 232, 233, 238<br />
women in politics 71<br />
police, training 110–111<br />
policy coherence for development 143–144<br />
policy recommendations, GEM 165–167<br />
political activism 99–101, 99<br />
political engagement<br />
<strong>and</strong> educational level 98<br />
see also participatory politics<br />
political roles, gender disparity 70, 71, 82, 89–90<br />
political systems see authoritarian regimes;<br />
democracy<br />
political violence, <strong>and</strong> education level 103<br />
pollution 20, 86<br />
health effects 68<br />
poorer countries<br />
class sizes 329<br />
digital literacy 247<br />
education expenditure 342, 347<br />
employment <strong>and</strong> education 56, 59<br />
literacy 59, 219<br />
pre-primary education participation 209, 210<br />
private sector funding 145–146<br />
TVET student background 226<br />
within country disparities 76<br />
see also least developed countries; low<br />
income countries; wealth disparities<br />
population growth 21, 44<br />
cities 116, 116<br />
population-related indicators 394<br />
Portugal<br />
adult education 238, 238, 238<br />
education aid donor 333<br />
education funding 350<br />
environmental education 301<br />
equity improvement 238<br />
gender disparity 230<br />
global citizenship education 294<br />
ICT facilities 314<br />
primary education 314<br />
secondary education 238, 238, 314<br />
socio-economic background <strong>and</strong><br />
perseverance 249<br />
special educational needs 266<br />
teacher education 336<br />
tertiary education 228, 229, 230, 238<br />
women in politics 71, 99<br />
post-secondary education<br />
education aid 138–139, 139, 353<br />
<strong>and</strong> political engagement 98, 100<br />
see also educated populations; second<br />
chance programmes; technical <strong>and</strong><br />
vocational education <strong>and</strong> training;<br />
tertiary education<br />
poverty<br />
effect of agricultural extension 46<br />
conflict incentive 103<br />
<strong>and</strong> crime 122<br />
donor priority for aid 138<br />
<strong>and</strong> economic growth 40, 46<br />
effect of climate change 40<br />
effect of education expansion 156–157, 157<br />
<strong>and</strong> food prices 45<br />
gender disparity 73, 74, 74–75<br />
integrated approaches 141<br />
<strong>and</strong> marginalization 73–75, 74–75<br />
<strong>and</strong> urban isolation 122<br />
see also extreme poverty; least developed<br />
countries; low income countries;<br />
poorer countries; socio-economic<br />
background; within country<br />
disparities; working poverty<br />
pre-academic skills 216, 218<br />
pre-primary education<br />
enrolment 117, 207–208, 208<br />
missing finance data 349<br />
participation 206–210, 207, 208, 209, 210<br />
private education 118<br />
teachers 328, 330, 331, 331<br />
see also early childhood care <strong>and</strong> education<br />
pregnancy<br />
lack of care for women with disabilities 72<br />
see also maternal education<br />
prejudice, leading to conflict 103–104<br />
premature deindustrialization 51<br />
PRIDI 217–218, 218<br />
primary education<br />
academically qualified teachers 330<br />
access 73, 180–181<br />
<strong>and</strong> adolescent birth rate 370, 370<br />
aid distribution inequality 138<br />
children with disabilities 72, 76<br />
completion programmes for adults 237<br />
compulsory education 185, 187<br />
for economic growth 119<br />
effect of educational attainment 46, 83, 186<br />
enrolment<br />
adjusted net enrolment 181–182, 182, 183<br />
adult learners 237<br />
conflict-affected areas 104, 106<br />
global 9, 182, 182<br />
incentives 78<br />
pre-primary children 207<br />
private education 187<br />
refugees 117<br />
entrants with pre-primary education 208,<br />
209<br />
expenditure per student indicator 345<br />
financing from taxes 136<br />
gender disparity 182, 183, 184, 184, 185, 259,<br />
259, 260, 262, 262<br />
<strong>and</strong> gender-based violence 81, 82, 316<br />
gross intake rate 184<br />
human rights education 290<br />
ICT facilities 312, 312–313, 313, 313, 314<br />
indigenous <strong>people</strong>s 72<br />
infrastructure index 308<br />
internet access 313<br />
late entry 183<br />
marginalized groups 73<br />
mathematics achievement 195, 195, 197, 197<br />
missing finance data 349<br />
in mother tongue or comprehended<br />
language 267<br />
national learning assessments 198<br />
out-of school children 76, 104–105, 105, 106,<br />
182, 182, 183<br />
over-age children in education 183, 184<br />
<strong>and</strong> political engagement 100<br />
pupil/teacher ratio 328, 329<br />
reading proficiency 195, 196, 196, 197<br />
repetition rate 183<br />
rural areas 121, 259<br />
school completion<br />
adult non-completion 237<br />
parity indicators 259, 259, 260, 261<br />
<strong>and</strong> poverty 121<br />
rates 69, 184, 185, 185, 186–187, 263, 263<br />
universal completion 151, 152, 153, 154<br />
school participation 182, 182, 272<br />
sexuality education 291<br />
skills assessments 194–195, 196<br />
teachers 331, 331, 335, 336, 337, 337, 338, 338<br />
urban areas 121, 259<br />
water <strong>and</strong> sanitation 309<br />
wealth disparities 184, 185, 259, 259, 260<br />
<strong>and</strong> working poverty 57<br />
see also basic education; universal primary<br />
education<br />
private education<br />
in city areas 122–123, 123<br />
enrolment share 187<br />
teacher retention 339<br />
tertiary education 233<br />
in urban areas 118<br />
private sector<br />
multisectoral approaches 163<br />
role in SDG funding 145–146, 167<br />
scholarship schemes 320–321<br />
problem-solving skills 59, 248<br />
professional development, teachers 336<br />
Program H/M (Brazil) 91–92<br />
Programme for the International Assessment of<br />
Adult Competencies (PIACC)<br />
literacy information 280, 281–282, 282<br />
numeracy definition <strong>and</strong> measurement 283,<br />
283<br />
problem solving with technology 247<br />
skill levels <strong>and</strong> income 60–61<br />
teacher skills 333<br />
Programme for International Student<br />
Assessment (PISA)<br />
collaboration skill tests 248<br />
curricula for sustainable development 25, 26<br />
digital reading 247<br />
environmental education 10, 301, 301<br />
extracurricular activities 298<br />
financial literacy 251, 251<br />
global competence 303, 303<br />
mathematics skills 48, 265<br />
parental involvement in school governance<br />
294<br />
perseverance tests 249, 249<br />
PISA for Development tool 198<br />
science achievement 10, 48, 265, 301, 301<br />
TVET backgrounds 226<br />
Progress in International Reading Literacy Study<br />
(PIRLS), language monitoring 269<br />
Project Atlas, data on internationally mobile<br />
students abroad 324<br />
prosperity<br />
<strong>and</strong> economic growth 39–40, 52–53<br />
GEM policy recommendations 165<br />
see also economic growth; high income<br />
countries; richer countries<br />
psychological violence 82, 109, 315, 315<br />
PTR 328–329, 330, 330<br />
public awareness campaigns 29, 164, 165<br />
public education expenditure<br />
budgetary allocations 136<br />
percentages 346, 346, 347, 347, 348, 348, 349<br />
recommendations 135<br />
see also education expenditure<br />
Public Expenditure <strong>and</strong> Financial Accountability<br />
(PEFA) programme 349<br />
public service provision, integrated approaches<br />
92<br />
public transport sustainability 120–121<br />
pupil/computer ratios 312–313, 314<br />
pupil/teacher ratios 328–329, 330, 330<br />
Q<br />
Qatar<br />
child development 219<br />
early childhood care <strong>and</strong> education 210<br />
educational attainment 76<br />
electricity provision 312, 313<br />
environmental education 301, 301<br />
ethnic minorities 76<br />
home learning environment 215<br />
ICT facilities 314<br />
internet access 313<br />
as knowledge economy 119<br />
literacy <strong>and</strong> numeracy 219<br />
pre-primary education 209<br />
primary education 312, 314<br />
secondary education 312, 314<br />
socio-economic background <strong>and</strong><br />
perseverance 249<br />
tertiary education 231<br />
violence in schools 315, 316<br />
within country disparity 210<br />
women in politics 71<br />
Qingdao Declaration on ICT 2015 311<br />
qualifications<br />
national qualifications frameworks 142, 227<br />
see also teacher education<br />
qualified teachers 107, 330–333, 331, 332, 333,<br />
334–336, 337<br />
quality of education<br />
adult education 240–241<br />
in agricultural training 47<br />
early childhood care <strong>and</strong> education 166–169<br />
2016 • GLOBAL EDUCATION MONITORING REPORT 525
early childhood education 210–213, 213<br />
for economic growth 39, 48–49, 119<br />
effect on political engagement 100<br />
<strong>and</strong> employment 56<br />
essential to SDG 9<br />
inequality a risk for conflict 103–104<br />
intra-urban disparity 122–123, 123<br />
learning outcomes 193–203, 195, 196, 197,<br />
197, 198, 199, 201, 202, 236, 299–302,<br />
303, 381<br />
measurement tools 211–212, 217<br />
monitoring 188, 188, 381<br />
for refugees 106<br />
slum dwellers need for schools 118<br />
for sustainability 34, 165<br />
teaching practices 191–193, 191, 192, 298<br />
technical <strong>and</strong> vocational education <strong>and</strong><br />
training (TVET) 226–227<br />
tertiary education 234–235, 235<br />
textbook availability 189–191, 190<br />
university ranking drawbacks 235<br />
R<br />
racial segregation 106–107, 123–124<br />
rainforest preservation <strong>and</strong> management 28<br />
range, in inequality measurement 258, 258<br />
rape 109<br />
ratio, in inequality measurement 258, 258<br />
RCE Minna (Nigeria) 30<br />
reading proficiency<br />
assessment 194–195, 195, 196, 197, 197<br />
<strong>and</strong> decent work 245<br />
immigrants 271<br />
in literacy monitoring 282, 282<br />
out-of-school children 196<br />
see also literacy<br />
rebel groups, recruitment of uneducated young<br />
men 103<br />
refugees<br />
education 106, 106, 166<br />
enrolment 117, 272–273<br />
monitoring 272<br />
regional assessments 201<br />
Regional Centres of Expertise (UN) 30<br />
regional data 395<br />
regional development plans, incorporation of<br />
SDGs 141<br />
regional disparity see cities; rural areas; urban<br />
areas; within country disparities<br />
regional government, data gaps on financing<br />
345<br />
regional indicators, development for monitoring<br />
181, 382, 387<br />
Regional Project on Child Development<br />
Indicators (PRIDI) project 217–218,<br />
218<br />
religious groups<br />
environmental advocacy 30<br />
inequality of education <strong>and</strong> conflict 103<br />
marginalization 72<br />
segregated schools 107, 123–124<br />
renewable energy 40–41<br />
repetition rate 183, 310<br />
Republic of the Congo see Congo<br />
Republic of Korea<br />
children with disabilities 266<br />
digital literacy skills 247<br />
early childhood care <strong>and</strong> education 212<br />
ecological footprint 22, 22<br />
education expenditure 234<br />
educational attainment 88<br />
electricity provision 312, 313<br />
employment <strong>and</strong> earnings 88, 89<br />
employment skills 59<br />
environmental education 26, 301<br />
ethnic minority groups 124<br />
gender disparity 88, 89, 230<br />
global citizenship education 295, 296, 300,<br />
300<br />
household expenditure 234<br />
Incheon declaration 7, 12<br />
internet access 313<br />
literacy 282<br />
migration 271<br />
out-of-school civic activities 26<br />
primary education 312<br />
private education 233<br />
pupil/teacher ratio <strong>and</strong> class size 329<br />
research <strong>and</strong> development expenditure 273<br />
school textbooks 295<br />
secondary education 152, 312, 329<br />
socio-economic background <strong>and</strong><br />
perseverance 249<br />
teacher education 296<br />
teaching methods 298<br />
tertiary education 59, 229, 229, 230, 233, 234<br />
TVET participation 224<br />
upper secondary school completion 152<br />
violence in schools 315<br />
women in politics 71<br />
Republic of Moldova<br />
child development 219<br />
childhood obesity 80<br />
early childhood care <strong>and</strong> education 210<br />
ecological footprint 23<br />
education expenditure 136<br />
educational attainment 75, 81, 186<br />
gender disparity 75, 230<br />
home learning environment 215<br />
intimate partner violence 81<br />
literacy 219, 281<br />
numeracy 219<br />
pre-primary education 209<br />
primary education 186, 335<br />
school completion 186<br />
secondary education 186<br />
sustainability 22<br />
teacher education 335<br />
tertiary education 229, 230, 231, 231<br />
within country disparity 186, 210, 231<br />
years of education 186<br />
research <strong>and</strong> development (R&D)<br />
for agriculture 47<br />
for comparative measurement in education<br />
383<br />
disparity in global deployment of staff 370,<br />
372<br />
funding 43, 47, 164, 372<br />
in sustainable economies 42–43, 164<br />
for urban competitiveness 119<br />
Research on Improving Systems of Education<br />
project 365<br />
results based management, aid programmes<br />
144<br />
revenue for education (taxation) 135, 136, 138<br />
richer countries<br />
class sizes 329<br />
digital literacy 247, 247<br />
education expenditure allocation 347<br />
educational attainment <strong>and</strong> employment 56<br />
income gap <strong>and</strong> growth 53, 53<br />
pre-primary education participation 209, 210<br />
private sector funding 145<br />
TVET student background 225<br />
view of SDGs 387<br />
within country disparities 76<br />
right to education<br />
global database 361<br />
historical agreements 8<br />
legal right 110<br />
rights<br />
International Covenant on Economic, Social<br />
<strong>and</strong> Cultural Rights 244<br />
see also human rights; right to education<br />
Rio de Janeiro<br />
city leadership 129<br />
Earth Summits 5, 6<br />
role models, importance for gender equality 91<br />
Roma populations, educational attainment 75,<br />
76<br />
Romania<br />
adult education 237, 238<br />
education expenditure 347<br />
environmental education 301<br />
gender disparity 230<br />
HIV education 292<br />
ICT facilities 314<br />
ICT skills 246, 246<br />
mathematics achievement 109<br />
primary education 187, 314<br />
school completion 187<br />
school leadership training 332<br />
secondary education 187, 238, 314<br />
socio-economic background <strong>and</strong><br />
perseverance 249<br />
tertiary education 228, 229, 230, 238<br />
violence in schools 109<br />
rural areas<br />
access to health care professionals 372<br />
electrification 86<br />
entrepreneurship skills for agriculture 253<br />
ICT facilities 314<br />
incentives 352<br />
integrated approaches 140<br />
literacy 74, 75, 279, 279<br />
maternity care 71<br />
non-formal education in civic society 100<br />
out-of-school children 259<br />
population 45<br />
poverty 44<br />
rural-to-urban migration 116, 117<br />
rural-urban education inequality 121–122, 122<br />
school completion 259<br />
school infrastructure 308<br />
teachers 330, 339<br />
teaching methods 102<br />
violence in schools 316<br />
see also agriculture; sanitation; water<br />
provision<br />
rural-to-urban migration 21, 116, 117, 166, 271<br />
rural-urban disparity 121–122, 122<br />
Russian Federation<br />
adult education 364<br />
digital literacy skills 247<br />
environmental education 301<br />
financial literacy 251<br />
gender disparity 230<br />
HIV education 292<br />
human rights education 300<br />
population growth 21<br />
primary education 187, 335<br />
school completion 187<br />
secondary education 187<br />
socio-economic background <strong>and</strong><br />
perseverance 249<br />
teacher education 335<br />
teacher skills 333<br />
tertiary education 228, 229, 230<br />
women in politics 71<br />
Rw<strong>and</strong>a<br />
agriculture 47<br />
computer/pupil ratio 313<br />
conflict 105<br />
educational attainment 74, 186, 370<br />
enrolment 106<br />
ethnic minority groups 103<br />
female literacy 83<br />
gender disparity 74, 75, 230<br />
gender equality initiatives 92<br />
gendered attitudes 264<br />
global citizenship education 294<br />
literacy 75, 83, 281<br />
literacy programme participation 278<br />
primary education 106, 186<br />
refugees 106<br />
rural areas 75<br />
school completion 186<br />
school curriculum 104, 107<br />
secondary education 106, 186<br />
teacher loss 105<br />
teaching methods 107<br />
tertiary education 229, 230, 231<br />
textbooks 189, 190<br />
under-5 mortality rate 83, 370, 370<br />
within country disparity 186, 231<br />
526<br />
ANNEX | INDEX
women in politics 99<br />
years of education 186<br />
Ryerson University, sustainability programme<br />
27<br />
S<br />
SABER 199–200, 227, 335, 350–351, 362–363, 362<br />
SACMEQ see Southern <strong>and</strong> Eastern Africa<br />
Consortium for Monitoring<br />
Educational Quality (SACMEQ)<br />
Safe Schools Initiative of the Association of<br />
Southeast Asian Nations 310<br />
Saint Kitts <strong>and</strong> Saint Nevis<br />
HIV education 292<br />
ICT facilities in schools 313<br />
violence in schools 316<br />
Saint Lucia<br />
child development 219<br />
early childhood care <strong>and</strong> education 85, 210<br />
HIV education 292<br />
home learning environment 215<br />
ICT facilities 313<br />
literacy <strong>and</strong> numeracy 219<br />
pre-primary education 209<br />
primary education 187, 313<br />
school completion 187<br />
secondary education 187, 313<br />
students abroad 322, 322<br />
stunted children 85<br />
within country disparity 210<br />
Saint Nevis see Saint Kitts <strong>and</strong> Saint Nevis<br />
Saint Vincent <strong>and</strong> the Grenadines<br />
electricity, <strong>and</strong> ICT <strong>and</strong> internet facilities in<br />
schools 313<br />
HIV education 292<br />
Samoa<br />
early childhood care <strong>and</strong> education 213, 213<br />
equity improvement 352<br />
national assessments 200<br />
special educational needs 267<br />
TVET fees 226<br />
violence in schools 316<br />
Samoa School Fees Grant Scheme 352<br />
San Francisco Bay, competitive economy 119<br />
sanitation<br />
‘adequate facilities’ definition 309<br />
capacity building 372<br />
monitoring of st<strong>and</strong>ards 308–309<br />
need for 68, 85<br />
primary schools 309, 309<br />
schemes 69, 79–80, 93, 165<br />
Sao Tome <strong>and</strong> Principe<br />
child development 219<br />
early childhood care <strong>and</strong> education 210<br />
educational attainment 74, 81, 186<br />
electricity provision 312, 313<br />
gender disparity 74<br />
home learning environment 215<br />
internet access 313<br />
intimate partner violence 81<br />
literacy 219, 281<br />
numeracy 219<br />
pre-primary education 209<br />
primary education 312<br />
secondary education 312<br />
students abroad 322<br />
within country disparity 186, 210<br />
years of education 186<br />
Sarva Shiksha Abhiyan programme (India) 311<br />
Saudi Arabia<br />
climate change 44<br />
gender disparity 230<br />
sexual <strong>and</strong> reproductive health interventions<br />
80<br />
tertiary education 228, 229, 230<br />
women in politics 71<br />
Sc<strong>and</strong>inavia see Denmark; Finl<strong>and</strong>; Norway;<br />
Sweden<br />
scholarships 226<br />
aid for 324–325, 324, 325<br />
availability 320–321<br />
<strong>and</strong> gender equality 98<br />
monitoring 319, 322, 378–379<br />
school attendance<br />
interventions 78, 85<br />
measurement 258<br />
see also enrolment; out-of-school children;<br />
school completion; school dropout<br />
school-based interventions 78–80, 127<br />
school building assessment tools 310<br />
School Buildings Safety Indicator (Guatemala)<br />
310<br />
school censuses, <strong>and</strong> records of disabled access<br />
311<br />
school completion<br />
in climate risk areas 33, 34<br />
<strong>and</strong> disability 72<br />
girls 104, 165, 259, 259, 260<br />
parity index 261<br />
primary education see primary education,<br />
school completion<br />
<strong>and</strong> reading proficiency 245<br />
secondary education see secondary<br />
education, school completion<br />
see also years of schooling<br />
school construction, guidelines <strong>and</strong> st<strong>and</strong>ards<br />
310, 311<br />
school curricula<br />
<strong>and</strong> bias 77, 166<br />
cause of violent conflict 104<br />
citizenship <strong>and</strong> sustainable development<br />
topics 292–294, 293, 294<br />
climate change information 33–34<br />
community involvement 164<br />
entrepreneurial skills 252<br />
gender equality 293, 293<br />
health <strong>and</strong> nutrition interventions 79<br />
history teaching post conflict 107<br />
human rights coverage 289–290, 290<br />
use of local traditional knowledge 29<br />
monitoring 289–293, 378, 381<br />
in mother tongue 224–239<br />
sexuality education 291<br />
tax education 136<br />
whole school approach 26, 293–294<br />
school dropout 85, 90, 117, 181<br />
see also second chance programmes<br />
school environment see learning environment<br />
school feeding programmes 78–79, 85, 140, 140<br />
school fees<br />
abolition 352<br />
private education 187–188<br />
school financing systems 350<br />
school governance, monitoring 294<br />
school infrastructure 308–311, 308, 309<br />
monitoring 378, 381<br />
whole school approach 26<br />
school leaders, preparation <strong>and</strong> training 332, 332<br />
school meals 78–79, 85, 140, 140, 352<br />
school participation<br />
boys 74<br />
girls 73, 74, 109<br />
see also enrolment; out-of-school children;<br />
school completion; school dropout;<br />
years of schooling<br />
school-related violence 109, 109, 123, 166<br />
monitoring <strong>and</strong> reporting 315, 317, 378<br />
types 314<br />
school repetition, affected by natural disasters<br />
183, 310<br />
science<br />
assessment 199, 199<br />
disparity in global deployment of staff 370,<br />
372<br />
extracurricular activities 298<br />
impact of female teachers on girls 91<br />
teacher shortages 331<br />
science-related careers, gender disparity <strong>and</strong><br />
equality 70, 165<br />
scientific research see research <strong>and</strong> development<br />
Scotl<strong>and</strong><br />
early childhood care <strong>and</strong> education 213<br />
special educational needs 266, 266<br />
SDG 4 6<br />
development <strong>and</strong> relationship with EFA goals<br />
180–181<br />
global indicators see global indicators main<br />
entry<br />
learning cities 126<br />
monitoring challenges 377–379<br />
thematic indicators see thematic indicators<br />
main entry<br />
Target 4.a Education facilities <strong>and</strong> learning<br />
environments 7, 189–191, 307–317,<br />
378, 397<br />
see also learning environments; school<br />
entries<br />
Target 4.b Scholarships 7, 319–325, 378–379,<br />
397<br />
see also scholarships<br />
Target 4.c Teachers 7, 191–193, 327–339,<br />
379, 397<br />
see also teachers; other teacher entries<br />
Target 4.1 Primary <strong>and</strong> Secondary Education<br />
<strong>and</strong> Learning 7, 68–69, 180, 181–182,<br />
184, 188–189, 188, 193, 377, 395<br />
effect on adaption to climate change 157<br />
effect on child mortality 156, 156<br />
effect on economic development<br />
156–157, 157<br />
projections for achievement 151–153, 152,<br />
153, 154, 155<br />
see also primary education; secondary<br />
education<br />
Target 4.2 Early Childhood Development <strong>and</strong><br />
Education 7, 205–219, 377, 396<br />
see also early childhood care <strong>and</strong><br />
education; mothers; parents; preprimary<br />
education<br />
Target 4.3 TVET<br />
Tertiary <strong>and</strong> Adult Education 7, 222–241,<br />
377, 396<br />
see also adult education; lifelong learning;<br />
post-secondary education; technical<br />
<strong>and</strong> vocational education <strong>and</strong><br />
training (TVET); tertiary education;<br />
vocational training<br />
Target 4.4 Skills for Decent Work 7, 244, 277,<br />
377–378, 396<br />
see also decent work; employment;<br />
employment skills; technical <strong>and</strong><br />
vocational education <strong>and</strong> training<br />
(TVET); vocational training<br />
Target 4.5 Equity 7, 256, 265, 378, 396<br />
see also discrimination; gender disparity;<br />
gender equality; inequality; justice;<br />
socio-economic background; wealth<br />
disparities; within country disparities<br />
Target 4.6 Adult literacy <strong>and</strong> numeracy 7,<br />
276, 378, 396<br />
see also adult literacy; illiteracy;<br />
literacy; mathematics achievement;<br />
numeracy; youth literacy<br />
Target 4.7 ESD <strong>and</strong> GCED 7, 288, 291, 378, 397<br />
see also gender equality; human<br />
rights; peacebuilding; sustainable<br />
development<br />
SDG-Education 2030 Steering Committee 146<br />
sea level rises 33<br />
second chance programmes 237, 237, 238<br />
Second Regional Comparative <strong>and</strong> Explanatory<br />
Study (SERCE) 270<br />
secondary education<br />
<strong>and</strong> adolescent birth rate 370, 370<br />
<strong>and</strong> adult education access 238, 238, 238<br />
benefits 161<br />
compulsory education 185, 187<br />
<strong>and</strong> conflict risk reduction 103<br />
for economic growth 119<br />
education aid 353<br />
effect of educational attainment 120, 186<br />
<strong>and</strong> employment 56, 58, 58, 59, 59, 89, 120<br />
enrolment<br />
2016 • GLOBAL EDUCATION MONITORING REPORT 527
adjusted net enrolment 181–182, 182, 183<br />
adult programmes 237, 237<br />
conflict-affected areas 104, 106<br />
global 182, 182<br />
private education 187<br />
programmes 352<br />
refugees 117<br />
TVET 223–224, 223<br />
female attainment <strong>and</strong> earnings 88, 89<br />
financing from taxes 136<br />
gender disparity 183, 184, 185, 259, 259, 260,<br />
262, 262<br />
<strong>and</strong> gender-based violence 81, 82<br />
gross intake rate 184<br />
human rights education 290, 290<br />
ICT facilities 312, 312–313, 313, 313, 314<br />
increasing gender equality 161<br />
infrastructure index 308<br />
internet access 313<br />
mathematics achievement 195, 197, 197<br />
missing finance data 349<br />
need for expansion 54<br />
out-of school children 106, 182, 182, 183, 183<br />
over-age children in education 183, 184<br />
<strong>and</strong> political engagement 26, 98, 100<br />
pupil/teacher ratio 328<br />
reading proficiency 196, 197, 245<br />
rural areas 259<br />
scholarship programmes 98<br />
school completion<br />
2030 universal completion target 151,<br />
153, 153, 154, 185<br />
adult non-completion 237<br />
<strong>and</strong> climate change 33, 34<br />
in climate risk areas 33, 34<br />
<strong>and</strong> female employment 88, 89, 89<br />
gender disparity 87<br />
parity indicators 259, 259, 260, 261<br />
rates 184, 185, 185, 186–187<br />
in urban <strong>and</strong> rural areas 121, 122<br />
sexuality education 291<br />
subject specialist gaps 331–332<br />
role in sustainability 26<br />
teachers 1912, 1913=14 331, 334–335, 337, 338,<br />
338, 339<br />
textbook content 294–296, 295, 296<br />
urban areas 259<br />
violence in schools 109, 109, 315, 316<br />
wealth disparities 185, 185, 259, 259, 260,<br />
261, 262<br />
<strong>and</strong> working poverty 57, 58<br />
see also basic education; lower secondary<br />
education; universal secondary<br />
education; upper secondary<br />
education<br />
segregation in education 106, 106–107, 123–124,<br />
166<br />
self-control, for employment success 249–250<br />
self-employment see own-account employment<br />
Senegal<br />
agriculture 46<br />
basic education 138<br />
climate change adaptation 10<br />
education aid 138<br />
educational attainment 10, 74, 82, 100, 186<br />
electricity provision 30, 312<br />
environmental education 31–32<br />
female genital mutilation 82<br />
gender disparity 74, 75<br />
gender equality initiatives 92<br />
instructional teaching time 192<br />
integrated programmes 140<br />
language of instruction 270<br />
literacy 75, 196, 202, 281<br />
literacy programme participation 277, 278<br />
mathematics achievement 202<br />
migration 271<br />
national assessments 202<br />
political participation 100, 101–102<br />
primary education 186, 196, 312<br />
reading proficiency 196, 202<br />
rural areas 75, 100<br />
school completion 186<br />
secondary education 186, 312<br />
solar lighting project 30<br />
students abroad 323<br />
teaching methods 191<br />
tertiary education 101–102, 231<br />
textbooks 190<br />
within country disparity 186, 231<br />
years of education 186<br />
Serbia<br />
child development 219<br />
childhood obesity 80<br />
early childhood care <strong>and</strong> education 210<br />
educational attainment 75, 75, 76, 186<br />
environmental education 301<br />
ethnic minorities 75, 76<br />
gender disparity 75, 75, 76, 230<br />
global citizenship education 294<br />
home learning environment 215<br />
literacy 219, 281<br />
national assessments 200<br />
numeracy 219<br />
pre-primary education 209<br />
primary education 187, 335<br />
school completion 187<br />
secondary education 187<br />
socio-economic background <strong>and</strong><br />
perseverance 249<br />
teacher education 335<br />
tertiary education 229, 230, 231<br />
within country disparity 76, 186, 210, 231<br />
years of education 186<br />
SERCE 270<br />
service sector economies 43, 51<br />
sexual abuse, girls 109<br />
sexual <strong>and</strong> reproductive health education 79, 92,<br />
140, 291–292, 292, 297<br />
see also family planning advice<br />
sexual violence 81, 81<br />
in schools 316<br />
Sexuality Education Review <strong>and</strong> Assessment<br />
Tool 291, 297<br />
Seychelles<br />
electricity provision 312<br />
global citizenship education 294, 297<br />
primary education 312<br />
secondary education 312<br />
students abroad 322, 322<br />
teacher education 297<br />
tertiary education 228, 231, 322<br />
violence in schools 316<br />
Shack/Slum Dwellers International (SDI) network<br />
118<br />
Shanghai (China)<br />
educational attainment 76<br />
ethnic minority groups 76<br />
Shia communities, educational causes of conflict<br />
104<br />
Shidhulai Swanirvar Sangstha, Solar-Powered<br />
Floating Schools programme<br />
(Bangladesh) 33<br />
short-term contracts, teachers 336–337, 337<br />
Sierra Leone<br />
child development 219<br />
conflict 103<br />
educational attainment 74, 81, 82, 103, 186<br />
electricity provision 312<br />
female genital mutilation 82<br />
gender disparity 74, 74, 75<br />
gender-based violence 109<br />
home learning environment 215<br />
intimate partner violence 81<br />
justice system 110<br />
literacy 74, 75, 219, 281<br />
literacy programme participation 278, 278<br />
numeracy 219<br />
over-age children 183<br />
peacebuilding 108<br />
pre-primary education 209<br />
primary education 186, 312<br />
rural areas 74, 75<br />
school completion 186<br />
secondary education 186, 312<br />
tertiary education 231<br />
within country disparity 186, 231<br />
women in politics 99<br />
years of education 186<br />
youth unemployment 103<br />
SIGI 265<br />
Singapore<br />
ecological footprint 22, 22<br />
electricity provision 312, 313<br />
HIV education 292<br />
ICT skills 246<br />
internet access 313<br />
as knowledge economy 119<br />
literacy 282<br />
primary education 312<br />
secondary education 312, 334<br />
socio-economic background <strong>and</strong><br />
perseverance 249<br />
students abroad 322<br />
teacher education 334, 336<br />
women in politics 71<br />
single-sector projects, success in low income<br />
countries 144–145<br />
Sint Maarten, ICT facilities in schools 313<br />
skills for decent work<br />
cognitive skills 244–247<br />
non-cognitive skills 247–250, 248, 250–252<br />
see also employment skills<br />
Skills Towards Employment <strong>and</strong> Productivity<br />
(STEP) programme<br />
educational attainment <strong>and</strong> employment<br />
57, 58, 59, 60, 225<br />
literacy 61, 282, 282<br />
Slovakia<br />
adult education 238, 238<br />
digital literacy skills 247<br />
environmental education 301<br />
financial literacy 251<br />
gender disparity 230<br />
global citizenship education <strong>and</strong> knowledge<br />
300, 300<br />
ICT facilities 314<br />
literacy 282<br />
primary education 187, 314, 328, 329<br />
pupil/teacher ratio <strong>and</strong> class size 328, 329<br />
school completion 187<br />
secondary education 187, 238, 314, 335, 338<br />
socio-economic background <strong>and</strong><br />
perseverance 249<br />
teacher education 335<br />
teacher salaries gap 338<br />
tertiary education 228, 229, 230, 238<br />
Slovenia<br />
adult education 238, 238, 239, 239<br />
civic education 100<br />
digital literacy skills 247<br />
education expenditure 233<br />
environmental education 301<br />
financial literacy 251<br />
household expenditure 233<br />
human rights education 300<br />
ICT facilities 314<br />
literacy 282<br />
political participation 100<br />
primary education 187, 314<br />
school completion 187<br />
secondary education 187, 238, 314<br />
socio-economic background <strong>and</strong><br />
perseverance 249<br />
special educational needs 266<br />
student support 233<br />
tertiary education 228, 229, 231, 233, 238<br />
slum dwellers<br />
access to services 118<br />
rural migrants from disaster areas 33<br />
sustainable urban programmes 126, 166<br />
small businesses<br />
cognitive skills of owners 252<br />
see also own-account employment (selfemployment)<br />
528<br />
ANNEX | INDEX
small isl<strong>and</strong> developing States<br />
students abroad 322, 322<br />
teacher training requirements 333<br />
social capital, role of education 48<br />
social development (societies)<br />
GEM policy recommendations 165<br />
inclusion <strong>and</strong> disadvantage 67–77<br />
influence on education 84–87<br />
integrated interventions 87–93<br />
relationship with language acquisition 214<br />
role of education 77–84<br />
Social Institutions <strong>and</strong> Gender Index (SIGI) 265<br />
social intelligence, employment skill 50<br />
social mobility, importance of education 54<br />
social protection programmes 78–79, 79–80, 85,<br />
90–91, 93, 140<br />
UNICEF multi-sector programme 144<br />
see also grants; scholarships<br />
social sciences<br />
assessment 199, 199<br />
language of instruction 270<br />
social skills, as work skills 250<br />
Social Skills Inventory 250<br />
social-emotional development 216, 218<br />
socio-economic background<br />
<strong>and</strong> digital literacy 247<br />
<strong>and</strong> education v. vulnerability 162<br />
<strong>and</strong> educational attainment 60<br />
<strong>and</strong> employment disparity 60–61<br />
<strong>and</strong> multiple disadvantage 75<br />
<strong>and</strong> perseverance skills 249, 249<br />
segregation of educated groups in cities 124<br />
teacher shortage in disadvantaged areas<br />
332<br />
tertiary education completion 230, 231<br />
<strong>and</strong> TVET participation 225, 226<br />
see also educated population; extreme<br />
poverty; household survey data;<br />
poverty; working poverty<br />
solar lighting <strong>and</strong> power initiative 29–30, 31–32<br />
Solar-Powered Floating Schools programme<br />
(Bangladesh) 33<br />
Solomon Isl<strong>and</strong>s<br />
violence in schools 316<br />
Somalia<br />
attacks on schools 317<br />
South Africa<br />
access to education 122<br />
agriculture 46<br />
civic education 100, 102<br />
climate change adaptation 10<br />
crime rate 120, 122<br />
disabled access to schools 311<br />
early childhood care programmes 85<br />
education expenditure 143<br />
educational attainment 10, 56, 74, 120<br />
electricity provision 312<br />
employment 56, 120, 271<br />
environmental concern 304<br />
financial literacy 250<br />
gender disparity 74, 230<br />
gender equality 71, 92, 291<br />
global citizenship education 294<br />
green economy 40<br />
HIV education 292<br />
national plans 143<br />
pension programmes 90<br />
political participation 71, 100, 102<br />
primary education 186, 312<br />
school completion 186<br />
school curriculum 107<br />
school leadership training 332<br />
secondary education 186, 312<br />
segregation 123<br />
stunted children 85<br />
sustainable transport 121<br />
teacher skills 333<br />
teaching methods 191<br />
tertiary education 229, 230<br />
women in politics 71<br />
World Summit on Sustainable Development<br />
(Johannesburg) 5<br />
South America<br />
agriculture 45<br />
buen vivir approach 4<br />
ethnic minority groups 124<br />
see also Latin America <strong>and</strong> the Caribbean;<br />
individual countries<br />
South Sudan<br />
education expenditure 347<br />
educational attainment 74, 74, 86, 186<br />
electricity provision 30, 86<br />
enrolment 106<br />
gender disparity 74, 74<br />
global citizenship education 294<br />
internally displaced persons 272<br />
primary education 106, 186<br />
refugees 106<br />
school completion 186<br />
secondary education 106, 186<br />
solar lighting project 30<br />
within country disparity 185, 186<br />
years of education 185, 186<br />
South-east Asia Primary Learning Metrics 302<br />
South-east Asian Ministers of Education<br />
Organization, education systems<br />
conformity 364<br />
South-eastern Asia<br />
adolescent birth rate 370<br />
adult literacy 280<br />
agriculture 45<br />
discrimination of minority groups 73<br />
Eastern Asia, countries listed 398<br />
ecological footprint 21<br />
education aid 354<br />
education expenditure 346<br />
educational attainment 370<br />
environmental education 301<br />
gender disparity 259, 260, 262, 280<br />
global citizenship education 296, 302<br />
health <strong>and</strong> nutrition programmes 78<br />
HIV education 292<br />
linguistic diversity 267<br />
out-of-school children 182<br />
population growth 21<br />
pre-primary enrolment 207<br />
primary education 153, 182, 260, 262<br />
private education 187<br />
school completion 154, 156, 259, 260<br />
school construction 310<br />
secondary education 153, 154, 155, 156, 182,<br />
187, 259, 260, 262<br />
sexuality education 291, 292<br />
teacher education 296, 331<br />
teaching methods 298<br />
tertiary education 229<br />
TVET enrolment 223<br />
under-5 mortality rate 156, 371<br />
universal primary <strong>and</strong> secondary education<br />
153, 154, 155, 156<br />
wealth disparities 260<br />
youth literacy 280<br />
see also individual countries<br />
Southern Africa see Southern <strong>and</strong> Eastern Africa<br />
Southern Africa<br />
adolescent birth rate 370<br />
educational attainment 370<br />
Southern African Development Committee,<br />
qualification frameworks 227<br />
Southern Asia<br />
adolescent birth rate 370<br />
agriculture 45<br />
countries listed 399<br />
discrimination of marginalized groups 73<br />
ecological footprint 21<br />
education aid 354<br />
education expenditure 346<br />
educational attainment 85, 370<br />
employment 57<br />
employment skills 51<br />
ethnic minority groups 124<br />
extreme poverty 52<br />
gender disparity 260, 262<br />
global citizenship education 295<br />
health <strong>and</strong> nutrition programmes 79<br />
HIV education 292<br />
linguistic diversity 267<br />
marriage 264<br />
maternal mortality 84<br />
out-of-school children 181, 181, 182, 182<br />
population growth 21, 44<br />
pre-primary enrolment 207<br />
primary education 153, 153, 182, 260, 262<br />
private education 187<br />
progress towards SDG 4 12<br />
sanitation 68<br />
school completion 154, 156, 260<br />
school leadership training 332<br />
secondary education 153, 154, 155, 156, 182,<br />
182, 187, 260, 262<br />
sexuality education 291, 292<br />
teacher education 296<br />
teaching methods 298<br />
tertiary education 48, 229<br />
TVET enrolment 223<br />
under-5 mortality rate 156<br />
universal primary <strong>and</strong> secondary education<br />
153, 153, 154, 155, 156<br />
wealth disparities 259, 260<br />
see also individual countries<br />
Southern <strong>and</strong> Eastern Africa<br />
adolescent birth rate 370, 370<br />
under-5 mortality rate 370, 371<br />
see also individual countries<br />
Southern <strong>and</strong> Eastern Africa Consortium for<br />
Monitoring Educational Quality<br />
(SACMEQ) 201, 270<br />
survey on sexual harassment 316<br />
Spain<br />
adult education 238<br />
education funding 350<br />
entrepreneurship skills 252<br />
equity improvement 350<br />
financial literacy 251<br />
gender disparity 230<br />
human rights education 300<br />
ICT facilities 314<br />
literacy 282<br />
primary education 186, 314<br />
school completion 186<br />
secondary education 186, 238, 314<br />
socio-economic background <strong>and</strong><br />
perseverance 249<br />
special educational needs 266<br />
teacher education 335, 336<br />
teacher skills 333<br />
tertiary education 228, 229, 230, 231, 238<br />
within country disparity 231<br />
special educational needs 266, 266<br />
species decline 20<br />
‘split site’ university education 321<br />
sports, extracurricular activities 299<br />
Sri Lanka<br />
ecological footprint 23<br />
education expenditure 346, 347<br />
education funding 351<br />
educational attainment 57, 58, 89<br />
electricity provision 313<br />
employment 58, 89<br />
employment skills 59<br />
entrepreneurship skills 252<br />
equity improvement 351<br />
gender disparity 89, 230<br />
global citizenship education 296<br />
internet access 313<br />
national assessments 199<br />
sustainability 22<br />
teacher education 296<br />
tertiary education 59, 228, 229, 230<br />
TVET 224, 225, 227<br />
underweight children 80<br />
working poverty 57<br />
St<strong>and</strong>ard & Poor module on financial literacy<br />
251<br />
Stanford University 119<br />
statistical data sources 393–395<br />
2016 • GLOBAL EDUCATION MONITORING REPORT 529
STEP see Skills Towards Employment <strong>and</strong><br />
Productivity (STEP) programme<br />
STEP countries, disparity <strong>and</strong> employment 57,<br />
58, 59, 60, 61<br />
Stepping Stones (South Africa) 92<br />
stereotyping<br />
male stereotypes 84<br />
need for educational campaigns 373<br />
<strong>and</strong> risk of conflict 103–104<br />
see also discrimination<br />
street vendors 120<br />
student-centred learning 102<br />
students<br />
financial assistance 225–226, 233–234, 233,<br />
234, 234<br />
scholarships 320–321<br />
teacher-student interaction 191, 191, 192, 298<br />
stunting 68, 72, 79, 83, 85<br />
sub-Saharan Africa<br />
adolescent birth rate 370, 370<br />
adult literacy 280<br />
agriculture 45, 47<br />
basic education aid 353<br />
clean energy 68<br />
conflict 103<br />
countries listed 399<br />
country status reports 350, 364<br />
early childhood care <strong>and</strong> education 212<br />
ecological footprint 22<br />
education aid 353, 354<br />
education expenditure 346, 346<br />
educational attainment 58, 85, 100, 370, 370<br />
electricity provision 86<br />
employment <strong>and</strong> earnings 51, 57, 59, 60<br />
employment skills 51<br />
entrepreneurship skills 252<br />
environmental concerns 304<br />
ethnic minority groups 124<br />
fertility rate 83<br />
gender disparity 60, 182, 259, 260, 262, 280<br />
gender equality education 291<br />
gender-based violence 109<br />
global citizenship education <strong>and</strong> knowledge<br />
294, 303<br />
gross intake rate in final grade 184<br />
health care 78–79, 79, 85, 87<br />
HIV education 87, 292<br />
human rights education 295<br />
ICT facilities 92, 311–312<br />
instructional teaching time 329<br />
language of instruction 270<br />
linguistic diversity 267<br />
manufacturing 51<br />
maternal mortality 84<br />
mother tongue instruction 268, 268<br />
out-of-school children 181, 182, 182<br />
over-age children 183<br />
parental health 85<br />
political participation 100<br />
population growth 21, 44<br />
poverty 52<br />
pre-primary education 118, 207, 331, 331<br />
primary education 153, 153, 182, 183, 259, 260,<br />
262, 330<br />
private schools 118<br />
progress towards SDG 4 12<br />
pupil/teacher ratios <strong>and</strong> recruitment 330<br />
regime change 101<br />
renewable energy 40<br />
repetition rate 183<br />
sanitation 68<br />
scholarships 320, 321<br />
school completion 154, 156, 259, 260, 261, 262<br />
school dropout 85<br />
school leadership training 332<br />
school textbooks 295<br />
secondary education 153, 154, 155, 156, 182,<br />
182, 183, 259, 260, 261, 262, 331, 331,<br />
353<br />
sexuality education 79, 291, 292, 297<br />
students abroad 322, 323<br />
teacher attrition 339<br />
teacher education 85, 297, 331, 331<br />
teacher recruitment 330<br />
teaching methods 191<br />
tertiary education 48, 101, 228, 229<br />
textbooks 190, 190<br />
TVET enrolment 223<br />
under-5 mortality rate 155, 156<br />
unemployment 56<br />
universal primary <strong>and</strong> secondary education<br />
153, 153, 154, 155, 156<br />
urban planning 126<br />
wealth disparities 259, 260, 261<br />
youth literacy 280<br />
see also individual countries<br />
Sudan<br />
attacks on schools 317<br />
early childhood care <strong>and</strong> education 210<br />
ecological footprint 23<br />
educational attainment 74, 186<br />
gender disparity 74, 230<br />
HIV education 292<br />
literacy 281<br />
national assessments 200<br />
nomad-specific education plans 9<br />
out-of-school children 183<br />
primary education 106, 183, 186<br />
refugees 106<br />
rural areas 122<br />
school completion 186<br />
secondary education 106, 183, 186<br />
tertiary education 228, 229, 230<br />
underweight children 80<br />
urban areas 122<br />
wealth disparities 122<br />
within country disparity 186, 210<br />
years of education 186<br />
SULITEST 302<br />
suma qamaña concept 27<br />
sumak kawsay concept 27<br />
Sunni communities, educational causes of<br />
conflict 104<br />
Suriname<br />
child development 219<br />
early childhood care <strong>and</strong> education 210<br />
educational attainment 74, 186<br />
electricity provision 312, 313<br />
gender disparity 74<br />
HIV education 292<br />
home learning environment 215<br />
internet access 313<br />
literacy 219, 281<br />
numeracy 219<br />
pre-primary education 209<br />
primary education 186, 312<br />
school completion 186<br />
secondary education 186, 312<br />
tertiary education 231<br />
violence in schools 316<br />
within country disparity 186, 210, 231<br />
years of education 186<br />
Survey of Income <strong>and</strong> Programme Participation<br />
(United States), child well-being<br />
module 299<br />
survival rate to final grade, gross intake rate 184<br />
sustainability nudging 31<br />
sustainable development<br />
<strong>and</strong> comprehensive sexuality education 291<br />
description, definition <strong>and</strong> perspectives 3–5<br />
global requirements 24<br />
green industry 40–43, 61–62<br />
integrated approach 134, 141–142, 167<br />
international instruments 289<br />
<strong>and</strong> level of education 25, 162<br />
links <strong>and</strong> connections 4<br />
monitoring education 378<br />
role of education 11, 11, 24, 25–26, 25, 26, 44,<br />
45–46, 46, 61, 78, 115, 164, 165, 378<br />
see also climate change, educational<br />
approach; environmental education<br />
in school curricula 292–294, 293, 294<br />
school textbook content 294–296, 295, 296<br />
teacher education 297<br />
Sustainable Development Goals (SDGs) 6, 97,<br />
115, 126<br />
accountability process 388–389<br />
compared to EFA goals 180–181<br />
compared to MDGs 180, 184<br />
development 6, 180<br />
global co-ordination 146<br />
global GDP needed 133<br />
global indicators for education 179, 181–182,<br />
205, 307, 319, 327, 330, 359, 361,<br />
367–373<br />
inter-agency commission on national<br />
implementation (Colombia) 141–142<br />
need to progress simultaneously 68<br />
obstacles to progress 387<br />
policy coherence 143<br />
reports <strong>and</strong> reviews 182–183<br />
role of education 10, 163–164<br />
role of GEM Report 388<br />
SDG 1 see extreme poverty; poverty<br />
SDG 2 see agriculture; nutrition<br />
SDG 3 69<br />
see also health care; health education<br />
SDG 4 see SDG 4 main entry<br />
SDG 5 264<br />
see also gender equality<br />
SDG 6 see sanitation; water entries<br />
SDG 7, see also green energy<br />
SDG 8 55–56<br />
see also decent work; economic growth;<br />
employment<br />
SDG 11 126<br />
see also cities; urban entries; urbanization<br />
SDG 17 133<br />
see also Global Partnership for Education<br />
Sustainable Development Goals Fund 144<br />
Sustainable Development Solutions Network 6<br />
Swazil<strong>and</strong><br />
child development 219<br />
early childhood care <strong>and</strong> education 210<br />
educational attainment 74, 186<br />
electricity provision 312<br />
gender disparity 74, 230<br />
HIV education 292, 292<br />
home learning environment 215<br />
language of instruction 270<br />
late entry into primary education 183<br />
literacy 219, 281<br />
literacy programme participation 278<br />
numeracy 219<br />
over-age entry 184<br />
primary education 183, 184, 186, 312<br />
school completion 186<br />
secondary education 184, 186, 312<br />
students abroad 323<br />
tertiary education 230, 231<br />
TVET enrolment 223<br />
within country disparity 184, 186, 210, 231<br />
years of education 186<br />
Sweden<br />
adult education 238, 238, 239<br />
aid donor 137<br />
crime 108<br />
education expenditure 233<br />
educational attainment 75, 108<br />
employment 70<br />
environmental education 25, 301<br />
ethnic minority groups 75, 124<br />
gender disparity 70, 70<br />
global citizenship education <strong>and</strong> knowledge<br />
294, 300, 303<br />
HIV education 292<br />
household expenditure 233<br />
inequality in education 123<br />
language of instruction 269<br />
literacy 282<br />
multicultural attitudes 304<br />
primary education 187<br />
private education 123<br />
school completion 187<br />
secondary education 187, 238, 334<br />
socio-economic background <strong>and</strong><br />
530<br />
ANNEX | INDEX
perseverance 249<br />
special educational needs 266, 266<br />
student support 233, 239<br />
teacher deployment 332<br />
teacher education 334, 336<br />
tertiary education 228, 229, 231, 233, 238<br />
TVET participation 224<br />
urban planning 126<br />
women in politics 70<br />
Switzerl<strong>and</strong><br />
employment 70<br />
environmental concern 304<br />
environmental education 301<br />
gender disparity 70, 230<br />
human rights education 300<br />
multicultural attitudes 304<br />
pre-primary enrolment 208<br />
socio-economic background <strong>and</strong><br />
perseverance 249<br />
special educational needs 266<br />
tertiary education 228, 229, 230<br />
Syrian Arab Republic<br />
attacks on schools 317<br />
conflict 103, 104, 105<br />
educational attainment 74<br />
enrolment 104<br />
gender disparity 74, 230<br />
loss of educational facilities 105<br />
rural areas 122<br />
scholarship aid 324<br />
tertiary education 229, 230<br />
urban areas 122<br />
wealth disparities 122<br />
Systems Approach for Better Education Results<br />
(SABER) 200, 227, 335, 350–351,<br />
362–363, 362<br />
Taiwan Province of China<br />
educational attainment 76<br />
ethnic minorities 76<br />
Tajikistan<br />
computer/pupil ratio 314<br />
conflict 104<br />
education system review 364<br />
educational attainment 74, 81, 186<br />
gender disparity 74, 104<br />
gendered attitudes 264<br />
HIV education 292<br />
income level 354<br />
intimate partner violence 81<br />
literacy 281<br />
primary education completion 186<br />
rural areas 314<br />
secondary education completion 104, 186<br />
tertiary education 231<br />
TVET enrolment 223<br />
underweight children 80<br />
within country disparity 186, 231<br />
years of education 186<br />
Take Charge Challenge (United States) 30<br />
take-home rations (schools) 78<br />
TALIS 332, 333, 335<br />
Tanzania see United Republic of Tanzania<br />
tax avoidance, loss of revenue 135<br />
tax treaties 135<br />
taxation systems, <strong>and</strong> revenue for education<br />
135, 136, 138<br />
taxpayer education programmes 136, 167<br />
Tayssir cash transfer scheme (Morocco) 352<br />
teacher absenteeism 191, 329<br />
<strong>and</strong> health care provision 85<br />
teacher education 330–333, 332, 333, 334–336<br />
adult education 240<br />
aid for 333<br />
developing country needs 333<br />
entry requirements 332<br />
for environmental education 31, 34<br />
for global citizenship <strong>and</strong> sustainability<br />
T<br />
education 31, 34, 296–298<br />
for green economy 165<br />
for human rights education 296–297<br />
in-service training <strong>and</strong> professional<br />
development 335–336, 335<br />
monitoring 378, 381<br />
for mother tongue instruction 164, 166<br />
needed for peacebuilding 107<br />
quality 332–333<br />
for school leadership (headship) 332<br />
for sexuality education 297<br />
Teacher Education <strong>and</strong> Development Study in<br />
Mathematics (TEDS-M) 333<br />
teacher incentives 339<br />
Teacher Knowledge Survey 333<br />
teacher recruitment<br />
<strong>and</strong> pupil/teacher ratios 330<br />
<strong>and</strong> retention policies 122<br />
teacher shortages 328–330, 331, 332<br />
teacher-student interaction 191, 191, 192, 298<br />
teachers<br />
academic qualification level 330, 337<br />
adult education 240<br />
assessment of skills 333<br />
classroom practices 191–193, 192, 265, 298<br />
earnings gap 338, 338<br />
employment in disadvantaged areas 122,<br />
339<br />
exit from profession 339<br />
expenditure on 345<br />
gendered bias <strong>and</strong> attitudes 265<br />
impact of female role models on girls 91<br />
interaction style in pre-primary education<br />
211, 212<br />
loss through conflict 105, 317<br />
monitoring of teaching 379<br />
motivation <strong>and</strong> support 333–335, 334, 339<br />
native language compared to pupils 269, 269<br />
numeracy skills 333<br />
recruitment 122, 330<br />
salaries 337–339, 338, 348<br />
training see teacher education<br />
violence towards pupils 316<br />
working conditions 336–337, 337, 339<br />
see also teaching methods; teaching time<br />
Teaching <strong>and</strong> Learning International Survey<br />
(TALIS) 332, 333, 335<br />
teaching materials, education expenditure 345<br />
teaching methods<br />
for open-mindedness 107<br />
<strong>and</strong> political engagement 102<br />
teacher-student interaction 191–193, 191,<br />
192, 298<br />
see also language of instruction; mother<br />
tongue instruction<br />
teaching time 191–192, 192, 329<br />
Technical Cooperation Group, development <strong>and</strong><br />
implementation of indicators 380<br />
technical skills, for green industry 42<br />
technical <strong>and</strong> vocational education <strong>and</strong> training<br />
(TVET)<br />
access 223–225, 223, 224<br />
database 361<br />
enrolment 223–224, 223<br />
funding <strong>and</strong> financial assistance 225–226,<br />
377<br />
institution based 223, 223–224, 223, 224–225,<br />
224<br />
integrated strategy (Malaysia) 142<br />
monitoring 377<br />
quality of education 226–227<br />
thematic indicator 222<br />
types 223, 223<br />
workplace based 223, 223, 224, 224, 225<br />
see also vocational training<br />
Technical <strong>and</strong> Vocational Vouchers Programme<br />
(Kenya) 226<br />
Technical Working Group on Data Collection on<br />
Violence against Children 315, 317<br />
technological careers, impact of female teachers<br />
on girls 91<br />
technological innovation<br />
agricultural needs 47<br />
global deployment of staff 372, 372<br />
for green economies 42, 164<br />
need for advanced numeracy 48<br />
transfer to poorer economies 42–43<br />
see also ICT<br />
technological transfer, green innovation 42–43<br />
technology clusters 119<br />
TEDS-M 333<br />
Tenth Malaysia Plan 2011-15 142<br />
TERCE 194<br />
tertiary education<br />
access 227–233, 228, 229, 230–231, 231,<br />
232–233, 232<br />
admission scores <strong>and</strong> graduation 232<br />
adult education access 238, 238<br />
completion 230, 231<br />
contribution to democracy 101–102<br />
<strong>and</strong> economic growth 48, 119<br />
<strong>and</strong> electoral non-participation 98–99<br />
<strong>and</strong> employment 53, 56, 58, 59, 59, 60<br />
enrolment 228, 228, 229, 230, 230–231<br />
expansion for technological needs 42<br />
funding <strong>and</strong> financial assistance 233–234,<br />
233, 234<br />
gender disparity 229–230, 229, 230–231<br />
global citizenship <strong>and</strong> sustainability<br />
knowledge 302–303<br />
graduation 228–230, 229, 230–231<br />
<strong>and</strong> inequality 55<br />
infrastructure investment 308<br />
management information systems 231, 232<br />
migrant qualification level 117–118<br />
missing finance data 349<br />
percentage attainment target 363<br />
<strong>and</strong> political participation 26, 98–99, 100, 101<br />
quality of education 234–235, 235<br />
<strong>and</strong> reduction in poverty 53<br />
<strong>and</strong> sustainability 26, 27, 165<br />
thematic indicators 227–229, 228, 229<br />
types 227<br />
university rankings 235<br />
women 230, 230–231, 264, 264<br />
<strong>and</strong> working poverty 57, 57<br />
see also educated populations; higher<br />
education; post-secondary education<br />
textbooks<br />
availability 189–191, 190<br />
education expenditure 345<br />
global citizenship <strong>and</strong> sustainability content<br />
294–296, 295, 296<br />
human rights education 290, 295<br />
Thail<strong>and</strong><br />
adult education 237<br />
child development 219<br />
childhood obesity 80<br />
digital literacy skills 247, 247<br />
early childhood care <strong>and</strong> education 210<br />
education system review 364<br />
educational attainment 75<br />
electricity provision 312, 313<br />
environmental education 26, 301<br />
gender disparity 75<br />
gender-based violence 110<br />
home learning environment 215<br />
human rights education 300, 300<br />
ICT facilities 314<br />
internet access 313<br />
language of instruction 269<br />
legal rights awareness 110<br />
literacy 219<br />
multicultural supportiveness 299<br />
natural disasters 33<br />
numeracy 219<br />
out-of-school civic activities 26<br />
pre-primary education 209<br />
primary education 237, 312, 314<br />
rural areas 122<br />
secondary education 312, 314<br />
sexuality education 291<br />
socio-economic background <strong>and</strong><br />
perseverance 249<br />
2016 • GLOBAL EDUCATION MONITORING REPORT 531
teacher education 332<br />
urban areas 122<br />
wealth disparities 122<br />
within country disparity 210<br />
women in politics 71<br />
the former Yugoslav Republic of Macedonia<br />
see former Yugoslav Republic of<br />
Macedonia, The<br />
the Gambia see Gambia<br />
thematic indicators 379–380, 395–397<br />
adoption of 181<br />
care needed in data interpretation 184–185<br />
early childhood care <strong>and</strong> education 205<br />
education facilities <strong>and</strong> learning<br />
environments 307<br />
education finance 341, 344, 345, 350<br />
education systems 359<br />
equity 255, 267<br />
literacy <strong>and</strong> numeracy 275<br />
primary <strong>and</strong> secondary education 179, 185,<br />
198<br />
scholarships 319<br />
skills for work 243<br />
sustainable development <strong>and</strong> global<br />
citizenship 287<br />
teachers 327<br />
technical, vocational <strong>and</strong> adult education<br />
221, 222–223<br />
tertiary education 227–229, 228, 229<br />
thematic reviews, need for development 387<br />
Third Regional Comparative <strong>and</strong> Explanatory<br />
Study (TERCE) 194<br />
ti nûle kûin concept 27<br />
Timap for Justice (Sierra Leone) 110<br />
Timor-Leste<br />
basic education 138<br />
conflict 105<br />
early childhood development 217<br />
ecological footprint 22, 22<br />
education aid 138<br />
educational attainment 74, 81, 186<br />
gender disparity 74<br />
HIV education 292<br />
intimate partner violence 81<br />
literacy 281<br />
literacy programme participation 278<br />
loss of educational facilities 105<br />
primary education completion 186<br />
secondary education completion 186<br />
students abroad 322, 323<br />
tertiary education 231<br />
within country disparity 186, 231<br />
years of education 186<br />
TIMSS see Trends in International Mathematics<br />
<strong>and</strong> Science Study (TIMSS)<br />
Tobago see Trinidad <strong>and</strong> Tobago<br />
Togo<br />
child development 219<br />
educational attainment 74, 81, 82, 186, 371<br />
electricity provision 312<br />
female genital mutilation 82<br />
female literacy 83<br />
gender disparity 74, 74, 75<br />
HIV education 292, 292<br />
home learning environment 215<br />
human rights education 297<br />
intimate partner violence 81<br />
language of instruction 270<br />
literacy 74, 75, 83, 202, 219, 281<br />
malaria prevalence 371<br />
mathematics achievement 202<br />
national assessments 202<br />
numeracy 202, 219<br />
primary education 186, 312<br />
reading proficiency 202<br />
rural areas 74, 75<br />
school completion 186<br />
secondary education 186, 312<br />
students abroad 323<br />
teacher attrition 339<br />
teacher education 297<br />
teaching methods 191<br />
tertiary education 231<br />
textbooks 190<br />
under-5 mortality rate 83<br />
within country disparity 186, 231<br />
years of education 186<br />
toilet facilities see sanitation<br />
Tokyo, competitive economy 119<br />
Tonga<br />
childhood obesity 80<br />
early childhood care <strong>and</strong> education 213, 213<br />
violence in schools 316<br />
tools for monitoring <strong>and</strong> assessment<br />
child development 217–219, 218, 219<br />
education system data collections 350, 351<br />
quality of education 211–212, 217<br />
school infrastructure 310–311<br />
UNICEF tools 196, 197, 310, 310–311<br />
see also measurement tools; monitoring<br />
Tostan project (Senegal) 92<br />
totalitarianism see authoritarian regimes<br />
trade union courses on sustainability 31<br />
traditional knowledge 27, 28–29<br />
see also cultural heritage<br />
transferable skills<br />
for green industry 42<br />
importance 50<br />
Transforming Our World 182<br />
see also Sustainable Development Goals<br />
transport sustainability 120–121, 121<br />
Trends in International Mathematics <strong>and</strong> Science<br />
Study (TIMSS)<br />
data on bullying 109, 315<br />
language monitoring 269<br />
Trinidad <strong>and</strong> Tobago<br />
educational attainment 75<br />
electricity provision 313<br />
gender disparity 75<br />
ICT facilities <strong>and</strong> internet access in schools<br />
312, 313, 314<br />
violence in schools 316<br />
Trinidad <strong>and</strong> Tobago Youth Survey 316<br />
Triple Helix model of innovation 119<br />
trust funds for development aid 137<br />
Tsukuba Science City 119<br />
Tullow Group Scholarship Scheme 320–321<br />
Tunisia<br />
cash transfers 352<br />
child development 219<br />
early childhood care <strong>and</strong> education 210<br />
educational attainment 74, 186<br />
environmental education 301<br />
gender disparity 74<br />
home learning environment 215, 215<br />
literacy 219, 281<br />
numeracy 219<br />
pre-primary education 209<br />
primary education 186, 335<br />
scholarship aid 324, 324<br />
school completion 186<br />
secondary education 186<br />
socio-economic background <strong>and</strong><br />
perseverance 249<br />
teacher education 335<br />
tertiary education 228, 229, 231<br />
within country disparity 186, 210<br />
years of education 186<br />
Turkey<br />
basic education 83<br />
child health 83<br />
childhood obesity 80<br />
children with disabilities 266<br />
digital literacy skills 247, 247<br />
educational attainment 56, 83, 88<br />
effect of politics on education 102<br />
employment <strong>and</strong> earnings 56, 88<br />
environmental education 301–302, 301<br />
gender disparity 88, 230<br />
ICT facilities 314<br />
literacy 282<br />
political participation 71, 102<br />
pre-primary education 272<br />
primary education 272, 314<br />
refugees 117<br />
scholarship aid 324, 324<br />
secondary education 272, 314<br />
socio-economic background <strong>and</strong><br />
perseverance 249<br />
tertiary education 229, 230<br />
TVET enrolment 223<br />
women in politics 71<br />
Turks <strong>and</strong> Caicos Isl<strong>and</strong>s, electricity provision,<br />
<strong>and</strong> ICT <strong>and</strong> internet access in<br />
schools 313<br />
Tuvalu<br />
HIV education 292<br />
TVET see technical <strong>and</strong> vocational education <strong>and</strong><br />
training (TVET)<br />
typhoons 310<br />
U<br />
Ug<strong>and</strong>a<br />
agriculture 47<br />
basic education 138<br />
class sizes 329<br />
democracy <strong>and</strong> education 102<br />
early childhood care <strong>and</strong> education 213, 213<br />
education aid 138<br />
education expenditure 347<br />
educational attainment 74, 75, 76, 81, 82, 85,<br />
186, 371<br />
employment 70, 85<br />
ethnic minorities 76<br />
female genital mutilation 82<br />
fertility rate 83<br />
gender disparity 70, 74, 75, 76<br />
gender-based violence 109<br />
health <strong>and</strong> nutrition programmes 78, 85<br />
intimate partner violence 81<br />
literacy 75, 281<br />
literacy programme participation 278<br />
malaria prevalence 371<br />
microfinance schemes 91<br />
mother tongue instruction 269, 270<br />
national assessments 200<br />
national education accounts 343<br />
primary education 83, 106, 186, 328, 335<br />
quality of education 118<br />
refugees 106<br />
rural areas 75, 315<br />
school completion 186<br />
school-based interventions 78<br />
secondary education 106, 186<br />
slum dwellers 118<br />
solar lighting project 30<br />
teacher attrition 339<br />
teacher deployment 329–330<br />
teacher education 335<br />
teacher motivation 334<br />
teaching methods 191, 192<br />
tertiary education 231<br />
textbooks 190<br />
TVET participation 224, 225<br />
violence in schools 316<br />
within country disparity 76, 186, 231<br />
years of education 186<br />
UIS see Unesco Institute for Statistics (UIS)<br />
Ukraine<br />
child development 219<br />
educational attainment 57, 58, 75, 186<br />
employment <strong>and</strong> earnings 58, 59, 89<br />
employment skills 59<br />
gender disparity 75, 89<br />
HIV education 292<br />
home learning environment 215, 215<br />
internally displaced persons 272<br />
literacy 59, 219, 281, 282<br />
numeracy 219<br />
primary education completion 187<br />
scholarship aid 324<br />
secondary education completion 187<br />
tertiary education 59, 231<br />
532<br />
ANNEX | INDEX
within country disparity 186, 231<br />
working poverty 57<br />
years of education 185, 186<br />
UN Conference on Trade <strong>and</strong> Development,<br />
estimate of SDG cost 7<br />
UN Conferences on Environment <strong>and</strong><br />
Development (Rio) 5<br />
UN Sustainability Literacy Test (SULITEST) 302<br />
UN Women, ‘substantive equality for women’ 71<br />
UNAIDS 291, 297<br />
under-5 mortality<br />
<strong>and</strong> educational attainment 155, 156,<br />
370–371, 371<br />
effect of pollution <strong>and</strong> inadequate facilities<br />
68<br />
<strong>and</strong> maternal literacy 82, 83<br />
reduction 69<br />
underemployment 56<br />
underweight children<br />
prevalence 80<br />
see also malnutrition<br />
unemployment 55–56<br />
<strong>and</strong> disaffected educated young <strong>people</strong> 103<br />
incentive for conflict 103<br />
UNESCO Institute for Lifelong Learning (UIL)<br />
278<br />
UNESCO Institute for Statistics (UIS)<br />
free <strong>and</strong> compulsory education 361<br />
indicators 263, 311, 311<br />
UNICEF<br />
Module on Child Functioning 266–267, 267<br />
monitoring tools 196, 197, 310, 310–311<br />
multisectoral social protection strategy 144<br />
Nourishing Bodies, Nourishing Minds<br />
initiative 140<br />
UNICEF Early Childhood Development Index 377<br />
Unilever, green policies 30<br />
United Arab Emirates<br />
city leadership 129<br />
educational attainment 76<br />
ethnic minorities 76<br />
national assessments 200<br />
pre-primary enrolment 208<br />
secondary education 335<br />
socio-economic background <strong>and</strong><br />
perseverance 249<br />
teacher deployment 332<br />
teacher mentoring 335<br />
women in politics 71<br />
United Kingdom<br />
adult education 237, 238<br />
aid donor 137<br />
city leadership 129<br />
climate change education 35<br />
crime 108<br />
education aid donor 354, 355<br />
education expenditure 233, 234<br />
education research 365<br />
educational attainment 89, 108<br />
employment 51<br />
environmental education 301<br />
extracurricular activity participation 299<br />
gender disparity 230<br />
global citizenship education <strong>and</strong> knowledge<br />
294, 300, 300<br />
household expenditure 233<br />
literacy 282<br />
manufacturing industry 51<br />
parent governors 294<br />
Project Atlas on students abroad 324<br />
pupil/teacher ratio <strong>and</strong> class size 329<br />
scholarship aid 324<br />
secondary education 238, 329<br />
socio-economic background <strong>and</strong><br />
perseverance 249<br />
special educational needs 266, 266<br />
student support 233, 234<br />
sustainability initiatives 35, 273<br />
tertiary education 89, 228, 229, 230, 231, 233,<br />
234, 238<br />
whole school environmental approach 27<br />
within country disparity 231<br />
women in politics 71, 90<br />
see also Engl<strong>and</strong>; Irel<strong>and</strong>; Scotl<strong>and</strong>; Wales<br />
United Nations Decade for Education for<br />
Sustainable Development 43<br />
United Nations Environment Programme 43<br />
United Nations Girls’ Education Initiative 265<br />
United Nations Relief <strong>and</strong> Works Agency<br />
(UNRWA), entrepreneurship courses<br />
253<br />
United Nations Stabilization Mission (Haiti) 111<br />
United Nations University Institute for the<br />
Advanced Study of Sustainability 30<br />
United Republic of Tanzania<br />
adult education 239<br />
early childhood care <strong>and</strong> education 212,<br />
213, 213<br />
education aid 138<br />
education expenditure 239<br />
educational attainment 81, 82, 186<br />
electricity provision 30, 312<br />
female genital mutilation 82<br />
female literacy 83<br />
financial management system 349–350<br />
gender disparity 75<br />
global citizenship education 294<br />
health care 78<br />
intimate partner violence 81, 82<br />
literacy 75, 83, 196, 281<br />
literacy programme participation 278<br />
mathematics achievement 197<br />
national assessments 197, 201<br />
nomad-specific education plans 9<br />
primary education 186, 196, 197, 312, 329<br />
reading proficiency 196<br />
rural areas 75<br />
school completion 186<br />
secondary education 186, 197, 312<br />
sexuality education 297<br />
solar lighting project 30<br />
teacher absenteeism 329<br />
teacher education 297<br />
teaching methods 191<br />
textbooks 190<br />
under-5 mortality rate 83<br />
urban planning 126<br />
within country disparity 186<br />
years of education 186<br />
United States<br />
child health 82<br />
childhood obesity 80<br />
children with disabilities 266<br />
city leadership 129<br />
civic education 100<br />
climate change 44<br />
competitive economy 119<br />
crime 120<br />
cyberbullying 315<br />
discrimination of minority groups 72, 87<br />
early childhood care <strong>and</strong> education 120, 212<br />
education aid donor 138, 355<br />
education expenditure 234<br />
educational attainment 54, 56, 82, 88, 120<br />
electoral participation 98<br />
employment <strong>and</strong> earnings 56, 88, 89, 89,<br />
120, 270<br />
employment skills 59, 62<br />
environmental concern 304<br />
environmental education 30, 301<br />
extracurricular activity participation 299<br />
financial literacy 251<br />
gender disparity 88, 89–90, 89, 90, 230<br />
global citizenship knowledge 300, 302, 303<br />
green economy 62, 270<br />
health care 71, 79<br />
household expenditure 234<br />
indigenous culture <strong>and</strong> knowledge 28, 29<br />
integrated interventions 125, 125<br />
literacy 282<br />
migration 271<br />
parental gender attitudes 90<br />
policy coherence failure 143–144<br />
political participation 71, 100, 102<br />
population growth 21<br />
pregnancy education 84<br />
primary education 187<br />
pupil/teacher ratio <strong>and</strong> class size 328, 329<br />
quality of education 100<br />
rural-urban migration 117<br />
scholarship aid 324<br />
school completion 187<br />
secondary education 120, 187, 328, 329<br />
segregation 123–124<br />
social skills 250<br />
socio-economic background 102, 249<br />
student support 321<br />
sustainable living 28, 30, 32<br />
teacher attrition 339<br />
tertiary education 50, 59, 228, 229, 229, 230,<br />
234<br />
urban farms 32<br />
urban planning 125, 125, 126<br />
violence in schools 109, 315, 316<br />
women in politics 71<br />
see also Northern America<br />
universal primary education<br />
access 73<br />
attainment of target 151, 153, 153, 154, 185,<br />
186–187<br />
<strong>and</strong> democracy 102<br />
<strong>and</strong> fertility rate reduction 83–84<br />
life-saving impact 161<br />
see also free <strong>and</strong>/or compulsory education;<br />
primary education<br />
universal secondary education<br />
access 73<br />
attainment of target 151, 152, 153, 153, 154,<br />
185, 186–187<br />
effect on child mortality levels 155, 156<br />
effect on poverty reduction 156–157, 157<br />
life-saving benefits 161<br />
see also free <strong>and</strong>/or compulsory education;<br />
secondary education<br />
University of Chicago Law School, informal<br />
education workers’ rights project 120<br />
University of Melbourne, Assessment <strong>and</strong><br />
Teaching of 21st Century Skills<br />
project 247<br />
university rankings 235<br />
UNRWA 253<br />
upper middle income countries<br />
basic skills for economic growth 49<br />
child mortality rate 83<br />
countries listed 399–400<br />
education aid disbursements 325, 325, 354<br />
education outcomes 68, 69<br />
gender disparity 259, 259, 262, 262<br />
health interventions 68, 69<br />
literacy 280<br />
out-of-school children 182, 182, 259<br />
overweight children 80<br />
population growth 20, 116<br />
primary education 69, 184, 259, 259, 262<br />
public education expenditure 136, 136, 346,<br />
346, 349<br />
school completion 184, 185, 185, 259, 259<br />
secondary education 259, 262<br />
tertiary education 229<br />
under-5 mortality 69<br />
wealth disparities 259, 259, 261<br />
working poverty 52<br />
see also emerging economies; richer<br />
countries<br />
upper secondary education<br />
effect on child mortality 155, 156<br />
effect on poverty reduction 156–157, 157<br />
<strong>and</strong> employment 56, 57, 58, 59, 59, 120<br />
enrolment 182<br />
enrolment of refugees 117, 272<br />
entrepreneurial skills 252<br />
gender disparity 185, 259, 259, 260, 262<br />
ICT facilities 313, 314<br />
mentoring for teachers 335<br />
out-of-school children 182, 182, 183<br />
rural areas 259<br />
2016 • GLOBAL EDUCATION MONITORING REPORT 533
school completion 152, 184, 185, 185, 186–187,<br />
259, 260<br />
2030 target 151, 153, 153, 154, 363<br />
in SDG 4 181<br />
teachers 331<br />
urban areas 259<br />
wealth disparities 185, 185, 259, 259, 260<br />
<strong>and</strong> working poverty 57, 58<br />
urban areas<br />
economic growth 118–119<br />
educational equality 166<br />
ICT facilities 314<br />
literacy 74, 75<br />
literacy programme participation 279, 279<br />
out-of-school children 259<br />
primary education 259<br />
private schools 118<br />
refugee enrolment 117<br />
rural-to-urban migration 21, 116, 117, 166<br />
school completion 259<br />
secondary education 259<br />
slum dwellers 118<br />
sustainable settlements project (Colombia)<br />
28<br />
urban farms 32<br />
violence 122, 127–128, 128<br />
see also cities; urban planning; urbanization<br />
urban competitiveness, education <strong>and</strong> research<br />
needs 119<br />
urban farms 32<br />
urban planning<br />
role of education 115<br />
training for 125–126<br />
urban violence 122<br />
integrated approaches 127–128, 128<br />
urban-rural disparity in education 121–122, 122<br />
urbanization 21, 115<br />
Uruguay<br />
child development 219<br />
educational attainment 186<br />
electricity provision 312, 313<br />
environmental education 301<br />
global citizenship education 294<br />
HIV education 292<br />
home learning environment 215<br />
internet access 313<br />
literacy 195, 219<br />
mathematics achievement 195<br />
numeracy 195, 219<br />
pre-primary education 338<br />
primary education 195, 312, 338<br />
psychological bullying in schools 315<br />
reading proficiency 195<br />
secondary education 312, 338, 338<br />
socio-economic background <strong>and</strong><br />
perseverance 249<br />
teacher salaries 338, 338<br />
violence in schools 315<br />
within country disparity 186<br />
years of education 186<br />
Uzbekistan<br />
gender disparity 230<br />
HIV education 292<br />
tertiary education 230<br />
textbooks 190<br />
V<br />
Vanuatu<br />
early childhood development 217<br />
HIV education 292<br />
income level 354<br />
underweight children 80<br />
Vélib (Paris) cycling scheme 121<br />
Venezuela see Bolivarian Republic of Venezuela<br />
verbal bullying, effects 109<br />
Viet Nam<br />
child development 217, 219<br />
city leadership 129<br />
climate change 34<br />
early childhood care <strong>and</strong> education 210<br />
education aid 138<br />
educational attainment 57, 58, 60, 74, 186<br />
employment 58, 60<br />
employment skills 59<br />
gender disparity 74<br />
green technology 273<br />
home learning environment 215<br />
literacy 219, 245, 281, 282<br />
mother tongue instruction 269, 269<br />
national assessments 200<br />
national education accounts 343, 344, 345<br />
natural disasters 33<br />
numeracy 219<br />
pre-primary education 209<br />
primary education 34<br />
primary education completion 186<br />
reading proficiency 245<br />
rural areas 122<br />
scholarship aid 324<br />
school completion 34<br />
scientific researchers 372<br />
secondary education 34<br />
secondary education completion 186<br />
sexuality education 291<br />
socio-economic background 60, 249<br />
sustainable development education 297<br />
teacher education 297<br />
teacher motivation 334<br />
teacher’s language 269<br />
technological transfer 42<br />
tertiary education 59, 229<br />
TVET participation 224<br />
underweight children 80<br />
urban areas 122<br />
wealth disparities 122<br />
within country disparity 186, 210<br />
working poverty 57, 60<br />
years of education 186<br />
violence see conflict; conflict-affected areas;<br />
gender-based violence; interpersonal<br />
violence; intimate partner violence;<br />
school-related violence; urban<br />
violence<br />
vocational training<br />
<strong>and</strong> employment 56<br />
entrepreneurial skills 253<br />
role in sustainable agriculture 45<br />
see also technical <strong>and</strong> vocational education<br />
<strong>and</strong> training (TVET)<br />
voter education campaigns 98, 99<br />
Voter Opinion <strong>and</strong> Involvement through Civic<br />
education (Democratic Republic of<br />
the Congo) 98<br />
voting 98–99<br />
voucher schemes, TVET 226<br />
vulnerable employment 57, 58, 58, 60<br />
W<br />
Wales, special educational needs 266<br />
Washington Group on Disability Statistics<br />
266–267<br />
waste from consumption, reduction 40, 43<br />
water depletion 44<br />
water deprivation, in indigenous populations 72<br />
water provision<br />
access to 68, 69, 85<br />
capacity building for 372<br />
school-based interventions 79–80, 308–309,<br />
309<br />
water, sanitation <strong>and</strong> hygiene facilities<br />
monitoring 308–309<br />
see also sanitation<br />
water use, freshwater <strong>and</strong> ocean 20<br />
WDE 361<br />
wealth disparities<br />
adult literacy participation 278<br />
cities 121–122, 122, 124<br />
digital literacy 247, 247<br />
educational attainment 73–74, 185, 186,<br />
230, 231<br />
<strong>and</strong> gender disparity 259<br />
literacy rates 279<br />
<strong>and</strong> marginalized groups 73–75, 74–75<br />
out-of-school children 259, 260<br />
over-age children in education 183, 184<br />
pre-primary education 209, 210<br />
primary education 184, 185, 259, 259, 260<br />
school completion 184, 185, 185, 259, 259,<br />
260, 261, 262<br />
secondary education 185, 185, 259, 259, 260,<br />
261, 262<br />
years of education 185, 186<br />
see also extreme poverty; poverty; within<br />
country disparities; working poverty<br />
weapons use in school 316<br />
welfare programmes see social protection<br />
programmes<br />
Western Africa<br />
adolescent birth rate 370<br />
educational attainment 370<br />
under-5 mortality rate 371<br />
see also individual countries<br />
Western Asia<br />
adolescent birth rate 370<br />
adult literacy 280<br />
conflict 104, 183<br />
countries listed 399<br />
ecological footprint 21<br />
education aid 354<br />
education expenditure 346<br />
educational attainment 55, 370<br />
environmental education 301<br />
gender disparity 182, 260, 262, 280<br />
HIV education 292<br />
human rights education 295<br />
out-of-school children 104, 182, 182, 183<br />
population growth 21<br />
pre-primary enrolment 207<br />
primary education 153, 153, 182, 183, 260, 262<br />
repetition rate 183<br />
school completion 154, 156, 260<br />
secondary education 153, 154, 155, 156, 182,<br />
182, 260, 262<br />
teacher education 331<br />
tertiary education 48, 229<br />
textbooks 295<br />
TVET enrolment 223<br />
under-5 mortality rate 156, 371<br />
unemployment 55<br />
universal primary <strong>and</strong> secondary education<br />
153, 153, 154, 155, 156<br />
wealth disparities 251, 260<br />
youth literacy 280<br />
see also individual countries<br />
Western Europe<br />
childhood obesity 79<br />
electoral participation 98<br />
health <strong>and</strong> nutrition programmes 79<br />
school-based interventions 79<br />
see also Europe; European Union; individual<br />
countries<br />
WHO/UNICEF Joint Monitoring Programme,<br />
water, sanitation <strong>and</strong> hygiene 309<br />
whole school approach (environment <strong>and</strong><br />
sustainability) 26–27, 293–294<br />
within country disparities<br />
digital literacy 247<br />
early childhood care <strong>and</strong> education 209, 210<br />
education funding 167<br />
as education indicator 257<br />
gender disparity 74, 74–75, 75<br />
ICT facilities 313–314<br />
marginalized groups 73–76, 74–75<br />
out-of-school children 181, 181<br />
rural-urban <strong>and</strong> intra-urban disparity<br />
121–124, 122<br />
teacher employment contracts 337<br />
see also wealth disparities<br />
women<br />
in agriculture 46, 69<br />
534<br />
ANNEX | INDEX
attitudes to business 253<br />
benefits of women 80–82<br />
effect of education on employment 81<br />
effects of voter education campaigns 98<br />
employment inequality 56, 57, 60, 61, 69–70,<br />
70, 81, 88–89, 88, 89, 165<br />
failure of education to empower 88–90<br />
female role models in schools 91<br />
financial acumen 251<br />
indigenous groups 73<br />
informal employment 69, 70, 120<br />
literacy 73, 81, 277–278, 279, 280, 280<br />
in politics 70, 71, 89–90, 99<br />
scholarships 321<br />
tertiary education 230, 230–231<br />
in vulnerable employment 57<br />
see also gender disparity; gender equality;<br />
girls; mothers<br />
women’s rights, education on 295, 295<br />
workers, education on environmental change<br />
<strong>and</strong> sustainability 31<br />
working poverty 52–53, 52, 57–58, 57, 60<br />
workplace-based TVET 223, 223, 224, 224, 225<br />
World Bank<br />
inequality indicators 263<br />
multisectoral aid 144<br />
public education expenditure reviews 350<br />
Skills Toward Employment <strong>and</strong> Productivity<br />
(STEP) survey 57, 58, 59, 60, 61, 225,<br />
282, 282<br />
Systems Approach for Better Education<br />
Results (SABER) 199–200, 227, 335,<br />
350–351, 362–363, 362<br />
World Data on Education (WDE) 361<br />
World Education Forum (Incheon) 180, 263<br />
Incheon Declaration 7, 12<br />
World Food Programme 140<br />
World Humanitarian Summit 2016 147<br />
world population see population growth<br />
World Programme on Human Rights Education<br />
framework 289–290<br />
World Report on Violence against Children 314<br />
world resources, unequal consumption 3, 21,<br />
22–23, 22, 23, 24, 120, 157, 162<br />
World Summit on the Information Society 311<br />
World Summit on Sustainable Development<br />
(Johannesburg) 5<br />
World Technical <strong>and</strong> Vocational Education <strong>and</strong><br />
Training (TVET) Database 361<br />
World Values Survey (WVS) 303<br />
worm infestation, treatment 79, 85<br />
Y<br />
years of schooling<br />
attainment 185, 186<br />
within-country disparities 74, 74–75, 76<br />
see also school completion; school<br />
participation<br />
Yemen<br />
adolescent birth rate 370<br />
attacks on schools 317<br />
early childhood care <strong>and</strong> education 213, 213<br />
educational attainment 82, 186, 370<br />
female genital mutilation 82<br />
financial literacy 251<br />
gendered attitudes 264<br />
HIV education 292<br />
primary education 106, 106, 186<br />
refugees 106, 106<br />
school completion 186<br />
secondary education 106, 186<br />
students abroad 323<br />
under-5 mortality rate 371<br />
underweight children 80<br />
within country disparity 186<br />
years of education 186<br />
Yolngu <strong>people</strong>s, education issues 77<br />
young adults, years of schooling 76<br />
young <strong>people</strong><br />
birth rate of adolescents 370, 370<br />
global citizenship <strong>and</strong> sustainability<br />
knowledge 302–303<br />
internet use 245<br />
literacy 74, 279, 280, 280<br />
NEET (not in education, employment or<br />
training) 369<br />
out-of-school 182, 182, 183, 183<br />
years of educational attainment 185, 186<br />
see also higher education; secondary<br />
education; technical <strong>and</strong> vocational<br />
education <strong>and</strong> training (TVET);<br />
tertiary education; youth literacy<br />
Youth Entrepreneurship Development<br />
programme 253<br />
youth literacy 74, 279, 280, 280<br />
youth organizations, extracurricular activities<br />
299<br />
Yugoslav Republic of Macedonia see former<br />
Yugoslav Republic of Macedonia, The<br />
Z<br />
Zambia<br />
adaption to climate change 10<br />
agriculture 46<br />
aid for domestic resources mobilization 138<br />
child health 82<br />
education aid 200<br />
educational attainment 10, 74, 81, 186, 370<br />
electricity provision 312<br />
gender disparity 74, 75<br />
global citizenship education <strong>and</strong> knowledge<br />
290, 294, 303<br />
intimate partner violence 81<br />
literacy 75, 82, 281<br />
literacy programme participation 278<br />
national assessments 200<br />
primary education 186, 312<br />
rural areas 75<br />
school completion 186<br />
secondary education 186, 312<br />
teacher education 333<br />
teacher skills 333<br />
tertiary education 231<br />
under-5 mortality rate 370, 371<br />
within country disparity 186, 231<br />
years of education 186<br />
youth literacy 280<br />
Zimbabwe<br />
child development 219<br />
educational attainment 74, 81, 186<br />
gender disparity 74<br />
global citizenship education 290<br />
health interventions 87<br />
HIV education 292, 292<br />
HIV status 87<br />
home learning environment 215, 215<br />
intimate partner violence 81<br />
literacy 219, 281<br />
literacy programme participation 278<br />
national assessments 199<br />
national education accounts 343, 344, 344,<br />
345<br />
numeracy 219<br />
pre-primary education 209<br />
primary education completion 186<br />
school curriculum 290<br />
secondary education completion 186<br />
students abroad 323<br />
tertiary education 228, 231<br />
voter education 98–99<br />
within country disparity 186, 231<br />
years of education 186<br />
2016 • GLOBAL EDUCATION MONITORING REPORT 535
536<br />
REFERENCES
Introduction<br />
Carson, R. 1962. Silent Spring. Boston, MA, Houghton Mifflin.<br />
Ehrlich, P. R. 1968. The Population Bomb. New York, Ballantine Books.<br />
Evans, J. 2015. There are no jobs on a dead <strong>planet</strong>. OECD Observer, November.<br />
Gudynas, E. 2011. Buen Vivir: today’s tomorrow. Development, Vol. 54, No. 4, pp. 441–47.<br />
Harber, C. 2014. Education <strong>and</strong> International Development: Theory, Practice <strong>and</strong> Issues. Oxford, UK, Symposium Books.<br />
Hardoon, D., Ayele, S. <strong>and</strong> Fuentes-Nivea, R. 2016. An Economy for the 1%: How Privilege <strong>and</strong> Power in the Economy Drive<br />
Extreme Inequality <strong>and</strong> How This Can Be Stopped Oxford, UK, Oxfam International. (Briefing paper.)<br />
Hawkes, J. 2001. The Fourth Pillar of Sustainability: Culture’s Essential Role in Public Planning. Melbourne, Australia, Cultural<br />
Development Network of Victoria.<br />
ISCU <strong>and</strong> ISSC. 2015. Review of Targets for the Sustainable Development Goals: The Science Perspective. Paris, International<br />
Council for Science <strong>and</strong> International Social Science Council.<br />
IUCN, UNEP <strong>and</strong> WWF. 1980. World Conservation Strategy: Living Resource Conservation for Sustainable Development. Gl<strong>and</strong>,<br />
Switzerl<strong>and</strong>, International Union for Conservation of Nature, United Nations Environment Programme, World<br />
Wildlife Fund, Food <strong>and</strong> Agriculture Organization of the United Nations <strong>and</strong> UNESCO.<br />
Lele, S. 1991. Sustainable development: a critical review. World Development, Vol. 19, No. 6, pp. 607–21.<br />
Leonard, L. <strong>and</strong> Barry, J. (eds). 2009. The Transition to Sustainable Living <strong>and</strong> Practice, (Vol. 4). Bingley, UK, Emerald Group<br />
Publishing.<br />
Meadows, D., Meadows, D., R<strong>and</strong>ers, J. <strong>and</strong> Behrens, W. W. 1972. The Limits to Growth: a Report for the Club of Rome’s<br />
Project on the Predicament of Mankind. New York, Universe Books.<br />
Nussbaum, M. C. C. 2010. Not for Profit: Why Democracy Needs the Humanities. Princeton, NJ, Princeton University Press.<br />
Orr, D. 1994. Earth in Mind: On Education, Environment, <strong>and</strong> the Human Prospect. Washington, DC, Isl<strong>and</strong> Press.<br />
Sachs, J. 2015. The Age of Sustainable Development. New York, Columbia University Press.<br />
UIL. 2015. Conceptions <strong>and</strong> realities of lifelong learning. UNESCO Institute for Lifelong Learning. (Background paper for<br />
Global Education Monitoring Report 2016.)<br />
UNCTAD. 2014. World Investment Report 2014: Investing in the SDGs – An Action Plan. Geneva, Switzerl<strong>and</strong>, United Nations<br />
Conference on Trade <strong>and</strong> Development.<br />
UNEP. 2016. Adaptation Finance Gap Report. Nairobi, United Nations Environment Programme.<br />
UNEP <strong>and</strong> UNCTAD. 1974. The Cocoyoc Declaration. Adopted at symposium on Patterns of Resource Use, Environment<br />
<strong>and</strong> Development Strategies, Cocoyoc, Mexico, 8–12 October.<br />
UNESCO. 2000. World Education Report 2000: The Right to Education – Towards Education for All Throughout Life. Paris,<br />
UNESCO.<br />
___. 2013. Education Transforms Lives. Paris, UNESCO.<br />
___. 2014. EFA Global Monitoring Report 2013/4: Teaching <strong>and</strong> Learning – Achieving Quality for All. Paris, UNESCO.<br />
___. 2015a. Education 2030 Incheon Declaration <strong>and</strong> Framework for Action. Paris, UNESCO.<br />
___. 2015b. EFA Global Monitoring Report 2015: Education for All 2000–2015 – Achievements <strong>and</strong> Challenges. Paris, UNESCO.<br />
UNESCO <strong>and</strong> UIS. 2012. International St<strong>and</strong>ard Classification of Education IESCD 2011. Montreal, Que., UNESCO Institute<br />
for Statistics.<br />
United Nations. 1987. Our Common Future. Oxford, UK, World Commission on Environment <strong>and</strong> Development. (Annex to<br />
document A/42/427.)<br />
___. 2002. Johannesburg Declaration on Sustainable Development. Johannesburg, South Africa, United Nations.<br />
___. 2012. Realizing the Future We Want for All: Report to the Secretary-General. New York, United Nations.<br />
___. 2013. A New Global Partnership: Eradicate Poverty <strong>and</strong> Transform Economics Through Sustainable Development. New York,<br />
United Nations. (Report of the High-Level Panel of Eminent Persons on the Post-2015 Development Agenda.)<br />
___. 2014. We the Peoples: Celebrating 7 Million Voices. New York, United Nations/Overseas Development Institute/Ipsos Mori.<br />
___. 2015a. The Millennium Development Goals Report 2015. New York, United Nations.<br />
2016 • GLOBAL EDUCATION MONITORING REPORT 537
___. 2015b. World Population Prospects: The 2015 Revision. New York, United Nations, Department of Economic <strong>and</strong> Social<br />
Affairs, Population Division. https://esa.un.org/unpd/wpp. (Accessed 5 May 2016.)<br />
Vladimirova, K. <strong>and</strong> Le Blanc, D. 2015. How Well Are the Links Between Education <strong>and</strong> Other Sustainable Development Goals<br />
Covered in UN Flagship Reports? A Contribution to The Study of the Science-Policy Interface On Education in The UN<br />
System. New York, United Nations. (DESA Working Paper 146.)<br />
Wals, A. E. J. <strong>and</strong> Lenglet, F. 2016. Sustainability citizens: collaborative <strong>and</strong> disruptive social learning. R. Horne, J. Fien, B.<br />
Beza <strong>and</strong> A. Nelson (eds), Sustainability Citizenship in Cities: Theory <strong>and</strong> Practice. London, Routledge, pp. 52–67.<br />
Zusman, E., Bengtsson, M. <strong>and</strong> Olsen, S. H. 2015. Governing the Sustainable Development Goals: closing the gap<br />
between aspiration <strong>and</strong> action. Achieving the Sustainable Development Goals: From Agenda to Action. Hayama, Japan,<br />
Institute for Global Environmental Strategies, pp. 1–22.<br />
Chapter 1<br />
Anderson, A. 2012. Climate change education for mitigation <strong>and</strong> adaptation. Journal of Education for Sustainable<br />
Development, Vol. 6, No. 2, pp. 191–206.<br />
___. 2013. Learning to be resilient global citizens for a sustainable world. Paris, UNESCO. (Background paper for the EFA<br />
Global Monitoring Report 2013/4.)<br />
Avaaz. 2013. 3 million to Save the Bees. New York, Avaaz. https://secure.avaaz.org/en/save_the_bees_<br />
global/?pv=59&rc=fb. (Accessed 10 May 2016.)<br />
Barnhardt, R. 2008. Creating a place for indigenous knowledge in education. Gruenewald, D. A. <strong>and</strong> Smith, G. A. (eds),<br />
Place-based Education in the Global Age: Local Diversity. New York, Psychology Press, pp. 113–33.<br />
Barnhardt, R. <strong>and</strong> Kawagley, A. O. 2005. Indigenous knowledge systems <strong>and</strong> Alaska Native ways of knowing.<br />
Anthropology <strong>and</strong> Education Quarterly, Vol. 36, No. 1, pp. 8–23.<br />
Batibo, H. 2009. Transmitting indigenous knowledge through the school curriculum in a diminishing biocultural<br />
environment: the case of Botswana. Bates, P., Chiba, M., Kube, S. <strong>and</strong> Nakashima, D. (eds), Learning <strong>and</strong> Knowing in<br />
Indigenous Societies Today. Paris, UNESCO, pp. 87–94.<br />
___. 2013. Preserving <strong>and</strong> transmitting indigenous knowledge in diminishing bio-cultural environment: case studies<br />
from Botswana <strong>and</strong> Tanzania. African Study Monographs. Vol. 34, No. 3, pp. 161–73.<br />
Battiste, M. 2002. Indigenous Knowledge <strong>and</strong> Pedagogy in First Nations Education: A Literature Review with Recommendation.<br />
Ottawa, Canada, Apamuwek Institute.<br />
BIO Intelligence Service. 2012. Policies to Encourage Sustainable Consumption. Report prepared for the European<br />
Commission. Paris/Brussels, BIO Intelligence Service/European Commission. http://ec.europa.eu/environment/<br />
eussd/pdf/report_22082012.pdf.<br />
Brulle, R. J. 2010. From environmental campaigns to advancing the public dialog: environmental communication for<br />
civic engagement. Environmental Communication, Vol. 4, No. 1, pp. 82–98.<br />
Buhaug, H. <strong>and</strong> Urdal, H. 2013. An urbanization bomb? Population growth <strong>and</strong> social disorder in cities. Global<br />
Environmental Change, Vol. 23, No. 1, pp. 1–10.<br />
Centre for Environmental Education. 2015. Paryavaran Mitrya: Actions that Count. Ahmedabad, India, Centre for<br />
Environmental Education.<br />
Clery, E. <strong>and</strong> Rhead, R. 2013. Education <strong>and</strong> attitudes towards the environment. Paris, UNESCO. (Background paper for the<br />
EFA Global Monitoring Report 2013/4.)<br />
Cunningham, M. 2010. Laman laka: our indigenous path to self-determined development. Tauli-Corpuz, V., Enkiwe-<br />
Abayao, L. <strong>and</strong> de Chavez, R. (eds), Towards an Alternative Development Paradigm: Indigenous Peoples’ Self-Determined<br />
Development. Baguio City, Philippines, Tebtebba Foundation, pp. 89–116.<br />
538<br />
REFERENCES
Das, P. K. 2010. Climate Change <strong>and</strong> Education: Bangladesh. London, UK Department for International Development.<br />
DEFRA. 2006. Climate Change: The UK Programme 2006. Norwich, UK, Department for Environment, Food & Rural Affairs.<br />
Deressa, T. T., Hassan, R. M., Ringler, C., Alemu, T. <strong>and</strong> Yesuf, M. 2009. Determinants of farmers’ choice of adaptation<br />
methods to climate change in the Nile Basin of Ethiopia. Global Environmental Change, Vol. 19, No. 2, pp. 248–55.<br />
Dweba, T. P. <strong>and</strong> Mearns, M. A. 2011. Conserving indigenous knowledge as the key to the current <strong>and</strong> future use of<br />
traditional vegetables. International Journal of Information Management, Vol. 31, No. 6, pp. 564–71.<br />
Ewing, B., Moore, D., Goldfinger, S., Oursler, A., Reed, A. <strong>and</strong> Wackernagel, M. 2010. The Ecological Footprint Atlas. Oakl<strong>and</strong>,<br />
CA, Global Footprint Network.<br />
Fadeeva, Z., Payyappallimana, P., Tabucanon, M. <strong>and</strong> Chhokar, K. B. 2014. Building a Resilient Future through<br />
Multistakeholder Learning <strong>and</strong> Action: Ten Years of Regional Centres of Expertise on Education for Sustainable<br />
Development. Tokyo, United Nations University Institute for the Advanced Study of Sustainability.<br />
Franzen, A. <strong>and</strong> Vogl, D. 2013. Two decades of measuring environmental attitudes: a comparative analysis of 33<br />
countries. Global Environmental Change, Vol. 23, No. 5, pp. 1001–08.<br />
Fuller, M. C., Kunkel, C., Zimring, M., Hoffman, I., Soroye, K. L. <strong>and</strong> Goldman, C. 2010. Driving Dem<strong>and</strong> for Home Energy<br />
Improvements: Motivating Residential Customers to Invest in Comprehensive Upgrades that Eliminate Energy Waste,<br />
Avoid High Utility Bills, <strong>and</strong> Spur the Economy. Berkeley, CA, Lawrence Berkeley National Laboratory.<br />
Gardiner, B. 2015. How India is Teaching 300 Million Kids to Be Environmentalists. Smithsonian.com. www.smithsonianmag.<br />
com/arts-culture/india-teaching-300-million-kids-sustainability-180956494. (Accessed 6 July 2016.)<br />
Global Footprint Network. 2016. Data <strong>and</strong> Results. Oakl<strong>and</strong>, CA, Global Footprint Network. www.footprintnetwork.org/<br />
en/index.php/GFN/page/footprint_data_<strong>and</strong>_results. (Accessed 23 February 2016.)<br />
Gorjestani, N. 2004. Indigenous knowledge: the way forward. Woytek, R., Shroff-Mehta, P. <strong>and</strong> Mohan, P. C. (eds),<br />
Indigenous Knowledge: Local Pathways to Global Development – Marking Five Years of the World Bank Indigenous<br />
Knowledge for Development Program. Washington, DC, World Bank, pp. 45–54.<br />
Greening of Detroit. 2015. Greening of Detroit. Detroit, MI, Greening of Detroit. www.greeningofdetroit.com. (Accessed<br />
12 February 2016.)<br />
Gruenewald, D. A. <strong>and</strong> Smith, G. A. (eds). 2008. Place-Based Education in the Global Age: Local Diversity. New York,<br />
Psychology Press.<br />
Gudynas, E. 2011a. Buen vivir: germin<strong>and</strong>o alternativas al desarrollo [Living well: germinating alternatives to<br />
development]. América Latina en Movimiento, No. 462, pp. 1–20.<br />
Gudynas, E. 2011b. Buen vivir: today’s tomorrow. Development, Vol. 54, No. 4, pp. 441–47.<br />
Hacking, E. B., Scott, W. <strong>and</strong> Lee, E. 2010. Evidence of Impact of Sustainable Schools. Nottingham, UK, Department for<br />
Children, Schools <strong>and</strong> Families.<br />
Hargreaves, L. G. 2008. The whole-school approach to eduation for sustainable development: from pilot projects to<br />
systemic change. Policy & Practice: A Development Education Review, No. 6, Spring, pp. 69–74.<br />
Hertwich, E. 2003. The Seeds of Sustainable Consumption Patterns. Paper presented at the 1st International Workshop on<br />
Sustainable Consumption in Japan, Tokyo, 19–20 May.<br />
Hisali, E., Birungi, P. <strong>and</strong> Buyinza, F. 2011. Adaptation to climate change in Ug<strong>and</strong>a: evidence from micro level data.<br />
Global Environmental Change, Vol. 21, No. 4, pp. 1245–61.<br />
IAU. 2015. Ryerson University. Paris, International Association of Universities. www.iau-hesd.net/en/universities/2781-<br />
ryerson-university.html. (Accessed 05 June 2016.)<br />
___. 2016. New Regional Centre of Expertise in Education. Paris, International Association of Universities. www.iau-hesd.<br />
net/en/news/2650-new-regional-centre-expertise-education-sustainable-development-university-paris-seine.<br />
(Accessed 25 March 2016.)<br />
Ibañez, A. 2011. Un acercamiento al “buen vivir”. Contextualizaciones Latinoamericanas, Vol. 3, No. 5, pp. 1–13.<br />
ICCA. 2015. Indigenous <strong>people</strong>s’ <strong>and</strong> community conserved territories <strong>and</strong> areas (ICCAs): a bold frontier for conservation,<br />
sustainable livelihoods <strong>and</strong> the respect of collective rights. Bugnaux-sur-Rolle, Switzerl<strong>and</strong>, ICCA Consortium. www.<br />
iccaconsortium.org. (Accessed 14 February 2016.)<br />
ILO. 2016. Green Jobs for a Just Transition to Low-Carbon <strong>and</strong> Climate-Resilient Development. Turin, Italy, International<br />
Labour Organization.<br />
Internal Displacement Monitoring Centre. 2015. Bangladesh: Comprehensive Response Required to Complex Displacement<br />
Crisis. Geneva, Switzerl<strong>and</strong>, Internal Displacement Monitoring Centre/Norwegian Refugee Council.<br />
2016 • GLOBAL EDUCATION MONITORING REPORT 539
___. 2016. Global Report on International Displacement. Geneva, Switzerl<strong>and</strong>, Internal Displacement Monitoring Centre/<br />
Norwegian Refugee Council.<br />
IPCC. 2014. Climate Change 2014: Synthesis Report – Contribution of Working Groups I, II <strong>and</strong> III to the Fifth Assessment<br />
Report of the Intergovernmental Panel on Climate Change. Geneva, Switzerl<strong>and</strong>, Intergovernmental Panel on Climate<br />
Change.<br />
Kabir, M. I., Rahman, M. B., Smith, W., Lusha, M. A. F. <strong>and</strong> Milton, A. H. 2015. Child centred approach to climate change<br />
<strong>and</strong> health adaptation through schools in Bangladesh: a cluster r<strong>and</strong>omised intervention trial. PLoS ONE, Vol. 10,<br />
No. 8, e0134993.<br />
Kreft, S., Eckstein, D., Dorsch, L. <strong>and</strong> Fischer, L. 2015. Global Climate Risk Index 2016: Who Suffers Most From Extreme<br />
Weather Events? Weather-related Loss Events in 2014 <strong>and</strong> 1995 to 2014. Bonn, Germany, Germanwatch e.V.<br />
Leduc, T. B. <strong>and</strong> Crate, S. A. 2013. Reflexive shifts in climate research <strong>and</strong> education: toward relocalizing our lives. Nature<br />
+ Culture, Vol. 8, No. 2, pp. 134–61.<br />
Lee, T. M., Markowitz, E. M., Howe, P. D., Ko, C.-Y. <strong>and</strong> Leiserowitz, A. A. 2015. Predictors of public climate change<br />
awareness <strong>and</strong> risk perception around the world. Nature Climate Change, Vol. 5, No. 11, pp. 1014–20.<br />
Lutz, W., Muttarak, R. <strong>and</strong> Striessnig, E. 2015. Universal education is key to enhanced climate adaptation. Science, Vol.<br />
346, No. 6213, pp. 1061–62.<br />
Mackenzie, S. H., Son, J. S. <strong>and</strong> Hollenhorst, S. 2014. Unifying psychology <strong>and</strong> experiential education: toward an<br />
integrated underst<strong>and</strong>ing of why it works. Journal of Experiential Education, Vol. 37, No. 1, pp. 75–88.<br />
Maddison, D. 2007. The Perception of <strong>and</strong> Adaptation to Climate Change in Africa. Washington, DC, World Bank. (Policy<br />
Research Working Paper 4308.)<br />
Magni, G. 2016. Indigenous knowledge <strong>and</strong> implications for the Sustainable Development Agenda. (Background paper for the<br />
Global Education Monitoring Report 2016.)<br />
Marika, R., Yunupingu, Y., Marika-Mununggiritj, R. <strong>and</strong> Muller, S. 2009. Leaching the poison: the importance of process<br />
<strong>and</strong> partnership in working with Yolngu. Journal of Rural Studies, Vol. 25, No. 4, pp. 404–13.<br />
Maurial, M. 2002. Indigenous knowledge <strong>and</strong> schooling: a continuum between conflict <strong>and</strong> dialogue. Semali, L. M. <strong>and</strong><br />
Kincheloe, J. L. (eds), What is indigenous knowledge? Voices from the Academy. New York, Routledge, pp. 59–78.<br />
McKenzie-Mohr, D. 2011. Fostering Sustainable Behavior: An Introduction to Community-Based Social Marketing, 3rd edn.<br />
Gabriola Isl<strong>and</strong>, B.C., New Society Publishers.<br />
McKinsey. 2014. Sustainability’s Strategic Worth: McKinsey Global Survey Results. New York, McKinsey & Co.<br />
McLellan, R., Iyengar, L., Jeffries, B. <strong>and</strong> Oerlemans, N. 2014. Living Planet Report 2014: Species <strong>and</strong> Spaces, People <strong>and</strong><br />
Places. Gl<strong>and</strong>, Switzerl<strong>and</strong>, WWF.<br />
McMillin, J. <strong>and</strong> Dyball, R. 2009. Developing a whole-of-university approach to educating for sustainability linking<br />
curriculum, research <strong>and</strong> sustainable campus operations. Journal of Education for Sustainable Development. Vol. 3,<br />
No. 1, pp. 55–64.<br />
Mfune, J., Ruppel, O., Willemse, N. <strong>and</strong> Mosimane, A. 2009. Proposed Climate Change Strategy <strong>and</strong> Action Plan. Windhoek,<br />
Namibia Ministry of Environment <strong>and</strong> Tourism.<br />
Nakashima, D. J., Galloway McLean, K., Thulstrup, H. D., Ramos Castillo, A. <strong>and</strong> Rubis, J. T. 2012. Weathering Uncertainty:<br />
Traditional Knowledge for Climate Change Assessment <strong>and</strong> Adaptation. Paris/Darwin, Australia, UNESCO/UNU.<br />
Noguchi, F., Guevara, J. R. <strong>and</strong> Yorozu, R. 2015. Communities in Action: Lifelong Learning for Sustainable Development.<br />
Hamburg, Germany, UNESCO Institute for Lifelong Learning.<br />
OECD. 2009. Green at Fifteen? How 15-year-olds Perform in Environmental Science <strong>and</strong> Geoscience in PISA. Paris, Organisation<br />
for Economic Co-operation <strong>and</strong> Development.<br />
Phuc, N. Q., Westen, A. C. M. v. <strong>and</strong> Zoomers, A. 2014. Agricultural l<strong>and</strong> for urban development: the process of l<strong>and</strong><br />
conversion in Central Vietnam. Habitat International, Vol. 41, pp. 1–7.<br />
Pichler, A. <strong>and</strong> Striessnig, E. 2013. Differential vulnerability to hurricanes in Cuba, Haiti, <strong>and</strong> the Dominican Republic:<br />
the contribution of education. Ecology <strong>and</strong> Society, Vol. 18, No. 3, p. 31.<br />
Plan International. 2008. From Catastrophe to Opportunity: Children in Asia Creating Positive Social Changes after Disaster.<br />
Bangkok, Plan International, Asia Regional Office.<br />
Radoll, P. 2015. Aboriginal <strong>people</strong>s, education <strong>and</strong> information <strong>and</strong> communication technologies in Australia. Bidwell,<br />
N. J. <strong>and</strong> Winschiers-Theophilus, H. (eds), At the Intersection of Indigenous <strong>and</strong> Traditional Knowledge <strong>and</strong> Technology<br />
Design. Santa Rosa, CA, Informing Science Press, pp. 19–32.<br />
540<br />
REFERENCES
Reyhner, J. <strong>and</strong> Eder, J. 2015. American Indian Education: A History. Norman, OK, University of Oklahoma Press.<br />
Rickinson, M., Dillon, J., Teamey, K., Morris, M., Choi, M. Y., S<strong>and</strong>ers, D. <strong>and</strong> Benefield, P. 2004. A Review of Research on<br />
Outdoor Learning. Shrewsbury, UK, National Foundation for Educational Research/King’s College London.<br />
Rockström, J., Steffen, W., Noone, K., Persson, Å., Chapin, F. S. I., Lambin, E., Lenton, T. M., Scheffer, M., Folke, C.,<br />
Schellnhuber, H. J., Nykvist, B., Wit, C. A. d., Hughes, T., Leeuw, S. v. d., Rodhe, H., Sörlin, S., Snyder, P. K., Costanza,<br />
R., Svedin, U., Falkenmark, M., Karlberg, L., Corell, R. W., Fabry, V. J., Hansen, J., Walker, B., Liverman, D., Richardson,<br />
K., Crutzen, P. <strong>and</strong> Foley, J. 2009. Planetary boundaries: exploring the safe operating space for humanity. Ecology<br />
<strong>and</strong> Society, Vol. 14, No. 2, p. 32.<br />
Save the Children. 2008. In the Face of Disaster: Children <strong>and</strong> Climate Change. London, Save the Children.<br />
Schulz, W., Ainley, J., Fraillon, J., Kerr, D. <strong>and</strong> Losito, B. 2010. ICCS 2009 International Report: Civic Knowledge, Attitudes, <strong>and</strong><br />
Engagement among Lower-secondary School Students in 38 Countries. Amsterdam, International Association for the<br />
Evaluation of Educational Achievement.<br />
Senge, P., Smith, B., Kruschwitz, N., Laur, J. <strong>and</strong> Schley, S. 2008. The Necessary Revolution: How Individuals <strong>and</strong><br />
Organizations Are Working Together to Create a Sustainable World. New York, Doubleday.<br />
Sheil, D., Boissière, M. <strong>and</strong> Beaudoin, G. 2015. Unseen sentinels: local monitoring <strong>and</strong> control in conservation’s blind<br />
spots. Ecology <strong>and</strong> Society, Vol. 20, No. 2, p. 39.<br />
Stavenhagen, R. 2015. Indigenous <strong>people</strong>s’ rights to education. European Journal of Education, Vol. 50, No. 3, pp. 254–57.<br />
Steffen, W., Richardson, K., Rockström, J., Cornell, S. E., Fetzer, I., Bennett, E. M., Biggs, R., Carpenter, S. R., Vries, W. d.,<br />
Wit, C. A. d., Folke, C., Gerten, D., Heinke, J., Mace, G. M., Persson, L. M., Ramanathan, V., Reyers, B. <strong>and</strong> Sörlin, S.<br />
2015. Planetary boundaries: Guiding human development on a changing <strong>planet</strong>. Science, Vol. 347, No. 6223.<br />
Steffen, W., Rockström, J. <strong>and</strong> Costanza, R. 2011. How defining <strong>planet</strong>ary boundaries can transform our approach to<br />
growth. Solutions: For a Sustainable & Desirable Future, Vol. 2, No. 3, pp. 59–65.<br />
Stern, N. 2007. The Economics of Climate Change: The Stern Review. Cambridge, UK, Cambridge University Press.<br />
Sussman, A., Fletcher, C. H. <strong>and</strong> Sachs, J. P. 2013. Climate Change Education in the U.S. Affiliated Pacific Isl<strong>and</strong>s. Conference<br />
paper for American Geophysical Union, Fall Meeting, San Francisco, CA.<br />
Swim, J. K., Clayton, S. <strong>and</strong> Howard, G. S. 2011. Human behavioral contributions to climate change: psychological <strong>and</strong><br />
contextual drivers. American Psychologist, Vol. 66, No. 4, pp. 251–64.<br />
Tauli-Corpuz, V. 2010. The Human Development Framework <strong>and</strong> Indigenous Peoples’ Self-determined Development or<br />
Development with Culture <strong>and</strong> Identity. New York, UN Permanent Forum on Indigenous Issues.<br />
Tauli-Corpuz, V., Enkiwe-Abayao, L., Magata, H. <strong>and</strong> Tugendhat, H. 2009. Asia Summit on Climate Change <strong>and</strong> Indigenous<br />
Peoples: Report of the Summit. Baguio City, Philippines, Tebtebba Foundation.<br />
The Economist. 2008. Just Good Business: a Special Report on Corporate Social Responsibility. London, The Economist<br />
Newspaper Limited.<br />
___. 2014. In Search of the Good Business. London, The Economist Newspaper Limited.<br />
Theimer, S. <strong>and</strong> Ernst, J. 2012. Fostering “connectedness to nature” through U.S. Fish <strong>and</strong> Wildlife Service education<br />
<strong>and</strong> outreach programming: a qualitative evaluation. Applied Environmental Education & Communication Vol. 11, No.<br />
2, pp. 79–87.<br />
Tietenberg, T. H. <strong>and</strong> Lewis, L. 2012. Environmental & Natural Resource Economics, 9th edn. Upper Saddle River, NJ,<br />
Pearson Education.<br />
Touchton, M. <strong>and</strong> Wampler, B. 2013. Improving social well-being through new democratic institutions. Comparative<br />
Political Studies, Vol. 47, No. 10, pp. 1442–69.<br />
TUC. 2014. The Union Effect: Greening the Workplace. London, Trade Union Congress.<br />
UIL. 2015. Conceptions <strong>and</strong> realities of lifelong learning, UNESCO Institute for Lifelong Learning. (Background paper for<br />
the Global Education Monitoring Report 2016.)<br />
UNDP. 2015a. Empowering Women One Community at a Time: The Mekhe Solar Cooker Project. New York, United Nations<br />
Development Programme/The GEF Small Grants Programme.<br />
___. 2015b. Human Development Index. New York, United Nations Development Programme.<br />
UNEP. 2012. Global Environment Outlook-5: Environment for the Future We Want. Nairobi, United Nations Environment<br />
Programme.<br />
UNESCO-IBE. 2013. IBE Glossary of Curriculum Terminology. Geneva, Switzerl<strong>and</strong>, UNESCO International Bureau of<br />
Education. (IBE/2013/KPM/PI/01.)<br />
2016 • GLOBAL EDUCATION MONITORING REPORT 541
UNESCO. 2014. Shaping the Future We Want: UN Decade of Education for Sustainable Development (2005–2014) – Final<br />
Report. Paris, UNESCO.<br />
___. 2016. If You Don’t Underst<strong>and</strong>, How Can You Learn? Paris, UNESCO. (Policy Paper 24.)<br />
___ (ed.). 2009. Learning <strong>and</strong> Knowing in Indigenous Societies Today. Paris, UNESCO.<br />
UNICEF. 2015. UNICEF Annual Report 2015: Nepal. New York, UNICEF.<br />
United Nations. 2009. State of the World’s Indigenous Peoples. New York, United Nations Department of Economic <strong>and</strong><br />
Social Affairs, Division for Social Policy <strong>and</strong> Development, Secretariat of the Permanent Forum on Indigenous<br />
Issues.<br />
___. 2015. World Population Prospects: The 2015 Revision. New York, United Nations, Department of Economic <strong>and</strong> Social<br />
Affairs, Population Division. https://esa.un.org/unpd/wpp. (Accessed 15 March 2016.)<br />
UNPFII. 2008. Consultation Workshop <strong>and</strong> Dialogue on Indigenous Peoples’ Self-determined Development or Development with<br />
Identity. Tivoli, Italy, UN Permanent Forum on Indigenous Issues.<br />
UOCRA-Argentina. 2009. Environment & Renewable Energy Training Courses, Outreach, Vol. 10, December 2009.<br />
van Dijk, M., Hilderlink, H., Rooij, W. v., Rutten, M., Ashton, R., Lan, V. C. <strong>and</strong> Kartikasari, K. 2012. L<strong>and</strong> Use, Food Security,<br />
<strong>and</strong> Climate Change in Vietnam. London, Climate & Development Knowledge Network.<br />
van Vugt, M., Van Lange, P. A. <strong>and</strong> Meertens, R. M. 1996. Commuting by car or public transportation? A social dilemma<br />
analysis of travel mode judgements. European Journal of Social Psychology, Vol. 26, No. 3, pp. 373–95.<br />
Vize, S. 2012. Using education to bring climate change adaptation to Pacific communities. Journal of Education for<br />
Sustainable Development, Vol. 6, No. 2, pp. 219–35.<br />
Wals, A. E. J. 2012. Learning our way out of un-sustainability: the role of environmental education. Clayton, S. (ed.),<br />
Oxford H<strong>and</strong>book on Environmental <strong>and</strong> Conservation Psychology. Oxford, UK, Oxford University Press, pp. 628–44.<br />
Walsham, M. 2010. Assessing the Evidence: Environment, Climate Change <strong>and</strong> Migration in Bangladesh. Dhaka, International<br />
Organization for Migration.<br />
Wheeler, D. 2011. Quantifying Vulnerability to Climate Change: Implications for Adaptation Assistance. Washington, DC,<br />
Center for Global Development. (Working Paper 240.)<br />
WISE Initiative. 2012. The WISE Awards: Solar-Powered Floating Schools. Doha, Wise Initiative. www.wise-qatar.org/solarpowered-floating-schools-bangladesh.<br />
(Accessed 6 July 2016.)<br />
World Bank. 2015. Lighting Africa: Ethiopia Launches Consumer Education Campaign Targeting over 12 million Ethiopians. Addis<br />
Ababa, World Bank.<br />
___. 2016. Lighting Africa Program Results. Washington, DC, World Bank www.lightingafrica.org/results. (Accessed 26<br />
February 2016.)<br />
Zaval, L. <strong>and</strong> Cornwell, J. F. M. 2015. Effective education <strong>and</strong> communication strategies to promote environmental engagement:<br />
the role of social-psychological mechanisms. (Background paper for the Global Education Monitoring Report 2016.)<br />
Chapter 2<br />
Abdullah, A., Doucouliagos, H. <strong>and</strong> Manning, E. 2015. Does education reduce income inequality? A meta-regression<br />
analysis. Journal of Economic Surveys, Vol. 29, No. 2, pp. 301–16.<br />
Acemoglu, D. <strong>and</strong> Autor, D. 2011. Skills, tasks <strong>and</strong> technologies: implications for employment <strong>and</strong> earnings. H<strong>and</strong>book of<br />
Labor Economics, Vol. 4, pp. 1043–171.<br />
Acemoglu, D., Naidu, S., Restrepo, P. <strong>and</strong> Robinson, J. 2014. Democracy Does Cause Growth. Cambridge, MA, National<br />
Bureau of Economic Research. (NBER Working Paper 20004.)<br />
Aghion, P., Hemous, D. <strong>and</strong> Veugelers, R. 2009a. No Green Growth without Innovation. Brussels, Bruegel. (Policy Brief<br />
2009/07.)<br />
542<br />
REFERENCES
Aghion, P., Veugelers, R. <strong>and</strong> Serre, C. 2009b. Cold Start for the Green Innovation Machine. Brussels, Bruegel.<br />
Ajwad, M. I., Simler, K., Azam, M., Dasgupta, B., Bonch-Osmolovskiy, M. <strong>and</strong> Topińska, I. 2015. Simulating Poverty in<br />
Europe: The Potential Contributions of Employment <strong>and</strong> Education to Reducing Poverty <strong>and</strong> Social Exclusion by 2020.<br />
Washington, DC, World Bank. (Policy Research Working Paper 6660.)<br />
Alston, J. M. <strong>and</strong> Pardey, P. G. 2014. Agriculture in the global economy. Journal of Economic Perspectives, Vol. 28, No. 1, pp.<br />
121–46.<br />
Altbach, P. G., Reisberg, L. <strong>and</strong> Rumbley, L. E. 2011. Trends in Global Higher Education: Tracking an Academic Revolution. Paris,<br />
UNESCO.<br />
Autor, D. H. 2015. Why are there still so many jobs? The history <strong>and</strong> future of workplace automation. Journal of<br />
Economic Perspectives, Vol. 29, No. 3, pp. 3–30.<br />
Autor, D. H. <strong>and</strong> Dorn, D. 2013. The growth of low-skill service jobs <strong>and</strong> the polarization of the U.S labor market.<br />
American Economic Review, Vol. 103, No. 5, pp. 1553–97.<br />
Autor, D. H., Dorn, D., Hanson, G. H. <strong>and</strong> Song, J. 2014. Trade adjustment: worker-level evidence. The Quarterly Journal of<br />
Economics, Vol. 129, No. 4, pp. 1799–860.<br />
Autor, D. H., Katz, L. F. <strong>and</strong> Kearney, M. S. 2006. The polarization of the U.S. labor market. American Economic Review, Vol.<br />
96, No. 2, pp. 189–94.<br />
Ayanwale, A. B., Adekunle, A. A., Akinola, A. A. <strong>and</strong> Adeyemo, V. A. 2013. Economic impacts of integrated agricultural<br />
research for development in the Sudan Savanna of Nigeria. African Development Review, Vol. 25, No. 1, pp. 30–41.<br />
Barro, R. J. 2013. Education <strong>and</strong> economic growth. Annals of Economics <strong>and</strong> Finance, Vol. 14, No. 2, pp. 301–28.<br />
Barro, R. J. <strong>and</strong> Lee, J. W. 2013. A new data set of educational attainment in the world, 1950–2010. Journal of Development<br />
Economics, Vol. 104, pp. 184–98.<br />
Bassett, R. M. <strong>and</strong> Salmi, J. 2014. International higher education: bridging academia <strong>and</strong> global policy development at<br />
the World Bank. A. Maldonado-Maldonado <strong>and</strong> R.M. Bassett (eds), The Forefront of International Higher Education: A<br />
Festschrift in Honor of Philip G. Altbach, Vol. 42. Dordrecht, The Netherl<strong>and</strong>s, Springer Netherl<strong>and</strong>s, pp. 255–64.<br />
Birdsall, N. <strong>and</strong> Londoño, J. L. 1997. Asset Inequality Does Matter: Lessons from Latin America. Washington, DC, Inter-<br />
American Development Bank. (IDB Working Paper 284.)<br />
Bjørnskov, C. 2012. How does social trust affect economic growth? Southern Economic Journal, Vol. 78, No. 4, pp. 1346–<br />
68.<br />
Bloom, D., Canning, D., Chan, K. <strong>and</strong> Luca, D. L. 2014. Higher education <strong>and</strong> economic growth in Africa. International<br />
Journal of African Higher Education, Vol. 1, No. 1, pp. 23–57.<br />
Botta, E., McCormick, C. <strong>and</strong> Eis, J. 2015. A Guide to Innovation System Analysis for Green Growth. Seoul, Global Green<br />
Growth Institute.<br />
Bowen, A. <strong>and</strong> Kuralbayeva, K. 2015. Looking for Green Jobs: The Impact of Green Growth on Employment. London/Seoul,<br />
Grantham Research Institute on Climate Change <strong>and</strong> the Environment/Global Green Growth Institute. (Policy<br />
Brief, March.)<br />
Ca, T. N. 2006. Universities as Drivers of the Urban Economies in Asia: The Case of Vietnam. Washington, DC, World Bank.<br />
(Policy Research Working Paper, 3949.)<br />
Chan, K. 2015. Robot revolution sweeps China’s factory floors. http://bigstory.ap.org/article/<br />
f57bec4da9df49a8b2b86e88ba21f52f/robot-revolution-sweeps-chinas-factory-floors.<br />
Chua, K. 2015. Education, skills, <strong>and</strong> decent work in low <strong>and</strong> middle income countries: trends <strong>and</strong> results from an adult skills<br />
survey. Paris, UNESCO. (Background paper for Global Education Monitoring Report 2016.)<br />
Cingano, F. 2014. Trends in Income Inequality <strong>and</strong> Its Impact on Economic Growth. Paris, Organisation for Economic Cooperation<br />
<strong>and</strong> Development. (OECD Social, Employment <strong>and</strong> Migration Working Paper 163.)<br />
Citi GPS. 2016. Technology at Work v2.0: The Future Is Not What It Used to Be. New York/Oxford, UK, Citi Global<br />
Perspectives <strong>and</strong> Solutions/Oxford Martin School, University of Oxford.<br />
Cunguara, B. <strong>and</strong> Moder, K. 2011. Is agricultural extension helping the poor? Evidence from rural Mozambique. Journal<br />
of African Economies, Vol. 20, No. 4, pp. 562–95.<br />
Dabla-Norris, E., Kochhar, K., Suphaphiphat, N., Ricka, F. <strong>and</strong> Tsounta, E. 2015. Causes <strong>and</strong> Consequences of Income<br />
Inequality: A Global Perspective. Washington, DC, International Monetary Fund. (IMF Discussion Note, SDN/15/13.)<br />
de Janvry, A. <strong>and</strong> Sadoulet, E. 2010. Agricultural Growth <strong>and</strong> Poverty Reduction: Additional Evidence. World Bank Research<br />
Observer, Vol. 25, No. 1, pp. 1–20.<br />
2016 • GLOBAL EDUCATION MONITORING REPORT 543
DFID. 2008. Building Jobs <strong>and</strong> Prosperity in Developing Countries. London, UK Department for International Development.<br />
Dobermann, A. <strong>and</strong> Nelson, R. 2013. Opportunities <strong>and</strong> Solutions for Sustainable Food Production. New York, Sustainable<br />
Development Solutions Network. (Background paper for the High-Level Panel of Eminent Persons on the Post-<br />
2015 Development Agenda.)<br />
Elias, A., Nohmi, M., Yasunobu, K. <strong>and</strong> Ishida, A. 2013. Effect of agricultural extension program on smallholders’ farm<br />
productivity: evidence from three peasant associations in the highl<strong>and</strong>s of Ethiopia. Journal of Agricultural Science,<br />
Vol. 5, No. 8, pp. 163–81.<br />
European Commission. 2011. Europe 2020 Flagship Initiative Innovation Union. Luxembourg, Directorate-General for<br />
Research <strong>and</strong> Innovation, European Commission.<br />
Eurostat. 2015. Almost 10 Million Part-Time Workers in the EU Would Have Preferred to Work More. Luxembourg, Eurostat,<br />
European Commission. (Eurostat News Release.)<br />
Evenson, R. E. <strong>and</strong> Gollin, D. 2003. Assessing the impact of the green revolution, 1960 to 2000. Science, Vol. 300, No.<br />
5620, pp. 758–62.<br />
FAO. 2011. Women In Agriculture: Closing The Gender Gap For Development. Rome, Food <strong>and</strong> Agriculture Organization of the<br />
United Nations.<br />
___. 2016. Farmer Field School Guidance Document: Planning For Quality Programmes. Rome, Food <strong>and</strong> Agriculture<br />
Organization of the United Nations.<br />
Felipe, J., Mehta, A. <strong>and</strong> Rhee, C. 2014. Manufacturing Matters...But it’s the Jobs that Count. Manila, Asian Development<br />
Bank. (ADB Economics Working Paper 420.)<br />
Fink, G. <strong>and</strong> Peet, E. 2014. Returns to Education in Low <strong>and</strong> Middle-Income Countries: Evidence from the Living St<strong>and</strong>ards <strong>and</strong><br />
Measurement Surveys. Cambridge, MA, Harvard School of Public Health. (PGDA Working Paper 120.)<br />
Frey, C. B. <strong>and</strong> Osborne, M. A. 2013. The Future of Employment: How Susceptible are Jobs to Computerisation? Oxford, UK,<br />
University of Oxford. (Oxford Martin School Working Paper 7.)<br />
Garrouste, C., Kozovska, K. <strong>and</strong> Perez, E. A. 2010. Education <strong>and</strong> Long-Term Unemployment. Conference paper for<br />
Geographical Localisation, Intersectoral Reallocation of Labour <strong>and</strong> Unemployment Differentials, Bologna, Italy,<br />
June 10.<br />
Gatti, R., Morg<strong>and</strong>i, M., Brodmann, S., Angel-Urdinola, D., Moreno, J. M., Marotta, D., Schiffbauer, M. <strong>and</strong> Mata Lorenzo,<br />
E. 2013. Jobs for Shared Prosperity: Time for Action in the Middle East <strong>and</strong> North Africa. Washington, DC, World Bank.<br />
Gaun<strong>and</strong>, A., Hocdé, A., Lemarié, S., Matt, M. <strong>and</strong> Turckheim, E. d. 2015. How does public agricultural research impact<br />
society? A characterization of various patterns. Research Policy, Vol. 44, No. 4, pp. 849–61.<br />
Geels, F. W., McMeekin, A., Mylan, J. <strong>and</strong> Southerton, D. 2015. A critical appraisal of sustainable consumption <strong>and</strong><br />
production research: the reformist, revolutionary <strong>and</strong> reconfiguration positions. Global Environmental Change, Vol.<br />
34, pp. 1–12.<br />
Global Footprint Network. 2016. Data <strong>and</strong> Results. Oakl<strong>and</strong>, CA, Global Footprint Network. www.footprintnetwork.org/<br />
en/index.php/GFN/page/footprint_data_<strong>and</strong>_results. (Accessed 23 February 2016.)<br />
MGI. 2011. Resource Revolution: Meeting the World’s Energy, Materials, Food, <strong>and</strong> Water Needs. New York, McKinsey Global<br />
Institute.<br />
Godfray, H. C. J., Beddington, J. R., Crute, I. R., Haddad, L., Lawrence, D., Muir, J. F., Pretty, J., Robinson, S., Thomas, S.<br />
M. <strong>and</strong> Toulmin, C. 2010. Food security: the challenge of feeding 9 billion <strong>people</strong>. Science, Vol. 327, No. 5967, pp.<br />
812–18.<br />
Goldin, C. <strong>and</strong> Katz, L. F. 2010. The Race between Education <strong>and</strong> Technology. Cambridge, MA, Harvard University Press.<br />
Goos, M., Manning, A. <strong>and</strong> Salomons, A. 2014. Explaining job polarization: routine-biased technological change <strong>and</strong><br />
offshoring. American Economic Review, Vol. 104, No. 8, pp. 2509–26.<br />
Gregorio, J. D. <strong>and</strong> Lee, J.-W. 2002. Education <strong>and</strong> income inequality: new evidence from cross-country data. Review of<br />
Income <strong>and</strong> Wealth, Vol. 48, No. 3, pp. 395–416.<br />
Gundlach, E., Navarro de Pablo, J. <strong>and</strong> Weisert, N. 2004. Education is good for the poor: a note on Dollar <strong>and</strong> Kraay. A.<br />
F. Shorrocks <strong>and</strong> R. van der Hoeven (eds), Growth, Inequality, <strong>and</strong> Poverty. Oxford, UK, Oxford University Press, pp.<br />
92–106.<br />
Hallegatte, S., Bangalore, M., Bonzanigo, L., Fay, M., Kane, T., Narloch, U., Rozenberg, J., Treguer, D. <strong>and</strong> Vogt-Schilb,<br />
A. 2016. Shock Waves: Managing the Impacts of Climate Change on Poverty. Washington, DC, World Bank. (Climate<br />
Change <strong>and</strong> Development Series.)<br />
544<br />
REFERENCES
Hanushek, E. A., Schwerdt, G., Wiederhold, S. <strong>and</strong> Woessmann, L. 2013. Returns to Skills Around the World: Evidence from<br />
PIAAC. Paris, Organisation for Co-operation <strong>and</strong> Development. (OECD Education Working Paper 101.)<br />
Hanushek, E. A. <strong>and</strong> Woessmann, L. 2012. Schooling, educational achievement, <strong>and</strong> the Latin American growth puzzle.<br />
Journal of Development Economics, Vol. 99, No. 2, pp. 497–512.<br />
Hanushek, E. A., Woessmann, L. <strong>and</strong> Zhang, L. 2011. General Education, Vocational Education, <strong>and</strong> Labor-Market Outcomes<br />
over the Life-Cycle. Bonn, Germany, Institute for the Study of Labor. (IZA Discussion Paper 6083.)<br />
Herrera-Idárraga, P., López-Bazo, E. <strong>and</strong> Motellón, E. 2015. Double penalty in returns to education: informality <strong>and</strong><br />
educational mismatch in the Colombian labour market. The Journal of Development Studies, Vol. 51, No. 12, pp.<br />
1683–701.<br />
Hershbein, B., Kearney, M. S. <strong>and</strong> Summers, L. H. 2015. Increasing Education: What It Will <strong>and</strong> Will Not Do for Earnings <strong>and</strong><br />
Earnings Inequality. Washington, DC, The Hamilton Project, The Brookings Institution.<br />
Hinojosa, C. <strong>and</strong> Pickles, A. 2015. The implications of greening industries on education systems <strong>and</strong> training policies in<br />
developing <strong>and</strong> advanced economies. Paris, UNESCO. (Background paper for Global Education Monitoring Report 2016.)<br />
IEA. 2010. Global Gaps in Clean Energy RD&D: Update <strong>and</strong> Recommendations for International Collaboration. Paris,<br />
International Energy Agency.<br />
IFAD. 2011a. Higher <strong>and</strong> Volatile Food Prices <strong>and</strong> Poor Rural People. Rome, International Fund for Agricultural<br />
Development.<br />
___. 2011b. Rural Poverty Report 2011. Rome, International Fund for Agricultural Development.<br />
IFPRI. 2012. Strategies <strong>and</strong> Priorities for African Agriculture: Economywide Perspectives from Country Studies. Washington,<br />
DC, International Food Policy Research Institute.<br />
ILO. 2007. The ILO at a Glance. Geneva, International Labour Organization.<br />
___. 2012. Working Towards Sustainable Development: Opportunities for Decent Work <strong>and</strong> Social Inclusion in a Green Economy.<br />
Geneva, International Labour Organization.<br />
___. 2013a. Sustainable Development, Decent Work <strong>and</strong> Green Jobs. Geneva, International Labour Organization.<br />
(International Labour Conference, 102nd Session.)<br />
___. 2013b. Women <strong>and</strong> Men in the Informal Economy: A Statistical Picture, 2nd edn. Geneva, International Labour<br />
Organization.<br />
___. 2014. Global Employment Trends 2014. Geneva, International Labour Organisation.<br />
___. 2015a. Global Employment Trends for Youth 2015. Geneva, International Labour Organization.<br />
___. 2015b. World Employment <strong>and</strong> Social Outlook: Trends 2015. Geneva, International Labour Organization.<br />
___. 2015c. World Employment <strong>and</strong> Social Outlook: Trends 2015 (Supporting Datasets) Geneva, International Labour<br />
Organization, www.ilo.org/legacy/english/weso/2015/WESO_jan2015.xlsx.<br />
___. 2016. Key Indicators of the Labour Market 9th edn. Geneva, International Labour Organisation, www.ilo.org/global/<br />
statistics-<strong>and</strong>-databases/WCMS_424979/lang--en/index.htm<br />
InfoDev. 2014. Building Competitive Green Industries: The Climate <strong>and</strong> Clean Technology Opportunity for Developing Countries.<br />
Washington, DC, World Bank.<br />
Jaimovich, N. <strong>and</strong> Siu, H. E. 2012. The Trend is the Cycle: Job Polarisation <strong>and</strong> Jobless Recoveries. Cambridge, MA, National<br />
Bureau of Economic Research. (NBER Working Paper 18334.)<br />
Jütting, J. <strong>and</strong> de Laiglesia, J. R. 2009. Employment, poverty reduction <strong>and</strong> development: what’s new? J. D. Jütting<br />
<strong>and</strong> J. R.de Laiglesia (eds), Is Informal Normal? Towards More <strong>and</strong> Better Jobs in Developing Countries. Paris, OECD<br />
Development Centre.<br />
Knack, S. <strong>and</strong> Zak, P. J. 2003. Building trust: public policy, interpersonal trust, <strong>and</strong> economic development. Supreme<br />
Court Economic Review, Vol. 10, pp. 91–107.<br />
Knight, J. B. <strong>and</strong> Sabot, R. H. 1983. Educational expansion <strong>and</strong> the Kuznets effect. American Economic Review, Vol. 73, No.<br />
5, pp. 1132–36.<br />
La Porta, R. <strong>and</strong> Shleifer, A. 2014. Informality <strong>and</strong> development. Journal of Economic Perspectives, Vol. 28, No. 3, pp. 109–26.<br />
Lakner, C. <strong>and</strong> Milanovic, B. 2015. Global income distribution: from the fall of the Berlin Wall to the great recession.<br />
World Bank Economic Review. (Advance access, published 12 August.)<br />
Lin, E. 2015. Foxconn targets 70% automation in 3 years. The China Post, 27 February.<br />
Lundberg, M. <strong>and</strong> Squire, L. 2003. The simultaneous evolution of growth <strong>and</strong> inequality. The Economic Journal, Vol. 113,<br />
No. 487, pp. 326–44.<br />
2016 • GLOBAL EDUCATION MONITORING REPORT 545
Maia, J., Giordano, T., Bardien, G., Bodibe, M., Plooy, P. d., Jafta, X., Jarvis, D., Kelder, N., Kruger-Cloete, E., Kuhn, G.,<br />
Lepelle, R., Makaulule, L., Mosoma, K., Neoh, S., Netshitomboni, N., Ngozo, T. <strong>and</strong> Swanepoel, J. 2011. Green Jobs: An<br />
Estimate on the Direct Employment Potential of a Greening South African Economy, S<strong>and</strong>ton/Midr<strong>and</strong>, South Africa/<br />
Pretoria, Industrial Development Corporation/Development Bank of Southern Africa/Trade <strong>and</strong> Industrial Policy<br />
Strategies.<br />
Mellor, J. W. 2014. High rural population density Africa: what are the growth requirements <strong>and</strong> who participates? Food<br />
Policy, Vol. 48, pp. 66–75.<br />
MGI. 2012. The World at Work: Jobs, Pay <strong>and</strong> Skills for 3.5 Billion People. New York, McKinsey Global Institute.<br />
Montenegro, C. E. <strong>and</strong> Patrinos, H. A. 2014. Comparable Estimates of Returns to Schooling around the World. Washington,<br />
DC, World Bank. (Policy Research Working Paper 7020.)<br />
Nkonya, E. M., Kato, E., Oduol, J., Pali, P. <strong>and</strong> Andrew, F. 2013. Initial impact of integrated agricultural research for<br />
development in East <strong>and</strong> Central Africa. African Journal of Agricultural <strong>and</strong> Resource Economics, Vol. 8, No. 3, pp.<br />
172–84.<br />
Ñopo, H., Daza, N. <strong>and</strong> Ramos, J. 2012. Gender earning gaps around the world: a study of 64 countries. International<br />
Journal of Manpower, Vol. 33, No. 5, pp. 464–513.<br />
OECD. 2011. Fostering Innovation for Green Growth. Paris, Organisation for Economic Co-operation <strong>and</strong> Development.<br />
___. 2012. Equity <strong>and</strong> Quality in Education: Supporting Disadvantaged Students <strong>and</strong> Schools. Paris, Organisation for<br />
Economic Co-operation <strong>and</strong> Development.<br />
___. 2013. OECD Skills Outlook 2013: First Results from the Survey of Adult Skills. Paris, Organisation for Economic Cooperation<br />
<strong>and</strong> Development.<br />
___. 2014a. Education at a Glance 2014: OECD Indicators. Organisation for Economic Co-operation <strong>and</strong> Development,<br />
Paris.<br />
___. 2014b. OECD Factbook 2014: Economic, Environmental <strong>and</strong> Social Statistics. Paris, Organisation for Economic Cooperation<br />
<strong>and</strong> Development.<br />
___. 2014c. OECD Science, Technology <strong>and</strong> Industry Outlook 2014. Paris, Organisation for Economic Co-operation <strong>and</strong><br />
Development.<br />
___. 2015a. Education at a Glance 2015: OECD Indicators. Paris, Organisation for Economic Co-operation <strong>and</strong><br />
Development.<br />
___. 2015b. Education at a Glance Interim Report: Update of Employment <strong>and</strong> Educational Attainment Indicators. Paris,<br />
Organisation for Economic Co-operation <strong>and</strong> Development.<br />
___. 2015c. OECD Employment Outlook 2015. Paris, Organisation for Economic Co-operation <strong>and</strong> Development.<br />
___. 2015d. Universal Basic Skills: What Countries St<strong>and</strong> to Gain. Paris, Organisation for Economic Co-operation <strong>and</strong><br />
Development.<br />
___. 2016a. Green Investment Banks: Scaling up Private Investment in Low-carbon, Climate-resilient Infrastructure, Green Finance<br />
<strong>and</strong> Investment. Paris, Organisation for Economic Co-operation <strong>and</strong> Development.<br />
___. 2016b. OECD Employment <strong>and</strong> Labour Market Statistics (database). Paris, Organisation for Economic Co-operation<br />
<strong>and</strong> Development. http://dx.doi.org/10.1787/data-00302-en.<br />
OECD <strong>and</strong> Eurostat. 1999. Environmental Goods <strong>and</strong> Services Industry Manual for the Collection <strong>and</strong> Analysis of Data. Paris/<br />
Luxembourg, Organisation for Economic Co-operation <strong>and</strong> Development/Eurostat.<br />
Oketch, M., McCowan, T. <strong>and</strong> Schendel, R. 2014. The Impact of Tertiary Education on Development. London, UK Department<br />
for International Development. (Education Rigorous Literature Review.)<br />
Pretty, J. <strong>and</strong> Bharucha, Z. P. 2014. Sustainable intensification in agricultural systems. Annals of Botany, Vol. 114, pp.<br />
1571–96.<br />
Pretty, J., Sutherl<strong>and</strong>, W. J., Ashby, J., Auburn, J., Baulcombe, D., Bell, M., Bentley, J., Bickersteth, S., Brown, K., Burke,<br />
J., Campbell, H., Chen, K., Crowley, E., Crute, I., Dobbelaere, D., Edwards-Jones, G., Funes-Monzote, F. Godfray,<br />
H. C. J., Griffon, M., Gypmantisiri, P., Haddad, L., Halavatau, S., Herren, H., Holderness, M., Izac, A.-M., Jones, M.,<br />
Koohafkan, P., Lal, R., Lang, T., McNeely, J., Mueller, A., Nisbett, N., Noble, A., Pingali, P., Pinto, Y., Rabbinge, R.,<br />
Ravindranath, N. H., Rola, A., Roling, N., Sage, C., Settle, W., Sha, J. M., Shiming, L., Simons, T., Smith, P., Strzepeck,<br />
K., Swaine, H., Terry, E., Tomich, T. P., Toulmin, C., Trigo, E., Twomlow, S., Vis, J. K., Wilson, J. <strong>and</strong> Pilgrim, S. 2010.<br />
The top 100 questions of importance to the future of global agriculture. International Journal of Agricultural<br />
Sustainability, Vol. 8, No. 4, pp. 219–36.<br />
546<br />
REFERENCES
Pritchett, L. 2006. Does learning to add up add up? The returns to schooling in aggregate data. E. A. Hanushek <strong>and</strong> F.<br />
Welch (eds), H<strong>and</strong>book of the Economics of Education, Vol. 5. Elsevier, Amsterdam, pp. 635–95.<br />
Psacharopoulos, G. <strong>and</strong> Patrinos, H. A. 2004. Returns to investment in education: a further update. Education Economics,<br />
Vol. 12, No. 2, pp. 111–34.<br />
Quintini, G. <strong>and</strong> Martin, S. 2013. Same But Different: School-to-work Transitions in Emerging <strong>and</strong> Advanced Economies. Paris,<br />
Organisation for Economic Co-operation <strong>and</strong> Development. (OECD Social, Employment <strong>and</strong> Migration Working<br />
Paper 154.)<br />
Ravallion, M. 2015. The Economics of Poverty: History, Measurement, <strong>and</strong> Policy. Oxford, UK, Oxford University Press.<br />
Reganold, J. P. <strong>and</strong> Wachter, J. M. 2016. Organic agriculture in the twenty-first century. Nature Plants, Vol. 2, No. 2, 15221.<br />
REN21. 2016. Renewables 2016: Global Status Report. Paris, Renewable Energy Policy Network for the 21st Century<br />
Rica, S. D. L. <strong>and</strong> Gortazar, L. 2016. Differences in Job De-Routinisation in OECD Countries: Evidence from PIAAC. Bonn,<br />
Germany, Institute for the Study of Labor (IZA Discussion Paper 9736.)<br />
Rickards, L. <strong>and</strong> Howden, S. M. 2012. Transformational adaptation: agriculture <strong>and</strong> climate change. Crop <strong>and</strong> Pasture<br />
Science, Vol. 63, No. 3, p. 240.<br />
Riddell, W. C. <strong>and</strong> Song, X. 2011. The Impact of Education on Unemployment Incidence <strong>and</strong> Re-employment Success: Evidence<br />
from the US Labour Market. Bonn, Germany, Institute for the Study of Labor (IZA Discussion paper 5572.)<br />
Rodrik, D. 2015. Premature De-industrialisation. Cambridge, MA, National Bureau of Economic Research. (NBER Working<br />
Paper 20935.)<br />
Sachs, J. D. 2015. The Age of Sustainable Development. New York, Columbia University Press.<br />
Sarabhai, K. <strong>and</strong> Vyas, P. 2015. The leapfrogging opportunity: role of education in sustainable development <strong>and</strong> climate change<br />
mitigation. Paris, UNESCO. (Background paper for Global Education Monitoring Report 2016.)<br />
Sayer, J. <strong>and</strong> Cassman, K. G. 2013. Agricultural innovation to protect the environment. Proceedings of the National<br />
Academy of Sciences of the United States of America, Vol. 110, No. 21, pp. 8345–8.<br />
Sidiropoulos, E. 2014. Education for sustainability in business education programs: a question of value. Journal of<br />
Cleaner Production, Vol. 85, pp. 472–87.<br />
Sparreboom, T. <strong>and</strong> Staneva, A. 2014. Is education the solution to decent work for youth in developing economies? Geneva,<br />
International Labour Organization. (Work4Youth Publication Series, 23.)<br />
Stern, N. 2015. Why Are We Waiting? The Logic, Urgency, <strong>and</strong> Promise of Tackling Climate Change Cambridge, MA, MIT Press.<br />
UCW. 2013. Educational attainment <strong>and</strong> employment outcomes. Paris, UNESCO. (Background paper for EFA Global<br />
Monitoring Report 2013/4.)<br />
UNDP. 2013. Humanity Divided: Confronting Inequality in Developing Countries. New York, United Nations Development<br />
Programme.<br />
UNEP. 2012. Global Outlook on Sustainable Consumption <strong>and</strong> Production Policies: Taking Action Together. Paris, United<br />
Nations Environment Programme.<br />
___. 2015. Sustainable Consumption <strong>and</strong> Production: A H<strong>and</strong>book for Policymakers (Global Edition). Paris, United Nations<br />
Environmental Programme.<br />
UNESCO. 2014. EFA Global Monitoring Report 2013/4: Teaching <strong>and</strong> Learning. Paris, UNESCO.<br />
UNIDO. 2011a. Policies for Supporting Green Industry. Vienna, United Nations Industrial Development Organization.<br />
___. 2011b. UNIDO Green Industry Initiative for Sustainable Industrial Development. Vienna, United Nations Industrial<br />
Development Organization.<br />
Valerio, A., Puerta, M. L. S., Tognatta, N. <strong>and</strong> Monroy-Taborda, S. 2015. Are There Skills Payoffs in Low <strong>and</strong> Middle Income<br />
Countries? Empirical Evidence Using STEP Data. Paper for 10th IZA/World Bank Conference on Employment <strong>and</strong><br />
Development. 4–6 June, Bonn, Germany.<br />
Vermeulen, S. J., Campbell, B. M. <strong>and</strong> Ingram, J. S. I. 2012. Climate Change <strong>and</strong> Food Systems. Annual Review of<br />
Environment <strong>and</strong> Resources, Vol. 37, No. 1, pp. 195–222.<br />
Vona, F., Marin, G., Consoli, D. <strong>and</strong> Popp, D. 2015. Green Skills. Cambridge, MA, National Bureau of Economic Research.<br />
(NBER Working Paper 21116.)<br />
Wada, Y., van Beek, L. P. H., van Kempen, C. M., Reckman, J. W. T. M., Vasak, S. <strong>and</strong> Bierkens, M. F. P. 2010. Global<br />
depletion of groundwater resources. Geophysical Research Letters, Vol. 37, No. 20, L20402.<br />
Waddington, H., Snilstveit, B., Garcia Hombrados, J., Vojtkova, M., Phillips, D., Davies, P. <strong>and</strong> White, H. 2014. Farmer field schools<br />
for improving farming practices <strong>and</strong> farmer outcomes: a systematic review. Campbell Systematic Reviews, Vol. 10, No. 6.<br />
2016 • GLOBAL EDUCATION MONITORING REPORT 547
World Bank. 2011. World Development Report 2012. Washington, DC, World Bank.<br />
___. 2012. Agricultural Innovation Systems: An Investment Sourcebook. Washington, DC, World Bank.<br />
___. 2015. World Bank Open Data. Washington, DC, World Bank. http://data.worldbank.org. (Accessed 9 September 2015.)<br />
___. 2016. Global Monitoring Report 2015/2016: Development Goals in an Era of Demographic Change. Washington, DC,<br />
World Bank.<br />
Chapter 3<br />
Agüero, J. M. <strong>and</strong> Bharadwaj, P. 2014. Do the more educated know more about health? Evidence from schooling <strong>and</strong><br />
HIV knowledge in Zimbabwe. Economic Development <strong>and</strong> Cultural Change, Vol. 62, No. 3, pp. 489–517.<br />
Aguirre, D., DeAnne, L. H., Rupp, C. <strong>and</strong> Sabbagh, K. 2012. Empowering the Third Billion: Women <strong>and</strong> the World of Work in<br />
2012. London, PricewaterhouseCoopers. (Briefing Report.)<br />
Aguirre, J. 2014. Impact of Rural Electrification on Education: a Case Study from Peru. Lima/Buenos Aires, Research Center,<br />
Universidad del Pacifico/Department of Economics, Universidad de San Andrés.<br />
Ahuja, A., Baird, S., Hicks, J. H., Kremer, M., Miguel, E. <strong>and</strong> Powers, S. 2015. When should governments subsidize health?<br />
The case of mass deworming. World Bank Economic Review, Vol. 29, No. Suppl 1, pp. S9–S24.<br />
Amin, M., Kuntchev, V. <strong>and</strong> Schmidt, M. 2015. Gender inequality <strong>and</strong> growth: the case of rich vs. poor countries. Washington,<br />
DC?, World Bank. (Policy Research Working Paper, No. 7172.)<br />
Babalobi, B. 2013. Water, sanitation <strong>and</strong> hygiene practices among primary-school children in Lagos: a case study of the<br />
Makoko slum community. Water International, Vol. 38, No. 7, pp. 921–29.<br />
Baldiga, K. 2013. Gender differences in willingness to guess. Management Science, Vol. 60, No. 2, pp. 434–48.<br />
Banerjee, S. G., Singh, A. <strong>and</strong> Samad, H. A. 2011. Power <strong>and</strong> People: the Benefits of Renewable Energy in Nepal. Washington,<br />
DC, World Bank.<br />
Barker, G. T. 2005. Dying to Be Men: Youth, Masculinity <strong>and</strong> Social Exclusion. London <strong>and</strong> New York, Routledge.<br />
Barnes, D., Domdom, A., Peskin, V. <strong>and</strong> Peskin, H. 2002. Rural Electrification <strong>and</strong> Development in the Philippines: Measuring<br />
the Social <strong>and</strong> Economic Benefits. Washington, DC, World Bank. (UNDP/ESMAP Report.)<br />
Barron, M. <strong>and</strong> Torero, M. 2014. Short Term Effects of Household Electrification: Experimental Evidence from Northern El<br />
Salvador. Munich, Germany, University Library of Munich. (Munich Personal RePEc Archive Working Paper.)<br />
Beall, J. 2010. Decentralisation, women’s rights <strong>and</strong> poverty: learning from India <strong>and</strong> South Africa. C. Sengupta <strong>and</strong> S. Corbridge<br />
(eds), Democracy, Development <strong>and</strong> Decentralisation in India: Continuing Debates. New Delhi <strong>and</strong> London, Routledge.<br />
Beaman, L., Duflo, E., P<strong>and</strong>e, R. <strong>and</strong> Topalova, P. 2012. Female leadership raises aspirations <strong>and</strong> educational attainment<br />
for girls: a policy experiment in India. Science, Vol. 335, No. 6068, pp. 582–86.<br />
Behrman, J. A. 2015. Does schooling affect women’s desired fertility? Evidence from Malawi, Ug<strong>and</strong>a, <strong>and</strong> Ethiopia.<br />
Demography, Vol. 52, No. 3, pp. 787–809.<br />
Berlan, D. <strong>and</strong> Shiffman, J. 2012. Holding health providers in developing countries accountable to consumers: a<br />
synthesis of relevant scholarship. Health Policy <strong>and</strong> Planning, Vol. 27, pp. 271–80.<br />
Bertr<strong>and</strong>, M. <strong>and</strong> Duflo, E. 2016. Field Experiments on Discrimination. Cambridge, MA, National Bureau of Economic<br />
Research. (NBER Working Paper 22014.)<br />
Bertr<strong>and</strong>, M. <strong>and</strong> Mullainathan, S. 2004. Are Emily <strong>and</strong> Greg more employable than Lakisha <strong>and</strong> Jamal? A field<br />
experiment on labor market discrimination. American Economic Review, Vol. 94, No. 4, pp. 991–1013.<br />
Bhalla, S. <strong>and</strong> Kaur, R. 2012. Labour Force Participation of Women in India: Some Facts, Some Queries. London, London School<br />
of Economics & Political Science. (Asia Research Centre Working Paper 40.)<br />
Bhalotra, S. <strong>and</strong> Clarke, D. 2013. Educational attainment <strong>and</strong> maternal mortality. (Background paper for EFA Global<br />
Monitoring Report 2013/4.)<br />
548<br />
REFERENCES
Bhurosy, T. <strong>and</strong> Jeewon, R. 2014. Overweight <strong>and</strong> obesity epidemic in developing countries: a problem with diet,<br />
physical activity, or socioeconomic status? The Scientific World Journal, Vol. 2014.<br />
Bjell<strong>and</strong>, H. F. 2014. En voldsom maktbalanse? En studie av relativ makt og forekomst av partnervold. Sosiologisk<br />
tidsskrift, Vol. 22, No. 01, pp. 51–74.<br />
Borooah, V. K., Sabharwal, N. S., Diwakar, D. G., Mishra, V. K. <strong>and</strong> Naik, A. K. 2015. Caste, Discrimination, <strong>and</strong> Exclusion in<br />
Modern India. New Delhi, SAGE Publications India.<br />
Borrell, C., Plasencia, A., Huisman, M., Costa, G., Kunst, A., Andersen, O., Bopp, M., Borgan, J., Deboosere, P. <strong>and</strong><br />
Glickman, M. 2005. Education level inequalities <strong>and</strong> transportation injury mortality in the middle aged <strong>and</strong><br />
elderly in European settings. Injury Prevention, Vol. 11, No. 3, pp. 138–42.<br />
Cabannes, Y. 2014. Contribution of Participatory Budgeting to Provision <strong>and</strong> Management of Basic Services: Municipal Practices<br />
<strong>and</strong> Evidence from the Field. London, International Institute for Environment <strong>and</strong> Development. (IIED Working<br />
Paper.)<br />
Capaldi, D. M., Knoble, N. B., Shortt, J. W. <strong>and</strong> Kim, H. K. 2012. A systematic review of risk factors for intimate partner<br />
violence. Partner Abuse, Vol. 3, No. 2, p. 231.<br />
Carr-Hill, R. 2013. Missing millions <strong>and</strong> measuring development progress. World Development, Vol. 46, pp. 30–44.<br />
Carrell, S. E., Page, M. E. <strong>and</strong> West, J. E. 2009. Sex <strong>and</strong> Science: How Professor Gender Perpetuates the Gender Gap.<br />
Cambridge, MA, National Bureau of Economic Research. (NBER Working Paper 14959.)<br />
Case, A. <strong>and</strong> Menendez, A. 2007. Does money empower the elderly? Evidence from the Agincourt demographic<br />
surveillance site, South Africa. Sc<strong>and</strong>inavian Journal of Public Health, Vol. 35, No. 69 suppl, pp. 157–64.<br />
Cavill, S., Chambers, R. <strong>and</strong> Vernon, N. 2015. Sustainability <strong>and</strong> CLTS: Taking Stock. Brighton, UK, Institute of Development<br />
Studies, University of Sussex. (Frontiers of CLTS: Innovations <strong>and</strong> Insights, 4.)<br />
Chambers, R. <strong>and</strong> von Medeazza, G. 2013. Sanitation <strong>and</strong> stunting in India: undernutrition’s blind spot. Economic <strong>and</strong><br />
Political Weekly, Vol. 48, No. 25, pp 15–18.<br />
Chisamya, G., DeJaeghere, J., Kendall, N. <strong>and</strong> Khan, M. A. 2012. Gender <strong>and</strong> education for all: progress <strong>and</strong> problems in<br />
achieving gender equity. International Journal of Educational Development, Vol. 32, No. 6, pp. 743–55.<br />
Chua, K. 2016. Education, skills, <strong>and</strong> decent work in low <strong>and</strong> middle income countries: trends <strong>and</strong> results from an adult skills<br />
survey. (Background paper for Global Education Monitoring Report 2016.)<br />
Connell, R. 2009. Gender: in World Perspective, 2nd edn. Cambridge, UK/Malden, MA, Polity Press.<br />
Crisp, N. <strong>and</strong> Chen, L. 2014. Global supply of health professionals. New Engl<strong>and</strong> Journal of Medicine, Vol. 370, No. 10, pp.<br />
950–57.<br />
Curley, J., Ssewamala, F. <strong>and</strong> Han, C.-K. 2010. Assets <strong>and</strong> educational outcomes: child development accounts (CDAs) for<br />
orphaned children in Ug<strong>and</strong>a. Children <strong>and</strong> Youth Services Review, Vol. 32, No. 11, pp. 1585–90.<br />
Currie, J. <strong>and</strong> Moretti, E. 2003. Mother’s education <strong>and</strong> the intergenerational transmission of human capital: evidence<br />
from college openings. The Quarterly Journal of Economics, Vol. 118, No. 4, pp. 1495–532.<br />
Cutler, D. <strong>and</strong> Lleras-Muney, A. 2014. Education <strong>and</strong> health: insights from international comparisons. A.J. Culyer (ed.),<br />
Encyclopedia of Health Economics, Vol. 1. San Diego, CA, Elsevier, pp. 232–45.<br />
Darkwah, A. K. 2010. Education: pathway to empowerment for Ghanaian women? IDS Bulletin, Vol. 41, No. 2, pp. 28–36.<br />
Das, J., Hammer, J. <strong>and</strong> Leonard, K. 2008. The quality of medical advice in low-income countries. Journal of Economic<br />
Perspectives, Vol. 22, No. 2, pp. 93–114.<br />
Dasso, R., Fern<strong>and</strong>ez, F. <strong>and</strong> Ñopo, H. 2015. Electrification <strong>and</strong> Educational Outcomes in Rural Peru. Bonn, Germany,<br />
Institute for the Study of Labor. (IZA Discussion Paper Series 8928.)<br />
De Walque, D. 2009. Does education affect HIV status? Evidence from five African countries. World Bank Economic<br />
Review, Vol. 23, No. 2, pp. 209–33.<br />
Deininger, K., Nagarajan, H. K. <strong>and</strong> Paul, S. 2012. Can political reservations empower women <strong>and</strong> affect economic outcomes?<br />
Evidence from rural India. (NCAER–IDRC Working Paper.)<br />
Dhar, D., Jain, T. <strong>and</strong> Jayach<strong>and</strong>ran, S. 2015. Intergenerational Transmission of Gender Attitudes: Evidence from India.<br />
Cambridge, MA, National Bureau of Economic Research. (NBER Working Paper 1429.)<br />
Dias, N., Julio, S. <strong>and</strong> Canning, P. 2014. Hope For Democracy: 25 years of Participatory Budgeting Worldwide. São Brás de<br />
Alportel, Portugal, IN LOCO Association.<br />
Domingo, P., Holmes, R., O’Neil, T., Jones, N., Bird, K., Larson, A., Presler-Marshall, E. <strong>and</strong> Valters, C. 2015. Women’s Voice<br />
<strong>and</strong> Leadership in Decision-Making: Assessing the Evidence. London, Overseas Development Institute.<br />
2016 • GLOBAL EDUCATION MONITORING REPORT 549
Duflo, E. 2003. Gr<strong>and</strong>mothers <strong>and</strong> gr<strong>and</strong>daughters: old‐age pensions <strong>and</strong> intrahousehold allocation in South Africa.<br />
World Bank Economic Review, Vol. 17, No. 1, pp. 1–25.<br />
___. 2012. Women empowerment <strong>and</strong> economic development. Journal of Economic Literature, Vol. 50, No. 4, p. 1051.<br />
Dupas, P. 2011a. Do teenagers respond to HIV risk information? Evidence from a field experiment in Kenya. American<br />
Economic Journal: Applied Economics, Vol. 3, pp. 1–34.<br />
___. 2011b. Health behavior in developing countries. Annual Review of Economics, Vol. 3, pp. 425–49.<br />
Duvendack, M., Palmer-Jones, R., Copestake, J. G., Hooper, L., Loke, Y. <strong>and</strong> Rao, N. 2011. What is the Evidence of the Impact<br />
of Microfinance on the Well-being of Poor People? London, EPPI-Centre, Social Science Research Unit, Institute of<br />
Education, University of London. (Report 1912.)<br />
Eapen, M. <strong>and</strong> Kodoth, P. 2003. Family structure, women’s education <strong>and</strong> work: re-examining the ‘high status’ of<br />
women in Kerala. S. Mukhopadyay <strong>and</strong> R. Surdarshan (eds), Tracking Gender Equity under the Economic Reforms. New<br />
Delhi, Kali for Women, pp. 227–67.<br />
Edström, J., Hassink, A., Shahrokh, T. <strong>and</strong> Stern, E. 2015. Engendering Men: A Collaborative Review of Evidence on Men <strong>and</strong><br />
Boys in Social Change <strong>and</strong> Gender Equality – Evidence Report. Washington, DC/Cape Town, South Africa/Brighton,<br />
UK, Promundo-US/Sonke Gender Justice/Institute of Development Studies, University of Sussex.<br />
Ekouevi, K. <strong>and</strong> Tuntivate, V. 2011. Household Energy Access for Cooking <strong>and</strong> Heating: Lessons Learned <strong>and</strong> the Way Forward.<br />
Washington, DC, World Bank. (Energy <strong>and</strong> Mining Sector Board Discussion Paper, No. 23.)<br />
Elborgh-Woytek, K., Newiak, M., Kochhar, K., Fabrizio, S., Kpodar, K., Wingender, P., Clements, B. J. <strong>and</strong> Schwartz, G. 2013.<br />
Women, Work, <strong>and</strong> the Economy: Macroeconomic Gains from Gender Equity. Washington, DC, International Monetary<br />
Fund. (IMF Staff Discussion Note, SDN/13/10.)<br />
Farré, L. <strong>and</strong> Vella, F. 2013. The intergenerational transmission of gender role attitudes <strong>and</strong> its implications for female<br />
labour force participation. Economica, Vol. 80, No. 318, pp. 219–47.<br />
Fernández, R. <strong>and</strong> Fogli, A. 2006. Fertility: the role of culture <strong>and</strong> family experience. Journal of the European Economic<br />
Association, Vol. 4, No. 2–3, pp. 552–61.<br />
Food Research <strong>and</strong> Action Center. 2015. National School Lunch Program. Washington, DC, Food Research <strong>and</strong> Action<br />
Center. http://frac.org/federal-foodnutrition-programs/national-school-lunch-program (Accessed 10 June 2016.)<br />
Fox, J. A. 2015. Social accountability: what does the evidence really say? World Development, Vol. 72, pp. 346–61.<br />
Freeman, M. C., Greene, L. E., Dreibelbis, R., Saboori, S., Muga, R., Brumback, B. <strong>and</strong> Rheingans, R. 2012. Assessing the<br />
impact of a school-based water treatment, hygiene <strong>and</strong> sanitation programme on pupil absence in Nyanza<br />
province, Kenya: a cluster-r<strong>and</strong>omized trial. Tropical Medicine <strong>and</strong> International Health, Vol. 17, No. 3, pp. 380–91.<br />
Ganuza, E. <strong>and</strong> Francés, F. 2012. The deliberative turn in participation: the problem of inclusion <strong>and</strong> deliberative<br />
opportunities in participatory budgeting. European Political Science Review, Vol. 4, No. 02, pp. 283–302.<br />
Garg, A. 2016. Woman can be ‘karta’ of a family: Delhi high court. Mumbai, India, The Times of India. http://timesofindia.<br />
indiatimes.com/india/Woman-can-be-kartaof-a-family-Delhi-high-court/articleshow/50799462.cms. (Accessed<br />
February 1 2016.)<br />
Garn, J. V., Greene, L. E., Dreibelbis, R., Saboori, S., Rheingans, R. D. <strong>and</strong> Freeman, M. C. 2013. A cluster-r<strong>and</strong>omized trial<br />
assessing the impact of school water, sanitation, <strong>and</strong> hygiene improvements on pupil enrollment <strong>and</strong> gender<br />
parity in enrollment. Journal of Water, Sanitation, <strong>and</strong> Hygiene for Development, Vol. 3, No. 4, pp. 1–15.<br />
Gillespie, D. <strong>and</strong> Melching, M. 2010. The transformative power of democracy <strong>and</strong> human rights in nonformal education:<br />
the case of Tostan. Adult Education Quarterly, Vol. 60, No. 5, pp. 477–98.<br />
Glick, P., H<strong>and</strong>y, C. <strong>and</strong> Sahn, D. 2015. Schooling, marriage, <strong>and</strong> age at first birth in Madagascar. Population Studies, Vol.<br />
69, No. 2, pp. 219–36.<br />
Goetz, A. M. 2003. Women’s education <strong>and</strong> political participation. (Background paper for EFA Global Monitoring Report<br />
2003/4.)<br />
Gonzales, C., Jain-Ch<strong>and</strong>ra, S., Kochhar, K., Newiak, M. <strong>and</strong> Zeinullayev, T. 2015. Catalyst for Change: Empowering Women<br />
<strong>and</strong> Tackling Income Inequality. Washington, DC, International Monetary Fund. (IMF Staff Discussion Note,<br />
SDN/15/20.)<br />
Grosjean, P. A. <strong>and</strong> Khattar, R. 2015. It’s Raining Men! Hallelujah? Kensington, Australia, University of New South Wales<br />
Business School. (UNSW Business School Research Paper 2014 ECON29C.)<br />
Güneş, P. M. 2015. The role of maternal education in child health: evidence from a compulsory schooling law. Economics<br />
of Education Review, Vol. 47, pp. 1–16.<br />
550<br />
REFERENCES
Gunewardena, D. 2015. Why aren’t Sri Lankan women translating their educational gains into workforce advantages? Washington,<br />
DC, Center for Universal Education, Brookings Institution. (2015 Echidna Global Scholars Working Paper.)<br />
Halff, A., Sovacool, B. K. <strong>and</strong> Rozhon, J. (eds). 2014. Energy Poverty: Global Challenges <strong>and</strong> Local Solutions. Oxford, UK,<br />
Oxford University Press.<br />
Haroon, S., Das, J. K., Salam, R. A., Imdad, A. <strong>and</strong> Bhutta, Z. A. 2013. Breastfeeding promotion interventions <strong>and</strong><br />
breastfeeding practices: a systematic review. BMC Public Health, Vol. 13, No. Suppl 3, p. S20.<br />
Hawkes, S. <strong>and</strong> Buse, K. 2013. Gender <strong>and</strong> global health: evidence, policy, <strong>and</strong> inconvenient truths. The Lancet, Vol. 381,<br />
No. 9879, pp. 1783–87.<br />
Hinrichs, P. 2010. The effects of the National School Lunch Program on education <strong>and</strong> health. Journal of Policy Analysis<br />
<strong>and</strong> Management, Vol. 29, No. 3, pp. 479–505.<br />
ILO. 2012. Global Employment Trends for Women 2012. Geneva, Switzerl<strong>and</strong>, International Labour Organization.<br />
___. 2016a. Employment by sex <strong>and</strong> occupation: selected ISCO level 2 (Thous<strong>and</strong>s). (Database.) Geneva, Switzerl<strong>and</strong>,<br />
International Labour Organization.<br />
___. 2016b. Labour force participation rate by sex <strong>and</strong> age (ILO estimates <strong>and</strong> projections). (Database.) Geneva, Switzerl<strong>and</strong>,<br />
International Labour Organization.<br />
___. 2016c. Women at Work: Trends. Geneva, Switzerl<strong>and</strong>, International Labour Organization.<br />
ILO <strong>and</strong> WIEGO. 2014. Women <strong>and</strong> Men in the Informal Economy: A Statistical Picture. Geneva, Switzerl<strong>and</strong>/Cambridge, MA,<br />
International Labour Organization/Women in Informal Employment: Globalizing <strong>and</strong> Organizing.<br />
Imbusch, P., Misse, M. <strong>and</strong> Carrión, F. 2011. Violence research in Latin America <strong>and</strong> the Caribbean: a literature review.<br />
International Journal of Conflict <strong>and</strong> Violence, Vol. 5, No. 1, p. 88.<br />
Imdad, A., Yakoob, M. Y. <strong>and</strong> Bhutta, Z. A. 2011. Impact of maternal education about complementary feeding <strong>and</strong><br />
provision of complementary foods on child growth in developing countries. BMC Public Health, Vol. 11, No. Suppl 3.<br />
Instituto Promundo. 2012. Engaging Men to Prevent Gender-Based Violence: A Multi-Country Intervention <strong>and</strong> Impact<br />
Evaluation Study. Washington, DC, Instituto Promundo/International Center for Research on Women/<br />
Culturasalud/Centre for Health <strong>and</strong> Social Justice/Rw<strong>and</strong>an Men’s Resource Centre.<br />
International Energy Agency <strong>and</strong> World Bank. 2015. Sustainable Energy for All 2015: Progress Towards Sustainable Energy.<br />
Washington, DC, World Bank.<br />
Jensen, R. <strong>and</strong> Oster, E. 2009. The power of TV: cable television <strong>and</strong> women’s status in India. The Quarterly Journal of<br />
Economics, Vol. 124, No. 3, pp. 1057–94.<br />
Jewkes, R., Gibbs, A., Jama-Shai, N., Willan, S., Misselhorn, A., Mushinga, M., Washington, L., Mbatha, N. <strong>and</strong> Skiweyiya,<br />
Y. 2014. Stepping Stones <strong>and</strong> Creating Futures intervention: shortened interrupted time series evaluation of a<br />
behavioural <strong>and</strong> structural health promotion <strong>and</strong> violence prevention intervention for young <strong>people</strong> in informal<br />
settlements in Durban, South Africa. BMC Public Health, Vol. 14, No. 1, pp. 1–10.<br />
Jha, P., Kesler, M. A., Kumar, R., Ram, F., Ram, U., Aleks<strong>and</strong>rowicz, L., Bassani, D. G., Ch<strong>and</strong>ra, S. <strong>and</strong> Banthia, J. K. 2011.<br />
Trends in selective abortions of girls in India: analysis of nationally representative birth histories from 1990 to<br />
2005 <strong>and</strong> census data from 1991 to 2011. The Lancet, Vol. 377, No. 9781, pp. 1921–28.<br />
Johnston, D. W., Schurer, S. <strong>and</strong> Shields, M. A. 2014. Maternal gender role attitudes, human capital investment, <strong>and</strong><br />
labour supply of sons <strong>and</strong> daughters. Oxford Economic Papers, Vol. 66, No. 3, pp. 631–59.<br />
Joshi, A. <strong>and</strong> Amadi, C. 2013. Impact of water, sanitation, <strong>and</strong> hygiene interventions on improving health outcomes<br />
among school children. Journal of Environmental <strong>and</strong> Public Health, Vol. 2013.<br />
Kassa, S. 2015. Challenges <strong>and</strong> opportunities of women political participation in Ethiopia. Journal of Global Economics,<br />
Vol. 3, No. 4, pp. 1–7.<br />
Kato-Wallace, J., Barker, G., Sharafi, L., Mora, L. <strong>and</strong> Lauro, G. 2016. Adolescent Boys <strong>and</strong> Young Men: Engaging Them<br />
as Supporters of Gender Equality <strong>and</strong> Health <strong>and</strong> Underst<strong>and</strong>ing Their Vulnerabilities. Washington, DC/New York,<br />
Promundo-US/UN Population Fund.<br />
Kazianga, H., de Walque, D. <strong>and</strong> Alderman, H. 2012. Educational <strong>and</strong> child labour impacts of two food-for-education<br />
schemes: evidence from a r<strong>and</strong>omised trial in rural Burkina Faso. Journal of African Economies, Vol. 21, No. 5, pp.<br />
723–60.<br />
Khalifeh, H., Hargreaves, J., Howard, L. M. <strong>and</strong> Birdthistle, I. 2013. Intimate partner violence <strong>and</strong> socioeconomic<br />
deprivation in Engl<strong>and</strong>: findings from a national cross-sectional survey. American Journal of Public Health, Vol. 103,<br />
No. 3, pp. 462–72.<br />
2016 • GLOBAL EDUCATION MONITORING REPORT 551
Kinoshita, Y. <strong>and</strong> Guo, F. 2015. What can boost female labor force participation in Asia? Washington, DC, International<br />
Monetary Fund. (IMF Working Paper.)<br />
Klasen, S. <strong>and</strong> Lamanna, F. 2009. The impact of gender inequality in education <strong>and</strong> employment on economic growth:<br />
new evidence for a panel of countries. Feminist Economics, Vol. 15, No. 3, pp. 91–132.<br />
Köhlin, G., Sills, E. O., Pattanayak, S. K. <strong>and</strong> Wilfong, C. 2011. Energy, Gender <strong>and</strong> Development: What are the Linkages? Where<br />
is the Evidence? Washington, DC, World Bank. (Social Development Working Papers 125.)<br />
Krätli, S <strong>and</strong> Dyer, C. (eds). 2006. Education <strong>and</strong> Development for Nomads: The Issues <strong>and</strong> the Evidence, Vol. 2006. New York/<br />
Oxford, UK, Berghahn Books. (The Education of Nomadic Peoples: Current Issues, Future Prospects.)<br />
Krieger, N. 2014. Discrimination <strong>and</strong> health inequities. International Journal of Health Services, Vol. 44, No. 4, pp. 643–710.<br />
Lawson, T. M. 2012. Impact of School Feeding Programs on Educational, Nutritional, <strong>and</strong> Agricultural Development Goals: A<br />
Systematic Review of Literature. East Lansing, MI, Agricultural, Food, <strong>and</strong> Resource Economics, Michigan State<br />
University. (Graduate Research Masters Degree Plan B Papers 142466.)<br />
Leclercq, F. 2015. Benefits of Early Childhood Education <strong>and</strong> Care for the Individual <strong>and</strong> Society: Evidence Review. Oxford, UK,<br />
Oxford Policy Management. (3ie Evidence Review Series on Early Childhood Development; unpublished.)<br />
Lee, K., Brewer, E., Christiano, C., Meyo, F., Miguel, E., Podolsky, M., Rosa, J. <strong>and</strong> Wolfram, C. 2014. Barriers to Electrification<br />
for “Under Grid” Households in Rural Kenya. Cambridge, MA, National Bureau of Economic Research. (NBER Working<br />
Paper 20327.)<br />
Lee, L. Y.-T. 2013. Household energy mix in Ug<strong>and</strong>a. Energy Economics, Vol. 39, pp. 252–61.<br />
LeVine, R. A. <strong>and</strong> Rowe, M. L. 2009. Maternal Literacy <strong>and</strong> Child Health in Less-Developed Countries: Evidence,<br />
Processes, <strong>and</strong> Limitations. Journal of Developmental <strong>and</strong> Behavioral Pediatrics, Vol. 30, No. 4, pp. 340–49.<br />
Levtov, R., van der Gaag, N., Greene, M., Kaufman, M. <strong>and</strong> Barker, G. 2015. State of the World’s Fathers. Washington, DC,<br />
Promundo/Rutgers/Save the Children/Sonke Gender Justice/the MenEngage Alliance.<br />
Levtov, R. G., Barker, G., Contreras-Urbina, M., Heilman, B. <strong>and</strong> Verma, R. 2014. Pathways to gender-equitable men:<br />
findings from the International Men <strong>and</strong> Gender Equality survey in eight countries. Men <strong>and</strong> Masculinities, 12<br />
December, pp. 1–35.<br />
Lewis, J. J. <strong>and</strong> Pattanayak, S. K. 2012. Who adopts improved fuels <strong>and</strong> cookstoves? A systematic review. Environmental<br />
Health Perspectives, Vol. 120, No. 5, pp. 637–45.<br />
Lipscomb, M., Mobarak, M. A. <strong>and</strong> Barham, T. 2013. Development effects of electrification: evidence from the<br />
topographic placement of hydropower plants in Brazil. American Economic Journal: Applied Economics, Vol. 5, No. 2,<br />
pp. 200–31.<br />
Lleras-Muney, A. <strong>and</strong> Lichtenberg, F. 2005. The effect of education on medical technology adoption: are the more<br />
educated more likely to use new drugs? Annales d’Economie et Statistique, Vol. 79/80.<br />
Lopez, L. M., Hiller, J. E. <strong>and</strong> Grimes, D. A. 2010. Education for Contraceptive Use by Women after Childbirth Cochrane<br />
Database of Systematic Reviews, Issue 1, CD001863.<br />
Macdonald, K. A. D. 2012. Indigenous <strong>people</strong>s <strong>and</strong> development goals: a global snapshot. G. H. Hall <strong>and</strong> H. A. Patrinos<br />
(eds), Indigenous Peoples, Poverty, <strong>and</strong> Development. Cambridge, UK, Cambridge University Press, pp. 17–72.<br />
Mackenbach, J. P., Kulhánová, I., Bopp, M., Deboosere, P., Eikemo, T. A., Hoffmann, R., Kulik, M. C., Leinsalu, M.,<br />
Martikainen, P. <strong>and</strong> Menvielle, G. 2015. Variations in the relation between education <strong>and</strong> cause-specific mortality<br />
in 19 European populations: a test of the “fundamental causes” theory of social inequalities in health. Social<br />
Science & Medicine, Vol. 127, pp. 51–62.<br />
Magni, G. 2016. Indigenous knowledge <strong>and</strong> implications for the Sustainable Development Agenda. (Background paper for<br />
Global Education Monitoring Report 2016.)<br />
Malla, S. <strong>and</strong> Timilsina, G. R. 2014. Household Cooking Fuel Choice <strong>and</strong> Adoption of Improved Cookstoves in Developing<br />
Countries: A Review. Washington, DC, World Bank. (Policy Research Working Paper 6903.)<br />
Marika, R., Yunupingu, Y., Marika-Mununggiritj, R. <strong>and</strong> Muller, S. 2009. Leaching the poison: the importance of process<br />
<strong>and</strong> partnership in working with Yolngu. Journal of Rural Studies, Vol. 25, No. 4, pp. 404–13.<br />
Marphatia, A. A. <strong>and</strong> Moussié, R. 2013. A question of gender justice: exploring the linkages between women’s unpaid care<br />
work, education, <strong>and</strong> gender equality. International Journal of Educational Development, Vol. 33, No. 6, pp. 585–94.<br />
Mato, D. 2015. Pueblos indígenas, estados y educación superior. Aprendizajes de experiencias en varios países de<br />
América Latina potencialmente útiles a los procesos en marcha en Argentina. Cuadernos de Antropología Social,<br />
Vol. 41, pp. 5–23.<br />
552<br />
REFERENCES
McBride, D. E. <strong>and</strong> Parry, J. A. 2014. Women’s Rights in the USA: Policy Debates <strong>and</strong> Gender Roles. New York <strong>and</strong> London,<br />
Routledge.<br />
Mekonnen, A. <strong>and</strong> Köhlin, G. 2009. Determinants of Household Fuel Choice in Major Cities in Ethiopia. Gothenburg, Sweden,<br />
Department of Economics, School of Business, Economics <strong>and</strong> Law, University of Gothenburg. (Working Papers<br />
in Economics 399.)<br />
Mikkelsen, M. V., Husby, S., Skov, L. <strong>and</strong> Perez-Cueto, F. J. 2014. A systematic review of types of healthy eating<br />
interventions in preschools. Nutrition Journal, Vol. 13, No. 56, pp. 1–19.<br />
Mincer, J. 1962. Labor force participation of married women: a study of labor supply. Universities-National Bureau<br />
Committee for Economic Research (ed.), Aspects of Labor Economics. Princeton, NJ, Princeton University Press, pp.<br />
63–105.<br />
Mir<strong>and</strong>a, A. 2015. The Journey of a Girl: Opportunities for Business Investment in Girls’ Education. London, Global Business<br />
Coalition for Education. (Working Paper.)<br />
Mitra, S., Posarac, A. <strong>and</strong> Vick, B. 2013. Disability <strong>and</strong> poverty in developing countries: a multidimensional study. World<br />
Development, Vol. 41, pp. 1–18.<br />
Morrison, J., Basnet, M., Budhathoki, B., Adhikari, D., Tumbahangphe, K., Man<strong>and</strong>har, D., Costello, A. <strong>and</strong> Groce, N. 2014.<br />
Disabled ׳women s maternal <strong>and</strong> newborn health care in rural Nepal: a qualitative study. Midwifery, Vol. 30, No. 11,<br />
pp. 1132–39.<br />
Murphy, S., Belmonte, W. <strong>and</strong> Nelson, J. 2009. Investing in Girls’ Education: an Opportunity for Corporate Leadership.<br />
Cambridge, MA, Corporate Responsibility Initiative, Harvard Kennedy School.<br />
Nauges, C. <strong>and</strong> Str<strong>and</strong>, J. 2013. Water Hauling <strong>and</strong> Girls’ School Attendance: Some New Evidence from Ghana. Washington,<br />
DC, World Bank. (Policy Research Working Paper 6443.)<br />
Nkohkwo, Q. N.-a. <strong>and</strong> Islam, M. S. 2013. Challenges to the successful implementation of e-government initiatives in<br />
sub-Saharan Africa: a literature review. Electronic Journal of e-Government, Vol. 11, No. 2, pp. 253–67.<br />
OECD. 2014a. Skills Outlook 2013. Paris, Organisation for Economic Co-operation <strong>and</strong> Development.<br />
___. 2014b. Social Institutions <strong>and</strong> Gender Index (SIGI). Paris, Organisation for Economic Co-operation <strong>and</strong> Development.<br />
https://stats.oecd.org/Index.aspx?DataSetCode=SIGI2014. (Accessed 15 May 2016.)<br />
___. 2015. The ABC of Gender Equality in Education: Aptitude, Behaviour, Confidence. Paris, Organisation for Economic Cooperation<br />
<strong>and</strong> Development.<br />
___. 2016a. Low-Performing Students: Why They Fall Behind And How To Help Them Succeed. Paris, Organisation for<br />
Economic Co-operation <strong>and</strong> Development.<br />
___. 2016b. OECD.Stat. (Database.) Paris, Organisation for Economic Co-operation <strong>and</strong> Development. http://stats.oecd.<br />
org. (Accessed 5 May 2016.)<br />
Olukanni, D. O. 2013. Assessment of WASH program in public secondary schools in south-western Nigeria. ARPN Journal<br />
of Engineering <strong>and</strong> Applied Sciences, Vol. 8, No. 3.<br />
Osili, U. O. <strong>and</strong> Long, B. T. 2008. Does female schooling reduce fertility? Evidence from Nigeria. Journal of Development<br />
Economics, Vol. 87, No. 1, pp. 57–75.<br />
Parkes, J. <strong>and</strong> Unterhalter, E. 2015. Hope <strong>and</strong> history: education engagements with poverty, inequality <strong>and</strong> gender<br />
violence. J. Parkes (ed.), Gender Violence in Poverty Contexts: The Educational Challenge. Oxford, UK, Routledge.<br />
Patel, T. (ed.). 2007. Sex-selective Abortion in India: Gender, Society <strong>and</strong> New Reproductive Technologies. New Delhi, SAGE<br />
Publications.<br />
Peisakhin, L. <strong>and</strong> Pinto, P. 2010. Is transparency an effective anti‐corruption strategy? Evidence from a field<br />
experiment in India. Regulation & Governance, Vol. 4, No. 3, pp. 261–80.<br />
Popkin, B. M., Adair, L. S. <strong>and</strong> Ng, S. W. 2012. Global nutrition transition <strong>and</strong> the p<strong>and</strong>emic of obesity in developing<br />
countries. Nutrition Reviews, Vol. 70, No. 1, pp. 3-21.<br />
Pueyo, A., Gonzalez, F., Dent, C. <strong>and</strong> DeMartino, S. 2013. The Evidence of Benefits for Poor People of Increased Renewable<br />
Electricity Capacity: Literature Review. Brighton, UK, Institute of Development Studies, University of Sussex. (IDS<br />
Evidence Report 31.)<br />
Rabbi, A. M. F., Karmaker, S. C., Mallick, S. A. <strong>and</strong> Sharmin, S. 2013. Determinants of birth spacing <strong>and</strong> effect of birth<br />
spacing on fertility in Bangladesh. Dhaka University Journal of Science, Vol. 61, No. 1, pp. 105–10.<br />
Robeyns, I. 2007. When will society be gender just? J. Browne (ed.), The Future of Gender. Cambridge, UK, Cambridge<br />
University Press, pp. 54–74.<br />
2016 • GLOBAL EDUCATION MONITORING REPORT 553
Sackey, H. A. 2005. Female Labour Force Participation in Ghana: The Effects of Education. Nairobi, Africa Economic Research<br />
Consortium. (AERC Research Paper.)<br />
Sæbønes, A.-M., Bieler, R. B., Baboo, N., Banham, L., Singal, N., Howgego, C., McClain-Nhlapo, C. V., Riis-Hansen, T.<br />
C. <strong>and</strong> Dansie, G. A. 2015. Towards a Disability Inclusive Education. Paper for Oslo Summit on Education for<br />
Development, 7 July.<br />
Salleh, H. 2012. Welfare regimes, social services <strong>and</strong> poverty reduction. K. B. Teik (ed.), Policy Regimes <strong>and</strong> the Political<br />
Economy of Poverty Reduction in Malaysia. Basingstoke, UK/Geneva, Switzerl<strong>and</strong>, Palgrave Macmillan/United<br />
Nations Research Institute for Social Development, pp. 145–82.<br />
Samad, H. A., Kh<strong>and</strong>ker, S. R., Asaduzzaman, M. <strong>and</strong> Yunusd, M. 2013. The Benefits of Solar Home Systems: An Analysis from<br />
Bangladesh. Washington, DC, World Bank. (Policy Research Working Paper 6724.)<br />
Sekhri, S. 2013. Female Literacy <strong>and</strong> Access to Drinking Water in Rural India. Charlottesville, VA, Department of Economics,<br />
University of Virginia. (Unpublished.)<br />
Sen, A. 1999. Development as Freedom. Oxford, UK, Oxford University Press.<br />
___. 2011. The Idea of Justice. Cambridge, MA, Harvard University Press.<br />
Shen, G., Lin, W., Yue, D., Zuoli, L., Chen, Y. <strong>and</strong> Yang, C. 2014. Factors influencing the adoption <strong>and</strong> sustainable use of clean fuels<br />
<strong>and</strong> cookstoves in China: a Chinese literature review. Renewable <strong>and</strong> Sustainable Energy Reviews, Vol. 51, pp. 741–50.<br />
Shimamura, Y. <strong>and</strong> Lastarria-Cornhiel, S. 2010. Credit program participation <strong>and</strong> child schooling in rural Malawi. World<br />
Development, Vol. 38, No. 4, pp. 567–80.<br />
Siddique, Z. 2011. Evidence on caste based discrimination. Labour Economics, Vol. 18, pp. S146–59.<br />
Silveira, J. A. C., Taddei, J. A. A. C., Guerra, P. H. <strong>and</strong> Nobre, M. R. C. 2011. Effectiveness of school-based nutrition<br />
education interventions to prevent <strong>and</strong> reduce excessive weight gain in children <strong>and</strong> adolescents: a systematic<br />
review. Jornal de Pediatria, Vol. 87, No. 5, pp. 382–92.<br />
Squires, T. 2015. The impact of access to electricity on education <strong>and</strong> other essays in spatial economics. Ph.D.<br />
dissertation, Brown University, Providence, RI.<br />
Stavenhagen, R. 2015. Indigenous <strong>people</strong>s’ rights to education. European Journal of Education, Vol. 50, No. 3, pp. 254–57.<br />
Stout, J. G., Dasgupta, N., Hunsinger, M. <strong>and</strong> McManus, M. A. 2011. STEMing the tide: using ingroup experts to inoculate<br />
women’s self-concept in science, technology, engineering, <strong>and</strong> mathematics (STEM). Journal of Personality <strong>and</strong><br />
Social Psychology, Vol. 100, No. 2, pp. 255–70.<br />
Sudhinaraset, M., Ingram, M., Lofthouse, H. K. <strong>and</strong> Montague, D. 2013. What is the role of informal healthcare providers<br />
in developing countries? a systematic review. PLoS ONE, Vol. 8, No. 2.<br />
Sumpter, C. <strong>and</strong> Torondel, B. 2013. A systematic review of the health <strong>and</strong> social effects of menstrual hygiene<br />
management. PLoS ONE, Vol. 8, No. 4.<br />
Tanaka, N. <strong>and</strong> Miyoshi, M. 2012. School lunch program for health promotion among children in Japan. Asia Pacific<br />
Journal of Clinical Nutrition, Vol. 21, No. 1, p. 155.<br />
The DHS Program. 2016. STATCompiler. Rockville, MD, The DHS Program, ICF International. http://beta.statcompiler.<br />
com. (Accessed 15 May 2016.)<br />
Thorat, S. <strong>and</strong> Neuman, K. S. 2012. Blocked by Caste: Economic Discrimination in Modern India. Oxford, UK, Oxford<br />
University Press.<br />
Tikkanen, I. <strong>and</strong> Urho, U.-M. 2009. Free school meals, the plate model <strong>and</strong> food choices in Finl<strong>and</strong>. British Food Journal,<br />
Vol. 111, No. 2, pp. 102–19.<br />
Torero, M. 2014. The impact of rural electrification. Paper for 11th Conference AFD PROPARCO/EUDN: Energy for<br />
Development, Paris, 3 December.<br />
UN Women. 2015. Progress of the World’s Women 2015–2016: Transforming Economies, Realizing Rights. New York, UN Women.<br />
UNESCO. 2009. Learning & Knowing in Indigenous Societies Today. Paris, UNESCO.<br />
___. 2010. EFA Global Monitoring Report 2010: Reaching the Marginalized. Paris, UNESCO.<br />
___. 2014. EFA Global Monitoring Report 2013/4: Teaching <strong>and</strong> Learning – Achieving Quality for All. Paris, UNESCO.<br />
___. 2015. EFA Global Monitoring Report 2015: Education for All 2000–2015 – Achievements <strong>and</strong> Challenges. Paris, UNESCO.<br />
UNICEF. 2006. UNICEF Water, Sanitation <strong>and</strong> Hygiene Strategies for 2006-2015. New York, UNICEF.<br />
___. 2015. UNICEF Data: Monitoring the Situation of Children <strong>and</strong> Women. New York, NY, UNICEF. http://data.unicef.org.<br />
(Accessed 15 December 2015.)<br />
___. 2016. Female Genital Mutilation/Cutting: A Global Concern. New York, UNICEF.<br />
554<br />
REFERENCES
United Cities <strong>and</strong> Local Governments. 2014. Basic Services for All in an Urbanizing World: Third Global Report of United Cities<br />
<strong>and</strong> Local Governments on Local Democracy <strong>and</strong> Decentralization – GOLD III. London <strong>and</strong> New York, Routledge.<br />
United Nations. 2014. United Nations E-Government Survey 2014: E-Government for the Future We Want. New York, United<br />
Nations, Department of Economic <strong>and</strong> Social Affairs.<br />
___. 2015a. Transforming our world: the 2030 Agenda for Sustainable Development. New York, United Nations. (UN General<br />
Assembly Resolution 70/1.)<br />
___. 2015b. The World’s Women 2015: Trends <strong>and</strong> Statistics. New York, United Nations, Department of Economic <strong>and</strong> Social<br />
Affairs, Statistics Division.<br />
UNRISD. 2015. Research for Social Change: Transformations to Equity <strong>and</strong> Sustainability – UNRISD Strategy 2016-2020.<br />
Geneva, Switzerl<strong>and</strong>, United Nations Research Institute for Social Development.<br />
Villegas, C. C. <strong>and</strong> Samman, E. 2015. Exclusion in Household Surveys: Causes, Impacts <strong>and</strong> Ways Forward. London, Overseas<br />
Development Institute.<br />
Vindigni, S. M., Riley, P. L. <strong>and</strong> Jhung, M. 2011. Systematic review: h<strong>and</strong>washing behaviour in low- to middle-income<br />
countries – outcome measures <strong>and</strong> behaviour maintenance. Tropical Medicine & International Health, Vol. 16, No. 4,<br />
pp. 466–77.<br />
Vogl, T. S. 2012. Education <strong>and</strong> Health in Developing Economies. Princeton, NJ, Princeton University.<br />
WHO. 2013. Global <strong>and</strong> Regional Estimates of Violence against Women: Prevalence <strong>and</strong> Health Effects of Intimate Partner<br />
Violence <strong>and</strong> Non-partner Sexual Violence. Geneva, Switzerl<strong>and</strong>, World Health Organization.<br />
___. 2014. Household Air Pollution <strong>and</strong> Health. Geneva, Switzerl<strong>and</strong>, World Health Organization. (Fact sheet 292.)<br />
___. 2016. World Health Statistics 2016: Monitoring Health For the SDGs. Geneva, Switzerl<strong>and</strong>, World Health Organization.<br />
WHO <strong>and</strong> London School of Hygiene <strong>and</strong> Tropical Medicine. 2010. Preventing Intimate Partner <strong>and</strong> Sexual Violence against<br />
Women: Taking Action <strong>and</strong> Generating Evidence. Geneva, Switzerl<strong>and</strong>, World Health Organization.<br />
WHO <strong>and</strong> UN Water. 2014. Investing in Water <strong>and</strong> Sanitation: Increasing Access, Reducing Inequalities – Special<br />
Report for the Sanitation <strong>and</strong> Water for All (SWA) High-Level Meeting (HLM) 2014. Geneva, Switzerl<strong>and</strong>, World<br />
Health Organization/UN-Water Global Analysis <strong>and</strong> Assessment of Sanitation <strong>and</strong> Drinking Water.<br />
Wils, A. <strong>and</strong> Bonnet, G. 2015. The Investment Case for Education <strong>and</strong> Equity. New York, UNICEF.<br />
World Bank. 2003. World Development Report 2004: Making Services Work for Poor People. Washington, DC, World Bank.<br />
___. 2009. HIV <strong>and</strong> AIDS <strong>and</strong> Teachers. Washington, DC, World Bank. (Policy Brief 14.)<br />
___. 2012. World Development Report 2012: Gender Equality <strong>and</strong> Development. Washington, DC, World Bank.<br />
___. 2015a. Mind, Society <strong>and</strong> Behavior. Washington, DC, World Bank.<br />
___. 2015b. World Bank Gender Statistics database. Washington, DC, World Bank. http://data.worldbank.org/datacatalog/gender-statistics.<br />
(Accessed 10 June 2016.)<br />
___. 2016. World Development Indicators. (Database.) Washington, DC, World Bank. http://data.worldbank.org/datacatalog/world-development-indicators.<br />
(Accessed 15 June 2016.)<br />
World Obesity Foundation. 2014. Obesity Prevention in Children in Pre-school Years: Policies <strong>and</strong> Evidence. Report of a<br />
high-level workshop, Brussels, 11 April. London, World Obesity Foundation.<br />
Chapter 4<br />
Abramovay, M. <strong>and</strong> das Graças Rua, M. 2005. Violence in Schools: Concise Version. Brasilia, UNESCO.<br />
Aiken, N. T. 2013. Identity, Reconciliation <strong>and</strong> Transitional Justice: Overcoming Intractability in Divided Societies. New York,<br />
Routledge.<br />
Aker, J. C., Collier, P. <strong>and</strong> Vicente, P. C. 2013. Is Information Power? Using Mobile Phones <strong>and</strong> Free Newspapers during an<br />
Election in Mozambique. Washington, DC, Center for Global Development. (Working Paper 328.)<br />
2016 • GLOBAL EDUCATION MONITORING REPORT 555
Alex<strong>and</strong>er, M. <strong>and</strong> Christia, F. 2011. Context modularity of human altruism. Science, Vol. 334, pp. 1392–93.<br />
Ali, N. 2008. Outrageous state, sectarianized citizens: deconstructing the ‘textbook controversy’ in the Northern<br />
Areas, Pakistan. South Asia Multidisciplinary Academic Journal, Vol. 2.<br />
Altinyelken, H. K. 2015. Democratising Turkey through student-centred pedagogy: opportunities <strong>and</strong> pitfalls.<br />
Comparative Education, Vol. 51, No. 4, pp. 484–501.<br />
Bajaj, M. (ed.) 2008. Encyclopedia of Peace Education. Charlotte, NC, Information Age Publishing.<br />
___. 2012. Human rights education in small schools in India. Peace Review: A Journal of Social Justice, Vol. 24, No. 1, pp.<br />
6–13.<br />
___. 2014. ‘Pedagogies of resistance’ <strong>and</strong> critical peace education praxis. Journal of Peace Education, Vol. 12, No. 2, pp.<br />
154–66.<br />
Bajaj, M. <strong>and</strong> Hantzopoulos, M. (eds). 2016. Peace Education: International Perspectives. London <strong>and</strong> New York,<br />
Bloomsbury Academic.<br />
B<strong>and</strong>iera, O., Buehren, N., Burgess, R., Goldstein, M., Gulesci, S., Rasul, I. <strong>and</strong> Sulaiman, M. 2014. Women’s Empowerment<br />
in Action: Evidence from a R<strong>and</strong>omized Control Trial in Africa. Oxford, UK, Centre for the Study of African Economies,<br />
University of Oxford. (CSAE Working Paper ,WPS/2014-30.)<br />
Banerjee, A., Chattopadhyay, R., Duflo, E., Keniston, D. <strong>and</strong> Singh, N. 2012. Improving Police Performance in Rajasthan,<br />
India: Experimental Evidence on Incentives, Managerial Autonomy <strong>and</strong> Training. Cambridge, MA, National Bureau of<br />
Economic Research. (NBER Working Paper 17912.)<br />
Banerjee, A. V., Kumar, S., P<strong>and</strong>e, R. <strong>and</strong> Su, F. 2011. Do informed voters make better choices? Experimental evidence from<br />
urban India. New Delhi, Satark Nagrik Sangathan. (Working paper.)<br />
Barakat, B., Karpinska, Z. <strong>and</strong> Paulson, J. 2008. Desk Study: Education <strong>and</strong> Fragility. New York, Inter-Agency Network on<br />
Education in Emergencies.<br />
Barakat, B. <strong>and</strong> Urdal, H. 2009. Breaking the Waves? Does Education Mediate the Relationship Between Youth Bulges <strong>and</strong><br />
Political Violence? Washington, DC, World Bank. (Policy Research Working Paper 5114.)<br />
Barakat, S., Connolly, D., Hardman, F. <strong>and</strong> Sundaram, V. 2013. The role of basic education in post-conflict recovery.<br />
Comparative Education, Vol. 49, No. 2, pp. 124–42.<br />
Barkan, J. D., Ademolekun, L., Zhou, Y., Laleye, M. <strong>and</strong> Ng’ethe, N. 2004. Emerging legislatures: institutions of horizontal<br />
accountability. B. Levy <strong>and</strong> S. J. Kpundeh (eds), Building State Capacity in Africa: New Approaches, Emerging Lessons.<br />
Washington, D.C., World Bank.<br />
Beaman, L., Duflo, E., P<strong>and</strong>e, R. <strong>and</strong> Topalova, P. 2012. Female leadership raises aspirations <strong>and</strong> educational attainment<br />
for girls: a policy experiment in India. Science, Vol. 335, No. 6068, pp. 582–86.<br />
Bekerman, Z. 2012. Culture/religion <strong>and</strong> identity: social justice versus recognition. Religious Education, Vol. 107, No. 3, pp.<br />
225–29.<br />
___. 2016. Experimenting with integrated peace education: critical perspectives in the Israeli context. M. Bajaj <strong>and</strong> M.<br />
Hantzopoulos (eds), Peace Education: International Perspectives. London <strong>and</strong> New York, Bloomsbury Academic, pp.<br />
51–69.<br />
Bellino, M. J. 2014. Whose past, whose present? Historical memory among the “postwar” generation in Guatemala.<br />
J. H. Williams (ed.), (Re)constructing Memory: School Textbooks <strong>and</strong> the Imagination of the Nation. Rotterdam, the<br />
Netherl<strong>and</strong>s, Sense Publishers, pp. 131–52.<br />
Bleck, J. 2015. Education <strong>and</strong> Empowered Citizenship in Mali. Baltimore, MD, Johns Hopkins University Press.<br />
Bourguignon, F. <strong>and</strong> Verdier, T. 2000. Oligarchy, democracy, inequality <strong>and</strong> growth. Journal of Development Economics,<br />
Vol. 63, No. 2, pp. 285–313.<br />
Bratton, M. <strong>and</strong> van de Walle, N. 1997. Democratic Experiments in Africa: Regime Transitions in Comparative Perspective.<br />
Cambridge, UK, Cambridge University Press.<br />
Buckl<strong>and</strong>, P. 2005. Reshaping the Future: Education <strong>and</strong> Postconflict Reconstruction. Washington, DC, World Bank.<br />
Buonanno, P. <strong>and</strong> Leonida, L. 2006. Education <strong>and</strong> crime: evidence from Italian regions. Applied Economics Letters, Vol.<br />
13, No. 11, pp. 709–13.<br />
Burchi, F. 2013. Women’s Political Role <strong>and</strong> Poverty in the Educational Dimension: A District-Level Analysis in India. Bonn,<br />
German Development Institute. (German Development Institute Discussion Paper 23.)<br />
Campante, F. R. <strong>and</strong> Chor, D. 2012. Why was the Arab world poised for revolution? Schooling, economic opportunities,<br />
<strong>and</strong> the Arab Spring. Journal of Economic Perspectives, Vol. 26, No. 2, pp. 167–87.<br />
556<br />
REFERENCES
Campbell, D. E. 2008. Voice in the classroom: how an open classroom climate fosters political engagement among<br />
adolescents. Political Behaviour, Vol. 30, No. 4, pp. 437–54.<br />
Castelló-Climent, A. 2008. On the distribution of education <strong>and</strong> democracy. Journal of Development Economics, Vol. 87,<br />
No. 2, pp. 179–90.<br />
Castillejo, C. 2009. Women’s Political Participation <strong>and</strong> Influence in Sierra Leone. Madrid, Fundación para las Relaciones<br />
Internacionales y el Diálogo Exterior. (FRIDE Working Paper 83.)<br />
Chenoweth, E. <strong>and</strong> Stephan, M. J. 2011. Why civil resistance works: the strategic logic of nonviolent conflict.<br />
International Security, Vol. 33, No. 1, pp. 7–44.<br />
Coalition to Stop the Use of Child Soldiers. 2008. Child Soldiers: Global Report 2008. London, Coalition to Stop the Use of<br />
Child Soldiers.<br />
Collier, P. <strong>and</strong> Vicente, P. C. 2014. Votes <strong>and</strong> violence: evidence from a field experiment in Nigeria. The Economic Journal,<br />
Vol. 124, No. 574, pp. 327–55.<br />
Comisión de la Verdad y Reconciliación de Peru. 2003. Informe Final [Final Report]. www.cverdad.org.pe/ifinal. (Accessed<br />
26 November 2015.)<br />
Croke, K., Grossman, G., Larreguy, H. A. <strong>and</strong> Marshall, J. 2015. Deliberate Disengagement: How Education Decreases Political<br />
Participation in Electoral Authoritarian Regimes. Afrobarometer. (Afrobarometer Working Papers 156.)<br />
Davies, L. 2005. Evaluating the link between conflict <strong>and</strong> education. Journal of Peacebuilding & Development, Vol. 2, No. 2.<br />
___. 2009. Educating against extremism: towards a critical politicisation of young <strong>people</strong>. International Review of<br />
Education, Vol. 55, No. 2, pp. 183–203.<br />
De Baessa, Y., Chesterfield, R. <strong>and</strong> Ramos, T. 2002. Active learning <strong>and</strong> democratic behavior in Guatemalan rural<br />
primary schools. Compare: A Journal of Comparative <strong>and</strong> International Education, Vol. 32, No. 2, pp. 205–18.<br />
Domingo, P., Holmes, R., O’Neil, T., Jones, N., Bird, K., Larson, A., Presler-Marshall, E. <strong>and</strong> Valters, C. 2015. Women’s Voice<br />
<strong>and</strong> Leadership in Decision-Making: Assessing the Evidence. London, Overseas Development Institute.<br />
Dunne, M., Humphreys, S. <strong>and</strong> Leach, F. 2006. Gender violence in schools in the developing world. Gender <strong>and</strong> Education,<br />
Vol. 18, No. 1, pp. 75–98.<br />
Dupuy, K. E. 2008. Education in peace agreements, 1989–2005. Conflict Resolution Quarterly, Vol. 26, No. 2, pp. 149–66.<br />
Eurydice. 2012. Citizenship Education in Europe. Brussels, Education, Audiovisual <strong>and</strong> Culture Executive Agency.<br />
FHI 360 Education Policy <strong>and</strong> Data Center. 2015. Does horizontal education inequality lead to violent conflict? New York,<br />
UNICEF.<br />
Finkel, S. E. 2002. Civic education <strong>and</strong> the mobilization of political participation in developing democracies. The Journal<br />
of Politics, Vol. 64, No. 4, pp. 994–1020.<br />
___. 2003. Can democracy be taught? Journal of Democracy, Vol. 14, No. 4, pp. 137–51.<br />
Finkel, S. E. <strong>and</strong> Ernst, H. R. 2005. Civic education in post-apartheid South Africa: alternative paths to the development<br />
of political knowledge <strong>and</strong> democratic values. Political Psychology, Vol. 26, No. 3, pp. 333–64.<br />
Finkel, S. E. <strong>and</strong> Rojo-Mendoza, R. T. 2013. Civic Education, Domain-Specific Knowledge, <strong>and</strong> Attitude Change: Evidence<br />
from an Information Campaign on Decentralization in the Democratic Republic of the Congo. Paper for the European<br />
Consortium for Political Research General Meeting, Bordeaux, 5 September.<br />
Freedman, S. W., Weinstein, H. M., Murphy, K. <strong>and</strong> Longman, T. 2008. Teaching history after identity-based conflicts:<br />
the Rw<strong>and</strong>a experience. Comparative Education Review, Vol. 52, No. 4, pp. 663–90.<br />
Friedman, W., Kremer, M., Miguel, E. <strong>and</strong> Thornton, R. 2011. Education as Liberation? Cambridge, MA, National Bureau of<br />
Economic Research. (NBER Working Paper, 16939.)<br />
Giné, X. <strong>and</strong> Mansuri, G. 2011. Together We Will: Experimental Evidence on Female Voting Behaviour in Pakistan. Washington,<br />
DC, World Bank. (Policy Research Working Paper, 5692.)<br />
Global Coalition to Protect Education from Attack. 2015. Lessons in War 2015: Military Use of Schools <strong>and</strong> Universities<br />
during Armed Conflict. New York, Global Coalition to Protect Education from Attack.<br />
Greene, M. E., Robles, O. J., Stout, K. <strong>and</strong> Suvilaakso, T. 2013. A Girl’s Right to Learn Without Fear: Working to end genderbased<br />
violence at school. Woking, UK, Plan International.<br />
Hansson, U., O’Connor, U. B. <strong>and</strong> McCord, J. 2013. Integrated Education: A Review of Policy <strong>and</strong> Research Evidence 1999–2012.<br />
Belfast, UK, Integrated Education Fund <strong>and</strong> UNESCO Centre.<br />
Harber, C. <strong>and</strong> Mncube, V. 2012. Education, Democracy <strong>and</strong> Development: Does Education Contribute to Democratisation in<br />
Developing Countries? Oxford, UK, Symposium Books Ltd.<br />
2016 • GLOBAL EDUCATION MONITORING REPORT 557
Hjalmarsson, R., Holmlund, H. <strong>and</strong> Lindquist, M. J. 2015. The effect of education on criminal convictions <strong>and</strong><br />
incarceration: causal evidence from micro-data. The Economic Journal, Vol. 125, No. 587, pp. 1290–326.<br />
Hoeffler, A. <strong>and</strong> Fearon, J. 2014. Conflict <strong>and</strong> Violence Assessment Paper: Benefits <strong>and</strong> Costs of the Conflict <strong>and</strong> Violence<br />
Targets for the Post-2015 Development Agenda. Copenhagen, Copenhagen Consensus Center.<br />
Hooghe, M. <strong>and</strong> Wilkenfeld, B. 2008. The stability of political attitudes <strong>and</strong> behaviors across adolescence <strong>and</strong> early<br />
adulthood: a comparison of survey data on adolescents <strong>and</strong> young adults in eight countries. Journal of Youth <strong>and</strong><br />
Adolescence, Vol. 37, No. 2, pp. 155–67.<br />
Human Rights Watch. 2014. “They Say We’re Dirty”: Denying an Education to India’s Marginalized. New York, Human Rights<br />
Watch.<br />
Human Rights Watch. 2016. “They Set the Classrooms on Fire” : Attacks on Education in Northeast Nigeria. New York, Human<br />
Rights Watch.<br />
Humphreys, M. <strong>and</strong> Weinstein, J. M. 2008. Who fights? The determinants of participation in civil war. American Journal<br />
of Political Science, Vol. 52, No. 2, pp. 436–55.<br />
Ichilov, O. 2007. Civic knowledge of high school students in Israel: personal <strong>and</strong> contextual determinants. Political<br />
Psychology, Vol. 28, No. 4, pp. 417–40.<br />
International Commission of Jurists. 2012. Women’s Access to Justice: Identifying the Obstances & Need for Change<br />
Thail<strong>and</strong>. Geneva, Switzerl<strong>and</strong>, International Commission of Jurists.<br />
Isaksson, A.-S. 2014. Political participation in Africa: the role of individual resources. Electoral Studies, Vol. 34.<br />
Jeffrey, C., Jeffery, P. <strong>and</strong> Jeffery, R. 2007. Degrees without Freedom? Education, Masculinities, <strong>and</strong> Unemployment in North<br />
India. Stanford, CA, Stanford University Press.<br />
Johnstad, P. G. 2010. Nonviolent democratization: a sensitivity analysis of how transition mode <strong>and</strong> violence impact<br />
the durability of democracy. Peace & Change, Vol. 35, No. 3, pp. 464–82.<br />
Jones, B. 2012. Exploring the politics of reconciliation through education reform: the case of Brčko District, Bosnia <strong>and</strong><br />
Herzegovina. International Journal of Transitional Justice, Vol. 6, No. 1, pp. 126–48.<br />
Karatnycky, A. <strong>and</strong> Ackerman, P. 2005. How Freedom is Won? From Civic Resistance to Durable Democracy. Washington, DC,<br />
Freedom House.<br />
King, E. 2014. From Classrooms to Conflict in Rw<strong>and</strong>a. New York, Cambridge University Press.<br />
Koissy-Kpein, S. A. 2015. Gender-based violence <strong>and</strong> gender bias in schooling decision. Helskinki, United Nations University<br />
World Institute for Development Economics Research. (UNU-WIDER Working Paper 107.)<br />
Kolisetty, A. 2014. Examining the Effectiveness of Legal Empowerment as a Pathway out of Poverty: A Case Study of BRAC.<br />
Washington, DC, World Bank. (Justice & Development Working Paper 26.)<br />
Kosciw, J. G., Palmer, N. A., Kull, R. M. <strong>and</strong> Greytak, E. A. 2013. The effect of negative school climate on academic<br />
outcomes for LGBT youth <strong>and</strong> the role of in-school supports. Journal of School Violence, Vol. 12, No. 1, pp. 45–63.<br />
Krueger, A. B. <strong>and</strong> Maleckova, J. 2003. Education, poverty <strong>and</strong> terrorism: is there a causal connection? Journal of<br />
Economic Perspectives, Vol. 17, No. 4, pp. 119–44.<br />
Kuenzi, M. T. 2006. Nonformal education, political participation, <strong>and</strong> democracy: findings from Senegal. Political<br />
Behaviour, Vol. 28, No. 1, pp. 1–31.<br />
___. 2011. Education <strong>and</strong> Democracy in Senegal. Basingstoke, UK, Palgrave MacMillan.<br />
Lall, M.-C. 2008. Educate to hate: the use of education in the creation of antagonistic national identities in India <strong>and</strong><br />
Pakistan. Compare: A Journal of Comparative Education, Vol. 38, No. 1, pp. 103–19.<br />
Machin, S., Marie, O. <strong>and</strong> Vujić, S. 2011. The crime reducing effect of education. The Economic Journal, Vol. 552, pp. 463–84.<br />
MacLean, L. M. 2011. State retrenchment <strong>and</strong> the exercise of citizenship in Africa. Comparative Political Studies, Vol. 44,<br />
No. 9, pp. 1238–66.<br />
Manganelli, S., Lucidi, F. <strong>and</strong> Alivernini, F. 2015. Italian adolescents’ civic engagement <strong>and</strong> open classroom climate: the<br />
mediating role of self-efficacy. Journal of Applied Developmental Psychology, Vol. 41, pp. 8–18.<br />
Marques, J. <strong>and</strong> Bannon, I. 2003. Central America : Education Reform in a Post-conflict Setting, Opportunities <strong>and</strong> Challenges.<br />
Washington, D.C, World bank. (Conflict Prevention <strong>and</strong> Reconstruction Series.)<br />
McGlynn, C. 2004. Education for peace in integrated schools: a priority for Northern Irel<strong>and</strong>? Child Care in Practice, Vol.<br />
10, No. 2, pp. 85–94.<br />
Mel<strong>and</strong>er, E. 2015. Organized Violence in the World 2015: An Assessment by the Uppsala Conflict Data Program. Uppsala,<br />
Sweden, Uppsala University. (UCDP Paper, 9.)<br />
558<br />
REFERENCES
Mendenhall, M. <strong>and</strong> Chopra, N. 2016. Peace education in crisis settings: insights <strong>and</strong> lessons learned from Kenya. M.<br />
Bajaj <strong>and</strong> M. Hantzopoulos (eds), Peace Education: International Perspectives. London <strong>and</strong> New York, Bloomsbury<br />
Academic, pp. 89–106.<br />
Milligan, K., Moretti, E. <strong>and</strong> Oreopoulos, P. 2004. Does education improve citizenship? Evidence from the U.S. <strong>and</strong> the<br />
U.K. Journal of Public Economics, Vol. 88, No. 9–10.<br />
Mogollón, O. <strong>and</strong> Solano, M. 2011. Active Schools: Our Convictions for Improving the Quality of Education. Durham, NC, FHI 360.<br />
Monteiro, R. 2012. The quota policy in Portugal: the role of political parties <strong>and</strong> state feminism. RCCS Annual Review, Vol. 4.<br />
Mullis, I. V. S., Martin, M. O., Foy, P. <strong>and</strong> Arora, A. 2012. TIMSS 2011 International Results in Mathematics. Chestnut Hill, MA,<br />
TIMSS <strong>and</strong> PIRLS International Study Center, Boston College.<br />
Murshed, S. M. <strong>and</strong> Gates, S. 2005. Spatial-horizontal inequality <strong>and</strong> the Maoist insurgency in Nepal. Review of<br />
Development Economics, Vol. 9, No. 1, pp. 121–34.<br />
Nguyen, P.-M., Terlouw, C. <strong>and</strong> Pilot, A. 2006. Culturally appropriate pedagogy: the case of group learning in a<br />
Confucian Heritage Culture context. Intercultural Education, Vol. 17, No. 1, pp. 1–19.<br />
Novelli, M., Cardozo, M. L. <strong>and</strong> Smith, A. 2015. A Theoretical Framework for Analysing the Contribution of Education to<br />
Sustainable Peacebuilding: 4rs in Conflict-Affected Contexts. Amsterdam, University of Amsterdam. (Research<br />
Consortium on Education <strong>and</strong> Peacebuilding.)<br />
O’Sullivan, M. 2004. The reconceptualisation of learner-centred approaches: a Namibian case study. International<br />
Journal of Educational Development, Vol. 24, No. 6, pp. 585–602.<br />
Obura, A. P. 2002. Peace Education Programme in Dadaab <strong>and</strong> Kakula, Kenya: Evaluation Summary. Geneva, Switzerl<strong>and</strong>,<br />
United Nations High Commissioner for Refugees<br />
OECD. 2015. States of Fragility 2015: Meeting Post-2015 Ambitions. Paris, Organisation for Economic Co-operation <strong>and</strong><br />
Development.<br />
Open Society Justice Initiative. 2015. Innovative Efforts, Proven Results: How Timap for Justice Provides Legal Aid in Sierra<br />
Leone. New York, Open Society Justice Initiative. (Briefing Paper.)<br />
Østby, G., Nordas, R. <strong>and</strong> Rød, J. K. 2009. Regional inequalities <strong>and</strong> civil conflict in sub-Saharan Africa. International<br />
Studies Quarterly, Vol. 53, No. 2, pp. 301–24.<br />
Pasek, J., Feldman, L., Romer, D. <strong>and</strong> Jamieson, K. H. 2008. Schools as incubators of democratic participation: building<br />
long-term political efficacy with civic education. Applied Developmental Science, Vol. 12, No. 1.<br />
Paulson, J. 2015. “Whether <strong>and</strong> how?” History education about recent <strong>and</strong> ongoing conflict: a review of research.<br />
Journal on Education in Emergencies, Vol. 1, No. 1, pp. 14–48.<br />
Pinnock, H. 2009. Language <strong>and</strong> Education: The Missing Link – How the Language Used Iin Schools Threatens the Achievement<br />
of Education for All. London, CfBT Education Trust <strong>and</strong> Save the Children Alliance.<br />
Powley, E. 2005. Rw<strong>and</strong>a: women hold up half the parliament. J. Ballington <strong>and</strong> A. Karam (eds), Women in Parliament:<br />
Beyond Numbers. Stockholm, International Institute for Democracy <strong>and</strong> Electoral Assistance, pp. 154–63.<br />
Quintelier, E. <strong>and</strong> Hooghe, M. 2013. The relationship between political participation intentions of adolescents <strong>and</strong> a<br />
participatory democratic climate at school in 35 countries. Oxford Review of Education, Vol. 39, No. 5, pp. 567–89.<br />
Ramirez-Barat, C. <strong>and</strong> Duthie, R. 2015. Education <strong>and</strong> Transitional Justice: Opportunities <strong>and</strong> Challenges for Peacebuilding.<br />
New York, International Center for Transitional Justice <strong>and</strong> Learning for Peace.<br />
Schulz, W., Ainley, J., Fraillon, J., Kerr, D. <strong>and</strong> Losito, B. 2010. ICCS 2009 International Report: Civic Knowledge, Attitudes, <strong>and</strong><br />
Engagement among Lower-secondary School Students in 38 Countries. Amsterdam, the Netherl<strong>and</strong>s, International<br />
Association for the Evaluation of Educational Achievement.<br />
Schweisfurth, M. 2011. Learner-centred education in developing country contexts: from solution to problem?<br />
International Journal of Educational Development, Vol. 31, No. 5, pp. 425–32.<br />
Serbessa, D. D. 2006. Tension between traditional <strong>and</strong> modern teaching-learning approaches in Ethiopian primary<br />
schools. Journal of International Cooperation in Education, Vol. 9, No. 1, pp. 123–40.<br />
Shaykhutdinov, R. 2011. Education for peace: protest strategies of ethnic resistance movements. Journal of Peace<br />
Education, Vol. 8, No. 2, pp. 143–55.<br />
Shemyakina, O. 2011. The effect of armed conflict on accumulation of schooling: results from Tajikistan. Journal of<br />
Development Economics, Vol. 95, No. 2, pp. 186–200.<br />
Sim, A., Puffer, E., Green, E., Chase, R., Zayzay, J., Garcia-Roll<strong>and</strong>, E. <strong>and</strong> Boone, L. 2014. Parents Make the Difference: Findings<br />
from a R<strong>and</strong>omized Impact Evaluation of a Parenting Program in rural Liberia, New York, International Rescue Committee.<br />
2016 • GLOBAL EDUCATION MONITORING REPORT 559
Sondheimer, R. M. <strong>and</strong> Green, D. P. 2010. Using experiments to estimate the effects of education on voter turnout.<br />
American Journal of Political Science, Vol. 54, No. 1, pp. 174–89.<br />
Stasavage, D. 2005. The role of democracy in Ug<strong>and</strong>a’s move to universal primary education. Journal of Modern African<br />
Studies, Vol. 43, No. 1, pp. 53–73.<br />
Syvertsen, A. K., Stout, M. D., Flanagan, C. A., Mitra, D. L., Oliver, M. B. <strong>and</strong> Sundar, S. S. 2009. Using elections as<br />
teachable moments: a r<strong>and</strong>omized evaluation of the student voices civic education program. American Journal of<br />
Education, Vol. 116, No. 1, pp. 33–67.<br />
Tadros, M. 2014. Engaging politically: rethinking women’s pathways to power. M. Tadros (ed.), Women in Politics: Gender,<br />
Power <strong>and</strong> Development. London, Zed Books, pp. 1–39.<br />
Torney-Purta, J. 2002. Patterns in the civic knowledge, engagement, <strong>and</strong> attitudes of European adolescents: the IEA<br />
Civic Education Study. European Journal of Education, Vol. 37, No. 2, pp. 129–41.<br />
UCLG. 2015. Local Governance Key to Achieving Gender Equality <strong>and</strong> Social Equity: Let’s Make It Happen! Barcelona, Spain,<br />
United Cities <strong>and</strong> Local Governments.<br />
UIS. 2010. The Quantitative Impact of Conflict on Education. Montreal, Que., UNESCO Institute for Statistics. (Background<br />
paper for EFA Global Monitoring Report 2011.)<br />
UN Women. 2011. 2011–2012 Progress of the World’s Women: In Pursuit of Justice. New York, UN Women. http://progress.unwomen.org.<br />
___. 2015. Progress of the World’s Women 2015–2016: Transforming Economies, Realizing Rights. New York, UN Women.<br />
UNDPKO. 2010. Haiti Police Reform. New York, UN Department of Peacekeeping Operations (Background paper for World<br />
Development Report 2011.)<br />
UNESCO. 2011. EFA Global Monitoring Report 2011: The Hidden Crisis – Armed Conflict <strong>and</strong> Education. Paris, UNESCO.<br />
___. 2015. EFA Global Monitoring Report 2015: Education for All 2000–2015 – Achievements <strong>and</strong> Challenges. Paris, UNESCO.<br />
___. 2016. If You don’t underst<strong>and</strong>, how can you learn? Paris, UNESCO. (Background paper for Global Education Monitoring<br />
Report 2016)<br />
UNHCR. 2015. UNHCR Mid-Year Trends 2015. Geneva, Switzerl<strong>and</strong>, United Nations High Commissioner for Refugees<br />
UNICEF. 2014. Hidden in Plain Sight: a Statistical Analysis of Violence against Children. New York, UNICEF.<br />
___. 2015. Education under Fire: How Conflict in the Middle East is Depriving Children of Their Schooling. New York, UNICEF.<br />
___. 2016. No Place for Children: The Impact of Five Years of War on Syria’s Children <strong>and</strong> Their Childhoods. Amman, UNICEF<br />
Regional Office for the Middle East & North Africa.<br />
van Ommering, E. 2015. Formal history education in Lebanon: crossroads of past conflicts <strong>and</strong> prospects for peace.<br />
International Journal of Educational Development, Vol. 41, pp. 200–07.<br />
Wang, G., Wu, L. <strong>and</strong> Han, R. 2015. College education <strong>and</strong> attitudes toward democracy in China: an empirical study. Asia<br />
Pacific Education Review, Vol. 16, No. 3, pp 399–412.<br />
Wantchekon, L., Klasnja, M. <strong>and</strong> Novta, N. 2015. Education <strong>and</strong> human capital externalities: evidence from colonial<br />
Benin. Quarterly Journal of Economics, Vol. 130, No. 2, pp. 703–57.<br />
World Bank. 2011. Macedonia: Evaluation of the Judicial System, 2011. Washington, DC, World Bank.<br />
World Justice Project. 2015. World Justice Project: Open Government Index 2015 Report. Washington, DC, World Justice Project.<br />
Chapter 5<br />
3RP. 2016. Regional Refugee & Resilience Plan 2016–2017 in Response to the Syria Crisis: Turkey. Geneva, Switzerl<strong>and</strong>/New<br />
York, United Nations High Commissioner for Refugees/United Nations Development Programme.<br />
A.T. Kearney. 2015. A.T. Kearney Global Cities 2015: The Race Accelerates. Chicago, IL, A.T. Kearney, Inc.<br />
Acuto, M. 2013. City leadership in global governance. Global Governance: A Review of Multilateralism <strong>and</strong> International<br />
Organizations, Vol. 19, No. 3, pp. 481–98.<br />
560<br />
REFERENCES
Allen, H. 2013. Africa’s First Full Rapid Bus System: The Rea Vaya Bus System in Johannesburg, Republic of South Africa.<br />
Nairobi, United Nations Human Settlements Programme. (Case study for Global Report on Human Settlements<br />
2013.)<br />
Arbel, Y. 2014. Urban Acupuncture: Curitiba as an Allegory. Tel Aviv, Institute for Democratic Education.<br />
Barber, B. R. 2013. If Mayors Ruled the World: Dysfunctional Nations, Rising Cities. New Haven, CT, Yale University Press.<br />
Bard, J., Gardener, C. <strong>and</strong> Wiel<strong>and</strong>, R. 2006. National rural education association report: rural school consolidation –<br />
history, research summary, conclusions, <strong>and</strong> recommendations. Rural Educator, Vol. 27, No. 2, pp. 40–48.<br />
Berlin Senate Department for Urban Development <strong>and</strong> the Environment. 2010. Neighborhood Management in Berlin:<br />
Information on the Program “Socially Integrative City”. Berlin, Senate Department for Urban Development <strong>and</strong> the<br />
Environment.<br />
Beteille, T. 2009. Absenteeism, transfers <strong>and</strong> patronage: the political economy of teacher labor markets in India. Ph.D.<br />
dissertation, Stanford University, Stanford, CA.<br />
Bidwell, K. <strong>and</strong> Watine, L. 2014. Exploring Early Education Programs in Peru-urban Settings in Africa. New Haven, CT,<br />
Innovations for Poverty Action.<br />
Bomberg, N. 2014. Medellín, Colombia: A City Transformed? Cities Speak: National League of Cities, Washington, DC.<br />
http://citiesspeak.org/2014/04/04/medellin-colombia-a-city-transformed. (Accessed 4 April 2016.)<br />
Borsdorf, A. <strong>and</strong> Hidalgo, R. 2008. New dimensions of social exclusion in Latin America: from gated communities to<br />
gated cities, the case of Santiago de Chile. L<strong>and</strong> Use Policy, Vol. 25, No. 2, pp. 153–60.<br />
Bosker, M., Deichmann, U. <strong>and</strong> Roberts, M. 2015. Hukou <strong>and</strong> Highways: The Impact of China’s Spatial Development Policies<br />
on Urbanization <strong>and</strong> Regional Inequality. Washington, DC, World Bank. (Policy Research Working Paper 7350.)<br />
Bouteligier, S. 2012. Cities, Networks, <strong>and</strong> Global Environment Governance: Spaces of Innovations, Places of Leadership, Vol. 1.<br />
New York <strong>and</strong> Oxford, UK, Routledge. (Cities <strong>and</strong> Global Governance.)<br />
Bunar, N. 2010. Choosing for quality or inequality: current perspectives on the implementation of school choice policy<br />
in Sweden. Journal of Education Policy, Vol. 25, No. 1, pp. 1–18.<br />
Cadena, A., Remes, J., Manyika, J., Dobbs, R., Roxburgh, C., Elstrodt, H.-P., Chaia, A. <strong>and</strong> Restrepo, A. 2011. Building Globally<br />
Competitive Cities: The Key to Latin American Growth. New York, McKinsey Global Institute.<br />
Carillo, F. J., Yigitcanlar, T., García, B. <strong>and</strong> Lönnqvist, A. 2014. Knowledge <strong>and</strong> the City: Concepts, Applications <strong>and</strong> Trends of<br />
Knowledge-Based Urban Development. Washington, DC, Routledge.<br />
Carrera, V., Ortiz-C<strong>and</strong>elejo, P<strong>and</strong>ji, M., Okuda, T. <strong>and</strong> Reyes Muguerza, R. 2016. The role of higher education in local<br />
development: issues of economic growth, inclusion <strong>and</strong> sustainability. (Background paper for Global Education<br />
Monitoring Report 2016.)<br />
Carvalho, L., Mingardo, G. <strong>and</strong> van Haaren, J. 2012. Green urban transport policies <strong>and</strong> cleantech innovations: evidence<br />
from Curitiba, Göteborg <strong>and</strong> Hamburg. European Planning Studies, Vol. 20, No. 3, pp. 375–96.<br />
Castro, L. <strong>and</strong> Echeverri, A. 2011. Bogotá <strong>and</strong> Medellín: architecture <strong>and</strong> politics. Architectural Design, Vol. 81, No. 3, pp.<br />
96–103.<br />
Cerdá, M., Morenoff, J. D., Hansen, B. B., Tessari Hicks, K. J., Duque, L. F., Restrepo, A. <strong>and</strong> Diez-Roux, A. V. 2012. Reducing<br />
violence by transforming neighborhoods: a natural experiment in Medellín, Colombia. American Journal of<br />
Epidemiology, Vol. 175, No. 10, pp. 1045–53.<br />
Chacko, E. 2007. From brain drain to brain gain: reverse migration to Bangalore <strong>and</strong> Hyderabad, India’s globalizing high<br />
tech cities. GeoJournal, Vol. 68, No. 2/3, pp. 131–40.<br />
Ch<strong>and</strong>rashekhar, S. <strong>and</strong> Sharma, A. 2014. Internal Migration for Education <strong>and</strong> Employment among Youth in India. Mumbai,<br />
India, Indira G<strong>and</strong>hi Institute of Development Research.<br />
Cherng, S. <strong>and</strong> Han, W.-J. 2016. Teacher Perceptions of Urban <strong>and</strong> Rural Migrant Youth in China. (Unpublished.)<br />
Chudgar, A. <strong>and</strong> Luschei, T. 2015. Evolution of policies on teacher deployment to disadvantaged areas. (Background paper for<br />
EFA Global Monitoring Report 2015.)<br />
Clean Air Asia. 2013. Promoting Non-motorized Transport in Asian Cities: Policymakers’ Toolbox. Pasig City, Philippines/New<br />
York/New Delhi, Clean Air Asia Center/UN Habitat/Shakti Sustainable Energy Foundation.<br />
Corbacho, A., Philipp, J. <strong>and</strong> Ruiz-Vega, M. 2015. Crime <strong>and</strong> erosion of trust: evidence for Latin America. World<br />
Development, Vol. 70, pp. 400–15.<br />
Corburn, J. 2004. Confronting the Challenges in Reconnecting Urban Planning <strong>and</strong> Public Health. American Journal of<br />
Public Health, Vol. 94, No. 4, pp. 541–46.<br />
2016 • GLOBAL EDUCATION MONITORING REPORT 561
Das, D. 2015. Hyderabad: visioning, restructuring <strong>and</strong> making of a high-tech city. Cities, Vol. 43, pp. 48–58.<br />
Day Ashley, L., Mcloughlin, C., Aslam, M., Engel, J., Wales, J., Rawal, S., Batley, R., Kingdon, G., Nicolai Susan <strong>and</strong> Pauline,<br />
R. 2014. The Role <strong>and</strong> Impact of Private Schools in Developing Countries: A Rigorous Review of the Evidence. London,<br />
Department for International Development. (Education Rigorous Literature Review.)<br />
De la Fuente, H., Rojas, C., Salado, M. J., Carrasco, J. A. <strong>and</strong> Neutens, T. 2013. Socio-spatial inequality in education<br />
facilities in the Concepción Metropolitan Area (Chile). Current Urban Studies, Vol. 1, No. 4, pp. 117–29.<br />
DeBaun, B. <strong>and</strong> Roc, M. 2013. Saving Futures, Saving Dollars: The Impact of Education on Crime Reduction <strong>and</strong> Earnings.<br />
Washington, DC, Alliance for Excellent Education.<br />
Dobbie, W. <strong>and</strong> Fryer Jr., R. G. 2009. Are High Quality Schools Enough to Close the Achievement Gap? Evidence from a Social<br />
Experiment in Harlem. Cambridge, MA, National Bureau of Economic Research. (NBER Working Paper 15473.)<br />
Dobbs, R., Smit, S., Remes, J., Manyika, J., Roxburgh, C. <strong>and</strong> Restrepo, A. 2011. Urban World: Mapping the Economic Power of<br />
Cities. New York, McKinsey Global Institute.<br />
Dupont, V. 2008. Slum demolitions in Delhi since the 1990s: an appraisal. Economic <strong>and</strong> Political Weekly, Vol. 43, No. 28,<br />
pp. 79–87.<br />
Eesley, C. <strong>and</strong> Miller, W. 2012. Impact: Stanford University’s Economic Impact via Innovation <strong>and</strong> Entrepreneurship. Stanford,<br />
CA, Stanford University.<br />
Ellis, P. <strong>and</strong> Roberts, M. 2016. Leveraging Urbanization in South Asia: Managing Spatial Transformation for Prosperity <strong>and</strong><br />
Liveability. Washington, DC, World Bank.<br />
Elwick, A. <strong>and</strong> McAleavy, T. 2015. Interesting Cities: Five Approaches to Urban School Reform. Reading, UK, Education<br />
Development Trust.<br />
EMBARQ. 2015. Global BRT Data. Washington, DC, WRI Ross Center for Sustainable Cities, World Resources Institute.<br />
http://brtdata.org (Accessed 23 May 2016.)<br />
Ernst <strong>and</strong> Young LLP. 2014. Private Sector’s Contribution to K–12 Education in India: Current Impact, Challenges <strong>and</strong> Way<br />
Forward. New Delhi, Ernst <strong>and</strong> Young.<br />
Etzkowitz, H. 2003. Innovation in innovation: the triple helix of university-industry-government relations. Social Science<br />
Information, Vol. 42, No. 3, pp. 293–337.<br />
Falch, T., Borge, L.-E., Lujala, P., Nyhus, O. H. <strong>and</strong> Strom, B. 2010. Completion <strong>and</strong> Dropout in Upper Secondary Education in<br />
Norway: Causes <strong>and</strong> Consequences. Trondheim, Norway, Centre for Economic Research, Norwegian University of<br />
Science <strong>and</strong> Technology.<br />
Ferreiro, L. 2015. Cycling gains ground on Latin American streets. Washington, DC, www.worldbank.org/en/news/<br />
feature/2015/06/24/el-pedaleo-gana-espacio-en-las-calles-latinoamericanas. (Accessed 6 May 2016.)<br />
Florida, R. 2002. The Rise of the Creative Class <strong>and</strong> How It’s Transforming Work, Leisure, Community <strong>and</strong> Everyday Life. New<br />
York, Basic Books.<br />
Florida, R. <strong>and</strong> Mell<strong>and</strong>er, C. 2015. Segregated City: The Geography of Economic Segregation in America’s Metros. Toronto,<br />
ON, Martin Prosperity Institute, Rotman School of Management, University of Toronto.<br />
Foad, H. S. 2014. Do Ethnic Enclaves Impede or Facilitate Assimilation <strong>and</strong> Education? A Comparison Across Ethnicities <strong>and</strong><br />
Geographies. San Diego, CA, Department of Economics, San Diego State University.<br />
Fünfgeld, H. 2015. Facilitating local climate change adaptation through transnational municipal networks. Current<br />
Opinion in Environmental Sustainability, Vol. 12, pp. 67–73.<br />
Giraldo-Ramírez, J. <strong>and</strong> Preciado-Restrepo, A. 2015. Medellín, from theater of war to security laboratory. Stability:<br />
International Journal of Security <strong>and</strong> Development, Vol. 4, No. 1.<br />
Godefrooij, T., Pardo, C. <strong>and</strong> Sagaris, L. (eds). 2009. Cycling-Inclusive Policy Development: A H<strong>and</strong>book. Utrecht, the<br />
Netherl<strong>and</strong>s, GTZ Transport Policy Advisory Services/German Ministry for Economic Cooperation <strong>and</strong> Development.<br />
Graham, P. <strong>and</strong> Booth, P. 2010. Guidelines on Education Policy for Sustainable Built Environments. Paris, United Nations<br />
Environment Programme.<br />
Haddad, M. <strong>and</strong> Nedovic-Budic, Z. 2006. Using spatial statistics to analyze intra-urban inequalities <strong>and</strong> public<br />
intervention in São Paulo, Brazil. Journal of Human Development, Vol. 7, No. 1, pp. 85–109.<br />
Hanna, R. N. <strong>and</strong> Linden, L. L. 2012. Discrimination in grading. American Economic Journal: Economic Policy, Vol. 4, No. 4,<br />
pp. 146–68.<br />
Hannah-Jones, N. 2014. Segregation Now: Investigating America’s Racial Divide. New York, ProPublica. www.propublica.org/<br />
article/segregation-now-full-text (Accessed 3 May 2016.)<br />
562<br />
REFERENCES
Hanson, D. 2013. Assessing the Harlem Children’s Zone. Washington, DC, Center for Policy Innovation, The Heritage<br />
Foundation. (Discussion Paper 8.)<br />
Harlem Children’s Zone. 2015. 2014–2015 Biennial Report: A Community of Opportunity. New York, Harlem Children’s Zone.<br />
Härmä, J. 2011. Lagos Private School Census 2010–2011 Report. Abuja, Nigeria, Education Sector Support Programme in<br />
Nigeria, UK Department for International Development. (Report, LG501.)<br />
___. 2013. Private Responses to State Failure: The Growth in Private Education (<strong>and</strong> Why) in Lagos, Nigeria. New York, National<br />
Center for the Study of Privatization in Education, Teachers College, Columbia University. (Working Paper 215.)<br />
___. 2015. Private schooling <strong>and</strong> development: an overview. P. Dixon, S. Humble <strong>and</strong> C. Counihan (eds), H<strong>and</strong>book of<br />
International Development <strong>and</strong> Education. Cheltenham, UK/Northampton, MA, Edward Elgar Publishing, pp. 171–99.<br />
Heath, A. F., Rothon, C. <strong>and</strong> Kilpi, E. 2008. The second generation in Western Europe: education, unemployment, <strong>and</strong><br />
occupational attainment. Annual Review of Sociology, Vol. 34, pp. 211–35.<br />
Howley, C., Johnson, J. <strong>and</strong> Petrie, J. 2011. Consolidation of Schools <strong>and</strong> Districts: What the Research Says <strong>and</strong> What It Means.<br />
Boulder, CO, National Education Policy Center, School of Education, University of Colorado Boulder. (Policy Brief.)<br />
Hsieh, C.-T. <strong>and</strong> Urquiola, M. 2006. The effects of generalized school choice on achievement <strong>and</strong> stratification: evidence<br />
from Chile’s voucher program. Journal of Public Economics, Vol. 90, pp. 1477–503.<br />
Icel<strong>and</strong>, J. 2014. Residential Segregation: A Transatlantic Analysis. Washington, DC, Migration Policy Institute.<br />
ILO <strong>and</strong> WIEGO. 2014. Women <strong>and</strong> Men in the Informal Economy: A Statistical Picture. Geneva, Switzerl<strong>and</strong>/Cambridge, MA,<br />
International Labour Organization/Women in Informal Employment: Globalizing <strong>and</strong> Organizing.<br />
International Organization for Migration. 2013. Crushed Hopes: Underemployment <strong>and</strong> Deskilling among Skilled Migrant<br />
Women. Geneva, Switzerl<strong>and</strong>, International Organization for Migration.<br />
___. 2015. World Migration Report 2015: Migration <strong>and</strong> Cities – New Partnerships to Manage Mobility. Geneva, Switzerl<strong>and</strong>,<br />
International Organization for Migration.<br />
John, B., Keeler, L. W., Wiek, A. <strong>and</strong> Lang, D. J. 2015. How much sustainability substance is in urban visions? An analysis<br />
of visioning projects in urban planning. Cities, Vol. 48, pp. 86–98.<br />
Johnson, R. C. 2011. Long-run Impacts of School Desegregation <strong>and</strong> School Quality on Adult Attainments. Cambridge, MA,<br />
National Bureau of Economic Research. (NBER Working Paper 16664.)<br />
Jonck, P., Goujon, A., Testa, M. R. <strong>and</strong> K<strong>and</strong>ala, J. 2015. Education <strong>and</strong> crime engagement in South Africa: a national <strong>and</strong><br />
provincial perspective. International Journal of Educational Development, Vol. 45, pp. 141–51.<br />
Jones, H., Clench, B. <strong>and</strong> Harris, D. 2014. The Governance of Urban Service Delivery in Developing Countries. London,<br />
Overseas Development Institute.<br />
Joshi, P. 2016. Experiencing <strong>and</strong> responding to private competition: the importance of subjectivity <strong>and</strong> intermediate<br />
outcomes. Comparative Education Review, Vol. 60, No. 3, pp. 571–600.<br />
Kiell<strong>and</strong>, A. 2015. Evolution in approaches to improving access to education for children living in urban slums. (Background<br />
paper for EFA Global Monitoring Report 2015.)<br />
Kilroy, A. 2007. Intra-Urban Spatial Inequality: Cities as “Urban Regions”. Washington, DC, World Bank. (Background paper<br />
for World Development Report 2009.)<br />
Kimmelman, M. 2012. A City Rises, Along With Its Hopes. The New York Times, 18 May .<br />
Knight, J. 2014. Education hubs: issues, indicators <strong>and</strong> reflections. J. Knight (ed.), International Education Hubs: Student,<br />
Talent, Knowledge-Innovation Models. Dordrecht, the Netherl<strong>and</strong>s, Springer, pp. 207–28.<br />
Kofman, E. <strong>and</strong> Raghuram, P. 2009. Skilled Female Labour Migration. Hamburg, Germany, Hamburg Institute of<br />
International Economics. (Focus Migration Policy Brief 13.)<br />
Kumar, A., Zimmerman, S. <strong>and</strong> Agarwal, O. P. 2012. International Experience in Bus Rapid Transit Implementation: Synthesis of<br />
Lessons Learned from Lagos, Johannesburg, Jakarta, Delhi, <strong>and</strong> Ahmedabad. Washington, DC, World Bank.<br />
Kurtz-Phelan, D. 2007. Q&A: Medellín Mayor Turns City Around. Newsweek, 11 November.<br />
Leeds, E. 2006. Rio de Janeiro. K. Koonings <strong>and</strong> D. Kruijit (eds), Fractured Cities: Social Exclusion, Urban Violence <strong>and</strong><br />
Contested Spaces in Latin America. London, Zed Books, pp. 23–35.<br />
Lochner, L. 2011. Non-production Benefits of Education: Crime, Health, <strong>and</strong> Good Citizenship. Cambridge, MA, National<br />
Bureau of Economic Research. (NBER Working Paper 16722.)<br />
LSE. 2014. Governing Urban Futures. London, London School of Economics <strong>and</strong> Political Science. (Urban Age.)<br />
Macedo, J. 2013. Planning a sustainable city: the making of Curitiba, Brazil. Journal of Planning History, Vol. 12, No. 4, pp.<br />
334–53.<br />
2016 • GLOBAL EDUCATION MONITORING REPORT 563
Machin, S., Marie, O. <strong>and</strong> Vujić, S. 2011. The crime reducing effect of education. The Economic Journal, Vol. 121, No. 552, pp.<br />
463–84.<br />
Mankiw, N. G., Romer, D. <strong>and</strong> Weil, D. N. 1992. A Contribution to the Empirics of Economic Growth. Cambridge, MA, National<br />
Bureau of Economic Research. (NBER Working Paper 3541.)<br />
Marcinczak, S., Musterd, S., Van Ham, M. <strong>and</strong> Tammaru, T. 2016. Inequality <strong>and</strong> rising levels of socio-economic<br />
segregation: Lessons from a pan-European comparative study. T. Tammaru, S. Marcińczak, M. van Ham <strong>and</strong> S.<br />
Musterd (eds), Socio-Economic Segregation in European Capital Cities: East Meets West. Oxford, UK, Routledge.<br />
Martino, D. 2016. Education <strong>and</strong> environmental sustainability in the urban Latin American <strong>and</strong> Caribbean context. (Background<br />
paper for Global Education Monitoring Report 2016.)<br />
Massey, D. S. <strong>and</strong> Denton, N. A. 1993. American Apartheid: Segregation <strong>and</strong> the Making of the Underclass. Cambridge, MA,<br />
Harvard University Press.<br />
McGranahan, G. <strong>and</strong> Satterthwaite, D. 2014. Urbanisation Concepts <strong>and</strong> Trends. London, International Institute for<br />
Environment <strong>and</strong> development. (IIED Working Paper.)<br />
Mega, V. 2013. Cities of education, science <strong>and</strong> innovation, culture <strong>and</strong> the arts. V. Mega (ed.), Quintessential Cities,<br />
Accountable to the Future: Sustainability, Innovation <strong>and</strong> Citizenship. New York, Springer-Verlag, pp. 149–67.<br />
Mei, H., Jiang, Q., Xiang, Y. <strong>and</strong> Song, X. 2015. School consolidation: whither China’s rural education? Asian Social Work<br />
<strong>and</strong> Policy Review, Vol. 9, pp. 138–50.<br />
Minnery, J., Argo, T., Winarso, H., Hau, D., Veneracion, C. C., Forbes, D. <strong>and</strong> Childs, I. 2013. Slum upgrading <strong>and</strong> urban<br />
governance: case studies in three South East Asian cities. Habitat International, Vol. 39, pp. 162–69.<br />
Musterd, S. 2005. Social <strong>and</strong> ethnic segregation in Europe: levels, causes, <strong>and</strong> effects. Journal of Urban Affairs, Vol. 27, No.<br />
3, pp. 331–48.<br />
Nolen, S. 2014. ‘Social urbanism’ experiment breathes new life into Colombia’s Medellín. The Globe <strong>and</strong> Mail, 22 December.<br />
OECD. 2015. Promoting the Development of Local Innovation Systems: the Case of Medellín Colombia. Trento, Italy, Centre for<br />
Local Development (LEED), Organisation for Economic Co-operation <strong>and</strong> Development. (OECD Working Paper.)<br />
Patel, S., Baptist, C. <strong>and</strong> d’Cruz, C. 2012. Knowledge is power: informal communities assert their right to the city<br />
through SDI <strong>and</strong> community-led enumerations. Environment <strong>and</strong> Urbanization, Vol. 24, No. 1, pp. 13–26.<br />
Patel, S. <strong>and</strong> Mitlin, D. 2010. Gender Issues <strong>and</strong> Slum/Shack Dweller Federations. London, International Institute for<br />
Environment <strong>and</strong> Development.<br />
Poveda, A. C. 2012. Violence <strong>and</strong> economic development in Colombian cities: a dynamic panel data analysis. Journal of<br />
International Development, Vol. 24, No. 7, pp. 809–27.<br />
Pucher, J. <strong>and</strong> Buehler, R. 2008. Making cycling irresistible: lessons from the Netherl<strong>and</strong>s, Denmark <strong>and</strong> Germany.<br />
Transport Reviews, Vol. 28, No. 4, pp. 495–528.<br />
Pucher, J., Dill, J. <strong>and</strong> H<strong>and</strong>y, S. 2010. Infrastructure, programs, <strong>and</strong> policies to increase bicycling: an international<br />
review. Preventive Medicine, Vol. 50, pp. s106–25.<br />
Pucher, J., Peng, Z.-R., Mittal, N., Zhu, Y. <strong>and</strong> Korattyswaroopam, N. 2007. Urban transport trends <strong>and</strong> policies in China<br />
<strong>and</strong> India: impacts of rapid economic growth. Transport Reviews, Vol. 27, No. 4, pp. 379–410.<br />
Ramanathan, S. 2013. Where are the Planners? Bangalore, India, Jana Urban Space Foundation.<br />
Robers, S., Zhang, A., Morgan, R. <strong>and</strong> Musu-Gillette, L. 2015. Indicators of School Crime <strong>and</strong> Safety: 2014. Washington, DC,<br />
National Center for Education Statistics, U.S. Department of Education/Bureau of Justice Statistics, Office of<br />
Justice Programs, U.S. Department of Justice.<br />
Rothstein, R. 2015. The racial achievement gap, segregated schools, <strong>and</strong> segregated neighborhoods: a constitutional<br />
insult. Race <strong>and</strong> Social Problems, Vol. 7, No. 1, pp. 21–30.<br />
Rothstein, R. <strong>and</strong> Santow, M. 2012. A Different Kind of Choice: Educational Inequality <strong>and</strong> the Continuing Significance of Racial<br />
Segregation. Washington, DC, Economic Policy Institute. (Working paper.)<br />
Rotmans, J., van Asselt, M. <strong>and</strong> Vellinga, P. 2000. An integrated planning tool for sustainable cities. Environmental Impact<br />
Assessment Review, Vol. 20, No. 3, pp. 265–76.<br />
Shack/Slum Dwellers International, The National Slum Dwellers Federation of Ug<strong>and</strong>a <strong>and</strong> ACTogether Ug<strong>and</strong>a. 2016.<br />
Ug<strong>and</strong>a Education Access. Cape Town/Kampala, Shack/Slum Dwellers International/The National Slum Dwellers<br />
Federation of Ug<strong>and</strong>a/ACTogether Ug<strong>and</strong>a. (Analysis provided to the GEM Report team; unpublished.)<br />
Shi, L. 2008. Rural Migrant Workers in China: Scenario, Challenges <strong>and</strong> Public Policy. Geneva, Switzerl<strong>and</strong>, International<br />
Labour Organization.<br />
564<br />
REFERENCES
Sirin, S. R. <strong>and</strong> Rogers-Sirin, L. 2015. The Educational <strong>and</strong> Mental Health Needs of Syrian Refugee Children. Washington, DC,<br />
Migration Policy Institute.<br />
Steinberg, F. <strong>and</strong> Mir<strong>and</strong>a Sara, L. 2000. The Peru Urban Management Education Programme (PEGUP): linking capacity<br />
building with local realities. Habitat International, Vol. 24, No. 4, pp. 417–31.<br />
Strang, D. 1987. The administrative transformation of American education: school district consolidation, 1938–1980.<br />
Administrative Science Quarterly, Vol. 32, pp. 352–66.<br />
Szulkin, R. <strong>and</strong> Jonsson, J. O. 2007. Ethnic Segregation <strong>and</strong> Educational Outcomes in Swedish Comprehensive Schools.<br />
Stockholm, Linnaeus Center for Integration Studies, Stockholm University. (SULCIS Working Paper 2.)<br />
The Economist Intelligence Unit. 2012. Hot Spots: Benchmarking Global City Competitiveness. London, The Economist.<br />
The Lauder Institute. 2014. The Lauder Global Business Insight Report 2014: Rebalancing the Global Economy. Philadelphia,<br />
PA, Lauder Institute, Wharton, University of Pennsylvania.<br />
Tyack, D. B. <strong>and</strong> Hansot, E. 1982. Managers of Virtue: Public school leadership in America, 1820–1980. New York, Basic Books.<br />
UN Habitat. 2009a. Global Report on Human Settlements 2009: Planning Sustainable Cities. Nairobi, United Nations Human<br />
Settlements Programme.<br />
___. 2009b. State of the World’s Cities 2008/2009: Harmonious Cities. Nairobi, United Nations Human Settlements<br />
Programme.<br />
___. 2013. Planning <strong>and</strong> Design for Sustainable Urban Mobility: Global Report on Human Settlements 2013. Nairobi, United<br />
Nations Human Settlements Programme.<br />
UNDESA. 2014. World Urbanization Prospects 2014. New York, United Nations, Department of Economic <strong>and</strong> Social<br />
Affairs.<br />
UNESCO. 2012. EFA Global Monitoring Report 2012: Youth <strong>and</strong> Skills – Putting Education to Work. Paris, UNESCO.<br />
___. 2014. EFA Global Monitoring Report 2013/4: Teaching <strong>and</strong> Learning – Achieving Quality for All. Paris, UNESCO.<br />
___. 2015. EFA Global Monitoring Report 2015: Education for All 2000–2015 –Achievements <strong>and</strong> Challenges. Paris, UNESCO.<br />
UNESCO <strong>and</strong> UNHCR. 2016. No More Excuses: Provide Education to All Forcibly Displaced People. Paris, UNESCO.<br />
(Background paper for Global Education Monitoring Report 2016.)<br />
UNESCO Institute for Lifelong Learning. 2015. UNESCO Global Network of Learning Cities: Guiding Documents. Hamburg,<br />
Germany, UNESCO Institute for Lifelong Learning.<br />
UNHCR. 2015. World at War: UNHCR Global Trends – Forced Displacement in 2014. Geneva, Switzerl<strong>and</strong>, United Nations<br />
High Commissioner For Refugees.<br />
United Nations. 2015. Transforming our world: the 2030 Agenda for Sustainable Development. New York, United Nations. (UN<br />
General Assembly Resolution 70/1.)<br />
Valdes-Cotera, R., Longworth, N., Lunardon, K., Wang, M., Jo, S. <strong>and</strong> Crowe, S. 2015. Unlocking the Potential of Urban<br />
Communities: Case Studies of Twelve Learning Cities. Hamburg/Seoul, UNESCO Institute for Lifelong Learning/<br />
National Institue for Lifelong Education of the Republic of Korea.<br />
Viteri, F. 2016. Spatial mapping for improved intra-urban education planning. (Background paper for Global Education<br />
Monitoring Report 2016.)<br />
Watson, V. 2011. Inclusive Urban Planning for the Working Poor: Planning Education Trends <strong>and</strong> Potential Shifts. Cambridge,<br />
MA, Women in Informal Employment: Globalizing <strong>and</strong> Organizing. (WIEGO Working Paper [Urban Policies] 21.)<br />
Watson, V. <strong>and</strong> Odendaal, N. 2012. Changing planning education in Africa: the role of the Association of African<br />
Planning Schools. Journal of Planning Education <strong>and</strong> Research, Vol. 33, No. 1, pp. 96–107.<br />
Wild, L., Booth, D., Cummings, C., Foresti, M. <strong>and</strong> Wales, J. 2015. Adapting Development: Improving Services to the Poor.<br />
London, Overseas Development Institute.<br />
World Bank. 2015. China: Rural Migrant Skills Development <strong>and</strong> Employment Project. Washington, DC, World Bank.<br />
World Bank <strong>and</strong> China Development Research Center of the State Council. 2014. Urban China: Toward Efficient, Inclusive,<br />
<strong>and</strong> Sustainable Urbanization. Washington, DC, World Bank.<br />
World Economic Forum. 2014. The Global Competitiveness Report 2014–2015. Geneva, Switzerl<strong>and</strong>, World Economic Forum.<br />
Yigitcanlar, T. 2014. Position paper: benchmarking the performance of global <strong>and</strong> emerging knowledge cities. Expert<br />
Systems with Applications, Vol. 41, No. 12, pp. 5549–59.<br />
Yigitcanlar, T., Baum, S. <strong>and</strong> Horton, S. 2007. Attracting <strong>and</strong> retaining knowledge workers in knowledge cities. Journal of<br />
Knowledge Management, Vol. 11, No. 5, pp. 6–17.<br />
2016 • GLOBAL EDUCATION MONITORING REPORT 565
Chapter 6<br />
Action Aid. 2013. Give Us A Break: How Big Companies Are Getting Tax-free Deals. Johannesburg, South Africa, Action Aid.<br />
___. 2016. Domestic Tax <strong>and</strong> Education. Johannesburg, South Africa, Action Aid. (ActionAid Research Report for<br />
International Commission on Financing Global Education.)<br />
Alesina, A. <strong>and</strong> Dollar, D. 2000. Who gives foreign aid to whom <strong>and</strong> why? Journal of Economic Growth, Vol. 5, No. 1, pp. 33–63.<br />
An<strong>and</strong>, R., Coady, D. P., Mohommad, A., Thakoor, V. J. <strong>and</strong> Walsh, J. P. 2013. The Fiscal <strong>and</strong> Welfare Impacts of Reforming<br />
Fuel Subsidies in India. Washington, DC, International Monetary Fund. (13/128.)<br />
Ansah, S. K. <strong>and</strong> Ernest, K. 2013. Technical <strong>and</strong> vocational education <strong>and</strong> training in Ghana: a tool for skill acquisition<br />
<strong>and</strong> industrial development. Journal of Education <strong>and</strong> Practice, Vol. 4, No. 16, pp. 172–80.<br />
Antonio, E., Ofei-Manu, P. <strong>and</strong> Hoiberg Olsen, S. 2014. Achieving Sustainable Development Goals (SDGs) Through<br />
Transformative Governance Practices <strong>and</strong> Vertical Alignment at the National <strong>and</strong> Subnational Levels in Asia Pacific.<br />
Nairobi, Sharing Tools in Planning for Sustainable Development, Asia Pacific Regional Workshop, 7–9 April.)<br />
Arze del Granado, F. J., Coady, D. <strong>and</strong> Gillingham, R. 2012. The unequal benefits of fuel subsidies: a review of evidence<br />
for developing countries. World Development, Vol. 40, No. 11, pp. 2234–48.<br />
Baird, S. J., Garfein, R. S., McIntosh, C. T. <strong>and</strong> Özler, B. 2012. Effect of a cash transfer programme for schooling on prevalence<br />
of HIV <strong>and</strong> herpes simplex type 2 in Malawi: a cluster r<strong>and</strong>omised trial. The Lancet, Vol. 379, No. 9823, pp. 1320–29.<br />
Banerjee, A., Duflo, E., Goldberg, N., Karlan, D., Osei, R., Parienté, W., Shapiro, J., Thuysbaert, B. <strong>and</strong> Udry, C. 2015. A<br />
multifaceted program causes lasting progress for the very poor: evidence from six countries. Science, Vol. 348,<br />
No. 6236.<br />
Batley, R., Cabral, L. <strong>and</strong> Souza, C. 2007. Sector Wide Approaches in Brazil: Features, Drivers <strong>and</strong> Emerging Lessons. London,<br />
Overseas Development Institute.<br />
Belgian Survival Fund <strong>and</strong> IFAD. 2009. IFAD/Belgian Survival Fund Joint Programme: 25 Years of Cooperation. Rome, Belgian<br />
Survival Fund Joint Programme/International Fund for Agricultural Development.<br />
Bovill, C. 2009. Rhetoric or reality? Cross-sector policy implementation at the UK government Department for<br />
International Development. Policy & Politics, Vol. 37, No. 2, pp. 179–99.<br />
Capra International Inc. 2014. Global <strong>and</strong> Thematic Evaluation of the Millennium Development Goals Achievement Fund: Final<br />
Evaluation Report. Cumberl<strong>and</strong>, ON, Capra International Inc.<br />
Chabbott, C. 2014. Institutionalizing Health <strong>and</strong> Education for All: Global Goals, Innovations, <strong>and</strong> Scaling Up. New York,<br />
Teachers College Press.<br />
Chapman, J. 2004. System Failure: Why Governments Must Learn to Think Differently. London, Demos.<br />
Claessens, S., Cassimon, D. <strong>and</strong> Van Campenhout, B. 2009. Evidence on changes in aid allocation criteria. World Bank<br />
Economic Review, Vol. 23, No. 2, pp. 185–208.<br />
Clements, B. J., Coady, D., Fabrizio, S., Gupta, S., Alleyne, T. S. C. <strong>and</strong> Sdralevich, C. A. 2013. Energy Subsidy Reform: Lessons<br />
<strong>and</strong> Implications. Washington, DC, International Monetary Fund.<br />
Coady, D. P., Parry, I., Sears, L. <strong>and</strong> Shang, B. 2015. How Large Are Global Energy Subsidies? Washington, DC, International<br />
Monetary Fund. (Working Paper, WP/15/105.)<br />
de Moura Castro, C. <strong>and</strong> Musgrove, P. 2007. On the Nonexistence of “The Social Sector” or Why Education <strong>and</strong> Health Are<br />
More Different than Alike. Washington, DC, World Bank. (Working Paper 40385.)<br />
Development Finance International. 2016. Integrated financial planning <strong>and</strong> “SDG Readiness” in the education sector.<br />
(Background paper for Global Education Monitoring Report 2016.)<br />
Development Finance International <strong>and</strong> Oxfam. 2015. Financing the Sustainable Development Goals: Lessons from<br />
Government Spending on the MDGs. London, Development Finance International/Oxfam. (Government Spending<br />
Watch Report.)<br />
Earth Institute. 2015. Scaling Up Efforts to Achieve the Millennium Development Goals: The Conditional Grants Scheme to<br />
Local Government Area Track in Nigeria. New York, Center for Sustainable Development, Earth Institute, Columbia<br />
University. (Working Policy Paper.)<br />
566<br />
REFERENCES
Fehling, M., Nelson, B. D. <strong>and</strong> Venkatapuram, S. 2013. Limitations of the Millennium Development Goals: a literature<br />
review. Global Public Health, Vol. 8, No. 10, pp. 1109–22.<br />
FHI 360. 2015. Integration of Global Health <strong>and</strong> Other Development Sectors: A Review of the Evidence. Washington, DC, FHI<br />
360.<br />
Fjeldstad, O. <strong>and</strong> Heggstad, K. 2012. Building Taxpayer Culture in Mozambique, Tanzania <strong>and</strong> Zambia: Achievements,<br />
Challenges <strong>and</strong> Policy Recommendations. Bergen, Norway, NORAD <strong>and</strong> CHR. Michelsen Institute.<br />
Gavas, M., Gulrajani, N. <strong>and</strong> Hart, T. 2015. Designing the Development Agency of the Future. London, Overseas Development<br />
Institute.<br />
Ginsburg, M. 2012. Public-private partnerships <strong>and</strong> the global reform of education in less wealthy countries: a<br />
moderated discussion. Comparative Education Review, Vol. 56, No. 1, pp. 155–75.<br />
GPE. 2016. GPE Strategic Plan 2016–2020: GPE 2020 – Improving Learning <strong>and</strong> Equity Through Stronger Education Systems.<br />
Washington, DC, Global Partnership for Education.<br />
Gulrajani, N. 2016. Bilateral Versus Multilateral Aid Channels: Strategic Choices For Donors. London, Overseas Development<br />
Institute.<br />
Guyatt, H. 2003. The cost of delivering <strong>and</strong> sustaining a control programme for schistosomiasis <strong>and</strong> soil-transmitted<br />
helminthiasis. Acta Tropica, Vol. 86, No. 2, pp. 267–74.<br />
Hazlewood, P. 2015. Global Multi-Stakeholder Partnerships: Scaling up Public-Private Collective Impact for the SDGs.<br />
Washington, DC, World Resources Institute. (Background Paper 4.)<br />
Hong, L. <strong>and</strong> Page, S. E. 2004. Groups of diverse problem solvers can outperform groups of high-ability problem<br />
solvers. Proceedings of the National Academy of Sciences of the United States of America, Vol. 101, No. 46, pp. 16385–89.<br />
ILO. 2013. Youth Employment <strong>and</strong> Migration: A Review of Practices from Joint Programmes of the United Nations. Geneva,<br />
Switzerl<strong>and</strong>, International Labour Organization.<br />
IMF. 2013a. Fiscal Monitor: Taxing Times. Washington, DC, International Monetary Fund.<br />
___. 2013b. Reforming Energy Subsidies: Summary Note. Washington, DC, International Monetary Fund.<br />
___. 2014. Spillovers in International Corporate Taxation. Washington, DC, International Monetary Fund.<br />
Independent Evaluation Group. 2009. Improving Effectiveness <strong>and</strong> Outcomes for the Poor in Health, Nutrition <strong>and</strong><br />
Population: An Evaluation of World Bank Group Support Since 1997. Washington, DC, World Bank.<br />
___. 2010. World Bank Engagement at the State Level: The Cases of Brazil, India, Nigeria <strong>and</strong> the Russian Federation.<br />
Washington, DC, World Bank.<br />
Iyengar, R., Mahal, A. R., Aklilu, L., Sweetl<strong>and</strong>, A., Karim, A., Shin, H., Aliyu, B., Park, J. E., Modi, V. <strong>and</strong> Berg, M. 2014.<br />
The use of technology for large-scale education planning <strong>and</strong> decision-making. Information Technology for<br />
Development, Vol. 22, No. 3.<br />
Iyengar, R., Mahal, A. R., Felicia, U.-N. I., Aliyu, B. <strong>and</strong> Karim, A. 2015. Federal policy to local level: data-driven education<br />
planning in Nigeria. International Education Journal: Comparative Perspectives, Vol. 14, No. 3, pp. 76–93.<br />
Jacobs, R. 1964. The inter-disciplinary approach to educational planning. Comparative Education Review, Vol. 8, No. 1, pp.<br />
17–27.<br />
Kania, J. <strong>and</strong> Kramer, M. 2011. Collective impact. Stanford Social Innovation Review, Vol. 9, No. 1, p. 104.<br />
Kar, D. <strong>and</strong> Spanjers, J. 2015. Illicit Financial Flows from Developing Countries: 2004–2013. Washington, DC, Global Financial<br />
Integrity.<br />
Kenny, L. <strong>and</strong> Winer, S. 2006. Tax systems in the world: an empirical investigation into the importance of tax bases,<br />
administration costs, scale <strong>and</strong> political regime. International Tax <strong>and</strong> Public Finance, Vol. 13, pp. 181–215.<br />
Killen, B. <strong>and</strong> Rogerson, A. 2010. Global Governance for International Development: Who’s in Charge? Paris, Organisation for<br />
Economic Co-operation <strong>and</strong> Development.<br />
Krishnaratne, S., White, H. <strong>and</strong> Carpenter, E. 2013. Quality Education for All Children? What Works in Education in Developing<br />
Countries. New Delhi, International Initiative for Impact Evaluation (3ie). (Working Paper 20.)<br />
Lagarde, C. 2016. Revenue Mobilization <strong>and</strong> International Taxation: Key Ingredients of 21st-Century Economies. Washington,<br />
DC, International Monetary Fund.<br />
Latek, M. 2015. Policy Coherence for Development: Still Some Way to Go, European Parliamentary Research Service,<br />
European Union. (Briefing.)<br />
Le Blanc, D. 2015. Towards Integration at Last? The Sustainable Development Goals as a Network of Targets. New York, United<br />
Nations, Department of Economic & Social Affairs. (DESA Working Paper 141.)<br />
2016 • GLOBAL EDUCATION MONITORING REPORT 567
Lucci, P., Surasky, J. <strong>and</strong> Gamba, C. 2015. Getting Ready for SDG Implementation in Latin America: The Example of Colombia.<br />
London/Bogotá, Overseas Development Institute/Centro de Pensamiento Estrategico Internacional.<br />
Lustig, N. 2015. The Redistributive Impact of Government Spending on Education <strong>and</strong> Health: Evidence from Thirteen Developing<br />
Countries in the Commitment to Equity Project. New Orleans, LA, Commitment to Equity Project, Tulane University.<br />
(Commitment to Equity Working Paper 30.)<br />
Malaysia Economic Planning Unit. 2009. Transforming Technical <strong>and</strong> Vocational Education <strong>and</strong> Training to Meet Industry<br />
Dem<strong>and</strong>. Putrajaya, Malaysia, Malaysia Economic Planning Unit, Prime Minister’s Department.<br />
Marope, P. T. M., Chakroun, B. <strong>and</strong> Holmes, K. 2015. Unleashing the Potential: Transforming Technical <strong>and</strong> Vocational<br />
Education <strong>and</strong> Training. Paris, UNESCO.<br />
Mercer, M. 2014. Donor policies, practices <strong>and</strong> investment priorities in support of education, <strong>and</strong> post-2015 prospects:<br />
a review. International Journal of Educational Development, Vol. 39, pp. 23–31.<br />
Merrill, L. <strong>and</strong> Chung, V. 2014. Financing the Sustainable Development Goals Through Fossil-Fuel Subsidy Reform:<br />
Opportunities in Southeast Asia, India <strong>and</strong> China. Winnpeg, MB/Geneva, Switzerl<strong>and</strong>/Singapore, International<br />
Institute for Sustainable Development/Global Subsidies Initiative/Asia-Europe Foundation.<br />
Moksnes, H. <strong>and</strong> Melin, M. 2012. Global Civil Society: Shifting Powers in a Shifting World. Upssala, Sweden, Uppsala Centre<br />
for Sustainable Development.<br />
Mutascu, M. <strong>and</strong> Danuletiu, D. 2013. The literacy impact on tax revenues. Economic Discussion Papers, Vol. No. 2013–63.<br />
Naylor, R. <strong>and</strong> Ndarhutse, S. 2015. Non-government organizations as donors to education. (Background paper for EFA Global<br />
Monitoring Report 2015.)<br />
Nordtveit, B. H. 2008. Poverty alleviation <strong>and</strong> integrated service delivery: literacy, early child development <strong>and</strong> health.<br />
International Journal of Educational Development, Vol. 28, No. 4, pp. 405–18.<br />
ODI. 2016. Education Cannot Wait: Proposing a Fund for Education in Emergencies. London, Overseas Development Institute.<br />
OECD-DAC. 2016. International Development Statistics: Creditor Reporting System. (Database.) Paris, Organisation for<br />
Economic Co-operation <strong>and</strong> Development, Development Assistance Committee. www.oecd.org/development/<br />
stats/idsonline.htm. (Accessed 2 June 2016.)<br />
OECD. 2013a. Investing Together: Working Effectively Across Levels of Government. Paris, Organisation for Economic Cooperation<br />
<strong>and</strong> Development<br />
___. 2013b. What Drives Tax Morale? Paris, Organisation for Economic Co-operation <strong>and</strong> Development<br />
___. 2015a. Building Tax Culture, Compliance <strong>and</strong> Citizenship: A Global Source Book on Taxpayer Education. Paris, Organisation<br />
for Economic Co-operation <strong>and</strong> Development.<br />
___. 2015b. Development Cooperation Report 2015: Making Partnerships Effective Coalitions for Action. Paris, Organisation for<br />
Economic Co-operation <strong>and</strong> Development.<br />
___. 2015c. Framework for Policy Coherence for Sustainable Development (PCSD). Paris, Organisation for Economic Cooperation<br />
<strong>and</strong> Development.<br />
___. 2015d. Integrating Social Services for Vulnerable Groups: Bridging Sectors for Better Service Delivery. Paris, Organisation<br />
for Economic Co-operation <strong>and</strong> Development.<br />
___. 2015e. OECD Development Co-operation Peer Reviews: Germany 2015. Paris, Organisation for Economic Co-operation<br />
<strong>and</strong> Development.<br />
___. 2015f. Policy Coherence for Development <strong>and</strong> the Sustainable Development Goals: Concept Note. Paris, Organisation for<br />
Economic Co-operation <strong>and</strong> Development.<br />
Oslo Summit on Education for Development. 2015. Chair’s Statement: The Oslo Declaration. Paper presented at the<br />
Education For Development Summit, 6 to 7 July, Oslo, Norwegian Ministry of Foreign Affairs.<br />
Patrinos, H. A., Osorio, F. B. <strong>and</strong> Guáqueta, J. 2009. The Role <strong>and</strong> Impact of Public-Private Partnerships in education.<br />
Washington, DC, World Bank.<br />
Persaud, A. 2016. Integrated planning for education <strong>and</strong> development. (Background paper for Global Education Monitoring<br />
Report 2016.)<br />
Phillips, J. 2009. Restoring Confidence <strong>and</strong> Increasing Responsiveness in State <strong>and</strong> Local Government through Condtiional<br />
Grants: The Experience of Nigeria. Washington, DC, Office of the Senior Special Assistant to the President on the<br />
MDGs, Nigeria.<br />
Pingeot, L. 2014. Corporate Influence in the Post-2015 Process. Aachen, Germany, Bischöfliches Hilfswerk Misereor.<br />
(Working Paper 3943126129.)<br />
568<br />
REFERENCES
Prichard, W. 2010. Taxation <strong>and</strong> State Building: Towards a Governance Focused Tax Reform Agenda. Brighton, United<br />
Kingdom, Institute of Development Studies, University of Sussex. (IDS Working Paper 341.)<br />
Profeta, P. <strong>and</strong> Scabrosetti, S. 2010. The Political Economy of Taxation: Lessons from Developing Countries. Cheltenham, UK/<br />
Northampton, MA, Edward Elgar Publishing.<br />
Reinsberg, B., Michaelowa, K. <strong>and</strong> Eichenauer, V. Z. 2015. The rise of multi-bi aid <strong>and</strong> the proliferation of trust funds. B.<br />
M. Arvin <strong>and</strong> B. Lew (eds), H<strong>and</strong>book on the Economics of Foreign Aid. Cheltenham, UK/Northampton, MA, Edward<br />
Elgar Publishing, pp. 527–54.<br />
Remme, M., Vassall, A., Lutz, B. <strong>and</strong> Watts, C. 2012. Paying girls to stay in school: a good return on HIV investment? The<br />
Lancet, Vol. 379, No. 9832, p. 2150.<br />
Results for Development <strong>and</strong> Universalia. 2015. Independent Interim Evaluation of the Global Partnership for Education:<br />
Volume I – Final Evaluation Report. Washington, DC, Results for Development/Universalia.<br />
Robertson, S. L. <strong>and</strong> Verger, A. 2012. Governing education through public private partnerships. S. L. Robertson, K.<br />
Mundy, A. Verger <strong>and</strong> F. Menashy (eds), Public Private Partnerships in Education: New Actors <strong>and</strong> Modes of Governance<br />
in a Globalizing World. Cheltenham, UK, Edward Elgar Publishing, pp. 21–42.<br />
Runde, D., Savoy, C. <strong>and</strong> Perkins, C. 2014. Taxes <strong>and</strong> Development: The Promise of Domestic Resource Mobilization. New York,<br />
Center for Strategic & International Studies.<br />
Sachs, J. <strong>and</strong> Schmidt-Traub, G. 2014. Financing Sustainable Development: Implementing the SDGs through Effective<br />
Investment Strategies <strong>and</strong> Partnerships. New York, Sustainable Development Solutions Network.<br />
Samoff, J., Leer, J. <strong>and</strong> Reddy, M. 2016. Capturing Complexity <strong>and</strong> Context: Evaluating Aid to Education. Stockholm, Expert<br />
Group For Aid Studies.<br />
S<strong>and</strong>er, F. G., Jalil, I. N., Ali, R., Lathapipat, D., Jithitikulchai, T., Taglioni, D., Testaverde, M., Ozier, O., Ozden, C. <strong>and</strong> del<br />
Carpio, X. 2013. Malaysia Economic Monitor: High-Performing Education. Washington, DC, World Bank.<br />
Schmidt-Traub, G. 2015. Investment Needs to Achieve the Sustainable Development Goals. Paris <strong>and</strong> New York, Sustainable<br />
Development Solutions Network.<br />
Shafiq, M. N. 2015. Aspects of moral change in India, 1990–2006: evidence from public attitudes toward tax evasion<br />
<strong>and</strong> bribery. World Development, Vol. 68, pp. 136–48.<br />
South Africa National Planning Commission. 2012. National Development Plan 2030: Our Future – Make it Work. Pretoria,<br />
South Africa, National Planning Commission.<br />
Steer, L. <strong>and</strong> Smith, K. 2015. Financing Education: Opportunities for Global Action. Washington, DC, Center for Universal<br />
Education, Brookings Institution.<br />
Strawson, T., Beecher, J., Hills, R., Ifan, G., Knox, D., Lonsdale, C., Osborne, A., Tew, R., Townsend, I. <strong>and</strong> Walton, D. 2015.<br />
Improving ODA Allocation for a Post-2015 World: Targeting Aid to Benefit the Poorest 20% of People in Developing<br />
Countries. London/New York, Development Initiatives/United Nations/UK Aid.<br />
Strawson, T. <strong>and</strong> Ifan, G. 2016. Aiding Domestic Revenue Mobilisation. Bristol, UK, Development Initiatives.<br />
Sumida, S. 2016. Foreign aid motivation in the basic education sector: what drives donors to provide education aid?<br />
Hiroshima, Japan, Hiroshima University. (Unpublished.)<br />
Sustainable Development Goals Fund. 2016. Sustainable Development Goals Fund: About Us. New York, Sustainable<br />
Development Goals Fund. www.sdgfund.org/about-us (Accessed 4 June 2016.)<br />
Tobias, J., Wales, J., Syamsulhakim, E. <strong>and</strong> Suharti. 2014. Towards Better Education Quality: Indonesia’s Promising Path.<br />
London, Overseas Development Institute.<br />
Trocaire. 2013. Achieving Policy Coherence for Development through a Whole of Government Approach. Dublin, Trocaire.<br />
(Briefing Paper.)<br />
UNCTAD. 2015. World Investment Report 2015: Reforming International Investment Governance. Geneva, United Nations<br />
Conference on Trade <strong>and</strong> Development.<br />
UNDP. 2013. From Global Agenda to National Action: Intersectoriality, National Ownership <strong>and</strong> “ONE UN” – the MDG<br />
Achievement Fund at Work. New York, United Nations Development Programme.<br />
UNESCO. 2002. FRESH: A Comprehensive School Health Approach to Achieve EFA. Paris, UNESCO. http://unesdoc.unesco.<br />
org/images/0012/001255/125537e.pdf. (Accessed 6 January 2016.)<br />
___. 2015a. EFA Global Monitoring Report 2015: Education for All 2000–2015 –Achievements <strong>and</strong> Challenges. Paris, UNESCO.<br />
___. 2015b. Pricing the Right to Education: The Cost of Reaching New Targets by 2030. Paris, UNESCO.<br />
___. 2016a. Aid to Education Stagnates, Jeopardising Global Targets. Paris, UNESCO.<br />
2016 • GLOBAL EDUCATION MONITORING REPORT 569
___. 2016b. Education 2030 Incheon Declaration <strong>and</strong> Framework for Action. Paris/New York/Washington, DC, Geneva,<br />
Switzerl<strong>and</strong>, UNESCO/UNDP/UNFPA/UNHCR/UNICEF/UN Women/World Bank/International Labour Organization.<br />
___. 2016c. Untitled final EFA Coordination Mechanism evaluation report. Paris, Internal Oversight Service, UNESCO.<br />
UNESCO, UNICEF <strong>and</strong> World Food Programme. 2013. Nourishing Bodies, Nourishing Minds: Partnering for the Child’s Wellbeing<br />
<strong>and</strong> Equity in Education. New York, UNICEF.<br />
UNICEF. 2012. Integrated Social Protection Systems: Enhancing Equity for Children. New York, UNICEF.<br />
UNIDO <strong>and</strong> UN Global Compact. 2014. Engaging with the Private Sector in the Post-2015 Agenda: Consolidated Report<br />
on 2014 Consultations. New York, United Nations Industrial Development Organization/United Nations Global<br />
Compact.<br />
United Nations. 2014. United Nations E-Government Survey 2014: E-Government for the Future We Want. New York, United<br />
Nations, Department of Economic <strong>and</strong> Social Affairs.<br />
___. 2015a. Addis Ababa Action Agenda of the Third International Conference on Financing for Development. Addis Ababa,<br />
United Nations.<br />
___. 2015b. Partnerships For Sustainable Development Goals: a Legacy Review Towards Realizing the 2030 Agenda. New York,<br />
United Nations.<br />
___. 2015c. Transforming our world: the 2030 Agenda for Sustainable Development. New York, United Nations. (General<br />
Assembly Resolution 70/1.)<br />
Urama, K., Ozor, N. <strong>and</strong> Acheampong, E. 2014. Achieving Sustainable Development Goals (SDGs) Through Transformative<br />
Governance Practices <strong>and</strong> Vertical Alignment at the National <strong>and</strong> Subnational Levels in Africa. Nairobi, Sharing Tools in<br />
Planning for Sustainable Development. (Africa Regional Workshop, 3–5 March.)<br />
Welham, B., Hedger, E. <strong>and</strong> Krause, P. 2015. Linkages between Public Sector Revenues <strong>and</strong> Expenditures in Developing<br />
Countries. London, Overseas Development Institute.<br />
World Bank. 2013. Malaysia Workforce Development: SABER Country Report 2013. Washington, DC, World Bank. (Systems<br />
Approach for Better Education Results [SABER] Country Report.)<br />
___. 2016. Early Childhood Development Ratings <strong>and</strong> Data. (Database.) Washington, DC, World Bank. http://saber.<br />
worldbank.org/index.cfm?indx=4&pd=6&sub=0. (Accessed 17 May 2016.)<br />
World Economic Forum. 2014. The Global Competitiveness Report 2014–2015. Geneva, Switzerl<strong>and</strong>, World Economic Forum.<br />
World Food Programme. 2009. Home-Grown School Feeding: A Framework to Link School Feeding with Local Agricultural<br />
Production. Rome, World Food Programme.<br />
___. 2013. State of School Feeding Worldwide 2013. Rome, World Food Programme.<br />
Zamba, C. <strong>and</strong> Oboh, V. 2013. Effective Partnerships for Accelerating the Millennium Development Goals (MDGs) at the<br />
Sub-national Level: Evidence from the Implementation of Nigeria’s Conditional Grant Scheme (CGS). New York, United<br />
Nations Development Programme. (UNDP Working Paper 1.)<br />
Chapter 7<br />
Barakat, B., Cuaresma, J. C., Samir, K. C., <strong>and</strong> Striessing, E. 2016. Modelling SDG scenarios for educational attainment <strong>and</strong><br />
development. (Background paper for Global Education Monitoring Repor 2016.)<br />
CRED. 2010. EM-DAT International Disaster Database. Brussels, Centre for Research on the Epidemiology of Disasters,<br />
Louvain Catholic University.<br />
IPCC. 2014. Climate Change 2014. Synthesis Report. Contribution of Working Groups I, II <strong>and</strong> III to the Fifth Assessment Report of<br />
the Intergovernmental Panel on Climate Change. Geneva, Switzerl<strong>and</strong>, Intergovernmental Panel on Climate Change.<br />
Krueger, A. B. <strong>and</strong> Lindahl, M. 2001. Education for growth: why <strong>and</strong> for whom? Journal of Economic Literature, Vol. 39, pp.<br />
1101–36.<br />
570<br />
REFERENCES
Lager, A. C. J. <strong>and</strong> Torss<strong>and</strong>er, J. 2012. Causal effect of education on mortality in a quasi-experiment on 1.2 million<br />
Swedes. Proceedings of the National Academy of Sciences, Vol. 109, pp. 8461–66.<br />
Lutz, W., Muttarak, R. <strong>and</strong> Striessing, E. 2014. Universal education is key to enhanced climate adaptation. Science, Vol.<br />
346, pp. 1061–62.<br />
Ravallion, M. 2012. Why don’t we see poverty convergence? American Economic Review, Vol. 102, No. 1, pp. 504–23.<br />
UNESCO. 2014. EFA Global Monitoring Report 2013/4: Teaching <strong>and</strong> Learning – Achieving Quality for All. Paris, UNESCO.<br />
___. 2015. How Long Will it Take to Achieve Universal Primary <strong>and</strong> Secondary Education? Technical Background Note for the<br />
Framework for Action on the post-2015 Education Agenda. Paris, UNESCO.<br />
Chapters 9-23<br />
Abdul-Hamid, H. 2016. Lessons from SABER as a Systems Approach. Paper for Making Systems Work: A Global Conference<br />
on Education Systems, Sydney, Australia, 29 February–2 March.<br />
Aboud, F. E. 2004. Evaluation of Early Childhood Preschool Programs of PLAN Bangladesh. Dhaka, Bangladesh ECD Network.<br />
ACARA. 2015. National Assessment Program: ICT Literacy Years 6 & 10 – 2014 Report. Sydney, Australia, Australian<br />
Curriculum <strong>and</strong> Reporting Authority.<br />
ACDP. 2014. Teacher Absenteeism in Indonesia. Jakarta, Education Sector Analytical <strong>and</strong> Capacity Development<br />
Partnership.<br />
Action, P. 2013. Poor People’s Energy Outlook 2013: Energy for Community Services. Rugby, UK, Practical Action Publishing.<br />
Adams, J., Bartram, J., Chartier, Y. <strong>and</strong> Sims, J. 2009. Water, Sanitation <strong>and</strong> Hygiene St<strong>and</strong>ards for Schools in Low-Cost<br />
Settings. Geneva, Switzerl<strong>and</strong>, World Health Organization.<br />
ADB. 2012. ICT in Education in Central <strong>and</strong> West Asia. Manila, Asian Development Bank.<br />
Ainley, J., Schulz, W. <strong>and</strong> Fraillon, J. 2016. A global measure of digital <strong>and</strong> ICT literacy skills. (Background paper for Global<br />
Education Monitoring Report 2016.)<br />
Akar, B. 2016. Developing a monitoring instrument to measure extracurricular <strong>and</strong> non-formal activities which promote Global<br />
Citizenship Education (GCED) <strong>and</strong> Education For Sustainable Development (ESD). (Background paper for Global<br />
Education Monitoring Report 2016.)<br />
Aker, J. C., Ksoll, C. <strong>and</strong> Lybbert, T. J. 2012. Can mobile phones improve learning? Evidence from a field experiment in<br />
Niger. American Economic Journal: Applied Economics, Vol. 4, No. 4, pp. 94–120.<br />
Albaugh, E. A. 2012. Language Policies in African States. Brunswick, ME, Department of Government <strong>and</strong> Legal Studies,<br />
Bowdoin College.<br />
___. 2015. State-Building <strong>and</strong> Multilingual Education in Africa. New York, Cambridge University Press.<br />
Alkema, L., Rou New, J., Pedersen, J. <strong>and</strong> You, D. 2014. Child mortality estimation 2013: an overview of updates in<br />
estimation methods by the United Nations Inter-agency Group for Child Mortality Estimation. PloS One, Vol. 9,<br />
No. 7, e101112.<br />
Altinok, N. 2012. General versus vocational education: some new evidence from PISA 2009. (Background paper for EFA Global<br />
Monitoring Report 2012.)<br />
Alves, T. <strong>and</strong> Pinto, J. M. R. 2011. Remuneração e características do trabalho docente no Brasil: um aporte<br />
[Compensation <strong>and</strong> characteristics of teaching in Brazil: a contribution]. Cadernos de Pesquisa, Vol. 41, No. 143, pp.<br />
606–39.<br />
Amin, G. 2014. Egypt Country Report: Policies <strong>and</strong> Mechanisms for Integration into the Workforce <strong>and</strong> Job Creation. Cairo,<br />
Egypt Ministry of Education.<br />
Amosa, D. U. 2012. Social Policies in Samoa. London, Commonwealth Secretariat <strong>and</strong> United Nations Research Institute<br />
for Social Development.<br />
2016 • GLOBAL EDUCATION MONITORING REPORT 571
Anderson, P. <strong>and</strong> Morgan, G. 2008. National Assessments of Educational Achievement: Volume 2 – Developing Tests <strong>and</strong><br />
Questionnaires for a National Assessment of Educational Achievement. Washington, DC, World Bank.<br />
Andrabi, T., Das, J., Khwaja, A. I., Vishwanath, T. <strong>and</strong> Zajonc, T. 2008. Pakistan: Learning <strong>and</strong> Educational Achievements in<br />
Punjab Schools (LEAPS) – Insights to Inform the Education Policy Debate. Washington, DC, World Bank.<br />
Andreas, R. <strong>and</strong> Michael, F. 2007. Let’s put the person back into entrepreneurship research: a meta-analysis on the<br />
relationship between business owners’ personality traits, business creation, <strong>and</strong> success. European Journal of<br />
Work <strong>and</strong> Organizational Psychology, Vol. 16, No. 4, pp. 353–85.<br />
Araujo, M. C., López-Boo, F., Novella, R., Schodt, S. <strong>and</strong> Tomé, R. 2015. The Quality of Centros Infantiles del Buen Vivir in<br />
Ecuador. Washington, DC, Inter-American Development Bank. (Policy Brief IDB-PB-248.)<br />
Arora, G. L., Koehler, W. <strong>and</strong> Reich, B. 1994. International education past <strong>and</strong> present. B. Reich <strong>and</strong> V. Pivovarov (eds),<br />
International Practical Guide on the Implementation of the Recommendation concerning Education for International<br />
Underst<strong>and</strong>ing, Co-operation <strong>and</strong> Peace <strong>and</strong> Education relating to Human Rights <strong>and</strong> Fundamental Freedoms. Paris,<br />
UNESCO, pp. 11–17.<br />
ASSI. 2015. ASEAN Safe Schools Initiative: A Compilation of Case Studies. Jakarta, ASEAN Safe Schools Initiative.<br />
Atkinson, A. <strong>and</strong> Messy, F.-A. 2012. Results of the OECD/International Network on Financial Education (INFE) Pilot Study.<br />
Paris, Organisation for Economic Co-operation <strong>and</strong> Development.<br />
Australian Curriculum Assessment <strong>and</strong> Reporting Authority. 2011. National Assessment Program: Civics <strong>and</strong> Citizenship<br />
Years 6 <strong>and</strong> 10 – Report 2010. Sydney, Australian Curriculum, Assessment <strong>and</strong> Reporting Authority.<br />
Baay, P. E., de Ridder, D. T. D., Eccles, J. S., van der Lippe, T. <strong>and</strong> van Aken, M. A. G. 2014. Self-control trumps work<br />
motivation in predicting job search behavior. Journal of Vocational Behavior, Vol. 85, No. 3, pp. 443–51.<br />
Balfour, S. 2016. SDG target 4b: a global measure of scholarships. (Background paper for Global Education Monitoring Report<br />
2016.)<br />
Ball, J. 2011. Enhancing Learning of Children From Diverse Language Backgrounds: Mother Tongue-Based Bilingual or<br />
Multilingual Education in the Early Years. Paris, UNESCO.<br />
Banerji, R., Bhattacharjea, S. <strong>and</strong> Wadhwa, W. 2013. The annual status of education report (ASER). Research in<br />
Comparative <strong>and</strong> International Education, Vol. 8, No. 3, pp. 387–96.<br />
Bangladesh Directorate of Primary Education. 2014. Bangladesh Primary Education Annual Sector Performance Report 2014.<br />
Dhaka, Bangladesh Directorate of Primary Education.<br />
Barbour, A., Boyer, W., Hardin, B. <strong>and</strong> Wortham, S. 2004. From principle to practice: using the global guidelines<br />
to assess quality education <strong>and</strong> care. Childhood Education: Journal of the Association for Childhood Education<br />
International, Vol. 80, No. 6, pp. 327–31.<br />
Barker, G., Contreras, J. M., Heilman, B., Singn, A. K., Verma, R. K. <strong>and</strong> Nascimento, M. 2011. Evolving Men: Initial Results<br />
from the International Men <strong>and</strong> Gender Equality Survey. Washington, DC, International Center for Research on<br />
Women <strong>and</strong> Instituto Promundo.<br />
Barratt, E. S. 1985. Impulsiveness subtraits: arousal <strong>and</strong> information processing. J. T. Spence <strong>and</strong> C. E. Izard (eds),<br />
Motivation, Emotion <strong>and</strong> Personality. Amsterdam, Elsevier, pp. 137–46.<br />
Barrows, T. S., Clark, J. L. <strong>and</strong> Klein, S. F. 1981. How College Seniors Perceive their World. Princeton, NJ, Educational Testing<br />
Service. (ETS Research Report Series.)<br />
Bartlett, L., Dowd, A. J. <strong>and</strong> Jonason, C. 2015. Problematizing early grade reading: should the post-2015 agenda treasure<br />
what is measured? International Journal of Educational Development, Vol. 40, No. 2015, pp. 308–14.<br />
Baumeister, R. F., Vohs, K. D. <strong>and</strong> Tice, D. M. 2007. The strength model of self-control. Current Directions in Psychological<br />
Science, Vol. 16, No. 6, pp. 351–55.<br />
Bell, M., Charles-Edwards, E., Ueffing, P., Stillwell, J., Kupiszewski, M. <strong>and</strong> Kupiszewska, D. 2015. Internal migration <strong>and</strong><br />
development: comparing migration intensities around the world. Population <strong>and</strong> Development Review, Vol. 41, No. 1,<br />
pp. 33–58.<br />
Belyakov, A., Cremonini, L., Mfusi, M. <strong>and</strong> Rippner, J. 2009. The Effects of Transitions on Access to Higher Education.<br />
Washington, DC, Institute for Higher Education Policy.<br />
Benavot, A. <strong>and</strong> Köseleci, N. 2015. Seeking quality in education: the growth of national learning assessments 1990–2013.<br />
(Background paper for EFA Global Monitoring Report 2015.)<br />
Benhassine, N., Devoto, F., Duflo, E., Dupas, P. <strong>and</strong> Pouliquen, V. 2015. Turning a shove into a nudge? A “labeled cash<br />
transfer” for education. American Economic Journal: Economic Policy, Vol. 7, No. 3, pp. 86–125.<br />
572<br />
REFERENCES
Bennell, P. <strong>and</strong> Akyeampong, K. 2007. Teacher Motivation in Sub-Saharan Africa <strong>and</strong> South Asia. London, UK Department<br />
for International Development. (Educational Paper 71.)<br />
Benson, C. 2016. Addressing language of instruction issues in education: recommendations for documenting progress.<br />
(Background paper for Global Education Monitoring Report 2016.)<br />
Benveniste, L., Marshall, J. <strong>and</strong> Araujo, M. C. 2008. Teaching in Cambodia. Washington, DC, World Bank/Cambodia<br />
Ministry of Education, Youth <strong>and</strong> Sport.<br />
Best, M., Knight, P., Lietz, P., Lockwood, C., Nugroho, D. <strong>and</strong> Tobin, M. 2013. The Impact of National <strong>and</strong> International<br />
Assessment Programmes on Education Policy: Particularly Policies Regarding Resource Allocation <strong>and</strong> Teaching <strong>and</strong><br />
Learning Practices in Developing Countries – Final Report. London, EPPI-Centre, Social Science Research Unit,<br />
Institute of Education, University of London.<br />
Bhatkal, T. 2014. What Do Women Want? Gender, Perceptions Data <strong>and</strong> Development Priorities. London, Overseas<br />
Development Institute.<br />
Blackmur, D. 2015. Arguing with Stephanie Allais. Are national qualifications frameworks instruments of neoliberalism<br />
<strong>and</strong> social constructivism? Quality in Higher Education, Vol. 21, No. 2, pp. 213–28.<br />
Boe, E. E., Cook, L. H. <strong>and</strong> Sunderl<strong>and</strong>, R. J. 2008. Teacher turnover: examining exit attrition, teaching area transfer, <strong>and</strong><br />
school migration. Exceptional Children, Vol. 75, No. 1, pp. 7–31.<br />
Borghans, L., Duckworth, A. L., Heckman, J. J. <strong>and</strong> Ter Weel, B. 2008. The economics <strong>and</strong> psychology of personality<br />
traits. Journal of Human Resources, Vol. 43, No. 4, pp. 972–1059.<br />
Borkowsky, A. 2013. Monitoring Adult Learning Policies. Paris, Organisation for Economic Co-operation <strong>and</strong> Development.<br />
(Education Working Paper 88.)<br />
Borman, G. D. <strong>and</strong> Dowling, N. M. 2008. Teacher attrition <strong>and</strong> retention: A meta-analytic <strong>and</strong> narrative review of the<br />
research. Review of Educational Research, Vol. 78, No. 3, pp. 367–409.<br />
Bornstein, M. H. <strong>and</strong> Leventhal, T. 2015. Children in bioecological l<strong>and</strong>scapes of development. R. M. Lerner, M. H.<br />
Bornstein <strong>and</strong> T. Leventhal (eds), H<strong>and</strong>book of Child Psychology <strong>and</strong> Developmental Science, Vol. 4, pp. 1–5.<br />
Bourn, D., Hunt, F., Blum, N. <strong>and</strong> Lawson, H. 2016. Primary Education for Global Learning <strong>and</strong> Sustainability. York, UK,<br />
Cambridge Primary Review Trust. (CPRT Research Survey.)<br />
Bradley, R. H. <strong>and</strong> Caldwell, B. M. 1995. Caregiving <strong>and</strong> the regulation of child growth <strong>and</strong> development: describing<br />
proximal aspects of caregiving systems. Developmental Review, Vol. 15, No. 1, pp. 38–85.<br />
Brinkman, S. A., Hasan, A., Jung, H., Kinnell, A., Nakajima, N. <strong>and</strong> Pradhan, M. 2016. The Role of Preschool Quality in<br />
Promoting Child Development: Evidence from Rural Indonesia. Washington, DC, World Bank. (Policy Research Working<br />
Paper 7529.)<br />
Britto, P. R., Yoshikawa, H. <strong>and</strong> Boller, K. 2011. Quality of early childhood development programs in global contexts:<br />
rationale for investment, conceptual framework <strong>and</strong> implications for equity. Social Policy Report, Vol. 25, No. 2.<br />
Britto, P. R., Yoshikawa, H., van Ravens, J., Ponguta, L. A., Reyes, M., Oh, S., Dimaya, R., Nieto, A. M. <strong>and</strong> Seder, R. 2014.<br />
Strengthening systems for integrated early childhood development services: a cross-national analysis of<br />
governance. Annals of the New York Academy of Sciences, Vol. 1308, pp. 245–55.<br />
Broadb<strong>and</strong> Commission. 2013. The State of Broadb<strong>and</strong> in 2013: Universalizing Broadb<strong>and</strong>. Geneva, Switzerl<strong>and</strong>, Broadb<strong>and</strong><br />
Commission for Digital Development/ITU/UNESCO.<br />
Bromley, P. 2013. Holocaust education <strong>and</strong> human rights: Holocaust discussions in social science textbooks worldwide,<br />
1970–2010 Tertium Comparationis, Vol. 19, No. 1, pp. 14–37.<br />
Bromley, P., Lerch, J. <strong>and</strong> Jimenez, J. D. 2016. Education for global citizenship <strong>and</strong> sustainable development: content in social<br />
science textbooks. (Background paper for Global Education Monitoring Report 2016.)<br />
Bromley, P. <strong>and</strong> Russell, S. G. 2010. Holocaust as history <strong>and</strong> human rights: Holocaust education in social science<br />
textbooks, 1970–2008. Prospects, Vol. 40, No. 1, pp. 153–73.<br />
Bruns, B. <strong>and</strong> Luque, J. 2014. Great Teachers: How to Raise Student Learning in Latin America <strong>and</strong> the Caribbean. Washington,<br />
DC, World Bank.<br />
Buckner, E. <strong>and</strong> Russell, S. G. 2013. Portraying the global: cross-national trends in textbooks’ portrayal of globalization<br />
<strong>and</strong> global citizenship. International Studies Quarterly, Vol. 57, No. 4, pp. 738–50.<br />
Burchinal, M., Howes, C., Pianta, R., Bryant, D., Early, D., Clifford, R. <strong>and</strong> Barbarin, O. 2008. Predicting child outcomes at<br />
the end of kindergarten from the quality of pre-kindergarten teacher–child interactions <strong>and</strong> instruction. Applied<br />
Developmental Science, Vol. 12, No. 3, pp. 140–53.<br />
2016 • GLOBAL EDUCATION MONITORING REPORT 573
Burns, D. <strong>and</strong> Darling-Hammond, L. 2014. Teaching Around the World: What Can TALIS Tell Us? Stanford, CA, Stanford<br />
Center for Opportunity Policy in Education.<br />
Bush, T. 2008. Leadership <strong>and</strong> Management Development in Education. London, UK, SAGE Publishing.<br />
Bush, T. <strong>and</strong> Glover, D. 2012. Leadership development <strong>and</strong> learner outcomes: evidence from South Africa. Journal of<br />
Educational Leadership, Policy <strong>and</strong> Practice, Vol. 27, No. 2, pp. 3–15.<br />
Cameroon Tribune. 2014. Cameroun: recrutement de 9000 instituteurs [Cameroon: recruting 9,000 teachers], 5 August.<br />
Campos, M. M., Esposito, Y. L., Bhering, E., Gimenes, N. <strong>and</strong> Abuchaim, B. 2011. Quality of early childhood education: a<br />
study in six Brazilian state capitals. Cadernos de Pesquisa, Vol. 41, No. 142, pp. 20–54.<br />
Cardoso, M. <strong>and</strong> Dowd, A. J. 2016. Using literacy boost to inform a global, household-based measure of children’s<br />
reading skills. UIS (ed.), Underst<strong>and</strong>ing What Works in Oral Reading Assessments: Recommendations from Donors,<br />
Implementers <strong>and</strong> Practitioners. Montreal, Que., UNESCO Institute for Statistics, pp. 106–17.<br />
Carnoy, M., Garcia, E. <strong>and</strong> Khavenson, T. 2015. Bringing it Back Home: Why State Comparisons Are More Useful than<br />
International Comparisons for Improving U.S. Education Policy. Washington, DC, Economic Policy Institute. (Briefing<br />
paper 410.)<br />
Carpena, F., Cole, S., Shapiro, J. <strong>and</strong> Zia, B. 2015. The ABCs of Financial Education Experimental Evidence on Attitudes,<br />
Behavior, <strong>and</strong> Cognitive Biases. Washington, DC, World Bank. (Policy Research Working Paper 7413.)<br />
Carrier, P., Fuchs, E. <strong>and</strong> Messinger, T. 2015. The International Status of Education about the Holocaust: A Global Mapping<br />
of Textbooks <strong>and</strong> Curricula. Paris/Braunschweig, Germany, UNESCO/Georg Eckert Institute for International<br />
Textbook Research.<br />
Castro, M. H. G. 2012. Developing the Enabling Context for Student Assessment in Brazil. Washington, DC, World Bank.<br />
(SABER Student Assessment Working Paper 7.)<br />
Catts, R. <strong>and</strong> Lau, J. 2008. Towards Information Literacy Indicators: Conceptual Framework Paper. Paris, UNESCO.<br />
CEDEFOP. 2011. Portugal: VET in Europe – Country Report 2011. Brussels, European Centre for the Development of<br />
Vocational Training.<br />
___. 2012. Loans for Vocational Education <strong>and</strong> Training in Europe. Luxembourg, European Centre for the Development of<br />
Vocational Training. (Research paper 20.)<br />
Chan, K. W. 2013. China: internal migration. I. Ness (ed.), The Encyclopedia of Global Human Migration. Oxford, UK,<br />
Blackwell.<br />
Clancy, P. <strong>and</strong> Goastellec, G. 2007. Exploring access <strong>and</strong> equity in higher education: policy <strong>and</strong> performance in a<br />
comparative perspective. Higher Education Quarterly, Vol. 61, No. 2, pp. 136–54.<br />
Clarke, D. J. <strong>and</strong> Aggleton, P. 2012. Life skills-based HIV education <strong>and</strong> Education for All. (Background paper for EFA Global<br />
Monitoring Report 2012.)<br />
Clarke, M. 2012. What Matters Most for Student Assessment Systems: A Framework Paper. Washington, DC, World Bank.<br />
(SABER Student Assessment Working Paper 1.)<br />
___. 2016. Finding a Reasonable Target for Math <strong>and</strong> Reading Test Scores. Washington, DC, World Bank. http://blogs.<br />
worldbank.org/education/finding-reasonable-target-math-<strong>and</strong>-reading-test-scores. (Accessed 6 May 2016.)<br />
Cole, S. <strong>and</strong> Fern<strong>and</strong>o, N. 2008. Assessing the Importance of Financial Literacy. Manila, Asian Development Bank.<br />
Coles, M., Keevy, J., Bateman, A. <strong>and</strong> Keating, J. 2014. Flying blind: policy rationales for national qualifications<br />
frameworks <strong>and</strong> how they tend to evolve. International Journal of Continuing Education <strong>and</strong> Lifelong Learning, Vol. 7,<br />
No. 1, pp. 17–46.<br />
Colombia Ministry of Education. 2016a. Sistema Nacional de Información de la Educación Superior (SNIES) [National<br />
Higher Education Information System]. Bogota, Colombia Ministry of Education. www.mineducacion.gov.co/<br />
sistemasdeinformacion/1735/w3-propertyname-2672.html (Accessed 27 January 2016.)<br />
___. 2016b. Sistema para la Prevención de la Deserción de la Educación Superior (SPADIES) [Higher Education<br />
Dropout Prevention System]. Bogota, Colombia Ministry of Education. www.mineducacion.gov.co/<br />
sistemasdeinformacion/1735/w3-article-212299.html (Accessed 29 January 2016.)<br />
Cowell, F. 2011. Measuring Inequality. Oxford, UK, Oxford University Press.<br />
Crisp, N. <strong>and</strong> Chen, L. 2014. Global supply of health professionals. New Engl<strong>and</strong> Journal of Medicine, Vol. 370, No. 10, pp.<br />
950–57.<br />
Cross, A. 2016. Country profiles of formal <strong>and</strong> non-formal adult education opportunities in literacy, numeracy <strong>and</strong> other skills:<br />
Jamaica. (Background paper for Global Education Monitoring Report 2016.)<br />
574<br />
REFERENCES
Crouch, L. 2015. Stumbling at the first step: a triple crisis at the foundations of education systems. Paper for UKFIET<br />
Conference, Oxford, UK, 15–17 September.<br />
CSC. 2014. A Study of Research Methodology Used in Evaluations of International Scholarship Schemes for Higher Education.<br />
London, Commonwealth Scholarship Commission.<br />
Currie, C., Zanotti, C., Morgan, A., Currie, D., de Looze, M., Roberts, C., Samdal, O., Smith, O. R. F. <strong>and</strong> Barnekow, V. 2012.<br />
Social Determinants of Health <strong>and</strong> Well-being Among Young People: Health Behaviour in School-aged children (HBSC) Study<br />
– International Report from the 2009–2010 Survey. Copenhagen, World Health Organization Regional Office for Europe.<br />
D. R. Congo Government. 2015. Stratégie Sectorielle de L’éducation et de la Formation 2016–2025 [Sectoral Strategy on<br />
Education <strong>and</strong> Training. Kinshasa, Government of the Democratic Republic of the Congo.<br />
Dahal, M. <strong>and</strong> Nguyen, Q. 2014. Private Non-State Sector Engagement in the Provision of Educational Services at the Primary<br />
<strong>and</strong> Secondary Levels in South Asia: An Analytical Review of Its Role in School Enrollment <strong>and</strong> Student Achievement.<br />
Washington, DC, World Bank. (Policy Research Working Paper 6899.)<br />
Dahlberg, G., Moss, P. <strong>and</strong> Pence, A. 1999. Beyond Quality in Early Childhood Education <strong>and</strong> Care: Postmodern Perspectives.<br />
Levittown, PA, Taylor <strong>and</strong> Francis.<br />
Danish Institute for Human Rights. 2014. Mapping of Human Rights Education in Danish Schools. Copenhagen, Danish<br />
Institute for Human Rights.<br />
Daoud, Y., Shanti, R., Kamal, S. <strong>and</strong> Sarsour, S. 2015. Risk Tolerance, Gender, <strong>and</strong> Entrepreneurship: the Palestinian Case.<br />
Nairobi, Partnership for Economic Policy.<br />
DARES. 2015. La Dépense Nationale pour la Formation Professionnelle Continue et l’Apprentissage en 2012: Baisse de la Dépense<br />
en Faveur des Jeunes [National expenditure for continuing education <strong>and</strong> apprenticeship in 2012: lower spending<br />
for youth]. Paris, Direction de l’Animation de la Recherche, des Études et des Statistiques, France Ministère du<br />
Travail, de l’Emploi, de la Formation professionnelle et du Dialogue social.<br />
Davies, L. 2006. Global citizenship: abstraction or framework for action? Educational Review, Vol. 58, No. 1, pp. 5–25.<br />
de Mel, S., McKenzie, D. <strong>and</strong> Woodruff, C. 2009. Innovative Firms or Innovative Owners? Determinants of Innovation in Micro,<br />
Small, <strong>and</strong> Medium Enterprises. Washington, DC, World Bank. (Policy Research Working Paper 4934.)<br />
De Renzio, P., Andrews, M. <strong>and</strong> Mills, Z. 2010. Evaluation of Donor Support to Public Financial Management (PFM) Reform<br />
in Developing Countries: Analytical Study of Quantitative Cross-country Evidence – Final Report. Stockholm, Swedish<br />
International Development Cooperation Agency.<br />
Demirguc-Kunt, A. <strong>and</strong> Klapper, L. 2012. Measuring Financial Inclusion: The Global Findex Database, Washington, DC., World<br />
Bank. (Policy Research Working Paper 6025.)<br />
Desrosières, A. 2010. La Politique des Gr<strong>and</strong>s Nombres: Histoire de la Raison Statistique. Paris, La Découverte.<br />
Devercelli, A., Raikes, A. <strong>and</strong> Anderson, K. 2015. Measuring early learning quality <strong>and</strong> outcomes (MELQO): process <strong>and</strong> lessons<br />
learned. Paper for Workshop on Early Childhood Development Measurement for Preschool Children, Washington,<br />
DC, World Bank, 27 May.<br />
Devries, K. M., Knight, L., Child, J. C., Mirembe, A., Nakuti, J., Jones, R., Sturgess, J., Allen, E., Kyegombe, N., Parkes, J.,<br />
Walakira, E., Elbourne, D., Watts, C. <strong>and</strong> Naker, D. 2015. The good school toolkit for reducing physical violence<br />
from school staff to primary school students: a cluster-r<strong>and</strong>omised controlled trial in Ug<strong>and</strong>a. The Lancet Global<br />
Health, Vol. 3, No. 7, pp. 378–86.<br />
Diamond, A., Barnett, W. S., Thomas, J. <strong>and</strong> Munro, S. 2007. Preschool program improves cognitive control. Science, Vol.<br />
318, No. 5855, pp. 1387–88.<br />
Diamond, J. <strong>and</strong> Khemani, P. 2005. Introducing Financial Management Information Systems in Developing Countries.<br />
Washington, DC, International Monetary Fund. (Working paper 05/196.)<br />
DiMenichi, B. C. <strong>and</strong> Richmond, L. L. 2015. Reflecting on past failures leads to increased perseverance <strong>and</strong> sustained<br />
attention. Journal of Cognitive Psychology, Vol. 27, No. 2, pp. 180–93.<br />
DOET, A. 2015. 2014 VET FEE-HELP Statistical Report. Canberra, Australia Department of Education <strong>and</strong> Training.<br />
Dortch, C. 2014. Career <strong>and</strong> Technical Education (CTE): A Primer. Washington, DC, Congressional Research Office. (R42748.)<br />
Dubeck, M. M. <strong>and</strong> Gove, A. 2015. The early grade reading assessment (EGRA): its theoretical foundation, purpose, <strong>and</strong><br />
limitations. International Journal of Educational Development, Vol. 40, No. 2015, pp. 315–22.<br />
Duckworth, A. L., Grant, H., Loew, B., Oettingen, G. <strong>and</strong> Gollwitzer, P. M. 2011. Self‐regulation strategies improve selfdiscipline<br />
in adolescents: benefits of mental contrasting <strong>and</strong> implementation intentions. Educational Psychology,<br />
Vol. 31, No. 1, pp. 17–26.<br />
2016 • GLOBAL EDUCATION MONITORING REPORT 575
Duckworth, A. L. <strong>and</strong> Kern, M. L. 2011. A meta-analysis of the convergent validity of self-control measures. Journal of<br />
Research in Personality, Vol. 45, No. 3, pp. 259–68.<br />
Duckworth, A. L. <strong>and</strong> Quinn, P. D. 2009. Development <strong>and</strong> validation of the Short Grit Scale (GRIT–S). Journal of<br />
Personality Assessment, Vol. 91, No. 2, pp. 166–74.<br />
Duflo, E., Dupas, P. <strong>and</strong> Kremer, M. 2015. School governance, teacher incentives, <strong>and</strong> pupil-teacher ratios: experimental<br />
evidence from Kenyan primary schools. Journal of Public Economics, Vol. 123, pp. 92–110.<br />
Dundar, H., Beteille, T., Riboud, M. <strong>and</strong> Deolalikar, A. 2014. Student Learning in South Asia: Challenges, Opportunities, <strong>and</strong><br />
Policy Priorities. Washington, DC, World Bank.<br />
EFA-FTI. 2004. Education for All Fast-Track Initiative: Accelerating Progress towards Quality Universal Primary Education –<br />
Framework. Washington, DC, Education for All Fast Track Initiative.<br />
Equal Education. 2015. Gauteng Schools Social Audit Report. Cape Town, South Africa, Equal Education.<br />
Erdogan, M. <strong>and</strong> Ok, A. 2011. An assessment of Turkish young pupils’ environmental literacy: a nationwide survey.<br />
International Journal of Science Education, Vol. 33, No. 17, pp. 2375–406.<br />
Erstad, O. 2010. Conceptions of technology literacy <strong>and</strong> fluency. P. Peterson, E. Baker <strong>and</strong> B. McGaw (eds), International<br />
Encyclopedia of Education, 3rd edn. Oxford, UK, Elsevier, pp. 34–41.<br />
ESSPIN. 2009. Approach to Monitoring Learning Achievement. Abuja, Nigeria, Education Sector Support Programme in<br />
Nigeria. (Position paper ESSPIN 027.)<br />
ETF. 2012. Qualification Frameworks: From Concepts to Implementation. Turin, Italy, European Training Foundation.<br />
European Commission. 2003. Entrepreneurship in Europe. Brussels, European Commission. (Green Paper.)<br />
___. 2014. Focus On Entrepreneurial Skills. Brussels, European Commission.<br />
___. 2015. Flash Eurobarometer 408: European Youth Report. Brussels, European Commission.<br />
___. 2016. Education <strong>and</strong> Training Monitor 2015. Luxembourg, Publications Office of the European Union.<br />
European Commission/EACEA/Eurydice. 2012a. Developing Key Competences at School in Europe: Challenges <strong>and</strong><br />
Opportunities for Policy. Luxembourg, European Commission.<br />
___. 2012b. Key Data on Education in Europe 2012. Brussels, Education Audiovisual <strong>and</strong> Culture Executive Agency.<br />
___. 2013. Key Data on Teachers <strong>and</strong> School Leaders in Europe: Eurydice Report – 2013 Edition. Luxembourg, Publications<br />
Office of the European Union.<br />
___. 2014. Financing Schools in Europe: Mechanisms, Methods <strong>and</strong> Criteria in Public Funding – Eurydice Report. Luxembourg,<br />
Publications Office of the European Union.<br />
___. 2015a. Adult Education <strong>and</strong> Training in Europe: Widening Access to Learning Opportunities. Luxembourg, Publications<br />
Office of the European Union.<br />
___. 2015b. The European Higher Education Area in 2015: Bologna Process Implementation Report. Luxembourg, Publications<br />
Office of the European Union.<br />
___. 2015c. The Teaching Profession in Europe Practices, Perceptions, <strong>and</strong> Policies. Luxembourg: Publications Office of the<br />
European Union.<br />
European Commission/EACEA/Eurydice/Eurostat. 2014. Key Data on Early Childhood Education <strong>and</strong> Care in Europe: 2014<br />
Edition. Luxembourg, Publications Office of the European Union.<br />
Eurostat. 2011. Methodological Notes: Data from Labour Force Survey <strong>and</strong> Adult Education Survey. Luxembourg, Eurostat.<br />
___. 2016. The Adult Education Survey. Luxembourg, Eurostat. http://ec.europa.eu/eurostat/web/microdata/adulteducation-survey.<br />
(Accessed 1 June 2015.)<br />
Eurostudent. 2015. Social <strong>and</strong> Economic Conditions of Student Life in Europe. Bielefeld, Germany, Eurostudent.<br />
Eurydice. 2000. Twenty Years Promoting Better Underst<strong>and</strong>ing of Education Systems. Brussels, Eurydice.<br />
___. 2012. Citizenship Education in Europe. Brussels, Education, Audiovisual <strong>and</strong> Culture Executive Agency.<br />
___. 2016a. Countries: Description of National Education Systems. Brussels, European Commission. https://webgate.<br />
ec.europa.eu/fpfis/mwikis/eurydice/index.php/Countries. (Accessed 10 April 2016.)<br />
___. 2016b. Publications 2015. Brussels, European Commission. https://webgate.ec.europa.eu/fpfis/mwikis/eurydice/<br />
index.php/Publications_2015. (Accessed 11 May 2016.)<br />
Evans, G. W. <strong>and</strong> Rosenbaum, J. 2008. Self-regulation <strong>and</strong> the income-achievement gap. Early Childhood Research<br />
Quarterly, Vol. 23, No. 4, pp. 504–14.<br />
Eysenck, S. B. G., Easting, G. <strong>and</strong> Pearson, P. R. 1984. Age norms for impulsiveness, venturesomeness <strong>and</strong> empathy in<br />
children. Personality <strong>and</strong> Individual Differences, Vol. 5, No. 3, pp. 315–21.<br />
576<br />
REFERENCES
Facione, P. A. 1990. Critical Thinking: A Statement of Expert Consensus for Purposes of Educational Assessment <strong>and</strong> Instruction<br />
– Research Findings <strong>and</strong> Recommendations. Millbrae, CA, The California Academic Press.<br />
FAO. 2010. Promoting Employment <strong>and</strong> Entrepreneurship for Vulnerable Youths in West Bank <strong>and</strong> Gaza Strip. Rome, Food <strong>and</strong><br />
Agriculture Organization of the United Nations.<br />
Fazekas, M. 2012. School Funding Formulas: Review of Main Characteristics <strong>and</strong> Impacts. Paris, Organisation for Economic<br />
Co-operation <strong>and</strong> Development. (OECD Education Working Paper.)<br />
Fehrler, S., Michaelowa, K. <strong>and</strong> Wechtler, A. 2009. The effectiveness of inputs in primary education: insights from recent<br />
student surveys for sub‐Saharan Africa. Journal of Development Studies, Vol. 45, No. 9, pp. 1545–78.<br />
Ferrari, A. 2013. DIGCOMP: A Framework for Developing <strong>and</strong> Underst<strong>and</strong>ing Digital Competence in Europe. Luxembourg,<br />
European Commission, Joint Research Centre. (JRC Scientific <strong>and</strong> Policy Reports.)<br />
Ferreira, F. H. G. <strong>and</strong> Gignoux, J. 2014. The measurement of educational inequality: achievement <strong>and</strong> opportunity. World<br />
Bank Economic Review, Vol. 28, No. 2, pp. 210–46.<br />
Ferrer, G. 2006. Educational Assessment Systems in Latin America: Current Practice <strong>and</strong> Future Challenges. Washington, DC,<br />
Partnership for Educational Revitalization in the Americas.<br />
Ferrer, G. <strong>and</strong> Fiszbein, A. 2015. What Has Happened with Learning Assessment Systems in Latin America? Lessons from the<br />
Last Decade of Experience. Washington, DC, World Bank.<br />
Feuer, M. J., Holl<strong>and</strong>, P. W., Green, B. F., Bertenthal, M. W. <strong>and</strong> Hemphill, F. C. 1999. Uncommon Measures: Equivalence<br />
<strong>and</strong> Linkage Among Educational Tests. Washington, DC, Committee on Equivalency <strong>and</strong> Linkage of Educational<br />
Tests, Board on Testing <strong>and</strong> Assessment/Division of Behavioral <strong>and</strong> Social Sciences <strong>and</strong> Education <strong>and</strong> National<br />
Research Council.<br />
Filmer, D. 2016. System health at the frontlines: using SDI data to analyze education quality in sub-Saharan Africa. Paper for<br />
Making Systems Work: a Global Conference on Education Systems, Sydney, Australia, 29 February 29–2 March.<br />
Filmer, D., Molina, E. <strong>and</strong> Stacy, B. 2015. What goes on inside the classroom in Africa? Assessing the relationship between what<br />
teachers know, what happened in the classroom, <strong>and</strong> student performance. Paper for AEFP 40th Annual Conference,<br />
Washington, DC, 26–28 February.<br />
Fraillon, J., Ainley, J., Schulz, W., Friedman, T. <strong>and</strong> Gebhardt, E. 2014. Preparing for Life in a Digital Age: The IEA International<br />
Computer <strong>and</strong> Literacy Information Study International Report. Amsterdam, International Association for the<br />
Evaluation of Educational Achievement.<br />
Franzen, A. <strong>and</strong> Vogl, D. 2013. Two decades of measuring environmental attitudes: a comparative analysis of 33<br />
countries. Global Environmental Change, Vol. 23, No. 5, pp. 1001–08.<br />
Frongillo, E. A., Tofail, F., Hamadani, J. D., Warren, A. M. <strong>and</strong> Mehrin, S. F. 2014. Measures <strong>and</strong> indicators for assessing<br />
impact of interventions integrating nutrition, health, <strong>and</strong> early childhood development. Annals of the New York<br />
Academy of Sciences, Vol. 1308, No. 1, pp. 68–88.<br />
Frost, M. <strong>and</strong> Little, A. W. 2014. Children’s learning practices in Ethiopia: observations from primary school cases. Oxford<br />
Review of Education, Vol. 40, No. 1, pp. 91–111.<br />
GADRRRES. 2015. Towards Safer School Construction: A Community-Based Approach. Geneva, Switzerl<strong>and</strong>, Global Alliance<br />
for Disaster Risk Reduction <strong>and</strong> Resilience in the Education Sector.<br />
GADRRRES/UNISDR. 2014. Comprehensive School Safety. Geneva, Switzerl<strong>and</strong>, Global Alliance for Disaster Risk<br />
Reduction <strong>and</strong> Resilience in the Education Sector/United Nations Office for Disaster Risk Reduction.<br />
Gal, I. 2016. Assessment of adult numeracy skills. (Background paper for Global Education Monitoring Report 2016.)<br />
Gal, I. <strong>and</strong> Tout, D. 2014. Comparison of PIAAC <strong>and</strong> PISA Frameworks for Numeracy <strong>and</strong> Mathematical Literacy. Paris,<br />
Organisation for Economic Co-operation <strong>and</strong> Development. (OECD Education Working Paper 102.)<br />
GCPEA. 2014. Education Under Attack 2014. New York, Global Coalition to Protect Education from Attack.<br />
___. 2015. Lessons in War 2015: Military Use of Schools <strong>and</strong> Universities during Armed Conflict. New York, Global Coalition to<br />
Protect Education from Attack.<br />
GEM. 2016. Global Entrepreneurship Monitor 2015/16 Global Report. London, Global Entrepreneurship Monitor.<br />
GFDRR. 2015. GFDRR on Risk Identification. Washington, DC, Global Facility for Disaster Reduction <strong>and</strong> Recovery, World<br />
Bank.<br />
Ghafory-Ashtiany, M. 2014. Earthquake risk <strong>and</strong> risk reduction capacity building in Iran. A. Ismail-Zadeh, J. U.<br />
Fucugauchi, A. Kijko, K. Takeuchi <strong>and</strong> I. Zaliapin (eds), Extreme Natural Hazards, Disaster Risks <strong>and</strong> Societal<br />
Implications. Cambridge, UK, Cambridge University Press, pp. 267–78.<br />
2016 • GLOBAL EDUCATION MONITORING REPORT 577
GHK. 2011. Study on Teacher Education for Primary <strong>and</strong> Secondary Education in Six Countries of the Eastern Partnership:<br />
Armenia, Azerbaijan, Belarus, Georgia, Moldova <strong>and</strong> Ukraine. Brussels, GHK.<br />
Gilmore, B. <strong>and</strong> McAuliffe, E. 2013. Effectiveness of community health workers delivering preventive interventions for<br />
maternal <strong>and</strong> child health in low- <strong>and</strong> middle-income countries: a systematic review. BMC Public Health, Vol. 13,<br />
No. 847.<br />
Global Campaign for Education. 2016. Global Indicator for Target 4.1. Johannesburg, South Africa, Global Campaign for<br />
Education.<br />
Global Initiative. 2015. Towards Non-violent Schools: Prohibiting All Corporal Punishment Global Report 2015. Nottingham,<br />
UK, Global Initiative to End All Corporal Punishment of Children/Save the Children.<br />
GMDAC. 2016. 2015 Global Migration Trends: Factsheet. Berlin, International Organization for Migration, IOM Global<br />
Migration Data Analysis Center.<br />
Godfrey, E. B., Osher, D., Williams, L. D., Wolf, S., Berg, J. K., Torrente, C., Spier, E. <strong>and</strong> Aber, J. L. 2012. Cross-national<br />
measurement of school learning environments: creating indicators for evaluating UNICEF’s Child Friendly<br />
Schools Initiative. Children <strong>and</strong> Youth Services Review, Vol. 34, No. 3, pp. 546–57.<br />
Goldstein, H. <strong>and</strong> Moss, G. 2014. Knowledge <strong>and</strong> numbers in education. Comparative Education, Vol. 50, No. 3, pp. 259–65.<br />
Goldstein, H. <strong>and</strong> Thomas, S. M. 2008. Reflections on the international comparative surveys debate. Assessment in<br />
Education: Principles, Policy & Practice, Vol. 15, No. 3, pp. 215–22.<br />
Gordon, R. A., Hofer, K. G., Fujimoto, K. A., Risk, N., Kaestner, R. <strong>and</strong> Korenman, S. 2015. Identifying high-quality<br />
preschool programs: new evidence on the validity of the Early Childhood Environment Rating Scale–Revised<br />
(ECERS-R) in relation to school readiness goals. Early Education <strong>and</strong> Development, Vol. 26, No. 8, pp. 1086–110.<br />
GPE, UIS <strong>and</strong> CUE. 2016. Assessment for Learning (A4L): An International Platform to Support Learning Assessment Systems.<br />
Washington, DC, Global Partnership for Education/UNESCO Institute for Statistics/Center for International<br />
Education at Brookings Institution.<br />
GPE <strong>and</strong> UNGEI. 2013. Statement of Intent. New York, United Nations Girls’ Education Initiative/Global Partnership for<br />
Education.<br />
Green, F. 2011. What Is Skill? An Inter-disciplinary Synthesis. London, Centre for Learning <strong>and</strong> Life Changes in Knowledge<br />
Economies <strong>and</strong> Societies. (LLakes Research Paper 20.)<br />
Griffin, P. <strong>and</strong> Care, E. 2015. Assessment <strong>and</strong> Teaching of 21st Century Skills: Methods <strong>and</strong> Approach. Dordrecht, the<br />
Netherl<strong>and</strong>s, Springer Netherl<strong>and</strong>s. (Educational Assessment in an Information Age.)<br />
Grissmer, D., Grimm, K., Aiyer, S., Murrah, W. <strong>and</strong> Steele, J. 2010. Fine motor skills <strong>and</strong> early comprehension of the world:<br />
two new school readiness indicators. Developmental Psychology, Vol. 46, No. 5, pp. 1008–17.<br />
Gutman, L. M. <strong>and</strong> Schoon, I. 2013. The Impact of Non-cognitive Skills on Outcomes for Young People. London, Education<br />
Endowment Foundation.<br />
Guzmán-Valenzuela, C. 2016. A challenge to the free market system. University World News, 22 January.<br />
Haberl<strong>and</strong>, N. <strong>and</strong> Rogow, D. 2015. Sexuality education: emerging trends in evidence <strong>and</strong> practice. Journal of Adolescent<br />
Health, Vol. 56, No. 1, pp. 15–21.<br />
Hadeed, J. 2014. Reliability <strong>and</strong> validity of the Early Childhood Environment Rating Scale, Revised Edition, ECERS-R in<br />
Arabic. Early Child Development <strong>and</strong> Care, Vol. 184, No. 6, pp. 819–42.<br />
Halle, M. <strong>and</strong> Wolfe, R. 2016. Follow-Up <strong>and</strong> Review for the 2030 Agenda: Bringing Coherence to the Work of the HLPF.<br />
Winnipeg, MB, International Institute for Sustainable Development.<br />
Hamre, B. K., Pianta, R. C., Mashburn, A. J. <strong>and</strong> Downer, J. T. 2007. Building a Science of Classrooms: Application of the<br />
CLASS Framework in over 4,000 U.S. Early Childhood <strong>and</strong> Elementary Classrooms. New York, Foundation for Child<br />
Development.<br />
Han, L. 2013. Is centralized teacher deployment more equitable? Evidence from rural China. China Economic Review, Vol.<br />
24, pp. 65–76.<br />
Hanson, K. 2015. What can Education Systems Research Learn from Health Systems Research? Research on Improving<br />
Systems of Education. (RISE Working Paper 15/003.)<br />
Hanushek, E. A., Piopiunik, M. <strong>and</strong> Wiederhold, S. 2014. The Value of Smarter Teachers: International Evidence on Teacher<br />
Cognitive Skills <strong>and</strong> Student Performance. Cambridge, MA, National Bureau of Economic Research.<br />
Hao, L. <strong>and</strong> Yu, X. 2015. Rural-urban migration <strong>and</strong> children’s access to education: China in comparative perspective.<br />
(Background paper for EFA Global Monitoring Report 2015.)<br />
578<br />
REFERENCES
Hardin, B. J., Vardell, R. <strong>and</strong> de Castañeda, A. 2008. More alike than different: early childhood professional development<br />
in Guatemala. Childhood Education, Vol. 84, No. 3, pp. 128–34.<br />
Hargreaves, L. G. 2008. The whole-school approach to eduation for sustainable development: from pilot projects to<br />
systemic change. Policy & Practice: A Development Education Review, No. 6, pp. 69–74.<br />
Harms, T., Clifford, R. M. <strong>and</strong> Cryer, D. 2015. Early Childhood Environment Rating Scale® Third Edition (ECERS-3). New York,<br />
Teachers College, Columbia University.<br />
Hart, B. <strong>and</strong> Risley, T. R. 1995. Meaningful Differences in the Everyday Experience of Young American Children. Baltimore, MD, Brookes.<br />
Hashweh, M. 2012. Entrepreneurship Education in the Occupied Palestinian Territory: An Exploratory Study. Jerusalem,<br />
Palestine Economic Policy Research Institute-MAS.<br />
Hatano, G. <strong>and</strong> Inagaki, K. 1998. Cultural contexts of schooling revisited: a review of “The Learning Gap” from a cultural<br />
psychology perspective. S. G. Paris <strong>and</strong> H. M. Wellman (eds), Global Prospects for Education: Development, Culture<br />
<strong>and</strong> Schooling Washington, DC, American Psychological Association, pp. 79–104.<br />
Hattie, J. 2009. Visible Learning: A Synthesis of over 800 Meta-Analyses Relating to Achievement. Abingdon, UK, Routledge.<br />
Henseler , M. <strong>and</strong> Plesch, J. 2009. How can scholarship institutions foster the return of foreign students? Jahrbücher für<br />
Nationalökonomie und Statistik, Vol. 229, No. 4, pp. 382–409.<br />
Herat, J., Hospital, X., Kalha, U., Alama, A. <strong>and</strong> Nicollin, L. 2014. Missing the Target: Using St<strong>and</strong>ardised Assessment Tools to<br />
Identify Gaps <strong>and</strong> Strengths in Sexuality Education Programmes in West <strong>and</strong> Central Africa. Paper for 20th International<br />
AIDS Conference, Melbourne, Australia, 20–25 July.<br />
Hernández Flores, G. E. 2016. Country profile of formal <strong>and</strong> non-formal adult education opportunities in literacy, numeracy <strong>and</strong><br />
other skills for acquisition <strong>and</strong> retention: Mexico. (Background paper for Global Education Monitoring Report 2016.)<br />
Heugh, K., Benson, C., Bogale, B. <strong>and</strong> Yohannes, M. A. G. 2007. Study on Medium of Instruction in Primary Schools in<br />
Ethiopia: Final Report. Addis Ababa, Ethiopia Ministry of Education.<br />
Hicks, J. H., Kremer, M., Mbiti, I. <strong>and</strong> Miguel, E. 2011. Vocational Education Voucher Delivery <strong>and</strong> Labour Market Returns: A<br />
R<strong>and</strong>omized Evaluation among Kenyan Youth. (Report for Spanish Impact Evaluation Fund phase II.)<br />
Hilverdink, P. 2013. Generalist Working with Youth <strong>and</strong> Families in the Netherl<strong>and</strong>s. Utrecht, the Netherl<strong>and</strong>s, Netherl<strong>and</strong>s<br />
Youth Institute.<br />
Hoadley, U. 2012. What do we know about teaching <strong>and</strong> learning in South African primary schools? Education as Change,<br />
Vol. 16, No. 2, pp. 187–202.<br />
Holford, J. <strong>and</strong> Młeczko, A. 2011. Towards a Lifelong Learning Society in Europe: The Contribution of the Education System.<br />
Tallinn, Institute for International <strong>and</strong> Social Studies, Tallinn University. (Working paper 64.)<br />
Holzmann, R., Mulaj, F. <strong>and</strong> Perotti, V. 2013. Financial Capability in Low- <strong>and</strong> Middle-Income Countries: Measurement <strong>and</strong><br />
Evaluation. Washington, DC, World Bank.<br />
Hoskins, B. 2016. Towards the development of an international module for assessing learning in Global Citizenship Education<br />
(GCE) <strong>and</strong> Education for Sustainable Development (ESD): a critical review of current measurement strategies. (Background<br />
paper for Global Education Monitoring Report 2016.)<br />
HRE 2020. 2015. Human Rights Education Indicator Framework: Key Indicators to Monitor <strong>and</strong> Assess the Implementation of<br />
Human Rights Education <strong>and</strong> Training. Middleburg, the Netherl<strong>and</strong>s, HREA.<br />
Human Rights Watch. 2016. “They Set the Classrooms on Fire”: Attacks on Education in Northeast Nigeria. New York, Human<br />
Rights Watch. www.hrw.org/report/2016/04/11/they-set-classrooms-fire/attacks-education-northeast-nigeria.<br />
(Accessed 17 March 2016.)<br />
Hu, B. Y. 2015. Comparing cultural differences in two quality measures in Chinese kindergartens: the Early Childhood<br />
Environment Rating Scale-Revised <strong>and</strong> the Kindergarten Quality Rating System. Compare: A Journal of<br />
Comparative <strong>and</strong> International Education, Vol. 45, No. 1, pp. 94–117.<br />
Hunt, F., Castagnaro, K. <strong>and</strong> Castrejón, E. M. 2014. Evaluation of the Implementation of the Ministerial Declaration: From<br />
Commitment to Action – Advances in Latin America <strong>and</strong> the Caribbean. New York, International Planned Parenthood<br />
Federation/Western Hemisphere Region Inc.<br />
Hurtado, M. E. 2012. Loan forgiveness plan fails to win over students. University World News, 25 March.<br />
___. 2015. Higher education reform project is failing the test. University World News, 4 September.<br />
___. 2016. Free tuition for students from 50% poorest families. University World News, 6 January.<br />
IADB. 2014. Thematic Evaluation: Review of IDB Support to Secondary Education – Improving Access, Quality <strong>and</strong> Institutions,<br />
1995–2012. Washington, DC, Inter-American Development Bank.<br />
2016 • GLOBAL EDUCATION MONITORING REPORT 579
IAEG-SDGs. 2016. Provisional Proposed Tiers for Global SDG Indicators as of March 24, 2016. New York, Inter-agency <strong>and</strong><br />
Expert Group on Sustainable Development Goal Indicators.<br />
IBE. 2010. World Data on Education 2010/11: Cameroon. Geneva, Switzerl<strong>and</strong>, UNESCO International Bureau of Education.<br />
___. 2016a. Global Monitoring of GCED & ESD: Themes in School Curricula. (Background paper for Global Education<br />
Monitoring Report 2016.).<br />
___. 2016b. World Data on Education. (Database.) Geneva, Switzerl<strong>and</strong>, UNESCO International Bureau of Education.<br />
www.ibe.unesco.org/en/resources/world-data-education (Accessed 1 June 2016.)<br />
IBP. 2015. Open Budget Survey 2015. Washington, DC, International Budget Partnership.<br />
ICDE. 2015. Online, Open <strong>and</strong> Flexible Systems Deliver Quality Higher Education, Student Success, Improved Capacity, <strong>and</strong><br />
Cost-Effective Pathways to Learning. Funding is Critical to Reap the Benefits. Oslo, International Council for Open <strong>and</strong><br />
Distance Education. http://icde.typepad.com/policy_forum. (Accessed 12 September 2015.)<br />
ICF. 2015. An In-Depth Analysis of Adult Learning Policies <strong>and</strong> their Effectiveness in Europe. Brussels, European Commission,<br />
Directorate General for Employment, Social Affairs <strong>and</strong> Inclusion.<br />
ICF GHK. 2013. Teacher Education <strong>and</strong> Training in the Western Balkans. Warsaw, ICF GHK.<br />
IDMC. 2015a. Global Estimates 2015: People Displaced by Disasters. Geneva, Switzerl<strong>and</strong>, Internal Displacement<br />
Monitoring Centre.<br />
___. 2015b. Global Overview 2015: People Internally Displaced by Conflict <strong>and</strong> Violence. Geneva, Switzerl<strong>and</strong>, Internal<br />
Displacement Monitoring Centre.<br />
IE Partners <strong>and</strong> R4D. 2015. Global Book Fund Feasibility Study: Preliminary Final Report. Windsor, UK/Washington, DC,<br />
International Education Partners/Results for Development.<br />
IIE. 2016. Scholarships for students from developing countries: establishing a global baseline. (Background paper for Global<br />
Education Monitoring Report 2016.)<br />
IIEP. 2015. IIEP Learning Portal. Paris, UNESCO International Institute for Educational Planning. http://learningportal.<br />
iiep.unesco.org. (Accessed 19 April 2016.)<br />
IIEP, UIS <strong>and</strong> GPE. 2016. Who Pays for What in Education? The Real Costs Revealed through National Education<br />
Accounts. UNESCO International Institute for Education Planning/UNESCO Institute for Statistics/Global<br />
Partnership for Education. (Unpublished.)<br />
IIEP, World Bank, UNICEF <strong>and</strong> GPE. 2014. Education Sector Analysis Methodological Guidelines, Vol. 1. Dakar/New York/<br />
Washington, DC, UNESCO International Institute for Educational Planning Pôle de Dakar/World Bank/UNICEF/<br />
Global Partnership for Education.<br />
ILO. 2012. Know about Business in the Occupied Palestinian Territory. Geneva, Switzerl<strong>and</strong>, International Labour<br />
Organization.<br />
___. 2013. Decent Work Indicators: Guidelines for Producers <strong>and</strong> Users of Statistical <strong>and</strong> Legal Framework Indicators. Geneva,<br />
Switzerl<strong>and</strong>, International Labour Organization.<br />
___. 2015. What Does NEETs Mean <strong>and</strong> Why Is the Concept so Easily Misinterpreted? Geneva, Switzerl<strong>and</strong>, International<br />
Labour Office.<br />
ILO <strong>and</strong> UNESCO. 2015. The Right to Education <strong>and</strong> the Teaching Profession: Overview of the Measures Supporting the Rights,<br />
Status <strong>and</strong> Working Conditions of the Teaching Profession reported on by Member States. Paris, UNESCO. (Background<br />
document for the Committee of Experts on the Application of the Recommendations concerning Teachers,<br />
20–24 April, ED-2015/WS/28.)<br />
IMF. 2015. Myanmar. Washington, DC, International Monetary Fund. (IMF country report 15/267.)<br />
India Government. 2015. Facilities for Differently Abled Children in Schools. New Delhi, Government of India. http://pib.nic.<br />
in/newsite/PrintRelease.aspx?relid=121550 (Accessed 11 May 2015.)<br />
INEE/GFDRR. 2009. Guidance Notes on Safer School Construction. Washington, DC, InterAgency Network for Education<br />
in Emergencies/Global Facility for Disaster Reduction <strong>and</strong> Recovery.<br />
Ingersoll, R., Merrill, L. <strong>and</strong> Stuckey, D. 2014. Seven Trends: The Transformation of the Teaching Force. Philadelphia, PA,<br />
Consortium for Policy Research in Education. (CPRE research report RR-80.)<br />
Institute of Educational Sciences. 2016. National Assessment of Educational Progress. Washington, DC, Institute of<br />
Educational Sciences. http://nces.ed.gov/nationsreportcard. (Accessed 11 April 2016.)<br />
Intel. 2015. Intel® Learn Program: Technology <strong>and</strong> Entrepreneurship Course. Santa Clara, CA, Intel. (Accessed 1 February<br />
2016.)<br />
580<br />
REFERENCES
Inter-Agency Working Group on TVET Indicators. 2012. Proposed Indicators on Assessing Technical <strong>and</strong> Vocational<br />
Education <strong>and</strong> Training, Inter-Agency Working Group on TVET Indicators.<br />
International ICT Literacy Panel. 2002. Digital Transformation: A Framework for ICT Literacy. Princeton, NJ, Educational<br />
Testing Service.<br />
International Water Association. 2014. An Avoidable Crisis: WASH Human Resouce Capacity Gaps in 15 Developing<br />
Economies. London, International Water Association.<br />
IOM. 2015. Displacement Tracking Matrix I DTM: Round IV Report. Geneva, Switzerl<strong>and</strong>, International Organization for<br />
Migration.<br />
Ishimine, K. <strong>and</strong> Tayler, C. 2014. Assessing quality in early childhood education <strong>and</strong> care. European Journal of Education,<br />
Vol. 49, No. 2, pp. 272–90.<br />
ISSA. 2010. Competent Educators of the 21st Century: Principles of Quality Pedagogy. Riga, International Step by Step<br />
Association.<br />
ITU. 2011. Measuring the WSIS Targets: A Statistical Framework. Geneva, Switzerl<strong>and</strong>, International Telecomunication<br />
Union.<br />
___. 2014. Manual for Measuring ICT Access <strong>and</strong> Use by Households <strong>and</strong> Individuals. Geneva, Switzerl<strong>and</strong>, International<br />
Telecommunication Union.<br />
Jamaica Observer. 2015. Education Minister Reports Decline in School Violence. Kingston, Jamaica Observer, 16 July. www.<br />
jamaicaobserver.com/news/Education-minister-reports-decline-in-school-violence. (Accessed 9 April 2016.)<br />
Jones, S. 2016. How does classroom composition affect learning outcomes in Ug<strong>and</strong>an primary schools? International<br />
Journal of Educational Development, Vol. 48, pp. 66–78.<br />
Jordan Ministry of Planning <strong>and</strong> International Cooperation. 2015. Jordan Response Plan for the Syria Crisis: 2016–2018.<br />
Amman, Jordan Ministry of Planning <strong>and</strong> International Cooperation.<br />
Jukes, M., Vagh, S. B. <strong>and</strong> Kim, Y.-S. 2006. Development of Assessments of Reading Ability <strong>and</strong> Classroom Behavior.<br />
Washington, DC, World Bank.<br />
Juntos por la Educación. 2013. Propuestas para la Agenda Educativa [Education agenda proposal]. Asunción, Juntos por la<br />
Educación.<br />
Kanjee, A. <strong>and</strong> Acana, S. 2013. Developing the Enabling Context for Student Assessment in Ug<strong>and</strong>a. Washington, DC, World<br />
Bank. (SABER Student Assessment Working Paper 8.)<br />
Karlan, D. <strong>and</strong> Valdivia, M. 2011. Teaching entrepreneurship: impact of business training on microfinance clients <strong>and</strong><br />
institutions. The Review of Economics <strong>and</strong> Statistics, Vol. 93, No. 2, pp. 510–52.<br />
Katz, C. M. <strong>and</strong> Fox, A. M. 2010. Risk <strong>and</strong> protective factors associated with gang-involved youth in Trinidad <strong>and</strong><br />
Tobago. Revista Panamericana de Salud Pública, Vol. 27, No. 3, pp. 187–202.<br />
Katz, L. G. <strong>and</strong> McClellan, D. E. 1997. Fostering Children’s Social Competence: The Teacher’s Role, Vol. 8. Washington, DC,<br />
National Association for the Education of Young Children.<br />
Kautz, T., Heckman, J. J., Diris, R., ter Weel, B. <strong>and</strong> Borghans, L. 2014. Fostering <strong>and</strong> Measuring Skills: Improving Cognitive<br />
<strong>and</strong> Non-Cognitive Skills to Promote Lifetime Success. Cambridge, MA, National Bureau of Economic Research.<br />
(NBER Working Paper 20749.)<br />
Keating, A., Kerr, D., Benton, T., Mundy, E. <strong>and</strong> Lopes, J. 2010. Citizenship Education in Engl<strong>and</strong> 2001–2010: Young People’s<br />
Practices <strong>and</strong> Prospects for The Future – The Eighth <strong>and</strong> Final Report From the Citizenship Education Longitudinal Study<br />
(CELS). London, Department for Education. (DFE-RR059.)<br />
Keevy, J. <strong>and</strong> Chakroun, B. 2015. Level-Setting <strong>and</strong> Recognition of Learning Outcomes: The Use of Level Descriptors in the<br />
Twenty-First Century. Paris, UNESCO.<br />
Kelley, J. G. <strong>and</strong> Simmons, B. A. 2015. Politics by number: indicators as social pressure in international relations.<br />
American Journal of Political Science, Vol. 59, No. 1, pp. 55–70.<br />
Kerr, D., Sturman, L., Schulz, W. <strong>and</strong> Burge, B. 2010. ICCS 2009 European Report: Civic Knowledge, Attitudes, <strong>and</strong> Engagement<br />
among Lower-Secondary Students in 24 European Countries. Amsterdam, International Association for the Evaluation<br />
of Educational Achievement.<br />
Kjøbli, J. <strong>and</strong> Ogden, T. 2014. A r<strong>and</strong>omized effectiveness trial of individual child social skills training: six-month followup.<br />
Child <strong>and</strong> Adolescent Psychiatry <strong>and</strong> Mental Health, Vol. 8, No. 1, pp. 1–11.<br />
Klapper, L., Lusardi, A. <strong>and</strong> van Oudheusden, P. 2015. Financial Literacy Around the World: Insights from the St<strong>and</strong>ard &<br />
Poor’s Ratings Services Global Financial Literacy Survey. New York, S&P Global Institute.<br />
2016 • GLOBAL EDUCATION MONITORING REPORT 581
Kokko, K., Pulkkinen, L. <strong>and</strong> Puustinen, M. 2000. Selection into long-term unemployment <strong>and</strong> its psychological<br />
consequences. International Journal of Behavioral Development, Vol. 24, No. 3, pp. 310–20.<br />
König, J. 2014. Innovative Teaching for Effective Learning. Paris, Organisation for Economic Co-operation <strong>and</strong><br />
Development. (Background Document: Designing an International Instrument to Assess Teachers’ General<br />
Pedagogical Knowledge [GPK]: Review of Studies, Considerations, <strong>and</strong> Recommendations – Draft Report.)<br />
Kuan-yi, C. 2009. Cultural Differences in Children’s Development of Social Competence between European American<br />
<strong>and</strong> Chinese Immigrant Families. PhD dissertation, University of Texas at Austin.<br />
Kyriacou, C. 2001. Teacher stress: directions for future research. Educational Review, Vol. 53, No. 1, pp. 28–35.<br />
Lai, E. R. 2011. Critical Thinking: A Literature Review. Boulder, CO, Pearson.<br />
Lamb, S. 2011. TVET <strong>and</strong> the poor: challenges <strong>and</strong> possibilities. International Journal of Training Research, Vol. 9, No. 1–2, pp.<br />
60–71.<br />
Lambert, M. C., Williams, S. G., Morrison, J. W., Samms‐Vaughan, M. E., Mayfield, W. A. <strong>and</strong> Thornburg, K. R. 2008. Are<br />
the indicators for the language <strong>and</strong> reasoning subscale of the Early Childhood Environment Rating Scale‐Revised<br />
psychometrically appropriate for Caribbean classrooms? International Journal of Early Years Education, Vol. 16, No. 1,<br />
pp. 41–60.<br />
Lancet. 2016. No health workforce, no global health security. The Lancet, Vol. 387, No. 10033, p. 2063.<br />
Laughlin, L. 2014. A Child’s Day: Living Arrangements, Nativity, <strong>and</strong> Family Transitions: 2011 (Selected Indicators of Child Well-<br />
Being). Washington, DC, US Census Bureau. (Current Population Reports.)<br />
Leclerc, J. 2016. L’Aménagement Linguistique dans le Monde [Language development in the world]. Quebec City, QC,<br />
Chaire pour le développement de la recherche sur la culture d’expression française en Amérique du Nord,<br />
Université Laval. www.axl.cefan.ulaval.ca (Accessed 9 March 2016.)<br />
Leithwood, K., Day, C., Sammons, P., Harris, A. <strong>and</strong> Hopkins, D. 2008. Seven strong claims about successful school<br />
leadership. School Leadership <strong>and</strong> Management, Vol. 28, No. 1, pp. 27–42.<br />
Levacic, R. 2008. Financing schools: evolving patterns of autonomy <strong>and</strong> control. Educational Management Administration<br />
& Leadership, Vol. 36, No. 2, pp. 221–34.<br />
Lewis, M. P., Simons, G. F. <strong>and</strong> Fennig, C. D. 2016. Ethnologue: Languages of the World, 19th edn. Dallas, TX, SIL<br />
International.<br />
Li, K., Hu, B. Y., Pan, Y., Qin, J. <strong>and</strong> Fan, X. 2014. Chinese Early Childhood Environment Rating Scale (trial) (CECERS): a<br />
validity study. Early Childhood Research Quarterly, Vol. 29, No. 3, pp. 268–82.<br />
Loaiza, E. <strong>and</strong> Liang, M. 2013. Adolescent Pregnancy: A Review of the Evidence. New York, United Nations Population Fund.<br />
Loeb, M. 2015. WG/UNCEF Child Functioning Module: Preliminary Results From Samoa & Supporting Documentation.<br />
Hyattsville, MD, National Center for Health Statistics/Washington Group on Disability Statistics.<br />
Lokken, F. <strong>and</strong> Mullins, C. 2014. Trends in eLearning: Tracking the Impact of eLearning at Community Colleges. Washington,<br />
DC, Instructional Technology Council. (2013 distance education survey results.)<br />
Lösel, F. <strong>and</strong> Beelmann, A. 2003. Effects of child skills training in preventing antisocial behavior: a systematic review<br />
of r<strong>and</strong>omized evaluations. The Annals of the American Academy of Political <strong>and</strong> Social Science, Vol. 587, No. 1, pp.<br />
84–109.<br />
Lustig, N., Pessino, C. <strong>and</strong> Scott, J. 2013. The Impact of Taxes <strong>and</strong> Social Spending on Inequality <strong>and</strong> Poverty in Argentina,<br />
Bolivia, Brazil, Mexico, Peru <strong>and</strong> Uruguay: An Overview. New Orleans, LA, Inter-American Dialogue/Tulane University<br />
Center for Inter-American Policy <strong>and</strong> Research. (CEQ Working Paper 13.)<br />
Maglen, L., Brown, J. <strong>and</strong> Lene, S. P. T. 2015. Research into the Financing of Technical <strong>and</strong> Vocational Education <strong>and</strong> Training<br />
(TVET) in the Pacific: Samoa – Country Report. Camberwell, Australia, Australian Council for Educational Research.<br />
Mahdizadeh, A. 2011. Report on Retrofit Procedure of School Buildings in Islamic Republic of Iran. Teheran, State Organization<br />
of Schools Renovation, Iran Ministry of Education.<br />
Makarova, Y. 2016. Assessing the focus of national education financing policies on equity. (Background paper for Global<br />
Education Monitoring Report 2016.)<br />
Malawi Ministry of Gender, Children, Disability <strong>and</strong> Social Welfare. 2014. Report: Violence Against Children <strong>and</strong> Young<br />
Women in Malawi – Findings from a National Survey 2013. Lilongwe, Malawi Ministry of Gender, Children, Disability<br />
<strong>and</strong> Social Welfare.<br />
Mansilla, V. B. <strong>and</strong> Jackson, A. 2011. Educating for Global Competence: Preparing Our Youth to Engage the World. New York,<br />
Council of Chief State School Officers’ EdSteps Initiative/Asia Society Partnership for Global Learning.<br />
582<br />
REFERENCES
Marfo, K. 2011. Envisioning an African child development field. Child Development Perspectives, Vol. 5, No. 2, pp. 140–47.<br />
Martinez, S., Naudeau, S. <strong>and</strong> Pereira, V. 2012. The Promise of Preschool in Africa: A R<strong>and</strong>omized Impact Evaluation of Early<br />
Childhood Development in Rural Mozambique. Washington, DC, World Bank/Save the Children.<br />
Mashburn, A. J., Pianta, R. C., Hamre, B. K., Downer, J. T., Barbarin, O. A., Bryant, D., Burchinal, M., Early, D. M. <strong>and</strong> Howes,<br />
C. 2008. Measures of classroom quality in prekindergarten <strong>and</strong> children’s development of academic, language,<br />
<strong>and</strong> social skills. Child Development, Vol. 79, No. 3, pp. 732–49.<br />
McClell<strong>and</strong>, M. M. <strong>and</strong> Tominey, S. L. 2014. The development of self-regulation <strong>and</strong> executive function in young<br />
children. Zero to Three, Vol. 35, No. 2, pp. 2–8.<br />
McCoy, D. C., Peet, E. D., Ezzati, M., Danaei, G., Black, M. M., Sudfeld, C. R., Fawzi, W. <strong>and</strong> Fink, G. 2016. Early childhood<br />
developmental status in low- <strong>and</strong> middle-income countries: national, regional, <strong>and</strong> global prevalence estimates<br />
using predictive modeling. PLoS Medicine, Vol. 13, No. 6, e1002034.<br />
McKeown, R. <strong>and</strong> Hopkins, C. 2014. Education for Sustainable Development in Teacher Education. Paris, UNESCO.<br />
MEALN. 2011. Etude Sociolinguistique sur l’Adéquation Entre la Dem<strong>and</strong>e et l’Offre d’Enseignement Bilingue dans la Region de<br />
Mopti [Sociolinguistic study of the supply-dem<strong>and</strong> balance in bilingual instruction in the Mopti region]. Bamako,<br />
Mali Ministère de l’Education, de l’Alphabétisation et des Langues Nationales.<br />
Mejer, L. 2006. Project of updating the UOE collection (education accounts). Paper for Measurement of Non-Market Output<br />
in Education <strong>and</strong> Health workshop, London, 3–5 October.<br />
Melguizo, T. <strong>and</strong> Wainer, J. 2014. Are students gaining general <strong>and</strong> subject area knowledge in university? Evidence from Brazil.<br />
Paper for V Seminario Internacional ICFES sobre Investigación en Calidad de la Educación, Bogota, 30–31 October.<br />
Mercosur. 2008. Estudo Analítico Comparativo do Sistema Educacional do Mercosul (2001–2005). Montevideo, Mercado<br />
Comum do Sur.<br />
Meschi, E. <strong>and</strong> Scervini, F. 2014. A new dataset on educational inequality. Empirical Economics, Vol. 47, No. 2, pp. 695–716.<br />
Mingat, A. <strong>and</strong> Ndem, F. 2014. Equity: A Cornerstone in Designing National Education Policies, Dijon, France, Institut de<br />
Recherche sur l’Education: Sociologie et Economie de l’Education, Université de Bourgogne. (IREDU Working<br />
Papers.)<br />
Mislevy, R. J. 1992. Linking Educational Assessment: Concepts, Issues, Methods, <strong>and</strong> Prospects. Princeton, NJ, Educational<br />
Testing Service.<br />
Miyamoto, K., Huerta, M. C. <strong>and</strong> Kubacka, K. 2015. Fostering social <strong>and</strong> emotional skills for well-being <strong>and</strong> social<br />
progress. European Journal of Education, Vol. 50, No. 2, pp. 147–59.<br />
Mizala, A. <strong>and</strong> Ñopo, H. 2012. Evolution of Teachers’ Salaries in Latin America at the Turn of the 20th Century: How Much Are<br />
They (Under or Over) Paid? Bonn, Germany, Institute for the Study of Labor (Discussion paper 6806.)<br />
Moberg, K., Vestergaard, L., Fayolle, A., Redford, D., Cooney, T., Singer, S., Sailer, K. <strong>and</strong> Filip, D. 2014. How to Assess <strong>and</strong><br />
Evaluate the Influence of Entrepreneurship Education. Odense, Denmark, Danish Foundation for Entrepreneurship.<br />
Mont, D. 2007. Measuring Disability Prevalence. Washington, DC, World Bank.<br />
Moon, R. J. <strong>and</strong> Koo, J.-W. 2011. Global citizenship <strong>and</strong> human rights: a longitudinal analysis of social studies <strong>and</strong> ethics<br />
textbooks in the Republic of Korea. Comparative Education Review, Vol. 55, No. 4, pp. 574–99.<br />
Moore, A.-M. S., DeStefano, J. <strong>and</strong> Adelman, E. 2012. Opportunity to Learn: A High Impact Strategy for Improving Educational<br />
Outcomes in Developing Countries. Washington, DC, USAID/EQUIP2.<br />
Morgan, J. 2015. OECD’s AHELO Will Fail to Launch, Says Education Director. London, Times Higher Education. www.<br />
timeshighereducation.com/news/oecds-ahelo-will-fail-launch-says-education-director. (Accessed 10 June 2016.)<br />
Morrisson, C. <strong>and</strong> Murtin, F. 2013. The Kuznets curve of human capital inequality: 1870–2010. The Journal of Economic<br />
Inequality, Vol. 11, No. 3, pp. 283–301.<br />
Mudenda, C., Johnson, D., Parks, L. <strong>and</strong> van Stam, G. 2014. Power Instability in Rural Zambia, Case Macha. T. F. Bissy<strong>and</strong>é<br />
<strong>and</strong> G. van Stam (eds), e-Infrastructure <strong>and</strong> e-Services for Developing Countries, Vol. 135 of Lecture Notes of the<br />
Institute for Computer Sciences, Social Informatics <strong>and</strong> Telecommunications Engineering, pp 260–70.<br />
Mulkeen, A. 2010. Teachers in Anglophone Africa: Issues in Teacher Supply, Training, <strong>and</strong> Management. Washington, DC, World<br />
Bank.<br />
Mullis, I. V. S., Martin, M. O., Foy, P. <strong>and</strong> Arora, A. 2012a. TIMSS 2011 International Results in Mathematics. Amsterdam,<br />
International Association for the Evaluation of Educational Achievement.<br />
Mullis, V. S., Martin, M. O., Foy, P. <strong>and</strong> Drucker, K. T. 2012b. PIRLS 2011 International Results in Reading. Amsterdam,<br />
International Association for the Evaluation of Educational Achievement.<br />
2016 • GLOBAL EDUCATION MONITORING REPORT 583
Muralidharan, A., Sheets, E. S., Madsen, J., Craighead, L. W. <strong>and</strong> Craighead, W. E. 2011. Interpersonal competence across<br />
domains: relevance to personality pathology. Journal of Personality Disorders, Vol. 25, No. 1, pp. 16–27.<br />
Murphy-Graham, E. 2009. Constructing a new vision: undoing gender through secondary education in Honduras.<br />
International Review of Educaiton, Vol. 55, No. 5–6, pp. 503–21.<br />
Muskin, J. A. 2015. Student Learning Assessment <strong>and</strong> the Curriculum: Issues <strong>and</strong> Implications for Policy, Design <strong>and</strong><br />
Implementation. Geneva, Switzerl<strong>and</strong>, UNESCO International Bureau of Education. (Current <strong>and</strong> Critical Issues in<br />
the Curriculum <strong>and</strong> Learning.)<br />
Muskin, J. A. 2016. Using Student Learning Assessment Data to Improve Teaching <strong>and</strong> Learning: an Overview, Critique<br />
<strong>and</strong> Propositions. New York, Brookings Institution. (Unpublished.)<br />
Myanmar Government. 2015. Education for All 2015 National Review Report: Myanmar. Naypyidaw, Government of<br />
Myanmar, Ministry of Education.<br />
Myanmar Ministry of Education. 2014. Comprehensive Education Sector Review (CESR) Phase I (Rapid Assessment Report).<br />
Naypyidaw, Myanmar Ministry of Education.<br />
Myers, R. G. 2006. Quality in program of early childhoodcare <strong>and</strong> education (ECCE). (Background paper for EFA Global<br />
Monitoring Report 2007.)<br />
NCES. 2016. Schools <strong>and</strong> Staffing Survey (SASS), Washington, DC, National Center for Education Statistics. https://nces.<br />
ed.gov/surveys/sass.<br />
NCVER. 2015. Financial Information 2014. Canberra, National Centre for Vocational Educational Research.<br />
Negev, M., Sagy, G., Garb, Y., Salzberg, A. <strong>and</strong> Tal, A. 2008. Evaluating the environmental literacy of Israeli elementary<br />
<strong>and</strong> high school students. The Journal of Environmental Education, Vol. 39, No. 2, pp. 3–20.<br />
NESSE. 2012. Education <strong>and</strong> Disability/Special Needs: Policies <strong>and</strong> Practices in Education, Training <strong>and</strong> Employment for<br />
Students with Disabilities <strong>and</strong> Special Educaiton needs in the EU. Brussels, European Commission.<br />
Neves de Jesus, S. <strong>and</strong> Lens, W. 2005. An integrated model for the study of teacher motivation. Applied Psychology, Vol.<br />
54, No. 1, pp. 119–34.<br />
Niang, F. 2015. Public Policies, Instructional Time <strong>and</strong> Quality of Education in Primary Education in Senegal. Paris,<br />
University of Paris Descartes. (Unpublished.)<br />
Nico, B. <strong>and</strong> Nico, L. P. 2011. Qualificação de Adultos: Realidades e Desafi os no Sul de Portugal. Mangualde/Ramada,<br />
Portugal, Edições Pedago, Lda.<br />
Niedermeier, F. <strong>and</strong> Pohlenz, P. 2016. State of Play <strong>and</strong> Development Needs: Higher Education Quality Assurance in the ASEAN<br />
Region. Jakarta, German Academic Exchange Service (DAAD).<br />
Nigeria NPC <strong>and</strong> RTI International. 2016. Nigeria 2015 Education Data Survey: National Report. Washington, DC, US<br />
Agency for International Development.<br />
Nkengne, A. P. N. 2010. What Contexts are Favorable for the Adoption of the Contract Teacher Policy? Institute for Research<br />
in the Sociology <strong>and</strong> Economics of Education. (IREDU Working Paper 2010/1.)<br />
NPC, N. <strong>and</strong> Macro, O. 2004. Nigeria DHS EdData Survey 2004. Abuja, Nigeria National Population Commission/ORC<br />
Macro.<br />
NUEPA. 2014. Elementary Education in India: Progress towards UEE. New Delhi, National University of Educational<br />
Planning <strong>and</strong> Administration.<br />
Nusche, D. 2008. Assessment of Learning Outcomes in Higher Education: A Comparative Review of Selected Practices. Paris,<br />
Organisation for Economic Co-operation <strong>and</strong> Development. (OECD Education Working Papers 15.)<br />
O’Prey, L. <strong>and</strong> Shephard, D. 2014. Financial Education for Children <strong>and</strong> Youth: A Systematic Review <strong>and</strong> Meta-Analysis.<br />
Amsterdam, Aflatoun International. (Aflatoun Working Paper 2014.1C.)<br />
OCHA. 2015. 2016 Humanitarian Needs Overview: Iraq, Office for the Coordination of Humanitarian Affairs.<br />
(Unpublished.)<br />
OECD. 2005a. Promoting Adult Learning. Paris, Organisation for Economic Co-operation <strong>and</strong> Development.<br />
___. 2005b. Students with Disabilities, Learning Difficulties <strong>and</strong> Disadvantages: Statistics <strong>and</strong> Indicators. Paris, Organisation<br />
for Economic Co-operation <strong>and</strong> Development.<br />
___. 2005c. Teachers Matter: Attracting, Developing <strong>and</strong> Retaining Effective Teachers – Final Report. Paris, Organisation for<br />
Economic Co-operation <strong>and</strong> Development.<br />
___. 2009a. Green at Fifteen? How 15-year-olds Perform in Environmental Science <strong>and</strong> Geoscience in PISA. Paris, Organisation<br />
for Economic Co-operation <strong>and</strong> Development.<br />
584<br />
REFERENCES
___. 2009b. INES Network for the Collection <strong>and</strong> the Adjudication of System-Level Descriptive Information on Educational<br />
Structures, Policies <strong>and</strong> Practices: M<strong>and</strong>ate <strong>and</strong> Implementation of the INES Network for the Collection <strong>and</strong> Adjudication<br />
of System-Level Descriptive Information on Educational Structures, Policies <strong>and</strong> Practices. Paris, Organisation for<br />
Economic Co-operation <strong>and</strong> Development.<br />
___. 2010. PISA 2009 Results: Overcoming Social Background – Equity in Learning Opportunities <strong>and</strong> Outcomes, Vol. II. Paris,<br />
Organisation for Economic Co-operation <strong>and</strong> Development.<br />
___. 2011a. Divided We St<strong>and</strong>: Why Inequality Keeps Rising. Paris, Organisation for Economic Co-operation <strong>and</strong> Development.<br />
___. 2011b. PISA 2009 Results: Digital Technologies <strong>and</strong> Performance, Vol. VI. Paris, Organisation for Economic Co-operation<br />
<strong>and</strong> Development.<br />
___. 2012a. Network on Early Childhood Education <strong>and</strong> Care: Draft Position Paper of the Thematic Working Group on Workforce<br />
Quality. Paris, Organisation for Economic Co-opoeration <strong>and</strong> Development.<br />
___. 2012b. PISA in Focus: Are Students More Engaged When Schools Offer Extracurricular Activities? Paris, Organisation for<br />
Economic Co-operation <strong>and</strong> Development. (PISA in Focus 18.)<br />
___. 2012c. Starting Strong III: a Quality Toolbox for Early Childhood Education <strong>and</strong> Care. Paris: Organisation for Economic<br />
Co-operation <strong>and</strong> Development.<br />
___. 2013a. OECD Skills Outlook 2013: First Results from the Survey of Adult Skills. Paris, Organsation for Economic Cooperation<br />
<strong>and</strong> Development.<br />
___. 2013b. PISA 2012 Results: Excellence through Equity – Giving Every Student the Chance to Succeed, Vol. II. Paris,<br />
Organisation for Economic Co-operation <strong>and</strong> Development.<br />
___. 2013d. PISA 2012 Results: Ready to Learn – Students’ Engagement, Drive <strong>and</strong> Self-Belief. Paris, Organisation for<br />
Economic Co-operation <strong>and</strong> Development.<br />
___. 2013e. PISA 2015: Draft Collaborative Problem Solving Framework. Paris, Organisation for Economic Co-operation <strong>and</strong><br />
Development.<br />
___. 2013f. Structural policy country notes: Myanmar. Economic Outlook for Southeast Asia, China <strong>and</strong> India 2014: Beyond<br />
the Middle-Income Trap. Paris, Organisation for Economic Co-opertation <strong>and</strong> Development.<br />
___. 2014a. PISA 2012 Results: Students <strong>and</strong> Money – Financial Literacy Skills for the 21st Century, Vol. VI. Paris, Organisation<br />
for Economic Co-operation <strong>and</strong> Development.<br />
___. 2014b. Social Institutions <strong>and</strong> Gender Index: 2014 Synthesis Report. Paris, Organisation for Economic Co-operation <strong>and</strong><br />
Development.<br />
___. 2014c. TALIS 2013 Results: An International Perspective on Teaching <strong>and</strong> Learning. Paris, Organisation for Economic Cooperation<br />
<strong>and</strong> Development.<br />
___. 2014d. Technical Report of the Survey of Adult Skills (PIAAC). Paris, Organisation for Economic Co-operation <strong>and</strong><br />
Development.<br />
___. 2015a. The ABC of Gender Equality in Education: Aptitude, Behaviour, Confidence. Paris, Organisation for Economic Cooperation<br />
<strong>and</strong> Development.<br />
___. 2015b. Education at a Glance 2015. Paris, Organisation for Economic Co-operation <strong>and</strong> Development.<br />
___. 2015c. Education Policy Outlook 2015: Making Reforms Happen. Paris, Organisation for Economic Co-operation <strong>and</strong><br />
Development.<br />
___. 2015d. Helping Immigrant Students to Succeed in School – <strong>and</strong> Beyond. Paris, Organisation for Economic Co-operation<br />
<strong>and</strong> Development.<br />
___. 2015e. Immigrant Students at School: Easing the Journey towards Integration. Paris, Organisation for Economic Cooperation<br />
<strong>and</strong> Development. (OECD Reviews of Migrant Education.)<br />
___. 2015f. Skills for Social Progress: The Power of Social <strong>and</strong> Emotional Skills. Paris, Organisation for Economic Cooperation<br />
<strong>and</strong> Development.<br />
___. 2015g. Starting Strong IV: Monitoring Quality in Early Childhood Education <strong>and</strong> Care. Paris, Organisation for Economic<br />
Co-operation <strong>and</strong> Development.<br />
___. 2015h. Students, Computers <strong>and</strong> Learning: Making the Connection. Paris, Organisation for Economic Co-operation <strong>and</strong><br />
Development.<br />
___. 2015i. Survey on Measuring Financial Literacy <strong>and</strong> Financial Inclusion in 2015. Paris, Organisation for Economic Cooperation<br />
<strong>and</strong> Development. www.oecd.org/daf/fin/financial-education/2015finlitmeasurementexercise.htm.<br />
(Accessed 22 June 2016.)<br />
2016 • GLOBAL EDUCATION MONITORING REPORT 585
___. 2016a. Global Competency for an Inclusive World. Paris, Organisation for Economic Co-operation <strong>and</strong> Development.<br />
___. 2016b. How Much Do Tertiary Students Pay <strong>and</strong> What Public Support Do They Receive? Paris, Organisation for Economic<br />
Co-operation <strong>and</strong> Development. (Education Indicators in Focus 41.)<br />
___. 2016c. PISA for Development: Assessment Frameworks. Paris, Organisation for Economic Co-operation <strong>and</strong><br />
Development.<br />
___. 2016d. Skills Matter: Further Results from the Survey of Adult Skills. Paris, Organisation for Economic Co-operation <strong>and</strong><br />
Development.<br />
OECD <strong>and</strong> World Bank. 2014. PISA for Development: Capacity Needs Analysis Report – Zambia. Paris, Organisation for<br />
Economic Co-operation <strong>and</strong> Development.<br />
OECD-INFE. 2011. Measuring Financial Literacy: Questionnaire <strong>and</strong> Guidance Notes for Conducting an Internationally<br />
Comparable Survey of Financial Literacy. Paris, Organisation for Economic Co-operation <strong>and</strong> Development/<br />
International Network on Financial Education.<br />
OEI. 2008. Metas Educativas 2021: La Educación que Queremos para la Generación de los Bicentenarios [Educational goals<br />
2021: the education we want for the bicentennial generation]. Madrid, Organización de Estados Iberoamericanos<br />
para la Educación, la Ciencia y la Cultura.<br />
___. 2014. Miradas Sobre la Educación en Iberoamérica: Avances en las Metas Educativas 2021 [Perspectives on education in<br />
Latin America: advances on the 2021 education goals]. Madrid, Organización de Estados Iberoamericanos para la<br />
Educación, la Ciencia y la Cultura.<br />
___. 2015. Conclusiones: VI Reunión del Consejo Rector del IESME [Conclusions: VI Session of the IESME Governing<br />
Council]. Madrid, Organización de Estados Iberoamericanos para la Educación, la Ciencia y la Cultura.<br />
OHCHR. 2015. Evaluation of the Implementation of the Second Phase of the World Programme for Human Rights Education:<br />
Report of the Office of the United Nations High Commissioner for Human Rights. Geneva, Switzerl<strong>and</strong>, Office of the<br />
United Nations High Commissioner for Human Rights.<br />
Orr, D. 2016. Monitoring cross-country performance in equality of access <strong>and</strong> affordability of tertiary education – a review of<br />
options. (Background paper for Global Education Monitoring Report 2016.)<br />
Orr, D. <strong>and</strong> Hovdhaugen, E. 2014. ‘Second chance’ routes into higher education: Sweden, Norway <strong>and</strong> Germany<br />
compared. International Journal of Lifelong Education, Vol. 33, No. 1, pp. 45–61.<br />
Osler, A. <strong>and</strong> Starkey, H. 2000. Citizenship, human rights <strong>and</strong> cultural diversity. A. Osler (ed.), Citizenship <strong>and</strong> Democracy<br />
in Schools: Diversity, Identity, Equality. Stoke on Trent, UK, Trentham Books.<br />
Ouane, A. <strong>and</strong> Glanz, C. 2011. Optimising Learning, Education <strong>and</strong> Publishing in Africa: The Language Factor – A Review <strong>and</strong><br />
Analysis of Theory <strong>and</strong> Practice in Mother-Tongue <strong>and</strong> Bilingual Education in sub-Saharan Africa. Hamburg, Germany/<br />
Abidjan, Côte d’Ivoire, UNESCO Institute for Lifelong Learning/Association for the Development of Education in<br />
Africa.<br />
Pakarinen, E., Lerkkanen, M.-K., Poikkeus, A.-M., Kiuru, N., Siekkinen, M., Rasku-Puttonen, H. <strong>and</strong> Nurmi, J.-E. 2010.<br />
A validation of the classroom assessment scoring system in Finnish kindergartens. Early Education <strong>and</strong><br />
Development, Vol. 21, No. 1, pp. 95–124.<br />
PAL Network. 2015. LEARNigeria. Nairobi, People’s Action for Learning Network. http://palnetwork.org/learnigeria.<br />
(Accessed 11 March 2016.)<br />
___. 2016. Position Statement on SDG4. Limuru, Kenya, People’s Action for Learning Network.<br />
Pallas, S. W., Minhas, D., Pérez-Escamilla, R., Taylor, L., Curry, L. <strong>and</strong> Bradley, E. H. 2013. Community health workers in<br />
low- <strong>and</strong> middle-income countries: what do we know about scaling up <strong>and</strong> sustainability? American Journal of<br />
Public Health, Vol. 103, No. 7, pp. e74–82.<br />
PASEC. 2015. PASEC2014: Education System Performance in Francophone Sub-Saharan Africa – Competencies <strong>and</strong> Learning<br />
Factors in Primary Education. Dakar, Programme d’Analyse des Systèmes Educatifs de la CONFEMEN.<br />
PEFA. 2016. Framework for Assessing Public Financial Management. Washington, DC, Public Expenditure <strong>and</strong> Financial<br />
Accountability.<br />
Perna, L., Orosz, K., Gopaul, B., Jumakulov, Z., Ashirbekov, A. <strong>and</strong> Kishkentayaeva, M. 2014. Promoting human capital<br />
development: a typology of international scholarship programs in higher education. Educational Researcher, Vol.<br />
43, No. 2, pp. 66–73.<br />
Pettersson, G. <strong>and</strong> Rawle, G. 2015. Impact Evaluation of Education Quality Improvement Programme in Tanzania: Baseline<br />
Briefing Note 1. Oxford, UK, Oxford Policy Management/UK Department for International Development.<br />
586<br />
REFERENCES
Pew Research Center. 2015. Internet Seen as Positive Influence on Education but Negative on Morality in Emerging <strong>and</strong><br />
Developing Nations. New York, Pew Research Center.<br />
PHEA. 2010. Accomplishments of the Partnership for Higher Education in Africa 2000–2010. New York, Partnership for Higher<br />
Education in Africa.<br />
PIAAC Numeracy Expert Group. 2009. PIAAC Numeracy: A Conceptual Framework Paris, Organisation for Economic Cooperation<br />
<strong>and</strong> Development. (OECD Education Working Paper 35.)<br />
Pinheiro, P. S. 2006. World Report on Violence Against Children. Geneva, Switzerl<strong>and</strong>, UNICEF.<br />
Piper, B. <strong>and</strong> Miksic, E. 2011. Mother tongue <strong>and</strong> reading: using early grade reading assessments to investigate<br />
language-of-instruction policy in east africa. A. Gove <strong>and</strong> A. Wetterberg (eds), The Early Grade Reading Assessment:<br />
Applications <strong>and</strong> Interventions to Improve Basic Literacy. Research Triangle Park, NC, RTI International, pp. 139–82.<br />
Pisani, L., Borisova, I. <strong>and</strong> Dowd, A. J. 2015. International Development <strong>and</strong> Early Learning Assessment Technical Working<br />
Paper. London, Save the Children.<br />
Possin, K. 2013. A fatal flaw in the Collegiate Learning Assessment Test, Assessment Update, 21 February. www.<br />
assessmentupdate.com/sample-articles/a-fatal-flaw-in-the-collegiate-learning-assessment-test.aspx.<br />
Primi, R., Carvalho, L. F., Miguel, F. K. <strong>and</strong> Silva, M. C. R. 2010. Análise do funcionamento diferencial dos itens do Exame<br />
Nacional do Estudante (ENADE) de psicologia de 2006. [Analysis of the differential item functioning of the 2006<br />
Psychology ENADE exam]. Psico-USF, Vol. 15, No. 3, pp. 379–93.<br />
Primi, R., Hutz, C. S. <strong>and</strong> Silva, M. C. R. 2011. A prova do ENADE de psicologia 2006: concepção, construção e análise<br />
psicométrica da prova. [The 2006 Psychology ENADE exam: conception, construction, <strong>and</strong> psychometric<br />
evaluation of the exam]. Avaliação Psicológica, Vol. 15, No. 3, pp. 271–94.<br />
Pryor, J., Akyeampong, K., Westbrook, J. <strong>and</strong> Lussier, K. 2012. Rethinking teacher preparation <strong>and</strong> professional<br />
development in Africa: an analysis of the curriculum of teacher education in the teaching of early reading <strong>and</strong><br />
mathematics. Curriculum Journal, Vol. 23, No. 4, pp. 409–502.<br />
R4D. 2015. Bringing Learning to Light: The Role of Citizen-led Assessments in Shifting the Education Agenda. Washington, DC,<br />
Results for Development Insitute.<br />
Raikes, A. 2016. Measuring of child development <strong>and</strong> learning. (Background paper for Global Education Monitoring Report<br />
2016.)<br />
Rao, G. P., Minni, P. <strong>and</strong> Jha, J. 2015. National Study on Working Conditions of Teachers: State Report for Jharkh<strong>and</strong>.<br />
Bangalore, India, Centre for Budget <strong>and</strong> Policy Studies.<br />
Rao, N. <strong>and</strong> Pearson, E. 2007. An Evaluation of Early Childhood Care <strong>and</strong> Education Programmes in Cambodia. Hong Kong,<br />
China, University of Hong Kong.<br />
Ratanawijitrasin, S. 2015. The evolving l<strong>and</strong>scape of South-east Asian higher education <strong>and</strong> the challenges of<br />
governance. A. Curaj, L. Matei, R. Pricopie, J. Salmi <strong>and</strong> P. Scott (eds), The European Higher Education Area: Between<br />
Critical Reflections <strong>and</strong> Future Policies. Cham, Switzerl<strong>and</strong>, Springer International Publishing, pp. 221–38.<br />
Rawle, G. <strong>and</strong> Attfield, I. 2015. What can the results from recent early grade learning assessments in Tanzania <strong>and</strong> Nigeria teach<br />
us about measuring learning for sustainable futures? Paper for UKFIET Conference, Oxford, UK, 15–17 September.<br />
Read, N. 2016. Measures of learning <strong>and</strong> teaching material availability <strong>and</strong> use in sub-Saharan Africa <strong>and</strong> other low income<br />
countries. (Background paper for Global Educatoin Monitoring Report 2016.)<br />
Read, T. 2015. Where Have All the Textbooks Gone? Toward Sustainable Provision of Teaching <strong>and</strong> Learning Materials in Sub-<br />
Saharan Africa. Washington, DC, World Bank.<br />
Reimers, F. 2010. Educating for global competency. J. E. Cohen <strong>and</strong> M. B. Malin (eds), International Perspectives on the<br />
Goals of Universal Basic <strong>and</strong> Secondary Education. New York, Routledge, pp. 183–202.<br />
Rentzou, K. 2010. Using the ACEI Global Guidelines Assessment to evaluate the quality of early child care in Greek<br />
settings. Early Childhood Education Journal, Vol. 38, No. 1, pp. 75–80.<br />
Richardson, P. W., Karabenick, S. A. <strong>and</strong> Watt, H. M. G. 2014. Teacher Motivation: Theory <strong>and</strong> Practice. New York, Routledge.<br />
Riggio, R. E. 1986. Assessment of basic social skills. Journal of Personality <strong>and</strong> Social Psychology, Vol. 51, No. 3, pp. 649–60.<br />
Riggio, R. E., Riggio, H. R., Salinas, C. <strong>and</strong> Cole, E. J. 2003. The role of social <strong>and</strong> emotional communication skills in leader<br />
emergence <strong>and</strong> effectiveness. Group Dynamics: Theory, Research, <strong>and</strong> Practice, Vol. 7, No. 4, pp. 83–103.<br />
Robers, S., Zhang, A., Morgan, R. E. <strong>and</strong> Musu-Gillette, L. 2015. Indicators of School Crime <strong>and</strong> Safety: 2014. Washington,<br />
DC, National Center for Education Statistics, US Department of Education/Bureau of Justice Statistics, Office of<br />
Justice Programs, US Department of Justice.<br />
2016 • GLOBAL EDUCATION MONITORING REPORT 587
Rogoff, B. 2003. The Cultural Nature of Human Development. New York, Oxford University Press.<br />
RTI International. 2015a. Early learning assessments: a retrospective. (Background paper for EFA Global Monitoring Report 2015.)<br />
___. 2015b. Task Order 15: Data for Education Programming in Asia <strong>and</strong> Middle East. Philippines EGRA Four Language Study –<br />
2015 Follow-On. Washington, DC, Research Triangle Institute International.<br />
___. 2016a. Measures of quality through classroom observation for the SDGs: lessons from low <strong>and</strong> middle income countries.<br />
(Background paper for Global Education Monitoring Report 2016.)<br />
___. 2016b. Nigeria Reading <strong>and</strong> Access Research Activity (RARA): Results of an Approach to Improve Early Grade Reading in<br />
Hausa in Bauchi <strong>and</strong> Sokoto States. Research Triangle Park, NC, RTI International.<br />
Rubenson, K. 1999. Supply of lifelong-learning opportunities. A. Tuijnman <strong>and</strong> T. Schuller (Eds), Lifelong Learning Policy<br />
<strong>and</strong> Research: Proceedings of an International Symposium. London, Portl<strong>and</strong> Press Ltd.<br />
Sabbagh, M., Xu, F., Carlson, S., Moses, L. J. <strong>and</strong> Lee, K. 2006. The development of executive functioning <strong>and</strong> theory of<br />
mind: a comparison of Chinese <strong>and</strong> US preschoolers. Psychological Science, Vol. 17, No. 1, pp. 74–81.<br />
Sabol, T. J. <strong>and</strong> Pianta, R. C. 2014. Do st<strong>and</strong>ard measures of preschool quality used in statewide policy predict school<br />
readiness? Education Finance <strong>and</strong> Policy, Vol. 9, No. 2, pp. 116–64.<br />
Save the Children. 2013. Rw<strong>and</strong>an Children’s Book Initiative (RCBI): Baseline Report. London, Save the Children.<br />
Save the Children <strong>and</strong> World Vision. 2015. Why Teacher Motivation Matters. London, Save the Children.<br />
Savigny, D. d. <strong>and</strong> Adam, T. 2009. Systems Thinking for Health Systems Strengthening. Geneva, Switzerl<strong>and</strong>, Alliance for<br />
Health Policy <strong>and</strong> Systems Research/World Health Organization.<br />
Savolainen, K. 2010. Education as a Means to World Peace: The Case of the 1974 UNESCO Recommendation. Jyväskylä,<br />
Finl<strong>and</strong>, University of Jyväskylä.<br />
Savolainen, K. <strong>and</strong> Torney-Purta, J. 2011. Modes of discourse about education, peace <strong>and</strong> human rights in the 1974<br />
UNESCO Recommendation. Prospects, Vol. 41, No. 4, pp. 581–96.<br />
Schofield, K. 2015. Research into the Financing of Technical <strong>and</strong> Vocational Education <strong>and</strong> Training (TVET) in the Pacific:<br />
Overview Paper – The Research at a Glance. Camberwell, Australia, Australian Council for Educational Research.<br />
Schulz, W., Ainley, J., Fraillon, J., Kerr, D. <strong>and</strong> Losito, B. 2010. ICCS 2009 International Report: Civic Knowledge, Attitudes, <strong>and</strong><br />
Engagement among Lower-secondary School Students in 38 Countries. Amsterdam, International Association for the<br />
Evaluation of Educational Achievement.<br />
Schulz, W., Ainley, J., Fraillon, J., Losito, B. <strong>and</strong> Agrusti, G. 2016. IEA International Civic <strong>and</strong> Citizenship Education Study 2016:<br />
Assessment Framework. Amsterdam, International Association for the Evaluation of Educational Achievement.<br />
Schulz, W., Ainley, J., Friedman, T. <strong>and</strong> Lietz, P. 2011. ICCS 2009 Latin American Report: Civic Knowledge <strong>and</strong> Attitudes among<br />
Lower-Secondary Students in Six Latin American Countries. Amsterdam, International Association for the Evaluation<br />
of Educational Achievement.<br />
Segrin, C. 2001. Social skills <strong>and</strong> negative life events: testing the deficit stress generation hypothesis. Current<br />
Psychology, Vol. 20, No. 1, pp. 19–35.<br />
Seidman, E., Raza, M. <strong>and</strong> Kim, S. 2015. The Teacher Instructional Practices <strong>and</strong> Processes System: An Overview <strong>and</strong><br />
Implementation Guidelines. New York, New York University.<br />
Seiferling, M. 2013. Recent Improvements to the Government Finance Statistics Yearbook Database in Response to Analytical<br />
Needs, International Monetary Fund. (IMF Working Paper.)<br />
Sektnan, M., McClell<strong>and</strong>, M. M., Acock, A. <strong>and</strong> Morrison, F. J. 2010. Relations between early family risk, children’s<br />
behavioral regulation, <strong>and</strong> academic achievement. Early Childhood Research Quarterly, Vol. 25, No. 4, pp. 464–79.<br />
Shavega, T. J., Brugman, D. <strong>and</strong> van Tuij, C. 2014. Children’s behavioral adjustment in pre-primary schools in Tanzania: a<br />
multilevel approach. Early Education <strong>and</strong> Development, Vol. 25, No. 3, pp. 356–80.<br />
Shechtman, N., DeBarger, A. H., Dornsife, C., Rosier, S. <strong>and</strong> Yarnall, L. 2013. Promoting Grit, Tenacity, <strong>and</strong> Perseverance:<br />
Critical Factors for Success in the 21st Century. Washington, DC, US Department of Education, Department of<br />
Educational Technology.<br />
Siraj-Blatchford, I. <strong>and</strong> Wong, Y. 1999. Defining <strong>and</strong> evaluating quality in early childhood education in an international<br />
context: dilemmas <strong>and</strong> possibilities. Early Years: the International Journal of Research <strong>and</strong> Development Vol. 20, No. 1.<br />
Somers, P., Morosini, M., Pan, M. <strong>and</strong> Cofer Sr, J. E. 2013. Brazil’s radical approach to exp<strong>and</strong>ing access for<br />
underrepresented college students. H. D. Meyer, E. P. St. John, M. Chankseliani <strong>and</strong> L. Uribe (eds), Fairness in Access<br />
to Higher Education in a Global Perspective: Reconciling Excellence, Efficiency <strong>and</strong> Justice. Albany, NY, Sense Publishers,<br />
pp. 203–22.<br />
588<br />
REFERENCES
South Africa Government. 2013. Regulation Relating to Minimum Uniform Norms <strong>and</strong> St<strong>and</strong>ards for Public School<br />
Infrastructure. Pretoria, South Africa, Ministry of Basic Education.<br />
___. 2015. Neims St<strong>and</strong>ard Report May 2015. Pretoria, South Africa, Ministry of Basic Education.<br />
SSFGS. 2010. The Samoa School Fees Grant Scheme. Apia, Government of Samoa.<br />
Staveteig, S. <strong>and</strong> Rutstein, S. O. 2014. Making the Demographic <strong>and</strong> Health Surveys Wealth Index Comparable. Fairfax, VA,<br />
ICF International.<br />
Sternberg, R. J. 2012. The assessment of creativity: an investment–based approach. Creativity Research Journal, Vol. 24,<br />
No. 1, pp. 3–12.<br />
Study Group on Measuring Learning Outcomes. 2013. Schooling Is Not Education! Using Assessment to Change the Politics<br />
of Non-Learning. Washington, DC, Center for Global Development.<br />
Sylva, K., Siraj-Blatchford, I., Taggart, B., Sammons, P., Melhuish, E., Elliote, K. <strong>and</strong> Totsika, V. 2006. Capturing quality in<br />
early childhood through environmental rating scales. Early Childhood Research Quarterly, Vol. 21, No. 1, pp. 76–92.<br />
Tangney, J. P., Baumeister, R. F. <strong>and</strong> Boone, A. L. 2004. High self-control predicts good adjustment, less pathology,<br />
better grades, <strong>and</strong> interpersonal success. Journal of Personality, Vol. 72, No. 2, pp. 271–324.<br />
Tannenbaum, R. J. <strong>and</strong> Katz, I. R. 2013. St<strong>and</strong>ard setting. K. F. Geisinger (ed.), APA H<strong>and</strong>book of Testing <strong>and</strong> Assessment<br />
in Psychology: Vol. 3 – Testing <strong>and</strong> Assessment in School Psychology <strong>and</strong> Education. Washington, DC, American<br />
Psychological Association, pp. 455–77.<br />
Uwezo Tanzania. 2012. Are Our Children Learning? Annual Learning Assessment Report 2012. Dar Es Salaam, Uwezo Tanzania.<br />
Tarullo, A. R., Obradovic, J. <strong>and</strong> Gunnar, M. R. 2009. Self-control <strong>and</strong> the developing brain. Zero to Three, Vol. 29, No. 3, p. 31.<br />
Tatto, M. T., Peck, R., Schwille, J., Bankov, K., Senk, S. L., Rodriguez, M., Ingvarson, L., Reckase, M. <strong>and</strong> Rowley, G. 2012.<br />
Policy, Practice, <strong>and</strong> Readiness to Teach Primary <strong>and</strong> Secondary Mathematics in 17 Countries: Findings from the IEA<br />
Teacher Education <strong>and</strong> Development Study in Mathematics (TEDS-M). Amsterdam, International Association for the<br />
Evaluation of Educational Achievement.<br />
Terra, L. <strong>and</strong> Bromley, P. 2012. The globalization of multicultural education in social science textbooks: cross-national<br />
analyses, 1950–2010. Multicultural Perspectives, Vol. 14, No. 3, pp. 136–43.<br />
Thompson, R. A. 2015. Relationships, regulation, <strong>and</strong> early development. R. M. Lerner (ed.), H<strong>and</strong>book of Child Psychology<br />
<strong>and</strong> Developmental Science, 7th edn, Vol. 3. Hoboken, NJ, Wiley, pp. 1–46.<br />
Tiyab , B. K. <strong>and</strong> Ndabananiye, J. C. 2013. Household Education Spending Approach <strong>and</strong> Estimation Techniques Using<br />
Household Surveys: Methodological Guidelines. Paris, UNESCO.<br />
Torney-Porta, J., Lehman, R., Oswald, H. <strong>and</strong> Schulz, W. 2001. Citizenship <strong>and</strong> Education in Twenty-eight Countries:<br />
Civic Knowledge <strong>and</strong> Engagement at Age Fourteen. Amsterdam, International Association for the Evaluation of<br />
Educational Achievement.<br />
Tout, D. <strong>and</strong> Gal, I. 2015. Perspectives on numeracy: reflections from international assessments. ZDM – The International<br />
Journal of Mathematics Education, Vol. 47, No. 4, pp. 691–706.<br />
Transparency International. 2013. Global Corruption Report: Education. New York, Routledge.<br />
Traoré, M. L. 2009. L’utilisation des langues nationales dans le système éducatif malien: Historique, défis et<br />
perspectives [The use of national languages in the Mali education system: history, challenges <strong>and</strong> outlook]. B.<br />
Brock-Utne <strong>and</strong> I. Skattum (eds), Languages <strong>and</strong> Education in Africa: A Comparative <strong>and</strong> Transdisciplinary Analysis.<br />
Oxford, UK, Symposium Books, pp. 155–61.<br />
Tri<strong>and</strong>is, H. C. <strong>and</strong> Gelf<strong>and</strong>, M. J. 1998. Converging measurement of horizontal <strong>and</strong> vertical individualism <strong>and</strong><br />
collectivism. Journal of Personality <strong>and</strong> Social Psychology, Vol. 74, No. 1, pp. 118–28.<br />
Tuck, R. 2007. An Introductory Guide to National Qualifications Frameworks: Conceptual <strong>and</strong> Practical Issues for Policy Makers.<br />
Geneva, Switzerl<strong>and</strong>, International Labour Office.<br />
UBEC, N. 2013. 2011 National Assessment of Learning Achievements in Basic Education (NALABE): Final Report. Abuja, Nigeria<br />
Universal Basic Education Commission.<br />
Ug<strong>and</strong>a Ministry of Education <strong>and</strong> Sport <strong>and</strong> IIEP Pôle de Dakar. 2014. Teacher Issues in Ug<strong>and</strong>a: A Shared Vision for an<br />
Effective Teacher Policy. Paris, International Institute for Educational Planning Pôle de Dakar.<br />
UIL. 2016. Global Report: GRALE. Hamburg, Germany, UNESCO Institute for Lifelong Learning. www.uil.unesco.org/<br />
adult-learning-<strong>and</strong>-education/global-report-grale (Accessed 10 June 2016.)<br />
UIL, ETF <strong>and</strong> CEDEFOP. 2015. Global Inventory of Regional <strong>and</strong> National Qualification Frameworks: Volume II – National <strong>and</strong><br />
Regional Cases. Hamburg, Germany, UNESCO Institute for Lifelong Learning.<br />
2016 • GLOBAL EDUCATION MONITORING REPORT 589
UIS. 2006a. Global Age-specific Literacy Projections Model (GALP): Rationale, Methodology <strong>and</strong> Software. Montreal, QB,<br />
UNESCO Institute for Statistics.<br />
___. 2006b. Teachers <strong>and</strong> educational quality: monitoring global needs for 2015. Montreal, QB, UNESCO Institute for Statistics.<br />
___. 2009. Guide to Measuring Information <strong>and</strong> Communication Technologies (ICT) in Education. Montreal, QB, UNESCO<br />
Institute for Statistics. (Technical Paper 2.)<br />
___. 2012a. ICT in Education in Latin America <strong>and</strong> the Caribbean: A Regional Analysis of ICT Integration <strong>and</strong> e-Readiness.<br />
Montreal, QB, UNESCO Institute for Statistics.<br />
___. 2012b. International St<strong>and</strong>ard Classification of Education: ISCED 2011. Montreal, QB, UNESCO Institute for Statistics.<br />
___. 2013a. Information <strong>and</strong> Communication Technology (ICT) in Five Arab States: A Comparative Analysis of ICT Integration <strong>and</strong><br />
e-Readiness in Schools in Egypt, Jordan, Oman, Palestine <strong>and</strong> Qatar. Montreal, QB, UNESCO Institute for Statistics.<br />
___. 2013b. Never Too Late to Complete School: Results of the UIS Survey on Adult Education <strong>and</strong> Literacy Programmes in Latin<br />
America <strong>and</strong> the Caribbean. Montreal, QB, UNESCO Institute for Statistics.<br />
___. 2014a. ICT in Education in Asia: A Comparative Analysis of ICT Integration <strong>and</strong> e-Readiness in Schools Across Asia.<br />
Montreal, QB, UNESCO Institute for Statistics.<br />
___. 2014b. Survey 2014: Observatory of Learning Outcomes – Instruction Manual for Completing the Catalogue of Learning<br />
Assessments. Montreal, QB, UNESCO Institute for Statistics.<br />
___. 2015. Information <strong>and</strong> Communication Technology (ICT) in Education in Sub-Saharan Africa: A Comparative Analysis of<br />
Basic e-Readiness in Schools. Montreal, QB, UNESCO Institute for Statistics.<br />
___. 2016a. Global Alliance to Monitor Learning: Concept Note. Montreal, QB, UNESCO Institute for Statistics.<br />
___. 2016b. The global <strong>and</strong> thematic indicators for SDG4-Education 2030. Paper presented at the Meeting of the SDG4-<br />
Education 2030 Steering Committee, Paris, 25–26 May.<br />
___. 2016c. A Roadmap to Better Data on Education Financing. Montreal, QB, UNESCO Institute for Statistics.<br />
___. 2016d. UIS Catalogue of Learning Assessments, Montreal, QB, UNESCO Institute for Statistics. www.uis.unesco.org/<br />
nada/en/index.php/catalogue/learning_assessments (Accessed 3 May 2016.)<br />
___. 2016e. Underst<strong>and</strong>ing What Works in Oral Reading Assessments: Recommendations from Donors, Implementers <strong>and</strong><br />
Practitioners. Montreal, QB, UNESCO Institute for Statistics.<br />
UIS <strong>and</strong> UNICEF. 2005. Children out of School: Measuring Exclusion from Primary Education. Montreal, QB/New York,<br />
UNESCO Institute for Statistics/United Nations Children’s Fund.<br />
Ukraine Ministry of Education <strong>and</strong> Science. 2016. Operational Information about Students (Pupils) of Temporarily<br />
Occupied Territories in the Autonomous Republic of Crimea, Donetsk <strong>and</strong> Lugansk Regions, Enrolled in Schools in<br />
Other Regions of the Country. Kiev, Ukraine Ministry of Education <strong>and</strong> Science. (Unpublished.)<br />
United Nations. 2006. Convention on the Rights of Persons with Disabilities. New York, United Nations.<br />
___. 2011. Programme of Action for the Least Developed Countries for the Decade 2011–2020. New York, United Nations.<br />
___. 2012. Global Education First Initiative. New York, United Nations.<br />
___. 2014a. Open Working Group Proposal for Sustainable Development Goals. New York, United Nations.<br />
___. 2014b. United Nations General Assembly, Sixty-Ninth Session, Agenda Items 13 (a) <strong>and</strong> 115: The Road to Dignity by 2030 –<br />
Ending Poverty, Transforming All Lives <strong>and</strong> Protecting the Planet. New York, United Nations.<br />
___. 2014c. A World that Counts: Mobilising the Data Revolution for Sustainable Development. New York, United Nations.<br />
___. 2015a. Transforming our World: the 2030 Agenda for Sustainable Development. New York, United Nations. (UN General<br />
Assembly Resolution 70/1.)<br />
___. 2015b. TST: Selected Follow-up <strong>and</strong> Review Processes <strong>and</strong> Platforms. New York, United Nations.<br />
___. 2015c. United Nations General Assembly, Seventieth session. Resolution adopted by the General Assembly on 25 September<br />
2015. New York, United Nations.<br />
___. 2016. United Nations General Assembly, Seventieth Session: Critical Milestones Towards Coherent, Efficient <strong>and</strong> Inclusive<br />
Follow-Up <strong>and</strong> Review at the Global Level. New York, United Nations.<br />
UN Trust Fund <strong>and</strong> Instituto Promundo. 2012. Engaging Men to Prevent Gender-Based Violence: A Multi-Country Intervention<br />
<strong>and</strong> Impact Evaluation Study. Washington, D.C, Instituto Promundo.<br />
UNAIDS. 2011. Securing the Future Today: Synthesis of Strategic Information on HIV <strong>and</strong> Young People. Geneva, Switzerl<strong>and</strong>,<br />
Joint United Nations Programme on HIV/AIDS.<br />
UNDESA. 2013. Cross-National Comparisons of Internal Migration: An Update on Global Patterns <strong>and</strong> Trends. New York,<br />
United Nations, Department of Economic <strong>and</strong> Social Affairs. (Technical Paper.)<br />
590<br />
REFERENCES
UNDP. 2004. Human Development Report 2004: Cultural liberty in Today’s Diverse World. New York, United Nations<br />
Development Programme.<br />
UNECE. 2012. Learning for the Future: Competences in Education for Sustainable Development. Geneva, Switzerl<strong>and</strong>, United<br />
Nations Economic Commission for Europe.<br />
UNESCAP. 2010. Disability at a Glance 2010: A Profile of 36 Countries <strong>and</strong> Areas in Asia <strong>and</strong> the Pacific. Bangkok, United<br />
Nations Economic <strong>and</strong> Social Commission for Asia <strong>and</strong> the Pacific.<br />
UNESCO-UNEVOC. 2016. World TVET Database. Bonn, Germany, UNESCO-UNEVOC International Centre for Technical<br />
<strong>and</strong> Vocational Education <strong>and</strong> Training. ww.unevoc.unesco.org/go.php?q=World+TVET+Database&context=<br />
(Accessed 1 June 2016.)<br />
UNESCO. 1978. Revised recommendation concerning the international st<strong>and</strong>ardization of educational statistics. Records<br />
of the General Conference, Twentieth Session, Paris, 24 October to 28 November 1978, Volume I: Resolutions. Paris, UNESCO.<br />
___. 2004. EFA Global Monitoring Report 2005: The Quality Imperative. Paris, UNESCO.<br />
___. 2005a. Aspect of Literacy Assessment: Topics <strong>and</strong> Issues from UNESCO Expert Meeting. Paris, UNESCO.<br />
___. 2005b. EFA Global Monitoring Report 2006: Literacy for Life. Paris, UNESCO.<br />
___. 2008. The Right To Education: Monitoring st<strong>and</strong>ard-setting instruments of UNESCO. Paris, UNESCO.<br />
___. 2012a. Global Education for All Meeting: 21–23 November 2012 – Draft Final Statement. Paris, UNESCO.<br />
___. 2012b. Multilingual Education: Vietnam. Bangkok, UNESCO. www.unescobkk.org/?id=16299. (Accessed 11 April 2016.)<br />
___. 2012c. Review of Policies <strong>and</strong> Strategies to Implement <strong>and</strong> Scale Up: Sexuality Education in Asia <strong>and</strong> the Pacific. Bangkok,<br />
UNESCO.<br />
___. 2013. Consolidated Report on the Implementation of the 1974 Recommendation Concerning Education for International<br />
Underst<strong>and</strong>ing, Cooperation <strong>and</strong> Peace <strong>and</strong> Education Relating to Human Rights <strong>and</strong> Fundamental Freedoms. Paris,<br />
UNESCO. (General Conference, 37th Session.)<br />
___. 2014a. EFA Global Monitoring Report 2013/4: Teaching And Learning – Achieving Quality for All. Paris, UNESCO.<br />
___. 2014b. Global Education for All Meeting, 10–14 May 2014: 2014 GEM Final Statement – The Muscat Agreement. Paris,<br />
UNESCO.<br />
___. 2014c. Holocaust Education in a Global Context. Paris, UNESCO.<br />
___. 2014d. Learning to Live Together: Education Policies <strong>and</strong> Realities in the Asia-Pacific. Paris, UNESCO.<br />
___. 2015a. Comprehensive Sexuality Education in Teacher Training in Eastern <strong>and</strong> Southern Africa. Paris, UNESCO.<br />
___. 2015b. Education 2030 Incheon Declaration <strong>and</strong> Framework for Action: Towards Inclusive <strong>and</strong> Equitable Quality Education<br />
<strong>and</strong> Lifelong Learning for All. Paris, UNESCO.<br />
___. 2015c. Education for All 2015 National Review Report: Morocco. Paris, UNESCO.<br />
___. 2015d. EFA Global Monitoring Report: Education for All 2000–2015 – Achievements <strong>and</strong> Challenges. Paris, UNESCO.<br />
___. 2015e. Emerging Evidence, Lessons <strong>and</strong> Practice in Comprehensive Sexuality Education: A Global Review. Paris, UNESCO.<br />
___. 2015f. Global Citizenship Education: Topics <strong>and</strong> Learning Objectives. Paris, UNESCO.<br />
___. 2015g. Informe de Resultados TERCE: Logros de Aprendizaje [TERCE Results Report: Learning Achievements]. Paris,<br />
UNESCO.<br />
___. 2015h. Measuring the Education Sector Response to HIV <strong>and</strong> AIDS: H<strong>and</strong>book – Supporting Country-level Data Collection<br />
for Core Indicators. Paris, UNESCO.<br />
___. 2015i. Pricing the Right to Education: The Cost of Reaching New Targets by 2030. Paris, UNESCO. (EFA Global Monitoring<br />
Report Policy Paper 18.)<br />
___. 2015j. School-Related Gender-Based Violence Is Preventing the Achievement of Quality Education For All. Paris, UNESCO.<br />
(Policy Paper 17.)<br />
___. 2016a. Country Profile: Niger. Paris, UNESCO. www.unesco.org/uil/litbase/?menu=13&country=NE&programme=191.<br />
(Accessed 1 March 2016.)<br />
___. 2016b. Database on the Right to Education. Paris, UNESCO. www.unesco.org/education/edurights. (Accessed 1 June<br />
2016.)<br />
___. 2016c. Evaluation of the Education for All (EFA) Coordination Mechanisms. Paris, UNESCO.<br />
___. 2016d. If You Don’t Underst<strong>and</strong>, How Can You Learn? Paris, UNESCO. (Global Education Monitoring Report Policy<br />
Paper 24.)<br />
___. 2016e. Implementation of St<strong>and</strong>ard-Setting Instruments: Part I, General Monitoring. Paris, UNESCO. (Executive Board,<br />
199th session.)<br />
2016 • GLOBAL EDUCATION MONITORING REPORT 591
UNESCO <strong>and</strong> UNAIDS. 2013. 2011–2012 Education Sector HIV <strong>and</strong> AIDS Global Progress Survey: Progression, Regression or<br />
Stagnation. Paris, UNESCO.<br />
UNESCO <strong>and</strong> UNFPA. 2012. Sexuality Education: A Ten-Country Review of School Curricula in East <strong>and</strong> Southern Africa. Paris/<br />
New York, UNESCO/United Nations Population Fund.<br />
UNESCO <strong>and</strong> UNHCR. 2016. No More Excuses: Provide Education to All Forcibly Displaced People. Paris, UNESCO. (Global<br />
Education Monitoring Report Policy Paper 26.)<br />
UNEVOC. 2014. Promising Practices: New Opportunities Initiative, Portugal. Bonn, Germany, UNESCO-UNEVOC<br />
International Centre for Technical <strong>and</strong> Vocational Education <strong>and</strong> Training. www.unevoc.unesco.org/<br />
go.php?q=Promising+Practices+List&id=2 (Accessed 10 June 2016.)<br />
UNFPA. 2007. Framework for Action on Adolescents <strong>and</strong> Youth: Opening Doors With Young People – 4 Keys. New York, United<br />
Nations Population Fund.<br />
___. 2016. Presentation on Tier III Indicator: UNFPA Indicator 5.6.1. New York, United Nations Population Fund.<br />
UNHCR. 2015a. Living in the Shadows: Jordan Home Visits Report 2014. Amman, United Nations High Commissioner for<br />
Refugees.<br />
___. 2015b. UNHCR Mid-Year Trends 2015. Geneva, Switzerl<strong>and</strong>, United Nations High Commissioner for Refugees.<br />
___. 2015c. World at War: UNHCR Global Trends Forced Displacement in 2014. Geneva, Switzerl<strong>and</strong>, United Nations High<br />
Commissioner for Refugees<br />
___. 2016. Chad Country Operation Data 2016. New York, United Nations High Commissioner for Refugees.<br />
(Unpublished.)<br />
UNIACC. 2010. Final evaluation of the implementation of the first phase of the World Programme for Human Rights Education:<br />
Report of the United Nations Inter-Agency Coordinating Committee (UNIACC) on Human Rights Education in the School<br />
System. Geneva, Switzerl<strong>and</strong>, United Nations.<br />
UNICEF. 2010. Raising Clean H<strong>and</strong>s: Advancing Learning, Health <strong>and</strong> Participation through WASH in Schools. New York, UNICEF.<br />
___. 2011a. UNICEF: Nordic Study On Child Rights To Participate 2009–2010, Helsinki, Innolink Research.<br />
___. 2011b. WASH in Schools Monitoring Package. New York, UNICEF.<br />
___. 2012a. A Framework <strong>and</strong> Tool Box for Monitoring <strong>and</strong> Improving Quality. New York, UNICEF.<br />
___. 2012b. Lao Cai Primary Classroom Language Profile. Hanoi, UNICEF.<br />
___. 2013a. Escuelas de comunidades indígenas en Paraguay: Análisis de datos 2006–2011. Asunción, UNICEF.<br />
___. 2013b. Towards More Child-Focused Social Investments: Snapshot of Social Sector Public Budget Allocations <strong>and</strong> Spending<br />
in Myanmar. Yangon, UNICEF.<br />
___. 2014a. Access to School <strong>and</strong> the Learning Environment: Physical, Information <strong>and</strong> Communication. New York, UNICEF.<br />
(Companion Technical Booklet, Webinar 10.)<br />
___. 2014b. Education Management Information Systems <strong>and</strong> Children with Disabilities. New York, UNICEF. (Companion<br />
Technical Booklet, Webinar 6.)<br />
___. 2014c. Ending Child Marriage: Progress <strong>and</strong> Prospects. New York, UNICEF.<br />
___. 2014d. Hidden in Plain Sight: A Statistical Analysis of Violence Against Children. New York, UNICEF.<br />
___. 2014e. Measuring Violence Against Children: Inventory <strong>and</strong> Assessment of Quantitative Studies. New York, UNICEF.<br />
___. 2014f. Planning, Monitoring <strong>and</strong> Evaluation. New York, UNICEF. (Companion Technical Booklet, Webinar 14 )<br />
___. 2014g. UNICEF Annual Report 2014: Morocco. New York, UNICEF.<br />
___. 2015a. Advancing WASH in Schools Monitoring. New York, UNICEF.<br />
___. 2015b. Analyse de la Situation des Enfants et des Femmes en RDC 2015: Vers la Réalisation du Droit à une Éducation de<br />
Qualité Pour Tous. New York, UNICEF.<br />
___. 2015c. Methodological Work: Assessment of Learning Outcomes New York, UNICEF. http://mics.unicef.org/<br />
methodological_work/2/ASSESSMENT-OF-LEARNING-OUTCOMES. (Accessed 22 April 2016.)<br />
___. 2015d. Nigeria Conflict Forces More Than 1 Million Children from School. Dakar, UNICEF. www.unicef.org/wcaro/english/<br />
media_9863.html. (Accessed 29 April 2016.)<br />
___. 2015e. Reimagine the Future: Innovation for Every Child. New York, UNICEF.<br />
___. 2016a. In Certain Cultures, Violence May be Perceived as a Normal <strong>and</strong> Acceptable Way to Resolve Conflict. New York,<br />
UNICEF.<br />
___. 2016b. UNICEF Multiple Indicator Cluster Survey Questionnaire Module on Child Functioning <strong>and</strong> Disability for Children Age<br />
5 to 17. New York, UNICEF.<br />
592<br />
REFERENCES
UNICEF <strong>and</strong> WHO. 2015. Progress on Sanitation <strong>and</strong> Drinking Water: 2015 Update <strong>and</strong> MDG Assessment. New York/Geneva,<br />
UNICEF/World Health Organization.<br />
UNICEF, WHO <strong>and</strong> World Bank. 2012. UNICEF-WHO-The World Bank Joint Child Malnutrition Estimates. New York/Geneva,<br />
Switzerl<strong>and</strong>/Washington, DC, UNICEF/World Health Organization/World Bank.<br />
UNICEF <strong>and</strong> WHO. 2015. JMP Green Paper: Global Monitoring of Water, Sanitation <strong>and</strong> Hygiene post-2015. New York/Geneva,<br />
Switzerl<strong>and</strong>, UNICEF/World Health Organization.<br />
UNISDR. 2011. School Safety Baseline Study. Geneva, Switzerl<strong>and</strong>, United Nations International Strategy for Disaster<br />
Reduction.<br />
United Republic of Tanzania Government. 2013. Big Result Now in Education Sector: Summary. Dar es Salaam, United<br />
Republic of Tanzania Ministry of Education, Science, Technology <strong>and</strong> Vocational Training.<br />
Unterhalter, E. 2015. Concept Paper Prepared for London Workshop Beyond Parity: Measuring Gender Inequality <strong>and</strong> Equality<br />
in Education. Paper for Beyond Parity: Measuring Gender Equality in Education, London, 18–19 September.<br />
UN Women, U. 2015. Monitoring Gender Equality <strong>and</strong> the Empowerment of Women <strong>and</strong> Girls in the 2030 Agenda for<br />
Sustainable Development: Opportunities <strong>and</strong> Challenges. New York, United Nation Entity for Gender Equality <strong>and</strong> the<br />
Empowerment of Women.<br />
Usher, A. <strong>and</strong> Medow, J. 2010. Global Higher Education Rankings 2010: Affordability <strong>and</strong> Accessibility in Comparative<br />
Perspective. Toronto, ON, Higher Education Strategy Associates.<br />
Ussene, V. 2016. Country profiles of formal <strong>and</strong> non-formal adult education opportunities in literacy, numeracy <strong>and</strong> other<br />
skills for acquisition <strong>and</strong> retention: Mozambique. (Background paper for International Council on Adult Education<br />
Commission on Adult Education, Organisation <strong>and</strong> Financing.)<br />
Vaillant, D. 2015. School leadership, trends in policies <strong>and</strong> practices, <strong>and</strong> improvement in the quality of education. (Background<br />
paper for EFA Global Monitoring Report 2015.)<br />
Vallet, L. A. <strong>and</strong> Montjourides, P. 2015. Underst<strong>and</strong>ing <strong>and</strong> measuring inequality in higher education. Paper for Framing <strong>and</strong><br />
Measuring Inequalities in Post-2015 Education Targets, Paris, 1–2 December.<br />
van Ijzendoorn, M., Bakersman-Kranenburg, M. <strong>and</strong> Ebstein, R. 2011. Methylation matters in child development: toward<br />
developmental behavioral epigenetics. Child Development Perspectives, Vol. 5, No. 4, pp. 305–10.<br />
V<strong>and</strong>ell, D., Belsky, J., Burchinal, M., Steinberg, L., V<strong>and</strong>ergrift, N. <strong>and</strong> NICHD Early Child Care Research Network 2010.<br />
Do effects of early child care extend to age 15 years? Results from the NICHD study of early child care <strong>and</strong> youth<br />
development. Child Development, Vol. 81, No. 3, pp. 756–83.<br />
Vanna, P. 2016. Country profiles of formal <strong>and</strong> non-formal adult education opportunities in literacy, numeracy <strong>and</strong> other skills:<br />
Cambodia. (Background paper for International Council on Adult Education Commission on Adult Education,<br />
Organisation <strong>and</strong> Financing.)<br />
Veal, K. 2009. Overview: competencies, qualifications, <strong>and</strong> recognition. R. Maclean <strong>and</strong> D. Wilson (eds), International<br />
H<strong>and</strong>book of Education for the Changing World of Work: Bridging Academic <strong>and</strong> Vocational Learning, Vol. 6. Dordrecht,<br />
the Netherl<strong>and</strong>s, Springer Science & Business Media, pp. 2763–76.<br />
Verdisco, A., Cueto, S., Thompson, J., Engle, P., Neuschmidt, O., Meyer, S., González, G., Oré, B., Hepworth, K. <strong>and</strong> Mir<strong>and</strong>a,<br />
A. 2015. Urgency <strong>and</strong> Possibility Results of PRIDI: A First Initiative to Create Regionally Comparative Data on Child<br />
Development in Four Latin American Countries. Technical Annex. Washington, DC, Inter-American Development Bank.<br />
Vermeer, H. J., van IJzendoorn, M. H., Cárcamo, R. A. <strong>and</strong> Harrison, L. J. 2016. Quality of child care using the<br />
environment rating scales: a meta-analysis of international studies. International Journal of Early Childhood, Vol. 48,<br />
No. 1, pp. 33–60.<br />
Walker, S. P., Wachs, T. D., Gardner, J. M., Lozoff, B., Wasserman, G. A., Pollitt, E., Carter, J. A. <strong>and</strong> International Child<br />
Development Steering Group. 2007. Child development: risk factors for adverse outcomes in developing<br />
countries. The Lancet, Vol. 369, No. 9556, pp. 145–57.<br />
Walter, S. L. <strong>and</strong> Benson, C. 2012. Language Policy <strong>and</strong> Medium of Instruction in Formal Education. B. Spolsky (ed.), The<br />
Cambridge H<strong>and</strong>book of Language Policy. Cambridge, UK, Cambridge University Press, pp. 278–300.<br />
Washington Group. 2006. Overview of Implementation Protocols for Testing the Washington Group Short Set of Questions on<br />
Disability. Kampala, Ug<strong>and</strong>a, Washington Group on Disability Statistics.<br />
Washington Group <strong>and</strong> UNICEF. 2014. Module on Child Functioning <strong>and</strong> Disability. New York, UNICEF.<br />
Westbrook, J., Durrani, N., Brown, R., Orr, D., Pryor, J., Boddy, J. <strong>and</strong> Salvi, F. 2013. Pedagogy, Curriculum, Teaching Practices<br />
<strong>and</strong> Teacher Education in Developing Countries. London, UK Department for International Development.<br />
2016 • GLOBAL EDUCATION MONITORING REPORT 593
WHO. 2013. Global <strong>and</strong> Regional Estimates of Violence Against Women: Prevalence <strong>and</strong> Health Effects of Intimate Partner<br />
Violence <strong>and</strong> Non-Partner Sexual Violence. Geneva, Switzerl<strong>and</strong>, World Health Organization.<br />
___. 2015. Global Health Observatory Data Repository. Geneva, Switzerl<strong>and</strong>, World Health Organization. http://apps.who.<br />
int/gho/data/?theme=home. (Accessed 15 December 2015.)<br />
WHO <strong>and</strong> UN Water. 2012. UN Water Global Analysis <strong>and</strong> Assessment of Sanitation <strong>and</strong> Drinking Wate (GLAAS) 2012: The<br />
Challenge of Extending <strong>and</strong> Sustaining Services. Geneva, Switzerl<strong>and</strong>, World Health Organization/UN Water Global<br />
Analysis <strong>and</strong> Assessment of Sanitation <strong>and</strong> Drinking Water.<br />
___. 2014. UN Water Global Analysis <strong>and</strong> Assessment of Sanitation <strong>and</strong> Drinking Wate (GLAAS) 2014: Investing in Water <strong>and</strong><br />
Sanitation – Increasing Access, Reducing Inequalities. Geneva, Switzerl<strong>and</strong>, World Health Organization/UN Water<br />
Global Analysis <strong>and</strong> Assessment of Sanitation <strong>and</strong> Drinking Water.<br />
Witt, L. A. <strong>and</strong> Ferris, G. R. 2003. Social skill as moderator of the conscientiousness-performance relationship:<br />
convergent results across four studies. Journal of Applied Psychology, Vol. 88, No. 5, pp. 809–27.<br />
Wodon, Q. 2014. Education in Sub-Saharan Africa: Comparing Faith-Inspired, Private Secular, <strong>and</strong> Public Schools. Washington,<br />
DC, World Bank.<br />
Wodon, Q. 2016. School Infrastructure in Paraguay: Needs, Investments, <strong>and</strong> Costs. Washington, DC, World Bank.<br />
World Bank. 2010. Promoting the Institutionalization of National Health Accounts: A Global Strategic Action Plan. Washington,<br />
DC, World Bank.<br />
___. 2011. SABER Student Assessment Country Report: Armenia 2011. Washington, DC, World Bank.<br />
___. 2012a. Serbia: Student Assessment. Washington, DC, World Bank. (SABER Country Report 79942.)<br />
___. 2012b. Service Delivery Indicators: Tanzania. Washington, DC, World Bank.<br />
___. 2013a. Malaysia Workforce Development. Washington, DC, World Bank. (SABER Country Report.)<br />
___. 2013b. Mauritania: Student Assessment. Washington, DC, World Bank. (SABER Country Report 90048.)<br />
___. 2013c. Myanmar Economic Monitor. Washington, DC, World Bank.<br />
___. 2013d. What Matters for Workforce Development: A Framework <strong>and</strong> Tool for Analysis. Washington, DC, World Bank.<br />
(SABER Working Paper Series 6.)<br />
___. 2013e. The What, Why, <strong>and</strong> How of the Systems Approach for Better Education Results (SABER). Washington, DC, World<br />
Bank.<br />
___. 2014a. Democratic Republic of the Congo: Student Assesment. Washington, DC, World Bank. (SABER Country Report.)<br />
___. 2014b. Implementation Completion <strong>and</strong> Results Report (IBRD-82660) on a Loan in the Amount of Eur 78.1 Million<br />
(US$100.0 Million Equivalent) to the Kingdom of Morocco for a Second Education Development Policy Loan. Washington,<br />
DC, World Bank.<br />
___. 2014c. Sri Lanka Workforce Development. Washington, DC, World Bank. (SABER Country Report.)<br />
___. 2014d. STEP Skills Measurement: Snapshot 2014. Washington, DC, World Bank.<br />
___. 2015a. Education Global Practice: Smarter Education Systems for Brighter Futures. Snapshot – Supporting Great Teaching.<br />
Washington, DC, World Bank.<br />
___. 2015b. Global Program for Safe School Facilities (Draft Proposal). Washington, DC, GFDRR/Sustainable Development<br />
Network.<br />
___. 2015c. International Development Association: Program Document for a Proposed Credit in the Amount Equivalent to<br />
US$ 100 Million (SDR 71.1 Million) to the United Republic of Tanzania for a First Open Government <strong>and</strong> Public Financial<br />
Management Development Policy Operation. Washington, DC, World Bank.<br />
___. 2015d. Myanmar Economic Monitor. Washington, DC, World Bank.<br />
___. 2015e. Public Expenditure Review of the Education Sector in the Democratic Republic of Congo: An Efficiency, Effectiveness,<br />
<strong>and</strong> Equity Analysis. Washington, DC, World Bank.<br />
___. 2016a. SABER Student assessment ratings <strong>and</strong> data. Washington, DC, World Bank. http://saber.worldbank.org/index.<br />
cfm?indx=4&pd=5&sub=0. (Accessed 4 April 2016.)<br />
___. 2016b. SABER teachers ratings <strong>and</strong> data. Washington, DC, World Bank. http://saber.worldbank.org/index.<br />
cfm?indx=4&pd=1&sub=0. (Accessed 10 April 2016.)<br />
___. 2016c. What Matters Most for Equity <strong>and</strong> Inclusion in Education Systems: A Framework Paper. Washington, DC, World<br />
Bank. (SABER Working Paper 10.)<br />
World Bank <strong>and</strong> AusAid. 2013. Rapid Assessment of the Financing of the Education Sector in Myanmar. Washington, DC/<br />
Canberra, World Bank/AusAid.<br />
594<br />
REFERENCES
Wortham, S. C. 2013. Common Characteristics <strong>and</strong> Unique Qualities in Preschool Programs: Global Perspectives in Early<br />
Childhood Education. Dordrecht, the Netherl<strong>and</strong>s, Springer.<br />
Yoshikawa, H., Weil<strong>and</strong>, C., Brooks-Gunn, J., Burchinal, M., Espinosa, L., Gormley, W., Ludwig, J. O., Magnuson, K. A.,<br />
Phillips, D. A. <strong>and</strong> Zaslow, M. J. 2013. Investing in Our Future: The Evidence Base on Preschool Education. New York/Ann<br />
Arbor, MI, Foundation for Child Development/Society for Research in Child Development.<br />
Youth Entrepreneurship Development. 2015. Where We Work: Palestine. Baltimore, MD, International Youth Foundation.<br />
www.iyfnet.org/country/palestine. (Accessed 9 February 2016.)<br />
Yusuf, A. 2007. Normative Action in Education, Science <strong>and</strong> Culture: Essays in Commemoration of the Sixtieth Anniversary of<br />
UNESCO. Paris, UNESCO. (St<strong>and</strong>ard Setting in UNESCO.)<br />
Zeng, H., Huang, R., Zhao, Y. <strong>and</strong> Zhang, J. 2012. ICT <strong>and</strong> OD in Education for Rural Development: Current Situation <strong>and</strong> Good<br />
Practices in China. Beijing, UNESCO International Research <strong>and</strong> Training Centre for Rural Education.<br />
Zhou, K. 2016. Non-cognitive skills: definitions, measurement <strong>and</strong> malleability. (Background paper for Global Education<br />
Monitoring Report 2016.)<br />
Zill, N. <strong>and</strong> Ziv, Y. 2007. Toward A Global Indicator of Early Child Development: Summary Report. New York, UNICEF.<br />
Zimbabwe National Statistics Agency. 2015. Zimbabwe Multiple Indicator Cluster Survey 2104: Final Report. Harare,<br />
Zimbabwe National Statistics Agency.<br />
Epilogue<br />
United Nations. 2015. United Nations General Assembly, Seventieth session. Resolution adopted by the General Assembly on<br />
25 September 2015. New York, United Nations.<br />
___. 2016a. Note by the Secretariat- Report of executive summaries of volunteer countries on voluntary national reviews for the<br />
high-level political forum. New York, United Nations.<br />
___. 2016b. The Sustainable Development Goals Report 2016. New York, Department of Economic <strong>and</strong> Social Affairs.<br />
___. 2016c. United Nations General Assembly, Seventieth Session. Critical Milestones Towards Coherent, Efficient <strong>and</strong> Inclusive<br />
Follow-Up <strong>and</strong> Review at the Global Level. New York, United Nations.<br />
V<strong>and</strong>emoortele, J. 2014. Post-2015 agenda: mission impossible? Development Studies Research, Vol. 1, No. 1, pp. 223–32.<br />
2016 • GLOBAL EDUCATION MONITORING REPORT 595
Education for<br />
<strong>people</strong> <strong>and</strong> <strong>planet</strong>:<br />
CREATING SUSTAINABLE FUTURES FOR ALL<br />
Education for People <strong>and</strong> Planet: Creating Sustainable Futures for All explores<br />
the complex relationship between education <strong>and</strong> the new 2030 Agenda<br />
for Sustainable Development, covering six fundamental pillars – Planet,<br />
Prosperity, People, Peace, Place <strong>and</strong> Partnerships. This report shows<br />
that education will not deliver its full potential unless participation rates<br />
increase dramatically <strong>and</strong> sustainable development guides education<br />
system reform. It also warns of the destructive impact that climate<br />
change, conflict, unsustainable consumption <strong>and</strong> the increasing gap<br />
between rich <strong>and</strong> poor have on education. A huge transformation is<br />
needed if we are to create sustainable futures for all.<br />
This edition of the Global Education Monitoring Report (GEM Report)<br />
is the first in a series that will assess the progress of education under<br />
the new Sustainable Development Goals (SDGs). The GEM Report<br />
provides evidence-based recommendations on the policies, strategies<br />
<strong>and</strong> programmes needed to meet the ambitious Education 2030 vision.<br />
It discusses the challenges of monitoring progress on the new global<br />
education goal <strong>and</strong> targets to ensure improvement in access, participation,<br />
completion, learning <strong>and</strong> reduced inequality. It provides readers with an<br />
authoritative source to enable them to argue for the value <strong>and</strong> importance<br />
of education at all levels of decision-making.<br />
The GEM Report is an editorially independent, evidence-based publication<br />
that serves as an indispensable tool to promote informed dialogue <strong>and</strong><br />
increase awareness about progress <strong>and</strong> challenges in education. This series<br />
of reports has assessed progress in education in some 200 countries<br />
<strong>and</strong> territories since 2002. Building on this experience, <strong>and</strong> with a new<br />
m<strong>and</strong>ate to monitor education progress in the SDGs, the GEM Report will<br />
serve as a key global resource for the follow-up <strong>and</strong> review process over<br />
the next fifteen years.<br />
United Nations<br />
Educational, Scientific <strong>and</strong><br />
Cultural Organization<br />
Sustainable<br />
Development<br />
Goals<br />
Sustainable<br />
Development<br />
Goals<br />
9 789231 001673<br />
www.unesco.org/publishing • www.unesco.org/gemreport