Weights of Road Accident Causes using Analytic Hierarchy Process
Weights of Road Accident Causes using Analytic Hierarchy Process
Weights of Road Accident Causes using Analytic Hierarchy Process

Create successful ePaper yourself
Turn your PDF publications into a flip-book with our unique Google optimized e-Paper software.
VOL. 2, NO. 2, March 2012 ISSN 2225-7217<br />
ARPN Journal <strong>of</strong> Science and Technology<br />
©2011-2012. All rights reserved.<br />
http://www.ejournal<strong>of</strong>science.org<br />
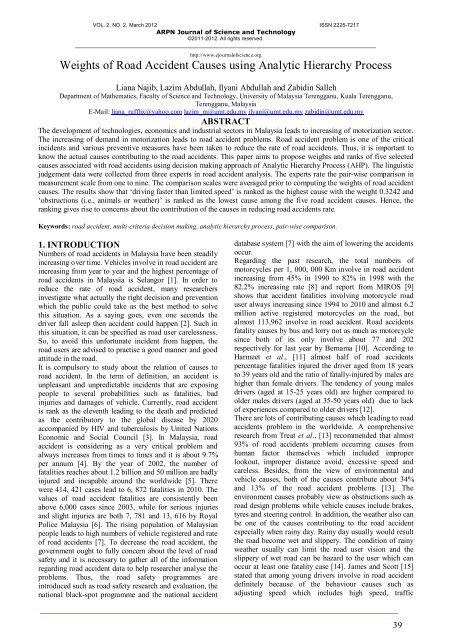
<strong>Weights</strong> <strong>of</strong> <strong>Road</strong> <strong>Accident</strong> <strong>Causes</strong> <strong>using</strong> <strong>Analytic</strong> <strong>Hierarchy</strong> <strong>Process</strong><br />
Liana Najib, Lazim Abdullah, Ilyani Abdullah and Zabidin Salleh<br />
Department <strong>of</strong> Mathematics, Faculty <strong>of</strong> Science and Technology, University <strong>of</strong> Malaysia Terengganu, Kuala Terengganu,<br />
Terengganu, Malaysia<br />
E-Mail: liana_rufflix@yahoo.com lazim_m@umt.edu.my ilyani@umt.edu.my zabidin@umt.edu.my<br />
ABSTRACT<br />
The development <strong>of</strong> technologies, economics and industrial sectors in Malaysia leads to increasing <strong>of</strong> motorization sector.<br />
The increasing <strong>of</strong> demand in motorization leads to road accident problems. <strong>Road</strong> accident problem is one <strong>of</strong> the critical<br />
incidents and various preventive measures have been taken to reduce the rate <strong>of</strong> road accidents. Thus, it is important to<br />
know the actual causes contributing to the road accidents. This paper aims to propose weights and ranks <strong>of</strong> five selected<br />
causes associated with road accidents <strong>using</strong> decision making approach <strong>of</strong> <strong>Analytic</strong> <strong>Hierarchy</strong> <strong>Process</strong> (AHP). The linguistic<br />
judgement data were collected from three experts in road accident analysis. The experts rate the pair-wise comparison in<br />
measurement scale from one to nine. The comparison scales were averaged prior to computing the weights <strong>of</strong> road accident<br />
causes. The results show that ‘driving faster than limited speed’ is ranked as the highest cause with the weight 0.3242 and<br />
‘obstructions (i.e., animals or weather)’ is ranked as the lowest cause among the five road accident causes. Hence, the<br />
ranking gives rise to concerns about the contribution <strong>of</strong> the causes in reducing road accidents rate.<br />
Keywords: road accident, multi-criteria decision making, analytic hierarchy process, pair-wise comparison.<br />
1. INTRODUCTION<br />
Numbers <strong>of</strong> road accidents in Malaysia have been steadily<br />
increasing over time. Vehicles involve in road accident are<br />
increasing from year to year and the highest percentage <strong>of</strong><br />
road accidents in Malaysia is Selangor [1]. In order to<br />
reduce the rate <strong>of</strong> road accident, many researchers<br />
investigate what actually the right decision and prevention<br />
which the public could take as the best method to solve<br />
this situation. As a saying goes, even one seconds the<br />
driver fall asleep then accident could happen [2]. Such in<br />
this situation, it can be specified as road user carelessness.<br />
So, to avoid this unfortunate incident from happen, the<br />
road users are advised to practise a good manner and good<br />
attitude in the road.<br />
It is compulsory to study about the relation <strong>of</strong> causes to<br />
road accident. In the term <strong>of</strong> definition, an accident is<br />
unpleasant and unpredictable incidents that are exposing<br />
people to several probabilities such as fatalities, bad<br />
injuries and damages <strong>of</strong> vehicle. Currently, road accident<br />
is rank as the eleventh leading to the death and predicted<br />
as the contributory to the global disease by 2020<br />
accompanied by HIV and tuberculosis by United Nations<br />
Economic and Social Council [3]. In Malaysia, road<br />
accident is considering as a very critical problem and<br />
always increases from times to times and it is about 9.7%<br />
per annum [4]. By the year <strong>of</strong> 2002, the number <strong>of</strong><br />
fatalities reaches about 1.2 billion and 50 million are badly<br />
injured and incapable around the worldwide [5]. There<br />
were 414, 421 cases lead to 6, 872 fatalities in 2010. The<br />
values <strong>of</strong> road accident fatalities are consistently been<br />
above 6,000 cases since 2003, while for serious injuries<br />
and slight injuries are both 7, 781 and 13, 616 by Royal<br />
Police Malaysia [6]. The rising population <strong>of</strong> Malaysian<br />
people leads to high numbers <strong>of</strong> vehicle registered and rate<br />
<strong>of</strong> road accidents [7]. To decrease the road accident, the<br />
government ought to fully concern about the level <strong>of</strong> road<br />
safety and it is necessary to gather all <strong>of</strong> the information<br />
regarding road accident data to help researcher analyse the<br />
problems. Thus, the road safety programmes are<br />
introduced such as road safety research and evaluation, the<br />
national black-spot programme and the national accident<br />
database system [7] with the aim <strong>of</strong> lowering the accidents<br />
occur.<br />
Regarding the past research, the total numbers <strong>of</strong><br />
motorcycles per 1, 000, 000 Km involve in road accident<br />
increasing from 45% in 1990 to 82% in 1998 with the<br />
82.2% increasing rate [8] and report from MIROS [9]<br />
shows that accident fatalities involving motorcycle road<br />
user always increasing since 1994 to 2010 and almost 6.2<br />
million active registered motorcycles on the road, but<br />
almost 113,962 involve in road accident. <strong>Road</strong> accidents<br />
fatality causes by bus and lorry not as much as motorcycle<br />
since both <strong>of</strong> its only involve about 77 and 202<br />
respectively for last year by Bernama [10]. According to<br />
Harmeet et al., [11] almost half <strong>of</strong> road accidents<br />
percentage fatalities injured the driver aged from 18 years<br />
to 39 years old and the ratio <strong>of</strong> fatally-injured by males are<br />
higher than female drivers. The tendency <strong>of</strong> young males<br />
drivers (aged at 15-25 years old) are higher compared to<br />
older males drivers (aged at 35-50 years old) due to lack<br />
<strong>of</strong> experiences compared to older drivers [12].<br />
There are lots <strong>of</strong> contributing causes which leading to road<br />
accidents problem in the worldwide. A comprehensive<br />
research from Treat et al., [13] recommended that almost<br />
93% <strong>of</strong> road accidents problem occurring causes from<br />
human factor themselves which included improper<br />
lookout, improper distance avoid, excessive speed and<br />
careless. Besides, from the view <strong>of</strong> environmental and<br />
vehicle causes, both <strong>of</strong> the causes contribute about 34%<br />
and 13% <strong>of</strong> the road accident problems [13]. The<br />
environment causes probably view as obstructions such as<br />
road design problems while vehicle causes include brakes,<br />
tyres and steering control. In addition, the weather also can<br />
be one <strong>of</strong> the causes contributing to the road accident<br />
especially when rainy day. Rainy day usually would result<br />
the road become wet and slippery. The condition <strong>of</strong> rainy<br />
weather usually can limit the road user vision and the<br />
slippery <strong>of</strong> wet road can be hazard to the user which can<br />
occur at least one fatality case [14]. James and Scott [15]<br />
stated that among young drivers involve in road accident<br />
definitely because <strong>of</strong> the behaviour causes such as<br />
adjusting speed which includes high speed, traffic<br />
39
VOL. 2, NO. 2, March 2012 ISSN 2225-7217<br />
ARPN Journal <strong>of</strong> Science and Technology<br />
©2011-2012. All rights reserved.<br />
conditions and other (20.8%), attention in the road (23%)<br />
and emergencies such as tyres and brakes failure (1.4%).<br />
The tyres and brakes defect usually because <strong>of</strong> lack <strong>of</strong><br />
maintenance and services. As mentioned above,<br />
drowsiness also leads to road accident with the percentage<br />
<strong>of</strong> 3.9% [2]. Generally the drowsy drivers could contribute<br />
themselves to the statistic <strong>of</strong> the road accident injured and<br />
that is why the drowsy can be one <strong>of</strong> the hazard factors<br />
contributing to the road accident.<br />
In order to overcome the road accidents problem, there are<br />
lots <strong>of</strong> researches on investigating the causal <strong>of</strong> road<br />
accident, but generally lack <strong>of</strong> study about the decision on<br />
the most important causes contributing to the road<br />
accidents. Fuzzy approach can be one <strong>of</strong> method to<br />
recognize the causes associated with road accident since<br />
road accident problems are one <strong>of</strong> the uncertainty cases to<br />
happen. Recently, Lazim Abdullah and Nurnadiah Zamri<br />
[16] used correlation analysis and Fuzzy TOPSIS to rank<br />
the factors <strong>of</strong> road accidents. Correlation analysis uses<br />
statistical data to measures the variables and Fuzzy<br />
TOPSIS uses the linguistic data collected from the expert<br />
and as part <strong>of</strong> multi-criteria decision making (MCDM).<br />
Hence, the decision making <strong>using</strong> Fuzzy approach can be<br />
use to decide the main factors <strong>of</strong> the road accidents<br />
problem. One <strong>of</strong> the most well-known methods in<br />
determining the weight for priority factors <strong>of</strong> the problem<br />
is <strong>Analytic</strong> <strong>Hierarchy</strong> <strong>Process</strong> (AHP). The AHP is<br />
practically used in many fields such as health issues,<br />
management and business, banking, sciences and<br />
engineering courses. For example, Lazim and Fateen [17]<br />
discuss the weight determination <strong>of</strong> factors related to<br />
obesity by <strong>using</strong> AHP procedures. By AHP procedures,<br />
the weight <strong>of</strong> each the factors associated with obesity is<br />
defined by comparison <strong>of</strong> pair-wise measurement for each<br />
<strong>of</strong> the factors. Recently, Liberatore [18] applied the<br />
application <strong>of</strong> AHP in medical and health care decision<br />
making. In business and economics, the AHP method can<br />
be used to define the optimum ranking <strong>of</strong> stocks for the<br />
portfolio [19]. Esra et al., [20] has been use AHP<br />
procedures to improve employee performance in<br />
organization. In addition, Hambali et al., [21] also uses<br />
AHP to select the best design concept and emphasizes the<br />
importance <strong>of</strong> making accurate decision in manufacturing<br />
and designing industrial. Newly, Sambasivan et al., [22]<br />
used the AHP to find the relative weights factors and<br />
benefits in the electrical and electronic sectors in<br />
Malaysia. Since AHP had been used widely in the many<br />
areas, thus the main purposes <strong>of</strong> this paper is to determine<br />
the weight and rank <strong>of</strong> the factors related to road accident<br />
problems. The finding from this research would help the<br />
public to understand the causal <strong>of</strong> the road accident.<br />
2. ANALYTIC HIERARCHY PROCESS<br />
The analytic hierarchy process (AHP) is a mathematical<br />
device in multi-criteria decision making which designing<br />
the decision factors in a hierarchic problem structure [23].<br />
The main target <strong>of</strong> the AHP is to decide and help decision<br />
makers in making resolution for the complex problem by<br />
structuring the criterion hierarchy <strong>of</strong> multi-criteria<br />
decision making (MCDM). The AHP is known as the most<br />
powerful tools for decision making. As the first part <strong>of</strong><br />
http://www.ejournal<strong>of</strong>science.org<br />
AHP procedures, the determination <strong>of</strong> focus or aim <strong>of</strong> the<br />
problem must identify. It is consider as the first level for<br />
the AHP hierarchy, next would be multiple criterion that<br />
define alternatives and the last level is the contributing<br />
alternatives (causes/factors) for the focus. The standard<br />
scale with absolute numbers would use as a measurement<br />
in order to manage the weight <strong>of</strong> each alternatives. The<br />
weight can be used as comparing and ranking the<br />
alternatives <strong>of</strong> the problem and lead the decision maker in<br />
making choice. The AHP method has the following<br />
general steps:<br />
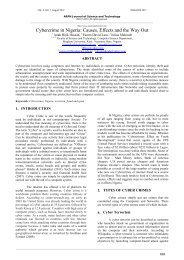
a) Construct a hierarchy structure for an MADM<br />
problem.<br />
Figure-1. <strong>Hierarchy</strong> <strong>of</strong> Alternatives Selection.<br />
b) Scaling the relative <strong>of</strong> data and constructing the pairwise<br />
comparison matrixes. For this step, construct the<br />
comparison matrixes <strong>of</strong> each attributes (criteria).<br />
Thus, the matrixes would be:<br />
C 1 C 2 � n C A ij<br />
C 1 1 1 / w2<br />
w � w 1 / wn<br />
1 w<br />
C 2 w 2 / w1<br />
1 � w 2 / wn<br />
2 w<br />
� � � � � = �<br />
C n wn / w1<br />
/ w2<br />
wn � 1 w n<br />
The scale should be measurement from 1 to 9 in a<br />
fundamental scale <strong>of</strong> measurement provided by Saaty<br />
(1980). The measurement scale is shown in Table-2.1.<br />
Table-2.1. Pair-wise Comparison Scale for<br />
AHP Preference.<br />
Preference on pair wise<br />
Preference<br />
comparison<br />
number<br />
Equally important 1<br />
Moderately more important 3<br />
Strongly more important 5<br />
Very strong more important 7<br />
Extremely more important 9<br />
Intermediate value 2, 4, 6, 8<br />
c) Calculating <strong>of</strong> matrix eigenvector, Aij and consistency<br />
index test (CI) <strong>of</strong> the criterion. For matrix eigenvector,<br />
A multiply the n elements in each row, take the nth<br />
ij<br />
40
VOL. 2, NO. 2, March 2012 ISSN 2225-7217<br />
ARPN Journal <strong>of</strong> Science and Technology<br />
©2011-2012. All rights reserved.<br />
root, and prepare a new column for the resulting<br />
values. Then divide each number by the sum <strong>of</strong><br />
resulting values <strong>of</strong> the new column [21].<br />
ij<br />
Eigenvector, A =<br />
⎡ n<br />
⎢<br />
⎢⎣<br />
i=<br />
⎡<br />
∑<br />
1<br />
∑ ⎢∑<br />
⎢⎣<br />
( w / w × w / w × ... × w / w )<br />
n<br />
i=<br />
1<br />
1<br />
1/<br />
n<br />
n<br />
( w / w × w / w × ... × w / w )<br />
1<br />
1<br />
1<br />
1<br />
1<br />
2<br />
2<br />
1<br />
1<br />
1<br />
n<br />
http://www.ejournal<strong>of</strong>science.org<br />
⎤<br />
⎥<br />
⎥⎦<br />
⎤ / n<br />
⎥<br />
⎥⎦<br />
(1)<br />
Eigenvalue, λ i =<br />
Consistency test, CI =<br />
⎛<br />
n n<br />
⎜ A ⎟ ∑⎜∑ ij ⎟<br />
j i=1<br />
⎝<br />
A<br />
ij<br />
⎞<br />
w<br />
⎠<br />
λmax<br />
− n<br />
n −1<br />
Table-2.2. Random indices <strong>of</strong> sizes <strong>of</strong> matrices (Saaty, 1980).<br />
n 1-2 3 4 5 6 7 8 9<br />
RI 0.0 .58 .90 1.12 1.24 1.32 1.41 1.45<br />
Consistency ratio (CR) is acceptable if it is does not<br />
exceed 0.10 [21]. If the CR <strong>of</strong> CI is greater than 0.10, the<br />
judgment matrix should be considered as inconsistent.<br />
Thus, the comparison should be repeated.<br />
d) Constructing the pair-wise comparisons <strong>of</strong> alternatives<br />
with respect to factors (criteria) in a matrix. Find the<br />
eigenvector, A ij and CR.<br />
e) Computing the relative weight and ranking the<br />
alternatives.<br />
w<br />
∑<br />
i = Ai<br />
K ij<br />
Where:<br />
w i = Overall relative rating for factors i<br />
A i = Average normalized weight for factors i<br />
K ij = Average normalized rating for alternatives j with<br />
respect to factors i.<br />
f) Ranks the alternatives<br />
These six general steps are practically used to decide the<br />
most preferred factors contributing to road accidents.<br />
3. CASE STUDY<br />
The AHP questionnaire was designed to compare the<br />
causes associated with road accidents. The questionnaire<br />
was used as a guideline in personal interview with the road<br />
accidents experts. Three road accident experts were sought<br />
to provide linguistic judgement data based on the AHP<br />
questionnaire. Three <strong>of</strong> the experts were traffic police<br />
inspector, road transport department <strong>of</strong>ficer and fire<br />
brigade department <strong>of</strong>ficer. The experts need to judge the<br />
relative measurement between the criterion and the<br />
alternatives <strong>using</strong> pair-wise comparison proposed by Saaty<br />
[24]. The scale and the relative importance are presented<br />
in Table-2.1.<br />
To find the contributing causes related to road accident,<br />
the criteria and alternatives are defined. The alternatives <strong>of</strong><br />
road accident are ‘driving faster than limited speed’ (A1),<br />
‘driving carelessly (i.e., failed to look, misjudged distance<br />
and decision)’ (A2), ‘adverse road and traffic conditions’<br />
(A3), ‘tyre and brake defects’ (A4), and ‘obstructions’ (i.e.,<br />
CI<br />
Consistency Ratio, CR = (4)<br />
RI<br />
animals or weather) (A5). The selected criteria are Cars<br />
(C1), Motorcycles (C2), Buses (C3) and Lorries (C4). The<br />
hierarchical structure <strong>of</strong> focus, criteria and alternatives are<br />
shown in Figure-2.<br />
Figure-2. Hierarchical Structures <strong>of</strong> <strong>Road</strong><br />
<strong>Accident</strong> Factors.<br />
The experts were asked to specify rating the alternatives<br />
with the linguistic expression (for example driving faster<br />
than limited speed vs. driving carelessly) and to indicate<br />
whether they felt that one factor was ‘strongly more<br />
important’ or ‘extremely more important’ to another factor<br />
on a nine-point degree <strong>of</strong> association scale. The judgement<br />
must strongly aim to all <strong>of</strong> the focus; criterion and<br />
alternatives for getting consistently result.<br />
4. COMPUTATIONAL PROCEDURES AND<br />
RESULTS<br />
The relationships among the alternatives and criteria<br />
related to road accident are computed <strong>using</strong> AHP<br />
procedures. The computations are executed <strong>using</strong> the<br />
proposed six steps <strong>of</strong> AHP.<br />
Step 1 : Construct hierarchy structure for the problems.<br />
The hierarchical structure <strong>of</strong> road accidents problem is<br />
given in Figure-2.1<br />
Step 2 : Construct the matrix <strong>of</strong> criteria and scale the<br />
matrix based on relative scale measurement.<br />
The scale <strong>of</strong> relative measurement <strong>of</strong> the criteria in pairwise<br />
comparison is presented in Table-4.1<br />
j<br />
41<br />
(2)<br />
(3)
VOL. 2, NO. 2, March 2012 ISSN 2225-7217<br />
ARPN Journal <strong>of</strong> Science and Technology<br />
©2011-2012. All rights reserved.<br />
http://www.ejournal<strong>of</strong>science.org<br />
Table-4.1. Criteria Pair-wise comparison AHP.<br />
Cn C1 C2 C3 C4<br />
C1 1 3 1/3 1/7<br />
C2 1/3 1 1/7 1/9<br />
C3 3 7 1 1/3<br />
C4 7 9 3 1<br />
Step 3: Find Eigenvector and Eigen-value <strong>of</strong> the criterion.<br />
Eigenvector and eigenvalue are obtained <strong>using</strong> equation (1) and (2).<br />
For example the calculation <strong>of</strong> weights criteria is:<br />
Eigenvector, A ij =<br />
( 1×<br />
3×<br />
1/<br />
3×<br />
1/<br />
7)<br />
Table-4.2. Eigenvector and Eigen-value <strong>of</strong> criterion.<br />
Cn C1 C2 C3 C4 ( ) n 1/<br />
1 × ...× c A n<br />
ij<br />
i<br />
C1 1 3 1/3 1/7 3/5 0.0989 4.0596<br />
C2 1/3 1 1/7 1/9 1/4 0.0434 4.1489<br />
C3 3 7 1 1/3 1 5/8 0.2616 4.0534<br />
C4 7 9 3 1 3 5/7 0.5962 4.1314<br />
Total 6 2/9 1 16.3943<br />
1/<br />
4<br />
=<br />
0.<br />
09889<br />
2<br />
6<br />
9<br />
The eigenvector <strong>of</strong> each criterion is computed as the<br />
example given.<br />
To obtain the consistency ratio (CR), the calculation <strong>of</strong><br />
Eigen-value is needed as follows:<br />
λ<br />
Eigen value, i<br />
( 1×<br />
0.<br />
098856 + 3×<br />
0.<br />
043368 + 1/<br />
3×<br />
0.<br />
261556 + 1/<br />
7 × 0.<br />
596217)<br />
=<br />
0.<br />
098859<br />
= 4.<br />
05956<br />
Next, calculate the consistency index (CI) <strong>using</strong> equation<br />
(3).<br />
⎛16.<br />
3948 ⎞<br />
⎜ − 4⎟<br />
Consistency test, CI = ⎝ 4 ⎠<br />
= 0.<br />
03285<br />
3<br />
The calculation <strong>of</strong> Consistency Ratio (CR) is 0.0365 by<br />
equation (4). Thus, the judgment is acceptable since CR is<br />
less than 0.1.<br />
Step 4 : Compute the eigenvector and Eigen-value <strong>of</strong><br />
alternatives pair-wise measurement and CR. The<br />
alternatives Table are illustrated as Table-4.3<br />
The calculations <strong>of</strong> the eigenvector, Eigen-value and<br />
consistency ratio are computed as same as example and<br />
formula from above.<br />
c<br />
λ<br />
Table-4.3. Alternatives pair-wise comparison with<br />
respect to criteria <strong>of</strong> Car, C1.<br />
C1 A1 A2 A3 A4 A5<br />
A1 1 5 7 3 3<br />
A2 1/5 1 1/5 1/5 1/3<br />
A3 1/7 5 1 1/3 3<br />
A4 1/3 5 3 1 1<br />
A5 1/3 3 1/3 1 1<br />
Table-4.4. Eigenvector and Eigen-value <strong>of</strong> alternatives<br />
with respect to criteria, C1.<br />
1 / n<br />
C1 ( )<br />
× An<br />
ij A i<br />
A1<br />
... ×<br />
A1 3 1/6 0.4800 5.6268<br />
A2 1/3 0.0464 5.4579<br />
A3 1 0.1420 6.1851<br />
A4 1 3/8 0.2096 5.4856<br />
A5 4/5 0.1219 5.5612<br />
Column<br />
sum<br />
6 4/7 1 28.3168<br />
The CR <strong>of</strong> the matrix above is 0.1480. Thus, the judgment<br />
is acceptable since CR is less than 0.1.<br />
In addition, the weights priorities for the hierarchy <strong>of</strong><br />
alternatives with respect to each criterion are also<br />
computed as the same way. Table-4.5 is shown from the<br />
result <strong>of</strong> weights calculation for each alternative to the<br />
criterion.<br />
Step 5 : Compute the composite priority (Overall<br />
weights in the entire hierarchy).<br />
λ<br />
42
VOL. 2, NO. 2, March 2012 ISSN 2225-7217<br />
ARPN Journal <strong>of</strong> Science and Technology<br />
©2011-2012. All rights reserved.<br />
http://www.ejournal<strong>of</strong>science.org<br />
Table-4.5. Weight factors associated with road accident.<br />
C1 C2 C3 C4 Aij Weight<br />
A1 0.4800 0.1019 0.1111 0.4081 0.0989 0.3242<br />
A2 0.0464 0.2626 0.2113 0.2813 0.0434 0.2389<br />
A3 0.1420 0.1582 0.1908 0.1530 0.2616 0.1620<br />
A4 0.2096 0.4216 0.1908 0.0409 0.5962 0.1133<br />
A5 0.1219 0.0554 0.2961 0.1168 0.1615<br />
Step 6: Ranks the alternatives<br />
Based on weight, the final rank for alternatives is<br />
established in Table-4.6.<br />
Table-4.6. Ranking <strong>of</strong> weights alternatives <strong>using</strong> AHP.<br />
Alternatives <strong>Weights</strong> Rank<br />
A1 0.3242 1<br />
A2 0.2389 2<br />
A3 0.1620 3<br />
A4 0.1133 5<br />
A5 0.1615 4<br />
Table-4.6 shows the weights and ranks for all <strong>of</strong> the<br />
factors contributing to road accident in Malaysia. As a<br />
conclusion, the best factors which <strong>of</strong>ten lead to accident<br />
are ‘driving faster than limited speed’ and followed by<br />
‘driving carelessly’. Both <strong>of</strong> these factors are contributed<br />
from human behaviour themselves. The third ranking is<br />
‘adverse road and followed by obstructions with consider<br />
as the environment factors. Last ranking is contributed by<br />
vehicle factor itself. The poor maintenance <strong>of</strong> tyres and<br />
brakes also lead to road accident. Based on the fives<br />
causes, driving faster than limited speed contributed as<br />
much as 32.42% to road accident.<br />
5. CONCLUSIONS<br />
The purpose <strong>of</strong> this paper is to identify the perfect causes<br />
contributed to the road accident in Malaysia <strong>using</strong> the pairwise<br />
comparison method <strong>of</strong> AHP. This six-step <strong>of</strong> AHP<br />
method has successfully identified that ‘driving faster than<br />
limited speed’ has the highest weights among all <strong>of</strong> the<br />
causes which leading to road accident. Regarding the past<br />
research, it is identically prove that human behaviour<br />
themselves [13] which contribute almost 17% <strong>of</strong> human<br />
indirect causal <strong>of</strong> road accident is excessive speed. The<br />
second highest factor is driving carelessly which including<br />
failed to look and improper misjudge distance contributed<br />
about 23.89%. Next causes are adverse road and traffic<br />
condition and obstructions (i.e., animals) both contributed<br />
by 16.20% and 16.15% which also known as factors for<br />
environment consequences. Last but not least, the factors<br />
for vehicle condition, which is tyres, are brakes defect<br />
contributed <strong>of</strong> 11.33% to road accident. In conclusion, this<br />
study is hoped to help people by acknowledge the causes<br />
may lead to road accidents and the importance <strong>of</strong> taking<br />
road safety prevention. Thus, from this research it is better<br />
to extend by considering more causal and other types <strong>of</strong><br />
accident to recognize and validate the sensitivity and<br />
accuracy <strong>of</strong> AHP procedure. Besides, further research can<br />
be used to weights the factors <strong>using</strong> fuzzy approach such<br />
as fuzzy set and numbers and intuitionistic fuzzy sets.<br />
ACKNOWLEGMENT<br />
The present work is part <strong>of</strong> the Fundamental Research<br />
Grant Scheme, project number 59173. We acknowledge<br />
financial support from the Malaysian Ministry <strong>of</strong> Higher<br />
Education and University <strong>of</strong> Malaysia Terengganu.<br />
REFERENCES<br />
[1] Royal Malaysia Police. Statistics <strong>of</strong> <strong>Road</strong> <strong>Accident</strong><br />
and Death. 2008. http://www.rmp.gov.my/rmp.<br />
Retrieved on 22 August 2011<br />
[2] Fridulv S. 1998. <strong>Road</strong> <strong>Accident</strong> Caused by Drivers<br />
Falling Asleep. <strong>Accident</strong> Analysis and Prevention. 31:<br />
639-649.<br />
[3] United Nations Economic and Social Council.<br />
(UNESCAP) report Status <strong>of</strong> <strong>Road</strong> Safety in Asia<br />
(2006). http://www.iatss.or.jp/english/research/30-<br />
1/pdf/30-1-12.pdf. Retrieved on 22 August 2011.<br />
[4] Mohamad Nizam, M. Overview <strong>of</strong> Current <strong>Road</strong><br />
Safety Situation in Malaysia. 2005. http://www.<br />
unescap.org/ttdw/common/TIS/AH/files/egm06/roads<br />
afety_malaysia.pdf. Retrieved on 9 August 2011.<br />
[5] Hejar A.R., Nor Afiah M.Z., Kulanthayan S. and Law<br />
T.H. 2005. Car Occupants <strong>Accident</strong>s and Injuries<br />
among Adolescents in a State in Malaysia.<br />
Proceedings <strong>of</strong> the Eastern Asia Society for<br />
Transportation Studies. (5): 1867-1874.<br />
[6] Royal Malaysia Police. Statistics <strong>of</strong> <strong>Road</strong> <strong>Accident</strong><br />
and Death. 2011. http://www.rmp.gov.my/rmp.<br />
Retrieved on 22 September 2011.<br />
[7] Radin Umar, R.S. Updates <strong>of</strong> <strong>Road</strong> Safety Status in<br />
Malaysia. 2005.<br />
http://eng.upm.edu.my/webrsrc/recent.pdf. Retrieved<br />
on 22 August 2011.<br />
[8] Talib R.J., Mohd Faizar M., Sutiman K. and Ramlan<br />
K. 2003. Kemalangan Jalan Raya: Analisis Data<br />
Membabitkan Pengguna Motosikal. Jurnal Teknologi.<br />
38(B): 1-14.<br />
43
VOL. 2, NO. 2, March 2012 ISSN 2225-7217<br />
ARPN Journal <strong>of</strong> Science and Technology<br />
©2011-2012. All rights reserved.<br />
[9] Malaysia Institute <strong>Road</strong> Safety Research (MIROS).<br />
2011. Motorcycle. <strong>Accident</strong> Database System and<br />
Analysis Unit Fact Sheet. (1): 1-6.<br />
[10] Bernama. 2011. <strong>Road</strong> Fatalities Involving Bus, Lorry<br />
Drivers not Alarming. http:// mmail.com.my/ content/<br />
67707-road-fatalities-invol ving-bus-lorry-drivers-notalarming:review.<br />
Retrieved on 1 October 2011.<br />
[11] Harmeet S., Ulf B., Anders E. and Mats O. 1996.<br />
Differences between Older and Younger Drivers:<br />
Characteristics <strong>of</strong> Fatal Car Crashes and Driver<br />
Injuries. Safety Science. 23(1): 63-77.<br />
[12] Micheal L.M. and Andrew R.M. 1986. Age<br />
Differences in Male Drivers’ Perception <strong>of</strong> <strong>Accident</strong><br />
Risk: The Role <strong>of</strong> Perceived Driving Ability. <strong>Accident</strong><br />
Analysis and Prevention. 18(4): 299-313.<br />
[13] Treat J.R., N.S. Tumbas S.T. McDonald D. Shinar<br />
R.D. Hume R.E. Mayer R.L. 1979. Stanisfer and<br />
N.J.Castellan. Tri-level Study <strong>of</strong> the <strong>Causes</strong> <strong>of</strong> Traffic<br />
<strong>Accident</strong>s. Report No. DOT-HS-034-3-535 (TAC).<br />
[14] Harold B. 1988. Risk <strong>of</strong> a <strong>Road</strong> <strong>Accident</strong> in Rainy<br />
Day. <strong>Accident</strong> Analysis and Prevention. 20(3): 161-<br />
176.<br />
[15] James M.A. and Scott M. A. 2003. Young Novice<br />
Drivers: Careless or Clueless. <strong>Accident</strong> Analysis and<br />
Prevention. (35): 921-925.<br />
[16] Lazim A. and Nurnadiah Z. 2010. Ranking <strong>of</strong> the<br />
Factors Associated with <strong>Road</strong> <strong>Accident</strong>s <strong>using</strong><br />
Correlation Analysis and Fuzzy TOPSIS. Australian<br />
Journal <strong>of</strong> Basic and Applied Sciences. 4(2): 314-320.<br />
http://www.ejournal<strong>of</strong>science.org<br />
[17] Lazim A. and Fateen Najwa A. 2011. <strong>Weights</strong> Obesity<br />
Factors <strong>using</strong> <strong>Analytic</strong> <strong>Hierarchy</strong> <strong>Process</strong>.<br />
http://www.arpapress.com/Volumes/Vol7Issue1/IJRR<br />
AS_7_1_09.pdf. Retrieved on 22 August 2011.<br />
[18] Liberatore M.J. and Nydick R.L. 2008. The analytic<br />
hierarchy process in medical and health care decision<br />
making: A literature review. EJOR. 189(1): 294-307.<br />
[19] Agus Z. A. 2011. The <strong>Analytic</strong> <strong>Hierarchy</strong> <strong>Process</strong><br />
(AHP) for Stocks Rank. Cambridge Business and<br />
Economics Conference, ISBN: 9780974211428.<br />
[20] Esra A. and Yasemin C.E. 2004. Using <strong>Analytic</strong><br />
<strong>Hierarchy</strong> <strong>Process</strong> (AHP) to Improve Human<br />
Performance: Application <strong>of</strong> Multiple Criteria<br />
Decision Making Problem. Journal <strong>of</strong> Intelligent<br />
Manufacturing. (15): 491-503.<br />
[21] Hambali A., Mohd S.S., Napsiah I. and Nukman Y.<br />
2008. Use <strong>of</strong> <strong>Analytic</strong> <strong>Hierarchy</strong> <strong>Process</strong> (AHP) for<br />
Selecting the Best Design Concept. Jurnal Teknologi.<br />
49(A): 1-8.<br />
[22] Sambasivan M. and Fei N.Y. 2008. Evaluation <strong>of</strong><br />
critical success factors <strong>of</strong> implementation <strong>of</strong> ISO<br />
14001 <strong>using</strong> analytic hierarchy process (AHP): a case<br />
study from Malaysia. Journal <strong>of</strong> Cleaner Production.<br />
16(13): 1424-1433.<br />
[23] Saaty T.L. 1990. How to Make Decision: The<br />
<strong>Analytic</strong> <strong>Hierarchy</strong> <strong>Process</strong>. European Journal <strong>of</strong><br />
Operational Research. 489-26.<br />
[24] Saaty T.L. 1980. The <strong>Analytic</strong> <strong>Hierarchy</strong> <strong>Process</strong>,<br />
McGraw-Hill Book Co., New York.<br />
44