

Monthly Report – December 2016
CII%20BCG%20Growth%20Index_January%202017_CII
CII%20BCG%20Growth%20Index_January%202017_CII

Create successful ePaper yourself
Turn your PDF publications into a flip-book with our unique Google optimized e-Paper software.
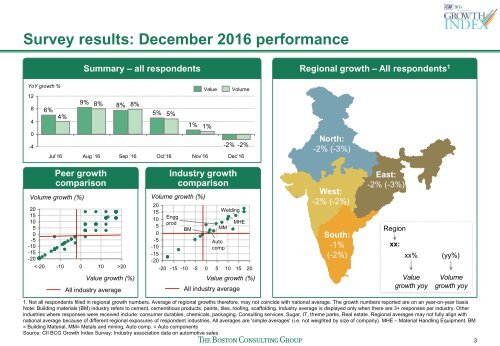
Survey results: <strong>December</strong> <strong>2016</strong> performance<br />
Summary <strong>–</strong> all respondents Regional growth <strong>–</strong> All respondents 1<br />
YoY growth %<br />
12<br />
8 6%<br />
4%<br />
4<br />
0<br />
-4<br />
Jul’16<br />
9%<br />
8%<br />
Aug ’16<br />
8%<br />
8%<br />
Sep ’16<br />
5%<br />
5%<br />
Oct’16<br />
Value<br />
1% 1%<br />
Nov’16<br />
Volume<br />
-2% -2%<br />
Dec’16<br />
North:<br />
-2% (-3%)<br />
20<br />
15<br />
10<br />
5<br />
0<br />
-5<br />
-10<br />
-15<br />
-20<br />
Peer growth<br />
comparison<br />
Volume growth (%)<br />
20<br />
Value growth (%)<br />
All industry average<br />
20<br />
15<br />
10<br />
5<br />
0<br />
-5<br />
-10<br />
-15<br />
-20<br />
Industry growth<br />
comparison<br />
Volume growth (%)<br />
Engg<br />
prod<br />
BM<br />
Auto<br />
comp<br />
Welding<br />
MM<br />
MHE<br />
-20 -15 -10 -5 0 5 10 15 20<br />
Value growth (%)<br />
All industry average<br />
West:<br />
-2% (-2%)<br />
South:<br />
-1%<br />
(-2%)<br />
East:<br />
-2% (-3%)<br />
Region<br />
xx:<br />
xx%<br />
Value<br />
growth yoy<br />
(yy%)<br />
Volume<br />
growth yoy<br />
1. Not all respondents filled in regional growth numbers. Average of regional growths therefore, may not coincide with national average. The growth numbers reported are on an year-on-year basis<br />
Note: Building materials (BM) industry refers to cement, cementitious products, paints, tiles, roofing, scaffolding. Industry average is displayed only when there are 3+ responses per industry. Other<br />
industries where responses were received include: consumer durables, chemicals, packaging, Consulting services, Sugar, IT, theme parks, Real estate. Regional averages may not fully align with<br />
national average because of different regional exposures of respondent industries. All averages are 'simple averages' (i.e. not weighted by size of company). MHE <strong>–</strong> Material Handling Equipment. BM<br />
= Building Material, MM= Metals and mining, Auto comp. = Auto components<br />
Source: CII BCG Growth Index Survey; Industry association data on automotive sales<br />
3