

Monthly Report – December 2016
CII%20BCG%20Growth%20Index_January%202017_CII
CII%20BCG%20Growth%20Index_January%202017_CII

You also want an ePaper? Increase the reach of your titles
YUMPU automatically turns print PDFs into web optimized ePapers that Google loves.
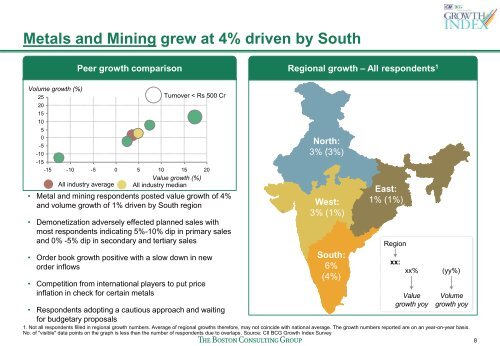
Metals and Mining grew at 4% driven by South<br />
Peer growth comparison<br />
Regional growth <strong>–</strong> All respondents 1<br />
Volume growth (%)<br />
25<br />
20<br />
15<br />
10<br />
5<br />
0<br />
-5<br />
-10<br />
Turnover < Rs 500 Cr<br />
-15<br />
-15 -10 -5 0 5 10 15 20<br />
Value growth (%)<br />
All industry average All industry median<br />
• Metal and mining respondents posted value growth of 4%<br />
and volume growth of 1% driven by South region<br />
• Demonetization adversely effected planned sales with<br />
most respondents indicating 5%-10% dip in primary sales<br />
and 0% -5% dip in secondary and tertiary sales<br />
• Order book growth positive with a slow down in new<br />
order inflows<br />
• Competition from international players to put price<br />
inflation in check for certain metals<br />
• Respondents adopting a cautious approach and waiting<br />
for budgetary proposals<br />
North:<br />
3% (3%)<br />
West:<br />
3% (1%)<br />
South:<br />
6%<br />
(4%)<br />
East:<br />
1% (1%)<br />
Value<br />
growth yoy<br />
Volume<br />
growth yoy<br />
1. Not all respondents filled in regional growth numbers. Average of regional growths therefore, may not coincide with national average. The growth numbers reported are on an year-on-year basis.<br />
No. of "visible" data points on the graph is less than the number of respondents due to overlaps. Source: CII BCG Growth Index Survey<br />
Region<br />
xx:<br />
xx%<br />
(yy%)<br />
8