Annual Report 2008 - BASF
Annual Report 2008 - BASF
Annual Report 2008 - BASF

You also want an ePaper? Increase the reach of your titles
YUMPU automatically turns print PDFs into web optimized ePapers that Google loves.
<strong>Report</strong> <strong>2008</strong><br />
Economic, environmental<br />
and social performance
BASf GRoup <strong>2008</strong><br />
Economic data (million €)<br />
<strong>2008</strong> 2007 Change in %<br />
Sales 62,304 57,951 7.5<br />
Income from operations before depreciation and amortization (EBITDA) 9,562 10,225 (6.5)<br />
Income from operations (EBIT) before special items 6,856 7,614 (10.0)<br />
Income from operations (EBIT) 6,463 7,316 (11.7)<br />
Income before taxes and minority interests 5,976 6,935 (13.8)<br />
Net income 2,912 4,065 (28.4)<br />
Earnings per share (€) 3.13 4.16 (24.8)<br />
Dividend per share (€) 1.95 1.95 –<br />
Cash provided by operating activities 5,023 5,807 (13.5)<br />
Additions to long-term assets1 3,634 4,425 (17.9)<br />
Depreciation and amortization 3,099 2,909 6.5<br />
Return on assets (%) 13.5 16.4 –<br />
Return on equity after tax (%) 17.0 22.4 –<br />
Research and development expenses 1,355 1,380 (1.8)<br />
Environment and safety<br />
<strong>2008</strong> 2007 Change in %<br />
Operating costs for environmental protection facilities Million € 706 640 10.3<br />
Investments in environmental protection Million € 165 103 60.2<br />
Emissions of greenhouse gases (CO 2 equivalent) 2 Million metric tons/year 27.1 27.5 (1.5)<br />
Emissions to air (air pollutants) 2 Thousand metric tons/year 36.5 50.6 (27.9)<br />
Emissions to water 2 of: – Organic substances Thousand metric tons/year 20.6 31.2 (34.0)<br />
– Nitrogen Thousand metric tons/year 4.4 5.3 (17.0)<br />
– Heavy Metals Metric tons/year 27.0 34.0 (20.6)<br />
Transportation accidents Per 10,000 shipments 0.36 0.28 28.6<br />
Number of environmental and safety audits 86 107 (19.6)<br />
Employees and society<br />
<strong>2008</strong> 2007 Change in %<br />
Employees as of December 31 96,924 95,175 1.8<br />
Trainees as of December 31 2,171 2,160 0.5<br />
Personnel costs Million € 6,364 6,648 (4.3)<br />
Donations and sponsoring Million € 64.7 75.3 (14.1)<br />
<strong>Annual</strong> bonus % of Group companies 74.7 73.7 1.4<br />
Lost time accidents Per million working hours 1.8 2.2 (18.2)<br />
Occupational diseases Per million working hours 0.31 0.22 40.9<br />
1 Including acquisitions<br />
2 Excluding emissions from oil and gas production<br />
ovERvIEw of BASf’S SEGMEntS<br />
SEE InSIdE CovER
BASf’S SEGMEntS<br />
ChEMICAlS<br />
PAGE 50<br />
In the Chemicals segment, we offer products<br />
for customers in the chemical, electronic,<br />
construction, textile, automotive, pharmaceutical<br />
and agricultural industries and provide<br />
other <strong>BASF</strong> segments with chemicals for the<br />
production of higher-value products. Our<br />
portfolio ranges from basic chemicals, glues<br />
and electronic chemicals for the semiconductor<br />
and flat panel display industry, to solvents<br />
and plasticizers, as well as starting materials<br />
for detergents, plastics, textile fibers, paints,<br />
coatings and pharmaceuticals.<br />
funCtIonAl SolutIonS<br />
PAGE 69<br />
In the Functional Solutions segment we<br />
bundle system solutions and innovative<br />
products for specific customers and industries,<br />
in particular for the automotive and<br />
construction sectors. Our portfolio comprises<br />
automotive and industrial catalysts, automotive<br />
and industrial coatings, concrete<br />
admixtures and building products such as<br />
tile adhesives and architectural coatings.<br />
plAStICS<br />
PAGE 57<br />
The Plastics segment offers a comprehensive<br />
range of products, system solutions and<br />
services. We offer a variety of engineering<br />
plastics for the automotive and electric<br />
industries as well as for use in household<br />
appliances, sport and leisure. Our styrenic<br />
foams are used as insulating materials in the<br />
construction industry and in the packaging<br />
industry. Our polyurethanes are extremely<br />
versatile: as soft foams, for example, they<br />
are to be found in car seats and mattresses,<br />
and as rigid foams they serve as highly<br />
efficient insulation in refrigerators.<br />
AGRICultuRAl SolutIonS<br />
PAGE 75<br />
Our crop protection products guard against<br />
fungal diseases, insects and weeds, increase<br />
quality and secure crop yields. Our research<br />
in plant biotechnology concentrates on<br />
plants for greater efficiency in agriculture,<br />
healthier nutrition and for use as renewable<br />
raw materials.<br />
pERfoRMAnCE pRoduCtS<br />
PAGE 63<br />
Our Performance Products help our custom- 2<br />
ers improve their products and processes.<br />
They are found in countless everyday products:<br />
from diapers, paper, vitamins for food<br />
supplements and light stabilizers for sun<br />
creams to products for the oil, automotive,<br />
coatings and plastics industries and for the<br />
manufacture of leather and textiles.<br />
3<br />
oIl & GAS<br />
PAGE 80<br />
As the largest German producer of oil and<br />
gas, we focus on exploration and pro-<br />
duction in oil and gas-rich regions of Europe,<br />
North Africa, South America, Russia and<br />
the Caspian Sea region. Together with our<br />
Russian partner Gazprom, we are active in<br />
the trading, transport and storage of natural<br />
gas in Europe.<br />
2<br />
3<br />
3<br />
2<br />
2<br />
1<br />
€10,324<br />
million<br />
2<br />
€9,675<br />
million<br />
€8,967<br />
million<br />
€9,388<br />
million<br />
€3,409<br />
million<br />
1<br />
€14,445<br />
million<br />
1<br />
1<br />
1<br />
1
1<br />
0,324<br />
million<br />
2<br />
9,675<br />
million<br />
8,967<br />
million<br />
9,388<br />
million<br />
3,409<br />
million<br />
1<br />
4,445<br />
million<br />
1<br />
1<br />
1<br />
1<br />
KEy SEGMEnt dAtA<br />
ChEMICAlS<br />
1 -- Inorganics: 14%<br />
2 -- Petrochemicals: 62%<br />
3 -- Intermediates: 24%<br />
plAStICS<br />
1 -- Performance Polymers: 47%<br />
2 -- Polyurethanes: 53%<br />
pERfoRMAnCE pRoduCtS<br />
1 -- Acrylics & Dispersions: 41%<br />
2 -- Care Chemicals: 34%<br />
3 -- Performance Chemicals: 25%<br />
funCtIonAl SolutIonS<br />
1 -- Catalysts: 50%<br />
2 -- Construction<br />
Chemicals: 23%<br />
3 -- Coatings: 27%<br />
AGRICultuRAl SolutIonS<br />
1 -- Crop Protection: 100%<br />
oIl & GAS<br />
1 -- Exploration & Production: 37%<br />
2 -- Natural Gas Trading: 63%<br />
2<br />
3<br />
2<br />
3<br />
3<br />
2<br />
2<br />
€8,967<br />
million<br />
€3,409<br />
million<br />
1<br />
1<br />
€10,324<br />
million<br />
2<br />
€9,675<br />
million<br />
€9,388<br />
million<br />
€14,445<br />
million<br />
1<br />
1<br />
1<br />
1<br />
Key data Chemicals<br />
Million €<br />
1 -- Inorganics: 14%<br />
Sales<br />
2 -- Petrochemicals: 62%<br />
<strong>2008</strong><br />
10,324<br />
2007<br />
9,358<br />
Change<br />
in %<br />
10.3<br />
Income from operations before special<br />
3 -- items Intermediates: 24%<br />
1,421 1,889 (24.8)<br />
Income from operations (EBIT) 1,376 1,903 (27.7)<br />
Key data plastics<br />
Million € <strong>2008</strong> 2007<br />
Change<br />
in %<br />
1 -- Sales Performance Polymers: 47%<br />
2 -- Income Polyurethanes: from operations 53% before special<br />
9,675 9,976 (3.0)<br />
items 544 1,261 (56.9)<br />
Income from operations (EBIT) 530 1,172 (54.8)<br />
Key data performance products<br />
Million €<br />
1 -- Acrylics & Dispersions: 41%<br />
Sales<br />
2 -- Care Chemicals: 34%<br />
Income from operations before special<br />
<strong>2008</strong><br />
8,967<br />
2007<br />
8,862<br />
Change<br />
in %<br />
1.2<br />
3 -- items Performance Chemicals: 25%<br />
785 712 10.3<br />
Income from operations (EBIT) 787 681 15.6<br />
Key data functional Solutions<br />
1 --<br />
Million<br />
Catalysts:<br />
€<br />
50%<br />
<strong>2008</strong> 2007<br />
Change<br />
in %<br />
Sales<br />
2 -- Construction<br />
Income Chemicals: from operations 23% before special<br />
9,388 9,491 (1.1)<br />
items<br />
3 -- Coatings: 27%<br />
265 557 (52.4)<br />
Income from operations (EBIT) 151 434 (65.2)<br />
Key data Agricultural Solutions<br />
Million € <strong>2008</strong> 2007<br />
Change<br />
in %<br />
Sales<br />
1 -- Crop Protection: 100%<br />
Income from operations before special<br />
3,409 3,137 8.7<br />
items 706 526 34.2<br />
Income from operations (EBIT) 705 516 36.6<br />
Key data oil & Gas<br />
Million € <strong>2008</strong> 2007<br />
Change<br />
in %<br />
1 -- Sales Exploration & Production: 37%<br />
2 -- Income Natural from Gas operations Trading: before 63% special<br />
14,445 10,517 37.3<br />
items 3,844 3,031 26.8<br />
Income from operations (EBIT) 3,844 3,031 26.8
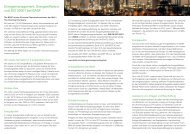
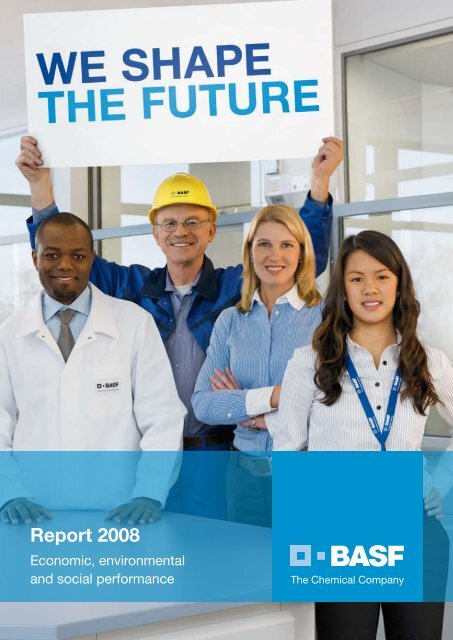
wE ShApE<br />
thE futuRE<br />
We combine<br />
economic success<br />
with social<br />
responsibility and<br />
environmental<br />
protection.<br />
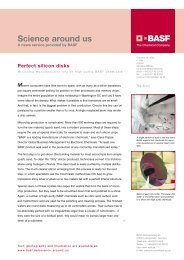
The cover shows, from left to right, our employees Godwin<br />
Mabande (Catalysts Research), Ulrich Schwind (Pressure Vessel<br />
Workshop), Talke Schroedter (Project “Diversity + Inclusion”),<br />
and Thi-Thu-Trinh Nguyen (Forum “perspectives”).
REPORT<br />
<strong>2008</strong><br />
ECONOMY<br />
REPORT<br />
<strong>2008</strong><br />
sOCIETY ENVIRONMENT<br />
ThIs Is aN INTEgRaTEd REPORT<br />
It documents our economic, environmental and social<br />
performance for <strong>2008</strong>.<br />
ValuE fOR Basf<br />
Sustainability is an integral part of our strategy. This<br />
report therefore combines our financial and sustainability<br />
reporting in one publication. We document our<br />
financial performance and provide solid examples<br />
of how sustainability contributes to the success of<br />
our company.<br />
ValuE fOR sOCIETY<br />
This report shows how we create value – for our<br />
employees, shareholders, business partners,<br />
neighbors and the public. With sustainable products,<br />
technol ogies and services, we contribute to finding<br />
answers to global challenges, such as climate<br />
protection, resource conservation, nutrition and<br />
demographic change. We promote education,<br />
our most important future resource, and support<br />
pro jects with long-term value worldwide. This is<br />
our contribution to a better future.
2<br />
ABOuT ThiS REPORT<br />
ABOuT ThiS REPORT<br />
COnTEnT And STRuCTuRE TOPiCS<br />
This integrated report combines our financial and sustainability<br />
reporting and is addressed to interested readers<br />
from all fields. The reporting of the <strong>BASF</strong> Group has continued<br />
to develop: For the second time, the integrated<br />
<strong>BASF</strong> <strong>Report</strong> replaces the individual financial and sustainability<br />
reports. Our dialogue with internal and external<br />
stakeholders as well as the positive feedback from our<br />
readers survey in <strong>2008</strong> confirmed our reporting approach.<br />
This year, we report once again in detail on how we combine<br />
economic success, social responsibility and environmental<br />
protection, in a single publication. The global reporting<br />
of the <strong>BASF</strong> Group is complemented by <strong>BASF</strong> In<br />
Brief <strong>2008</strong>.<br />
Alongside the traditional content index, the cover<br />
of this report folds out to provide an index of key topics.<br />
It classifies the content according to central themes:<br />
information on our strategy, business development,<br />
sustainability as well as factors driving our growth and<br />
our res ponse to global trends.<br />
AddiTiOnAl infORmATiOn<br />
The Online <strong>Report</strong> <strong>2008</strong> with additional information and interactive service<br />
functions can be found at basf.com/report<br />
BASf in Brief <strong>2008</strong> offers a quick overview of the entire reporting year and<br />
provides concise reporting on how BASf is contributing to important<br />
issues of the future. more information can be found at<br />
basf.com/basf_in_brief<br />
more information on the subject of sustainability can be found at<br />
basf.com/sustainability<br />
BASf REPORT <strong>2008</strong><br />
The information on the financial position and financial performance<br />
of <strong>BASF</strong> Group is based on the requirements of<br />
International Financial <strong>Report</strong>ing Standards (IFRS), and<br />
where applicable, the German Commercial Code and German<br />
Accounting Standards (DRS).<br />
After delisting from the NYSE, we retained, in an adjusted<br />
form, the internal control system for financial reporting<br />
based on the guidelines of the Sarbanes-Oxley Act. Internal<br />
control mechanisms ensure the reliability of the information<br />
we report. The management of <strong>BASF</strong> confirmed the effectiveness<br />
of the internal control system as well as the compliance<br />
with regulations relevant to financial reporting.<br />
Together with our external partners, we regularly analyze<br />
and assess the topics of sustainability that are relevant<br />
to <strong>BASF</strong>. We identify topics of global interest and<br />
topics which represent risks or opportunities for the <strong>BASF</strong><br />
Group today or in the future. The results of these processes<br />
are incorporated into this report as well as the results<br />
from our annual stakeholder survey on reporting and<br />
our dialogue with stakeholders. The sustainability reporting<br />
follows the international guidelines (G3) of the Global<br />
<strong>Report</strong>ing Initiative (GRI). It also serves as a progress<br />
report for the implementation of the ten principles of the<br />
United Nations Global Compact. The symbol within the<br />
text of the report indicates the relevance to the principles<br />
of the U.N. Global Compact.<br />
more information on our matrix for sustainability topics can be found on<br />
page 28 and at basf.com/materiality<br />
information on our contribution to solving global challenges can be found<br />
at basf.com/future<br />
A short GRi- and Global Compact-index can be found on page 240 and<br />
comprehensive information on this subject is available at<br />
basf.com/gri_gc_e
ABOuT ThiS REPORT<br />
dATA ExTERnAl AudiTinG And vAlidATiOn<br />
All data and bases of calculation in this report are in line<br />
with international standards for financial and sustainability<br />
reporting. All corporate information is sourced from <strong>BASF</strong><br />
documents as well as from central queries to the appropriate<br />
competence centers and regions. The reporting period<br />
is calendar year <strong>2008</strong>.<br />
Our data collection methods for environmental protection<br />
and safety are based on the recommendations of the<br />
European Chemical Industry Council (CEFIC). In the area of<br />
emissions and energy, we report on approximately 98% of<br />
all emissions from our worldwide production sites. The<br />
emissions of joint venture companies are included pro rata<br />
based on our stake. Information on work-related accidents<br />
is compiled worldwide at our production and administrative<br />
sites. Accidents at joint venture sites are compiled and<br />
reported in total. In the reporting year <strong>2008</strong>, we continued<br />
to improve the data collection on environmental protection<br />
and safety. In these areas, data processing systems were<br />
optimized and the data collection frequency was increas -<br />
ed. Unless otherwise indicated, additional information<br />
on social responsibility is based on all consolidated Group<br />
companies. All employees in the <strong>BASF</strong> Group as of<br />
December 31, <strong>2008</strong> are represented in the information.<br />
To increase the relevance of this report, information<br />
available up to the editorial deadline of February 24, 2009<br />
has been included. The report is published each year in<br />
mid-March in English and in German.<br />
more information on emissions can be found in the chapters “Our Goals”,<br />
“Climate Protection“, “Energy”, “Water” and “Environmental and Safety<br />
management”<br />
more information on work-related accidents can be found on page 95<br />
THE GlOBAl COMPACT<br />
Our reporting serves as a progress<br />
report on the implementation<br />
of the ten principles of the<br />
U.N. Global Compact.<br />
Our reporting is audited by a third party. KPMG AG<br />
Wirtschaftsprüfungsgesellschaft has audited the <strong>BASF</strong><br />
Group Consolidated Financial Statements, including the<br />
Management’s Analysis, and has approved them free of<br />
qualification. This assurance comprises financial and nonfinancial<br />
information. The verification was also conducted<br />
in accord ance with assurance standards for sustainability<br />
reporting, the International Standard on Assurance Engagements<br />
3000.<br />
The transparency of our reporting was recognized on<br />
several occasions in <strong>2008</strong>: Based primarily on its environmental<br />
and social reporting, <strong>BASF</strong> was named as chemical<br />
sector leader in the global Dow Jones Sustainability Index<br />
(DJSI World). Our reporting on our progress in implementing<br />
the ten principles of the U.N. Global Compact earned<br />
us “Notable Communication on Progress” status in <strong>2008</strong>.<br />
The sustainability reporting of the <strong>BASF</strong> Group has again<br />
achieved the highest application level A+ from the Global<br />
<strong>Report</strong>ing Initiative.<br />
The report of the independent auditors can be<br />
found on page 151<br />
more information on the u.n. Global Compact can<br />
be found at www.globalcompact.org<br />
more information on the Global <strong>Report</strong>ing initiative<br />
can be found at www.globalreporting.org<br />
BASf REPORT <strong>2008</strong><br />
3
4<br />
COnTEnTS<br />
<strong>2008</strong><br />
TO OuR<br />
ShAREhOldERS<br />
mAnAGEmEnT’S<br />
AnAlySiS<br />
BASf REPORT <strong>2008</strong><br />
01<br />
02<br />
letter from the Chairman<br />
of the Board of Executive directors 8<br />
Board of Executive directors 10<br />
Our values 12<br />
Our Strategy 14<br />
Our Goals 16<br />
BASf on the Capital market 18<br />
The BASf Group 24<br />
Markets, Structures and Organization 24<br />
Value-based Management 27<br />
Sustainability Management 28<br />
Value added Statement 33<br />
Research and Development in the <strong>BASF</strong> Group 34<br />
The Business year at BASf 36<br />
Trends in the Global Economy 36<br />
Trends in Key Customer Industries 37<br />
Trends in the Chemical Industry 38<br />
Results of the <strong>BASF</strong> Group 39<br />
Consolidated Balance Sheets 43<br />
Liquidity and Capital Resources 45<br />
Results of Operations by Segment 48<br />
<strong>BASF</strong> Segments 50<br />
Chemicals 50<br />
Plastics 57<br />
Performance Products 63<br />
Functional Solutions 69<br />
Agricultural Solutions 75<br />
Oil & Gas 80<br />
Regional Results 87<br />
Employees and Society 90<br />
Employees 90<br />
Occupational Safety 95<br />
Health Protection 96<br />
Social Commitment 97<br />
Environment and Safety 99<br />
Climate Protection 99<br />
Energy 102<br />
Water 104<br />
Environmental and Safety Management 106<br />
Product Stewardship 110<br />
Risk <strong>Report</strong> 112<br />
forecast 120<br />
Economic Environment 120<br />
Group Outlook and Opportunities 123<br />
Supplementary <strong>Report</strong> 125
CORPORATE<br />
GOvERnAnCE 03<br />
COnSOlidATEd<br />
finAnCiAl<br />
STATEmEnTS<br />
SuPPlEmEnTARy<br />
infORmATiOn<br />
On Oil And GAS<br />
PROduCinG<br />
ACTiviTiES<br />
04<br />
05<br />
infORmATiOn,<br />
SERviCE 06<br />
WWW.BASf.COm<br />
COnTEnTS<br />
Corporate Governance of the <strong>BASF</strong> Group 128<br />
Management and Supervisory Boards 133<br />
Compensation <strong>Report</strong> 137<br />
<strong>Report</strong> of the Supervisory Board 144<br />
Declaration of Conformity 148<br />
Statement by the Board of Executive Directors 150<br />
<strong>Report</strong> of the Independent Auditors 151<br />
Consolidated Statements of Income 152<br />
Consolidated Balance Sheets 153<br />
Consolidated Statements of Recognized Income<br />
and Expense 154<br />
Consolidated Statements of Cash Flows 155<br />
Consolidated Statements of Stockholders’ Equity 156<br />
<strong>BASF</strong> Group Consolidated Financial Statements<br />
and Notes 157<br />
Supplementary Information on Oil and<br />
Gas Producing Activities 222<br />
Glossary 231<br />
Index 235<br />
Ten-year Summary 237<br />
GRI and Global Compact Index 240<br />
The <strong>2008</strong> <strong>Report</strong> on the internet<br />
This report is also available as a HTML version and as a PDF download on<br />
our internet site. Additional service functions include quick links to key topics<br />
and enable a tailor-made compilation of individual text sections, tables and<br />
diagrams. A new function enables the direct comparison of elements with<br />
last year’s report. Through examples from the report and additional information,<br />
we also show how we are creating value – for <strong>BASF</strong> and for society.<br />
BASf REPORT <strong>2008</strong><br />
5
6<br />
hOW WE ShAPE ThE fuTuRE<br />
hOW WE ShAPE ThE fuTuRE<br />
We are meeting the challenges of our time. Around the world, almost 97,000<br />
employees are helping our customers to be more successful through their<br />
creativity, commitment and performance. We combine economic success and<br />
social responsibility with environmental protection. This is our contribution<br />
to a better future for us and for coming generations.<br />
In this report, five employees show how we create value – for <strong>BASF</strong> and<br />
for society.<br />
BASf REPORT <strong>2008</strong><br />
01 houses that protect the climate<br />
ClaIRE faRRaR is project manager of the Basf low energy house<br />
in England. Page 7<br />
02 Electricity for the next generation<br />
JaE hYuNg hwaNg is researching affordable and simple to produce<br />
solar cells of the future. Page 23<br />
03 Earning trust<br />
ThEREsa EglER is one of over 80 Basf compliance officers<br />
worldwide. Page 127<br />
04 harvesting under extreme conditions<br />
fREdY MaRIsCal helped to develop the successful umbrella brand<br />
agCelence ® for the latin american crop protection market. Page 149<br />
05 securing energy supplies<br />
ThEO BERgERs helped to build a radio control system for gas<br />
production platforms. Page 221
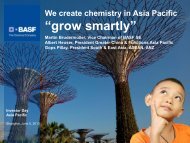
ClaIRE faRRaR<br />
is project manager of the Basf<br />
low energy house in Nottingham.<br />
* Basf products save three times more greenhouse gas<br />
emissions than the entire amount caused by the<br />
production and disposal of all the company’s products –<br />
as shown by our corporate carbon footprint.
TO OuR ShAREhOldERS<br />
ValuE fOR Basf<br />
success with products for<br />
climate protection<br />
Claire Farrar on site during construction of the low energy house in Nottingham,<br />
England, inaugurated in spring <strong>2008</strong>.<br />
Innovation for energy efficient building<br />
The <strong>BASF</strong> low energy house in Nottingham shows how modern<br />
construction chemicals and plastics contribute to climate<br />
protection. <strong>BASF</strong> sells, for example, 400,000 metric tons of<br />
insulation materials like Styropor ® and Neopor ® each year.<br />
Our corporate carbon footprint proves that <strong>BASF</strong> products<br />
save 252 million metric tons of CO 2 worldwide, in contrast to<br />
87 million metric tons of CO 2 emissions from raw material<br />
extraction, production and disposal of all our products.<br />
ValuE fOR sOCIETY<br />
Energy efficient houses that<br />
protect the climate<br />
The use of innovative products saves energy and better protects building<br />
materials: the <strong>BASF</strong> low energy house in Nottingham.<br />
homeowners save energy and protect the environment<br />
<strong>BASF</strong> products and technologies help save CO 2 in many areas<br />
of life. In the <strong>BASF</strong> low energy house, modern materials like<br />
Neopor ® and Elastopor ® provide energy efficient insulation.<br />
The phase change material Micronal ® PCM is used as an<br />
alternative to air conditioning and accordingly saves on electricity<br />
and maintenance costs. Black pigments like Paliogen ® ,<br />
Lumogen ® or Sicopal ® in roof coatings absorb only a small<br />
amount of the sun’s infrared radiation and prevent dark surfaces<br />
from overheating. In this way, home owners can save<br />
energy, protect their building materials, and at the same time<br />
reduce their maintenance costs.<br />
more information on the corporate carbon footprint and on products for<br />
climate protection can be found from page 99 onward
01<br />
TO OuR<br />
ShAREhOldERS<br />
Letter from the Chairman<br />
of the Board of Executive Directors 8<br />
Board of Executive Directors 10<br />
Our Values 12<br />
Our Strategy 14<br />
Our Goals 16<br />
<strong>BASF</strong> on the Capital Market 18<br />
TO OuR ShAREhOldERS
8<br />
TO OuR ShAREhOldERS<br />
Letter from the Chairman of the Board of Executive Directors<br />
<strong>2008</strong> was a year that brought dramatic change to the world economy and to <strong>BASF</strong>: a global financial crisis, massive<br />
downturns in economies around the world and enormous fluctuations in raw material prices. In the current year, the<br />
global recession and shrinking world chemical market will confront us with unprecedented challenges. All forecasts<br />
are subject to great uncertainty.<br />
After a very good start to <strong>2008</strong>, customer demand declined drastically, particularly in the fourth quarter. Overall,<br />
sales increased compared with 2007, while income from operations was below the previous year’s very good level.<br />
<strong>BASF</strong> shares were also caught up in the worldwide decline on the stock markets – we are not satisfied with our<br />
stock performance. But even in difficult times, we stand by our ambitious dividend policy. We propose to pay a<br />
dividend of €1.95 per share.<br />
We responded quickly to the tremendous downturn: Worldwide, we have reduced capacity or temporarily closed<br />
production facilities, and adjusted working hours to the new situation. I am impressed with the flexibility and commitment<br />
shown by the <strong>BASF</strong> team in these circumstances and would like to sincerely thank all of our employees.<br />
This year, more than ever before, it will be essential to work together to build trusting relationships both internally<br />
as well as with our customers, suppliers and other business partners. I am convinced that in tough times like these,<br />
the <strong>BASF</strong> team will show what it is capable of.<br />
Our goal remains to increase value<br />
Despite the immense challenges, the economic environment in the current year also presents new opportunities for<br />
our business. We will actively pursue them to assert our position as the world’s leading chemical company. We are<br />
well equipped to do so thanks to our long-term strategy for sustained growth, our solid financing, and a portfolio<br />
that we have developed in the past years to be more robust and competitive.<br />
We are working continually to improve <strong>BASF</strong>’s position, for example with the acquisitions of the Swiss chemical<br />
company Ciba and the Norwegian oil and gas company Revus Energy. We completed the acquisition of Revus at<br />
the end of <strong>2008</strong>. We aim to close the Ciba acquisition in the first quarter of 2009 so that we can start quickly with<br />
the integration and restructuring.<br />
BASf REPORT <strong>2008</strong><br />
“shaping the future requires<br />
determination. Especially in<br />
difficult times like the present.”<br />
Dr. Jürgen Hambrecht<br />
Chairman of the Board of Executive Directors of <strong>BASF</strong> SE
TO OuR ShAREhOldERS<br />
Letter from the Chairman of the Board of Executive Directors<br />
Just as high on our agenda is to be quicker, more flexible and more decisive in the face of fierce global competition.<br />
We are therefore accelerating the rigorous implementation of our restructuring and efficiency programs. From 2012<br />
onward, we expect a positive earnings contribution of more than €1 billion annually through NEXT – our new global<br />
program to improve operational excellence and efficiency in all areas of daily business. A large portion of this<br />
amount will be achieved in 2009 and 2010.<br />
Chemistry remains a strong motor for innovation<br />
Despite the strong economic headwind, I firmly believe that chemistry is the motor for innovation when it comes to<br />
finding solutions for global challenges like climate protection, nutrition, water, energy, mobility, and an overall better<br />
quality of life for the growing world population. In short: <strong>BASF</strong> wants to shape the future with chemistry, especially<br />
in difficult times like the present. And to do so, we need outstanding innovations above all.<br />
For example in new and innovative technologies, like plant biotechnology or nanotechnology, we want to open up new<br />
applications. Despite the difficult economic environment, we are therefore maintaining a high level of spending on<br />
research and development in 2009.<br />
But outstanding innovations require more than that: They need a corporate culture that encourages unusual perspectives<br />
and creativity. Employees who approach topics from different angles advance our company and reflect<br />
the diversity of our customers and markets. In my view, it is therefore especially important that we continue to<br />
measurably increase the diversity and internationalism of <strong>BASF</strong> employees. To achieve this, we started the global<br />
pro ject “Diversity + Inclusion” in <strong>2008</strong>, and the first pilot projects are now being implemented.<br />
Sustainable development<br />
Difficult times especially show that companies which conduct their business sustainably and responsibly are more<br />
successful in the long-term. That is why sustainability is a firm part of <strong>BASF</strong>’s strategy: Long-term success is not<br />
possible unless the environment and society are treated carefully. We are therefore committed to implementing the<br />
principles of the U.N. Global Compact.<br />
<strong>BASF</strong> received a number of awards for its sustainability management in <strong>2008</strong>: For example, we lead the Dow Jones<br />
Sustainability Index as the best chemical company. Success like this spurs us on: We have set ourselves ambitious<br />
goals for the future that you can read more about in this report.<br />
For my fellow Board members and me as well as for the entire <strong>BASF</strong> team, one thing is certain: Shaping the future<br />
requires determination, especially in difficult times like the present. Our highest priorities are to be a reliable partner<br />
for our customers, maintain our strong cash flow, reduce costs and continue our restructuring efforts. What is clear<br />
is that there are enormous challenges ahead of us. We are ready to face them with our full strength and with trust<br />
in your support.<br />
Sincerely yours,<br />
dr. Jürgen hambrecht<br />
Chairman of the Board of Executive Directors of <strong>BASF</strong> SE<br />
BASf REPORT <strong>2008</strong><br />
9
10<br />
TO OuR ShAREhOldERS<br />
Board of Executive Directors<br />
ThE BOARd Of ExECuTivE diRECTORS<br />
Of BASf SE<br />
With schoolchildren from the Ruprecht Elementary School, ludwigshafen, Germany<br />
dR. hAnS-ulRiCh EnGEl<br />
As of March 3, 2009<br />
dR. hAnS-ulRiCh EnGEl<br />
49, with <strong>BASF</strong> for 21 years<br />
Board member since March 4, <strong>2008</strong><br />
-- Oil & Gas<br />
-- Region Europe<br />
-- Global Procurement & Logistics<br />
BASf REPORT <strong>2008</strong><br />
dR. kuRT BOCk<br />
dR. kuRT BOCk<br />
Chief Financial Officer<br />
50, with <strong>BASF</strong> for 18 years<br />
dR. JÜRGEn hAmBREChT<br />
-- Catalysts<br />
-- Market & Business<br />
Development North America<br />
-- Regional Functions North America<br />
-- Finance<br />
-- Information Services<br />
-- Corporate Controlling<br />
-- Corporate Audit<br />
dR. hARAld SChWAGER<br />
dR. JÜRGEn hAmBREChT<br />
Chairman of the Board of Executive<br />
Directors<br />
62, with <strong>BASF</strong> for 33 years<br />
-- Legal, Taxes & Insurance<br />
-- Strategic Planning & Controlling<br />
-- Communications & Government<br />
Relations<br />
-- Global HR – Executive<br />
Management & Development<br />
-- Investor Relations<br />
-- Chief Compliance Officer<br />
dR. mARTin BRudERmÜllER<br />
dR. hARAld SChWAGER<br />
Industrial Relations Director,<br />
48, with <strong>BASF</strong> for 21 years<br />
-- Human Resources<br />
-- Engineering & Maintenance<br />
-- Environment, Health & Safety<br />
-- Verbund Site<br />
Management Europe
dR. STEfAn mARCinOWSki<br />
dR. mARTin BRudERmÜllER<br />
47, with <strong>BASF</strong> for 21 years<br />
-- Performance Polymers<br />
-- Polyurethanes<br />
-- Styrenics<br />
-- Market & Business<br />
Development Asia Pacific<br />
-- Regional Functions & Country<br />
Management Asia Pacific<br />
dR. STEfAn mARCinOWSki<br />
56, with <strong>BASF</strong> for 30 years<br />
-- Crop Protection<br />
-- Coatings<br />
-- Region South America<br />
-- Specialty Chemicals Research<br />
-- <strong>BASF</strong> Plant Science<br />
dR. AndREAS kREimEyER dR. JOhn fEldmAnn<br />
dR. AndREAS kREimEyER<br />
Research Executive Director,<br />
53, with <strong>BASF</strong> for 23 years<br />
-- Inorganics<br />
-- Petrochemicals<br />
-- Intermediates<br />
-- Chemicals Research<br />
& Engineering<br />
-- <strong>BASF</strong> Future Business<br />
TO OuR ShAREhOldERS<br />
Board of Executive Directors<br />
dR. JOhn fEldmAnn<br />
59, with <strong>BASF</strong> for 21 years<br />
-- Construction Chemicals<br />
-- Acrylics & Dispersions<br />
-- Care Chemicals<br />
-- Performance Chemicals<br />
-- Polymer Research<br />
BASf REPORT <strong>2008</strong><br />
11
12<br />
TO OuR ShAREhOldERS<br />
Our Values<br />
OuR vAluES<br />
long-term business success requires clearly defined<br />
principles. Our system of values and standards of<br />
conduct are laid down in our corporate values and<br />
Principles. We promote these values and Principles,<br />
and through acting responsibly, strengthen our<br />
stakehol ders’ trust in our sustainable development.<br />
Six values constitute the foundation of our business and<br />
the means by which we want to achieve our goals:<br />
• Sustainable profitable performance<br />
• Innovation for the success of our customers<br />
• Safety, health and environmental responsibility<br />
• Personal and professional competence<br />
• Mutual respect and open dialogue<br />
• Integrity<br />
Each value is illustrated by principles that govern our conduct<br />
in day-to-day business. Together they form a system<br />
of values and standards which is binding for all <strong>BASF</strong><br />
employees. Observance of our Values and Principles is a<br />
basic element in the annual target agreements of all senior<br />
executives in the <strong>BASF</strong> Group.<br />
Code of Conduct and compliance<br />
The value “Integrity” forms the basis of our Code of Conduct,<br />
which we introduced in 2000 throughout all Germanbased<br />
Group companies. It is binding for all employees of<br />
the <strong>BASF</strong> Group in Germany. <strong>BASF</strong> Group companies in<br />
other countries introduced corresponding codes of conduct,<br />
which take local laws and customs into account.<br />
Codes of conduct must be explained and applied to our<br />
daily business in order for them to be realized. Compliance<br />
is the term widely used to describe this. It encompasses<br />
the obligation to abide by laws and internal corporate<br />
directives as well as signaling the company’s activities to<br />
OuR RESPOnSiBiliTy fOR SuSTAinABlE dEvElOPmEnT<br />
With the rise of globalization, economic conditions have changed fundamentally. As a globally committed company, our<br />
stakeholders expect our decisions and conduct to serve as models for sustainable development. As a founding member of<br />
the United Nations Global Compact, we are voluntarily committed to the implementation and advancement of internationally<br />
recognized principles on human rights, labor standards, environmental protection and fighting corruption.<br />
more information can be found at basf.com/globalcompact_e and under www.globalcompact.org<br />
BASf REPORT <strong>2008</strong><br />
ensure the fulfillment of this obligation. All <strong>BASF</strong> employees<br />
worldwide receive compliance training. Furthermore,<br />
we offer our employees points of contact, where they can<br />
seek advice and assistance from supervisors, the Legal<br />
and Human Resources departments as well as through an<br />
anonymous and confidential Compliance Hotline. The<br />
Chief Compliance Officer reports directly to the Board of<br />
Executive Directors and is responsible for managing, monitoring<br />
and developing our Compliance Program.<br />
more information on our Compliance Program can be found on page 30<br />
dedicated to fighting corruption<br />
An important goal of the <strong>BASF</strong> Compliance Program is to<br />
guard against cases of corruption, and when possible, prevent<br />
them. To achieve this, we are also involved in initiatives<br />
with external partners. As a member of the United<br />
Nations Global Compact (GC), we work act ively in implementing<br />
the GC principle on fighting corruption. We have<br />
been a member of Transparency International Germany e.V.<br />
since 2003, and strongly support their work in fighting corruption.<br />
Since <strong>2008</strong>, we have been a participant in the<br />
“Partnering Against Corruption Initiative” (PACI) from the<br />
World Economic Forum in Davos, Switzerland.<br />
Since 2002, we have been working with the Indian government,<br />
local non-governmental organizations and scientific<br />
institutions in the “Million Minds Project,” which aims<br />
to provide one million people with information on the subject<br />
of anti-corruption.
Global labor and social standards<br />
We are committed to maintaining and promoting high labor<br />
and social standards: We comply with federal laws, adhere<br />
to internationally recognized standards and respect generally<br />
accepted customs.<br />
Within our spheres of influence, we promote the protection<br />
and consistent implementation of the principles of the<br />
U.N. Global Compact. We respect and support:<br />
• The United Nations’ Universal Declaration of Human<br />
Rights;<br />
• The International Labor Organization’s (ILO) eight core<br />
labor standards;<br />
• The OECD Guidelines for Multinational Enterprises.<br />
Our labor conditions conform to internationally recognized<br />
labor and social standards. We are committed to the following<br />
principles:<br />
• We provide our employ ees with performance-related<br />
compensation based on global principles and in line with<br />
the market, that at the very least, matches the current<br />
minimum wage. We pass on our economic success to<br />
our employees;<br />
• An appropriate limit to the maximum number of working<br />
hours;<br />
• Regularly paid vacation for our employees;<br />
• In recruitment, type of work and compensation, we do<br />
not discriminate based on nationality, gender, religion or<br />
any other personal characteristics;<br />
• We avoid and condemn the exploitation of all forms of<br />
child, forced or compulsory labor;<br />
• The principles of freedom of assembly and cooperation<br />
with the elected employee representatives.<br />
more information can be found at basf.com/humanrights<br />
vAluES And PRinCiPlES<br />
Our values describe our approach to business. They<br />
are supplemented by principles which explain how we<br />
implement our values in our day-to-day business.<br />
TO OuR ShAREhOldERS<br />
Our Values<br />
We believe that meeting our voluntary commitments is one<br />
of our fundamental responsibilities. We have therefore<br />
developed and implemented a global monitoring system<br />
for labor and social standards.<br />
more information on monitoring instruments can be found in the chapter<br />
“Sustainability management” on page 29<br />
lABOR And SOCiAl STAndARdS<br />
• Supporting the ten principles of the United Nations<br />
Global Compact<br />
• Labor conditions conform to internationally recognized<br />
labor and social standards<br />
• A monitoring system assesses whether our voluntary<br />
commitments are being met<br />
BASf REPORT <strong>2008</strong><br />
13
14<br />
TO OuR ShAREhOldERS<br />
Our Strategy<br />
OuR STRATEGy<br />
Strategies for value-adding growth<br />
As the world’s leading chemical company, we play a<br />
decisive role in shaping the future. We base our actions<br />
on sustainability. Our goal is to grow profitably on a<br />
permanent basis. We achieve this through operational<br />
excellence, innovation and investments in growth markets.<br />
As a reliable partner, we help our customers to<br />
be more successful with our products and intelligent<br />
solutions.<br />
We focus our business activities on the challenges of the<br />
future. In times of economic difficulty, we continue to concentrate<br />
on innovative business areas and profit from our<br />
wide portfolio range, operating excellence, solid financing<br />
and a high-performance team. We invest early in growth<br />
markets and are present in all important markets. Our<br />
active portfolio management, acquisitions and divestitures<br />
make us economically independent and more competitive.<br />
All <strong>BASF</strong> employees contribute to affirming our number<br />
one position in the chemical industry through their creativity,<br />
individual responsibility and performance. In order to<br />
guarantee this in the future, our personnel policy centers<br />
on long-term developments, with a program on demographic<br />
change, and a stronger focus on internationality<br />
and diversity.<br />
Strong portfolio through acquisitions<br />
We strengthen our position and reduce the cyclical nature<br />
of our business through acquisitions. With the takeover of<br />
Ciba Holding AG in Switzerland, we continue to expand<br />
our leading position in specialty chemicals. In order to<br />
efficiently integrate Ciba’s activities, we are developing a<br />
market-driven positioning for the combined businesses<br />
and optimizing our structures. With the acquisition of<br />
Revus Energy ASA in Norway, we have strengthened our<br />
oil and gas business in Europe.<br />
OuR POSiTiOninG<br />
<strong>BASF</strong> is the world’s leading chemical company. We offer<br />
intelligent solutions with innovative products and tailormade<br />
services. We open up opportunities for success<br />
through trustworthy and reliable partnerships.<br />
BASf REPORT <strong>2008</strong><br />
value-adding growth through efficiency and effectiveness<br />
At the end of <strong>2008</strong>, we adjusted our production at an early<br />
stage to meet lowering demand. Our ongoing processes for<br />
restructuring and cost-cutting have been strengthened. In<br />
October <strong>2008</strong>, we started the excellence program NEXT: It<br />
unites over 500 individual projects worldwide in all divisions<br />
and functions of <strong>BASF</strong>. Together with our ongoing programs<br />
to increase efficiency, we expect a resulting contribution of<br />
over €1 billion annually starting in 2012. NEXT creates more<br />
value, for example through simplifying processes, resource<br />
bundling, energy efficiency and intelligent use of new information<br />
technologies. Our goal is to attain the next level of<br />
operational excellence.<br />
innovation creates market opportunities<br />
For us, innovation is key to profitable growth in a competitive<br />
global marketplace. Therefore, we maintain our high<br />
level of investment in research and development, and<br />
network globally with universities, institutes, customers<br />
and industrial partners. We work on solutions for global<br />
challenges and thereby focus on future markets and technologies<br />
with high growth potential. These include:<br />
• Energy management<br />
• Raw material change<br />
• Nanotechnology<br />
• Plant biotechnology<br />
• White (industrial) biotechnology<br />
Success through strategic partnerships<br />
Strong partnerships enable us to develop significant growth<br />
markets. Our most important cooperation partners include<br />
the biotechnology company Monsanto in the United States,<br />
our Chinese joint venture partner Sinopec, PETRONAS in<br />
Malaysia, as well as Gazprom in Russia.<br />
WE CREATE vAluE<br />
• Restructuring and cost-cutting<br />
• Excellence program NEXT<br />
• Acquisitions and divestitures<br />
• Innovative business areas<br />
• Presence in growth markets<br />
• Investments in research and development<br />
•<br />
Worldwide research cooperations
We earn a premium<br />
on our cost of capital<br />
A prerequisite for our long-term success is that we earn<br />
a premium on our cost of capital. We therefore concentrate<br />
our funds more strongly on attractive business<br />
sectors. Income from operations after cost of capital is<br />
our key performance and management indicator. We<br />
rely on our employees for implementing this guideline.<br />
Together they make an important contribution within the<br />
framework of our value-based management and make<br />
our company more competitive.<br />
We help our customers<br />
to be more successful<br />
We are there where our customers are: in all important<br />
markets around the world. As a reliable partner and<br />
advisor, we already want to understand today what<br />
our customers need tomorrow. Based on their requirements,<br />
we mutually develop innovative products and<br />
technologies – because our customers’ success is our<br />
success.<br />
fOuR STRATEGiC GuidElinES<br />
Our four guidelines form the basis for our activities and make us strong for the future:<br />
• We earn a premium on our cost of capital<br />
• We help our customers to be more successful<br />
• We form the best team in industry<br />
• We ensure sustainable development<br />
We form the best team<br />
in industry<br />
TO OuR ShAREhOldERS<br />
Our Strategy<br />
Our strategy for value-adding growth relies on having the<br />
best team in industry. Every employee can contribute to<br />
value-based management. We recognize the benefits of<br />
employee diversity: With differing competencies and perspectives,<br />
they help us understand customers better and<br />
develop tailor-made solutions for them. Our management<br />
culture is built on open dialogue and trustworthy cooperation.<br />
To attract and keep the best professionals and<br />
managers, we offer development opportunities as well as<br />
pay linked to company performance.<br />
We ensure<br />
sustainable development<br />
At <strong>BASF</strong>, sustainable development means combining<br />
economic success with environmental protection and<br />
social responsibility. We are committed to this concept<br />
in all business activities. The goal of our sustainability<br />
strategy is to minimize risks and open up new business<br />
opportunities: for example with sustainable products<br />
and services that give us and our customers a competitive<br />
advantage. Throughout the world, our products<br />
make a contribution to solving global challenges.<br />
BASf REPORT <strong>2008</strong><br />
15
16<br />
TO OuR ShAREhOldERS<br />
Our Goals<br />
OuR GOAlS<br />
Economic Goals<br />
Premium on cost of capital <strong>2008</strong> goals<br />
Earn an EBIT of at least 10% based on the assets of the<br />
operating divisions<br />
dividend<br />
Dividend per share to be increased annually or at least to<br />
remain at the previous year’s level<br />
EBiTdA margin<br />
BASf REPORT <strong>2008</strong><br />
At least<br />
€4,842 million<br />
At least<br />
€1.95<br />
Status at year-end <strong>2008</strong> more on<br />
We achieved an EBIT of €6,463 million and therefore a<br />
premium of €1,621 million on our cost of capital.<br />
The Board of Executive Directors and the Supervisory<br />
Board will propose a dividend payment of €1.95 per<br />
share at the <strong>Annual</strong> Meeting.<br />
> page 27<br />
> page 45<br />
EBITDA margin of 18% until 2012 18% 15.3% > page 39<br />
Environment, Safety and Product Stewardship<br />
Energy and Climate Protection 2020 goals<br />
Emissions of greenhouse gases per metric ton of sales<br />
product (baseline 2002)<br />
Improvement of specific energy efficiency of production<br />
processes (baseline 2002)<br />
Stop the flaring of associated gas that is released during<br />
crude oil production by Wintershall (2012 goal)<br />
Reduction in emissions from chemical operations (baseline 2002)<br />
Goal Status at year-end <strong>2008</strong> more on<br />
–25% –14.2% > page 100<br />
+25% +22.0% > page 102<br />
100% >95% > page 100<br />
Emissions of air pollutants 1 –70% –55.3% > page 107<br />
Emissions to water of > page 104<br />
Organic substances 1 –80% –77.5% > page 104<br />
Nitrogen 1 –80% –80.3% > page 104<br />
Heavy metals 1 –60% –55.9% > page 104<br />
distribution safety (baseline 2003)<br />
Reduction in transportation accidents –70% –35.7% > page 108<br />
Product Stewardship<br />
Review of all products that are sold worldwide by <strong>BASF</strong> in<br />
quantities of more than 1 metric ton per year, based on a risk<br />
assessment (2015 goal)<br />
1 Assuming comparable product portfolio<br />
PROPOSEd dividEnd PER ShARE<br />
€1.95<br />
> 99% >15% > page 110<br />
REduCTiOn in GREEnhOuSE GASES<br />
(Greenhouse gas emissions per metric ton of sales product/baseline 2002)<br />
–14%
Employees and Society<br />
Occupational safety (baseline 2002) 2020 goals<br />
Reduction in lost time injuries<br />
per million working hours<br />
health protection (baseline 2004)<br />
TRAnSPORTATiOn ACCidEnTS<br />
(Per 10,000 shipments / baseline 2003)<br />
–36%<br />
SEniOR ExECuTivES WiTh<br />
inTERnATiOnAl ExPERiEnCE<br />
74%<br />
TO OuR ShAREhOldERS<br />
Our Goals<br />
Goal Status at year-end <strong>2008</strong> more on<br />
–80% –45.5% > page 95<br />
Reduction in cases of occupational diseases –80% –23.3% > page 96<br />
Senior executives long-term goals<br />
International proportion of senior executives<br />
Women in senior executive positions<br />
Senior executives with international experience<br />
leadership feedback <strong>2008</strong> goal<br />
Mandatory leadership feedback for senior executives<br />
worldwide<br />
Employee survey 2009 goal<br />
Increase in the proportion of non-German senior<br />
executives (baseline 2003: 30%)<br />
Increase in the proportion of female senior executives<br />
(baseline 2003: 5.2%)<br />
Proportion of senior executives with international<br />
experience over 70%<br />
80% of senior executives have taken part in the<br />
standardized leadership feedback process<br />
Global employee survey Implement a global employee survey for the <strong>BASF</strong> Group<br />
Data collected,<br />
subsequent<br />
process initiated<br />
30.2% > page 91<br />
5.7% > page 91<br />
73.7% > page 91<br />
76.9% > page 91<br />
> page 92<br />
BASf REPORT <strong>2008</strong><br />
17
18<br />
TO OuR ShAREhOldERS<br />
<strong>BASF</strong> on the Capital Market<br />
BASf On ThE CAPiTAl mARkET<br />
high dividend yield, good credit ratings<br />
BASf shares could not escape losses on the stock<br />
markets as a result of the financial and economic crisis.<br />
Even in difficult times, we are committed to our<br />
ambitious dividend policy and offer our shareholders a<br />
dividend yield of 7%. BASf has solid financing and<br />
good credit ratings compared with its competitors in<br />
the chemical industry.<br />
Stock markets gripped by the financial and economic<br />
crisis<br />
In <strong>2008</strong>, <strong>BASF</strong>’s shares were also caught up in the downward<br />
trend on the stock markets and closed the year at a price of<br />
€27.73 per share, 45.3% lower than at the end of 2007.<br />
Assuming that dividends were reinvested, a holding in<br />
<strong>BASF</strong> shares declined by 42.9% in value in <strong>2008</strong>. The<br />
global industry indices, DJ Chemicals and MSCI World<br />
Chemicals, also declined by 41.9% and 44.2%, respectively.<br />
Over the same period, the DAX 30 and DJ EURO<br />
STOXX 50, the key German and European indices, lost<br />
40.4% and 42.4%, respectively.<br />
Change in value of an investment in BASf shares <strong>2008</strong><br />
(with dividends reinvested, indexed)<br />
110<br />
110<br />
100<br />
100<br />
90<br />
90<br />
80<br />
80<br />
70<br />
60<br />
50<br />
40<br />
dividend per share 1 (€ per share)<br />
2.0<br />
1.5<br />
1.0<br />
0.5<br />
0.0<br />
0.57<br />
1999<br />
JAN<br />
jan<br />
FEB<br />
BASf REPORT <strong>2008</strong><br />
feb<br />
MAR<br />
0.65 0.65 0.70 0.70<br />
2000<br />
2001<br />
2002<br />
2003<br />
mär<br />
APR<br />
2004<br />
apr<br />
2005<br />
MAY<br />
mai<br />
2006<br />
JUN<br />
jun<br />
1.95 1.95<br />
2007<br />
1 Adjusted for two-for-one stock split, conducted in the second quarter of<br />
<strong>2008</strong>.<br />
0.85<br />
1.00<br />
1.50<br />
<strong>2008</strong><br />
JUL<br />
jul<br />
The assets of an investor who invested €1,000 in <strong>BASF</strong><br />
shares at the end of 1998 and reinvested the dividends in<br />
additional <strong>BASF</strong> shares would have increased to €2,395 by<br />
the end of <strong>2008</strong>. This average annual return of 9.1% places<br />
<strong>BASF</strong> shares substantially above the corresponding returns<br />
for the EURO STOXX 50 (minus 1.0 %) and DAX 30 (minus<br />
0.4%) and MSCI World Chemicals at 3.2%.<br />
long-term performance of BASf shares compared with indices<br />
(average annual performance with dividends reinvested)<br />
2004 – <strong>2008</strong><br />
1999 – <strong>2008</strong><br />
dividEnd<br />
–2%<br />
–1.0<br />
–0.4<br />
0%<br />
0.3<br />
2% 4% 6% 8% 10%<br />
• Proposed dividend of €1.95 per share matches last<br />
year<br />
• Aim to continuously increase the annual dividend, or<br />
at least maintain it at the level of the previous year<br />
3.0<br />
3.2<br />
3.9<br />
• <strong>BASF</strong> • DAX 30 • EURO STOXX • MSCI World Chemicals<br />
AUG<br />
aug<br />
SEP<br />
sep<br />
OCT<br />
okt<br />
NOV<br />
nov<br />
DEC<br />
dez<br />
8.1<br />
• DAX 30<br />
–40.4%<br />
• <strong>BASF</strong><br />
–42.9%<br />
• MSCI World<br />
Chemicals<br />
–44.2%<br />
9.1
Proposed dividend of €1.95 per share<br />
At the <strong>Annual</strong> Meeting, the Board of Executive Directors<br />
and the Supervisory Board will propose to distribute a<br />
dividend of €1.95 per share as in the previous year. This<br />
means that, even in difficult economic times, we stand by<br />
our ambitious dividend policy and will pay out €1.8 billion<br />
to our shareholders (based on the number of qualifying<br />
shares on December 31, <strong>2008</strong>). Based on the year-end<br />
share price for <strong>2008</strong>, <strong>BASF</strong> shares offer a high dividend<br />
yield of 7%. <strong>BASF</strong> belongs to the DivDAX share index,<br />
which contains the 15 companies with the highest dividend<br />
yield in the DAX 30. We aim to increase our dividend each<br />
year, or at least maintain it at the previous year’s level.<br />
Share buybacks for €1.6 billion in <strong>2008</strong><br />
In June <strong>2008</strong>, <strong>BASF</strong> concluded ahead of schedule the<br />
€3 billion share buyback program for 2007 and <strong>2008</strong> that it<br />
announced in February 2007. A new share buyback program<br />
that began in July was stopped in the fourth quarter<br />
due to the financial and economic crisis.<br />
In <strong>2008</strong>, <strong>BASF</strong> bought back 37.9 million shares for approximately<br />
€1.6 billion at an average price of €42.70 per<br />
share. The majority of the repurchased shares have already<br />
been cancelled and the share capital of <strong>BASF</strong> SE reduced<br />
accordingly.<br />
Following the deduction of 4.6 million shares that are<br />
earmarked for cancellation, the total number of outstanding<br />
shares was 918.5 million on December 31, <strong>2008</strong>.<br />
Based on a year-end share price of €27.73, the market<br />
capitalization was €25.5 billion at the end of the year.<br />
Share buybacks (million €)<br />
2,000<br />
1,500<br />
1,000<br />
500<br />
0<br />
256<br />
1999<br />
700<br />
2000<br />
1,300<br />
2001<br />
500<br />
2002<br />
500<br />
2003<br />
726<br />
2004<br />
1,435<br />
2005<br />
938<br />
1,899<br />
2006 2007<br />
1,618<br />
<strong>2008</strong><br />
TO OuR ShAREhOldERS<br />
<strong>BASF</strong> on the Capital Market<br />
Broad base of international shareholders<br />
<strong>BASF</strong> is one of the largest publicly owned companies with<br />
around 460,000 shareholders and a high free float. An<br />
analysis of the shareholder structure carried out in September<br />
<strong>2008</strong> showed that, at 22% of share capital, the<br />
United States and Canada made up the largest regional<br />
group of institutional investors. Institutional investors from<br />
Germany made up 13%. Shareholders from the United<br />
Kingdom and Ireland held 14% of <strong>BASF</strong> shares, while a<br />
further 14% are held by institutional investors from the rest<br />
of Europe. Around 28% of the company’s share capital is<br />
held by private investors, most of whom are residents in<br />
Germany.<br />
Shareholder structure (by region)<br />
4<br />
3<br />
5<br />
6<br />
2<br />
1<br />
1 -- Germany: 41%<br />
2 -- United Kingdom/Ireland: 14%<br />
3 -- Rest of Europe: 14%<br />
4 -- U.S./Canada: 22%<br />
5 -- Rest of the World: 1%<br />
6 -- Unidentified: 8%<br />
Employees becoming shareholders<br />
In many countries, we offer employee stock ownership<br />
plans to encourage our employees to become <strong>BASF</strong><br />
shareholders. More than 19,400 employees bought<br />
employ ee shares in <strong>2008</strong>, worth a total of approximately<br />
€44 million.<br />
• Shares bought back for €1.6 billion in <strong>2008</strong><br />
• €3 billion share buyback program for 2007 and <strong>2008</strong><br />
concluded ahead of schedule in June <strong>2008</strong><br />
• New share buyback program started in July <strong>2008</strong><br />
stopped in the fourth quarter due to the financial and<br />
economic crisis<br />
BASf REPORT <strong>2008</strong><br />
19
20<br />
TO OuR ShAREhOldERS<br />
<strong>BASF</strong> on the Capital Market<br />
increased attendance again at the <strong>Annual</strong> meeting<br />
The <strong>Annual</strong> Meeting was held in Mannheim on April 24,<br />
<strong>2008</strong>. With over 51% of the share capital represented,<br />
attendance was 3 percentage points higher than in the<br />
previous year.<br />
Attendance at the <strong>Annual</strong> meeting<br />
60<br />
50<br />
40<br />
30<br />
20<br />
10<br />
0<br />
49.5<br />
46.0<br />
43.6<br />
48.4<br />
36.9<br />
31.3<br />
35.0 34.4<br />
38.4<br />
1999<br />
2000<br />
BASf REPORT <strong>2008</strong><br />
2001<br />
2002<br />
2003<br />
BASf shares in key sustainability indices<br />
<strong>BASF</strong> was named the leading chemical company in the<br />
Dow Jones Sustainability Index (DJSI World), the most<br />
important sustainability index worldwide. <strong>BASF</strong> was recognized<br />
for its climate strategy, its environmental and social<br />
reporting and for developing innovative and eco-efficient<br />
products. <strong>BASF</strong> was included in the DJSI World for the<br />
eighth year in succession.<br />
In addition, <strong>BASF</strong> is the worldwide number 1 in the<br />
renowned Carbon Disclosure Leadership Index (CDLI) in<br />
the category carbon-intensive sectors. This index provides<br />
investors with a tool to evaluate companies who distinguish<br />
themselves in addressing the challenges of climate<br />
change and transparent disclosure practices. The Carbon<br />
Disclosure Project represents 385 institutional investors<br />
with $57 trillion in assets under management.<br />
2004<br />
2005<br />
2006<br />
more information can be found at basf.com/sustainabilityindices<br />
SuSTAinABiliTy indiCES SOlid finAnCinG<br />
2007<br />
• <strong>BASF</strong>: Chemical sector leader in the world’s leading<br />
sustainability index, the Dow Jones Sustainability<br />
Index<br />
• <strong>BASF</strong>: Worldwide number 1 in the renowned Carbon<br />
Disclosure Leadership Index (CDLI) in the category<br />
carbon-intensive sectors<br />
51.4<br />
<strong>2008</strong><br />
Good credit ratings and solid financing<br />
Thanks to its excellent business profile and good financial<br />
position, <strong>BASF</strong> has good credit ratings compared with its<br />
competitors in the chemical industry. At year-end, the rating<br />
agency Standard & Poor’s valued <strong>BASF</strong>’s creditworthiness<br />
at “AA- /A-1+/outlook negative” and the rating agency<br />
Moody’s at “Aa3/P-1/outlook under review for downgrade.”<br />
At the beginning of 2009, Standard & Poor’s downgraded<br />
<strong>BASF</strong>’s rating to a level of “A+/A-1/outlook negative”<br />
and Moody’s reduced its rating to “A1/P-1/outlook<br />
stable.”<br />
At year-end <strong>2008</strong>, the financial indebtedness of the<br />
<strong>BASF</strong> Group was €14.5 billion with a liquidity of €2.8 billion.<br />
Approximately 57% of financial indebtedness was<br />
long-term debt with a maturity of over one year.<br />
Our medium to long-term debt financing is based on<br />
corporate bonds with a balanced maturity profile. <strong>BASF</strong><br />
issued several bonds totaling €1.6 billion as well as promissory<br />
notes for €553 million in <strong>2008</strong>.<br />
Despite the tense situation on the credit markets, <strong>BASF</strong><br />
was able to finance itself with commercial paper without<br />
any difficulty. In October <strong>2008</strong>, we increased the maximum<br />
potential issuing volume of our commercial paper program<br />
from $7.5 billion to $12.5 billion. As of December 31, <strong>2008</strong>,<br />
<strong>BASF</strong> had used approximately $6.1 billion of this program.<br />
As back-up for the program, committed and unused credit<br />
lines of $6 billion are available as well as a credit line of<br />
CHF 3.5 billion to finance the acquisition of Ciba.<br />
more information on financial indebtedness and their maturities can be found<br />
on page 206<br />
• Year-end <strong>2008</strong>, <strong>BASF</strong> Group financial indebtedness of<br />
€14.5 billion, approximately 57% of which was longterm<br />
with a maturity of over one year<br />
• No difficulties in financing through commercial papers<br />
in <strong>2008</strong>, commercial paper program increased to<br />
$12.5 billion<br />
• Liquidity at year-end <strong>2008</strong>: €2.8 billion
key BASf share data 1<br />
TO OuR ShAREhOldERS<br />
<strong>BASF</strong> on the Capital Market<br />
2004 2005 2006 2007 <strong>2008</strong><br />
Year-end price € 26.50 32.36 36.93 50.71 27.73<br />
Year high € 26.50 32.67 37.12 50.81 52.41<br />
Year low € 20.25 25.06 29.49 35.98 19.95<br />
Year average € 22.59 28.57 32.41 44.5 38.88<br />
Daily trade in shares 2<br />
– million € 121.7 154.0 198.6 298.3 282.1<br />
– million shares 5.4 5.4 6.2 6.7 7.26<br />
Number of shares as of December 31 3 million shares 1,080.80 1,028.80 999.4 956.4 918.5<br />
Market capitalization December 31 billion € 28.6 33.3 36.9 48.5 25.5<br />
Earnings per share 4 € 1.83 2.87 3.19 4.16 3.13<br />
Dividend per share € 0.85 1.00 1.50 1.95 1.95<br />
Dividend yield 5 % 3.21 3.09 4.06 3.85 7.03<br />
Payout ratio 4 % 45 34 46 45 62 6<br />
Price-earnings ratio (P/E ratio) 4, 5 14.5 11.3 11.6 12.2 8.9<br />
1 All values adjusted for two-for-one stock split, conducted in the second quarter of <strong>2008</strong><br />
2 Average, Xetra trading<br />
3 After deduction of shares earmarked for cancellation<br />
4 Starting in 2005, the accounting and reporting of the <strong>BASF</strong> Group has been performed in accordance with International Financial <strong>Report</strong>ing Standards (IFRS).<br />
The previous year’s figure has been restated accordingly. The figures up to and including 2003 were prepared according to German Commercial Code.<br />
5 Based on year-end share price<br />
6 With regard to the number of qualifying shares as of December 31, <strong>2008</strong><br />
Percentage of BASf shares in important indices<br />
as of december 31, <strong>2008</strong><br />
%<br />
DAX 30 5.8<br />
DJ STOXX 50 1.3<br />
DJ EURO STOXX 50 2.0<br />
DJ Chemicals 7.1<br />
MSCI World Index 0.2<br />
S&P Global 100 0.6<br />
further information<br />
Securities code numbers<br />
Germany 515100<br />
Great Britain 0083142<br />
Switzerland 323600<br />
USA (CUSIP-Number) 055262505<br />
ISIN International Stock Identification Number DE0005151005<br />
international ticker symbol<br />
Deutsche Börse BAS<br />
London Stock Exchange BFA<br />
Swiss Exchange AN<br />
BASf REPORT <strong>2008</strong><br />
21
22<br />
TO OuR ShAREhOldERS<br />
<strong>BASF</strong> on the Capital Market<br />
Analysts’ recommendations<br />
Approximately thirty financial analysts regularly publish<br />
reports on <strong>BASF</strong>. At the end of <strong>2008</strong>, 48% of analysts<br />
recommended buying our shares, 28% of analysts recommended<br />
keeping our shares, and 24% graded them to sell.<br />
On December 31, <strong>2008</strong>, analysts estimated the average<br />
target price of <strong>BASF</strong> shares to be €31.09.<br />
Analyst’s current forecasts about BASf can be found at basf.com/share<br />
Close dialogue with the capital markets<br />
For our corporate strategy that is aimed to create sustainable<br />
value, the continual and open communication with all<br />
participants in the capital market is important. We inform<br />
institutional investors and rating agencies through numerous<br />
individual meetings and road shows worldwide, while<br />
also holding information events to provide private investors<br />
with an insight into the world of <strong>BASF</strong>.<br />
In <strong>2008</strong>, we hosted a series of presentations each<br />
focus ing on a different <strong>BASF</strong> Group segment. On these<br />
Segment Days, we informed analysts and investors of the<br />
performance, strategy and growth potential of the respective<br />
segments. In <strong>2008</strong>, we presented the Chemicals, Agricultural<br />
Solutions, and Oil & Gas segments as well as the<br />
biotechnology growth cluster.<br />
Furthermore, we discussed our contributions to such<br />
sustainability topics as climate protection and energy effi ciency<br />
with the financial analysts and investors. Information<br />
on the strategic benefit of sustainability and its full implementation<br />
within our company is in demand from our<br />
inves tors particularly within the framework of “Socially<br />
Responsible Investment” (SRI).<br />
invESTOR RElATiOnS nEWSlETTER<br />
The Investor Relations Team’s newsletter provides<br />
current information of new topics concerning <strong>BASF</strong><br />
and reminds the reader about important <strong>BASF</strong> dates.<br />
Registration at: basf.com/aktie/newsletter<br />
BASf REPORT <strong>2008</strong><br />
Analysts and investors confirm the quality of our communication<br />
work and have ranked <strong>BASF</strong> Investor Relations as<br />
the number one on many occasions. In June, <strong>BASF</strong> was<br />
awarded first place in the Capital Investor Relations Prize<br />
<strong>2008</strong>. In this ranking conducted by the German business<br />
magazine Capital, and the Society of Investment Professionals<br />
in Germany (DVFA), <strong>BASF</strong> ranked first among<br />
EURO STOXX 50 companies as in the previous year, and<br />
for the first time was the overall winner among the approximately<br />
200 participants. In the Thomson Extel Survey as<br />
well as with a survey of financial analysts conducted by the<br />
trade journal Institutional Investor, <strong>BASF</strong> won first place for<br />
the best Investor Relations work in the European chemical<br />
industry. <strong>BASF</strong> also received first place for having the best<br />
Investor Relations website of all companies in the DAX,<br />
MDAX and TECDAX in the NetFed IR-Benchmark<br />
2007/<strong>2008</strong>.<br />
Our new reporting concept also received praise on the<br />
capital markets. The IR Society awarded <strong>BASF</strong> first place<br />
in the category “Best Practice Communication Through The<br />
<strong>Annual</strong> <strong>Report</strong>.”<br />
invESTOR RElATiOnS<br />
can be contacted by:<br />
• phone: +49 621 60-48230<br />
• e-mail: investorrelations@basf.com<br />
• Internet: basf.com/share
Jae Hyung Hwang<br />
is researching the next generation<br />
of solar cells.<br />
* with universities, research institutes and<br />
industrial partners
ManageMent’s analysis<br />
VaLue FOR BaSF<br />
winning a share of the future<br />
energy market<br />
In the Joint Innovation Lab, Peter Erk and Jae Hyung Hwang, together with<br />
their colleagues, are developing products for organic solar cells.<br />
Innovations for global challenges<br />
Our research opens up growth areas of the future. In the<br />
areas of energy management and nanotechnology, for<br />
example, we are developing new materials for solar cells to<br />
replace silicon, which is energy intensive in production, with<br />
organic compounds. Organic solar cells are therefore made<br />
more competitive in the long-term through affordable manufacturing<br />
processes. <strong>BASF</strong> created a cooperation network<br />
of leading research groups within the framework of the<br />
initiative “Organic Photovoltaics,” initiated by the German<br />
Federal Ministry of Education and Research.<br />
VaLue FOR SOCIeTy<br />
affordable electricity, clean<br />
energy<br />
Electricity from light: In the future, solar cells could also produce energy with<br />
organic photovoltaics. Source: Schott<br />
Contributing to sustainable energy production<br />
The contribution of organic photovoltaics to sustainable<br />
ener gy production unlocks new applications for turning light<br />
into electrical energy. Imprinted on transparent foil, the<br />
extremely thin photoactive layer makes solar cells light and<br />
bendable. With this, for example, house facades could<br />
produce electricity in the future.<br />
More information on research and development can be found from<br />
page 34 onward
02<br />
ManageMent’s<br />
analysis<br />
the BasF group 24<br />
Markets, Structures and Organization 24<br />
Value-based Management 27<br />
Sustainability Management 28<br />
Value added Statement 33<br />
Research and Development in the <strong>BASF</strong> Group 34<br />
the Business year at BasF 36<br />
Trends in the Global Economy 36<br />
Trends in Key Customer Industries 37<br />
Trends in the Chemical Industry 38<br />
Results of the <strong>BASF</strong> Group 39<br />
Consolidated Balance Sheets 43<br />
Liquidity and Capital Resources 45<br />
Results of Operations by Segment 48<br />
<strong>BASF</strong> Segments 50<br />
Chemicals 50<br />
Plastics 57<br />
Performance Products 63<br />
Functional Solutions 69<br />
Agricultural Solutions 75<br />
Oil & Gas 80<br />
Regional Results 87<br />
employees and society 90<br />
Employees 90<br />
Occupational Safety 95<br />
Health Protection 96<br />
Social Commitment 97<br />
environment and safety 99<br />
Climate Protection 99<br />
Energy 102<br />
Water 104<br />
Environmental and Safety Management 106<br />
Product Stewardship 110<br />
Risk <strong>Report</strong> 112<br />
Forecast 120<br />
Economic Environment 120<br />
<strong>BASF</strong> Group Outlook and Opportunities 123<br />
Supplementary <strong>Report</strong> 125<br />
ManageMent’s analysis
24<br />
ManageMent’s analysis<br />
The <strong>BASF</strong> Group Markets, Structures and Organization<br />
MaRkets, stRuctuRes and ORganizatiOn<br />
global leader in the chemical industry – the chemical company<br />
With six Verbund sites and approximately 330 additional production sites, we support customers and partners in<br />
almost all countries. about 97,000 employees of the BasF group help customers in nearly all industries to be more<br />
successful. Our portfolio ranges from oil and gas to chemicals, plastics, high-value products, such as specialties<br />
and tailor-made system solutions, and crop protection products.<br />
BasF sites<br />
FREEPORT<br />
RegionaL<br />
HeadquaRteR<br />
VeRbund Site<br />
the VeRBund<br />
• Six Verbund sites worldwide and approximately 330 additional production sites<br />
• Production plants linked intelligently to save resources and energy<br />
• Ludwigshafen is the largest Verbund site, where the Verbund concept was developed<br />
and is continuously optimized<br />
BasF RePORt <strong>2008</strong><br />
GEISMAR<br />
SeLected<br />
PRoduction Site<br />
FLORHAM<br />
PARK<br />
SÃO<br />
PAULO<br />
LUDWIGSHAFEN<br />
ANTWERP<br />
NANJING<br />
KUANTAN<br />
SINGAPORE<br />
HONG KONG
Markets and sites<br />
baSF has subsidiaries in more than 80 countries and supplies<br />
its products to a large number of business partners<br />
around the world. in <strong>2008</strong>, we achieved 59% of our sales<br />
with customers in europe, of which 22 percentage points<br />
were in the oil & gas segment. 19% of sales were generated<br />
in north america; 15% in asia Pacific; and 7% in<br />
South america, africa, Middle east. We operate six Verbund<br />
sites as well as approximately 330 additional production<br />
sites worldwide. Ludwigshafen is the largest integrated<br />
chemical complex in the world. this was where the Verbund<br />
concept was developed and optimized before it was<br />
applied to other sites around the world.<br />
Organization of the BasF group<br />
We restructured our segments to mirror similar products,<br />
customers and production processes as of January 1,<br />
<strong>2008</strong>. as a result, investors are better able to assess baSF<br />
and we can align our portfolio with the acquisitions, divestitures<br />
and restructuring of the past years.<br />
in <strong>2008</strong>, baSF’s operating divisions were aggregated<br />
into six segments. the divisions carry the operational<br />
responsibility and manage our 61 global and regional business<br />
units. these in turn develop strategies for our 68 strategic<br />
business units and are organized along business or<br />
product lines.<br />
our regional divisions contribute to the local development<br />
of baSF’s business and help to exploit market potential.<br />
these divisions are also responsible for optimizing<br />
the regional infrastructure. For reporting purposes, the divisions<br />
are grouped into the following four regions: europe;<br />
north america; asia Pacific; and South america, africa,<br />
Middle east.<br />
BasF gROuP ORganizatiOn<br />
• divisions that are grouped into segments, manage our<br />
global and regional business units<br />
• Regional divisions optimize the infrastructure and support<br />
operations<br />
• corporate divisions and departments as well as competence<br />
centers function group-wide<br />
ManageMent’s analysis<br />
The <strong>BASF</strong> Group Markets, Structures and Organization<br />
VeRBund<br />
Efficient use of resources<br />
VALUE FOR <strong>BASF</strong><br />
€200<br />
million in annual savings<br />
from the Energy Verbund<br />
Ludwigshafen<br />
VaLue FOR BaSF<br />
BasF’s six segMents<br />
• chemicals<br />
• Plastics<br />
• Performance Products<br />
• Functional Solutions<br />
• agricultural Solutions<br />
• oil & gas<br />
VALUE FOR THE ENVIRONMENT<br />
1.5<br />
million metric tons of<br />
CO 2 annual savings<br />
from the Energy Verbund<br />
Ludwigshafen<br />
In the <strong>BASF</strong> Verbund, production facilities, energy flow, logistics<br />
and infrastructure are intelligently networked with each<br />
other, in order to increase production yields, save resources<br />
and energy and reduce logistic costs. A significant factor in the<br />
Verbund concept is the Know-how Verbund, which encourages<br />
the exchange of knowledge among <strong>BASF</strong> employees worldwide.<br />
The expert knowledge is pooled in research platforms.<br />
Customers inspire and drive new developments, innovations<br />
and measures to improve efficiency. The Know-how Verbund<br />
shapes the future.<br />
VaLue FOR THe enVIROnMenT<br />
As part of the Verbund system, the Energy Verbund reduces<br />
emissions of CO 2. Crude oil and natural gas are not only used<br />
as raw materials, but also as energy sources. Heat from production<br />
processes is not discharged to the environment; but<br />
rather captured in <strong>BASF</strong> steam networks and used to power<br />
other production plants.<br />
BasF RePORt <strong>2008</strong><br />
25
26<br />
ManageMent’s analysis<br />
The <strong>BASF</strong> Group Markets, Structures and Organization<br />
segments:<br />
• chemicals<br />
• Plastics<br />
• Performance Products<br />
• Functional Solutions<br />
• agricultural Solutions<br />
• oil & gas<br />
Regions:<br />
• europe<br />
• north america<br />
• asia Pacific<br />
• South america, africa, Middle east<br />
corporate divisions:<br />
• Finance<br />
• Legal, taxes & insurance<br />
• Strategic Planning & controlling<br />
• communications baSF group<br />
• corporate & governmental Relations<br />
• corporate audit<br />
• corporate controlling<br />
• global HR – executive Management & development<br />
• investor Relations<br />
competence centers:<br />
• engineering & Maintenance<br />
• environment, Health & Safety<br />
• global Procurement & Logistics<br />
• Human Resources<br />
• information Services<br />
• Polymer Research<br />
•<br />
Science Relations and innovation Management<br />
RegiOns<br />
• europe<br />
• north america<br />
• asia Pacific<br />
• South america, africa, Middle east<br />
BasF RePORt <strong>2008</strong><br />
• Specialty chemicals Research<br />
• chemicals Research & engineering<br />
• baSF Plant Science<br />
• Verbund Site Management europe<br />
corporate legal structure<br />
baSF Se, headquartered in Ludwigshafen, germany, takes<br />
the central role as the largest operating company in the<br />
baSF group. directly or indirectly, it holds the shares in<br />
the companies that belong to the baSF group.<br />
the majority of baSF group companies cover a broad<br />
spectrum of our business. Some companies concentrate<br />
on specific areas, such as the coatings division. in the<br />
baSF group consolidated Financial Statements, 274<br />
companies including baSF Se are fully consolidated. We<br />
consolidate 19 joint ventures with one or more partners<br />
on a proportional basis. additionally, we include four joint<br />
ventures and five affiliated companies, in which we have a<br />
20% to 50% interest, as well as eight more companies in<br />
the financial result using the equity method. Furthermore,<br />
we have a stake in numerous smaller companies that are<br />
not material for the preparation of the annual financial<br />
statements, both individually and in the aggregate.<br />
More information on the scope of consolidation can be found in note 1 to the<br />
consolidated Financial statements from page 157 onward<br />
compensation report and disclosures according to<br />
section 315 (4) german commercial code<br />
the compensation report with the disclosures according to section 315 (2) 4<br />
of the german commercial code can be found from page 138 onward, and the<br />
disclosures according to section 315 (4) of the german commercial code can<br />
be found from page 131 onward. it forms part of the Management’s analysis<br />
audited by the external auditor.<br />
legal cORPORate stRuctuRe<br />
• baSF Se, headquartered in Ludwigshafen, is the<br />
parent company in the baSF group<br />
• baSF group consolidated Financial Statements<br />
include 274 consolidated group companies and<br />
19 joint ventures on a proportional basis<br />
• 17 additional companies are included using the<br />
equity method
Value-Based ManageMent<br />
We earn a premium on our cost of capital<br />
We increase BasF’s value by earning a premium on<br />
our cost of capital. Our value-based management<br />
concept is a comprehensive approach that includes<br />
all functions within the company and supports and<br />
encourages all employees in acting in an entrepre-<br />
neurial manner.<br />
eBit after cost of capital<br />
earnings before interest and taxes (ebit) after cost of capital<br />
is the key performance and management indicator for<br />
our operating divisions and business units. the baSF<br />
group must achieve an ebit at least as high as its cost of<br />
capital to meet the interest rates payable to providers of<br />
debt, to satisfy the returns expected by providers of equity,<br />
and to cover tax expenses.<br />
calculation of the cost of capital percentage<br />
the cost of capital percentage depends primarily on three<br />
factors:<br />
• the capital structure of the baSF group<br />
• the level of interest rates on debt and<br />
• the return expected by shareholders<br />
We calculate our cost of equity on the basis of the market<br />
value of baSF shares; we calculate the cost of external<br />
financing based on book value. the cost of capital percentage<br />
is reviewed annually in the light of current data.<br />
the cost of capital percentage for <strong>2008</strong> was 10%. the<br />
cost of capital percentage for 2009 will be 9% due to the<br />
higher degree of leverage.<br />
eBit after cost of capital (million €)<br />
Five-year summary 1<br />
3,000<br />
2,000<br />
1,000<br />
0<br />
1,982<br />
2004<br />
2,354<br />
2005<br />
2,126<br />
2006<br />
2,895<br />
2007<br />
1,621<br />
<strong>2008</strong><br />
1 Since January 1, <strong>2008</strong>, group corporate costs are no longer allocated<br />
to the segments, but rather reported under “other.” the previous years’<br />
figures were not adjusted.<br />
ManageMent’s analysis<br />
The <strong>BASF</strong> Group Value-based Management<br />
Value-based management throughout the company<br />
Value-based management is only successful if it is firmly<br />
rooted in the company and consistently implemented. an<br />
important factor in ensuring its successful implementation<br />
is achieved by linking the goals of baSF to the target<br />
agreements of employees. in operating units, ebit after<br />
cost of capital is the most important performance indicator.<br />
the performance of functional units, in other words of regions,<br />
sites, corporate units and competence centers, are<br />
frequently harder to determine in monetary terms. the<br />
most important performance indicator for functional units<br />
is therefore value contribution. two general value drivers<br />
upon which we evaluate the performance of the units result<br />
from this: efficiency and effectiveness.<br />
a wide range of training programs provide our employees<br />
worldwide with relevant information on value-based<br />
management. in this way, we want to make our employees<br />
more aware of business contexts, thus furthering entrepreneurship<br />
at all levels of baSF.<br />
in groups which span entire units, several thousand<br />
employees from specialist and managerial positions have<br />
applied the principles of value-based management to specific,<br />
practical examples.<br />
calculation of eBit after cost of capital (million €)<br />
<strong>2008</strong><br />
ebit baSF group 6,463<br />
less ebit for activities not assigned to the segments 1 (930)<br />
less noncompensable foreign income taxes for oil<br />
production<br />
1,851<br />
less cost of capital 2 3,921<br />
ebit after cost of capital 1,621<br />
1 the projected net expense is already provided for in the cost of capital<br />
percentage.<br />
2 10% on the average operating assets of the segments<br />
BasF RePORt <strong>2008</strong><br />
27
28<br />
ManageMent’s analysis<br />
The <strong>BASF</strong> Group Sustainability Management<br />
sustainaBility ManageMent<br />
Minimizing risks, creating new business opportunities<br />
sustainability is strategically and organizationally integrated<br />
into our company: as one of the values guiding<br />
our activities, as part of our corporate strategy, and as<br />
a value driver for our business. By sharing our knowledge<br />
in the areas of environment, health, safety, and<br />
sustainability management, we help our customers and<br />
partners to be more successful.<br />
conducting our business sustainably influences our activities<br />
on three levels: it helps us minimize risks, enhance<br />
existing business, and create new business opportunities.<br />
our sustainability strategy enables us to ensure competitive<br />
advantages and to generate additional contributions to<br />
earnings. Products with economic and ecological benefits,<br />
and sustainability services for customers as part of our<br />
“Success – added Value through Sustainability” initiative,<br />
contribute directly to this. the implementation and monitoring<br />
of environmental, safety and social standards as well<br />
as ongoing dialogue with relevant stakeholders are also<br />
part of sustainability management at baSF.<br />
Management structures for sustainability<br />
our global Sustainability council ensures that the baSF<br />
group is aligned with the principles of sustainable development.<br />
the council comprises nine operating, functional<br />
and regional division heads, including the climate Protection<br />
officer. the board member dr. Harald Schwager<br />
chairs the council. in <strong>2008</strong>, the Sustainability council adopted<br />
globally valid group directives on product stewardship<br />
and distribution safety. Since 2004, regional steering<br />
committees in asia, north and South america, as well as in<br />
europe, support the Sustainability council. they identify<br />
key regional topics and are responsible for the local implementation<br />
of the global strategy. the Sustainability center<br />
acts as the interface between the Sustainability council,<br />
regional Steering committees and business operating<br />
ORganizatiOnal stRuctuRes<br />
FOR sustainaBility<br />
• the Sustainability council ensures that the baSF<br />
group is aligned with the principles of sustainable<br />
development<br />
• the council, chaired by board member dr. Harald<br />
Schwager, comprises nine operating, functional and<br />
regional division heads<br />
• Regional committees identify key topics and implement<br />
the global strategy at local level<br />
BasF RePORt <strong>2008</strong><br />
units, and coordinates the implementation of our sustainability<br />
strategy in the day-to-day business activities of the<br />
company. in addition, the center is the focal point for<br />
external stakeholders. the worldwide baSF Responsible<br />
care ® network supports the council in all matters regarding<br />
environment, health and safety.<br />
identifying future topics<br />
We identify important issues concerning sustainable development<br />
at an early stage. together with external partners,<br />
we analyze sustainability topics of societal interest which<br />
are relevant to baSF and position them in a matrix. the<br />
matrix assesses the issues according to societal materiality<br />
and their relevance to baSF. this enables us to identify<br />
topics that could, in the immediate or near future, become<br />
a source of risk or opportunity for our business. We use the<br />
results of this issue management to initiate long-term<br />
change processes within the company and identify focus<br />
points for reporting. For example, we have extended our<br />
reporting on the topic of water. every two to three years,<br />
the matrix is updated to reflect current developments.<br />
More information on water can be found from page 104 onward; more information<br />
on the materiality matrix can be found at basf.com/materiality<br />
Monitoring tools minimize risks<br />
Since the mid-1980s, baSF has conducted audits according<br />
to standardized criteria on process safety, occupational<br />
health and safety and environmental protection at all sites<br />
worldwide. We also assess the adherence to internationally<br />
recognized labor and social standards. a range of systems<br />
help us to monitor compliance with environmental and social<br />
standards at our sites.<br />
More information on environmental protection and occupational health and<br />
safety audits can be found on pages 96 and 106<br />
stRategy<br />
• Minimizing risks, enhancing existing business, creating<br />
new business opportunities<br />
• Sustainable products and services<br />
• identifying important topics relevant to sustainable<br />
development<br />
• Monitoring systems for process safety, occupational<br />
health and safety, environmental protection, and labor<br />
and social standards
Monitoring labor and social standards<br />
ensuring that our working conditions are, at minimum, in<br />
compliance with internationally recognized labor and social<br />
standards is one of our values. We introduced a two-part<br />
monitoring system to evaluate their implementation in the<br />
company.<br />
Firstly, we conduct an annual survey in our group companies<br />
on legal compliance and the internationally recognized<br />
labor and social standards to which we are voluntarily<br />
committed. in addition, we obtain an updated overview of<br />
the regional conditions in our business operations. the<br />
results of the survey in <strong>2008</strong> cover more than 99% of the<br />
employees in our group companies. the adherence to our<br />
voluntary commitments is documented in almost all our<br />
group companies.<br />
Secondly, our monitoring system comprises telephone<br />
hotlines which enable employees to seek advice on applicable<br />
labor conditions and report grievances. in this respect,<br />
we have either broadened the content of our existing<br />
hotlines to incorporate legal compliance or introduced an<br />
additional hotline. to ensure anonymity and confidentiality,<br />
calls to the hotlines are usually handled by external legal<br />
professionals. the hotlines are available to our employees<br />
wherever they are legally permitted.<br />
When the evaluation and comparison of the two monitoring<br />
tools indicate any grievances at any of our locations,<br />
we initiate investigations and take necessary measures to<br />
redress them.<br />
More information on this topic can be found at basf.com/monitoring_e<br />
laBOR and sOcial standaRds<br />
• annual survey on compliance and adherence to internationally<br />
recognized labor and social standards<br />
• external hotlines through which employees can seek<br />
advice and anonymously report grievances<br />
ManageMent’s analysis<br />
The <strong>BASF</strong> Group Sustainability Management<br />
Monitoring supply chains<br />
common values are the basis for long-term and trusting<br />
relationships with our suppliers. this is why we choose<br />
suppliers not only based on economic criteria. both new<br />
and existing suppliers are also evaluated on the basis of<br />
environmental protection, occupational safety and social<br />
responsibility standards. our customers and investors are<br />
increasingly interested in the topic of sustainability – not<br />
only regarding our own activities but also in our supply<br />
chain. Risk matrices, based on specific country, product<br />
and sector databases, help us to identify high-risk suppliers.<br />
our supply chain management comprises a multi-<br />
level process:<br />
• information on expected standards: by <strong>2008</strong>, we had<br />
informed 12,000 suppliers in writing. in addition, we held<br />
“Supplier days” in india and china in <strong>2008</strong>, during which<br />
suppliers were trained on our requirements in the areas<br />
of environmental, safety, and social standards.<br />
• Self-assessment by high-risk suppliers<br />
• onsite visits: in <strong>2008</strong>, we made 549 onsite visits to<br />
assess suppliers.<br />
• corrective measures taken if necessary<br />
if our evaluation shows that suppliers do not meet our standards<br />
or do so only partially, we provide them with support.<br />
one example is our “1+3” project in china, in which we<br />
encourage the spread of sustainability standards among<br />
partners in the value chain. the project shares successful,<br />
new best practices for sustainable enterprise with small<br />
and medium-sized companies. in <strong>2008</strong>, baSF purchased<br />
approximately 500,000 different raw materials and technical<br />
goods as well as services for plant construction, maintenance<br />
and logistics.<br />
suPPly chain ManageMent<br />
• evaluation of suppliers according to economic aspects<br />
as well as environmental protection, occupational<br />
health and safety, and social standards<br />
• identification of high-risk suppliers using risk-matrices<br />
based on topic specific databases<br />
• onsite evaluation of suppliers<br />
More information on this topic can be found at basf.com/supplychain<br />
BasF RePORt <strong>2008</strong><br />
29
30<br />
ManageMent’s analysis<br />
The <strong>BASF</strong> Group Sustainability Management<br />
HIgHLIgHTS <strong>2008</strong><br />
Sustainability<br />
• DOW JONES SUSTAINABILITY INDEX<br />
<strong>BASF</strong> is chemical sector leader in the world’s most<br />
important sustainability index.<br />
• CARBON DISCLOSURE PROJECT<br />
<strong>BASF</strong> achieves top ranking in the Carbon Disclosure<br />
Leadership Index (carbon-intensive sectors).<br />
• GERMAN SUSTAINABILITY AWARD<br />
<strong>BASF</strong> receives award in the category “Most Sustainable<br />
Company”.<br />
compliance<br />
an important aim of the baSF compliance Program is the<br />
prevention and avoidance of legal violations. For this purpose,<br />
we have introduced a system of compliance training,<br />
decentralized information centers, group-wide monitoring<br />
systems and have developed a compliance organization<br />
appropriate to the size of our company.<br />
in their first year of employment, all our employees take<br />
part in a basic compliance training, in which they are introduced<br />
to the baSF Values and Principles, code of conduct,<br />
compliance Hotline and compliance Program. Since<br />
2007, baSF has offered refresher courses, using interactive<br />
learning tools whenever possible. in addition, we hold<br />
regular training courses on specific legal topics tailored to<br />
the area of work of the employees.<br />
through this training, we make it clear that our Values<br />
and Principles, code of conduct and the compliance Program<br />
are binding for every single baSF employee and that<br />
no breach will be tolerated. in <strong>2008</strong>, over 26,000 employees<br />
took part in compliance training.<br />
cOMPliance PROgRaM<br />
• obligatory training for employees<br />
• telephone hotline employees can use anonymously<br />
• chief compliance officer coordinates compliance<br />
management<br />
• around 80 compliance managers worldwide<br />
BasF RePORt <strong>2008</strong><br />
employees can also seek advice anonymously via telephone<br />
hotlines that are available group-wide regarding<br />
personal conduct or to report incidents they consider to<br />
be dubious or legally questionable. any one who uses the<br />
hotline for this purpose is assured that he will not have<br />
to bear any negative consequences. Since its establishment,<br />
the use of the hotline has continuously increased.<br />
in <strong>2008</strong>, approximately 300 calls were received.<br />
Regular compliance audits by the corporate audit department<br />
further support the compliance Program. in<br />
<strong>2008</strong>, we performed 60 such audits group-wide (2007:<br />
137). they specifically assess if antitrust regulations are<br />
adhered to, and if dealings with business partners and<br />
public authorities conform to our Values and Principles. We<br />
make inquiries if we detect any irregularities in the conduct<br />
of our suppliers and customers.<br />
in 2002, baSF became one of the first german companies<br />
to appoint a chief compliance officer. around 80<br />
compliance managers from individual group companies<br />
and the regions support him in his tasks. the chief compliance<br />
officer reports directly to the chairman of the<br />
board of executive directors. He coordinates the compliance<br />
Program and its further group-wide development.<br />
the board of executive directors is regularly informed<br />
on the implementation of the compliance Program, especially<br />
concerning compliance audits and hotline cases that<br />
have a wider relevance. the board of executive directors<br />
informs the Supervisory board on important issues.<br />
More information on this topic can be found at basf.com/compliance_e<br />
cOMPliance audits<br />
• to assess adherence to antitrust regulations and<br />
ensure our interaction with business partners and<br />
public authorities conforms to the baSF Values and<br />
Principles<br />
• Regular audits by the corporate audit department<br />
• 60 audits group-wide in <strong>2008</strong>
success – added Value through sustainability<br />
Sustainability is becoming an increasingly important<br />
success factor for our business partners. We see great<br />
opportunities for integrating our sustainability expertise into<br />
customer partnerships. this is why, in 2007, we developed<br />
the strategic initiative “Success – added Value through<br />
Sustainability” which enables our business units to identify<br />
how they can differentiate themselves through sustainability.<br />
this initiative brings together our longstanding competencies<br />
in the fields of environment, health, safety and sustainability<br />
management. the services offered by Success range<br />
from individual offers to tailor-made packages. one example<br />
is our service package greenloop ® which, since <strong>2008</strong>,<br />
has enabled customers to return used electronic chemicals,<br />
such as solvents, to baSF where they are recycled for other<br />
applications.<br />
in <strong>2008</strong>, we implemented 196 sustainability projects<br />
with our customers aimed at expanding and strengthening<br />
customer relationships through sustainability.<br />
More information on this topic can be found at basf.com/success_e<br />
eco-efficiency analysis and seeBalance<br />
We offer the eco-efficiency analysis as a strategic instrument<br />
for product and process optimization. it provides<br />
information on the relationship between the financial value<br />
of a product and its impact on the environment. this tool<br />
helps us and our customers to decide which products and<br />
processes are most suitable, both in economic and in ecological<br />
terms. the entire life cycle of a product or production<br />
process is assessed, for example, resource and energy<br />
consumption, emissions to air, water and soil as well<br />
as risk potential. We have conducted eco-efficiency analyses<br />
for important products in 90% of our business units. in<br />
total, we carry out approximately 40 analyses per year. in<br />
<strong>2008</strong>, we conducted a multitude of analyses with and for<br />
our customers. this is how we were able to demonstrate<br />
ecO-eFFiciency analysis<br />
• conducted for important products in 90% of baSF<br />
business units<br />
• approximately 40 analyses per year<br />
• Strategic tools for product and process optimization<br />
• Shows which products and processes are economically<br />
and environmentally most suitable<br />
ManageMent’s analysis<br />
The <strong>BASF</strong> Group Sustainability Management<br />
that the use of our new product elastocoast ® for coastal<br />
protection applications, offers clear economic and ecological<br />
advantages in comparison to other products.<br />
We have now refined our eco-efficiency analysis to include<br />
social aspects: our Socio-eco-efficiency analysis<br />
SeebaLance ® incorporates relevant social criteria such<br />
as lost time accidents, training levels, spending on research<br />
and development, equal opportunities as well as wages and<br />
salaries. in this way, we can calculate costs and environmental<br />
impact alongside the social effects of products and<br />
production processes. in <strong>2008</strong>, we conducted Socio-ecoefficiency<br />
analyses in selected product applications.<br />
More information on this topic can be found at basf.com/eco_efficiency<br />
customer satisfaction<br />
the premise for long-term business success is the satisfaction<br />
of our customers. We discuss the needs of our customers<br />
with them in our forum “perspectives.” based on<br />
this, we develop new business models. Whenever customers<br />
are not satisfied with our performance, our non conformance<br />
Management (ncM) system helps us to understand<br />
the reasons, to learn from our mistakes and to optimize<br />
our business processes. this global system enables<br />
us to document complaints, make inquiries and measure<br />
the satisfaction of our customers. the latter also manifests<br />
itself in numerous awards and prizes. in <strong>2008</strong>, for example,<br />
Ford presented baSF coatings with the “Recognition of<br />
achievement award” for excellent performance in the area<br />
of corporate social responsibility. For being an environmentally<br />
friendly supplier, Volkswagen awarded baSF the<br />
“group award <strong>2008</strong>” which it gives to the best 15 suppliers<br />
worldwide each year.<br />
nOn cOnFORMance ManageMent<br />
the quality of our customer relationships is also measured<br />
by the way we handle complaints and how we<br />
avoid them. We document all our customers’ problems<br />
with our products and processes, investigate them, and<br />
find ways to optimize our business processes. in <strong>2008</strong>,<br />
we further developed our system and have improved the<br />
documentation of costs of non conformance Management<br />
in all regions and business units.<br />
BasF RePORt <strong>2008</strong><br />
31
32<br />
ManageMent’s analysis<br />
The <strong>BASF</strong> Group Sustainability Management<br />
dialogue with stakeholders<br />
one of our values is to treat all our stakeholders with respect.<br />
dialogue with our stakeholders helps us to identify<br />
their expectations and thus to identify opportunities and<br />
risks for our company. as a chemical company, we are<br />
aware of the particular responsibility we bear towards our<br />
immediate neighbors. We established community advisory<br />
Panels (caPs) worldwide to foster regular dialogue with<br />
our neighbors on current topics, in particular, at our production<br />
sites. currently there are 59 caPs at baSF sites.<br />
We also need trust to introduce products based on new<br />
technologies. as a result of our experiences with previous<br />
debates on new technologies, we started engaging in public<br />
and political debates on nanotechnolgy at a very early<br />
stage of its technological development. in 2004, we published<br />
our first dialogue paper on nanotechnology. Since<br />
then, we have been an active participant in numerous national<br />
and international dialogue forums including the nano<br />
commission of the german Federal Ministry for the environment,<br />
nature conservation and nuclear Safety.<br />
in <strong>2008</strong>, we established the “nano dialogue Forum”<br />
with baSF experts, representatives of environmental and<br />
consumer protection organizations and churches, as well<br />
as other critical opinion leaders. We involve our employees<br />
in the dialogue on nanotechnology. together with the works<br />
council and the Mining, chemical and energy industrial<br />
trade union (ig bce), we have established a dialogue<br />
forum for laboratory workers at the Ludwigshafen site in<br />
germany, which we aim to continue in 2009. We engage in<br />
dialogue with society and politicians on further topics.<br />
More information on our stakeholder dialogue can be found at<br />
basf.com/dialogue; more information on our nanotechnology dialogue can<br />
be found at basf.com/dialogue-nanotechnology; more information on the key<br />
points of our political dialogue can be found at basf.com/political-dialogue<br />
sustainaBility neWsletteR<br />
the Sustainability center newsletter provides infor-<br />
mation on sustainability topics at baSF.<br />
Registration at basf.com/sustainability/newsletter<br />
More information on sustainability at basf.com/sustainability<br />
BasF RePORt <strong>2008</strong><br />
gReenLOOp<br />
Chemicals Recycling<br />
RECYCLING<br />
OTHER<br />
APPLICATIONS<br />
VALUE FOR <strong>BASF</strong><br />
5additional cooperations<br />
with customer companies<br />
in <strong>2008</strong><br />
NEW<br />
USED<br />
VALUE FOR THE ENVIRONMENT<br />
5000<br />
metric tons of electronic<br />
chemicals recycled<br />
In <strong>2008</strong>, our production sites, particularly in Europe and<br />
Asia, took back and recycled previously sold electronic<br />
chemicals. Through the global initiative “Success,” we<br />
were able to intensify our relationship with many customers<br />
and recycle more than 5,000 metric tons of electronic<br />
chemicals.<br />
dialOgue With stakehOldeRs<br />
• identifying risks and opportunities for our company<br />
• community advisory Panels for the dialogue with<br />
neighbors<br />
• increased social acceptance of our business<br />
operations
Value added stateMent<br />
the value added statement shows how BasF provides<br />
value to society through its activities. in this way, our<br />
sustainable development is shown in a transparent<br />
manner. unlike the statement of income, the value added<br />
statement is not from the shareholder’s perspective,<br />
but shows BasF’s contribution to private and public<br />
income.<br />
Value added results from the company’s business performance<br />
minus goods and services purchased as well as<br />
depreciation or amortization. the resulting amount is distributed<br />
to employees, shareholders or the state.<br />
in <strong>2008</strong>, value added at baSF amounted to €13,210 million<br />
and decreased by 8.5% compared with the previous<br />
year. the decline is mainly due to the significant increase in<br />
raw material prices. the majority of value added was distributed<br />
to our employees in the form of wages, salaries and<br />
creation of value added<br />
(million €, previous year’s figures in brackets)<br />
1 -- Value added:<br />
13,210 (14,442)<br />
2 -- Amortization<br />
and depreciation:<br />
3,179 (2,917)<br />
3 -- Services purchased,<br />
energy costs and<br />
other expenses:<br />
11,516 (10,066)<br />
4 -- Cost of raw materials<br />
and merchandise:<br />
35,883 (31,813)<br />
Value added stateMent<br />
• baSF group’s financial contribution to private and<br />
public income<br />
• decline of 8.5% compared with 2007 to €13.2 billion,<br />
mainly due to significantly increased raw material<br />
costs<br />
• Majority distributed to employees<br />
4<br />
Business performance 1<br />
63,788 (59,238)<br />
1 Net sales and other income<br />
3<br />
2<br />
1<br />
ManageMent’s analysis<br />
The <strong>BASF</strong> Group Value added Statement<br />
social benefits. in addition, a significant share of value<br />
added was distributed to the state in the form of taxes.<br />
this amounted to €2,940 million in <strong>2008</strong> compared with<br />
€2,855 million in the previous year.<br />
in <strong>2008</strong>, baSF spent a total of €65 million on donations,<br />
sponsoring and funding for our own projects, compared<br />
with €75 million in 2007. this amount is contained<br />
in “other expenses.”<br />
the remaining value added of €2,912 million was available<br />
to be paid out as a dividend or retained.<br />
Further information on wages and salaries can be found on pages 94 and 187,<br />
taxes on page 183 and donations and sponsoring on page 97<br />
use of value added<br />
(%, previous year’s figures in brackets)<br />
1<br />
use OF Value added<br />
2<br />
5<br />
1 -- Employees:<br />
48.2 (46.0)<br />
2 -- Taxes:<br />
22.3 (19.8)<br />
3 -- Minority interests:<br />
3.0 (1.8)<br />
4 -- Creditors:<br />
4.4 (4.3)<br />
5 -- Remaining<br />
value added<br />
(dividend and<br />
retention):<br />
22.1 (28.1)<br />
• €6,364 million for employees<br />
• €2,940 million for taxes<br />
• €65 million for donations, sponsoring and own<br />
social projects<br />
• €2,912 million available for dividend or retention<br />
3<br />
4<br />
BasF RePORt <strong>2008</strong><br />
33
34<br />
ManageMent’s analysis<br />
The <strong>BASF</strong> Group Research and Development in the <strong>BASF</strong> Group<br />
ReseaRch and deVelOPMent<br />
Meeting challenges, developing solutions, shaping the future<br />
Our international and interdisciplinary research and<br />
development offers solutions to many future chal-<br />
lenges. Our know-how, products and processes are<br />
driving forces of innovation in most manufacturing<br />
industries. they promote the long-term success of<br />
our customers, which in turn ensures our profitable<br />
growth and sustainable commercial success.<br />
Megatrends such as rapid population growth and increasing<br />
energy needs are creating global challenges, which we<br />
meet with innovative solutions and projects for the future.<br />
the four global technology platforms: Polymer Research,<br />
Specialty chemicals Research, chemicals Research &<br />
engineering, as well as Plant biotechnology Research, act<br />
with the research and development units of the operating<br />
divisions as our knowledge and competence centers. the<br />
close cooperation with our partners worldwide is an important<br />
factor in the success of efficient and future oriented<br />
research. our network includes 1,900 collaborative partnerships<br />
with universities, research institutes, startup companies<br />
and industrial partners.<br />
We continued to expand our activities in the area of<br />
research and development in <strong>2008</strong>. new types of baSF<br />
systems made from epoxy resin and hardener from the<br />
baxxodur ® brand, for example, impart the rotor blades of<br />
wind energy plants with high mechanical cohesiveness and<br />
contribute to an acceleration of up to 30% in the production<br />
process. the first anti-microbial baSF-plastic Luran ® S<br />
bX 13042 has a germ-killing effect, which is useful in hospital<br />
beds, doctor’s chairs or on computer keyboards in<br />
offices. our plastic ecoflex ® is biodegradable and is used<br />
in shopping bags, organic waste bags, mulch foil in agriculture<br />
and food packaging. trilon M ® , a chelating agent,<br />
can bind metals, thus preventing damaging reactions –<br />
making detergents highly effective and eco-friendly.<br />
More information on ecoflex can be found on page 58 and trilon M on page 64<br />
ReseaRch and deVelOPMent<br />
• Spending of €1,355 million in <strong>2008</strong><br />
• over 1,900 cooperations with universities, research<br />
institutes and industrial partners<br />
• Starting in 2010, annual sales of €4 billion from<br />
product innovations, 20% of which additional<br />
BasF RePORt <strong>2008</strong><br />
in <strong>2008</strong>, baSF had approximately 8,900 employees in research<br />
and development worldwide. We spent €1,355 million<br />
in this field, compared with €1,380 million in 2007.<br />
despite the difficult economic environment, we want to<br />
maintain the same high level of spending in 2009 as in the<br />
previous three years. More than one third will be invested<br />
in products and technologies for increased energy efficiency,<br />
as well as climate protection, resource conservation<br />
and renewable raw materials. in <strong>2008</strong>, we also started<br />
to adopt criteria for environmental protection and social<br />
responsibility in our innovation processes, in order to<br />
systematically take into account sustainability aspects.<br />
approximately 76% of expenses fell under the responsibility<br />
of the operating divisions, with around 24% being<br />
allocated to corporate research. From 2010, we expect<br />
product innovations alone to generate annual sales of<br />
€4 billion, 20% of this amount will be additional sales. in<br />
<strong>2008</strong>, baSF filed 1,265 patents worldwide.<br />
the methods that we introduced in the previous years<br />
to increase the efficiency and effectiveness of innovation<br />
processes are showing their effects. For example the<br />
Phasegate Process proved itself in being a successful tool<br />
for project and portfolio management. innovation projects<br />
are divided in five different phases, from the idea-generation<br />
to market launch, thereby making the decision-making<br />
processes more transparent. in process and product development,<br />
we increase efficiency through the intensified<br />
application of high-throughput methods, for example in the<br />
development of catalysts and formulations.<br />
expenditure on research and development<br />
(million €)<br />
6<br />
5<br />
7<br />
1<br />
€1,355<br />
million<br />
4<br />
2<br />
3<br />
1 -- Chemicals: 9%<br />
2 -- Plastics: 11%<br />
3 -- Performance Products: 17%<br />
4 -- Functional Solutions: 14%<br />
5 -- Agricultural Solutions: 24%<br />
6 -- Oil & Gas: 1%<br />
7 -- Corporate research,<br />
other: 24%
corporate research<br />
our cross-divisional strategic corporate research enables<br />
us to tap into future growth clusters. as part of our strategy<br />
started in 2006 “We innovate for growth,” we focus on five<br />
growth clusters, which address future technologies and<br />
markets and cover the most important interdisciplinary<br />
approaches for future challenges: energy management,<br />
nanotechnology, white (industrial) biotechnology, plant biotechnology,<br />
and raw material change.<br />
baSF positively assessed the results of the first phase<br />
of the initiative, which was completed in <strong>2008</strong>. We spent<br />
more than €900 million on this initiative: the project portfolio<br />
contains approximately 200 projects, its value exceeds<br />
our expectations and we filed or obtained over 700 patents.<br />
Starting in 2015, we expect additional annual sales of<br />
between €2 billion and €4 billion from innovations based<br />
on projects in these growth clusters.<br />
in the future market energy management, we have already<br />
achieved considerable success in developing new<br />
technologies and materials for energy storage and conversion.<br />
baSF Fuel cell gmbH is one of the leading manufacturers<br />
of fuel cell components. beginning in January 2009,<br />
baSF Fuel cell was integrated into the inorganics division.<br />
another future project is thermoelectricity that, for example,<br />
converts the heat from a running car into electricity,<br />
thereby allowing for a significant decrease in fuel consumption.<br />
baSF sees nanotechnology as a key technology to<br />
solve urgent issues, for example in the field of medical<br />
technology. Since the end of 2007, we have been conducting<br />
research projects with Harvard university. together<br />
with the companies Polyic, evonik industries, elantas beck<br />
and Siemens, baSF started a alliance project “MadriX,”<br />
sponsored by the german Federal Ministry for education<br />
and Research. in this project, the development of radio<br />
“We innOVate FOR gROWth”<br />
initiatiVe<br />
• interdisciplinary cooperation between chemistry and<br />
other natural sciences<br />
• Positive assessment after first phase of the initiative<br />
“We innovate for growth”: 700 patents out of 200<br />
projects<br />
• From 2015, additional annual sales of between<br />
€2 billion and €4 billion from projects in the growth<br />
clusters expected<br />
ManageMent’s analysis<br />
The <strong>BASF</strong> Group Research and Development in the <strong>BASF</strong> Group<br />
frequency identification tags (polymer RFid) is advanced<br />
with the help of nanotechnology.<br />
another key technology of the 21st century is biotechnology.<br />
biotechnology makes many product and process<br />
innovations possible. our white (industrial) biotechnology<br />
research concentrates on four technologies: enzyme<br />
catalysis for the production of specialty chemicals, fermentation<br />
based on renewable raw materials, biopolymers as<br />
well as industrial proteins and enzymes. an example of the<br />
successful usage of white biotechnology is the application<br />
of enzymes in the production of visually active intermediates<br />
with a high purity level. Since <strong>2008</strong>, baSF has<br />
applied, for example, a new enzyme class, the enoate<br />
reductases, to the production of starting materials for<br />
pharmaceuticals and crop protection products.<br />
in plant biotechnology, we are developing plants for<br />
more efficient agriculture, healthier nutrition and for better<br />
use as renewable raw materials. We are continuing our<br />
successful cooperation with Monsanto. the first results of<br />
the field experiments with drought-tolerant corn (maize)<br />
exceeded our expectations.<br />
in the raw materials change business sector, we are<br />
researching a range of starting materials as alternatives to<br />
crude oil for our value-adding chains; examples include<br />
renewable raw materials and natural gas.<br />
our success with the initiative “We innovate for growth”<br />
has encouraged us to continue into the second phase from<br />
2009 to 2011 with investments of up to €1 billion. We want<br />
to generate profitable growth through innovation for baSF<br />
and contribute to a better future.<br />
expenditure on research and development in the growth clusters<br />
2006 – <strong>2008</strong> (million €)<br />
4<br />
5<br />
1<br />
€925<br />
million<br />
3<br />
2<br />
1 -- Energy management: 90<br />
2 -- Nanotechnology: 185<br />
3 -- White biotechnology: 135<br />
4 -- Plant biotechnology: 410<br />
5 -- Raw material change: 105<br />
BasF RePORt <strong>2008</strong><br />
35
36<br />
ManageMent’s analysis<br />
The Business Year at <strong>BASF</strong> Trends in the Global Economy<br />
tRends in the glOBal ecOnOMy<br />
the previous year’s values have been adjusted.<br />
in <strong>2008</strong>, the world economy was heavily impacted by<br />
the global financial crisis and its effects on the real<br />
economy. due to the massive slump in demand for<br />
consumer and industrial goods in the fourth quarter,<br />
industrialized countries entered into a recession.<br />
Worldwide growth of gross domestic product in <strong>2008</strong><br />
(+2.2%) was below both our forecast (+2.8%) and the<br />
growth trend. since mid-<strong>2008</strong>, the chemical industry<br />
has shown no signs of growth.<br />
the global financial crisis strongly affected the economic<br />
situation in <strong>2008</strong>. the bankruptcy of the u.S. investment<br />
bank Lehman brothers in the middle of September intensified<br />
the crisis of confidence in the financial sector. Furthermore,<br />
very high energy and raw material prices negatively<br />
impacted demand in the second and third quarter<br />
of <strong>2008</strong>.<br />
both governments and central banks have provided<br />
a financial safety net to ensure that the financial markets<br />
can begin to function again. additionally, interest rates<br />
were dramatically reduced. these measures, however,<br />
have only partially stabilized the financial system. the<br />
turbulences caused a crisis of confidence in the global<br />
economy. Risk premiums, credit standards and financing<br />
costs have increased.<br />
in the third quarter, the real economic effects of the<br />
financial crisis began to weaken worldwide growth significantly.<br />
Many industrialized countries have entered into a<br />
recession – especially the united States, the united Kingdom,<br />
Spain, germany, italy and Japan – which intensified<br />
in the fourth quarter through the slump in industrial production.<br />
the growth of the global gross domestic product<br />
in <strong>2008</strong> (+2.2%) was significantly weaker than in the previous<br />
three years.<br />
tRends in the glOBal ecOnOMy<br />
<strong>2008</strong><br />
• growth of worldwide gross domestic product (+2.2%)<br />
significantly below the forecast (+2.8%)<br />
• Strong impact on the world economy in <strong>2008</strong> from the<br />
financial crisis and very high raw material prices<br />
• no growth impulse for the chemical industry since<br />
mid-<strong>2008</strong><br />
BasF RePORt <strong>2008</strong><br />
development by region<br />
in europe, since the second quarter of <strong>2008</strong>, the economy<br />
has been in a downturn, which intensified significantly at<br />
the end of the year. the united Kingdom, ireland and<br />
Spain have entered into a recession as a result of the real<br />
estate and financial crisis. the rest of the e.u. is also<br />
show ing signs of a recession, lead by low consumer<br />
spend ing and a marked decline in exports. the growth of<br />
gross domestic product decreased considerably (2007:<br />
+2.8%; <strong>2008</strong>: +1.0%).<br />
in the second half of <strong>2008</strong>, the united states was<br />
under pressure to adjust to the recessive real estate market<br />
and the crisis in the financial market. the slump in<br />
the construction sector and in consumption, particularly<br />
in the demand for automobiles, significantly reduced the<br />
growth of gross domestic product (+1.2%). a significant<br />
decrease in private consumption and subsequently corporate<br />
investing resulted from high interest costs, negative<br />
wealth effects, and increasing unemployment.<br />
the growth in asia (excluding Japan) was very strong<br />
up until the second quarter, but afterwards it could not<br />
detach itself from the global economic downturn. in particular,<br />
the aSean region, as well as Korea and taiwan,<br />
were showing signs of a recession in industrial production<br />
beginning in the second quarter. this increased in the third<br />
quarter because of the economic slowdown in china. the<br />
growth of gross domestic product in asia (excluding<br />
Japan) weakened compared with the previous year (<strong>2008</strong>:<br />
+6.7%; 2007: +8.8%).<br />
Japan was likewise affected by the recession and only<br />
grew slightly in <strong>2008</strong> (+0.1%), due to its considerable<br />
dependence on u.S. and e.u. markets.<br />
in south america the previously strong regional<br />
growth declined (+5.0%). the drop in raw material prices in<br />
the second half of <strong>2008</strong> especially impacted the export oriented<br />
raw material industry.<br />
gross domestic Product <strong>2008</strong><br />
Real change compared with the previous year<br />
World<br />
E.U.<br />
United States<br />
Asia (excl. Japan)<br />
Japan<br />
South America<br />
0% 4% 8%<br />
0.1<br />
1.0<br />
1.2<br />
2.2<br />
5.0<br />
6.7
ManageMent’s analysis<br />
The Business Year at <strong>BASF</strong> Trends in Key Customer Industries<br />
tRends in key custOMeR industRies<br />
the previous year’s values have been adjusted.<br />
compared with the previous year (+4.3%), growth in<br />
global industrial production declined sharply (+1.0%)<br />
and was significantly below our projection (+2.8%).<br />
this was due to the drastic decline in consumer demand,<br />
which affected industrialized countries in particular.<br />
here, industrial production declined (–1.3%).<br />
as a result of the recession in residential housing construction<br />
in the united States and parts of europe, the construction<br />
industry only grew slightly worldwide (+0.9%). in the united<br />
States, the construction sector declined significantly (–6.2%),<br />
in Western europe slightly (–0.8%). building activities in transition<br />
countries, in particular in asia and the Middle east, grew<br />
solidly (+8.2%).<br />
toward the end of the year, the automotive industry in<br />
industrialized countries entered into an extremely critical<br />
phase due to dwindling domestic sales. Production units in<br />
the industrialized countries considerably declined (–9.4%), in<br />
the united States production plunged (–19.7%). in asia<br />
(excluding Japan) the growth rate decreased significantly<br />
(+4.5%) compared with the previous year (+14.0%). Worldwide,<br />
production fell (–3.4%).<br />
the electronics industry grew only slightly (+1.4%). as<br />
a result of lower investment activities, growth levels in the<br />
industrialized countries declined (–0.4%) compared with the<br />
previous year (+3.3%). asia (excluding Japan) benefited from<br />
the trend to offshore and recorded strongest growth (+4.6%).<br />
compared with the previous year, growth in the information<br />
and communications technology industry (ict) was<br />
weaker (+8.7%). due to the dependence on exports to the<br />
united States, growth especially in asia decreased.<br />
in the industrialized countries, production in the textile<br />
industry declined (–7.9%), mainly due to the reduced domestic<br />
demand and an increase in import volume from asia. in the<br />
united States production significantly decreased (–9.8%).<br />
deVelOPMent OF industRial<br />
PROductiOn in <strong>2008</strong><br />
• Worldwide growth declined (to +1.0%)<br />
• construction industry: slight growth worldwide<br />
(+0.9%), in the united States (–6.2%) and Western<br />
europe (–0.8%) decline in production<br />
• automotive industry: critical situation because of the<br />
rising oil prices and financial crisis, units declined<br />
(–9.4%) in the industrialized countries, and sharply<br />
declined in the united States (–19.7%)<br />
as in the previous years, growth (+0.9%) was generated in<br />
asia (+9.4%).<br />
in the industrialized countries, the paper industry decreased<br />
(–2.5%). Worldwide growth (+0.8%) was possible<br />
because of the strong production increase in the transition<br />
countries (+6.1%).<br />
growth in the food and nutrition industry remained<br />
stable (+2.8%) as it is less affected by economic fluctuations.<br />
in the industrialized countries growth weakened (+0.3%).<br />
agriculture profited from increased acreage and the<br />
increased use of corn (maize) and cereals for biofuel and<br />
bioethanol production, and grew worldwide slightly stronger<br />
(+3.1%) compared with 2007. this was particularly due to<br />
significant growth in emerging markets (+4.0%).<br />
growth in key customer industries in <strong>2008</strong><br />
Real change compared with previous year<br />
Industries total OECD<br />
World<br />
Construction OECD<br />
World<br />
Automotive OECD –9.4<br />
(per-unit basis) World<br />
Electronics OECD<br />
Industry<br />
World<br />
Information and OECD<br />
communications World<br />
Textiles OECD<br />
World<br />
–7.9<br />
Paper OECD<br />
World<br />
Nutrition OECD<br />
World<br />
Agriculture OECD<br />
World<br />
BasF sales by industry<br />
direct customers<br />
> 15% chemicals<br />
–3.1<br />
–3.4<br />
–2.5<br />
–1.3<br />
–0.4<br />
10 – 15% automotive | construction | utilities<br />
0%<br />
1.0<br />
0.9<br />
1.4<br />
0.9<br />
0.8<br />
0.3<br />
5 – 10% agriculture | Plastics industry | oil industry<br />
< 5% electrical/electronics | Furniture | Paper<br />
10 – 15% other industries<br />
1.1<br />
4% 8%<br />
2.8<br />
3.1<br />
8.8<br />
8.7<br />
BasF RePORt <strong>2008</strong><br />
37
38<br />
ManageMent’s analysis<br />
The Business Year at <strong>BASF</strong> Trends in the Chemical Industry<br />
tRends in the cheMical industRy<br />
the previous year‘s values were adjusted.<br />
the demand for chemical products slumped dramatically<br />
as a result of economic turbulences and has been<br />
declining since the third quarter of <strong>2008</strong> – for the first<br />
time since 2001. Overall, worldwide chemical production<br />
(excluding pharmaceuticals) stagnated in <strong>2008</strong> –<br />
after growing strongly in the previous year (+4.5%).<br />
after the growth phase of the previous years, <strong>2008</strong> brought<br />
a greater than expected slowdown for global chemical production.<br />
in the third quarter, worldwide chemical production<br />
was for the first time below the previous year’s level.<br />
the solid growth that global chemical production had<br />
experienced up until then slumped in parallel to production<br />
declines in the customer industries – construction, automotive,<br />
electronics, furniture and paper.<br />
especially dramatic is the decline in production in the<br />
united States (–5.0%), followed by Japan (–3.6%) and<br />
europe (–1.1%). in asia (excluding Japan), the chemical<br />
industry grew significantly less (+5.2%) than in the previous<br />
year (+12.3%). South america’s growth was also<br />
weaker (+2.7%).<br />
chemical production (without pharmaceuticals) <strong>2008</strong><br />
Real change compared with previous year<br />
World<br />
E.U.<br />
United States<br />
Asia (excl. Japan)<br />
Japan<br />
South America<br />
BasF RePORt <strong>2008</strong><br />
–5.0<br />
–3.6<br />
–1.1<br />
tRends in the cheMical<br />
industRy <strong>2008</strong><br />
• Stagnation of worldwide chemical production<br />
• decline in demand for chemical products due to<br />
downturn in production in customer industries<br />
• Strong price volatility for crude oil and naphtha<br />
0%<br />
0.0<br />
2.7<br />
4%<br />
5.2<br />
trends in the raw materials markets<br />
the energy markets showed an unprecedentedly volatile<br />
course as a result of speculative bias. the price of oil rose<br />
from $90 per barrel in the beginning of <strong>2008</strong> to a record<br />
price of up to $145 per barrel in July, thereby causing<br />
great uncertainty for energy consumers. in the course of<br />
the economic downturn, the oil price dropped again to<br />
under $50 per barrel, matching the level it was at in the<br />
beginning of 2007. the prices for chemical raw materials,<br />
for example naphtha, rose mid-year in parallel with oil<br />
prices to a record level of over $1,100 per metric ton. in<br />
September <strong>2008</strong>, demand in the energy markets strongly<br />
decreased as a result of the financial crisis. in december,<br />
energy prices reached their lowest level since 2005: the<br />
oil price was $40 per barrel and the price of naphtha was<br />
$245 per metric ton. the average annual price of oil rose<br />
by 34% to approximately $97 per barrel and the price for<br />
naphtha by 17% to $789 per metric ton above the previous<br />
year’s level.<br />
in the united States, gas prices fell after steadily<br />
increasing until mid-<strong>2008</strong>. after reaching a level of $13/<br />
mbtu, the price stabilized to below $6/mbtu. the average<br />
annual price of $8.9/mbtu was however 27% higher than<br />
in 2007. in europe, the average annual gas price increased<br />
by 50% compared with the previous year.<br />
the steady increase of agricultural commodity prices<br />
since 2007 abruptly stopped in July <strong>2008</strong>. Since then,<br />
prices have fallen, and at the end of <strong>2008</strong> prices were<br />
32% below the previous year’s level. the average annual<br />
agricultural commodity prices in <strong>2008</strong> were approximately<br />
4% less than 2007.<br />
the markets for nonferrous metals slumped as early as<br />
March, <strong>2008</strong> and at year end were 47% below the level of<br />
the previous year. the average annual price in <strong>2008</strong> for<br />
nonferrous metals was 11.4% lower than in the previous<br />
year.<br />
Price trends for crude oil and naphtha (uS$/barrel, uS$/metric ton)<br />
US$/metric<br />
2006<br />
ton<br />
1,150<br />
950<br />
750<br />
550<br />
350<br />
150<br />
2007<br />
<strong>2008</strong><br />
Oil price in US$/barrel Naphtha price in US$/metric ton<br />
US$/<br />
bbl<br />
135<br />
115<br />
95<br />
75<br />
55<br />
35<br />
15
ManageMent’s analysis<br />
The Business Year at <strong>BASF</strong> Business Development <strong>BASF</strong> Group<br />
Business deVelOPMent BasF gROuP<br />
sales and earnings (million €)<br />
<strong>2008</strong> 2007 change in %<br />
Sales 62,304 57,951 7.5<br />
income from operations before depreciation and amortization (ebitda) 9,562 10,225 (6.5)<br />
ebitda in percent of sales 15.3 17.6 –<br />
income from operations (ebit) before special items 6,856 7,614 (10.0)<br />
income from operations (ebit) 6,463 7,316 (11.7)<br />
Financial result (487) (381) (27.8)<br />
income before taxes and minority interests 5,976 6,935 (13.8)<br />
income before minority interests 3,305 4,325 (23.6)<br />
income before minority interests as a percentage of sales 5.3 7.5 –<br />
net income 2,912 4,065 (28.4)<br />
earnings per share (€) 1 3.13 4.16 (24.8)<br />
sales and earnings by quarter <strong>2008</strong> (million €)<br />
1st quarter 2nd quarter 3rd quarter 4th quarter <strong>2008</strong><br />
Sales 15,921 16,305 15,772 14,306 62,304<br />
income from operations before depreciation and amortization (ebitda) 2,955 3,033 2,171 1,403 9,562<br />
income from operations (ebit) before special items 2,354 2,408 1,568 526 6,856<br />
income from operations (ebit) 2,303 2,359 1,509 292 6,463<br />
Financial result (122) (38) (39) (288) (487)<br />
income before taxes and minority interests 2,181 2,321 1,470 4 5,976<br />
net income 1,170 1,297 758 (313) 2,912<br />
earnings per share (€) 1 1.24 1.39 0.82 (0.34) 3.13<br />
sales and earnings by quarter 2007 (million €)<br />
1st quarter 2nd quarter 3rd quarter 4th quarter 2007<br />
Sales 14,632 14,656 13,963 14,700 57,951<br />
income from operations before depreciation and amortization (ebitda) 2,673 2,663 2,355 2,534 10,225<br />
income from operations (ebit) before special items 2,116 2,030 1,705 1,763 7,614<br />
income from operations (ebit) 2,010 2,007 1,689 1,610 7,316<br />
Financial result (94) (65) (105) (117) (381)<br />
income before taxes and minority interests 1,916 1,942 1,584 1,493 6,935<br />
net income 1,035 1,024 1,213 793 4,065<br />
earnings per share (€) 1 1.04 1.04 1.25 0.83 4.16<br />
1 in the second quarter of <strong>2008</strong>, we conducted a two-for-one stock split. the earnings per share figure for 2007 has been adjusted accordingly.<br />
sales (million €)<br />
70,000<br />
52,500<br />
35,000<br />
17,500<br />
0<br />
37,537<br />
2004<br />
42,745<br />
2005<br />
52,610<br />
2006<br />
57,951<br />
2007<br />
62,304<br />
<strong>2008</strong><br />
income from operations (million €)<br />
8,000<br />
6,000<br />
4,000<br />
2,000<br />
0<br />
5,193<br />
2004<br />
5,830<br />
2005<br />
6,750<br />
2006<br />
7,316<br />
2007<br />
6,463<br />
<strong>2008</strong><br />
BasF RePORt <strong>2008</strong><br />
39
40<br />
ManageMent’s analysis<br />
The Business Year at <strong>BASF</strong> Business Development <strong>BASF</strong> Group<br />
Following a strong start, BasF group’s business worsened<br />
steadily in the further course of <strong>2008</strong>. in the first<br />
half of the year, we continued to grow strongly as in<br />
previous years. toward the end of the year, however,<br />
the business environment was significantly impacted<br />
by the worldwide economic crisis. in this difficult<br />
business environment, we exceeded the record level<br />
of sales posted in 2007, but income from operations<br />
decreased compared with the previous year.<br />
sales<br />
Sales in <strong>2008</strong> rose by 7.5% compared with the previous<br />
year to €62,304 million. the change in sales was due to<br />
the following factors:<br />
Factors influencing sales<br />
Million € <strong>2008</strong><br />
BasF RePORt <strong>2008</strong><br />
contribution to<br />
sales growth (%)<br />
Volumes 178 0.3<br />
Prices 6,781 11.7<br />
currencies (2,567) (4.4)<br />
acquisitions and changes of the<br />
scope of consolidation<br />
divestitures (274) (0.5)<br />
4,353 7.5<br />
in the first half of the year, sales volumes increased in almost<br />
all areas of our portfolio. toward the end of the year,<br />
however, demand in many sales markets declined significantly.<br />
nevertheless, on average we increased prices in all<br />
divisions in <strong>2008</strong> compared with 2007. We were, however,<br />
unable to pass on fully raw material prices, which were<br />
very volatile and on average higher than in 2007.<br />
sales<br />
235<br />
Sales rise due to higher prices despite significant<br />
decline in demand toward the end of the year<br />
+8%<br />
0.4<br />
acquisitions contributed €278 million to the sales increase,<br />
while divestitures reduced sales by €274 million. the main<br />
divestitures were the sale of the lysine and premixes businesses;<br />
the sale of the pharmaceuticals manufacturing business<br />
in Shreveport, Louisiana; and the sale of WibaRco, a<br />
subsidiary involved in the surfactant business.<br />
currency effects reduced sales by 4.4%, or €2,567 million.<br />
the average euro/dollar exchange rate was $1.47 per<br />
euro, compared with $1.37 in 2007.<br />
Sales in the chemicals segment grew. in particular, this<br />
was due to passing on raw material prices, which on average<br />
were considerably higher in <strong>2008</strong> compared with 2007.<br />
Sales decreased in both divisions in the Plastics segment,<br />
in particular due to negative currency effects. the Performance<br />
Polymers and Polyurethanes divisions reported a<br />
significant decline in volumes in all regions in the second half<br />
of the year.<br />
Sales in the Performance Products segment rose<br />
slightly compared with 2007. the acrylics & dispersions<br />
division contributed mainly to this increase. Higher prices<br />
offset the impact of currency effects and divestitures.<br />
Sales in the Functional Solutions segment decreased<br />
due to lower sales in the catalysts and coatings divisions.<br />
the construction chemicals division, however, posted<br />
higher sales due to continued growth in eastern europe,<br />
the Middle east and large parts of asia.<br />
incOMe FROM OPeRatiOns<br />
earnings decline compared with 2007, significant drop<br />
in many divisions in the fourth quarter<br />
–12%
in the agricultural Solutions segment, sales increased due<br />
to strong demand for our crop protection products resulting<br />
from high prices for agricultural commodities.<br />
Sales in the oil & gas segment rose significantly thanks<br />
to the higher average oil price in <strong>2008</strong> and higher sales<br />
volumes in natural gas trading.<br />
Sales in “other” declined, mainly due to a decrease in<br />
Styrenics and in raw materials trading. Sales of fertilizers<br />
rose.<br />
income from operations<br />
income from operations amounted to €6,463 million in<br />
<strong>2008</strong>, 11.7% lower than the record amount of €7,316 million<br />
in 2007. in <strong>2008</strong>, we again earned a premium on our<br />
cost of capital amounting to €1,621 million; this compared<br />
with €2,895 million in 2007.<br />
More information on the cost of capital concept can be found in the “Valuebased<br />
Management” chapter on page 27<br />
after a strong first half in <strong>2008</strong>, the economic environment<br />
worsened steadily in the course of the second half of the<br />
year. only South america remained largely unaffected.<br />
Raw material prices and demand declined considerably, in<br />
particular in the fourth quarter of <strong>2008</strong>. We therefore significantly<br />
reduced production worldwide or shut down<br />
plants temporarily.<br />
earnings decreased in the chemicals segment. this<br />
was primarily the result of a decline in earnings in the Petrochemicals<br />
division because of lower margins for cracker<br />
products and plant shutdowns due to lower demand toward<br />
the end of the year.<br />
the Plastics segment also reported a decline in earnings.<br />
this was primarily due to lower volumes and margins<br />
in the Performance Polymers division.<br />
incOMe FROM OPeRatiOns<br />
• <strong>2008</strong> income from operations down 11.7% at<br />
€6,463 million<br />
• Special charges due to restructuring measures and<br />
writedowns<br />
• Strong earnings growth in the agricultural Solutions<br />
and oil & gas segments<br />
ManageMent’s analysis<br />
The Business Year at <strong>BASF</strong> Business Development <strong>BASF</strong> Group<br />
earnings in the Performance Products segment increased<br />
due to the strong performance of the care chemicals division.<br />
the acrylics & dispersions and Performance chemicals<br />
divisions posted lower earnings.<br />
in the Functional Solutions segment, earnings declined<br />
in all operating divisions. this was due to weaker demand<br />
from the automotive and construction industries as well as<br />
higher raw material costs, which negatively impacted margins.<br />
earnings in the agricultural Solutions segment grew<br />
strongly due to higher sales volumes and margins.<br />
earnings rose in the oil & gas segment. the exploration<br />
& Production business sector posted higher earnings<br />
as a result of the higher oil price. the natural gas trading<br />
business sector posted a decline in earnings compared<br />
with 2007 due to lower margins.<br />
earnings in other declined. this was due to expenses<br />
related to the hedging of raw material price risks as well as<br />
lower earnings in the Styrenics business. at year end <strong>2008</strong>,<br />
the Styrenics business was no longer classified as a disposal<br />
group. Moreover, other included income from the<br />
reversal of provisions for the baSF options program and<br />
higher earnings from the sale of fertilizers.<br />
special items<br />
income from operations was negatively impacted by<br />
special charges of €393 million in <strong>2008</strong> compared with<br />
€298 million in 2007.<br />
Restructuring measures accounted for special charges<br />
of €257 million. the major part of this was due to the<br />
write-down of assets in the Styrenics business as a result<br />
of lower profitability.<br />
special items<br />
Million € <strong>2008</strong> 2007<br />
Restructuring measures (257) (185)<br />
divestitures (5) (3)<br />
other charges and income (131) (110)<br />
(393) (298)<br />
BasF RePORt <strong>2008</strong><br />
41
42<br />
ManageMent’s analysis<br />
The Business Year at <strong>BASF</strong> Business Development <strong>BASF</strong> Group<br />
net special charges were also incurred as a result of divestitures<br />
to optimize our portfolio. in particular, this applied to<br />
the sale of real estate in north america. Special income<br />
resulted from the sale of the pharmaceuticals manufacturing<br />
business in Shreveport, Louisiana.<br />
other special charges were incurred by the intermediates<br />
and coatings divisions and the Styrenics business<br />
reported in other. these units closed plants in asia and the<br />
united States and had to write down other plants due to<br />
unsatisfactory profitability.<br />
in <strong>2008</strong>, other special income resulted from the reversal<br />
of a portion of the provisions established in 2006 due to<br />
the mothballing of the tHF plant in caojing, china.<br />
net income<br />
the financial result declined to minus €487 million compared<br />
with minus €381 million in 2007. this was due to<br />
losses from foreign currency transactions at the production<br />
company for the Yuzhno Russkoye natural gas field, which<br />
is consolidated using the equity method. this was partially<br />
offset by lower interest rates for the u.S. dollar and gains<br />
from the hedging of foreign currency risks.<br />
income before taxes and minority interests amounted<br />
to €5,976 million compared with €6,935 million in 2007.<br />
the return on assets was 13.5% in <strong>2008</strong> compared with<br />
16.4% in 2007.<br />
net incOMe<br />
• Financial result declines due to foreign currency<br />
transactions<br />
• tax rate increases due to high oil production taxes<br />
BasF RePORt <strong>2008</strong><br />
the tax rate of 44.7% was approximately seven percentage<br />
points higher than in 2007. this was due to the higher<br />
level of non-compensable income taxes on oil production,<br />
which increased from €1,302 million in 2007 to €1,851 million<br />
in <strong>2008</strong>. Furthermore, the german corporate tax<br />
Reform resulted in non-recurring, non-cash income of<br />
€229 million in 2007.<br />
net income declined by €1,153 million, or 28.4%, to<br />
€2,912 million.<br />
Minority interests were mainly related to gazprom’s<br />
stakes in natural gas trading companies as well as in a<br />
german Wintershall subsidiary that holds production and<br />
exploration rights to onshore concessions in Libya.<br />
earnings per share were €3.13 compared with €4.16 in<br />
2007. in the second quarter, we conducted a two-for-one<br />
stock split. the earnings per share figure for 2007 has<br />
been adjusted accordingly.<br />
in <strong>2008</strong>, we again generated a high level of cash<br />
from operating activities of €5,023 million compared with<br />
€5,807 million in the previous year. at €2,502 million, free<br />
cash flow in <strong>2008</strong> was also high (2007: €3,245 million).<br />
eaRnings PeR shaRe/cash FlOW<br />
• earnings per share of €3.13, 25% below the previous<br />
year’s level<br />
• Previous year’s figure adjusted accordingly due to<br />
two-for-one stock split<br />
• cash provided by operating activities again high at<br />
€5 billion
cOnsOlidated Balance sheets<br />
assets<br />
ManageMent’s analysis<br />
The Business Year at <strong>BASF</strong> Consolidated Balance Sheets<br />
<strong>2008</strong><br />
Million €<br />
<strong>2008</strong><br />
%<br />
2007<br />
Million €<br />
intangible assets 9,889 19.4 9,559<br />
Property, plant and equipment 15,032 29.6 14,215<br />
investments accounted for using the equity method 1,146 2.3 834<br />
other financial assets 1,947 3.8 1,952<br />
deferred taxes 930 1.8 679<br />
other receivables and miscellaneous long-term assets 642 1.3 655<br />
long-term assets 29,586 58.2 27,894<br />
inventories 6,763 13.3 6,578<br />
accounts receivable, trade 7,752 15.2 8,561<br />
other receivables and miscellaneous short-term assets 3,948 7.8 2,337<br />
Marketable securities 35 0.1 51<br />
cash and cash equivalents 2,776 5.4 767<br />
assets of disposal groups – – 614<br />
short-term assets 21,274 41.8 18,908<br />
total assets 50,860 100.0 46,802<br />
stockholders’ equity and liabilities<br />
<strong>2008</strong><br />
Million €<br />
<strong>2008</strong><br />
%<br />
2007<br />
Million €<br />
Subscribed capital 4,417 8.7 4,397<br />
Retained earnings 13,250 26.0 14,556<br />
other comprehensive income (96) (0.2) 174<br />
Minority interests 1,151 2.3 971<br />
stockholders’ equity 18,722 36.8 20,098<br />
Provisions for pensions and similar obligations 1,712 3.4 1,292<br />
other provisions 2,757 5.4 3,015<br />
deferred taxes 2,167 4.3 2,060<br />
Financial indebtedness 8,290 16.3 6,954<br />
other liabilities 917 1.8 901<br />
long-term liabilities 15,843 31.2 14,222<br />
accounts payable, trade 2,734 5.4 3,763<br />
Provisions 3,043 6.0 2,697<br />
tax liabilities 860 1.7 881<br />
Financial indebtedness 6,224 12.2 3,148<br />
other liabilities 3,434 6.7 1,976<br />
Liabilities of disposal groups – – 17<br />
short-term liabilities 16,295 32.0 12,482<br />
total stockholders’ equity and liabilities 50,860 100.0 46,802<br />
BasF RePORt <strong>2008</strong><br />
43
44<br />
ManageMent’s analysis<br />
The Business Year at <strong>BASF</strong> Consolidated Balance Sheets<br />
Long-term assets rose by €1,692 million to €29,586 million.<br />
as of december 31, 2007, parts of the former Styrenics<br />
division were classified as a disposal group. in <strong>2008</strong>, these<br />
businesses, which we operate under the name Styrenics,<br />
could not be sold. due to the underlying macroeconomic<br />
conditions and the changes on the capital market, a divesture<br />
is no longer likely in the near future. therefore, the<br />
assets and liabilities of Styrenics were no longer reported<br />
as disposal group as of december 31, <strong>2008</strong>.<br />
intangible assets increased by €330 million, mainly due<br />
to the acquisition of Revus energy aSa, norway.<br />
other financial assets decreased slightly, in particular<br />
due to the partial repayment of the loan to finance the production<br />
company in the Yuzhno Russkoye natural gas field.<br />
this was partially offset by the purchase of 15.2% of the<br />
shares of ciba Holding ag.<br />
additional reasons for the increase in long-term assets<br />
were the strengthening of the u.S. dollar against the euro<br />
as of the balance sheet date as well as various investment<br />
projects.<br />
More information on our investments can be found in “BasF segments” from<br />
page 50 onward<br />
inventories increased by €185 million to €6,763 million.<br />
due to lower demand toward the end of the year, days of<br />
inventory invested increased compared with 2007.<br />
trade accounts receivable declined by €809 million to<br />
€7,752 million. this was mainly due to lower sales in the<br />
fourth quarter. despite the global credit crisis, we further<br />
reduced the number of days of sales outstanding.<br />
BasF RePORt <strong>2008</strong><br />
compared with 2007, other receivables and miscella-<br />
neous short-term assets increased by €1,611 million to<br />
€3,948 million, primarily due to higher market values of<br />
derivatives held to hedge against currency risks.<br />
Stockholders’ equity decreased by €1,376 million,<br />
mainly due to the repurchase of 37.9 million shares for a<br />
total of €1,618 million. additional factors included the<br />
lower net income compared with 2007 and dividend payments<br />
of €2,157 million. the equity ratio declined from<br />
42.9% to 36.8%.<br />
Long-term liabilities increased by €1,621 million to<br />
€15,843 million. Pension provisions increased as a result of<br />
the lower market value of pension assets. to finance its<br />
activities, baSF issued bonds totaling €1.6 billion as well<br />
as promissory notes for €553 million in the course of <strong>2008</strong>.<br />
net debt (million €)<br />
<strong>2008</strong> 2007<br />
cash and cash equivalents 2,776 767<br />
Financial indebtedness 14,514 10,102<br />
net debt 11,738 9,335<br />
Short-term liabilities increased by €3,813 million to<br />
€16,295 million. this was mainly due to the expansion of<br />
our commercial paper program.<br />
More information on the consolidated balance sheets is provided in the notes<br />
to the consolidated Financial statements from page 153 onward<br />
assets stOckhOldeRs’ equity and<br />
liaBilities<br />
• disposal group of the Styrenics dissolved, sale not<br />
likely in the near future<br />
• intangible assets increased due to the acquisition of<br />
Revus energy aSa, norway<br />
• accounts receivable, trade decreased, particularly<br />
due to lower sales in the fourth quarter<br />
• Stockholders’ equity decreased, due especially to<br />
share buybacks, dividends and lower net income<br />
• Long-term liabilities increased due to higher pension<br />
provisions and the issuing of bonds<br />
• Short-term liabilities increased due to the expansion<br />
of the commercial paper program
liquidity and caPital ResOuRces<br />
Value-based financial management, high cash flow<br />
Our goal is to maintain the financial flexibility needed<br />
to continually develop our business portfolio and take<br />
advantage of strategic opportunities.<br />
Financing Policy<br />
the objectives of our financing policy are to ensure liquidity,<br />
limit financial risks and optimize capital costs by means<br />
of an appropriate capital structure. our financial activities<br />
are conducted in line with the needs of the operational<br />
business and the company’s strategic direction.<br />
consolidated statements of cash Flows (million €)<br />
ManageMent’s analysis<br />
The Business Year at <strong>BASF</strong> Liquidity and Capital Resources<br />
share buybacks and dividends<br />
due to our shareholder-oriented buyback policy we managed<br />
our equity ratio, reduced our capital costs and boosted<br />
earnings per share in the past years. We aim to increase our<br />
dividend annually and in years with difficult business conditions,<br />
we aim to at least maintain it at the previous year’s<br />
level.<br />
<strong>2008</strong> 2007<br />
net income 2,912 4,065<br />
depreciation and amortization of intangible assets, property, plant and equipment and financial assets 3,180 2,947<br />
changes in working capital (1,339) (999)<br />
Miscellaneous items 270 (206)<br />
cash provided by operating activities 5,023 5,807<br />
Payments related to property, plant and equipment and intangible assets (2,521) (2,562)<br />
acquisitions/divestitures (564) (536)<br />
Financial investments and other items (375) (514)<br />
cash used in investing activities (3,460) (3,612)<br />
capital increases/repayments, share repurchases (1,573) (1,749)<br />
changes in financial liabilities 4,189 1,137<br />
dividends (2,157) (1,624)<br />
cash provided by (used in) financing activities 459 (2,236)<br />
net changes in cash and cash equivalents 2,022 (41)<br />
cash and cash equivalents as of beginning of year and other changes 754 808<br />
cash and cash equivalents as of end of year 2,776 767<br />
cash flow (billion €)<br />
6<br />
5<br />
4<br />
3<br />
2<br />
1<br />
0<br />
2004<br />
2005<br />
2006<br />
2007<br />
<strong>2008</strong><br />
cash provided by operating activities<br />
Payments related to property, plant and equipment<br />
and intangible assets<br />
Free cash flow 1<br />
1 cash provided by operating activities minus payments related to property,<br />
plant and equipment and intangible assets, in 2005 excluding external<br />
financing of pension obligations (cta)<br />
BasF RePORt <strong>2008</strong><br />
45
46<br />
ManageMent’s analysis<br />
The Business Year at <strong>BASF</strong> Liquidity and Capital Resources<br />
cash provided by operating activities<br />
despite an increase in net working capital in the first three<br />
quarters, we again generated a high level of cash from<br />
operating activities of €5,023 million in <strong>2008</strong> compared<br />
with €5,807 million in 2007. Miscellaneous items reflect the<br />
reclassification of equity income and minority interests. in<br />
2007, miscellaneous items also contained the elimination<br />
of non-cash income resulting from the german corporate<br />
tax Reform.<br />
cash used in investing activities<br />
at €3,460 million, net expenses were slightly lower than<br />
in the previous year.<br />
in <strong>2008</strong>, expenditures for acquisitions totaled €637 million<br />
compared with €635 million in 2007 and were primarily<br />
related to the purchase of Revus energy aSa, Stavanger,<br />
norway.<br />
We generated proceeds of €73 million from divestitures,<br />
in particular from the sale of the pharmaceuticals<br />
manufacturing business in Shreveport, Louisiana.<br />
in <strong>2008</strong>, payments related to property, plant and equipment<br />
and intangible assets amounted to €2,521 million,<br />
and were accordingly below the corresponding level of<br />
depreciation and amortization.<br />
Free cash flow in <strong>2008</strong> was €2,502 million compared<br />
with €3,245 million in 2007.<br />
More information on additions to property, plant and equipment is in the<br />
chapter “BasF segments” from page 50 onward<br />
capital expenditures by region (%)<br />
BasF RePORt <strong>2008</strong><br />
<strong>2008</strong> 2007<br />
europe 77.6 79.4<br />
north america 14.9 14.3<br />
asia Pacific 4.7 4.2<br />
South america, africa, Middle east 2.8 2.1<br />
100.0 100.0<br />
Financial investments and miscellaneous items resulted in<br />
a net cash outflow of €375 million in <strong>2008</strong>. Payments were<br />
primarily related to the purchase of 15.2% of the shares of<br />
ciba Holding ag as well as capital contributions to nord<br />
Stream ag and oao Severneftegazprom. cash inflows<br />
resulted from the repayment of loans, in particular by oao<br />
Severneftegazprom, and the sale of assets.<br />
cash provided by financing activities<br />
cash provided by financing activities amounted to €459 million<br />
in <strong>2008</strong> compared with minus €2,236 million in 2007.<br />
this was primarily due to an increase in financial indebtedness<br />
of €4,412 million compared with the previous year<br />
to €14,514 million at the end of <strong>2008</strong>. net debt rose by<br />
€2,403 million to €11,738 million.<br />
We spent a total of €1,618 million to buy back 37.9 million<br />
shares at an average price of €42.70 per share.<br />
For further information on the share buyback program, see also note 17 to the<br />
consolidated Financial statements on page 198<br />
We paid out €2,157 million in dividends and profit transfers<br />
in <strong>2008</strong>. of this amount, €1,831 million or €3.90 per share<br />
(before the stock split) was to shareholders of baSF Se for<br />
fiscal year 2007. Minority interests in proportionally or fully<br />
consolidated companies received €326 million.<br />
Key financial ratios remained solid in <strong>2008</strong> and thus<br />
provided the basis for good ratings. With an “aa- /a-1+/<br />
outlook negative” rating from Standard & Poor’s and an<br />
“aa3/P-1/outlook under review for downgrade” rating from<br />
Moody’s, baSF had significantly stronger ratings than its<br />
competitors in the chemical industry at the end of <strong>2008</strong>.<br />
at the beginning of 2009, Standard & Poor’s downgraded<br />
its rating of baSF to “a+/a-1/outlook negative” and<br />
Moody’s reduced its rating to “a1/P-1/outlook stable.”<br />
cOnsOlidated stateMents OF<br />
cash FlOWs<br />
• cash provided by operating activities again high at<br />
€5 billion<br />
• Free cash flow of €2,502 million compared with<br />
€3,245 million in 2007<br />
• €2.5 billion spent on property, plant and equipment<br />
and intangible assets<br />
• expenditures on acquisitions of €637 million;<br />
income from divestitures of €73 million
Balance sheet ratios<br />
Fixed asset coverage i (%) =<br />
Fixed asset coverage ii (%) =<br />
equity ratio (%) =<br />
liquidity and debt ratios<br />
Liquidity (%) =<br />
dynamic debt level (%) =<br />
Leverage (%) =<br />
interest coverage<br />
ebitda interest coverage =<br />
Stockholders’ equity<br />
intangible assets + Property, plant and equipment + Financial assets<br />
Stockholders’ equity + Long-term liabilities<br />
intangible assets + Property, plant and equipment + Financial assets<br />
Stockholders’ equity<br />
Stockholders’ equity + liabilities<br />
current assets<br />
Short-term liabilities<br />
cash provided by operating activities<br />
Financial indebtedness<br />
Financial indebtedness<br />
Stockholders’ equity<br />
income from operations before<br />
depreciation and amortization<br />
interest expense – interest income<br />
solid Financing<br />
despite the tense situation on the credit markets, baSF<br />
was able to finance itself with commercial paper without<br />
any difficulty. in october <strong>2008</strong>, we increased the maximum<br />
potential issuing volume of our commercial paper program<br />
from $7.5 billion to $12.5 billion. as of december 31, <strong>2008</strong>,<br />
baSF used approximately $6.1 billion from the commercial<br />
PRinciPles and OBJectiVes OF OuR Financial ManageMent<br />
ManageMent’s analysis<br />
The Business Year at <strong>BASF</strong> Liquidity and Capital Resources<br />
<strong>2008</strong> 2007<br />
66.8 75.7<br />
123.4 129.2<br />
36.8 42.9<br />
<strong>2008</strong> 2007<br />
130.6 151.5<br />
34.6 57.5<br />
77.5 50.3<br />
<strong>2008</strong> 2007<br />
22.4 21.7<br />
paper program. as back-up for the program, contractually<br />
agreed and unused credit lines of $6 billion are available as<br />
well as a credit line of cHF 3.5 billion to finance the acquisition<br />
of ciba. Furthermore, baSF issued bonds totaling<br />
€1.6 billion as well as promissory notes of €553 million in<br />
the course of <strong>2008</strong>.<br />
Financial management in the baSF group is centrally organized and is supported by regional competence centers. our<br />
financing and investment policy is value-based. Risk management takes precedence over return. the risks associated with<br />
currencies, interest rate changes and creditworthiness are analyzed and limited using modern processes and financial<br />
instruments. Within the framework of our financial management, we govern the capital structure of baSF by taking into<br />
account selected financial ratios.<br />
More information regarding the use of financial instruments can be found in note 26 to the consolidated Financial statements from page 212 onward.<br />
BasF RePORt <strong>2008</strong><br />
47
48<br />
ManageMent’s analysis<br />
The Business Year at <strong>BASF</strong> Business Development by Segment<br />
Business deVelOPMent By segMent<br />
segment overview (million €)<br />
BasF RePORt <strong>2008</strong><br />
Sales<br />
income from operations before<br />
depreciation and amortization<br />
(ebitda)<br />
income from operations (ebit)<br />
before special items<br />
<strong>2008</strong> 2007 <strong>2008</strong> 2007 <strong>2008</strong> 2007<br />
chemicals 10,324 9,358 1,988 2,416 1,421 1,889<br />
Plastics 9,675 9,976 962 1,655 544 1,261<br />
Performance Products 8,967 8,862 1,286 1,143 785 712<br />
Functional Solutions 9,388 9,491 564 876 265 557<br />
agricultural Solutions 3,409 3,137 905 718 706 526<br />
oil & gas 14,445 10,517 4,409 3,592 3,844 3,031<br />
other 1 6,096 6,610 (552) (175) (709) (362)<br />
segment overview (million €)<br />
62,304 57,951 9,562 10,225 6,856 7,614<br />
income from<br />
operations<br />
(ebit) assets capital expenditures 2<br />
<strong>2008</strong> 2007 <strong>2008</strong> 2007 <strong>2008</strong> 2007<br />
chemicals 1,376 1,903 5,455 5,971 528 668<br />
Plastics 530 1,172 5,060 5,605 478 510<br />
Performance Products 787 681 6,352 6,397 432 434<br />
Functional Solutions 151 434 8,693 8,730 234 315<br />
agricultural Solutions 705 516 4,352 4,157 196 83<br />
oil & gas 3,844 3,031 8,356 7,057 1,651 2,280<br />
other 1 (930) (421) 12,592 8,885 115 135<br />
6,463 7,316 50,860 46,802 3,634 4,425<br />
1 information on the composition of ‘other’ can be found in note 4 to the consolidated Financial Statements from page 175 onward.<br />
2 additions to property, plant and equipment (thereof from acquisitions: €363 million in <strong>2008</strong> and €17 million in 2007) and intangible assets (thereof from acquisitions:<br />
€745 million in <strong>2008</strong> and €1,779 million in 2007).<br />
sales by segment<br />
6<br />
5<br />
7<br />
1<br />
€62,304<br />
million<br />
4<br />
3<br />
2<br />
1 -- Chemicals: 17%<br />
2 -- Plastics: 16%<br />
3 -- Performance Products: 14%<br />
4 -- Functional Solutions: 15%<br />
5 -- Agricultural Solutions: 5%<br />
6 -- Oil & Gas: 23%<br />
7 -- Other: 10%<br />
income from operations by segment<br />
Chemicals<br />
Plastics<br />
Performance Products<br />
Functional Solutions<br />
Agricultural Solutions<br />
Oil & Gas<br />
Other<br />
–14%<br />
0%<br />
2%<br />
8%<br />
20% 40%<br />
12%<br />
11%<br />
21%<br />
60%
sales (million €)<br />
ManageMent’s analysis<br />
The Business Year at <strong>BASF</strong> Business Development by Segment<br />
1st quarter 2nd quarter 3rd quarter 4th quarter<br />
<strong>2008</strong> 2007 <strong>2008</strong> 2007 <strong>2008</strong> 2007 <strong>2008</strong> 2007<br />
chemicals 2,561 2,290 2,863 2,434 2,788 2,348 2,112 2,286<br />
Plastics 2,547 2,466 2,654 2,541 2,592 2,497 1,882 2,472<br />
Performance Products 2,206 2,226 2,297 2,268 2,370 2,254 2,094 2,114<br />
Functional Solutions 2,394 2,278 2,490 2,440 2,479 2,448 2,025 2,325<br />
agricultural Solutions 946 897 1,159 957 636 574 668 709<br />
oil & gas 3,744 2,970 3,201 2,269 3,182 2,185 4,318 3,093<br />
other 1 1,523 1,505 1,641 1,747 1,725 1,657 1,207 1,701<br />
income from operations (eBit) before special items (million €)<br />
15,921 14,632 16,305 14,656 15,772 13,963 14,306 14,700<br />
1st quarter 2nd quarter 3rd quarter 4th quarter<br />
<strong>2008</strong> 2007 <strong>2008</strong> 2007 <strong>2008</strong> 2007 <strong>2008</strong> 2007<br />
chemicals 524 566 378 573 396 446 123 304<br />
Plastics 359 314 291 340 198 299 (304) 308<br />
Performance Products 223 204 226 185 233 174 103 149<br />
Functional Solutions 140 151 111 168 117 153 (103) 85<br />
agricultural Solutions 259 231 363 241 31 (5) 53 59<br />
oil & gas 984 848 1,026 712 870 662 964 809<br />
other 1 (135) (198) 13 (189) (277) (24) (310) 49<br />
income from operations (eBit) (million €)<br />
2,354 2,116 2,408 2,030 1,568 1,705 526 1,763<br />
1st quarter 2nd quarter 3rd quarter 4th quarter<br />
<strong>2008</strong> 2007 <strong>2008</strong> 2007 <strong>2008</strong> 2007 <strong>2008</strong> 2007<br />
chemicals 524 566 378 573 396 475 78 289<br />
Plastics 358 313 291 339 194 297 (313) 223<br />
Performance Products 231 194 249 180 233 170 74 137<br />
Functional Solutions 137 137 108 155 112 151 (206) (9)<br />
agricultural Solutions 259 226 363 241 31 (5) 52 54<br />
oil & gas 984 848 1,026 712 870 662 964 809<br />
other 1 (190) (274) (56) (193) (327) (61) (357) 107<br />
2,303 2,010 2,359 2,007 1,509 1,689 292 1,610<br />
1 information on the composition of ‘other’ can be found in note 4 to the consolidated Financial Statements from page 175 onward.<br />
BasF RePORt <strong>2008</strong><br />
49
50<br />
ManageMent’s analysis<br />
The Business Year at <strong>BASF</strong> <strong>BASF</strong>’s Segments/Chemicals<br />
cheMicals<br />
excellence in the Verbund, technology and cost leadership<br />
the chemicals segment consists of the inorganics,<br />
Petrochemicals and intermediates divisions. at our<br />
integrated production facilities – our Verbund – in<br />
europe, asia and north america we produce a broad<br />
range of basic chemicals and higher value products<br />
for our internal and external customers.<br />
segment strategy<br />
We create value by growing with an attractive product<br />
portfolio, investments in growth markets and process and<br />
product innovations as well as by integrating our production<br />
competitively and flexibly into the baSF Verbund<br />
structures.<br />
We supply the baSF segments efficiently with basic<br />
chemicals for the production of higher value products. as a<br />
reliable supplier, we market our products to customers in<br />
downstream industries; primarily in the chemical, electronics,<br />
construction, textile, automotive, pharmaceutical and<br />
agrochemical industries. We continually develop our valueadding<br />
chains through innovations and acquisitions in<br />
strongly growing markets.<br />
technology and cost leadership are some of our most<br />
important success factors. We achieve them by improving<br />
processes, implementing market-oriented business models,<br />
and efficiently exploiting the synergy potentials of our<br />
Verbund. We constantly optimize our portfolio and production<br />
structures and align them with the regional market requirements<br />
in europe, north america and asia.<br />
stRategy<br />
• Supplying our value-adding chains and selling to<br />
external customers<br />
• technology and cost leadership as most important<br />
success factors<br />
• optimizing product portfolio and regional production<br />
structures<br />
BasF RePORt <strong>2008</strong><br />
Our Products<br />
the success of the inorganics division is based on a<br />
product range comprising basic products for use in our<br />
Verbund and specialties for our business with third parties.<br />
our most important basic products are ammonia, methanol,<br />
sodium hydroxide, chlorine as well as sulfuric and nitric<br />
acid. our specialties have a clear industry focus, for<br />
example for the electronics or pharmaceutical industries.<br />
We benefit from the knowledge of our customers’ technological<br />
requirements and demands. We are the market<br />
leader in electronic chemicals in asia and europe.<br />
the Petrochemicals division, with its broad range of<br />
basic chemicals, is the backbone of baSF’s value-adding<br />
chain. Products such as ethylene, propylene, butadiene<br />
and benzene are produced in steam crackers from naphtha<br />
or natural gas. in further processing stages, we produce<br />
alcohols, solvents and plasticizers for the chemicals<br />
and plastics industries. alkylene oxides and glycols are<br />
starting materials for the detergents, automotive, packaging<br />
and textile industries.<br />
With its 600 products, our intermediates division develops,<br />
produces and markets the most comprehensive<br />
range of intermediates of all producers worldwide. our<br />
product lines include amines, diols, polyalcohols, acids<br />
and specialties. they serve as starting materials for products<br />
such as coatings, plastics, pharmaceuticals, textile<br />
fibers, crop protection products as well as detergents<br />
and cleaners. Worldwide baSF is among the three largest<br />
suppliers for all significant intermediates.<br />
PROducts<br />
• inorganics: basic materials for our Verbund and<br />
specialties with clear industry focus<br />
• Petrochemicals: broad range of basic chemicals<br />
for baSF’s value-adding chains as well as external<br />
customers<br />
• intermediates: With 600 products, the most comprehensive<br />
range of intermediates worldwide, multiple<br />
market leader
IOnIC LIquIdS<br />
For cellulose processing<br />
VALUE FOR <strong>BASF</strong><br />
no. 1<br />
in the development of this<br />
innovative technology<br />
Eco-friendly use of<br />
resources<br />
VALUE FOR THE ENVIRONMENT<br />
85%<br />
fewer excipients<br />
In the production of cellulose fibers (viscose rayon) from<br />
wood, large amounts of excipients from non-renewable<br />
resources are used today. They subsequently need to be<br />
disposed of or otherwise recycled. Alternatively, ionic liquids<br />
can be used as solvents. They have higher solvency and<br />
can be virtually completely recovered – this is one of our<br />
contributions to resource conservation.<br />
ReseaRch and deVelOPMent<br />
• innovative production processes and structures<br />
• improvement of existing products and applications<br />
• Kaurit Light technology for wood-based materials<br />
• baxxodur for wind turbine rotor blades<br />
• ionic liquids for cellulose processing<br />
ManageMent’s analysis<br />
The Business Year at <strong>BASF</strong> <strong>BASF</strong>’s Segments/Chemicals<br />
Research and development<br />
We focus on the development of innovative production<br />
processes that allow us to further extend our competitive<br />
advantage. existing products and applications are continuously<br />
improved.<br />
in developing new products, we look at the needs of<br />
our internal and external customers as well as at the<br />
opportunities offered by the markets and the Verbund’s<br />
value-adding chains. We also develop completely novel<br />
solutions and next-generation technologies, such as a<br />
wood-based material based on our Kaurit ® Light technology.<br />
this consists of wood chippings, a baSF foam and a<br />
Kaurit binder. it has the same mechanical properties as<br />
normal particle boards, but weighs 30% less, and, due to<br />
this, is better suited to the needs of our customers in the<br />
furniture industry. it can be produced from existing particle<br />
board plants.<br />
under the trade name baxxodur ® , baSF sells a new,<br />
broad range of curing agents, accelerators and additives<br />
for professional epoxy resin processing. these can, for<br />
example, be used in the production of rotor blades for<br />
wind turbines. our goal was to shorten cycle periods in<br />
processing and further improved mechanical strength.<br />
With a new business concept, baSF has developed from<br />
a product to system supplier in this area.<br />
baSF is also the first company to have used ionic<br />
liquids specifically and in large quantities to improve<br />
chemical processes. they can, for example, be used<br />
for cellulose processing where they represent a resourceconserving<br />
alternative to common solvents.<br />
MaRketing and custOMeR<br />
RelatiOns<br />
• Reliable and cost efficient marketing of standard<br />
products mostly without intermediaries, and often via<br />
e-commerce<br />
• Marketing of organic and inorganic specialties with<br />
corresponding technical applications knowledge<br />
• in specialties, particularly close cooperation of our<br />
development laboratories with customers<br />
BasF RePORt <strong>2008</strong><br />
51
52<br />
ManageMent’s analysis<br />
The Business Year at <strong>BASF</strong> <strong>BASF</strong>’s Segments/Chemicals<br />
Marketing and customer relations<br />
in standard products, we focus primarily on supplying our<br />
customers reliably and cost efficiently. they are primarily sold<br />
without intermediaries, largely via e-commerce. We market<br />
organic and inorganic specialties with the corresponding<br />
applications technology knowledge. in these areas, our<br />
development laboratories work particularly closely with our<br />
customers.<br />
We help our customers to be more successful: For<br />
example with the reduction agent adblue ® , which in combination<br />
with a ScR catalyst, reduces the share of nitrogen<br />
oxides in diesel exhaust by 80% and emissions of soot<br />
particles by 40%.<br />
capital expenditures<br />
Location Project<br />
BasF RePORt <strong>2008</strong><br />
additional annual<br />
capacity through<br />
expansion<br />
(metric tons)<br />
total annual<br />
capacity<br />
(metric tons) Startup<br />
antwerp, belgium construction of nitric acid S5 500,000 <strong>2008</strong><br />
Ludwigshafen, germany construction of cyclododecanon 25,000 2009<br />
expansion of hydrogen 50,000 nm 3 /h n/a. 2009<br />
construction of ethylene-/ propylene<br />
pipeline to Karlsruhe, germany<br />
nanjing, china 1 expansion of oxo c4 alcohols 55,000 305,000 <strong>2008</strong><br />
expansion of steam cracker 150,000 750,000 2009/2010<br />
expansion of ethylene oxide, 2-propylheptanol<br />
construction of butylglycol ether, ehano-<br />
n/a. n/a. n/a.<br />
lamines, ethyleneamines, butadiene and<br />
isobutene<br />
n/a.<br />
n/a.<br />
1 operated by a joint venture company in which baSF has a 50% stake and which is proportionally consolidated in the group consolidated Financial Statements.<br />
VeRBund sites<br />
• Ludwigshafen, germany<br />
• antwerp, belgium<br />
• Freeport, texas<br />
• geismar, Louisiana<br />
• Kuantan, Malaysia<br />
• nanjing, china<br />
to tap into new applications, we work closely with partners<br />
from science and technology as well as with large customers.<br />
For example through successful collaborations with<br />
ibM, a technology developer, and the interuniversity Microelectronics<br />
centre (iMec), which is one of the largest european<br />
research centers for nano and micro electronics in<br />
belgium, baSF has access to the innovation circle in the<br />
semiconductor business. Participation in this allows us to<br />
be included with our products in the development of the<br />
next generation of chips – together with the most important<br />
manufacturers – at a very early stage.<br />
staRtuPs in <strong>2008</strong><br />
n/a.<br />
• nitric acid plant in antwerp, belgium<br />
• expansion of the oxo c4 alcohols plant in<br />
nanjing, china<br />
2009
Production capacities of significant Products<br />
Product<br />
europe north america<br />
Sites<br />
ManageMent’s analysis<br />
The Business Year at <strong>BASF</strong> <strong>BASF</strong>’s Segments/Chemicals<br />
asia<br />
Pacific<br />
South america,<br />
africa, Middle<br />
east<br />
annual capacity<br />
(metric tons)<br />
alkylamines X X X 221,000 1<br />
Formic and<br />
propionic acid X X<br />
255,000 1<br />
119,000 1<br />
ammonia X 1,525,000<br />
1, 2<br />
benzene X X X 820,000<br />
butadiene X X 515,000 3<br />
butanediol-equivalents X X X 4, 5 585,000<br />
chlorine X 385,000<br />
ethanolamines und derivatives X 285,000<br />
ethylene X X X 1, 2<br />
3,235,000<br />
ethylene oxide X X X 1,175,000 1<br />
Formaldehyde condensates X 750,000<br />
neopentylglycol X X X 165,000 6<br />
oxo c 4 alcohols<br />
(calculated as butyraldehyde)<br />
X<br />
X<br />
X<br />
1, 4<br />
1,415,000<br />
Polytetrahydrofuran X X X 185,000<br />
Propylene X X X 1, 2, 7<br />
2,480,000<br />
Plasticizers X X X 660,000 4<br />
1 contains the full capacity of a joint venture company for the production of 600,000 metric tons of ethylene; 300,000 metric tons of propylene; 130,000 metric tons<br />
of benzene; 250,000 metric tons of ethylene oxide; 350,000 metric tons of ethylene glycol; 250,000 metric tons of oxo c4 alcohols; 36,000 metric tons of alkylamines,<br />
50,000 metric tons of formic acid; 39,000 metric tons of propionic acid and 160,000 metric tons of acrylic monomers in nanjing, china, in which baSF has<br />
a 50% stake and which is proportionally consolidated in the group consolidated Financial Statements.<br />
2 contains the full capacity of a joint venture company for the production of 935,000 metric tons of ethylene; 830,000 metric tons of propylene and 110,000 metric<br />
tons of benzene (including metathesis) in Port arthur, texas, in which baSF has a 60% stake.<br />
3 contains the full capacity of a joint venture company for the production of 410,000 metric tons of butadiene in Port arthur, texas, in which baSF has a 22.82%<br />
stake and which is proportionally consolidated in the group consolidated Financial Statements.<br />
4 contains the full capacity of a joint venture company for the production of 250,000 metric tons of oxo c4 alcohols; 40,000 metric tons of phthalic anhydride;<br />
100,000 metric tons of plasticizer; 100,000 metric tons of butanediol equivalents and 160,000 metric tons of acrylic monomers in Kuantan, Malaysia, in which baSF<br />
has a 60% stake.<br />
5 contains the full capacity of a joint venture company for the production of 25,000 metric tons of butanediol equivalents in chiba, Japan, in which baSF has a 67%<br />
stake.<br />
6 contains the full capacity of a joint venture company for the production of 35,000 metric tons of neopentylglycol in Jilin, china, in which baSF has a 60% stake.<br />
7 contains the full capacity of a joint venture company for the production of 350,000 metric tons of propylene in tarragona, Spain, in which baSF has a 51% stake.<br />
sales chemicals (million €)<br />
12,000<br />
9,000<br />
6,000<br />
3,000<br />
0<br />
9,161<br />
2006<br />
9,358<br />
2007<br />
10,324<br />
<strong>2008</strong><br />
income from operations chemicals (million €)<br />
2,000<br />
1,500<br />
1,000<br />
500<br />
0<br />
1,337<br />
2006<br />
1,903<br />
2007<br />
1,376<br />
<strong>2008</strong><br />
BasF RePORt <strong>2008</strong><br />
53
54<br />
ManageMent’s analysis<br />
The Business Year at <strong>BASF</strong> <strong>BASF</strong>’s Segments/Chemicals<br />
segment data chemicals (million €)<br />
BasF RePORt <strong>2008</strong><br />
<strong>2008</strong> 2007 change in %<br />
Sales to third parties 10,324 9,358 10.3<br />
thereof inorganics 1,384 1,192 16.1<br />
Petrochemicals 6,428 5,696 12.9<br />
intermediates 2,512 2,470 1.7<br />
intersegmental transfers 5,503 4,829 14.0<br />
Sales including intersegmental transfers 15,827 14,187 11.6<br />
income from operations before depreciation and amortization (ebitda) 1,988 2,416 (17.7)<br />
income from operations (ebit) before special items 1,421 1,889 (24.8)<br />
income from operations (ebit) 1,376 1,903 (27.7)<br />
income from operations (ebit) after cost of capital 740 1,305 (43.3)<br />
ebitda in percent of sales 19.3 25.8 –<br />
assets 5,455 5,971 (8.6)<br />
Research and development expenses 125 123 1.6<br />
additions to property, plant and equipment and intangible assets 528 668 (21.0)<br />
in <strong>2008</strong>, we increased sales to third parties by €966 million<br />
to €10,324 million (volumes 2%, prices 13%, currencies<br />
–5%). income from operations declined to<br />
€1,376 million. earnings were particularly impacted by<br />
the drastic decline in demand in the fourth quarter.<br />
generally high raw material costs and declining margins<br />
for cracker products also contributed to this decline.<br />
in the fourth quarter, production was adjusted to<br />
the considerably lower demand and to reduce inven-<br />
tories.<br />
For 2009, we expect sales to decrease and income<br />
from operations to decline significantly compared with<br />
<strong>2008</strong>, due to lower demand in many of our customer<br />
industries and stronger competition from the Middle<br />
east and asia.<br />
Factors influencing sales – chemicals<br />
Volumes<br />
Prices<br />
Currencies<br />
Sales<br />
–5%<br />
0%<br />
2%<br />
6% 12%<br />
10%<br />
13%<br />
inorganics<br />
in <strong>2008</strong>, sales to third parties increased to €1,384 million<br />
(volumes 1%, prices 17%, currencies –2%). Sales grew<br />
particularly with glues and impregnating resins, inorganic<br />
specialties and inorganic salts.<br />
income from operations was significantly higher than<br />
in the previous year. this was primarily due to high prices<br />
and margins for basic products, especially ammonia and<br />
urea, as well as the specialties business. this more than<br />
offset declines in many business areas, which occurred<br />
due to the generally negative economic situation in the<br />
fourth quarter.<br />
sales by division (million €)<br />
3<br />
1<br />
€10,324<br />
million<br />
2<br />
1 -- Inorganics: 14%<br />
2 -- Petrochemicals: 62%<br />
3 -- Intermediates: 24%
in <strong>2008</strong>, a series of investments, such as the construction<br />
of a nitric acid plant in antwerp, belgium, led to a slight<br />
increase in depreciation.<br />
We intend to sell our 50% stake in Pec-Rhin, a producer<br />
of amonia, nitric acid and fertilizer in ottmarsheim,<br />
France. this site is not integrated into the baSF Verbund.<br />
as of January 2009, baSF Fuel cell gmbH – one of the<br />
leading manufacturers of fuel cell components – will be included<br />
in the inorganics division. Previously, it was<br />
accounted for as corporate research under “other.”<br />
For 2009, we expect sales to decline. Significantly lower<br />
margins with methane-based derivatives will impact<br />
income from operations in 2009, which will be significantly<br />
below the excellent level achieved in <strong>2008</strong>.<br />
inorganics -- sales by region (location of customer)<br />
2<br />
3<br />
4<br />
€1,384<br />
million<br />
1<br />
1 -- Europe: 68%<br />
2 -- North America: 6%<br />
3 -- Asia Pacific: 21%<br />
4 -- South America, Africa,<br />
Middle East: 5%<br />
Petrochemicals<br />
Sales to third parties in <strong>2008</strong> increased by €732 million to<br />
€6,428 million (volumes 4%, prices 15%, currencies –6%).<br />
this was primarily due to the significantly higher prices in<br />
the first three quarters in which stable demand allowed us<br />
to pass on rising raw material prices for crude oil and<br />
naphtha. Margins for plasticizers, alcohols and solvents as<br />
well as alkylene oxides and glycols were high but below<br />
the previous year’s very good level. Margins for cracker<br />
products, however, were significantly below expectations.<br />
new capacities, particularly in the Middle east, led to an<br />
inORganics<br />
• Sales growth especially in glues and impregnating<br />
resins, inorganic specialities and inorganic salts<br />
• High market prices and margins for basic products<br />
• income from operations increases significantly in <strong>2008</strong><br />
• For 2009, lower sales and significantly lower earnings<br />
as a result of lower margins with methane-based<br />
derivatives<br />
ManageMent’s analysis<br />
The Business Year at <strong>BASF</strong> <strong>BASF</strong>’s Segments/Chemicals<br />
oversupply of cracker products, which meant that product<br />
prices could not be increased sufficiently.<br />
toward the end of the third quarter, competition intensified<br />
and demand in the automotive and construction<br />
industries declined rapidly. For business steering and<br />
inventory control purposes, we significantly reduced the<br />
capacity utilization rates of plants that had previously been<br />
operating at high rates worldwide. numerous plants were<br />
operated at lower utilization rates or idled.<br />
income from operations declined significantly. this was<br />
mainly due to the drastic decline in demand in the fourth<br />
quarter, unsatisfactory margins for cracker products, as<br />
well as plant shutdowns because of the hurricanes gustav<br />
and ike on the u.S. gulf coast.<br />
We expect economic conditions to continue to worsen.<br />
For 2009, we anticipate a decline in sales due to declining<br />
product prices with lower annual average raw material<br />
prices. Simultaneously, additional production capacities in<br />
the Middle east and asia and weaker demand will further<br />
reduce the capacity utilization in the industry. in view of the<br />
difficult economic environment, we expect income from<br />
operations to decline significantly in 2009.<br />
Petrochemicals -- sales by region (location of customer)<br />
2<br />
3<br />
4<br />
€6,428<br />
million<br />
PetROcheMicals<br />
1<br />
1 -- Europe: 41%<br />
2 -- North America: 47%<br />
3 -- Asia Pacific: 11%<br />
4 -- South America, Africa,<br />
Middle East: 1%<br />
• Higher sales due to higher product and raw material<br />
prices in the first three quarters<br />
• drastic decline in demand in the fourth quarter<br />
• earnings in <strong>2008</strong> significantly below the previous<br />
year’s level<br />
• For 2009, lower sales and significantly lower income<br />
from operations due to difficult economic environment<br />
BasF RePORt <strong>2008</strong><br />
55
56<br />
ManageMent’s analysis<br />
The Business Year at <strong>BASF</strong> <strong>BASF</strong>’s Segments/Chemicals<br />
intermediates<br />
in <strong>2008</strong>, sales to third parties increased slightly compared<br />
with 2007 by €42 million to €2,512 million (volumes –2%,<br />
prices 7%, currencies –3%). in particular, we significantly<br />
expanded our business with products for the agrochemical<br />
industry, as well as in the gas purification and energy businesses.<br />
thanks to high demand for amines and carboxylic acids,<br />
we passed on higher raw material prices for these products<br />
to the market. butanediol and its derivatives came under<br />
margin pressure as stagnating demand for PolytHF ® and<br />
new capacities of asian competitors impeded our ability to<br />
raise volumes and prices. Hurricanes on the u.S. gulf coast<br />
led to plant shutdowns and sales losses.<br />
Since the end of the third quarter, the economic crisis,<br />
in particular in the automotive, plastics and textile industries,<br />
has negatively impacted the business. in the fourth quarter<br />
we therefore reduced our production volumes worldwide.<br />
in <strong>2008</strong>, income from operations did not reach the previous<br />
year’s high level. this was the result of the drastic<br />
decline in demand in the fourth quarter and the resulting low<br />
plant utilization rates at the end of the year. in addition, the<br />
pressure on margins for butanediol and its derivatives, as<br />
well as lost sales as a result of the hurricanes on the u.S.<br />
gulf coast in September contributed to the decline in earnings.<br />
in <strong>2008</strong>, two special items negatively impacted the division:<br />
as a result of unsatisfactory profitability, the butanediol<br />
plant in the 60:40 joint venture, baSF PetRonaS chemicals<br />
Sdn. bhd., in Kuantan, Malaysia, was written down. in addition,<br />
as part of the restructuring of our butanediol value-<br />
adding chain in asia, we decided to shut down the butanediol/tHF<br />
plant in ulsan, Korea because of sustained worldwide<br />
overcapacity and permanent high costs for the raw<br />
material butadiene. this was partially offset by the reversal<br />
of a portion of the provisions established for the mothballing<br />
inteRMediates<br />
• Slight increase in sales due to strong demand for products for the agrochemical industry as well as in the gas<br />
purification and energy businesses<br />
• earnings decline due to significantly lower demand in the fourth quarter as well as margin pressure for butanediol and<br />
derivatives<br />
• Lower sales as a result of lower volumes as well as significantly lower income from operations expected for 2009<br />
BasF RePORt <strong>2008</strong><br />
of the tHF plant in caojing, china, which were recorded as<br />
special charges in income from operations in 2006. the<br />
technical design for the conversion of the plant to co-produce<br />
tHF and maleic anhydride has been completed. thus<br />
we have different options for its future operation, which we<br />
will decide on according to the development of the market.<br />
For 2009, we expect the performance of our product<br />
lines to continue to be heterogeneous. income from operations<br />
will decline significantly due to lower sales resulting<br />
from lower volumes.<br />
intermediates -- sales by region (location of customer)<br />
3<br />
2<br />
4<br />
€2,512<br />
million<br />
1<br />
1 -- Europe: 50%<br />
2 -- North America: 16%<br />
3 -- Asia Pacific: 28%<br />
4 -- South America, Africa,<br />
Middle East: 6%
Plastics<br />
energy-efficient materials, innovative solutions<br />
BasF is one of the world’s leading producers of plastics.<br />
the Performance Polymers and Polyurethanes divisions<br />
offer our customers energy-efficient products, system<br />
solutions and services.<br />
strategy<br />
We concentrate on activities which allow us to distinguish<br />
ourselves from our competitors and offer us profitable<br />
growth opportunities. our customers are primarily in the<br />
automotive, electric/electronics, textile, packaging and<br />
construction industries. at the same time, the diverse<br />
properties of our plastics are increasingly appealing to<br />
customers from other industries.<br />
this allows us to broaden our portfolio of customer<br />
industries, grow faster than the market and become less<br />
dependent on the cyclicality of individual industries. in the<br />
development of new products and system solutions we<br />
focus on a close collaboration with our customers.<br />
We aim to improve our production processes in a sustainable<br />
way: conserving even more resources, producing<br />
even more energy-efficiently and using more cost effective<br />
raw materials.<br />
stRategy<br />
• tapping into new market segments with a diversified<br />
and innovative portfolio<br />
• close cooperation with customers in the development<br />
of new products and system solutions<br />
• Process optimization for resource and energy efficient<br />
production<br />
ManageMent’s analysis<br />
The Business Year at <strong>BASF</strong> <strong>BASF</strong>’s Segments/Plastics<br />
Our Products<br />
the Performance Polymers division is one of the world’s<br />
leading suppliers of engineering plastics, polyamides and<br />
polyamide intermediates, foams and specialty plastics.<br />
We offer our customers a broad portfolio of engineering<br />
plastics based on polyamide 6 and polyamide 6.6 with the<br />
products ultramid ® , Miramid ® and capron ® . this is complemented<br />
by our products ultradur ® , ultraform ® and<br />
ultrason ® . due to their special mechanical properties<br />
which simultaneously combine low weight, high temperature<br />
and chemical resistance, our engineering plastics are<br />
widely used in the automotive, electric and electronics<br />
industries, for household appliances and in sports and<br />
leisure products.<br />
For the packaging, textile and food industries, we offer<br />
ultramid, an important base product for the manufacturing<br />
of fibers and foils. our product range also includes ecoflex<br />
® and ecovio ® , biodegradable specialty plastics for the<br />
packaging industry.<br />
Styropor ® and its innovative refinement neopor ® – both<br />
styrene-based precursors for foams – are used in insulating<br />
material for construction and packaging. not only do<br />
our foams contribute to energy efficiency: the melaminebased<br />
foam basotect ® additionally provides excellent<br />
sound absorption in buildings and in airplanes, and is<br />
also marketed as a cleaning sponge in consumer goods<br />
industry.<br />
PROducts<br />
• Performance Polymers: engineering plastics, polyamide<br />
and polyamide intermediates as well as foams<br />
and specialty plastics for various applications<br />
• Polyurethanes: basic products, customer-specific<br />
systems and specialties for automotive, construction<br />
and furniture industries as well as household appliances<br />
BasF RePORt <strong>2008</strong><br />
57
58<br />
ManageMent’s analysis<br />
The Business Year at <strong>BASF</strong> <strong>BASF</strong>’s Segments/Plastics<br />
eCOFLex<br />
Biodegradable plastic<br />
Robust in its<br />
application<br />
VALUE FOR <strong>BASF</strong><br />
10x<br />
higher market growth than<br />
conventional plastics<br />
PeRFORMance POlyMeRs<br />
PROducts<br />
• engineering plastics ultramid, Miramid and capron as<br />
well as ultradur and ultraform for the automotive and<br />
electronics industries<br />
• biodegradable plastics ecoflex and ecovio for the<br />
packaging industry<br />
• Precursor for foams neopor, for energy-efficient<br />
materials in the construction industry<br />
BasF RePORt <strong>2008</strong><br />
Biodegradable<br />
after use<br />
VALUE FOR THE ENVIRONMENT<br />
100%<br />
biodegradable<br />
The biodegradable polymer Ecoflex ® is mostly used in blends.<br />
These are combinations of renewable raw materials such as<br />
starch, cellulose and polylactic acid and a petrochemically<br />
based polymer such as Ecoflex. It is used in shopping bags,<br />
agricultural mulch films and food packaging materials. In this<br />
way, Ecoflex imparts renewable raw materials with highvalue<br />
properties.<br />
the Polyurethanes division is one of the leading suppliers<br />
of basic products, systems and specialties. With its worldwide<br />
network of more than 30 polyurethane system houses<br />
and its comprehensive product and service portfolio, baSF<br />
is the preferred partner of its customers in many industries.<br />
Polyurethanes make life more comfortable, safer and<br />
more pleasant – and they help to save energy sustainably.<br />
they help architects to better insulate buildings and automotive<br />
producers to design their vehicles more attractively<br />
and to construct lighter frames. the manufacturers of shoe<br />
soles, mattresses and household appliances as well as<br />
sports equipment use the manifold opportunities and<br />
advantages of this specialty plastic together with the<br />
knowledge and expertise of the polyurethane experts of<br />
baSF worldwide.<br />
We can offer tailor-made polyurethane products for<br />
numerous customer applications. under brand names<br />
such as elastoflex ® and elastopor ® , polyurethanes are<br />
used, for example, as rigid or flexible foams in construction<br />
for furniture and household appliances. the automotive industry<br />
is increasingly using our polyurethanes, for example<br />
our product elastoskin ® , in the manufacture of interior surfaces.<br />
its visual and tactile qualities are nearly indistinguishable<br />
from those of leather. baSF develops, manufactures<br />
and sells components of cellular polyurethane elastomers<br />
under the brand name cellasto ® , which are used for<br />
automotive spring aids. nine in ten automotive manufacturers<br />
use baSF springs – making us the market leader.<br />
our range of polyurethanes continues to include products<br />
with thermoplastic properties. on the market, we sell<br />
these under the brand name elastollan ® as granulates,<br />
which are used in almost all industries, especially in the<br />
automotive industry, in products of the electronic and shoe<br />
industries, and in sports and leisure articles.<br />
POlyuRethanes<br />
PROducts<br />
• elastoflex and elastopor: Rigid or flexible foams for the<br />
construction and furniture industries as well as electric<br />
devices<br />
• elastoskin surfaces for sophisticated vehicle interiors<br />
• Spring aids made of cellasto for the automotive industry<br />
• granulate elastollan with thermoplastic properties for<br />
various applications ranging from heart-lung machine<br />
to ski boots and cable sheathing
Research and development<br />
in addition to innovative manufacturing processes, we<br />
focus in particular on product and system development.<br />
With our customers, we were able to launch numerous innovations<br />
on the market. these include sophisticated<br />
structures in vehicles, such as engine mounts and body<br />
panels, which are lighter than the alternatives made of<br />
metal, thus contributing to the reduction of fuel consumption.<br />
they are developed with baSF software directly at<br />
the customer’s location.<br />
one area we are also focusing on is the use of plastics<br />
as energy-efficient products, for example in insulating<br />
materials in the construction and automotive industries.<br />
the innovative silver gray material neopor displays a much<br />
better insulation capacity than conventional insulation materials.<br />
it achieves the same insulation as Styropor while<br />
using only half the material. thus, fewer fossil fuels are<br />
needed for the temperature control of buildings. the same<br />
amount of fossil fuels needed for the production of the<br />
insulating product is already saved during the first heating<br />
period.<br />
Polyurethanes are increasingly used as the thermal<br />
insulation core in sandwich building elements. Such elements<br />
have established themselves as construction materials<br />
for industrial buildings because of their exceptionally<br />
good thermal and mechanical properties as well as the<br />
ease and speed of installation. We have developed a new<br />
generation of polyurethane rigid foams under the name of<br />
elastopir tM in order to meet the needs of stricter fire protection<br />
regulations for core materials. elastopir combines<br />
the heat insulating properties of polyurethane foams with<br />
high fire resistance and thus makes it possible to build<br />
modern industrial buildings that are both energy-efficient<br />
and safe.<br />
ReseaRch and deVelOPMent<br />
• Sophisticated structures in vehicles, which are lighter<br />
than alternatives such as metal<br />
• energy-efficient insulation materials for the reduction<br />
of fossil fuel consumption in the temperature control of<br />
buildings<br />
• Lupranol balance: low-emission slab polyol based on<br />
castor oil for use in mattresses<br />
ManageMent’s analysis<br />
The Business Year at <strong>BASF</strong> <strong>BASF</strong>’s Segments/Plastics<br />
We offer solutions based on renewable raw materials<br />
for various plastics applications. Mattresses made of<br />
Lupranol ® balance, for example, contain natural castor oil<br />
from the castor oil plant (Ricinus communis). this can be<br />
used as a raw material for the production of low-emission<br />
slab polyols for the first time by utilizing a novel catalyst. in<br />
this way the use of fossil energy sources can be reduced.<br />
a 10 kilogram mattress core made of Lupranol balance<br />
contains an average of 2.2 kilograms of castor oil. in <strong>2008</strong>,<br />
this baSF innovation was awarded with the innovations<br />
award of the american Polyurethanes-association cPi.<br />
Marketing and customer Relations<br />
in the Plastics segment, we develop, produce and market<br />
standard products and specialties as well as special systems<br />
and compounded polymers. For standard products,<br />
which we sell in large quantities, a high priority is placed<br />
on quality and efficiency. For specialties and tailor-made<br />
products, we focus on customer-specific technical marketing.<br />
We work intensively with our customers at an early<br />
stage of development in order to find optimal solutions and<br />
thus help them sustain long-term success.<br />
in the highly service-oriented business with polyurethane<br />
systems and specialties, trust, experience and competence<br />
are especially asked for. through its network of<br />
more than 30 polyurethane system houses baSF provides<br />
fast local support – from technical service and sales to<br />
marketing – in the development of customized solutions.<br />
MaRketing and<br />
custOMeR RelatiOns<br />
• quality and efficiency in the marketing of standard<br />
products<br />
• tailor-made technical marketing for specialties and<br />
customer-specific products<br />
• intensive collaboration with our customers at an early<br />
stage of development in order to achieve optimized<br />
solutions and sustained success<br />
BasF RePORt <strong>2008</strong><br />
59
60<br />
ManageMent’s analysis<br />
The Business Year at <strong>BASF</strong> <strong>BASF</strong>’s Segments/Plastics<br />
capital expenditures<br />
Location Project<br />
BasF RePORt <strong>2008</strong><br />
additional<br />
capacity through<br />
expansion<br />
(metric tons)<br />
total annual<br />
capacity<br />
(metric tons) Startups<br />
antwerp, belgium construction of propylen oxyde 300,000 1 <strong>2008</strong><br />
construction of hydrogen peroxide 230,000 2 <strong>2008</strong><br />
geismar, Louisiana expansion of polyols 155,000 350,000 <strong>2008</strong><br />
Ludwigshafen, germany expansion of ecoflex 60,000 74,000 2010<br />
expansion of ultraform 12,000 55,000 <strong>2008</strong><br />
expansion of ultrason 6,000 12,000 <strong>2008</strong><br />
expansion of neopor 70,000 150,000 2009<br />
thane, india construction of compounding plant for<br />
engineering plastics 9,000 2009<br />
1 operated by a joint venture company in which baSF has a 50% stake and which is proportionally consolidated in the group consolidated Financial Statements.<br />
2 operated by a joint venture company in which baSF has a 25% stake and which is consolidated using the equity method.<br />
Production capacities of significant Products<br />
Product<br />
europe north america<br />
Sites<br />
asia<br />
Pacific<br />
South america,<br />
africa,<br />
Middle east<br />
annual capacity<br />
(metric tons)<br />
isocyanate X X X 1,840,000<br />
Polyamide X X 720,000<br />
Polyamide precursors X X 1,370,000<br />
Propylene oxide X X 925,000 1<br />
1 of which 800,000 metric tons are for polyurethane applications. contains the full capacity of three joint venture companies for the production of propylene oxide in<br />
belgium, the netherlands, and in Singapore, in which baSF has a 50% stake in each and which are proportionally consolidated in the group consolidated Financial<br />
Statements.<br />
sales Plastics (million €)<br />
12,000<br />
9,000<br />
6,000<br />
3,000<br />
0<br />
9,461<br />
2006<br />
9,976<br />
2007<br />
9,675<br />
<strong>2008</strong><br />
income from operations Plastics (million €)<br />
1,200<br />
900<br />
600<br />
300<br />
0<br />
1,180 1,172<br />
2006<br />
2007<br />
530<br />
<strong>2008</strong>
segment data (million €)<br />
ManageMent’s analysis<br />
The Business Year at <strong>BASF</strong> <strong>BASF</strong>’s Segments/Plastics<br />
<strong>2008</strong> 2007 change in %<br />
Sales to third parties 9,675 9,976 (3.0)<br />
thereof Performance Polymers 4,535 4,810 (5.7)<br />
Polyurethanes 5,140 5,166 (0.5)<br />
intersegmental transfers 642 828 (22.5)<br />
Sales including intersegmental transfers 10,317 10,804 (4.5)<br />
income from operations before depreciation and amortization (ebitda) 962 1,655 (41.9)<br />
income from operations (ebit) before special items 544 1,261 (56.9)<br />
income from operations (ebit) 530 1,172 (54.8)<br />
income from operations (ebit) after cost of capital (42) 626 –<br />
ebitda in percent of sales 9.9 16.6 –<br />
assets 5,060 5,605 (9.7)<br />
Research and development expenses 147 142 3.5<br />
additions to property, plant and equipment and intangible assets 478 510 (6.3)<br />
sales to third parties decreased slightly by €301 million<br />
to €9,675 million (volumes –2%, prices 3%, currencies<br />
–4%). in the wake of the economic crisis, income from<br />
operations dropped significantly due to lower volumes<br />
and margins. at €530 million, income from operations<br />
was €642 million lower than in 2007. in 2009, we expect<br />
sales to decrease. We aim to increase earnings due to<br />
lower one-time charges and optimized cost structures.<br />
Performance Polymers<br />
Since January <strong>2008</strong>, the division consists of the foams and<br />
specialty plastics businesses in addition to the engineering<br />
plastics and the polyamide and intermediates businesses.<br />
at €4,535 million, sales to third parties were lower than<br />
the corresponding level of the previous year (volumes<br />
–4%, prices 2%, currencies –4%). Sales volumes declined<br />
due to drastic order cutbacks from our key customer<br />
industries – automotive, construction, and in asia, textiles<br />
– in response to the global economic downturn.<br />
Factors influencing sales – Plastics<br />
Volumes<br />
Prices<br />
Currencies<br />
Sales<br />
–4%<br />
–3%<br />
–2%<br />
0%<br />
2% 4%<br />
3%<br />
in the first three quarters, we were able to raise sales prices<br />
in all major product lines due to increasing raw material<br />
prices. in the fourth quarter, the economic downturn<br />
led to a decline in raw material prices which, at declining<br />
demand, required us to adjust prices particularly for polyamides<br />
and intermediates.<br />
as a result of the development of the crisis and extremely<br />
volatile raw material prices, the income from operations<br />
achieved up to august was eroded in the last months<br />
of <strong>2008</strong>, and was negative for the full year. this was due to<br />
lower volumes and margin erosion, especially for polyamides<br />
and intermediates, reduced capacity utilization at<br />
production facilities and inventory writedowns.<br />
in august, we sold our site in Seal Sands, united Kingdom,<br />
to ineos nitriles as part of the optimization of our<br />
cost structure for polyamides and intermediates. because<br />
inventories and property, plant and equipment had already<br />
been written down in the previous year, the lack of scheduled<br />
depreciation had a positive effect on income from<br />
sales by division (million €)<br />
2<br />
€9,675<br />
million<br />
1<br />
1 -- Performance Polymers: 47%<br />
2 -- Polyurethanes: 53%<br />
BasF RePORt <strong>2008</strong><br />
61
62<br />
ManageMent’s analysis<br />
The Business Year at <strong>BASF</strong> <strong>BASF</strong>’s Segments/Plastics<br />
operations in <strong>2008</strong>. However, we suffered a loss because<br />
of contractual obligations in conjunction with the sale. the<br />
production plant for hexamethylenediamine, an important<br />
precursor for polyamide 6.6, remains the property of baSF<br />
but is operated by ineos nitriles.<br />
For 2009, we expect sales to decline due to weak<br />
demand in our key customer industries – automotive, construction<br />
and textile – and lower raw material prices. nevertheless,<br />
we expect income from operations to grow due<br />
to improved cost structures and new potential offered by<br />
the marketing of innovative products.<br />
Performance Polymers -- sales by region (location of customer)<br />
3<br />
2<br />
€4,535<br />
million<br />
PeRFORMance POlyMeRs<br />
• Lower sales because of significantly lower sales<br />
volumes in the fourth quarter<br />
• income from operations was negative because of<br />
lower volumes and margin erosion, lower capacity<br />
utilization rates, inventory writedowns and special<br />
charges<br />
• Lower sales, but higher earnings due to efficiency<br />
enhancements expected for 2009<br />
BasF RePORt <strong>2008</strong><br />
4<br />
1<br />
1 -- Europe: 49%<br />
2 -- North America: 22%<br />
3 -- Asia Pacific: 23%<br />
4 -- South America, Africa,<br />
Middle East: 6%<br />
Polyurethanes<br />
at €5,140 million, sales to third parties were €26 million<br />
below the previous year’s level (volumes 0%, prices 4%,<br />
currencies –5%).<br />
in europe, our business grew until the third quarter. the<br />
previous years‘ growth trajectory continued in asia Pacific<br />
in the first half of <strong>2008</strong>. during the olympic games in<br />
beijing, china, however, the authorities imposed restrictions<br />
on our customers’ production and on the transportation<br />
of our own products. this led to a decline in demand<br />
in china at the beginning of the second half of the year. in<br />
north america, we posted lower sales, in particular due to<br />
the slowdown in our most important customer industries –<br />
construction and automotive. in September, we had to<br />
curtail our activities and temporarily stop production due to<br />
Hurricane gustav. in the first three quarters, we were able<br />
to largely pass on higher raw material and energy prices in<br />
the form of higher prices.<br />
in <strong>2008</strong>, we posted a lower income from operations<br />
due to the drastic decline in demand in the fourth quarter.<br />
Writedowns on inventory were necessary in the fourth<br />
quarter because of a significant decline in sales prices.<br />
For 2009, we expect a continued difficult economic<br />
environment and lower margins also due to new capacities<br />
for important basic products. We expect sales as well as<br />
income from operations below the level of the previous<br />
year.<br />
Polyurethanes -- sales by region (location of customer)<br />
3<br />
4<br />
€5,140<br />
million<br />
2<br />
POlyuRethanes<br />
1<br />
1 -- Europe: 41%<br />
2 -- North America: 23%<br />
3 -- Asia Pacific: 30%<br />
4 -- South America, Africa,<br />
Middle East: 6%<br />
• Sales almost match previous year’s level, despite<br />
significant declines in the fourth quarter<br />
• decline in earnings due to drop in demand and declining<br />
margins in the fourth quarter<br />
• Lower sales and earnings expected for 2009
PeRFORMance PROducts<br />
innovative and high-growth specialties<br />
the Performance Products segment consists of the<br />
acrylics & dispersions, care chemicals and Performance<br />
chemicals divisions. Our customers use our<br />
products and services to make their processes more<br />
efficient and to offer products on the market that<br />
clearly stand out in the competition.<br />
segment strategy<br />
Specialties make up a major part of our product range. Key<br />
success factors are innovations, close links to leading<br />
companies of our customer industries as well as special<br />
applications and development expertise. our products create<br />
an additional benefit for our customers, which distinguish<br />
them from their competitors. this is why we develop<br />
new solutions preferably with our customers and strive for<br />
long-term collaborations which create profitable growth<br />
opportunities for both sides.<br />
We follow another business model for standard products<br />
such as acrylic acid and vitamins. Here, efficient production<br />
structures within the baSF Verbund, capacity<br />
management as well as technology and cost leadership<br />
are crucial.<br />
a central element of the value-adding strategy is the<br />
active management of our business and product portfolios.<br />
We expand our share of innovative, cyclically resilient, and<br />
growth businesses through acquisitions and divestitures.<br />
With the planned acquisition of ciba Holding ag we will<br />
strengthen our position in several specialties markets, in<br />
particular in plastic additives.<br />
stRategy<br />
• Success factors for specialties: innovation, close<br />
links to leading customer companies, applications and<br />
development expertise<br />
• Success factors for standard products: efficient<br />
production structures within the Verbund, capacity<br />
management as well as technology and cost leadership<br />
•<br />
active portfolio management<br />
ManageMent’s analysis<br />
The Business Year at <strong>BASF</strong> <strong>BASF</strong>’s Segments/Performance Products<br />
Our Products<br />
acrylics & dispersions produces acrylic acid as well as<br />
its derivatives superabsorbents and polymer dispersions.<br />
Superabsorbents are used particularly in diapers. Polymer<br />
dispersions are used in the production of glues, coatings,<br />
nonwoven materials and construction chemicals. our<br />
product portfolio for the paper industry comprises binders,<br />
process chemicals and kaolin pigments. innovative<br />
Luredur ® polyvinylamin products, for example, optimize the<br />
process of paper manufacturing through higher productivity<br />
and lower energy needs.<br />
the portfolio of the care chemicals division for the<br />
cosmetics, as well as the detergents and formulators<br />
business is made up of polymers, surfactants, uV filters,<br />
chelating agents and other specialties, which are increasingly<br />
used in chemical-technical industries. Here, sustainability<br />
is an important goal. an innovative product in<br />
our chelating agent range is trilon ® M, a highly effective<br />
and environmentally friendly detergent. important products<br />
for human nutrition and animal nutrition include vitamins,<br />
carotenoids and enzymes. the division provides the<br />
pharmaceutical industry with active ingredients such as<br />
caffeine and ibuprofen, as well as excipients and customized<br />
synthesized products.<br />
Performance chemicals pools high-value specialties<br />
for various customer industries. these include chemicals<br />
for the production and finishing of leather and textiles as<br />
well as pigments and resins for the coatings and plastics<br />
industries. For example, our innovative black pigments<br />
do not absorb long wave solar radiation so that dark surfaces<br />
remain cooler and there is less strain on the material<br />
of the colored construction components. the division develops<br />
the latest brake fluids and engine coolants for the<br />
automotive, refinery and oil industries as well as fuel additives,<br />
refinery and oilfield chemicals.<br />
PROducts<br />
• acrylics & dispersions: acrylic acid as well as its<br />
derivatives superabsorbents and polymer dispersions<br />
• care chemicals: Product portfolio for the cosmetics,<br />
detergents and formulators industries, animal nutrition<br />
and human nutrition as well as the pharmaceutical<br />
industry<br />
• Performance chemicals: High-quality specialties for<br />
various industrial applications<br />
BasF RePORt <strong>2008</strong><br />
63
64<br />
ManageMent’s analysis<br />
The Business Year at <strong>BASF</strong> <strong>BASF</strong>’s Segments/Performance Products<br />
TRILOn M<br />
Eco-friendly detergents<br />
High effect Biodegradable<br />
VALUE FOR <strong>BASF</strong><br />
€300<br />
million market potential<br />
ReseaRch and deVelOPMent<br />
• development of new products, alignment to customers’<br />
needs and sustainable market trends<br />
• cooperation with innovation leaders of the respective<br />
sectors<br />
• Focus on innovative and rapidly growing markets<br />
• Further development and increase in flexibility of our<br />
production technology and processes<br />
BasF RePORt <strong>2008</strong><br />
VALUE FOR THE ENVIRONMENT<br />
80%<br />
less wastewater load<br />
Our chelating agent Trilon M improves the cleaning effect of<br />
detergents and cleaning agents and has an excellent ecological<br />
profile. A dishwashing tab based on Trilon M, from the<br />
extraction of the raw materials up until its utilization in the<br />
dishwasher, produces 80% less wastewater load compared<br />
with phosphate-based formulations.<br />
Research and development<br />
We focus on the development of new products as well as<br />
the improvement of existing products. We align ourselves<br />
with our customers’ needs and sustainable market trends,<br />
for example novel adhesive raw materials for resealable<br />
food packaging. close collaboration with innovation leaders<br />
among our customers is decisive when it comes to<br />
the development of new solutions and their successful<br />
launch on the market, as for example with our innovative<br />
superabsorbents for ultra thin hygiene products which<br />
need less raw materials. We concentrate our resources on<br />
innovative, rapidly growing markets and applications in<br />
which we can distinguish ourselves from competitors<br />
through our special expertise. Simultaneously, we are<br />
accelerating the further development and flexibility of<br />
our production technologies and processes. this applies<br />
in particular for the acrylic acid value-adding chain and<br />
for vitamins in the care chemicals division.<br />
Marketing and customer relations<br />
our customer portfolio is made up of large and mediumsized<br />
enterprises, global and regional customers in almost<br />
all areas of the consumer and capital goods industries. We<br />
service them directly and individually. With many customers,<br />
we have had business collaborations and partnerships<br />
for many years. in addition to innovative products, applications<br />
services are often part of the service package. We<br />
work with specialized distributors for the servicing of<br />
smaller customers and for certain products and applications.<br />
We also supply internal customers, for example<br />
the coatings and construction chemicals divisions, that<br />
obtain important feedstocks from the divisions in the<br />
Performance Product segment.<br />
MaRketing and custOMeR<br />
RelatiOns<br />
• broad customer portfolio of large and medium sized<br />
as well as global and regional customers from almost<br />
all areas of the consumer and capital goods industries<br />
• applications services are often part of the<br />
service package<br />
• Specialized distributors for the servicing of smaller customers<br />
as well as for certain products and applications
capital expenditures<br />
Location Project<br />
antwerp, belgium<br />
expansion polyisobutene<br />
(low molecular weight)<br />
ManageMent’s analysis<br />
The Business Year at <strong>BASF</strong> <strong>BASF</strong>’s Segments/Performance Products<br />
additional annual<br />
capacity through<br />
expansion<br />
(metric tons)<br />
25,000<br />
total annual<br />
capacity<br />
(metric tons) Startup<br />
antwerp, belgium expansion acrylic acid 160,000 320,000 <strong>2008</strong><br />
Ludwigshafen, germany expansion butylacrylate n/a. n/a. <strong>2008</strong><br />
nanjing, china construction polyisobutene,<br />
surfactants and superabsorbents<br />
Shanghai, china construction performance<br />
chemicals for leather tanning 12,000 <strong>2008</strong><br />
Shanghai, china construction polyacrylate polymers 30,000 <strong>2008</strong><br />
Wyandotte, Michigan construction water-based resins n/a. 2009<br />
Production capacities of significant Products<br />
Product<br />
europe north america<br />
Sites<br />
asia<br />
Pacific<br />
100,000<br />
South america,<br />
africa, Middle<br />
east<br />
n/a.<br />
<strong>2008</strong><br />
annual capacity<br />
(metric tons)<br />
1, 2<br />
acrylic acid X X X 1,175,000<br />
citral X 40,000<br />
Hdi (hexamethylendiisocyanate) X 10,000<br />
Methanesulfonic acid X 10,000<br />
nonionic surfactants X X 435,000<br />
organic pigments X X X 21,000<br />
Polyisobutene X 145,000<br />
Superabsorbents X X X 400,000<br />
1 contains the total capacity of a joint venture company for the production of 160,000 metric tons of acrylic acid in Kuantan, Malaysia, in which baSF has a 60%<br />
stake.<br />
2 contains the total capacity of a joint venture company for the production of 160,000 metric tons of acrylic acid in nanjing, china, in which baSF has a 50 % stake<br />
and which is proportionally consolidated in the group consolidated Financial Statements.<br />
sales Performance Products (million €)<br />
10,000<br />
7,500<br />
5,000<br />
2,500<br />
0<br />
8,494<br />
2006<br />
8,862<br />
2007<br />
8,967<br />
<strong>2008</strong><br />
income from operations Performance Products (million €)<br />
1,000<br />
750<br />
500<br />
250<br />
0<br />
431<br />
2006<br />
681<br />
2007<br />
787<br />
<strong>2008</strong><br />
n/a.<br />
BasF RePORt <strong>2008</strong><br />
65
66<br />
ManageMent’s analysis<br />
The Business Year at <strong>BASF</strong> <strong>BASF</strong>’s Segments/Performance Products<br />
segment data Performance Products (million €)<br />
BasF RePORt <strong>2008</strong><br />
<strong>2008</strong> 2007 change in %<br />
Sales to third parties 8,967 8,862 1.2<br />
thereof acrylics & dispersions 3,632 3,522 3.1<br />
care chemicals 3,065 3,029 1.2<br />
Performance chemicals 2,270 2,311 (1.8)<br />
intersegmental transfers 422 361 16.9<br />
Sales including intersegmental transfers 9,389 9,223 1.8<br />
income from operations before depreciation and amortization (ebitda) 1,286 1,143 12.5<br />
income from operations (ebit) before special items 785 712 10.3<br />
income from operations (ebit) 787 681 15.6<br />
income from operations (ebit) after cost of capital 138 24 475.0<br />
ebitda in percent of sales 14.3 12.9 –<br />
assets 6,352 6,397 (0.7)<br />
Research and development expenses 231 267 (13.5)<br />
additions to property, plant and equipment and intangible assets 432 434 (0.5)<br />
We increased sales to third parties by €105 million to<br />
€8,967 million (volumes 0%, prices 8%, portfolio –4%,<br />
currencies –3%). income from operations increased<br />
to €787 million due to the high profitability of the care<br />
chemicals division.<br />
For 2009, we expect significantly higher sales<br />
following the integration of the ciba business. due<br />
to difficult market conditions and acquisition-related<br />
charges, we expect income from operations to be<br />
below the level of <strong>2008</strong>.<br />
acrylics & dispersions<br />
in <strong>2008</strong>, we posted sales to third parties of €3,632 million,<br />
an increase of €110 million compared with 2007 (volumes<br />
1%, prices 5%, currencies –3%). business in the individual<br />
product lines was mixed. Sales of acrylic monomers increased<br />
compared with the previous year due to higher<br />
Factors influencing sales – Performance Products<br />
–4%<br />
–3%<br />
0%<br />
Volumes 0%<br />
Prices<br />
Portfolio<br />
Currencies<br />
Sales<br />
1%<br />
5%<br />
8%<br />
10%<br />
volumes and prices. Higher volumes increased sales of superabsorbents.<br />
Sales of paper chemicals declined slightly<br />
due to lower volumes caused by the continuing consolidation<br />
of our customers in the paper industry. Sales of adhesive<br />
and construction polymers improved in all regions.<br />
Sales volumes and sales of kaolin minerals declined due to<br />
the persistent weakness of the paper industry.<br />
Raw material prices, which had been rising into the<br />
third quarter, could not be passed on fully to the market.<br />
this led to lower margins in almost all businesses. Margins<br />
for acrylic monomers declined, in particular as a result of<br />
continued high overcapacities in asia. continued consolidation<br />
measures by our customers in the paper industry<br />
put pressure on margins for paper chemicals. Margins for<br />
adhesive and construction polymers declined in europe<br />
compared with 2007 due to higher raw material prices.<br />
the kaolin business was negatively impacted by lower<br />
sales by division (million €)<br />
3<br />
2<br />
€8,967<br />
million<br />
1<br />
1 -- Acrylics & Dispersions: 41%<br />
2 -- Care Chemicals: 34%<br />
3 -- Performance Chemicals: 25%
volumes, higher gas prices in the middle of the year and<br />
significantly higher container freight rates. in north america,<br />
we further expanded our successful asphalt business.<br />
toward the end of the year, the normal seasonal slowdown<br />
in construction-related industries was intensified by the<br />
economic slump. this was reflected in the significant<br />
decrease of demand for acrylic monomers as well as<br />
from the packaging industry. demand-related adjustments<br />
in production led to higher costs due to underutilization.<br />
income from operations was below the previous year’s<br />
level.<br />
in the third quarter of <strong>2008</strong>, we started up additional<br />
annual capacity of 160,000 metric tons of acrylic acid in<br />
antwerp, belgium, thus achieving a further milestone in<br />
securing the internal supply of acrylic acid.<br />
We expect a difficult economic environment for 2009.<br />
Hardly any growth will come from our key customer industries<br />
- automotive, construction and packaging. in the paper<br />
industry, we do not expect any improvement of the<br />
present situation. We expect solid performance from the<br />
hygiene sector. overall, in this difficult economic environment,<br />
we expect sales to decline due to lower prices, with<br />
volumes remaining stable. We anticipate earnings to decrease<br />
only slightly thanks to our productivity improvement<br />
and cost-saving initiatives.<br />
acRylics & disPeRsiOns<br />
• Higher sales due to higher volumes for superabsorbents<br />
as well as higher volumes and prices for acrylic<br />
monomers<br />
• Lower earnings, margins decline in almost all businesses<br />
• Lower sales and slightly lower earnings expected for<br />
2009<br />
ManageMent’s analysis<br />
The Business Year at <strong>BASF</strong> <strong>BASF</strong>’s Segments/Performance Products<br />
acrylics & dispersions -- sales by region (location of customer)<br />
3<br />
2<br />
4<br />
€3,632<br />
million<br />
1<br />
1 -- Europe: 49%<br />
2 -- North America: 24%<br />
3 -- Asia Pacific: 19%<br />
4 -- South America, Africa,<br />
Middle East: 8%<br />
care chemicals<br />
Sales to third parties in the care chemicals division<br />
increased by €36 million to €3,065 million, (volumes 1%,<br />
prices 12%, portfolio –9%, currencies –3%). Sales rose by<br />
€311 million when adjusted for structural effects related to<br />
the sale of the lysine and premixes businesses; the sale of<br />
the pharmaceuticals manufacturing business in Shreveport,<br />
Louisiana; and the sale of WibaRco, a subsidiary<br />
involved in the surfactant business.<br />
We significantly increased income from operations in a<br />
stable market environment, in particular because of the<br />
strong performance of the nutrition unit. this was due to<br />
lower fixed costs following restructuring measures and<br />
higher sales prices for the citral-based vitamins e and a.<br />
integrating the personal care ingredients and detergents<br />
& formulators units, the division gave new impetus<br />
to marketing activities and innovation. by launching new<br />
products, we managed to satisfy the growing demand for<br />
environmentally friendly and sustainable solutions. in addition,<br />
margins were held stable despite higher raw material<br />
prices.<br />
caRe cheMicals<br />
• Higher sales despite divestitures<br />
• new stimulus from optimized marketing activities and<br />
innovations<br />
• Significant increase in earnings thanks in particular to<br />
the nutrition unit<br />
• For 2009, sales and earnings expected slightly below<br />
the level of <strong>2008</strong><br />
BasF RePORt <strong>2008</strong><br />
67
68<br />
ManageMent’s analysis<br />
The Business Year at <strong>BASF</strong> <strong>BASF</strong>’s Segments/Performance Products<br />
overall, special items did not have a significant influence<br />
on income from operations.<br />
in 2009, as a result of our broadly positioned, cyclically<br />
resilient portfolio, we expect the negative impact from the<br />
economic crisis on the care chemicals division to be only<br />
limited. despite the difficult market environment, we expect<br />
sales and earnings to decline only slightly compared<br />
with the exceptionally high levels reached in <strong>2008</strong>.<br />
care chemicals -- sales by region (location of customer)<br />
3<br />
2<br />
PeRFORMance cheMicals<br />
• decline of sales in particular due to lower sales volumes in the fourth quarter<br />
• Lower earnings due to poor performance in chemicals for coatings and plastics<br />
• in 2009 a slight decline in sales and earnings expected<br />
BasF RePORt <strong>2008</strong><br />
4<br />
€3,065<br />
million<br />
1<br />
1 -- Europe: 52%<br />
2 -- North America: 24%<br />
3 -- Asia Pacific: 16%<br />
4 -- South America, Africa,<br />
Middle East: 8%<br />
Performance chemicals<br />
at €2,270 million, sales to third parties declined compared<br />
with 2007 (volumes –1%, prices 5%, portfolio –3%, currencies<br />
–3%). negative currency effects were offset by price<br />
increases. until the third quarter, sales volumes matched the<br />
previous year’s level, but then fell significantly in the fourth<br />
quarter due to the drop in demand in almost all customer<br />
industries.<br />
in europe, we increased prices, although sales<br />
declined for structural reasons. Sales also declined in north<br />
america. Here, higher sales prices could not offset lower volumes<br />
and negative currency effects. in asia, higher prices<br />
were offset by negative currency effects; volumes were at<br />
approximately the same level as in 2007.<br />
in <strong>2008</strong>, we increased sales in our automotive, refinery and<br />
oilfield chemicals. in contrast, sales with chemicals for coatings<br />
and plastics decreased as a result of the difficult economic<br />
condition of important customer industries particularly<br />
in north america. in a difficult global environment, sales in<br />
leather and textile chemicals also declined.<br />
income from operations did not match the previous<br />
year’s level despite the increase in profitability in automo-<br />
tive and refinery chemicals. Lower earnings were posted<br />
in particular for chemicals for coatings and plastics. the<br />
necessary adjustments in production levels following the significant<br />
decline in sales volumes toward the end of the year<br />
caused idle costs to rise.<br />
We introduced additional measures to increase efficiency<br />
for the entire value-adding chain and will continue with this<br />
in 2009. through these measures, we aim to ensure our<br />
success even in difficult economic times. We are creating a<br />
further basis for profitable long-term growth with the startup<br />
of a new plant for the production of water-based resins in<br />
Wyandotte, Michigan, in 2009.<br />
For 2009, we expect the weak economic environment<br />
to continue and thus expect a slight decline in sales and<br />
earnings.<br />
Performance chemicals -- sales by region (location of customer)<br />
3<br />
2<br />
4<br />
€2,270<br />
million<br />
1<br />
1 -- Europe: 48%<br />
2 -- North America: 21%<br />
3 -- Asia Pacific: 22%<br />
4 -- South America, Africa,<br />
Middle East: 9%
FunctiOnal sOlutiOns<br />
customer-specific products and system solutions<br />
the Functional solutions segment consists of the catalysts,<br />
construction chemicals and coatings divisions.<br />
these divisions develop innovative, sector and customer-specific<br />
products and system solutions, in particular<br />
for the automotive and construction industries.<br />
segment strategy<br />
our portfolio is made up of innovative products and technologies<br />
that allow our customers to differentiate themselves<br />
from their competitors. the success of the segment<br />
is based primarily on specialties and system solutions,<br />
which we develop in collaboration with our customers. our<br />
strategy focuses on the continued optimization of our product<br />
portfolios based on regionally differentiated market requirements<br />
as well as megatrends in our customer industries.<br />
We aim to strengthen our leading market position in<br />
europe, to continue improving our position on the north<br />
american market, and to profitably expand our activities in<br />
the growth regions of asia, South america, eastern europe<br />
and the Middle east.<br />
Our Products<br />
the catalysts division develops and produces catalysts,<br />
which destroy pollutants in off-gas streams of vehicles.<br />
With our catalyzed Soot Filter for example, we offer our<br />
customers worldwide an integrated catalytic converter<br />
for diesel vehicles. Furthermore, we produce process<br />
catalysts which increase the raw material and energy<br />
efficiency of chemical plants and refineries. our catalyst<br />
naphthaMax ii tM , for example, increases the gasoline yield<br />
of crude oil. in addition to the development and production<br />
of catalysts, the division provides base and precious<br />
metals and services in this area.<br />
stRategy<br />
• innovative products and technologies<br />
• Focus on the development of specialties and system<br />
solutions in collaboration with our customers<br />
• continued optimization of our product portfolios<br />
according to regional market requirements and global<br />
megatrends in the customer industries<br />
ManageMent’s analysis<br />
The Business Year at <strong>BASF</strong> <strong>BASF</strong>’s Segments/Functional Solutions<br />
Worldwide, the construction chemicals division is leading<br />
in the area of concrete admixtures such as concrete<br />
plasticizers, deferrers and curing agents. these facilitate a<br />
simple and efficient processing of concrete, and increase<br />
the stability and durability of concrete structures. our<br />
Smart dynamic construction concept is an example of<br />
energy-efficient and economical construction: the system<br />
solution for highly fluid, self-compacting concrete saves<br />
energy and labor, as mechanical compacting is no longer<br />
necessary. in addition, we produce and market construction<br />
systems that help to protect and repair concrete constructions.<br />
our portfolio includes tile adhesives, mortar,<br />
water-proofing and thermal-insulation, as well as, for<br />
sports and industrial flooring such as our brand ucrete ® .<br />
these are extremely resistant to mechanical, chemical and<br />
thermal impact, thus meet the highest standards, for<br />
example, for pharmaceutical and food production.<br />
the coatings division is among the world’s largest<br />
providers of innovative and environmentally friendly coatings<br />
solutions for automotive and industrial applications.<br />
our brands glasurit ® and R-M ® for the car refinish business<br />
make us successful in the premium segment worldwide.<br />
in South america, we are one of the leading manufacturers<br />
of architectural coatings, with an excellent market<br />
position of our brand Suvinil ® .<br />
Research and development<br />
We have a worldwide unique research platform in the<br />
catalysts division and are strengthening our leading technological<br />
position through continued process and product<br />
innovations. our focus is on meeting stricter exhaust gas<br />
emission norms and on increasing efficiency. one of the<br />
division’s innovations are the new metal-zeolite-catalysts<br />
for use in diesel powered vehicles.<br />
PROducts<br />
• catalysts: automotive and process catalysts<br />
• construction chemicals: concrete admixtures and<br />
construction systems<br />
• coatings: innovative and eco-friendly coatings solutions<br />
for automotive and industrial applications, and<br />
architectural coatings<br />
BasF RePORt <strong>2008</strong><br />
69
70<br />
ManageMent’s analysis<br />
The Business Year at <strong>BASF</strong> <strong>BASF</strong>’s segments/Functional Solutions<br />
napHTHaMax<br />
Highly effective catalyst<br />
Conversion of crude<br />
oil into gasoline and<br />
other fuels<br />
VALUE FOR <strong>BASF</strong><br />
€900<br />
million market potential for<br />
gas oil cracking catalysts<br />
ReseaRch and deVelOPMent<br />
• Worldwide unique platform for catalysis research in<br />
the catalysts division<br />
• Focus on sustainability and cost and energy efficiency<br />
in construction chemicals<br />
• new solutions for integrated processes, eco-efficient<br />
coatings, as well as highly scratch-resistant clearcoats<br />
in the coatings division<br />
BasF RePORt <strong>2008</strong><br />
Higher fuel yield<br />
VALUE FOR THE CUSTOMER<br />
2-3%<br />
higher fuel yield<br />
Fluid cracking catalysts split the heavy molecules of crude oil<br />
into lighter compounds which are the basis for gasoline and<br />
other fuels. NaphthaMax ensures higher product yield without<br />
producing more unwanted by-products. Numerous experiments<br />
have shown that refineries can increase their fuel<br />
yield by 2 to 3% and therefore produce more economically.<br />
construction chemicals orients its research and development<br />
activities towards customers’ needs and the megatrends<br />
in the construction industry. Sustainability, cost and<br />
resource efficiency are the focus of the division’s research.<br />
Key topic areas are polymers, reactive resins, new formulations<br />
and tailor-made system solutions as well as mineralogy<br />
and nanotechnology.<br />
in the coatings division, we are developing new solutions<br />
for integrated coatings processes, eco-efficient coatings,<br />
as well as highly scratch-resistant clear coats in close<br />
collaboration with our customers in the automotive industry.<br />
additional research topics include improved products<br />
for rapidly growing applications such as wind turbine farms<br />
as well as for fulfilling higher ecological requirements, for<br />
example developing chrome-free coatings for industrial<br />
uses.<br />
Marketing and customer relations<br />
our customer portfolio is highly diversified and ranges<br />
from large customers in the automotive, construction and<br />
chemical industries, to medium-sized regional customers<br />
and to small businesses, such as car repair shops. our<br />
business models and sales channels are aligned with the<br />
needs of the specific customer groups and market segments.<br />
We service our major customers individually and<br />
offer them customer-specific research and development<br />
activities and technical services. in <strong>2008</strong>, for example, the<br />
coatings division opened a new color design Studio in<br />
Münster, germany, enabling us to identify and present the<br />
future trends in the coatings industry with our partners<br />
from the automotive sector at an early stage.<br />
MaRketing and custOMeR<br />
RelatiOns<br />
• our broad customer portfolio comprises major customers<br />
from the automotive, construction and chemical<br />
industry as well as medium-sized regional customers<br />
• business models and sales channels aligned with<br />
needs of the specific customers groups and segments<br />
• individual customer services and customer-specific<br />
development activities and technical services for<br />
major customers
capital expenditures<br />
ManageMent’s analysis<br />
The Business Year at <strong>BASF</strong> <strong>BASF</strong>’s Segments/Functional Solutions<br />
Location Project Startup<br />
chennai, india expansion of mobile emissions catalysts <strong>2008</strong><br />
deMeern, the netherlands expansion of chemical catalysts <strong>2008</strong><br />
guaratinguetá, brazil construction of concrete admixtures <strong>2008</strong><br />
Huntsville, alabama expansion of mobile emissions catalysts <strong>2008</strong><br />
calcutta, india construction of concrete admixtures <strong>2008</strong><br />
Moscow, Russia construction of mobile emissions catalysts 2009<br />
Münster, germany expansion of water-based finishes 2009<br />
Pasadena, texas, and tarragona, Spain expansion of polyolefin catalysts <strong>2008</strong><br />
Pavlovsky Posad, Russia construction of automotive coatings <strong>2008</strong><br />
Shanghai, china expansion of mobile emissions catalysts 2009<br />
Shandong, china construction of concrete admixtures <strong>2008</strong><br />
Wuhan, china construction of concrete admixtures <strong>2008</strong><br />
Würzburg, germany expansion of water-based finishes 2009<br />
sales Functional solutions (million €)<br />
10,000<br />
7,500<br />
5,000<br />
2,500<br />
0<br />
5,906<br />
2006<br />
9,491<br />
2007<br />
9,388<br />
<strong>2008</strong><br />
income from operations Functional solutions (million €)<br />
500<br />
375<br />
250<br />
125<br />
0<br />
338<br />
2006<br />
434<br />
2007<br />
151<br />
<strong>2008</strong><br />
BasF RePORt <strong>2008</strong><br />
71
72<br />
ManageMent’s analysis<br />
The Business Year at <strong>BASF</strong> <strong>BASF</strong>’s Segments/Functional Solutions<br />
segment data Functional solutions (million €)<br />
BasF RePORt <strong>2008</strong><br />
<strong>2008</strong> 2007 change in %<br />
Sales to third parties 9,388 9,491 (1.1)<br />
thereof catalysts 4,729 4,804 (1.6)<br />
construction chemicals 2,163 2,100 3.0<br />
coatings 2,496 2,587 (3.5)<br />
intersegmental transfers 147 141 4.3<br />
Sales including intersegmental transfers 9,535 9,632 (1.0)<br />
income from operations before depreciation and amortization (ebitda) 564 876 (35.6)<br />
income from operations (ebit) before special items 265 557 (52.4)<br />
income from operations (ebit) 151 434 (65.2)<br />
income from operations (ebit) after cost of capital (750) (401) (87.0)<br />
ebitda in percent of sales 6.0 9.2 –<br />
assets 8,693 8,730 (0.4)<br />
Research and development expenses 186 181 2.8<br />
additions to property, plant and equipment and intangible assets 234 315 (25.7)<br />
as a result of the significant decline in demand and<br />
negative currency effects, sales to third parties<br />
declined slightly by 1.1% to €9,388 million (volumes<br />
–3%, prices 6%, currencies –4%). income from operations<br />
decreased by €283 million to €151 million. this<br />
was primarily due to the drastic decline in demand<br />
from our key customer industries – construction and<br />
automotive – and higher raw material costs, which<br />
negatively impacted margins.<br />
in 2009, we expect the market environment to remain<br />
difficult in the automotive and construction industries;<br />
as a result, we anticipate a slight decline in sales. We<br />
aim to increase income from operations.<br />
Factors influencing sales – Functional solutions<br />
Volumes<br />
Prices<br />
Currencies<br />
Sales<br />
–4%<br />
–3%<br />
–1%<br />
0% 3% 6%<br />
6%<br />
catalysts<br />
at €4,729 million, sales to third parties almost matched the<br />
previous year’s level despite significant negative currency<br />
effects (volumes –4%, prices 8%, currencies –6%). Without<br />
these currency effects, sales would have increased<br />
by 4%.<br />
We increased sales of chemical and refinery catalysts.<br />
in <strong>2008</strong>, the market environment for automotive catalysts<br />
was difficult due to the dramatic decline in automotive<br />
production, in particular in north america and europe.<br />
in contrast, we increased volumes and sales in emerging<br />
markets, particularly in asia Pacific. as a result of higher<br />
average prices for precious metals, the Precious and<br />
base Metal Services unit increased its sales by 3% to<br />
€2,467 million.<br />
sales by division (million €)<br />
3<br />
2<br />
€9,388<br />
million<br />
1<br />
1 -- Catalysts: 50%<br />
2 -- Construction<br />
Chemicals: 23%<br />
3 -- Coatings: 27%
income from operations was below the previous year’s level,<br />
in particular due to negative currency effects and the<br />
especially weak market environment in the fourth quarter.<br />
Higher contributions from our business with chemical catalysts<br />
could not offset the significantly lower earnings from<br />
automotive catalysts.<br />
For 2009, we expect a significant decline in sales due<br />
to the lower precious metals prices. However, this will<br />
affect earnings only marginally. in addition, we expect a<br />
further deterioration in the market environment for automotive<br />
catalysts for 2009 and a probable decline in vehicle<br />
production in all regions compared with <strong>2008</strong>. We are,<br />
nevertheless, cautiously optimistic about profitably expan d-<br />
ing our business with process catalysts. overall, income<br />
from operations in 2009 will not reach the level posted in<br />
<strong>2008</strong>.<br />
catalysts -- sales by region (location of customer)<br />
3<br />
catalysts<br />
4<br />
€4,729<br />
million<br />
2<br />
1<br />
1 -- Europe: 38%<br />
2 -- North America: 33%<br />
3 -- Asia Pacific: 18%<br />
4 -- South America, Africa,<br />
Middle East: 11%<br />
construction chemicals<br />
in <strong>2008</strong>, sales to third parties increased slightly to<br />
€2,163 million due to higher prices (volumes –2%, prices<br />
5%, portfolio 2%, currencies –2%). We continued to grow<br />
in eastern europe and the Middle east as well as in large<br />
parts of asia. in contrast, in north america, Japan and<br />
Spain as well as in other important Western european markets,<br />
the very weak growth in the construction industry<br />
negatively impacted our business.<br />
• despite considerable negative currency effects, sales<br />
almost match previous year’s level<br />
• difficult market environment for vehicle catalysts as a<br />
result of significant decline in automobile production<br />
• income from operations declines in <strong>2008</strong><br />
• Sales and earnings decrease expected for 2009<br />
ManageMent’s analysis<br />
The Business Year at <strong>BASF</strong> <strong>BASF</strong>’s Segments/Functional Solutions<br />
income from operations declined significantly compared<br />
with the previous year and was negative. Higher raw material<br />
and transportation costs could not be passed on fully<br />
to customers due to the decline in business. Margins<br />
decreased.<br />
We started up new plants for the formulation of concrete<br />
admixtures in Shandong and Wuhan, china, and<br />
calcutta, india. We started up a new production facility for<br />
polymers in guaratinguetá, brazil.<br />
in addition, we acquired the concrete admixtures business<br />
of the chinese company, Kejie admixture Science &<br />
technology co. Ltd., a leading manufacturer of concrete<br />
admixtures in southern china.<br />
For 2009, we expect continued weak demand, particularly<br />
in north america and Western europe. in north<br />
america, the continuing crisis in residential construction<br />
is accompanied by the cyclical downturn in commercial<br />
construction projects. in Western europe, the global financial<br />
crisis will negatively impact industrial and residential<br />
construction in particular. We expect a better market environment<br />
in asia, South america, and the Middle east.<br />
However, a weaker growth dynamic in the construction<br />
industry is expected also in these regions. the impact of<br />
infrastructure investments contained in the economic stimulus<br />
packages announced in many countries will be felt<br />
at the end of 2009 at the earliest.<br />
in 2009, we expect higher sales and significantly higher<br />
earnings due to higher prices and margins as well as measures<br />
for optimizing fixed costs. in this difficult market<br />
environment, we aim to achieve larger volume growth<br />
primarily in asia and South america.<br />
cOnstRuctiOn cheMicals<br />
• Sales increase slightly due to growth in eastern<br />
europe, in the Middle east and in large parts of asia<br />
• Very difficult market environment in the united States,<br />
Japan, and many Western european countries<br />
• earnings decline significantly due to economic environment<br />
and lower margins; special charges from<br />
restructuring<br />
• 2009: growth in sales and earnings expected<br />
BasF RePORt <strong>2008</strong><br />
73
74<br />
ManageMent’s analysis<br />
The Business Year at <strong>BASF</strong> <strong>BASF</strong>’s Segments/Functional Solutions<br />
construction chemicals -- sales by division (location of customer)<br />
3<br />
2<br />
BasF RePORt <strong>2008</strong><br />
4<br />
€2,163<br />
million<br />
1<br />
1 -- Europe: 48%<br />
2 -- North America: 24%<br />
3 -- Asia Pacific: 16%<br />
4 -- South America, Africa,<br />
Middle East: 12%<br />
coatings<br />
at €2,496 million, sales to third parties were below the previous<br />
year’s level (volumes –3%, prices 2%, portfolio –1%,<br />
currencies –2%).<br />
Strong growth in architectural coatings in South america<br />
could not offset the declines in other regions and business<br />
sectors, in which demand fell significantly, especially<br />
in the fourth quarter. a dramatic deterioration in the market<br />
environment in the automotive and construction industries<br />
as well as negative currency effects resulted in a decline in<br />
sales in north america. in europe and asia too, weak volumes<br />
in the automotive industry led to lower sales of automotive<br />
coatings.<br />
Sales decreased slightly in the automotive refinish<br />
coatings business unit. the steady demand for coatings<br />
for tractors and other agricultural vehicles in europe as<br />
well as the expansion of the business for our brands glasurit<br />
® and Salcomix ® could not completely offset the negative<br />
currency effects, particularly in north america.<br />
as a result of weaker performance in north america<br />
and a decline in coil coatings in europe in the fourth quarter,<br />
sales for industrial coatings declined slightly. growth<br />
in coatings for wind turbine farms could not offset the<br />
downturn.<br />
cOatings<br />
our architectural coatings business in South america grew<br />
faster than the strongly growing market and we were able<br />
to increase our market share.<br />
income from operations declined compared with 2007<br />
due to the overall decrease in sales as a result of the crisis<br />
in the automotive industry, which intensified dramatically in<br />
the fourth quarter of the year, and the continued pressure<br />
on margins resulting from higher raw material costs.<br />
Special items were at the previous year’s level and<br />
resulted from restructuring in north america, asia and<br />
europe, as well as the sale of our coil coatings business in<br />
north america. We will shut down the production plant in<br />
decatur, alabama in the second half of 2009 and the Plastisol<br />
plant in belvidere, new Jersey, at the end of 2010.<br />
these plants were not purchased by the acquirer. With<br />
these measures and the start up of our new manufacturing<br />
site in Pavlovsky Posad, Russia, we are reacting to changes<br />
in the regional distribution of demand.<br />
For 2009, we expect a decline in production in the<br />
automotive industry and an overall weaker consumer<br />
demand. this will result in a decline in sales. income from<br />
operations will slightly improve due to our planned restructuring<br />
measures. We will continue to expand our presence<br />
in the growth regions of eastern europe and asia, particularly<br />
in Russia, china and india.<br />
coatings -- sales by region (location of customer)<br />
3<br />
4<br />
2<br />
€2,496<br />
million<br />
• Lower sales, in particular due to the sharp drop in demand of the automotive industry<br />
and the construction sector in north america<br />
• earnings below previous year’s level due to lower volumes and margins<br />
• For 2009, lower sales and slight increase in earnings expected<br />
1<br />
1 -- Europe: 49%<br />
2 -- North America: 16%<br />
3 -- Asia Pacific: 13%<br />
4 -- South America, Africa,<br />
Middle East: 22%
agRicultuRal sOlutiOns<br />
development of innovative active ingredients and solutions<br />
the agricultural solutions segment consists of the crop<br />
Protection division. We develop and produce innovative<br />
active ingredients and formulations for the improvement<br />
of crop quality and yields, and market them worldwide.<br />
crop Protection<br />
strategy<br />
in the crop Protection division we grow through innovation.<br />
our focus is on the continuous development of new solutions<br />
to optimally address the needs of our customers. We<br />
concentrate on high value markets and applications and<br />
strategically optimize our portfolio.<br />
innovation is decisive for our success. For us, this<br />
means the constant development and supply of new and<br />
improved active ingredients. We achieve this through continued<br />
investments in our product pipeline. in addition, we<br />
focus on the research and development of new formulations.<br />
Successful growth for us also entails identifying and<br />
utilizing the potential of new business models as well as<br />
crop Protection Pipeline<br />
active ingredients launched on the market<br />
F500 (F), boscalid (F) crops, specialty crops<br />
titrosulfuron (H) crops<br />
chlorfenapyr (i) Pest control<br />
active ingredients/projects in market launch<br />
dimoxystrobin (F), metrafenone (F), orysastrobin (F) crops, specialty crops<br />
topramezone (H), F500 fungicide seed treatment (F) crops<br />
Metaflumizone (i) Specialty crops<br />
active ingredients/projects in development<br />
2 fungicides crops, specialty crops, seed treatment<br />
1 herbicide, 2 herbicide tolerance projects crops<br />
1 insecticide Pest control<br />
stRategy and PROducts<br />
• Leading position due to innovative portfolio and continuous<br />
development of new active ingredients and<br />
formulations<br />
• our products are fungicides, insecticides, herbicides,<br />
seed treatments and applications in the non-agricultural<br />
sector<br />
• Plant Health concept: Product Headline is the leader in<br />
the u.S. in corn (maize) and soybean markets<br />
ManageMent’s analysis<br />
The Business Year at <strong>BASF</strong> <strong>BASF</strong>’s Segments/Agricultural Solutions<br />
tapping into new market segments, where appropriate also<br />
through acquisitions.<br />
Our Products<br />
our products and services make us a reliable partner of<br />
the farming industry. our products contribute to improving<br />
plant health and the yields of crops and add value to nonagricultural<br />
applications, such as pest control in buildings.<br />
our innovative portfolio of fungicides, insecticides, herbicides<br />
and seed treatments make us a leader in crop protection.<br />
We develop new markets in close partnership with<br />
our customers and on the basis of our in-depth knowledge<br />
of plant physiology and our innovative portfolios. increasing<br />
yields, for example, is the goal of our newly developed<br />
Plant Health market segment. our product Headline ® , with<br />
which we became market leader in the u.S. corn (maize)<br />
and soybean fungicide market in <strong>2008</strong>, belongs to this<br />
market segment. Headline contains the active ingredient<br />
F500 ® , which is not only used for corn and soybean, but<br />
also for numerous other crops.<br />
Market segments total peak sales potential<br />
ReseaRch and deVelOPMent<br />
€1,400 million<br />
€700 million<br />
total €2,100 million<br />
(F): Fungicides (H): Herbicides (i): insecticides<br />
• <strong>2008</strong>: €325 million for research and development<br />
• Pipeline with peak sales potential of €2,100 million<br />
• Four new active ingredients and two herbicide tolerant<br />
projects in development phase<br />
• Successful development of boscalid, market potential<br />
significantly expanded from new mixtures with other<br />
active ingredients<br />
BasF RePORt <strong>2008</strong><br />
75
76<br />
ManageMent’s analysis<br />
The Business Year at <strong>BASF</strong> <strong>BASF</strong>’s Segments/Agricultural Solutions<br />
4,000<br />
3,000<br />
2,000<br />
1,000<br />
HeadLIne FungICIde<br />
Innovative active ingredient<br />
VALUE FOR <strong>BASF</strong><br />
no. 1<br />
in the U.S. corn and<br />
soybean market<br />
sales agricultural solutions 1 (million €)<br />
0<br />
3,079<br />
2006<br />
BasF RePORt <strong>2008</strong><br />
Better quality,<br />
easier harvest<br />
VALUE FOR THE CUSTOMER<br />
6-10%<br />
more yield<br />
F500, the active ingredient contained in Headline simultaneously<br />
fights fungal diseases and strengthens plant health. In addition<br />
to improved quality, it also leads to a considerable increase<br />
in yields. With Headline, we are the market leader in the United<br />
States and are continuing to expand our position worldwide.<br />
In Brazil, we successfully launched our new umbrella brand<br />
AgCelence.<br />
F500 is the centerpiece of our Plant Health concept. We<br />
aim to continue expanding this concept worldwide. in<br />
South america, we successfully introduced agcelence,<br />
our umbrella brand for Plant Health, in <strong>2008</strong>.<br />
3,137<br />
2007<br />
3,409<br />
<strong>2008</strong><br />
1 Sales, earnings and all additional data of baSF Plant Science are not<br />
included in the agricultural Solutions segment but reported in “other.”<br />
Research and development<br />
We make targeted investments to identify novel active ingredients<br />
at an early stage and to accelerate the time to<br />
market of our research and development projects. in <strong>2008</strong>,<br />
research and development expenditures were €325 million.<br />
as a percentage of sales, this amounts to 9.5%. our pipeline<br />
currently has a peak sales potential of €2,100 million.<br />
of this, €700 million relates to our future product innovations.<br />
a total of €1,400 million relates to active ingredients<br />
launched since 2002 with which we have achieved approximately<br />
70% of the peak sales potential in <strong>2008</strong>.<br />
once again the fungicide boscalid performed strongly<br />
in <strong>2008</strong>. its market potential has been expanded significantly<br />
due to new mixtures with other active ingredients.<br />
We intend to achieve annual sales considerably above<br />
€250 million with boscalid.<br />
currently, we are working on the development of four<br />
new active ingredients and two new herbicide tolerance<br />
projects. the new herbicide Kixor tM is especially promising.<br />
this active ingredient demonstrates excellent performance<br />
against hard-to-control weeds in important crops.<br />
Simultaneously, Kixor will play a significant role in successfully<br />
combating weeds that are resistant to glyphosate.<br />
in future, we aim to achieve annual sales of over<br />
€100 million with Kixor. the launch in the united States<br />
is scheduled for 2009.<br />
Marketing and customer Relations<br />
innovative, high-value products and services as well as<br />
strong local competence are key factors for the good partnership<br />
with our customers. We supply farmers in the key<br />
agricultural markets europe, north america, brazil, argen-<br />
tina and Japan via a global network of trading partners.<br />
income from operations agricultural solutions 1 (million €)<br />
800<br />
600<br />
400<br />
200<br />
0<br />
472<br />
2006<br />
516<br />
2007<br />
705<br />
<strong>2008</strong><br />
1 Sales, earnings and all additional data of baSF Plant Science are not<br />
included in the agricultural Solutions segment but reported in “other.”
investments<br />
in <strong>2008</strong>, we invested €196 million. our single largest project<br />
is the investment into production capacity for our new<br />
herbicide Kixor. to fully satisfy the high demand for our<br />
innovative crop protection products in the future, we have<br />
made available €150 million on expanding capacity for important<br />
products in <strong>2008</strong>. this pertains especially to F500,<br />
fipronil, boscalid and metazachlor. this capacity will come<br />
on stream in 2010 at the latest. the majority of the capital<br />
expenditures will be incurred in 2009.<br />
BasF Plant science<br />
Plant biotechnology at BasF<br />
baSF Plant Science is an international research and technology<br />
Verbund with over 700 employees at eight sites in<br />
europe and north america. in addition, we maintain numerous<br />
cooperations with research institutes, universities<br />
and biotechnology companies. between 1998 and <strong>2008</strong>,<br />
baSF invested around €1 billion in total in plant biotechnology.<br />
We are one of the world’s leading companies in the<br />
field of plant biotechnology research and development.<br />
We will shape this attractive market of the future with our<br />
high-performance technology platform and an extensive<br />
project portfolio.<br />
strategy<br />
We concentrate on the second and third generation of<br />
genetically optimized plants, especially for more efficient<br />
agriculture, healthier nutrition and for use as renewable raw<br />
materials. Plant biotechnology is a controversial topic in<br />
europe and we take our social responsibility seriously. the<br />
baSF Plant Science strategy is to develop products with<br />
clear benefits for consumers and the environment with the<br />
help of plant biotechnology. through close dialogue with<br />
inVestMents<br />
• investments of €196 million in <strong>2008</strong><br />
• Largest single project: Production capacity for our new<br />
herbicide Kixor<br />
• expansions of existing production capacity started,<br />
mainly for F500, Fipronil, boscalid and Metazachlor<br />
ManageMent’s analysis<br />
The Business Year at <strong>BASF</strong> <strong>BASF</strong>’s Segments/Agricultural Solutions<br />
farmers, politicians and consumers, we inform the public on<br />
the benefit of the processes and products used at an early<br />
stage.<br />
Research and development<br />
in our long-term cooperation with Monsanto, we are jointly<br />
developing crops with higher yields and greater resistance<br />
to adverse environmental conditions, such as drought. the<br />
joint pipeline includes programs for the most important<br />
crops worldwide - corn (maize), soybeans, cotton and<br />
canola (oil-seed rape). this year, the research and development<br />
results far exceeded expectations.<br />
For the most advanced project, the drought-tolerant<br />
corn (maize) product, data for the regulatory process is already<br />
being collected. the first corn plants are scheduled<br />
to be launched from 2012 onward. these research activities<br />
are being supported in particular by our subsidiaries<br />
cropdesign in belgium and Metanomics in berlin, germany.<br />
We have expanded our activities in asia through cooperations<br />
in china, South Korea and taiwan. the focus is on<br />
increasing yields and the stress tolerance of rice and corn<br />
(maize).<br />
an additional product from our pipeline is the starch<br />
potato amflora ® . this renewable raw material offers advantages<br />
for the entire value chain from the farmer to industrial<br />
processing. amflora has been going through the european<br />
union’s approval process since 1996. on July 24, <strong>2008</strong>,<br />
baSF Plant Science filed an action with the european<br />
court of First instance against the e.u. commission for<br />
failure to act.<br />
BasF Plant science<br />
• international research and technology Verbund with<br />
eight sites in europe and north america<br />
• cooperation with research institutes, universities and<br />
biotechnology companies, in particular with Monsanto<br />
• investments of approximately €1 billion between 1998<br />
and <strong>2008</strong><br />
BasF RePORt <strong>2008</strong><br />
77
78<br />
ManageMent’s analysis<br />
The Business Year at <strong>BASF</strong> <strong>BASF</strong>’s Segments/Agricultural Solutions<br />
segment data agricultural solutions 1 (million €)<br />
BasF RePORt <strong>2008</strong><br />
<strong>2008</strong> 2007 change in %<br />
Sales to third parties 3,409 3,137 8.7<br />
intersegmental transfers 28 19 47.4<br />
Sales including intersegmental transfers 3,437 3,156 8.9<br />
income from operations before depreciation and amortization (ebitda) 905 718 26.0<br />
income from operations (ebit) before special items 706 526 34.2<br />
income from operations (ebit) 705 516 36.6<br />
income from operations (ebit) after cost of capital 264 84 214.3<br />
ebitda in percent of sales 26.5 22.9 –<br />
assets 4,352 4,157 4.7<br />
Research and development expenses 325 328 (0.9)<br />
additions to property, plant and equipment and intangible assets 196 83 136.1<br />
1 Sales, earnings and all other data of baSF Plant Science are not included in the agricultural Solutions segment but reported in “other.”<br />
in <strong>2008</strong>, sales to third parties rose by €272 million to<br />
€3,409 million compared to the previous year. income<br />
from operations increased to the record high of €705<br />
million.<br />
in 2009, we aim to further improve our sales and<br />
earnings despite a difficult market environment.<br />
crop Protection<br />
For the crop Protection division, <strong>2008</strong> was a record year in<br />
which we again increased sales and earnings. Sales to<br />
third parties were €3,409 million. as a result of higher sales<br />
volumes and prices, negative currency effects were more<br />
than offset (volumes 10%, prices 4%, currencies –5%). in<br />
the course of the financial crisis, the price level for important<br />
agricultural products such as corn (maize), soybeans<br />
and cereals began to decline in the second half of <strong>2008</strong>.<br />
Prices, nevertheless, were significantly above the historical<br />
average throughout <strong>2008</strong>. this led to a high demand for<br />
our innovative crop protection products worldwide.<br />
Factors influencing sales – agricultural solutions<br />
Volumes<br />
Prices<br />
Currencies<br />
Sales<br />
–5%<br />
0%<br />
4%<br />
6% 12%<br />
9%<br />
10%<br />
Sales to customers in europe increased by 7.5% to<br />
€1,544 million. good cultivation conditions and increased<br />
use of crop protection products, in particular our innovative<br />
cereal fungicides, contributed to this growth. our business<br />
in the specialty crops segment also performed well.<br />
We again recorded a strong sales increase in the growth<br />
markets of central and eastern europe.<br />
at €781 million, sales in north america were below the<br />
previous year’s level. negative currency effects, in particular<br />
the weak annual average for the u.S. dollar, significantly<br />
impacted sales in this region. in addition, our business with<br />
non-crop applications in the united States declined due to<br />
the real estate crisis. this was largely offset by very strong<br />
growth with our product Headline in our newly created<br />
Plant Health market segment. adjusted for currency<br />
effects, sales were significantly above the previous year’s<br />
level.<br />
FactORs inFluencing sales<br />
• europe: good cultivation conditions boost sales<br />
growth<br />
• north america: Significant negative currency effects<br />
partly offset by product line Headline<br />
• asia: increase of sales due to higher sales volumes<br />
• South america: new record high driven by expansion<br />
of our product portfolio
in asia, we increased sales by 15.8% to €315 million, primarily<br />
as a result of higher sales volumes. in Japan, we<br />
were particularly successful with our rice fungicide arashi ® ,<br />
and in india with our soybean herbicide Pursuit ® .<br />
at €769 million, sales in South america increased by<br />
20.2% compared with 2007. this strong performance<br />
was supported by the successful launch of products under<br />
our plant health umbrella brand agcelence as well as the<br />
expansion of our portfolio to include additional crops. in<br />
addition, we profited from the continued increase in the<br />
cultivation of sugarcane for the production of bioethanol.<br />
income from operations increased to a new record<br />
high. at 26.5%, the ebitda margin exceeded our target of<br />
25%. in achieving this, we benefited from our “value over<br />
volume” strategy. expenditures for marketing activities<br />
were increased.<br />
the acquisition of Sorex group was finalized toward<br />
the end of <strong>2008</strong>. through this acquisition, we are strengthening<br />
our business in north america and europe in the<br />
general insect control segment, which is expected to grow<br />
faster than the market in the long term. Sorex has extensive<br />
expertise with regard to formulation technology. combined<br />
with our portfolio of innovative active ingredients and<br />
our global market presence, we will be able to offer our<br />
customers even better solutions for professional pest management.<br />
total assets increased to €4,352 million. this was primarily<br />
due to the acquisition of the Sorex group and the<br />
rise in inventories. due to strong volume growth in <strong>2008</strong><br />
and in anticipation of continued high demand at the start of<br />
the season in north america and europe, we want to guarantee<br />
the optimal availability of our products. We reduced<br />
the level of receivables thanks to strict manage ment.<br />
cROP PROtectiOn<br />
ManageMent’s analysis<br />
The Business Year at <strong>BASF</strong> <strong>BASF</strong>’s Segments/Agricultural Solutions<br />
For 2009, we expect a less favorable market environment<br />
compared with <strong>2008</strong> due to the difficult economic situation<br />
worldwide. in anticipation of good seasonal conditions,<br />
continued positive price trends for agricultural commodities<br />
and more favorable exchange rates, we nevertheless<br />
aim to improve sales and earnings.<br />
crop Protection -- sales by region (location of customer)<br />
3<br />
4<br />
2<br />
€3,409<br />
million<br />
crop Protection -- sales by indication<br />
2<br />
3<br />
€3,409<br />
million<br />
• in <strong>2008</strong>, record high in sales and earnings<br />
• Higher sales volumes and prices more than offset negative currency effects<br />
• Strong sales growth in europe, South america and asia; Sales in north america almost<br />
match the level of the previous year<br />
• income from operations in <strong>2008</strong> significantly above the previous year’s level<br />
• ebitda margin reaches record high of 26.5%<br />
• For 2009 we aim to achieve further growth of sales and earnings<br />
1<br />
1<br />
1 -- Europe: 45%<br />
2 -- North America: 23%<br />
3 -- Asia Pacific: 9%<br />
4 -- South America, Africa,<br />
Middle East: 23%<br />
1 -- Fungicides: 46%<br />
2 -- Herbicides: 33%<br />
3 -- Insecticides and other: 21%<br />
BasF RePORt <strong>2008</strong><br />
79
80<br />
ManageMent’s analysis<br />
The Business Year at <strong>BASF</strong> <strong>BASF</strong>’s Segments/Oil & Gas<br />
Oil & gas<br />
exploration and production of oil and natural gas;<br />
trading, transport and storage of natural gas<br />
BasF’s oil and gas activities are bundled in the Winters -<br />
hall group. Wintershall and its subsidiaries operate in<br />
the business sectors exploration & Production and<br />
natural gas trading.<br />
segment strategy<br />
in the exploration and production of oil and natural gas,<br />
we focus on oil and gas-rich regions in europe, north<br />
africa and South america as well as Russia and the caspian<br />
Sea region. in addition to investments into the exploration,<br />
development and production of hydrocarbons, the<br />
extension of technological know-how, secures our future<br />
success.<br />
the growing demand for natural gas in Western europe<br />
coupled with the decline in domestic gas production<br />
means that in the future natural gas will have to be imported<br />
into europe in even greater amounts. this opens up opportunities<br />
for both our business sectors which we utilize<br />
in our concept “gas for europe.” We explore for and produce<br />
natural gas in europe and its proximity and also help<br />
to construct the linking infrastructure to deliver the gas to<br />
customers in europe. We contribute to supply security<br />
in germany and in europe through our pipeline network<br />
operations and the expansion of strategically positioned<br />
gas transportation and storage facilities.<br />
Wintershall pursues its own research and development<br />
activities in selected technology areas. the thematic focus<br />
is on increasing the quality of exploration methods, higher<br />
recovery rates from existing deposits, and the development<br />
of technologies for reservoirs with difficult production<br />
conditions. in the foreground of technological development<br />
is the use of synergies with the baSF group’s research<br />
competence. this is how Wintershall, in the competition<br />
for access to oil and natural gas resources, can fortify its<br />
position as a partner with outstanding technological competence.<br />
Oil & gas<br />
BasF RePORt <strong>2008</strong><br />
exploration & Production<br />
europe: the Mittelplate oil field in the north Sea tidal flats<br />
is the cornerstone of our oil production in germany. it is<br />
the country’s largest known oil deposit. Wintershall and<br />
RWe-dea each hold a 50% stake in this field. Wintershall<br />
is one of the largest producers of natural gas in the southern<br />
sector of the north Sea, producing approximately<br />
1.9 billion cubic meters annually. We operate 26 platforms<br />
there, of which 18 are centrally controlled by one of the<br />
most modern radio control systems in the world. this<br />
monitoring system makes a major contribution to the<br />
future economical production of small and medium-sized<br />
deposits.<br />
in <strong>2008</strong>, we acquired stakes in eight exploration licenses<br />
in norway. Seismic surveys were conducted over an<br />
area of about 2,500 square kilometers in norwegian and<br />
dutch territorial waters.<br />
through the acquisition of Revus energy, Stavanger,<br />
norway, in december <strong>2008</strong>, Wintershall in addition participates<br />
in 47 licenses in norway and 21 licenses in the united<br />
Kingdom. With its high-quality exploration portfolio,<br />
Revus ideally complements our activities in this region.<br />
Russia and the caspian sea Region: baSF concluded<br />
a cooperation agreement with gazprom for joint field<br />
development in Siberia, Russia. through Severneftegazprom,<br />
Wintershall has an interest of 35% in the economic<br />
rewards of the Yuzhno Russkoye natural gas field in western<br />
Siberia. its development is progressing ahead of<br />
schedule: at year end <strong>2008</strong>, 106 of a total of 142 planned<br />
production wells were already operational. in the first half<br />
of 2009, we expect to already have reached a plateau production<br />
(100%) of 62 million cubic meters (V n) natural gas<br />
per day.<br />
• two business sectors: exploration & Production and natural gas trading, bundled in the Wintershall group<br />
• Success driven by investing in exploration and production and the extension of technological know-how<br />
• the “gas for europe” concept for long-term supply security in the gas trading business<br />
• Wintershall’s own research and development activities in selected technological areas to strengthen our position in<br />
the competition for the access to oil and natural gas resources
Wintershall holds a stake of 50% in the development of a<br />
section of the achimov formation in the urengoy field in<br />
Western Siberia. the startup of production in the summer<br />
of <strong>2008</strong> means that for the first time natural gas and condensate<br />
are being produced from this geologically complex<br />
formation. Four production wells and a gas treatment<br />
plant are currently operational. in the caspian Sea region,<br />
we are pursuing exploration projects in turkmenistan and<br />
azerbaijan.<br />
north africa/Middle east: in Libya, Wintershall operates<br />
eight onshore oil fields in the concessions 96 and 97 and<br />
exploits the associated gas released during crude oil production<br />
in a gas utilization plant for the local demand. gazprom<br />
is involved in these activities through its 49% stake<br />
in a german Wintershall subsidiary.<br />
in <strong>2008</strong>, the Libyan national oil corporation (noc)<br />
requested Wintershall to transform its existing concession<br />
agreements into exploration and Production Sharing<br />
agreements according to the ePSa-iV standard. the impact<br />
on relevant net income is dependent on the conclusion<br />
of the ongoing negotiations.<br />
in the exploration blocks in the Kufra basin in southern<br />
Libya, in which Wintershall operates and holds a 65%<br />
stake, seismic measurements were conducted over a total<br />
of approximately 3,500 kilometers.<br />
in addition, we hold a stake of 12.5% in the al Jurf<br />
offshore oil field in Libya operated by another company.<br />
during the drilling of a production well in april <strong>2008</strong>,<br />
an existing production well was damaged and production<br />
in the field had to be temporarily suspended. Production<br />
was resumed in december after repair has been finished.<br />
in Mauritania, we operate two onshore exploration<br />
blocks. in addition to the existing stakes in block 3 and 11,<br />
Wintershall in qatar, was awarded the license for the<br />
exploration block 4n in november <strong>2008</strong>. this block is<br />
exPlORatiOn & PROductiOn<br />
• cooperation with gazprom for the joint development<br />
of natural gas fields in Siberia, Russia<br />
• Production startup of achimgaz<br />
• quickly progressing development in the natural gas<br />
field Yuzhno Russkoye<br />
• Strengthening of the position in the north Sea through<br />
the acquisition of Revus energy<br />
ManageMent’s analysis<br />
The Business Year at <strong>BASF</strong> <strong>BASF</strong>’s Segments/Oil & Gas<br />
located close to the north Field, the largest natural gas<br />
field in the world. Wintershall also acquired a 20% stake in<br />
block 51 in oman.<br />
south america: in argentina, Wintershall has been active<br />
in the exploration and production of oil and natural gas<br />
for 30 years. in <strong>2008</strong>, Wintershall acquired stakes of 50%<br />
each in two exploration areas in the cañadón asfalto<br />
basin. in chile, we were awarded an exploration license<br />
for the otway block in the Magellan basin, close to our<br />
existing production facilities at tierra del Fuego.<br />
natural gas trading<br />
our natural gas trading business is operated with our partner<br />
gazprom via the WingaS group. We supply germany<br />
and several other european countries. the long-distance<br />
gas pipeline network operated by WingaS tRanSPoRt<br />
connects the markets in Western europe with a natural gas<br />
infrastructure that runs through eastern europe and the<br />
Russian Federation all the way to the gas fields in Siberia.<br />
the natural gas storage facility in Rehden, Lower Saxony,<br />
germany – with a working gas volume of over 4 billion<br />
cubic meters the largest of its kind in Western europe –<br />
and the Haidach natural gas storage facility in austria play<br />
further significant roles for WingaS’s activities.<br />
the planned construction of the nord Stream Pipeline<br />
through the baltic Sea to the german coast and its associated<br />
onshore projects for onward transport will decisively<br />
strengthen our natural gas infrastructure and improve supply<br />
security from the fourth quarter of 2011. the pipeline<br />
will transport additional natural gas volumes to europe<br />
and reduce transit risk. europe’s gas supply security will<br />
be sus tainably improved. Partners involved in the construction<br />
of the pipeline – and thus shareholders in nord<br />
Stream ag – besides gazprom, which holds a 51% stake –<br />
are e.on Ruhrgas and Wintershall with stakes of 20%<br />
natuRal gas tRading<br />
• expansion of natural gas infrastructure in germany<br />
and europe in cooperation with gazprom<br />
• Participation in the construction of the nord Stream<br />
pipeline running from Russia, through the baltic Sea<br />
to the german coast<br />
• Further expansion of storage capacity<br />
BasF RePORt <strong>2008</strong><br />
81
82<br />
ManageMent’s analysis<br />
The Business Year at <strong>BASF</strong> <strong>BASF</strong>’s Segments/Oil & Gas<br />
each, and n.V. nederlandse gasunie with a 9% stake. in<br />
<strong>2008</strong>, nord Stream ag, which is included in the baSF<br />
group consolidated Financial Statements using the equity<br />
method, continued with the authorization process and environmental<br />
assessments necessary for this project. the<br />
commissioning of the pipeline ostsee-Pipeline-anbindungs-Leitung<br />
(oPaL), in which WingaS has a stake of<br />
80% and e.on Ruhrgas 20%, is scheduled for 2011. the<br />
pipeline norddeutsche erdgasleitung (neL) is to be commissioned<br />
in 2012. Here, WingaS has a stake of 75% and<br />
e.on Ruhrgas 25%.<br />
our growth strategy is additionally supported by further<br />
expanding our storage capacity. the Saltfleetby natural<br />
gas storage facility in the united Kingdom is in the planning<br />
stage. initial construction work started on the<br />
Jemgum storage facility in germany and the second construction<br />
phase of the Haidach storage facility in austria is<br />
already being implemented.<br />
WingaS tRanSPoRt gmbH & co. Kg has appealed<br />
to the court against the decision of the german Federal<br />
network agency (bundesnetzagentur) to apply in the future<br />
cost-based tariff regulation to its long-distance pipelines in<br />
germany. these had previously been exempted.<br />
iMPORtant deVelOPMents in <strong>2008</strong><br />
• development of a section of the achimov formation in the urengoy gas and condensate field in Siberia, Russia<br />
• development of the cenoman formation in the Yuzhno Russkoye natural gas field<br />
• expansion of the Haidach natural gas storage facility in austria<br />
• acquisition of Revus energy aSa, Stavanger, norway<br />
BasF RePORt <strong>2008</strong><br />
ReMOTe COnTROLLed OpeRaTIOnS<br />
Efficient supervision of natural gas<br />
platforms<br />
Radio control from<br />
onshore<br />
VALUE FOR <strong>BASF</strong><br />
€2.6<br />
million saved per year<br />
VALUE FOR THE ENVIRONMENT<br />
35%<br />
fewer transportation and<br />
supply flights<br />
In the southern North Sea we centrally operate 18 natural<br />
gas platforms through one of the most modern radio control<br />
systems in the world. The number of helicopter flights for<br />
transportation and supply are significantly reduced through<br />
the centralization of supervisory and control functions. This<br />
has benefits for health, security and the environment.
capital expenditures<br />
Location Project<br />
Siberia, Russia achimgaz,<br />
development of the achimov formation in the urengoy<br />
natural gas and condensate field 1<br />
austria<br />
ManageMent’s analysis<br />
The Business Year at <strong>BASF</strong> <strong>BASF</strong>’s Segments/Oil & Gas<br />
additional annual<br />
capacity through<br />
expansion Startup<br />
70,000,000 boe 2, 3 <strong>2008</strong><br />
development of the cenoman formation in the Yuzhno<br />
Russkoye natural gas field 4 143,000,000 boe 5 2007 6<br />
expansion of the Haidach natural gas storage facility 7 2,400,000,000 m 3 8 2007/2011<br />
germany expansion of the compressor station Haiming 39,000,000 W 9 2007/2011<br />
construction of the nord Stream Pipeline through the<br />
baltic Sea 10 55,000,000,000 m 3 11 2011<br />
construction of the onshore pipeline link oPaL 12 and<br />
neL 13 to the nord Stream natural gas pipeline<br />
ca. 55,000,000,000 m 3 14 2011<br />
construction of the Jemgum natural gas storage facility 1,200,000,000 m 3 2013<br />
1 Joint venture company for the production of natural gas, in which Wintershall has a 50% stake and which is proportionally consolidated in the<br />
group consolidated Financial Statements<br />
2 boe = barrel oil equivalent<br />
3 total capacity in the plateau phase after 2015<br />
4 Joint venture company in which Wintershall has 35% of the economic rewards<br />
5 total capacity in the plateau phase from 2009 onward<br />
6 Participation and the start of production in 2007 is being continuously developed.<br />
7 natural gas storage facility, in which WingaS has a 33% stake, recorded as a jointly-controlled asset<br />
8 total capacity of the storage facility on completion of the second stage of expansion in 2011<br />
9 total performance of the compressor stations after the final expansion in 2011<br />
10 construction and operation by nord Stream ag, in which Wintershall has a 20% share and which is consolidated using the equity method<br />
11 total capacity after completion of both pipelines<br />
12 WingaS has a 80% stake in oPaL<br />
13 WingaS has a 75% stake in neL<br />
14 total capacity of oPaL and neL<br />
sales Oil & gas (million €)<br />
16,000<br />
12,000<br />
8,000<br />
4,000<br />
0<br />
10,687 10,517<br />
2006<br />
2007<br />
14,445<br />
<strong>2008</strong><br />
income from operations Oil & gas (million €)<br />
4,400<br />
3,300<br />
2,200<br />
1,100<br />
0<br />
3,265<br />
2006<br />
3,031<br />
2007<br />
3,844<br />
<strong>2008</strong><br />
BasF RePORt <strong>2008</strong><br />
83
84<br />
ManageMent’s analysis<br />
The Business Year at <strong>BASF</strong> <strong>BASF</strong>’s Segments/Oil & Gas<br />
segment data Oil & gas (million €)<br />
Oil & gas<br />
• Startup of natural gas and condensate production in the achimgaz joint venture<br />
• Successful development of the Yuzhno Russkoye natural gas field<br />
• new exploration licenses in germany, norway, argentina, qatar, oman and chile<br />
• Stake in nord Stream: continued with approval process for the pipeline through the baltic Sea,<br />
planning of the onshore connection (oPaL) carried forward<br />
• Libya: negotiations are being held to switch from concession contracts to exploration and<br />
production sharing agreements<br />
• acquisition of Revus energy to sustainably strengthen our long-term position in the north Sea<br />
BasF RePORt <strong>2008</strong><br />
<strong>2008</strong> 2007 change in %<br />
Sales to third parties 14,445 10,517 37.3<br />
thereof exploration & Production 5,308 4,365 21.6<br />
natural gas trading 9,137 6,152 48.5<br />
intersegmental transfers 1,235 1,189 3.9<br />
Sales including intersegmental transfers 15,680 11,706 33.9<br />
income from operations before depreciation and amortization (ebitda) 4,409 3,592 22.7<br />
thereof exploration & Production 3,744 2,901 29.1<br />
natural gas trading 665 691 (3.8)<br />
income from operations (ebit) before special items 3,844 3,031 26.8<br />
thereof exploration & Production 3,319 2,486 33.5<br />
natural gas trading 525 545 (3.7)<br />
income from operations (ebit) 3,844 3,031 26.8<br />
thereof exploration & Production 3,319 2,486 33.5<br />
natural gas trading 525 545 (3.7)<br />
income from operations (ebit) after cost of capital 1 1,271 1,260 0.9<br />
ebitda in percent of sales 30.5 34.2 –<br />
assets 8,356 7,057 18.4<br />
thereof exploration & Production 4,740 4,037 17.4<br />
natural gas trading 3,616 3,020 19.7<br />
exploration expenses 227 268 (15.3)<br />
additions to property, plant and equipment and intangible assets 1,651 2,280 (27.6)<br />
income taxes on oil-producing operations non-compensable with german<br />
corporate income tax<br />
net income 2 951 789 20.5<br />
1 non-compensable foreign income taxes for oil production are deducted.<br />
2 information on the net income of the oil & gas segment can be found in the Reconciliation oil & gas in the notes to the consolidated Financial Statements on<br />
page 177.<br />
1,851<br />
1,302<br />
42.2
in <strong>2008</strong>, sales to third parties increased by €3,928 million<br />
to €14,445 million (volumes 7%, prices/currencies<br />
28%, portfolio 2%). income from operations rose by<br />
€813 million to €3,844 million. net income increased by<br />
€162 million to €951 million.<br />
in 2009, as a result of economic developments,<br />
we expect both the oil price as well as the euro/dollar<br />
exchange rate to weaken significantly. We have based<br />
our planning on an oil price of $50 per barrel and an<br />
average euro/dollar exchange rate of $1.30 per euro.<br />
consequently, we expect an overall decrease of sales<br />
and earnings.<br />
More information on net income of the Oil & gas segment can be found in the<br />
notes to the consolidated Financial statements on page 177<br />
exploration & Production<br />
compared with 2007, sales increased by €943 million to<br />
€5,308 million. the average price of brent crude increased<br />
by approximately $25 to $97 per barrel. as a result of the<br />
weaker u.S. dollar against the euro over the course of the<br />
year, the price in euros increased by only €13 to €66 per<br />
barrel. crude oil and natural gas production rose by 16%<br />
to 130 million barrels of oil equivalent (boe). this includes<br />
minority interests from gazprom’s stake in a german Wintershall<br />
subsidiary that holds the Libyan concessions 96<br />
and 97. due to contractual and legal stipulations, no volumes<br />
from the achimgaz project are included.<br />
income from operations increased by €833 million to<br />
€3,319 million, primarily due to higher prices. in <strong>2008</strong>,<br />
earnings in the exploration & Production business sector<br />
included income taxes on oil production in north africa of<br />
€1,851 million that are non-compensable with german corporate<br />
income tax (2007: €1,302 million). these taxes are<br />
reported as income taxes. currently, negotiations are being<br />
held with the Libyan national oil corporation to switch<br />
Factors influencing sales – Oil & gas<br />
Volumes<br />
Prices/Currencies<br />
Portfolio<br />
Sales<br />
0%<br />
2%<br />
7%<br />
20% 40%<br />
28%<br />
37%<br />
ManageMent’s analysis<br />
The Business Year at <strong>BASF</strong> <strong>BASF</strong>’s Segments/Oil & Gas<br />
from concession contracts to exploration and production<br />
sharing agreements.<br />
in <strong>2008</strong>, 16 exploration and appraisal wells were drilled<br />
in the search for new oil and natural gas deposits, of which<br />
five were successful. We acquired stakes in exploration<br />
licenses in germany, norway, argentina, qatar, oman and<br />
chile. We replenished 116% of the volumes produced in<br />
<strong>2008</strong>. as part of the “gas for europe” strategy, we concentrate<br />
in particular on the expansion of natural gas reserves.<br />
Proven crude oil and natural gas reserves increased<br />
by 2% to 1,149 million boe compared with the end of<br />
2007. the reserve-to-production ratio of these reserves<br />
is 11 years (2007: 10 years). this is based on Wintershall’s<br />
share of production in <strong>2008</strong> and refers to the reserves at<br />
year end. these figures do not include the volumes from<br />
the achimgaz project.<br />
development of the Yuzhno Russkoye natural gas field,<br />
in which Wintershall has a share of 35% in the economic<br />
rewards through Severneftegazprom, is progressing faster<br />
than expected. at year end <strong>2008</strong>, 106 of a total of 142<br />
planned production wells were in operation. the projected<br />
plateau production from this field will be reached already<br />
in the first half of 2009.<br />
in 2009, we expect lower sales and earnings in the exploration<br />
and production business sector due to the lower<br />
oil price.<br />
sales by division (million €)<br />
2<br />
€14,445<br />
million<br />
1<br />
1 -- Exploration & Production: 37%<br />
2 -- Natural Gas Trading: 63%<br />
BasF RePORt <strong>2008</strong><br />
85
86<br />
ManageMent’s analysis<br />
The Business Year at <strong>BASF</strong> <strong>BASF</strong>’s Segments/Oil & Gas<br />
natural gas trading<br />
Sales to third parties increased by €2,985 million to<br />
€9,137 million. in total, natural gas volumes increased by<br />
13% to 417 billion kilowatt hours. WingaS grew in germany<br />
and abroad and increased sales volumes by approximately<br />
19% to 298.4 billion kilowatt hours. of this amount,<br />
approximately 13% was supplied to baSF group companies.<br />
income from operations declined by €20 million to<br />
€525 million. the significant increase in oil prices in the<br />
first half of the year led to a considerable decline in margins.<br />
this was due to the fact that purchase prices for natural<br />
gas are quickly adjusted to reflect oil prices, whereas<br />
sales prices can contractually only be adjusted after a<br />
time-lag of several months. the resulting negative impact<br />
was only partially offset by the recovery in margins in the<br />
fourth quarter and by an increase in volumes.<br />
our stake in nord Stream ag is a significant component<br />
of our growth strategy in natural gas trading. nord<br />
Stream is constructing a pipeline from Russia through the<br />
baltic Sea to the german coast. in <strong>2008</strong>, nord Stream advanced<br />
with the required authorization process in the relevant<br />
countries.<br />
onshore, work on the Jemgum storage facility and the<br />
planning for the pipeline ostsee-Pipeline-anbindungs-<br />
Leitung (oPaL) and the pipeline norddeutsche erdgasleitung<br />
(neL) continued as part of the nord Stream project.<br />
the oPaL pipeline is to run from greifswald, germany, to<br />
olbernhau, germany, on the czech-german border.<br />
in <strong>2008</strong>, a memorandum of intent was signed with gazprom<br />
to extend the existing main supply agreement to<br />
2043 before expiration of its term. For the next 35 years,<br />
natural gas trading secures more than 800 billion cubic<br />
meters of natural gas for europe.<br />
exPlORatiOn & PROductiOn natuRal gas tRading<br />
• Sales increase due to higher prices: average oil price<br />
in u.S. dollar significantly above previous year<br />
• increase reduced by weak average u.S. dollar<br />
• Production increased by 16% to 130 million boe<br />
• earnings above the level of the previous year<br />
• as a result of the lower oil price, decline in sales and<br />
earnings expected for 2009<br />
BasF RePORt <strong>2008</strong><br />
Volumes in natural gas trading will not reach the very good<br />
level achieved in <strong>2008</strong> as a result of the economic downturn.<br />
the significantly lower oil price will lead to a decline in<br />
sales in 2009. However, due to the time-lag in the adjustment<br />
of sales prices to purchase prices, we expect earnings<br />
to match the level of <strong>2008</strong>.<br />
Oil & gas -- sales by region (location of customer)<br />
23 4<br />
€14,445<br />
million<br />
1<br />
1 -- Europe: 96%<br />
2 -- North America: 1%<br />
3 -- Asia Pacific: 1%<br />
4 -- South America, Africa,<br />
Middle East: 2%<br />
• Significantly higher sales due to higher prices and volumes<br />
• Margins negatively impacted by contractually delayed<br />
adjustment of sales prices to the development in oil<br />
prices<br />
• income from operations declined slightly<br />
• For 2009, lower sales expected; earnings to match<br />
<strong>2008</strong> level
RegiOnal Results<br />
Regions (million €)<br />
europe<br />
in <strong>2008</strong>, companies in europe increased sales by 12.6% to<br />
€38,652 million. the economic situation in the region has<br />
deteriorated since the second half of <strong>2008</strong>. this development<br />
greatly intensified at the end of the year as a result of<br />
low consumer spending and significant export losses.<br />
in the chemicals segment, sales increased in all three<br />
divisions, in some significantly, although business declined<br />
in the fourth quarter.<br />
in the Plastics and Performance Products segments,<br />
sales matched the previous year’s level. the increase in<br />
sales during the first three quarters, which was significant<br />
in some businesses, was offset by the sizeable decline in<br />
business in the fourth quarter.<br />
Sales decreased in the Functional Solutions segment,<br />
in particular as a result of the drop in demand from the<br />
automotive and construction industries in the fourth quarter.<br />
the expansion of the business in eastern europe could<br />
not compensate for the decline in demand in Western<br />
europe.<br />
Sales in the agricultural Solutions segment increas ed<br />
due to higher volumes and prices.<br />
sales by region (location of company)<br />
(million €)<br />
3<br />
Sales<br />
by location of company<br />
<strong>2008</strong> 2007<br />
Sales<br />
by location of customer<br />
change<br />
in % <strong>2008</strong> 2007<br />
ManageMent’s analysis<br />
The Business Year at <strong>BASF</strong> Regional Results<br />
as a result of higher prices and volumes, sales in the oil &<br />
gas segment were significantly higher than in 2007.<br />
at €5,822 million, income from operations was substantially<br />
higher than in 2007. the oil & gas segment,<br />
which posted considerably higher earnings compared with<br />
the previous year, made the greatest contribution to the<br />
increase in earnings.<br />
We adapted structures and processes to changing<br />
market conditions in our project “Further development of<br />
the european organization,” which we successfully concluded<br />
in <strong>2008</strong>. in order for our service structures to<br />
remain competitive in the future, we have started additional<br />
projects in the past few months: they encompass our services<br />
in the areas of administration, procurement and production,<br />
and are parts of the global program neXt, which<br />
focuses on more excellence in the day-to-day business.<br />
We continued to expand our european Shared Services<br />
center (eSSc) in berlin, germany. Here, we combine<br />
finance and accounting functions as well as standard<br />
human resource services under one roof.<br />
income from operations by region<br />
(million €)<br />
income from operations<br />
(ebit)<br />
change<br />
in % <strong>2008</strong> 2007<br />
europe 38,652 34,316 12.6 36,693 32,347 13.4 5,822 5,415 7.5<br />
thereof germany 27,497 24,312 13.1 13,796 11,967 15.3 4,744 4,226 12.3<br />
north america 11,937 12,007 (0.6) 11,932 11,928 . 73 762 (90.4)<br />
asia Pacific 8,664 8,785 (1.4) 9,320 9,579 (2.7) 254 828 (69.3)<br />
South america, africa, Middle east 3,051 2,843 7.3 4,359 4,097 6.4 314 311 1.0<br />
4<br />
€62,304<br />
million<br />
2<br />
5<br />
1<br />
1 -- Germany: 44%<br />
2 -- Europe<br />
(excl. Germany): 18%<br />
3 -- North America: 19%<br />
4 -- Asia Pacific: 14%<br />
5 -- South America, Africa,<br />
Middle East: 5%<br />
change<br />
in %<br />
62,304 57,951 7.5 62,304 57,951 7.5 6,463 7,316 (11.7)<br />
2<br />
3 4<br />
5<br />
€6,463<br />
million<br />
1<br />
1 -- Germany: 73%<br />
2 -- Europe<br />
(excl. Germany): 17%<br />
Europe total: 90%<br />
3 -- North America: 1%<br />
4 -- Asia Pacific: 4%<br />
5 -- South America, Africa,<br />
Middle East: 5%<br />
BasF RePORt <strong>2008</strong><br />
87
88<br />
ManageMent’s analysis<br />
The Business Year at <strong>BASF</strong> Regional Results<br />
north america<br />
Sales by companies in north america declined by 0.6%<br />
to €11,937 million. in local-currency terms, sales increased<br />
by 7.8%.<br />
the economic environment and domestic demand in<br />
the region weakened significantly in the second half of<br />
<strong>2008</strong>. in addition, exports of industrial goods declined as a<br />
result of the strengthening of the u.S. dollar toward the<br />
end of the year. Sales declined due to lower demand as<br />
well as destocking at our customers.<br />
Sales in the Plastics, Performance Products and Functional<br />
Solutions segments declined as a result of the weakening<br />
automotive and construction industries. in the agricultural<br />
Solutions segment, sales in euro terms almost<br />
matched the previous year’s level due to higher sales prices<br />
and the strong demand for agricultural products.<br />
income from operations declined by 90.4% compared<br />
with the previous year to €73 million in <strong>2008</strong>. the main<br />
reasons for the decline in earnings were the significant<br />
decrease in prices and margins and the marked under-utilization<br />
of our production capacities due to the drop in business<br />
in the fourth quarter. the chemicals, Plastics and<br />
Functional Solutions segments were especially affected by<br />
this. Plant shutdowns – caused by two hurricanes on the<br />
u.S. gulf coast – and temporary unscheduled plant shutdowns<br />
also negatively impacted earnings in the chemicals<br />
and Plastics segments. the decline in earnings was partially<br />
offset by the good performance of the care chemicals<br />
division.<br />
Special items overall negatively impacted earnings: Special<br />
income resulted from the divestitures of the coil coatings<br />
business and the sale of the pharmaceuticals manufacturing<br />
business in Shreveport, Louisiana. Special charges<br />
resulted from the writedown of assets in the Styrenics business,<br />
costs for environmental protection measures, and<br />
costs associated with the sale of real estate.<br />
RegiOnal tRends<br />
BasF RePORt <strong>2008</strong><br />
Within the framework of the excellence program neXt, we<br />
initiated various measures in <strong>2008</strong>, for example, we<br />
implemented a new transportation management system.<br />
now, we can make the supply chain process more reliable<br />
and efficient as well as make the cost structures more<br />
transparent in order to facilitate future cost savings.<br />
in the fourth quarter, we intensified our cost-cutting<br />
measures in order to promptly reduce discretionary costs<br />
by 10% and to adjust personnel resources to the expected<br />
lower demand in 2009.<br />
asia Pacific<br />
companies in asia Pacific generated sales of €8,664 million,<br />
which was slightly below the previous year’s level.<br />
Sales in local-currency terms increased by 4%.<br />
as the global economic downturn progressed, the<br />
economy in the region decreased from the second quarter<br />
on. beginning in the third quarter, this development intensified<br />
with the slowdown in the chinese economy.<br />
Sales increased in the Performance Products, Functional<br />
Solutions and agricultural Solutions segments, in<br />
some businesses strongly. this positive development,<br />
however, was partially offset by the decline in sales in the<br />
chemicals and Plastics segments.<br />
income from operations declined substantially by<br />
€574 million to €254 million. this is largely due to weaker<br />
results in the chemicals, Plastics and Functional Solutions<br />
segments. Furthermore, our earnings were significantly impacted<br />
by special charges of €128 million. these comprised<br />
the restructuring of our coatings business, the<br />
shutdown of our butanediol/tHF plant in Korea as well as<br />
impairments of our plants for styrene monomer in Korea,<br />
and butanediol in Malaysia. the Performance Products<br />
and agricultural Solutions segments generated earnings<br />
growth.<br />
• europe: successful completion of the project “Further development of european organization”<br />
• north america: divestitures of the coil coatings business as well as the pharmaceutical manufacturing business in<br />
Shreveport, Louisiana<br />
• asia Pacific: continued strengthening of our R&d activities; project for increased efficiency at production sites as<br />
part of the neXt initiative<br />
• South america, africa, Middle east: FaRo initiative for identifying sales potential in strongly growing industries
Within the framework of our global excellence program<br />
neXt, we started a project to increase the efficiency of our<br />
production sites. by the end of 2010, we expect improvements<br />
amounting to €80 million.<br />
We still aim to achieve 70% of our sales in asia from<br />
local production by 2015. For this purpose, we intend to<br />
expand our Verbund site in nanjing, china, with our<br />
chinese partner Sinopec. in addition, we plan to build a<br />
new Mdi plant in the chongqing municipality, in Western<br />
china, with a capacity of 400,000 metric tons of crude<br />
Mdi per year.<br />
We are also intensifying our research and development<br />
activities in asia. For example, we opened a new development<br />
center for fuel cell technology in Yokkaichi, Japan;<br />
and in the field of plant biotechnology, we have signed a<br />
new cooperation and licensing agreement with the national<br />
institute of biological Sciences in china, and with the<br />
academia Sinica, a leading research institute in taiwan.<br />
Particularly in china and in india, we strengthened<br />
our research and especially our development activities to<br />
react better and faster to new market impulses. We have<br />
further expanded Shanghai as our innovation center for<br />
china; development units for all of our segments are<br />
located there. We expanded our research site in thane,<br />
india, through the construction of a laboratory for organic<br />
synthesis.<br />
assets by region (share in %)<br />
ManageMent’s analysis<br />
The Business Year at <strong>BASF</strong> Regional Results<br />
south america, africa, Middle east<br />
Sales of the companies in the region increased by 7.3%<br />
above the previous year to €3,051 million. in local currency<br />
terms, sales rose by 11.7%.<br />
a large contribution to the positive business development<br />
in South america was made by the agricultural<br />
Solutions segment and the care chemicals division.<br />
in africa and in the Middle east sales increased in particular<br />
in the chemicals, Plastics and oil & gas segments.<br />
this offset lower sales in the Functional Solutions segment.<br />
earnings increased by 1% to €314 million. this was in<br />
particular due to the very positive development in the<br />
agricultural Solutions segment in South america, which<br />
could boost margins significantly. the care chemicals<br />
division also contributed to the increase in income from<br />
operations.<br />
to secure our future success in the agricultural Solutions<br />
segment, a herbicide tolerant soybean, which was<br />
jointly developed with the agricultural research institute<br />
eMbRaPa, was submitted for official approval in brazil.<br />
an analysis of the purchasing power of broad sections of<br />
the South american population led to projects with the<br />
construction industry in the region. Some of these projects<br />
were cross-divisional.<br />
the FaRo initiative constantly pinpoints sales<br />
poten tial for baSF’s products and solutions in strongly<br />
growing industries and value-adding chains in the region.<br />
For example, additional sales potential was identified in<br />
mining and in the value-adding chains for renewable raw<br />
materials.<br />
Property, plant and equipment inventories accounts receivable, trade<br />
<strong>2008</strong> 2007 <strong>2008</strong> 2007 <strong>2008</strong> 2007<br />
europe 58.4 56.9 56.6 56.4 63.4 60.1<br />
north america 21.5 21.0 24.3 25.4 14.6 16.6<br />
asia Pacific 16.5 18.1 12.4 13.5 15.3 17.2<br />
South america, africa, Middle east 3.6 4.0 6.7 4.7 6.7 6.1<br />
100.0 100.0 100.0 100.0 100.0 100.0<br />
BasF RePORt <strong>2008</strong><br />
89
90<br />
MAnAgEMEnT’S AnAlySiS<br />
Employees and Society Employees<br />
EMPlOyEES<br />
Qualified and motivated employees are the core of<br />
<strong>BASF</strong>’s innovative and competitive capacities. in order<br />
to attract and retain the best talents, we offer performance-oriented<br />
pay as well as extensive training and<br />
development opportunities. Our comprehensive program<br />
on demographic change prepares <strong>BASF</strong> for the<br />
personnel related risks and opportunities of the future.<br />
demographic change as an opportunity<br />
Demographic change is affecting <strong>BASF</strong> worldwide, particularly<br />
in Europe and the United States. While overall life<br />
expectancy is increasing, the population of many countries<br />
is shrinking due to low birth rates. Companies consequently<br />
have to cope with a diminishing supply of skilled labor<br />
as well as an ageing workforce. For instance, one out of<br />
three workers in the European Union will be 50 years or<br />
older by 2020.<br />
In order to manage the challenges arising from this situation,<br />
<strong>BASF</strong> initiated the program “Generations@Work” in<br />
2006. Its aim is to keep <strong>BASF</strong> innovative and ahead of the<br />
competition by recognizing the successful management of<br />
demographic change as a competitive advantage. As a<br />
basis for defining initiatives and measures, we conduct an<br />
internal analysis of the age structures of our workforce as<br />
well as external analyses of demographic developments in<br />
the areas surrounding our sites. As a result, the demograph<br />
ic risk and the derived need for action can be determined<br />
for each site. Generations@Work includes all <strong>BASF</strong><br />
sites in Europe and encompasses all fields of human resource<br />
management – ranging from the recruitment,<br />
retention, and training of employees to the adaptation of<br />
labor conditions to the needs of an ageing workforce. The<br />
evaluation and relaunch of our existing health and sport<br />
programs against the backdrop of demographic change is<br />
only one example of the measures that have been implemented<br />
since Generations@Work started.<br />
EuROPEAn CSR AlliAnCE iMPlEMEnTEd dEMOgRAPhy<br />
PROjECTS<br />
We are in dialogue with stakeholders to develop strategies<br />
for dealing with demographic change in Europe.<br />
In cooperation with external partners, <strong>BASF</strong> leads the<br />
“Laboratory for Demographic Change,” part of the<br />
alliance initiated by the E.U. Commission, between<br />
politics and business on corporate social responsibility<br />
(CSR Alliance).<br />
More information at www.demographicchange.info<br />
<strong>BASF</strong> REPORT <strong>2008</strong><br />
In cooperation with external partners, <strong>BASF</strong> leads the<br />
“Labor atory for Demographic Change,” part of the alliance<br />
initiated by the E.U. Commission, between politics and<br />
business on corporate social respon sibility (CSR Alliance).<br />
More information on demographic change can be found at<br />
basf.com/demographic_change<br />
<strong>BASF</strong> group employee structure <strong>2008</strong><br />
(proportion of employees in percent)<br />
Up to and including 25 years<br />
Between 26 and 39 years<br />
Between 40 and 54 years<br />
55 years and older<br />
0%<br />
• Further development of vocational training programs<br />
• Strengthening <strong>BASF</strong>’s employer brand<br />
• Expansion of training and development offers as well<br />
as individual counseling regarding learning<br />
• Evaluation and relaunch of health and sport programs<br />
• Enhanced concepts for systematic knowledge transfer<br />
7.6<br />
9.6<br />
20% 40%<br />
36.4<br />
46.4<br />
increasing employer attractiveness<br />
We want to be even better in the highly competitive market<br />
for qualified talent. Therefore, we started a global initiative in<br />
<strong>2008</strong> to strengthen <strong>BASF</strong>’s attractiveness as an employer.<br />
Especially in Europe and Asia, <strong>BASF</strong> expanded its recruiting<br />
measures: We comprehensively recruit across countries and<br />
production sites, and approach talents more actively. In<br />
those places where we are already considered to be a top<br />
employer, it is our goal to maintain that position. In <strong>2008</strong>, for<br />
the third year in a row, <strong>BASF</strong> in Brazil was ranked as one of<br />
the best employers in the country by the business magazine<br />
Guia Você S. A. – Exame.
Employees worldwide<br />
At the end of <strong>2008</strong>, <strong>BASF</strong> had 96,924 employees. Worldwide,<br />
the percentage of employees leaving the company<br />
during their first three years of employment was on average<br />
1.3%. This fluctuation rate varies from region to<br />
region. In <strong>2008</strong>, 2,171 apprentices worked at <strong>BASF</strong>, and<br />
21,700 employees from other companies provided technical<br />
and other services at our sites.<br />
<strong>BASF</strong> group employee structure <strong>2008</strong><br />
(2007 in parentheses)<br />
Women Men<br />
Total number of employees 21.9% (21.2%) 78.1% (78.8%)<br />
Management & Professionals 23.2% (21.8%) 76.8% (78.2%)<br />
Senior executives 5.7% (5.6%) 94.3% (94.4%)<br />
diversity as a competitive advantage<br />
The demands placed by new markets and customers are<br />
becoming ever more complex, especially in times of economic<br />
difficulty. Concurrently, demographic change intensifies<br />
the competition for the best employees. In order to remain<br />
the global number one in the chemical industry, we need<br />
employees who approach topics from different perspectives<br />
and reflect the diversity of our markets and customers. In<br />
<strong>2008</strong>, we started the global project “Diversity + Inclusion.”<br />
The goal of the program is to make clear the value of each<br />
individual employee, and to show how teams with various<br />
competencies and backgrounds can help to make <strong>BASF</strong><br />
more successful and innovative. To this end, we developed<br />
a three point program. We want to:<br />
• promote the skills of our employees to meet changing<br />
market demands;<br />
• reflect the diversity of employees available worldwide in<br />
all levels of the company, especially the growing number<br />
of welleducated women and international employees;<br />
divERSiTy AS A COMPETiTivE<br />
AdvAnTAgE<br />
• Attractive employer through openness and<br />
transparency<br />
• Employee diversity helps unlock new customer<br />
segments<br />
• Strong employee commitment through more<br />
appreciation<br />
• Legal conformity through equal opportunity<br />
• Equal chances for all employees<br />
MAnAgEMEnT’S AnAlySiS<br />
Employees and Society Employees<br />
• further develop our corporate culture through more<br />
appreciation, trust and openness. This also includes<br />
more transparent career opportunities and worklife<br />
balance measures.<br />
In <strong>2008</strong>, the percentage of women in senior executive positions<br />
in the <strong>BASF</strong> Group was 5.7%. The percentage of<br />
nonGermans in senior executive positions in <strong>2008</strong> was<br />
30.2%. Furthermore, we achieved and exceeded our goal<br />
to increase the percentage of senior executives with international<br />
experience to over 70%. In <strong>2008</strong>, the percentage<br />
was 73.7%. We provide equal opportunities for all employees<br />
and are committed to the equal treatment of both men<br />
and women. We do not make any distinction between<br />
male and female employees when it comes to setting<br />
salaries.<br />
More information can be found at basf.com/diversity_e<br />
leadership feedback<br />
At <strong>BASF</strong>, all managers receive regular feedback from their<br />
employees. In an anonymous, online questionnaire,<br />
employ ees assess the leadership skills and conduct of<br />
their manager. This enables managers to gain a better<br />
understanding of their personal strengths and potential<br />
improvement areas. In facilitated workshops, managers<br />
establish goals and measures together with their employees<br />
to improve teamwork and communication. The program<br />
is mandatory for all senior executives. By the end of<br />
<strong>2008</strong>, 76.9% of our senior executives had participated in<br />
our “Global Leadership Feedback” program. The feedback<br />
processes that are still outstanding will be completed at<br />
the beginning of 2009.<br />
number of employees by region<br />
(as of December 31, <strong>2008</strong>)<br />
<strong>2008</strong><br />
%<br />
<strong>2008</strong><br />
%<br />
2007<br />
Europe 61,889 63.9 64.1<br />
Thereof Germany 47,364 48.9 49.3<br />
Thereof <strong>BASF</strong> SE 32,838 33.9 34.4<br />
North America 15,168 15.6 16.0<br />
Asia Pacific 13,734 14.2 13.9<br />
South America, Africa, Middle East 6,133 6.3 6.0<br />
96,924 100.0 100.0<br />
<strong>BASF</strong> REPORT <strong>2008</strong><br />
91
92<br />
MAnAgEMEnT’S AnAlySiS<br />
Employees and Society Employees<br />
Global employee survey<br />
Key data <strong>2008</strong><br />
• 66% of employees worldwide took part in the survey.<br />
• The survey was conducted in 77 countries.<br />
• 239 <strong>BASF</strong> Group companies were involved.<br />
First global employee survey<br />
The opinions of our employees are important to us. Their<br />
responses to regular surveys help us to make necessary<br />
improvements to our working environment.<br />
For the first time, regional surveys were standardized<br />
and conducted simultaneously. Between May and June<br />
<strong>2008</strong>, employees from 77 countries and 239 <strong>BASF</strong> Group<br />
companies could anonymously take part in the survey.<br />
Worldwide, 66% of employees responded on issues such<br />
as leadership, professional and personal development,<br />
innovation culture or <strong>BASF</strong> strategy. For example, 71% of<br />
<strong>BASF</strong> employees would recommend <strong>BASF</strong> as an employer<br />
to friends and acquaintances, and 79% of our employees<br />
are convinced that <strong>BASF</strong> has an excellent reputation<br />
among the general public. Employees see room for<br />
improve ment regarding support for professional development:<br />
Currently, 48% of our employees regard support<br />
programs as very good or good.<br />
The survey furthermore measures how we implement<br />
our strategic guideline “We form the best team in industry”<br />
– for example, in the areas of collaboration and leadership.<br />
We continue to pursue our longterm goal of implementing<br />
a global survey, including a followup process, for the entire<br />
<strong>BASF</strong> Group. In the steps following the completion of<br />
data collection, employees and management discuss all<br />
survey results and identify potential areas for improvement.<br />
<strong>BASF</strong> REPORT <strong>2008</strong><br />
Balancing career and family<br />
<strong>BASF</strong> promotes balancing career and family. We offer support<br />
to employees in different life situations so they can<br />
achieve a better worklife balance. We present different<br />
models for flexible working hours according to the individual<br />
employee’s needs. These include telecommuting, flextime<br />
or parttime work. The percentage of employees working<br />
parttime for <strong>BASF</strong> SE is 9.4%.<br />
<strong>BASF</strong> offers several childcare programs to its employees.<br />
In Ludwigshafen, for example, there are two <strong>BASF</strong><br />
daycare nurseries. In addition, we opened the child care<br />
facility “LuKids adhoc” in early <strong>2008</strong>. Here employees can<br />
place their children in good hands if their own childcare<br />
arrangements are cancelled at short notice. Also in the<br />
Unit ed States, through our program “Backup Care,” we<br />
organize replacement care for either children or dependents<br />
of our employ ees when there is a need.<br />
Since 2006, a total of 320 children and teenagers have<br />
participated in the international vacation program “<strong>BASF</strong><br />
Global Family,” an exchange program for the children of<br />
employees. In <strong>2008</strong>, children from 15 <strong>BASF</strong> production<br />
sites worldwide took part in the program.<br />
For the past three years, we have supported the families<br />
of our delegated employees through a special course to<br />
prepare their children for life in a foreign country. We are<br />
also adapting to the changing lifestyles of our employees:<br />
At the end of <strong>2008</strong>, 488 employees were on parental leave,<br />
7.8% of them being fathers. At the beginning of 2007,<br />
3.5% of all male employees took parental leave.<br />
In <strong>2008</strong>, <strong>BASF</strong> once again passed the “FamilienTÜV”<br />
awarded by the nonprofit Hertie Foundation – a seal of<br />
quality for family friendly companies.<br />
More information can be found at basf.com/worklife_balance<br />
glOBAl EMPlOyEE SuRvEy CAREER And FAMily<br />
• Regional surveys were standardized and conducted<br />
simultaneously for the first time<br />
• Helping to achieve improvements to the work<br />
environment<br />
• Measuring acceptance of the strategic guideline<br />
“We form the best team in industry”<br />
• Starting in 2010, employees can evaluate implementation<br />
of measures through a followup survey<br />
• Models for flexible working hours<br />
• Offers of childcare<br />
• Information events for parents<br />
• Caregiver counseling<br />
• Quality seal from the Hertie Foundation as a<br />
family friendly company
Commitment to professional training<br />
It is our goal to offer as many young people as possible an<br />
opportunity to start their career. Currently, <strong>BASF</strong> is training<br />
2,171 young people in 50 professions in 14 countries. The<br />
chances of finding a permanent job at the end of the training<br />
are very good, a fact proved by the high takeon rate.<br />
In <strong>2008</strong>, <strong>BASF</strong> SE offered permanent positions to 92% of<br />
its apprentices following the successful completion of their<br />
training programs.<br />
Since 2004, the <strong>BASF</strong> Training Verbund has created<br />
additional training positions in Germany, and together with<br />
around 750 partner companies, currently trains 1,174<br />
young people. The percentage of apprentices being offered<br />
a permanent position was clearly above the national<br />
average at 75%. In <strong>2008</strong>, the Training Verbund was awarded<br />
the “Initiative Prize for Training and Further Development<br />
<strong>2008</strong>.” This is awarded to outstanding business<br />
initia tives to improve the quality and attractiveness of<br />
companybased vocational training.<br />
In <strong>2008</strong>, the Training Verbund started the program<br />
“Ready, Set, Training” that encourages high school students<br />
with strengths in practical areas. Intensive mentoring<br />
makes the transition to vocational training easier for the<br />
teenagers and equips them with the required skills.<br />
In <strong>2008</strong>, we invested approximately €69.2 million in our<br />
apprentices and approximately €24.7 million in the “<strong>BASF</strong><br />
Training Verbund” worldwide. We also supported “Job<br />
Chance 100” with €2.5 million in <strong>2008</strong>, to help 100 unemployed<br />
young people make a start in their professional<br />
lives.<br />
APPREnTiCE PROgRAMS<br />
• <strong>BASF</strong> offers training in 50 professions in 14 countries<br />
• 92% of trainees and apprentices receive permanent<br />
hire offers<br />
• <strong>BASF</strong>’s Training Verbund, together with 750 partner<br />
companies trains 1,174 young people in Germany<br />
• Above national average rate of permanent hire offers,<br />
75%, from <strong>BASF</strong> Training Verbund<br />
MAnAgEMEnT’S AnAlySiS<br />
Employees and Society Employees<br />
Further training opportunities<br />
The further training of our employees is an investment<br />
in the future of the company. The need for further training<br />
forms a part of the annual performance appraisals with our<br />
employees in order to enable us to offer the necessary<br />
qualifications. We also support independent learning –<br />
both on and off the job.<br />
Our personnel development concept includes methods<br />
such as seminars, coaching and selfregulated elearning.<br />
Our webbased European Learning Portal (ELP) offers a<br />
wide range of courses from language training to management<br />
skills, with online elearning programs in seven different<br />
languages. As of <strong>2008</strong>, ELP is also the platform for<br />
the new European Technical Academy with a wide range<br />
of qualification opportunities for more than 10,000 employees<br />
working in a technical function. In addition, <strong>BASF</strong><br />
offers elearning portals worldwide, where our employees<br />
can make use of a wide range of offers for independent<br />
learning.<br />
Within the framework of the company’s global initiative<br />
“perspectives,” over 3,700 employees from all regions took<br />
part in trainings and workshops on the topics of marketing<br />
and sales in <strong>2008</strong>. Regular surveys show that the participants<br />
thought very highly of the quality of the internal seminars<br />
they attended.<br />
We want to further improve the utilization of our training<br />
opportunities. In <strong>2008</strong>, <strong>BASF</strong> invested €129.6 million<br />
(2007: €131.2 million) in vocational training and further<br />
train ing. More than 80,000 employees participated in training.<br />
On average, each employee spent 3.9 days in training<br />
events (2007: 3.6 days).<br />
FuRThER TRAining<br />
• Webbased European learning portal with courses in<br />
seven languages<br />
• 500 topics for further training and approximately 5,000<br />
events annually at the site in Ludwigshafen<br />
• European Technical Academy for more than 10,000<br />
employees in technical fields<br />
• Worldwide access to elearning portals<br />
<strong>BASF</strong> REPORT <strong>2008</strong><br />
93
94<br />
MAnAgEMEnT’S AnAlySiS<br />
Employees and Society Employees<br />
Employee participation in the company’s success<br />
For <strong>BASF</strong>, sustainable enterprise means sharing the company’s<br />
success with our employees. We want our employees<br />
to have a longterm interest in our company and we<br />
reward their personal performance. We encourage entrepreneurial<br />
thinking by implementing remuneration sys tems<br />
based on performance and success that follows the same<br />
basic principles for all our employees. They usually involve<br />
both fixed and variable components. The variable compon<br />
ent is determined by two factors: the economic success<br />
of the <strong>BASF</strong> Group measured by the return on assets, and<br />
the employee’s individual performance. Employee performance<br />
is assessed in an annual review, which is compulsory<br />
in <strong>BASF</strong> SE and most companies of the <strong>BASF</strong> Group.<br />
Share programs for employees<br />
Our “Plus” share program helps to foster employee interest<br />
in the company’s success and business performance. The<br />
program promotes the longterm involvement of employees<br />
through incentive shares. Employees can invest varying portions<br />
of their compensation in <strong>BASF</strong> shares. In <strong>2008</strong>, 19,452<br />
employees worldwide purchased 974,460 shares. Since<br />
1999, <strong>BASF</strong> has offered its senior executives the opportunity<br />
to participate in the <strong>BASF</strong> stock option program (BOP),<br />
which ties a part of remuneration to the longterm development<br />
of the <strong>BASF</strong> share price. In <strong>2008</strong>, more than 90% of<br />
approximately 1,000 senior executives eligible participated<br />
in BOP worldwide, investing up to 30% of their variable<br />
compensation in shares.<br />
More information can be found in the notes from page 210 onward<br />
Personnel costs and social benefits<br />
At <strong>BASF</strong>, attractive compensation for our employees comprises<br />
remuneration and social benefits. Among others,<br />
these include a company pension plan, supplementary<br />
health insurance, and a share program. In <strong>2008</strong>, the <strong>BASF</strong><br />
EMPlOyEE PARTiCiPATiOn: lOng-TERM invESTMEnTS<br />
<strong>BASF</strong> REPORT <strong>2008</strong><br />
Group spent €6,364 million on wages and salaries, social<br />
security contributions, pension contributions and assistance,<br />
4.3% less than in 2007, due in particular to lower<br />
expenses for the <strong>BASF</strong> Options Program and for variable<br />
compensation.<br />
<strong>BASF</strong> group personnel costs <strong>2008</strong> (million €)<br />
<strong>2008</strong><br />
Change<br />
in %<br />
Wages and salaries 5,158 (4.1)%<br />
Social security contributions and expenses for<br />
pensions and assistance<br />
1,206 (5 .0)%<br />
Thereof for pension benefits 310 (13.6)%<br />
Personnel costs 6,364 (4.3)%<br />
Open dialogue with employee representatives<br />
We work in partnership with elected employee representatives<br />
on a company, national and regional level. The European<br />
employee representative body of <strong>BASF</strong> SE – the <strong>BASF</strong><br />
Europa Betriebsrat (Europe Works Council) – was formed<br />
as a result of the conversion of <strong>BASF</strong> AG to a European<br />
Com pany, a Societas Europaea (SE), and succeeded the<br />
former “Euro Dialogue.” The <strong>BASF</strong> Europa Betriebsrat is<br />
responsible for crossborder issues and has clearly defined<br />
rights of involvement. It comprises 23 members from 12<br />
European countries. In Asia and South America, platforms<br />
for coop eration between <strong>BASF</strong> and employee representatives<br />
have also proven their value. The advantage of a<br />
regional approach lies in open dialogue and cooperation,<br />
which enables the diverse everyday conditions, legal situations<br />
and challenges in the different regions of the world to<br />
be met.<br />
More information can be found at basf.com/employeerepresentation<br />
• “Plus” share program for employees since 1999<br />
• In <strong>2008</strong>, 19,452 employees worldwide acquired 974,460 shares (number after stock split)<br />
• Incentiveshares encourage longterm employee commitment at <strong>BASF</strong>
OCCuPATiOnAl SAFETy<br />
The safety and health of our employees are of the<br />
utmost importance to us. We have made significant<br />
achievements as a result of our high safety standards<br />
and comprehensive regulations. Worldwide, the lost<br />
time injury rate has stabilized at a low level. We aim to<br />
become even better in the future, thus contributing to<br />
<strong>BASF</strong>’s long-term business success.<br />
In <strong>2008</strong>, we started a worldwide safety initiative that builds<br />
upon the success of safety programs in previous years. We<br />
aim to make safety a visible value and success factor. Our<br />
goal is to improve our safety culture Groupwide, above and<br />
beyond the traditional technical safety measures and rules,<br />
and to develop a strong collective commitment to safe<br />
behavior.<br />
Minimizing risks<br />
Occupational safety plays a fundamental role in our daily<br />
routine through, for example, regular safety briefings in our<br />
production facilities and the activities of the safety experts<br />
who are appointed for every site. Systematic risk assessments<br />
of workflow processes and individual activities minimize<br />
risks and sensitize employees to possible sources of<br />
danger.<br />
We have been promoting safety awareness among our<br />
employees over a long period, by means of safety regulations,<br />
seminars and training courses. We analyze accidents<br />
and nearaccidents to pinpoint and eliminate potential<br />
weaknesses. We are further developing our safety management<br />
with our worldwide network of experts.<br />
We have set ourselves the ambitious goal of reducing<br />
the lost time injury rate by 80% by 2020, compared with<br />
2002. In <strong>2008</strong>, the lost time injury rate in the <strong>BASF</strong> Group<br />
was 1.8 accidents per million working hours (2007: 2.2).<br />
lost time injury rate<br />
per million working hours (reduction compared with baseline 2002: –45%)<br />
<strong>2008</strong><br />
2007<br />
2006<br />
2005<br />
2004<br />
2003<br />
2002<br />
0<br />
1 2 3<br />
1.7<br />
1.8<br />
1.8<br />
2.0<br />
2.2<br />
2.4<br />
3.3<br />
MAnAgEMEnT’S AnAlySiS<br />
Employees and Society Occupational Safety<br />
To date, we have reduced the lost time injury rate per million<br />
working hours by 45% compared with 2002. Among<br />
employees of partner companies working at <strong>BASF</strong> sites,<br />
the lost time injury rate declined to 3.4 accidents per million<br />
working hours (2007: 3.6). We continue to include<br />
these companies in our safety activities.<br />
2020 Goal<br />
Reduce lost time injuries<br />
–80%<br />
We want to reduce our lost time<br />
injury rate per million working hours<br />
by 80% worldwide compared with<br />
the baseline of 2002.<br />
new paths to safety excellence<br />
With our new safety initiative, we go beyond traditional<br />
safety methods. Our success factors for occupational<br />
health and safety not only include the acceptance of rules<br />
and regulations and the personal responsibility of each<br />
individual, but it is also important that our managers lead<br />
the way by acting as role models and that our employees<br />
are actively committed. We also pursue open dialogue in<br />
order to benefit from experiences and learn from our mistakes.<br />
To achieve this, we launched the worldwide initiative<br />
“Safety Champions” in <strong>2008</strong>. In Asia, it is implemented by<br />
the “C.A.R.E.Initiative,” in South America through “Cultura<br />
De Segurança,” and in North America by “Journey to EHS<br />
Excellence.” Several thousand managers, experts, employees<br />
and partner companies developed ideas for improvement<br />
in major regional events, discussion forums, and<br />
surveys.<br />
SuCCESS FACTORS FOR<br />
OCCuPATiOnAl SAFETy<br />
• Role model function of managers<br />
• Personal responsibility, clear rules and guidelines<br />
• Open dialogue to mutually benefit from experiences<br />
• Active commitment from every single employee<br />
<strong>BASF</strong> REPORT <strong>2008</strong><br />
95
96<br />
MAnAgEMEnT’S AnAlySiS<br />
Employees and Society Health Protection<br />
hEAlTh PROTECTiOn<br />
The ability of our employees to perform, their job satisfaction<br />
and their creativity are fundamental to our economic<br />
success. The <strong>BASF</strong> global health program aims<br />
to protect their health – benefiting both employees and<br />
the company.<br />
A worldwide network of experts for occupational medicine<br />
and health protection work together to implement our<br />
program. They also help to ensure that our products and<br />
their production do not pose a health risk to employees,<br />
neighbors, customers or consumers.<br />
2020 Goal<br />
Reduce occupational diseases<br />
–80%<br />
<strong>BASF</strong> REPORT <strong>2008</strong><br />
We have set ourselves the goal<br />
of reducing cases of occupational<br />
diseases within the <strong>BASF</strong> Group<br />
by 80% based on the criteria and<br />
rate for 2004: 0.4 occupational<br />
diseases per million hours worked.<br />
Examples of occupational diseases include noiseinduced<br />
hearing damage, skin and respiratory diseases caused by<br />
chemicals, and musculoskeletal disorders. In <strong>2008</strong>, there<br />
were 0.31 occupational diseases per million working hours<br />
within <strong>BASF</strong>. This corresponds to a 23% reduction compared<br />
with the baseline figure for 2004. In order to achieve<br />
our health goal, we rely on medical surveillance and regular<br />
targeted hazard assessments, for example, occupational<br />
medical plant inspections and audits. Our preventive<br />
health interventions are derived from these assessments.<br />
For us, prevention is always the priority.<br />
glOBAl nOn-SMOking CAMPAign<br />
Worldwide investment in health<br />
Standards for our medical performance for employees are<br />
laid down in our global Occupational Medicine and Health<br />
Protection Program. We ensure that prevention and health<br />
promotion at all <strong>BASF</strong> sites worldwide meet the same high<br />
standards. Our 15 expert teams cover all areas of occupational<br />
medicine. Regular medical audits help us to improve<br />
our services. Our internal auditing system corresponds to<br />
the standards of the commonly used external auditing procedures<br />
ISO 19011 and OHSAS 18001.<br />
Our expertise in occupational medicine and health protection<br />
is available to employees, neighbors and customers.<br />
<strong>BASF</strong>’s commitment to this field is also recognized<br />
outside the company. The European Commission and the<br />
German Association of Corporate Health Insurance Companies<br />
(BKK Bundesverband) awarded us with the “German<br />
Corporate Health Achievement Award” (Deutscher<br />
Unternehmenspreis Gesundheit) for our ‘excellent, comprehensive<br />
and holistic health management.’<br />
Commitment to our employees<br />
Our checkup and prevention modules contribute to the<br />
reduction of health risks and to promote the longterm<br />
health of our employees. Our health campaigns make an<br />
important contribution: Through our second global health<br />
campaign “Steps to Health 2009,” we aim to increase our<br />
employees’ awareness of the benefits of daily physical<br />
exercise and encourage them to be more active. During<br />
the campaign, a pedometer will become their constant<br />
companion. Every site can support the participants with<br />
additional offers. The pedometer readings of all participants<br />
will be entered regularly into a global database,<br />
thereby making individual or team progress immediately<br />
visible.<br />
More information on this topic can be found at basf.com/health_protection<br />
For the first time, we launched a health campaign globally: During our nonsmoking campaign in <strong>2008</strong>, 1,578 employees at<br />
126 different <strong>BASF</strong> sites voluntarily gave up smoking for four weeks; this corresponds to 870,000 cigarettes. At many sites,<br />
permanent followup services such as stop smoking courses were introduced along with the campaign. Three years after<br />
the 2003 nonsmoking campaign in Ludwigshafen, Germany, which was based on the same concept, 40% of the participants<br />
had stopped smoking permanently.
SOCiAl COMMiTMEnT<br />
For <strong>BASF</strong>, taking on social responsibility means investing<br />
in the future. knowledge is our most important future<br />
resource and the driving force behind innovation<br />
and growth around the world. We therefore focus our<br />
commitment on education, and support in particular,<br />
projects that make education accessible in the communities<br />
close to our sites worldwide.<br />
Our economic success depends on trust and social acceptance<br />
from our neigbors. We are therefore committed to<br />
promoting education in the communities and regions<br />
where our sites are located, as well as supporting initiatives<br />
and projects in sports, culture and society. An important<br />
selection criterion for projects is their longterm value.<br />
A framework directive for the <strong>BASF</strong> Group regulates the<br />
allocation of funds for donations and sponsoring.<br />
<strong>BASF</strong> group donations, sponsoring and own projects in <strong>2008</strong><br />
€64.7 million (2007: €75.3 million).<br />
5<br />
6<br />
1<br />
€64.7<br />
million<br />
2<br />
3<br />
4<br />
1 -- Science: 5.6 (8.7%)<br />
2 -- Society: 4.1 (6.4%)<br />
3 -- Culture: 7.6 (11.7%)<br />
4 -- Sports: 1.8 (2.7%)<br />
5 -- Education: 38.5 (59.5%)<br />
6 -- Other: 7.1 (11.0%)<br />
As a matter of principle, <strong>BASF</strong> does not support political<br />
parties. This applies worldwide. However, our employees in<br />
the United States have made use of their right to establish a<br />
Political Action Committee (PAC). The <strong>BASF</strong> Corporation<br />
PAC is a nonpartisan, federally registered group of employees<br />
which supports candidates for political posts at federal,<br />
state and local levels.<br />
PRinCiPlES And FOCuS<br />
• Education is the focus of our commitment<br />
• We primarily sponsor activities in the communities and regions close to our sites<br />
• We create value for society with our donations and sponsorship<br />
•<br />
We promote projects with sustainable benefits<br />
MAnAgEMEnT’S AnAlySiS<br />
Employees and Society Social Commitment<br />
In <strong>2008</strong>, the <strong>BASF</strong> Group spent a total of €64.7 million (2007:<br />
€75.3 million) on promoting projects. Of the total amount,<br />
38.6% was donated.<br />
We promote education<br />
Education is key to the future of our children and the development<br />
of society as a whole. Early learning is essential:<br />
Through the “Action on Education” initiative, <strong>BASF</strong> is currently<br />
supporting more than 170 daycare centers in<br />
Ludwigshafen and the local region. Seven different projects<br />
focus, for example, on improving language skills and discovering<br />
the natural world through play. The initiative, which<br />
started in 2005, was expanded in <strong>2008</strong> and has so far<br />
reached 13,000 children. Aid amount for the initiative totals<br />
up to €5 million annually. In <strong>2008</strong>, the German UNESCO<br />
Commission assumed patronage of the “Action on Education”<br />
initiative and honored its achievements. This promotes<br />
the sustainability of the initiative and gives it a unique standing<br />
compared with the multitude of different early learning<br />
projects in Germany.<br />
We also support education projects in other countries.<br />
In South America, for example, we support neighborhood<br />
elementary schools close to our production sites, provide<br />
further education for teachers and award grants to students.<br />
inspiring interest in science<br />
The best way to inspire children about science is by conducting<br />
scientific experiments in the classroom. We therefore<br />
offer laboratories for schoolchildren at our sites and<br />
support a wide range of different projects.<br />
In 15 countries, children can discover the world of<br />
chemistry in our Kids’ Labs and through a variety of handson<br />
experiments. In <strong>2008</strong>, a total of 67,000 children and<br />
young people participated in these activities. In India, we<br />
provided a rolling Kids’ Lab for the “Science Express” –<br />
<strong>BASF</strong> REPORT <strong>2008</strong><br />
97
98<br />
MAnAgEMEnT’S AnAlySiS<br />
Employees and Society Social Commitment<br />
an entire train containing a mobile exhibition from the Max<br />
Planck Society in Germany. The train stopped at 57 Indian<br />
cities and welcomed 2.25 million visitors during a seven<br />
month journey that ended in May <strong>2008</strong>. More than 15,300<br />
young people conducted experiments in the <strong>BASF</strong> Kids’<br />
Lab on the train.<br />
We are also committed to discovering and encouraging<br />
scientific and business talent. For this reason, we sponsored<br />
the Young Researchers science competition in the<br />
RhinelandPalatinate region of Germany for the 43rd time<br />
in <strong>2008</strong>. We also offer regular summer courses and workshops<br />
for talented students from around the world.<br />
Working together in the knowledge Factory<br />
To promote knowledge as an essential resource, we<br />
cofounded the “Knowledge Factory” in 2005. Together<br />
with approximately 70 other companies, <strong>BASF</strong> works to<br />
foster a learning culture and spirit of discovery among<br />
children in kindergartens, schools and colleges. The focus<br />
is on the topics of the future – science and technology – as<br />
well as providing insights into the world of business. In our<br />
newly developed business game “ProFi,” for example,<br />
elementary school pupils can start up their own company<br />
and learn practically what it means to conduct business.<br />
In addition, the Knowledge Factory contributes to the<br />
national debate on education: At the education summit in<br />
Dresden, Germany, in October, <strong>2008</strong>, children from education<br />
partnerships within the Knowledge Factory presented<br />
their ideas for the “ideal school of the future” to German<br />
Chancellor Angela Merkel. The Knowledge Factor also pursues<br />
another goal: promoting entrepreneurship in young<br />
people. Through a mentoring program, employees of the<br />
member companies provide professional support and advice<br />
to young entrepreneurs.<br />
More information at www.wissensfabrik-deutschland.de<br />
PARTnERShiP WiTh ThE uniTEd nATiOnS<br />
<strong>BASF</strong> REPORT <strong>2008</strong><br />
Worldwide commitment from the <strong>BASF</strong> team<br />
Education was also the focus of the Christmas donation<br />
campaign <strong>2008</strong> at <strong>BASF</strong> SE, and <strong>BASF</strong> SA in Brazil. The<br />
<strong>BASF</strong> social foundation is working together with UNHABI<br />
TAT, the United Nations’ human settlements program, to<br />
build an education and community center in a poor quarter<br />
of São Paulo, Brazil. <strong>BASF</strong> SE made a donation of<br />
€100,000 to the project as starting capital. <strong>BASF</strong> employees<br />
at our sites in Ludwigshafen and Schwarzheide in Germany,<br />
and in São Paulo collectively donated over €70,000.<br />
In <strong>2008</strong>, the <strong>BASF</strong> team was also active in helping victims<br />
of natural disasters. A total of €900,000 for victims of<br />
the earthquake in China and the flooding in Burma was donated<br />
by employees in Germany together with employees<br />
from <strong>BASF</strong> Greater China and joint ventures in the region.<br />
The <strong>BASF</strong> social foundation, UNHABITAT and <strong>BASF</strong><br />
Pakis tan are rebuilding a school which was badly damaged<br />
during the earthquake in 2005.<br />
Our commitment to reconstruction after natural catastrophes<br />
makes it possible for the victims to gain longterm<br />
perspectives. This was the case in Bangladesh after<br />
cyclone Nargis: UNHABITAT built a new school building<br />
which can withstand future storms.<br />
In May <strong>2008</strong>, the <strong>BASF</strong> social foundation and UN<br />
HABITAT initiated a project in Nairobi, Kenya, to mark the<br />
entry into force of the U.N. Human Rights Convention on<br />
the Rights of Persons with Disabilities: The construction<br />
of a health and education center in the slums of Kibera<br />
Soweto offers disabled children and young people improved<br />
medical treatment and initial aid to help them make<br />
a new start in life.<br />
As a founding member of the Global Compact, <strong>BASF</strong> is committed to achieving the U.N. Millennium Development Goals.<br />
The <strong>BASF</strong> social foundation works in close collaboration with U.N. organizations to provide emergency aid and assistance<br />
for general development projects. In several projects, experts from <strong>BASF</strong>’s divisions supplement the expertise of our<br />
U.N. partners. Experts from the Care Chemicals division developed a test kit to simplify nutritional analysis especially for<br />
a UNICEF Project to combat malnourishment in the Democratic Republic of Congo. Startup funds from the Christmas<br />
donation campaign in 2007, as well as technical support from <strong>BASF</strong>, ensure the longterm success of the initiative.<br />
More information on the Millenium development goals at basf.com/millennium_goals, more on our commitment to fighting against malnutrition at<br />
www.food-fortification.com
CliMATE PROTECTiOn<br />
Climate change is one of the main challenges facing<br />
society. industry, science, politics and society need<br />
to work together to find global solutions for climate<br />
protection. At the beginning of <strong>2008</strong>, we presented our<br />
action plan for climate protection: We set ourselves<br />
ambitious climate protection goals, appointed a<br />
Climate Protection Officer and presented a comprehensive<br />
corporate carbon footprint. We create business<br />
opportunities for ourselves and our customers with our<br />
products for climate protection.<br />
Climate protection is an integral part of our sustainability<br />
strategy. We support the goals of the Kyoto Protocol and<br />
are committed to contributing to their global implementation.<br />
We reduce greenhouse gas emissions in our production<br />
by further improving the energy efficiency of our processes.<br />
Above all, our products make a major contribution<br />
to climate protection. They enable our customers to<br />
reduce greenhouse gas emissions and save resources. We<br />
develop innovative technologies for climate protection<br />
together with customers and our partners in industry and<br />
science. <strong>BASF</strong> invests over €400 million per year in<br />
research and development for products and technologies<br />
for energy efficiency, climate protection, resource conservation<br />
and renewable raw materials.<br />
listing in the Carbon disclosure leadership index<br />
<strong>BASF</strong>’s commitment to climate protection and our transparent<br />
reporting on this issue have been officially recognized<br />
with our listing in the renowned Carbon Disclosure<br />
Leadership Index (CDLI). In <strong>2008</strong>, <strong>BASF</strong> achieved the top<br />
ranking in this global index in the category carbonintensive<br />
sectors. In the United States, <strong>BASF</strong> has been a member<br />
of the Business Environmental Leadership Council of<br />
the Pew Center on Global Climate Change since <strong>2008</strong>.<br />
Membership is attained by invitation from the Center and<br />
CORPORATE CARBOn FOOTPRinT<br />
Savings of CO 2 equivalent per year<br />
Emissions of CO 2 equivalent per year<br />
Saving of<br />
CO2 emissions<br />
through <strong>BASF</strong> products<br />
Emissions for raw materials,<br />
production of disposal<br />
of all <strong>BASF</strong> products<br />
–252 mill.<br />
metric<br />
tons<br />
3<br />
1<br />
87 mill.<br />
metric<br />
tons<br />
MAnAgEMEnT’S AnAlySiS<br />
Environment and Safety Climate Protection<br />
is offered to companies that actively advocate climate<br />
protection.<br />
greenhouse gas emissions<br />
(1,000 metric tons of CO 2 equivalent per year)<br />
GWP<br />
Faktor* 2002** 2005 2006 2007 <strong>2008</strong><br />
CO 2 *** 1 18,236 19,737 20,250 21,433 20,727<br />
N 2O 310 6,407 4,915 4,602 5,963 6,294<br />
CH 4 21 10 16 12 21 15<br />
HFC **** 140 – 11,700 61 116 121 96 69<br />
PFC **** 6,500 – 9,200 0 0 0 0 0<br />
SF 6 23,900 0 1 2 1 2<br />
24,714 24,785 24,987 27,514 27,107<br />
spec. GHG factor ***** 0.897 0.800 0.786 0.749 0.770<br />
* GWP factor global warming potential of the individual gases compared with<br />
CO 2<br />
** Baseline<br />
*** Energyrelated CO 2 emissions cover both direct emissions arising from the<br />
generation of electricity and steam as well as indirect emissions from the<br />
acquisition and sale of electricity and steam.<br />
**** Halogenated fluorocarbons (HFC) and perfluorcarbons (PFC); Calculated<br />
using the GWP factors of the individual components (IPCC 1995)<br />
***** Specific greenhouse gas factor = metric tons of greenhouse gases per metric<br />
ton of sales product<br />
<strong>BASF</strong>’s corporate carbon footprint<br />
Analysis of the entire product life cycle is the basis on<br />
which new solutions are developed. At the beginning of<br />
<strong>2008</strong>, we were the first industrial company to draw up a<br />
comprehensive carbon footprint for our chemical business<br />
(data based on 2006). We not only analyzed our own<br />
greenhouse gas emissions, but also the emissions from<br />
the extraction of raw materials, the production of precursors<br />
and from product disposal. These figures were set<br />
against the CO 2 savings achieved through the use of our<br />
products. The result: CO 2 savings of 252 million metric tons<br />
compared with 87 million metric tons of greenhouse gas<br />
We were the first industrial company to present a comprehensive<br />
corporate carbon footprint. The result shows<br />
that <strong>BASF</strong> products save three times more greenhouse<br />
gas emissions than are caused by the production and<br />
disposal of all our products. In the longterm, we want<br />
to maintain or even improve this factor.<br />
More information on this topic can be found at<br />
basf.com/corporate_carbon_footprint<br />
<strong>BASF</strong> REPORT <strong>2008</strong><br />
99
100<br />
MAnAgEMEnT’S AnAlySiS<br />
Environment and Safety Climate Protection<br />
emissions. <strong>BASF</strong> products save three times more greenhouse<br />
gas emissions than are caused by the production<br />
and disposal of all <strong>BASF</strong> products. We want to maintain, or<br />
even improve this factor of three in the longterm. In <strong>2008</strong>,<br />
<strong>BASF</strong> was distinguished with the European Responsible<br />
Care ® Award by the European Chemical Industry Association<br />
for our corporate carbon footprint.<br />
global climate protection goals<br />
In <strong>2008</strong>, emissions of greenhouse gases from <strong>BASF</strong>’s chemical<br />
operations worldwide amounted to 27.1 million metric<br />
tons (2007: 27.5 million metric tons). In recent years, numerous<br />
projects have helped us to reduce emissions of relevant<br />
greenhouse gases significantly. Between 1990 and 2002,<br />
we reduced greenhouse gas emissions by 38% in absolute<br />
terms and specifically by 61%. By 2020, we aim to achieve<br />
another big step, and have set ourselves an ambitious new<br />
goal in <strong>2008</strong>: a further 25% reduction in our specific greenhouse<br />
gas emissions per metric ton of sales product compared<br />
with 2002.<br />
2020 Goal<br />
Reduce greenhouse gas emissions<br />
–25%<br />
<strong>BASF</strong> REPORT <strong>2008</strong><br />
By 2020, we aim to reduce our<br />
specific greenhouse gas emissions<br />
per metric ton of sales product by<br />
25% compared with 2002.<br />
In <strong>2008</strong>, we reduced greenhouse gas emissions per metric<br />
ton of sales product by 14.2% compared with 2002. This<br />
reduction is smaller than in 2007, due primarily to reduced<br />
plant utilization, in addition to the shutdown and startup of<br />
several plants worldwide because of the economic crisis,<br />
and following hurricanes in the United States.<br />
REduCTiOn OF gREEnhOuSE gASES<br />
as of <strong>2008</strong>, compared with the baseline 2002<br />
–14%<br />
Emissions from gas and oil production<br />
In <strong>2008</strong>, emissions of greenhouse gases from oil and gas<br />
production totaled 1.4 million metric tons (2007: 1.3 million<br />
metric tons).<br />
Our greenhouse gas emissions goal does not include<br />
oil and gas production as it is difficult to forecast the emissions<br />
from exploration of new oil and gas fields. In <strong>2008</strong>,<br />
we therefore set ourselves a climate goal specifically for<br />
our oil and gas business.<br />
2012 Goal<br />
Stop the flaring of associated gases<br />
100%<br />
We want to stop the flaring<br />
of associated gases that are<br />
released during crude oil<br />
production by Wintershall.<br />
The production of crude oil releases waste gases which are<br />
often burnt off (flared) due to the lack of infrastructure to use<br />
these gases further. The <strong>BASF</strong> subsidiary Wintershall has<br />
set itself the goal to stop the continuous flaring of gases<br />
associated with crude oil production in routine operations at<br />
all its sites by 2012. In <strong>2008</strong>, Wintershall put an oil compressor<br />
into operation in Emlichheim, Germany, to help achieve<br />
this goal. In Libya, Wintershall processes gas released during<br />
the production of crude oil in a special gas utilization<br />
plant and transports it by pipeline to power plants for the<br />
generation of electricity. Two remaining production sites will<br />
be equipped with facilities to process associated gases and<br />
ensure the achievement of the goal by 2012. Overall, gas<br />
utilization reduces greenhouse gas emissions in Germany<br />
and Libya by around two million metric tons per year.<br />
Reduction of specific greenhouse gas emissions<br />
per metric ton of sales product (baseline 2002)<br />
0%<br />
–5%<br />
–10%<br />
–15%<br />
–20%<br />
–25%<br />
2004<br />
–1.4<br />
2005<br />
–10.9<br />
2006<br />
–12.4<br />
2007<br />
–16.6<br />
<strong>2008</strong><br />
–14.2<br />
Goal 2020
innovation for climate protection<br />
Many of our products make a contribution to climate protection.<br />
Our products for climatefriendly construction and<br />
housing range from innovative insulating materials for exteriors<br />
and windows, that increase the energy efficiency of<br />
buildings to cement additives that reduce greenhouse gas<br />
emissions in the construction phase. Our fuel additives and<br />
plastics for lightweight auto body construction contribute to<br />
decreasing greenhouse gas emissions in traffic. Baxxodur ®<br />
epoxy resins enable the construction of larger, lighter rotor<br />
blades to improve the performance of wind turbines. To facilitate<br />
the transfer of modern climate protection technologies<br />
to transition and developing countries, we have pooled<br />
our competencies in a technology transfer team. Our activities<br />
in this area are operated under the Clean Development<br />
Mechanism (CDM) arrangement of the Kyoto Protocol.<br />
In <strong>2008</strong>, we examined the carbon footprint of various<br />
textile production processes in a joint project with our partner<br />
and customer PUMA, the company Systain, and textile<br />
companies in Bangladesh. The use of <strong>BASF</strong> textile chemicals<br />
and technologies can significantly reduce CO 2 emissions<br />
per garment. At our own sites, we also initiated a<br />
range of climate protection measures in <strong>2008</strong>; one example<br />
is our Energy Efficiency Program.<br />
<strong>BASF</strong>, RWE Power and the Linde Group have agreed on<br />
the development of a new process for CO 2 capture from<br />
combustion gases in coalfired power plants. Over 90% of<br />
the CO 2 from combustion gases could be captured with<br />
this new technology called CO 2 scrubbing, and afterwards<br />
be stored underground. A pilot facility is under construction<br />
in which newly developed <strong>BASF</strong> solvents will undergo<br />
longterm tests to increase process and engineering<br />
knowhow, and thus optimize CO 2 capture technology.<br />
The longterm goal is to improve the profitability of this<br />
technology.<br />
More information at basf.com/climate_protection<br />
PROduCTS FOR CliMATE PROTECTiOn<br />
• Construction: exterior insulation, insulating materials<br />
for windows, cement additives<br />
• Energy: epoxy resin systems for wind turbine blades<br />
• Mobility: fuel additives, plastics for lightweight auto<br />
body construction<br />
MAnAgEMEnT’S AnAlySiS<br />
Environment and Safety Climate Protection<br />
InnovatIve thermal InsulatIon materIals<br />
Increased energy efficiency<br />
wIthout<br />
InSulatIon<br />
Value for BaSf<br />
400<br />
thousand metric tons<br />
of insulation material sold<br />
wIth<br />
InSulatIon<br />
Lower energy<br />
consumption –<br />
fewer emissions<br />
Value for SocIety<br />
110<br />
million metric tons<br />
of co 2 saved<br />
Our modern insulation materials can reduce the energy<br />
consumption of residential houses by more than 70%.<br />
400,000 metric tons of insulation material sold annually<br />
by <strong>BASF</strong> save over 110 million metric tons of greenhouse<br />
gases.<br />
ACTiOn PlAn CliMATE PROTECTiOn<br />
• New ambitious climate protection goals<br />
• Corporate Carbon Footprint reporting<br />
• Appointment of the Climate Protection Officer<br />
• Global expert group for climate change monitoring<br />
• Energy efficiency program in production<br />
<strong>BASF</strong> REPORT <strong>2008</strong><br />
101
102<br />
MAnAgEMEnT’S AnAlySiS<br />
Environment and Safety Energy<br />
EnERgy<br />
The conservation of resources is a fundamental economic<br />
principle for us. Therefore, we strive continually<br />
to generate and use energy efficiently. Energy efficiency<br />
will be one of the most valuable future energy<br />
sources as it brings together climate protection, resource<br />
conservation and economic benefit.<br />
2020 Goal<br />
Increase energy efficiency<br />
+25%<br />
<strong>BASF</strong> REPORT <strong>2008</strong><br />
We want to improve the specific<br />
energy efficiency of our production<br />
processes by 25% compared with<br />
the baseline of 2002.<br />
Energy efficiency is the most important means of reducing<br />
our energy consumption and conserving resources. In<br />
<strong>2008</strong>, we set a new quantitative goal to improve energy<br />
efficiency through a wide range of measures. One element<br />
of our energy management is a global initiative to reduce<br />
energy use in our chemical plants and achieve more efficient<br />
energy production and distribution at our sites. The<br />
most costefficient measures are connected with replacement<br />
investments.<br />
The use of combined heat and power (CHP) plants,<br />
energy optimization of production processes as well as<br />
structural changes, increased our energy efficiency by<br />
22% from 2002 to <strong>2008</strong>. As part of our energy efficiency<br />
program, we are currently evaluating the most energy intensive<br />
plants at our Ludwigshafen, Germany site. Over the<br />
next three years, we aim to review and identify potential<br />
savings at these plants, which account for around 80% of<br />
our total site energy consumption.<br />
EnERgy EFFiCiEnCy AT <strong>BASF</strong><br />
• Cost reduction, climate protection, resource<br />
conservation<br />
• Quantitative goal to increase energy efficiency<br />
• Threepronged strategy to achieve energy goal:<br />
efficient energy production, savings through the<br />
Energy Verbund and successful energy<br />
management<br />
Energy efficiency in the production of energy<br />
Energy is one of the main cost factors in the production of<br />
chemicals. To supply our production sites with energy, we<br />
use combined cycle gas turbines in our CHP plants which<br />
operate with a fuel efficiency of almost 90%. Worldwide, 16<br />
<strong>BASF</strong>owned CHP plants, and seven plants operated by<br />
external partners, supply our operations with electricity and<br />
steam.<br />
Energy efficiency through the verbund<br />
Our Verbund system links our production and energy supply<br />
networks, thus making a major contribution to energy<br />
efficiency. Crude oil and natural gas are used not only as<br />
raw materials, but also to fuel electricity and steam generation.<br />
Heat from production processes is not discharged<br />
to the environment; rather it is captured to power other<br />
production plants. This principle is applied at all major<br />
<strong>BASF</strong> production sites. Without this Energy Verbund, the<br />
total energy needed to generate electricity and steam in<br />
<strong>BASF</strong> Group power plants in <strong>2008</strong> would have been<br />
a round 4.5 million metric tons of oil equivalent – approximately<br />
54% higher than the actual figure of 2.9 million<br />
metric tons.<br />
Energy efficiency through energy management<br />
<strong>BASF</strong>’s energy management incorporates all our activities<br />
to analyze and continually improve our energy efficiency.<br />
Based on the worldwide energy data in our Responsible<br />
Care database, our experts measure current energy use<br />
and costs, and evaluate potential energy savings. On this<br />
basis, we establish energy goals and design measures to<br />
achieve them. In developing new processes, we use complex<br />
simulations and optimization models. They help us,<br />
for example, to optimize the energy requirements of existing<br />
or future plants from an economic viewpoint.<br />
EnERgy vERBund<br />
• Contribution to the efficient use of energy<br />
• Linking of production and energy supply networks<br />
• Savings of 1.6 million metric tons of oil equivalent<br />
through the generation of electricity and steam in<br />
<strong>BASF</strong> Group’s power plants
Energy supply of the <strong>BASF</strong> group <strong>2008</strong><br />
2<br />
Electricity supply<br />
Electricity<br />
1 -- Self generated: 69%<br />
14.4 million<br />
MWhel<br />
2 -- Purchased: 31% 1<br />
Steam supply<br />
1 -- Self generated: 44%<br />
2 -- Waste heat: 45%<br />
3 -- Purchased: 11%<br />
2<br />
3<br />
Steam<br />
52.4 million<br />
metric tons<br />
1<br />
Generated in <strong>BASF</strong>’s own power plants<br />
by using fossil and residual fuels<br />
87%<br />
1%<br />
1%<br />
11%<br />
Natural gas<br />
29.5 million MWh<br />
Heating oil<br />
0.3 million MWh<br />
Coal<br />
0.2 million MWh<br />
Residual fuels<br />
3.7 million MWh<br />
Total: 33.7 million MWh<br />
MAnAgEMEnT’S AnAlySiS<br />
Environment and Safety Energy<br />
In <strong>2008</strong>, <strong>BASF</strong>’s total electricity requirements amounted to 14.4 million MWh el. In addition, a total of 52.4 million metric tons of steam was distributed via steam networks.<br />
This electricity and steam is generated in central <strong>BASF</strong> power plants. In <strong>2008</strong>, we used 33.7 million MWh of fossil and residual fuels worldwide to generate this<br />
electricity and steam. The amount of primary fuels used (30.0 million MWh) corresponds to 60% of the total of primary fuel used in the <strong>BASF</strong> Group. 9.9 million MWh el<br />
of electrical power and 22.9 million metric tons of steam were generated. We used cogeneration as the primary source of energy supply for our sites. Compared with<br />
conventional generation of electricity and steam, this saved approximately 10.9 million MWh of fossil fuels.<br />
At our Ludwigshafen site, 17 production plants are currently<br />
using an inhouse solution that provides realtime data<br />
on energy and raw material consumption. Since 2006, this<br />
information has helped reduce annual costs in these plants<br />
by over €1.5 million.<br />
Sources of energy<br />
We continue to rely on a balanced mix of energy and raw<br />
materials that includes all conventional fuels. We also evaluate<br />
renewable energy sources. These only achieve a permanent<br />
place in our energy mix, if they are assessed to be<br />
competitive. Our energy management research cluster focuses<br />
on the energies of the future. Several products in<br />
our portfolio contribute to the development of renewable<br />
REnEWABlE RAW MATERiAlS<br />
energy, for example in catalysis and electrochemistry for<br />
fuel cells. In <strong>2008</strong>, the German Aerospace Center presented<br />
the first manned airplane that can takeoff and fly exclusively<br />
with a fuel cell fitted with <strong>BASF</strong>’s Celtecmembrane<br />
electrode assemblies (MEA).<br />
More information on energy efficiency can be found at<br />
basf.com/resource_conservation<br />
Renewable raw materials are used in the manufacture of products. As for all sources of raw materials, we place a high<br />
priority on selecting the most sustainable resource for each application. We use renewable raw materials where they offer<br />
economic or environmental advantages.<br />
We are researching new applications in many areas. Successful examples include bioplastics such as Ecovio ® and<br />
Lupranol ® Balance. We are also developing products such as catalysts and process chemicals for the decomposition<br />
of biomass to facilitate the use of renewable raw materials. Our crop protection products and plant biotechnology<br />
contribute to raising the yields and quality of renewable raw materials.<br />
<strong>BASF</strong> REPORT <strong>2008</strong><br />
103
104<br />
MAnAgEMEnT’S AnAlySiS<br />
Environment and Safety Water<br />
WATER<br />
Worldwide, water is becoming an increasingly scarce<br />
resource. The sustainable use of water and worldwide<br />
conservation of natural water resources are therefore<br />
of concern to us. Our water conservation strategy is<br />
built on three pillars: We minimize our water consumption,<br />
reduce emissions to water from our production<br />
processes, and offer products that save water and<br />
improve water quality.<br />
Ensuring worldwide access to clean water is one of the<br />
major global challenges of the future. Through responsible<br />
use of water and innovative technologies which help our<br />
customers to use water sustainably, we contribute to the<br />
implementation of the U.N. Millennium Goal to maintain and<br />
improve access to safe drinking water.<br />
<strong>BASF</strong> uses water in the manufacture of products, for<br />
cooling and cleaning, and as a means of transportation.<br />
Water conservation is primarily a local responsibility. At our<br />
sites, we plan to systematically evaluate the sustainability<br />
of our water sources and to identify potential risks regarding<br />
future water supply. By 2015, we will also review our<br />
water conservation concepts at our large production sites.<br />
Our commitment to worldwide partnerships in this field<br />
enables us to improve our knowledge and share our expertise<br />
with others. In <strong>2008</strong>, we became a strategic partner in<br />
the European Water Partnership.<br />
Water consumption at <strong>BASF</strong><br />
We continually reduce our water consumption and reuse<br />
as much water as possible in our circuit systems. In <strong>2008</strong>,<br />
<strong>BASF</strong> used 2,058 million cubic meters (2007: 2,093 million<br />
cubic meters) of water worldwide. Of this amount, 95%<br />
was drawn from rivers and lakes. Groundwater accounted<br />
for around 4%, and around 1% was drinking water. The<br />
vast majority of the water is used for cooling. However, the<br />
benefits achieved by recirculating this water are offset by<br />
Emissions to water<br />
(reduction compared with baseline 2002)<br />
0%<br />
–20%<br />
–40%<br />
–60%<br />
–80%<br />
–5.2<br />
<strong>BASF</strong> REPORT <strong>2008</strong><br />
Organic substances (COD) Nitrogen<br />
–51.7<br />
–64.2<br />
–65.9<br />
Goal 2020 –77.5 Goal 2020<br />
–73.1 –76.3<br />
–16.5<br />
–60.5<br />
an increase in energy needed for recooling. The challenge<br />
is to achieve both goals simultaneously: to reduce energy<br />
consumption, and, at the same time, save the amount of<br />
cooling water used.<br />
Clean water from production<br />
One tenth of the water used by <strong>BASF</strong> comes into contact<br />
with our products. We are continually working on reducing<br />
emissions to water from production processes and have<br />
set ourselves ambitious goals. At our large production<br />
sites, wastewater from production processes and graywater<br />
are treated biologically in our own wastewater treatment<br />
plants. At our smaller sites, wastewater and graywater<br />
are discharged to municipal or industrial wastewater<br />
treatment plants for cleaning.<br />
2020 Goal<br />
Reduce emissions to water<br />
We aim to reduce emissions of both organic substances and<br />
nitrogen to water by 80% and of heavy metals by 60%, compared<br />
with the baseline year 2002.<br />
In <strong>2008</strong>, <strong>BASF</strong> discharged a total of 183 million cubic<br />
meters of wastewater. In <strong>2008</strong>, we reduced emissions of<br />
organic substances to water by 77.5% compared with<br />
2002. Emissions of organic substances – calculated as<br />
chemical oxygen demand (COD) – amounted to around<br />
20,600 metric tons (2007: 31,200 metric tons). Emissions<br />
to water of nitrogen (N total) were 4,400 metric tons (2007:<br />
5,300 metric tons). This amounts to a reduction of 80.3%<br />
compared with the baseline year 2002. Emissions of phosphorous<br />
were 376 metric tons (2007: 437 metric tons).<br />
Our wastewater contained 27 metric tons of heavy metals<br />
(2007: 34 metric tons). We achieved this reduction through<br />
–80.3<br />
Goal 2020<br />
–23.0<br />
–26.2<br />
Heavy metals<br />
2004 2005 2006 2007 <strong>2008</strong><br />
2004 2005 2006 2007 <strong>2008</strong><br />
2004 2005 2006 2007 <strong>2008</strong><br />
–42.6<br />
–44.3<br />
–55.9
Water balance of the <strong>BASF</strong> group in <strong>2008</strong><br />
(million cubic meters per year)<br />
2 3<br />
1<br />
Supply<br />
1 -- Surface water<br />
1,951 (95%)<br />
2 -- Groundwater<br />
82 (4%)<br />
3 -- Drinking water<br />
25 (1%)<br />
89.9%<br />
10.1%<br />
Total:<br />
1 Total from production processes, graywater, rinsing and purification in production<br />
technical improvements to the wastewater treatment plant<br />
at our catalysts production site in Nanjing, China. Changes<br />
in our product portfolio also contributed to this reduction.<br />
We cut heavy metal emissions by 55.9% compared with<br />
2002.<br />
The reduction of emissions to water in <strong>2008</strong> is due to<br />
improvements in wastewater treatment, the temporary<br />
decline in production volumes, and structural changes.<br />
Business opportunities through water conservation<br />
Many of our products help to prevent pollution in areas<br />
where water is scarce. The engineering plastic Ultrason ® ,<br />
for example, is used in filter membranes for cleaning and<br />
treating water. Other products help to save water and conserve<br />
resources during their manufacture and their use.<br />
During the production of our new detergent surfactant<br />
Lutensol M ® , for example, fewer emissions are released<br />
to wastewater than with other surfactants. The <strong>BASF</strong><br />
Specific emissions<br />
per metric ton of sales product (changes compared with 2007)<br />
Emissions to water<br />
Nitrogen (12.9 %)<br />
Organic substances (COD) (31.2%)<br />
Heavy metals (17.5 %)<br />
Use<br />
Cooling<br />
2,370<br />
(of which 562 are<br />
reused repeatedly)<br />
Production 1<br />
266<br />
2.636<br />
MAnAgEMEnT’S AnAlySiS<br />
Environment and Safety Water<br />
Discharge<br />
1 -- Cooling water (uncontaminated)<br />
1,808 (91%)<br />
2 -- Wastewater from production<br />
167 (8%)<br />
3 -- Graywater<br />
15 (1%)<br />
Color Fast Finish process enables onestep textile dyeing<br />
and finishing, thus saving water and energy.<br />
Through our EcoEfficiency Analysis, we assess the<br />
risks and opportunities of selected products and processes<br />
with regard to water use and impact. As part of our sustainability<br />
service “Success”, we support customers with<br />
our expertise in handling contaminated soil and groundwater,<br />
water supply, wastewater treatment and water conservation.<br />
WATER COnSERvATiOn<br />
• Reduce our own water consumption<br />
• Further reduce emissions to water<br />
• Products to improve water quality<br />
• Products to help our customers save water<br />
2<br />
3<br />
<strong>BASF</strong> REPORT <strong>2008</strong><br />
1<br />
105
106<br />
MAnAgEMEnT’S AnAlySiS<br />
Environment and Safety Environmental and Safety Management<br />
EnviROnMEnTAl And SAFETy MAnAgEMEnT<br />
We work continually to improve environmental protection,<br />
health and safety at <strong>BASF</strong> and set ourselves ambitious<br />
goals. Our global Responsible Care ® Management<br />
System and uniform global directives ensure that<br />
our standards are the basis of day-to-day work at all<br />
sites. We have, for example, established clear directives<br />
for plant safety and the transportation of our<br />
products. They help us protect our employees and<br />
neighbors, and secure our productivity.<br />
Responsible Care Management<br />
<strong>BASF</strong> supports the chemical industry’s voluntary commitment<br />
to the global Responsible Care initiative, and in 2006,<br />
coinitiated the Responsible Care Global Charter of the<br />
International Council of Chemical Associations.<br />
Experts from our Responsible Care network coordinate<br />
all <strong>BASF</strong> activities in the areas of environmental protection,<br />
health and safety. They develop worldwide standards, for<br />
example, directives on the construction of plants. The<br />
activities of this global network contribute to the Responsible<br />
Care initiative. With success: In <strong>2008</strong>, <strong>BASF</strong> Indonesia<br />
received a Responsible Care distinction for excellence<br />
in safety management.<br />
We launched our revised, globally valid Responsible<br />
Care Management System in the summer of 2007. It supports<br />
managers in promoting Responsible Care and sets<br />
the framework for the safe production, transportation and<br />
handling of chemicals. In <strong>2008</strong>, the American Chemistry<br />
Council distinguished <strong>BASF</strong> Corporation with the Responsible<br />
Care Leadership Award for its implementation of<br />
Responsible Care management in the United States. All<br />
<strong>BASF</strong> sites worldwide report to our Responsible Care<br />
database in which information on emissions, energy, occupational<br />
safety, health protection and distribution safety<br />
is captured. In <strong>2008</strong>, we began the introduction of a new<br />
incident database to better analyze accidents and near<br />
RESPOnSiBlE CARE MAnAgEMEnT<br />
<strong>BASF</strong> REPORT <strong>2008</strong><br />
accidents. Detailed data on accidents, environmental and<br />
transport incidents and damage are centrally recorded.<br />
Thus potential sources of mistakes can be identified faster<br />
and eliminated systematically. In <strong>2008</strong>, <strong>BASF</strong> had no<br />
events with relevant environmental impact of importance<br />
to the Consolidated Financial Statements.<br />
More information on this topic can be found at basf.com/responsible-care_e<br />
More information on occupational safety can be found on page 95,<br />
health protection on page 96, and product stewardship on page 110<br />
Audits<br />
We audit our internal environment, health and safety performance<br />
regularly on the basis of a standard global procedure.<br />
<strong>BASF</strong>’s environment, safety and occupational<br />
medicine experts audit sites and plants, and monitor the<br />
implementation of our global standards using an inspection<br />
catalog. Their audit recommendations help us to further<br />
improve our environment and safety performance. In<br />
addition, the international audit team meets regularly to<br />
ensure global consistency of the audit systems and to<br />
develop them further. Our internal audit system is in line<br />
with the standards and criteria of external auditing proc edures.<br />
A total of 149 of our production sites are certified in<br />
accordance with ISO 14001 or EMAS.<br />
In <strong>2008</strong>, 86 environmental and safety audits were carried<br />
out at 71 sites in the <strong>BASF</strong> Group. In addition, there<br />
were 34 audits on occupational medicine and health protection<br />
at 34 sites.<br />
More information on certified sites can be found at basf.com/certified<br />
Reduction of air pollutants<br />
The examination of the emissions from our plants is an<br />
integral part of our environmental management. In addition<br />
to measuring greenhouse gas emissions, we also measure<br />
emissions of air pollutants. Air pollutants include inorganic<br />
compounds such as carbon monoxide (CO), sulfur dioxide<br />
• Coordinates activities in the areas of environmental protection, health and safety<br />
• Supports management to further promote Responsible Care<br />
• Comprises nine key sectors at <strong>BASF</strong>: environmental protection, process safety, transport and distribution safety,<br />
emergency response, product stewardship, health protection, occupational safety, dialogue and security
(SO 2), nitrogen oxides (N 2O), ammonia and other inorganic<br />
compounds, dust, heavy metals and volatile organic compounds<br />
(NMVOCs). In <strong>2008</strong>, emissions to air from <strong>BASF</strong>’s<br />
chemical operations totaled 36,500 metric tons (2007:<br />
50,600 metric tons). Due to process optimization, emissions<br />
of ozonedepleting substances as defined by the<br />
Montreal Protocol totaled only 63 metric tons (2007: 99<br />
metric tons). In <strong>2008</strong>, heavy metals emissions were<br />
reduced to a total of 8 metric tons (2007: 22 metric tons)<br />
primarily due to the installation of a new dust filter at the<br />
catalysts production site in Nanjing, China.<br />
Emissions to air<br />
Air pollutants 1 (reduction compared with baseline 2002)<br />
0%<br />
–10%<br />
–20%<br />
–30%<br />
–40%<br />
–50%<br />
–60%<br />
–70%<br />
2003<br />
–4.0<br />
2004<br />
–37.0<br />
2005<br />
–40.5<br />
2006<br />
–42.6<br />
1 Consist of: CO, NOx (Sum of NO 2 + NO, calculated as NO 2),<br />
NMVOC (Non-methane volatile organic compounds, SO x,<br />
dust and NH 3/other inorganics<br />
2007<br />
–40.9<br />
<strong>2008</strong><br />
–57.3<br />
Goal 2020<br />
Our goal is to further reduce the emissions of air pollutants<br />
from our chemical plants by 70% by 2020. We remain<br />
focused on our goal to reduce absolute emissions even<br />
when our portfolio changes. In <strong>2008</strong>, structural changes<br />
and economic fluctuation led to lower emission levels. We<br />
also reduced emissions of air pollutants through technical<br />
improvements. Since the end of 2007, the thermoreactor<br />
in the phthalic anhydride plant at our Ludwigshafen site<br />
has made a significant contribution to this reduction.<br />
MAnAgEMEnT’S AnAlySiS<br />
Environment and Safety Environmental and Safety Management<br />
2020 Goal<br />
Reduce emissions of air pollutants<br />
–70%<br />
We aim to reduce air pollutants<br />
from our chemical plants by 70%<br />
compared with 2002.<br />
Waste management<br />
At <strong>BASF</strong>, the appropriate disposal of waste is beyond question.<br />
Our fundamental principles are “avoid, reduce, recycle.”<br />
Residual waste is only disposed of when all other possibilities<br />
are exhausted. Sewage sludge from the <strong>BASF</strong><br />
wastewater treatment facility at the Ludwigshafen site, for<br />
example, is used to generate electricity and heating. In addition,<br />
since the beginning of <strong>2008</strong>, the sludge has been<br />
enriched by the addition of substitute fuels for thermal recovery.<br />
Worldwide, <strong>BASF</strong> produced around 1.77 million<br />
metric tons of waste in <strong>2008</strong> (2007: 1.93 million metric<br />
tons). Oil and gas exploration accounted for 0.15 million<br />
metric tons. Around 43% of our waste was recycled or subjected<br />
to thermal recovery. We aim to further improve this<br />
figure. The remainder was disposed of: 16% thereof underground,<br />
44% was incinerated, and 40% in landfills. In line<br />
with the customary international categories, 484,800 metric<br />
tons of our disposal waste was classified as hazardous<br />
and 529,600 metric tons as nonhazardous.<br />
Process safety<br />
Safety is of the utmost priority in our plants. This is how we<br />
protect the health of our employees and neighbors, and<br />
avoid environmental damage and production stoppages.<br />
We introduced a fivestage system for the planning of<br />
plants, to avoid product spillages, fires and explosions. It<br />
covers all important aspects in the areas of environmental<br />
RESPOnSiBlE CARE AudiTS EMERgEnCy RESPOnSE<br />
• 86 audits on environmental protection and<br />
occupational safety<br />
• 34 audits on occupational medicine and health<br />
protection<br />
• Findings to improve environmental, health and<br />
safety performance<br />
• Alarm plan with information on our plants, and on fire<br />
and explosion protection<br />
• Regular monitoring of our emergency systems<br />
• Local teams for incident and crisis management<br />
<strong>BASF</strong> REPORT <strong>2008</strong><br />
107
108<br />
MAnAgEMEnT’S AnAlySiS<br />
Environment and Safety Environmental and Safety Management<br />
protection, health and safety from the design of a plant to<br />
the startup of production. In order to ensure uniform safety<br />
standards, we place particular importance on training<br />
and further education for our safety experts worldwide. We<br />
hold regular seminars on process safety and protection<br />
against explosions. In these seminars, we place emphasis<br />
on the exchange of information on instruments to improve<br />
process safety, such as the use of new safety concepts or<br />
our risk matrix. The matrix is used as part of the hazard assessment<br />
process to classify potential risks according to<br />
their impact and estimated frequency. Various risk levels<br />
and appropriate measures are derived from this matrix.<br />
More information on this topic can be found at basf.com/process_safety<br />
Emergency response<br />
We prepare carefully for potential incidents. For this, we<br />
are continually improving our emergency response. Our<br />
emergency response plans include information on each<br />
plant, an alarm plan, and information on fire control and<br />
explosion protection.<br />
Worldwide, our subsidiaries and joint ventures, suppliers,<br />
customers, neighboring companies, municipalities,<br />
and communities in which we operate are included in<br />
these plans. Prevention is the essential factor in all our<br />
environment, health and safety activities. We regularly<br />
check our emergency systems, for example in emergency<br />
drills with our employees and local authorities. We have<br />
local incident and crisis management teams at our sites<br />
which we support from our Ludwigshafen site. Our emergency<br />
response is available around the clock.<br />
A swift response is also essential if accidents occur<br />
while chemicals are being transported. This is why we are<br />
actively involved in networks to quickly provide information<br />
and assist in emergencies. These include the German<br />
Transport, Accident, Information and Emergency Response<br />
System (TUIS), and the International Chemical Environ<br />
Transportation accidents per 10,000 shipments<br />
(reduction compared with baseline 2003: 35.7%)<br />
<strong>2008</strong><br />
2007<br />
2006<br />
2005<br />
2004<br />
2003<br />
<strong>BASF</strong> REPORT <strong>2008</strong><br />
0<br />
0.2 0.4 0.6<br />
0.28<br />
0.36<br />
0.45<br />
0.47<br />
0.50<br />
0.56<br />
mental (ICE) initiative. In addition, we have an international<br />
network of emergency assistance and emergency response<br />
centers, primarily in Europe and in North and South<br />
America, and, since <strong>2008</strong>, also at important production<br />
sites in Asia.<br />
More information on this topic can be found at basf.com/emergency_response<br />
2020 Goal<br />
Reduce transportation accidents<br />
– 70%<br />
We aim to reduce the rate of<br />
transportation accidents worldwide<br />
per 10,000 shipments by<br />
70% compared with 2003.<br />
improved transportation and distribution safety<br />
Safe transportation and storage of products is part of our<br />
social responsibility. Uniform standards for the transportation<br />
and storage of chemical products are determined in<br />
directives. They define responsibilities, requirements and<br />
assessment methods. Our safety advisers are tasked with<br />
ensuring that internal, national and international transportation<br />
regulations are adhered to during all transports. If an<br />
accident occurs, they collect and analyze all the relevant<br />
information. Their reports help us to develop strategies and<br />
measures in order to avoid similar incidents in the future.<br />
We have reduced the number of transportation accidents<br />
from 0.56 in 2003 to 0.36 per 10,000 transports in <strong>2008</strong><br />
(2007: 0.28). In spite of the increase in <strong>2008</strong> compared with<br />
2007, the longterm trend toward fewer accidents continues.<br />
These figures are based on accidents reported to us<br />
by our logistics partners. Product spillages during transport<br />
are recorded and assessed separately.<br />
More information on this topic can be found at basf.com/distribution_safety<br />
SAFETy duRing TRAnSPORTATiOn<br />
• Evaluation of carriers using the “Safety Quality<br />
Assessment System”<br />
• Safety and quality assessment of marine transportation<br />
by independent experts<br />
• Global standards<br />
• High performance organization<br />
• Reliable logistics partners
Safety of our logistics partners<br />
In our supply chain, collaboration with our external logistics<br />
providers is also oriented toward safety. We use<br />
approved systems such as the Safety Quality Assessment<br />
System (SQAS) to evaluate the performance of our carriers.<br />
This assessment system was developed under the<br />
leadership of the European Chemical Industry Association<br />
(CEFIC). It provides information regarding issues such as<br />
the training level of carrier employees, accident response<br />
times and equipment carried by vehicles.<br />
Safety and quality assessments of tankers are carried<br />
out globally by the Chemical Distribution Institute (CDI).<br />
Independent specialists assess ship conditions, technical<br />
equipment and operations. As a CDI member, <strong>BASF</strong> evaluates<br />
these safety reports and uses the results as a basis<br />
to decide which vessels to use for transportation.<br />
Crime prevention<br />
Our corporate security concept is also based on the principle<br />
of prevention. We protect <strong>BASF</strong>’s employees, plants<br />
and knowhow against crime, terrorism, sabotage and<br />
espionage. We ensure this through consistent worldwide<br />
standards, measures to protect company knowledge and<br />
a network of corporate security and information protection<br />
officers. <strong>BASF</strong> is one of the few companies to integrate<br />
security into its worldwide Responsible Care Management<br />
System. The protection measures are adapted by our sites<br />
to local conditions. In addition, we involve employees by<br />
informing them about potential risks and through specific<br />
training. We can determine the location of an employee on<br />
a business trip at short notice and provide protective measures<br />
if needed.<br />
Respecting human rights in our security work is unques<br />
tionable. This is why the topic of human rights, for<br />
example, is integrated into the basic training of <strong>BASF</strong><br />
security officers in Germany.<br />
EnviROnMEnTAl PROTECTiOn COSTS<br />
MAnAgEMEnT’S AnAlySiS<br />
Environment and Safety Environmental and Safety Management<br />
Safety of suppliers and service providers<br />
Our directives on environmental protection, health and<br />
safety also apply to employees of other companies who<br />
work at our sites. In addition, <strong>BASF</strong> companies and joint<br />
ventures in which we hold a majority stake, are required to<br />
assess the performance of contractors. We expect service<br />
providers and suppliers to adhere to our global directives<br />
and monitor their compliance. If we detect shortcomings,<br />
we support companies in eliminating them.<br />
• Overall costs of operating environmental protection facilities throughout the <strong>BASF</strong> Group: €706 million in <strong>2008</strong><br />
(2007: €640 million)<br />
• Additional investments in new and improved environmental protection plants and facilities: €165 million<br />
(2007: €103 million); these investments involved both endofpipe measures as well as integrated environmental<br />
protection measures<br />
<strong>BASF</strong> REPORT <strong>2008</strong><br />
109
110<br />
MAnAgEMEnT’S AnAlySiS<br />
Environment and Safety Product Stewardship<br />
PROduCT STEWARdShiP<br />
We make sure that our products are safe and pose no<br />
danger to people or the environment when they are<br />
used responsibly and in the manner intended. The basis<br />
for this are risk assessments and safety information<br />
for all products which we update continuously. via our<br />
global database, we can provide information on all our<br />
products worldwide at any time.<br />
global product stewardship<br />
<strong>BASF</strong> offers a wide range of products, which are used in<br />
all industry sectors. We strive for an equal standard of<br />
pro duct safety and product stewardship worldwide – a<br />
standard which exceeds mere compliance with legal<br />
requirements. Uptodate safety data sheets on our sales<br />
products are available in 34 languages. Via a global network<br />
of emergency telephone numbers we provide information<br />
on <strong>BASF</strong> products 24 hours a day, 7 days a week.<br />
If desired, we also offer our customers customized training<br />
courses and workshops on the safe use of our products.<br />
Partnership for product safety<br />
Our product safety experts work in scientific expert groups,<br />
together with public authorities and partners from science and<br />
industry, to analyze and evaluate research studies. The aim is<br />
to establish precise and consistent classification and labeling.<br />
<strong>BASF</strong> supports the creation of a globally harmonized system<br />
(GHS) for the classification and labeling of chemical substances<br />
and mixtures. We are engaged on a voluntary basis in important<br />
international programs, such as the United Nations’<br />
Strategic Approach for International Chemicals Management<br />
(SAICM) and the Global Product Strategy (GPS) of the International<br />
Council of Chemical Associations (ICCA). Through<br />
GPS, for the first time, global standards and practices are being<br />
established to improve the safety of using chemical products<br />
worldwide, and in doing so, are contributing to the implementation<br />
of the Responsible Care Global Charter.<br />
glOBAl PROduCT STEWARdShiP diRECTivE<br />
<strong>BASF</strong> REPORT <strong>2008</strong><br />
The aim is to strengthen public confidence in the chemical industry<br />
and its products, and to minimize the present differences<br />
in chemical safety standards between developing, transition<br />
and industrialized countries. Our international Product<br />
Safety and Product Stewardship team of experts coordinates<br />
our global activities in this field, including the exchange of<br />
best practices and trainings. The team analyzes audit results<br />
and uses their findings to make proposals for future improvements.<br />
2015 Goal<br />
Risk assessments of substances<br />
Based on a risk assessment, we want to review all substances<br />
produced or sold worldwide in the <strong>BASF</strong> Group in quantities of<br />
more than 1 metric ton per year by 2015.<br />
Our previous <strong>2008</strong> goal was achieved: The data records<br />
for substances handled by <strong>BASF</strong> in quantities of more than<br />
1 metric ton per year were completed as planned. As our<br />
product portfolio is constantly changing through, for example,<br />
acquisitions and innovations, we continue to update<br />
our global database with information on new substances<br />
and products. With our new product stewardship<br />
goals, we go significantly beyond the previous goals: We<br />
want to review all the substances we sell in substantial<br />
quantities worldwide based on risk assessments in line<br />
with REACH specifications. In addition, we want to conduct<br />
similar assessments of those products that we sell in<br />
similar annual quantities – regardless of the volume of individual<br />
substances they contain. In this way, we go far beyond<br />
the statutory requirements.<br />
Product stewardship is more than just a question of safety: It is an important part of our risk management. Our new<br />
global directive includes our voluntary commitment to product stewardship, together with worldwide goals. The directive<br />
stipulates that we evaluate the safety of our products throughout the entire value chain. It applies to all our ope rative<br />
decision makers worldwide who are responsible for its implementation. The network of product safety and product<br />
stewardship experts supports them in this task.<br />
More information can be found at basf.com/product_stewardship
2020 Goal<br />
Risk assessment of products<br />
Based on a risk assessment, we want to review all products<br />
sold worldwide in quantities of more than 1 metric ton per year<br />
by 2020.<br />
REACh implementation status<br />
The European Union’s regulation on chemicals, REACH,<br />
sets out the terms for the registration, evaluation and<br />
authorization of chemicals. We began preparing for REACH<br />
as far back as 2004: In a central database, the REACH<br />
Tracking System, we can track the status of all substances<br />
that have to be registered. During the preregistration<br />
phase, which ended on December 1, <strong>2008</strong>, <strong>BASF</strong> sub<br />
mitted more than 40,000 preregistrations for several<br />
thousand substances. Through this we can now prevent<br />
interruptions in the production, delivery and sales of substan<br />
ces. The first registration phase is now starting and<br />
must be completed by November 2010. In this phase, all<br />
largevolume substances of more than 1,000 tons, envi<br />
ronmentally dangerous substances and substances with<br />
carcinogenic, mutagenic or reprotoxic effects (CMR substances),<br />
will be registered. We anticipate average annual<br />
costs of €50 million per year until completion of the<br />
REACH implementation in 2018.<br />
Eco-toxicological and toxicological testing<br />
Before placing our products on the market, we subject<br />
them to extensive ecotoxicological and toxicological<br />
testing, and register them with the respective national and<br />
international authorities. For many such tests, animal<br />
studies are legally required. REACH demands even more<br />
information on the properties of chemical substances,<br />
WhAT iS RiSk ASSESSMEnT?<br />
We assess the risk of a substance from the combination<br />
of its hazardous properties and the potential impact on<br />
people and the environment. We analyze the potential<br />
danger of a substance based on its physicochemical<br />
properties as well as its toxicological and ecotoxicological<br />
effects. Based on this risk assessment, we determine the<br />
expected impact on people and the environment.<br />
MAnAgEMEnT’S AnAlySiS<br />
Environment and Safety Product Stewardship<br />
and this will result in an increase in the number of animal<br />
tests required by law.<br />
We are committed to the ethical principles of animal<br />
welfare and we have set ourselves the goal of developing<br />
and using alternative methods to animal testing in addition<br />
to intelligent test strategies. To date, very few animalfree<br />
alternative methods have been validated by the authorities.<br />
<strong>BASF</strong> uses all of these methods. For more than<br />
20 years, we have been involved in all relevant research<br />
initiatives to develop alternative and supplementary<br />
methods to animal testing, and we invest considerable<br />
resources in these projects. We have been able to substantially<br />
reduce the number of animals used in testing<br />
through a combination of alternative methods with measures<br />
to improve the validity of studies and intelligent<br />
testing strategies.<br />
More knowledge about nanomaterials<br />
Our standards for product stewardship apply to nano <br />
ma terials in the same way as for other products in our portfolio.<br />
Because more knowledge means more safety, we have<br />
been engaged in research on the safety of nanomaterials<br />
for a number of years. Advances in nanotechnology are<br />
accompanied by advances in toxicology, which will allow<br />
an even more comprehensive assessment of nanomaterials.<br />
Therefore we conduct toxicological experiments and<br />
participate in national and international research projects.<br />
The results are provided promptly to experts at symposia<br />
and from scientific journals, as well as to the wider public.<br />
For this purpose, we launched a website in <strong>2008</strong> where all<br />
the results of our safety research are published. In this<br />
way, we contribute to public and political dialogue as laid<br />
down in our code of conduct on nanotechnology.<br />
More information on safety research is available at<br />
basf.com/dialogue-nanotechnology/safety-research; more information<br />
on our nanotechnology dialogue can be found on page 32<br />
iMPlEMEnTing REACh<br />
• Preparations for REACH since 2004<br />
• Preregistration ended on December 1, <strong>2008</strong>; <strong>BASF</strong><br />
submitted more than 40,000 preregistrations<br />
• Start of the first phase of registration for largevolume<br />
substances, CMR substances, and environmentally<br />
hazardous substances<br />
• Average annual costs of €50 million until 2018<br />
<strong>BASF</strong> REPORT <strong>2008</strong><br />
111
112<br />
MAnAgEMEnT’S AnAlySiS<br />
Risk <strong>Report</strong><br />
RiSk REPORT<br />
identifying, evaluating and minimizing risks<br />
<strong>BASF</strong> risk management’s goal is to identify and evaluate<br />
risks as early as possible and limit business losses<br />
by taking suitable measures, thus avoiding risks that<br />
pose a threat to the company’s continued existence.<br />
We understand risk to be any event that could negatively<br />
impact the achievement of our short-term operational<br />
or long-term strategic goals. We define opportunities<br />
as possible successes that exceed our defined<br />
goals.<br />
Risk management is integrated into our planning and controlling<br />
processes to ensure its effectiveness and a close<br />
relationship to the business. Opportunities and risks are<br />
included and quantified within the planning framework; this<br />
ranges from shortterm business planning to longterm<br />
strategic and investment planning.<br />
Organization, responsibilities and tools<br />
Regular risk analyses are conducted by the following units:<br />
• Compliance<br />
• Corporate Controlling<br />
• Environment, Health & Safety<br />
• Finance<br />
• Global Procurement & Logistics<br />
• Human Resources<br />
• Legal, Taxes & Insurance<br />
• Strategic Planning & Controlling<br />
• Corporate Audit<br />
The Strategic Planning & Controlling and Finance divisions<br />
are responsible for centralized risk controlling. The Strategic<br />
Planning & Controlling division provides the necessary<br />
tools and knowhow, further develops the methods and is<br />
responsible for global communications. Specific individual<br />
risks pertaining to the operating divisions, corporate divi<br />
RiSk MAnAgEMEnT<br />
Strategy and goal<br />
• Earliest possible identification of risks<br />
• Taking measures to limit business losses<br />
• Avoid risks that threaten the company’s continued<br />
existence<br />
<strong>BASF</strong> REPORT <strong>2008</strong><br />
sions and competence centers as well as <strong>BASF</strong>wide risks,<br />
are permanently registered, evaluated and monitored centrally.<br />
Risk management process<br />
The risk management process comprises the following<br />
steps:<br />
• identification of opportunities and risks<br />
The identification of opportunities and risks is a bottomup<br />
process that uses a variety of tools, ranging from expert<br />
interviews to teambased approaches. These are<br />
complemented by market, competitive and environmental<br />
analyses as well as statistical evaluations. The above<br />
are based on internal and external risk information sources;<br />
macroeconomic scenarios that evaluate important<br />
factors, such as industry growth rates; as well as our<br />
companywide risk catalog, which acts as a checklist to<br />
manage the identification process.<br />
• Assessment and quantification<br />
Where possible, opportunities and risks are quantified as<br />
to their probability of occurrence and impact on profitability.<br />
The business plan serves as the reference base.<br />
In addition, we quantify the dependence of each business<br />
sector on macroeconomic factors, such as the<br />
development of key customer industries, exchange rates<br />
and raw material prices.<br />
• Aggregation<br />
Opportunities and risks as well as the dependence on<br />
macroeconomic factors are aggregated on the division<br />
and group level to determine the spectrum of possible<br />
effects on profit and the probability distribution. Correlations<br />
between the individual events and factors as well<br />
as effects caused by the transfer of products within the<br />
Verbund are taken into account.<br />
Processes<br />
• Identification of opportunities and risks<br />
• Assessment and quantification<br />
• Aggregation<br />
• Control and measures
• Control and measures<br />
The management of opportunities and risks, including<br />
the necessary countermeasures, takes place on the divisional<br />
level. For certain <strong>BASF</strong>wide risks these actions<br />
are taken at the <strong>BASF</strong>Group level. The details are governed<br />
by our risk management handbook, upon which<br />
divisional specific regulations are based.<br />
The Board of Executive Directors receives regular reports<br />
on the risk situation of the <strong>BASF</strong> Group, and additionally<br />
when certain risk thresholds are reached. The divisions,<br />
competence centers and regional divisions are responsible<br />
for operational risk management. Strategic opportunities<br />
and risks are quantitatively assessed in the product and<br />
regional strategies and are updated at least once a year as<br />
part of the strategic planning and controlling process. The<br />
assessments are immediately adjusted following significant<br />
changes to the opportunity and risk exposure. Our risk<br />
management process is constantly being developed and is<br />
reviewed by Corporate Audit and as part of the external<br />
audit of the annual financial statements.<br />
internal control system over financial reporting<br />
Significant features: In the Finance division, the corporate<br />
unit Financial <strong>Report</strong>ing Compliance provides methods for<br />
the structured, Groupwide and uniform evaluation of the<br />
internal control system for financial reporting.<br />
A risk catalog covers the significant risks to the <strong>BASF</strong><br />
Group regarding an intact control environment as well as<br />
proper financial reporting. The risk catalog is revised and<br />
updated annually.<br />
In a central selection process, companies and units are<br />
identified that are exposed to particular risks or that have a<br />
material impact on the Consolidated Financial Statements<br />
of the <strong>BASF</strong> Group or that provide related service processes.<br />
All significant <strong>BASF</strong> sites, regions and divisions are<br />
STRATEgiC PlAnning & COnTROlling<br />
uniT<br />
• Implementing risk management standards<br />
• Worldwide communication with the operating units,<br />
divisions, competence centers and regional divisions<br />
• Coordinating the companywide collection and evaluation<br />
of relevant risks<br />
•<br />
Proving knowhow and necessary tools<br />
MAnAgEMEnT’S AnAlySiS<br />
Risk <strong>Report</strong><br />
covered. The composition is decided on each year. In the<br />
companies and units, a responsible person is named who<br />
coordinates and monitors the execution of the following<br />
steps:<br />
yearly evaluation process: This consists of the following<br />
steps:<br />
• Evaluation of the control environment<br />
The adherence to internal and external guidelines that<br />
are relevant to the financial reporting process is checked<br />
through a standard questionnaire. Each responsible<br />
manager performs an appraisal based on sampling.<br />
• identification of control activities<br />
In order to counter the risks to the financial reporting process<br />
listed in our central risk catalog, corresponding<br />
control activities are conducted. The control activities of<br />
the largest companies and those with special risks are<br />
documented in a global IT system.<br />
• Appraisal of the control activities<br />
After the documentation, a test is performed to verify if<br />
the described control is capable of adequately countering<br />
the risk. In the following test phase, samples are taken<br />
to test the effectiveness of the controls.<br />
• Monitoring of control weaknesses<br />
Management receives reports on any control weaknesses<br />
and their elimination, and an interdisciplinary committee<br />
investigates their relevance to the <strong>BASF</strong> Group. The<br />
Board of Executive Directors is informed once control<br />
weaknesses are identified that have a considerable<br />
impact on financial reporting.<br />
• internal confirmation of the internal control system<br />
The responsible managing director and chief financial<br />
officer for each consolidated Group company confirm to<br />
the Board of Executive Directors of the <strong>BASF</strong> Group at<br />
inTERnAl COnTROl SySTEM OvER<br />
FinAnCiAl REPORTing<br />
• Corporate unit Financial <strong>Report</strong>ing Compliance<br />
• Evaluation of the internal control system for financial<br />
reporting, based on a central risk catalog<br />
• Selection of companies/units based on risks, significance<br />
for the Consolidated Financial Statements or services<br />
processes provided<br />
• Execution and monitoring of the individual steps through<br />
the companies/units<br />
<strong>BASF</strong> REPORT <strong>2008</strong><br />
113
114<br />
MAnAgEMEnT’S AnAlySiS<br />
Risk <strong>Report</strong><br />
the end of the annual cycle the effectiveness of the internal<br />
control system over accounting as well as the adequacy of<br />
financial reporting.<br />
Risks from the operating business<br />
development of sales markets: Because <strong>BASF</strong> is an<br />
important partner in many industries, shifts in demand naturally<br />
bring with them opportunities and risks.<br />
For 2009, we expect a weaker economic climate as a<br />
result of the worldwide financial crisis. Several divisions are<br />
directly affected by weaker demand in important customer<br />
industries, such as the construction and automotive industries,<br />
and stronger competition in sales markets. Other<br />
divisions are indirectly affected by a decline in the growth<br />
of demand for basic chemical products.<br />
The margins for commodities, such as those in the<br />
plastics business, are particularly exposed to productspecific<br />
supply and demand cycles.<br />
As a result of a price advantage in raw materials in the<br />
Middle East, there is currently a significant increase in the<br />
capacity for basic chemicals, such as ethylene and propylene.<br />
There is also the risk that demand in target markets<br />
will grow more slowly, thus resulting in a decline in margins.<br />
We reduce these risks in the <strong>BASF</strong> Verbund through<br />
diversification. We manage the construction and expansion<br />
of facilities for each product according to the expected<br />
demand and we schedule maintenance turnarounds accordingly.<br />
We divest businesses in which we do not see<br />
satisfactory opportunities to distinguish ourselves from our<br />
competitors in the long term.<br />
Financial difficulties arising from the financial crisis and<br />
customer bankruptcies could contribute to a downturn in<br />
customer demand.<br />
More information on the identification and assessment of such risks can be<br />
found in the section “default risks”<br />
COnTROl ACTiviTiES in ThE FinAnCiAl<br />
REPORTing PROCESS<br />
• Evaluation of the control environment<br />
• Identification of control activities<br />
• Appraisal of control activities<br />
• Monitoring of control weaknesses<br />
• Internal confirmation of the effectiveness of the<br />
internal control system<br />
<strong>BASF</strong> REPORT <strong>2008</strong><br />
Our planning takes the economic downturn into consideration.<br />
Opportunities and risks from market developments<br />
above or below our expectations are evaluated quantitatively.<br />
The possible spectrum of positive and negative plan<br />
deviations is captured in a probability distribution on division<br />
and group levels. The possible deviation from the plan<br />
may be significant. From a <strong>BASF</strong> Group perspective, this is<br />
limited by our high degree of diversification.<br />
Where possible, these risks are countered using operating<br />
measures: For example, through close cooperation<br />
with customers and the optimal management of our production.<br />
We limit the effects of the risks stemming from the<br />
current overall economic situation by means of a crisis<br />
management system focused on the shortterm. In this<br />
way, we react to the declining global demand by adjusting<br />
capacity utilization and by bringing forward maintenance<br />
turnarounds. A further aspect of balanced opportunity and<br />
risk management is to ensure that we are prepared for a<br />
possible recovery in order to optimally serve the needs of<br />
our customers.<br />
Additionally, there are longterm strategic measures,<br />
such as our international orientation, the continuous development<br />
of innovative products and systems, and active<br />
portfolio management. Constant research and development<br />
takes center stage in this. Furthermore, we shape our<br />
portfolio through internal optimization measures, and not<br />
least through acquisitions, through which we expand our<br />
position in various specialty segments.<br />
RiSkS FROM ThE OPERATing BuSinESS<br />
• Development of sales markets<br />
• Availability and price volatility of raw materials<br />
• Technical risks
Raw material availability and price volatility: The availability<br />
and price volatility of feedstock, especially of crudeoilbased<br />
chemicals and precious metals, pose opportunities<br />
and risks for <strong>BASF</strong>. Currently, we do not see risks arising<br />
from raw material availability. Given the current economic<br />
environment, however, the risk of failure of individual<br />
suppliers has increased. We minimize these risks through<br />
our wide portfolio, our global purchasing activities and<br />
optimized procedures for the purchase of additional quantities<br />
of raw materials on spot markets. When possible, we<br />
avoid procuring particular raw materials from a single supplier.<br />
Where this is not possible, we try to foster competition,<br />
or if this could not be done, we knowingly enter into<br />
these relationships and assess the effects of possible<br />
availability problems. We continually monitor the credit risk<br />
of important business partners, customers as well as suppliers.<br />
We adopt a similar approach regarding the purchasing<br />
of services in the field of logistics and technology.<br />
More information on the identification and assessment of such risks can be<br />
found in the section “default risks”<br />
We assume that the volatility of raw material prices in the<br />
future will be above the historical level. In order to take appropriate<br />
action, the effects of raw material price volatility<br />
and changing price expectations are mapped, taking the<br />
valueadding chains of the <strong>BASF</strong> Verbund into account.<br />
Our dependence on the oil price is reduced through the<br />
contribution of our oil and gas business. Furthermore, we<br />
minimize cost risks by using commodity derivatives. These<br />
measures help to secure margins when strongly rising raw<br />
material prices are expected, which can not be, or only to<br />
a limited extent, passed on via product prices. This could<br />
lead to costs if prices do not move as expected.<br />
dEvElOPMEnT OF SAlES MARkETS<br />
• Risks for 2009 from the recession in the wake of the<br />
financial crisis<br />
• Potential deviations from plans are reduced through a<br />
high degree of diversification<br />
• Operating measures include close cooperation with<br />
the customers and optimal planning of our production<br />
MAnAgEMEnT’S AnAlySiS<br />
Risk <strong>Report</strong><br />
Technical risks: Guaranteeing the quality and availability<br />
of our products can require unforeseen technical measures.<br />
Moreover, there is the risk that for safety reasons or<br />
due to technical problems, unscheduled plant shutdowns<br />
are required. We minimize these risks through the continuous<br />
improvement of facilities and processes and our global<br />
production Verbund.<br />
Financial risks<br />
The management of currency and interest rate risks is conducted<br />
in the Treasury department; the management of<br />
commodity price risks in the Global Procurement & Logistics<br />
competence center or through appropriately authorized<br />
Group companies. Detailed guidelines and procedures<br />
exist for dealing with financial risks. Among other<br />
things, they provide for the segregation of trading and<br />
back office functions.<br />
Exchange rate volatility: In global markets, risks arise<br />
from the movement in exchange rate parities. On the production<br />
side, we address exchange rate risks by having<br />
our local production sites.<br />
On the market side, there are risks arising from our<br />
customer industries.<br />
Financial foreign currency risks result from the translation<br />
of receivables, liabilities and other monetary items in<br />
terms of IAS 21 at the closing date rate into the functional<br />
currency of the respective Group company. In addition, we<br />
incorporate planned purchase and sales transactions in<br />
foreign currencies in our financial foreign currency risk<br />
man agement. These risks are hedged using derivative<br />
instruments.<br />
RAW MATERiAl AvAilABiliTy And<br />
PRiCE vOlATiliTy<br />
• Our activities in the exploration and production of oil<br />
and gas provide a partial offset for the impact on earnings<br />
of fluctuations in raw material prices<br />
• Use of commodity derivatives to hedge against rising<br />
raw material costs<br />
• Risk reduction through diversification in our portfolio<br />
<strong>BASF</strong> REPORT <strong>2008</strong><br />
115
116<br />
MAnAgEMEnT’S AnAlySiS<br />
Risk <strong>Report</strong><br />
interest rate risks: Interest rate risk result from changes in<br />
prevailing market interest rates, which can cause a change<br />
in the present value of fixedrate instruments, and changes<br />
in the interest payments of variablerate instruments. To<br />
hedge these risks, interest rate swaps and combined interest<br />
rate and currency derivatives are used.<br />
Risks from metal and raw materials trading: In the catalysts<br />
business, <strong>BASF</strong> employs commodity derivatives on<br />
base and precious metals and trades on behalf of third<br />
parties and on its own account. In addition, within predetermined<br />
limits and exposure constraints we use our<br />
knowledge of the markets for crude oil and oil products to<br />
generate earnings in the trade of raw materials. These<br />
activities are subject to constant monitoring.<br />
liquidity risks: Risks from cash flow fluctuations are recognized<br />
in a timely manner as part of our liquidity planning.<br />
The present increased uncertainties are taken into<br />
account by means of additional risk scenarios and the<br />
shortterm updating of our liquidity planning. This means<br />
we can promptly take the necessary measures when<br />
required.<br />
We issue longterm bonds to reduce refinancing risks. In<br />
addition, we also use bank loans to finance the growth of<br />
the <strong>BASF</strong> Group. In the course of the current financial and<br />
economic crisis, issuing bonds has become significantly<br />
more difficult and costly than in previous years. As a result<br />
of our good ratings, the ongoing commercial paper program<br />
and committed lines of bank credit, we have access to comprehensive<br />
liquid funds. The commercial paper program<br />
also constitutes a reliable liquidity source for <strong>BASF</strong> in the<br />
financial crisis.<br />
FinAnCiAl RiSkS<br />
• Currency and interest rate risks<br />
• Risks from metal and raw materials trading<br />
• Liquidity risks<br />
• Credit and default risks<br />
•<br />
Pension obligations<br />
<strong>BASF</strong> REPORT <strong>2008</strong><br />
default risks: We limit countryspecific risks through internal<br />
country ratings, which are continually updated to reflect<br />
changing environment conditions. We use export credit<br />
insurance and investment guarantees as the main tools to<br />
limit specific countryrelated risks.<br />
We lessen credit risks for our financial investments by<br />
engaging in transactions only with business partners and<br />
banks with good credit ratings and by adhering to fixed<br />
limits. Monetary transactions are also conducted through<br />
such banks. Against the background of the current economic<br />
crisis, we continuously check the creditworthiness<br />
of our partner banks. We reduce the risk of default on<br />
receivables by continually monitoring the creditworthiness<br />
and payment behavior of customers and by setting appropriate<br />
credit limits. Risks are also limited through the use of<br />
credit insurance and bank guarantees.<br />
More information on financial risks can be found in note 26 to the<br />
Consolidated Financial Statements “Financial risks and derivative financial<br />
instruments,” from page 212 onward<br />
Pension obligations: We predominantly finance company<br />
pension obligations externally through separate pension<br />
assets. In addition to the pension plans of our Group companies<br />
in North America, this applies particularly to <strong>BASF</strong><br />
Pensionskasse VVaG and the <strong>BASF</strong> Pensionstreuhand e.V.<br />
in Germany. We address the risk of pension plan underfunding<br />
due to market volatility of plan assets by aligning<br />
the investment strategy in terms of return and risk optimization<br />
to the structure of the pension obligations. Stress<br />
scenarios are simulated as part of the portfolio analyses.<br />
ExChAngE RATE vOlATiliTy<br />
• Risk of an increasing imbalance in exchange rates<br />
• Management on the production side through local<br />
sites<br />
• Management on the market side through derivative<br />
instruments
The permanent review of the investment strategy was<br />
further intensified in the wake of the financial and econo<br />
mic crisis. Furthermore, we are reducing this risk by increasingly<br />
offering employees defined contribution<br />
schemes.<br />
Regulatory and political risks<br />
As of June 1, 2007, the new European chemicals directive<br />
REACH came in effect, which set forth terms for the registration,<br />
evaluation and authorization of chemicals. With its<br />
networked structure and extensive product portfolio, <strong>BASF</strong><br />
is one of the companies most heavily affected worldwide.<br />
<strong>BASF</strong> is aware of the demands and therefore started preparing<br />
for REACH in 2004. Under the terms of REACH,<br />
<strong>BASF</strong> will register several thousand substances. Upon the<br />
completion of the preregistration phase on December 1,<br />
<strong>2008</strong>, we submitted more than 40,000 preregistrations to<br />
the ECHA (European Chemicals Agency) in Helsinki, Finland.<br />
We expect average annual costs of €50 million until<br />
completion of its implementation in 2018. Despite good<br />
preparation and planning, <strong>BASF</strong> and our European customers<br />
continue to face the risk of being placed at a disadvantage<br />
due to the cost intensive test and registration procedures<br />
in comparison to our nonEuropean competitors.<br />
Within the framework of E.U. emissions trading, the<br />
<strong>BASF</strong> Group was allocated emission certificates for the<br />
second trading period from <strong>2008</strong> to 2012. <strong>BASF</strong> does not<br />
currently expect any shortage of certificates for the European<br />
group in this second trading period.<br />
The concrete design of the European emissions trading<br />
from 2013 is still unclear. Under the present E.U. resolutions,<br />
however, a large portion of the chemical industry will<br />
be included in the trading system. It is still largely unclear<br />
what proportion of the required certificates for the individual<br />
plants will need to be paid for. Chemical plants which<br />
are exceptionally efficient will probably receive allocation of<br />
REgulATORy RiSkS: REACh<br />
MAnAgEMEnT’S AnAlySiS<br />
Risk <strong>Report</strong><br />
certificates largely free of cost. Depending on the final<br />
design of the implementing regulation, <strong>BASF</strong> will be<br />
required to purchase several million certificates annually.<br />
The final design will, however, also impact the prices for<br />
CO 2 certificates on the exchanges and thus affect our cost<br />
and global competitive situation.<br />
In addition, an aggravation of geopolitical tensions and<br />
the destabilization of currently politically stable systems<br />
pose risks.<br />
Other significant risks<br />
Prospective candidates for specialist and management<br />
positions: It is our goal to form the best team in industry.<br />
At the same time, we are aware of the challenges brought<br />
through demographic change and international competition<br />
for highly qualified specialist and management candidates.<br />
<strong>BASF</strong> is prepared for this global competition<br />
through attractive compensation and benefit packages.<br />
We have initiated regional projects for the analysis of local<br />
labor markets and for mid to longterm recruitment planning.<br />
One of these central programs is “Generations@<br />
Work.” An important element is a sustainable personnel<br />
policy which focuses on the recruitment of qualified new<br />
talents and their continuous training and development.<br />
Programs to help our employees balance career and family<br />
life also make a significant contribution.<br />
More information on “generations@Work” can be found in the chapter<br />
“Employees” on page 90<br />
• June 1, 2007: new European chemicals directive REACH; Terms for the registration, evaluation and authorization<br />
of chemical substances in the European Union.<br />
• Submission of more than 40,000 preregistrations with the European Chemicals Agency in Helsinki, Finland, by<br />
December 1, <strong>2008</strong><br />
• Average annual costs of €50 million until the completion of implementation in 2018<br />
<strong>BASF</strong> REPORT <strong>2008</strong><br />
117
118<br />
MAnAgEMEnT’S AnAlySiS<br />
Risk <strong>Report</strong><br />
Research and development; Exploration: Due to the high<br />
degree of complexity and uncertainty involved in chemical<br />
and biological research, there is a risk that projects might<br />
be discontinued or that developed products will not receive<br />
approval for sale. We lessen this risk through our global<br />
Knowhow Verbund, our collaboration with our partners<br />
and customers as well as our innovation process whereby<br />
efficiency, chances of success, and general conditions of<br />
research projects are continuously reviewed. A significant<br />
contribution to longterm strategic risk management is<br />
made by the alignment of strategic goals and the research<br />
portfolio as part of both strategic planning and strategic<br />
controlling. There are also opportunities and risk in oil and<br />
gas exploration. The search for new oil and gas reserves is<br />
dependent on geological conditions. We lessen such risks<br />
by means of a balanced exploration portfolio.<br />
Sustainability: <strong>BASF</strong> is committed to combining economic<br />
success and the protection of the environment with<br />
socially responsible business. Contraventions to our voluntary<br />
commitment to sustainability or to laws represent a<br />
reputational risk and could lead to operational or strategic<br />
risks. To promptly recognize risks and opportunities related<br />
to sustainability, we have set up a dedicated management<br />
system. The results are then used to initiate change processes<br />
in the company, in order to be prepared for any<br />
risks and to exploit opportunities accordingly. We have<br />
established global monitoring systems to ensure the adherence<br />
to laws and our voluntary commitments in the<br />
areas of environment, health and safety as well as to labor<br />
and social standards. These include the supply chain on<br />
a companywide basis. In order to assure society’s acceptance<br />
of our business activities, we remain in constant<br />
exchange with relevant stakeholders.<br />
More information on monitoring tools can be found in the chapter<br />
“Sustainability management” from page 28 onward<br />
OThER SigniFiCAnT RiSkS<br />
• Prospective candidates for specialist and management<br />
positions<br />
• Research and Development; Exploration<br />
• Sustainability<br />
•<br />
Acquisition and investment decisions<br />
<strong>BASF</strong> REPORT <strong>2008</strong><br />
Acquisition and investment decisions: Implementing<br />
acquisition and investment decisions involves complex<br />
risks. The evaluation of risks and opportunities already<br />
plays a significant role during the assessment of potential<br />
acquisition targets. Opportunities and risks are analyzed<br />
and quantified in detail during due diligence. Risks and<br />
opportunities are directly connected to acquisitions and<br />
their integration, such as increased staff turnover, a better<br />
or worse realization of synergies, or the assumption of obligations<br />
that were difficult to quantify in advance. Therefore<br />
implementation and followup take place along defined<br />
processes. By nature, the acquired businesses are subject<br />
to general market risks and businessspecific risks. Therefore,<br />
acquired businesses are promptly integrated into the<br />
<strong>BASF</strong> risk management process, while taking businessspecific<br />
areas of risk into account.<br />
information technology: To reduce possible risks, <strong>BASF</strong><br />
has an integrated, Groupwidestandardized IT infrastructure<br />
and applications, backup systems, replicated databases,<br />
viruses and access protection, and encoding systems.<br />
Risk management is conducted through Groupwide<br />
regulations for organization and application as well as an<br />
internal control system based on this.<br />
Patent and intellectual property rights: The Global Intellectual<br />
Property department of <strong>BASF</strong> SE, together with the<br />
appropriate units of the U.S.based <strong>BASF</strong> Corporation and<br />
<strong>BASF</strong> Coatings, Münster, Germany, monitors all the intellectual<br />
property rights of <strong>BASF</strong>. At the same time, we aim to<br />
avoid patent and licensing disputes as far as possible<br />
through our extensive clearance research.<br />
• Information technology<br />
• Patents and intellectual property rights<br />
• Security<br />
• Legal risks
Security: <strong>BASF</strong>’s Corporate Security department, through<br />
its Groupwide network, works in close cooperation with<br />
local security authorities to develop measures to protect<br />
<strong>BASF</strong> from worldwide security risks.<br />
legal risks: We limit risks from potential wrongdoing or<br />
legal infringements by using compliance programs and<br />
centralized contract management.<br />
Overall assessment<br />
Our planning takes into account significantly lower economic<br />
growth. At present, it is exceptionally difficult to<br />
make forecasts. This is primarily due to the increased volatility<br />
in raw material prices as well as uncertainty regarding<br />
the overall economy and the performance of important<br />
customer industries. In <strong>2008</strong>, events occurred that we had<br />
assessed as having a low probability of occurrence: Globally,<br />
the credit markets almost collapsed and the oil price<br />
increased considerably before dropping dramatically. The<br />
possible knockon effects of further negative developments<br />
would be considerably more serious than in the previous<br />
years. Nevertheless, based on our assessment, there<br />
are currently no significant individual risks that pose a<br />
threat to the continued existence of the <strong>BASF</strong> Group. That<br />
also applies to the sum of the individual risks.<br />
OvERAll ASSESSMEnT<br />
Significant areas of opportunity and risk<br />
Development in the economic situation and<br />
sales markets<br />
Availability and price volatility of<br />
raw materials<br />
Exchange rate volatility<br />
Remaining financial risks<br />
Regulatory and political risks<br />
• Forecasts currently subject to great uncertainty<br />
• Uncertainty regarding economic growth and important customer industries<br />
• 2009: Planning takes lower growth into account<br />
Specific opportunities and risks in the individual<br />
divisions<br />
Further risk areas (Human resources, R&D, IT,<br />
acquisitions, etc.)<br />
MAnAgEMEnT’S AnAlySiS<br />
Risk <strong>Report</strong><br />
Measurement<br />
High contribution to<br />
overall volatility<br />
High contribution to<br />
overall volatility<br />
Medium contribution to<br />
overall volatility<br />
Low contribution to overall<br />
volatility<br />
Longterm effects, strategic<br />
significance<br />
Medium contribution; high<br />
diversification<br />
Longterm effects, strategic<br />
significance<br />
<strong>BASF</strong> REPORT <strong>2008</strong><br />
119
120<br />
MAnAgEMEnT’S AnAlySiS<br />
Forecast Economic Environment<br />
ECOnOMiC EnviROnMEnT<br />
The world economy is in the worst crisis of the postwar<br />
period, whose impact will also shape the year 2009. We<br />
expect a recession that involves a decrease in global<br />
gross domestic product (–0.3%). in the industrialized<br />
countries, economic growth will decline significantly<br />
(–1.6%). Early indicators show that the production will<br />
decline at least into the second quarter. For the year<br />
2010, we expect a moderate recovery. not until 2011 is<br />
it expected that growth will return to near the normal<br />
rate of over +3%. however, any forecast is currently<br />
subject to great uncertainty.<br />
As a result of the crisis in the financial markets and in wide<br />
parts of industry, Europe can expect a difficult first half of<br />
the year. Economic growth in 2009 will decline (–1.5%),<br />
despite a slight improvement in the second half of the year.<br />
In the United Kingdom and Spain, investments in construction,<br />
above all in housing, will decrease in the course of<br />
the recession. There will also be considerable declines in<br />
the automotive industry across Europe. In Germany, the<br />
Benelux and other countries that are highly dependent<br />
on exports, a significant downturn in exports is expected.<br />
The announced economic stimulus plans will help support<br />
growth. We expect slight midterm economic growth<br />
(+0.4%).<br />
Outlook for gross domestic Product 2009<br />
Real change compared with previous year<br />
0%<br />
World<br />
E.U.<br />
United States<br />
Asia (excl. Japan)<br />
Japan<br />
South America<br />
<strong>BASF</strong> REPORT <strong>2008</strong><br />
–2.0<br />
–1.5<br />
–1.5<br />
–0.3<br />
3% 6%<br />
2.3<br />
4.5<br />
We expect a decrease (–2.0%) in gross domestic product<br />
in the united States in 2009. This will be caused by the<br />
continuing significant decline in domestic demand and<br />
lower investment in the construction industry. The growth<br />
in private consumption will decrease as a result of nega<br />
tive wealth effects and decreasing employment. The<br />
new U.S. government has planned a massive economic<br />
stimulus plan of almost $900 billion over the next two<br />
years. We expect that midterm economic growth will be<br />
low (+0.9%), due to the continued difficult market con<br />
ditions.<br />
Economic growth will be negatively impacted in Asia<br />
(excluding japan), particularly due to the recessions in<br />
the most important export markets: the United States, the<br />
European Union and Japan. The downturn will primarily<br />
affect the ASEAN countries as well as China and Taiwan.<br />
Private consumer demand and robust construction activity,<br />
how ever, will support economic growth in 2009 (+4.5%).<br />
Robust midterm growth is expected (+5.7%).<br />
In japan, we anticipate a decrease in gross domestic<br />
product in 2009 (–1.5%). The current financial crisis will<br />
indirectly affect Japan, particularly due to the strong<br />
appreciation of the yen against the U.S. dollar. Japanese<br />
domestic demand as well as exports will continue to<br />
weaken. Parallel to this development, the willingness of<br />
Trends 2009 – 2011<br />
Average annual real change<br />
World<br />
E.U.<br />
United States<br />
Asia (excl. Japan)<br />
Japan<br />
South America<br />
0% 3% 6%<br />
FOR ThE yEAR 2009 WE ExPECT ThE FOllOWing ECOnOMiC COndiTiOnS:<br />
• Decline in global gross domestic product (–0.3%)<br />
• Continued critical situation in the first half of year in the United States, in many European countries, and in Japan<br />
due to the credit crisis<br />
• Slight improvement of the economic situation in late fall through fiscal stimulus, lower inflation and energy prices<br />
as well as stronger confidence<br />
• Crisisrelated lower interest rates in the United States and in Europe in the course of 2009<br />
• An average euro/dollar exchange rate of $1.30 per euro<br />
• Continued low oil price: annual average $50 per barrel<br />
0.4<br />
0.2<br />
0.9<br />
1.7<br />
3.0<br />
5.7
companies to invest will decrease. Midterm gross domestic<br />
product is not expected to grow.<br />
The growth of the gross domestic product in South<br />
America will decrease (+2.3%) in 2009. The decline in raw<br />
material prices will particularly affect Venezuela and Brazil.<br />
Despite the interest rate increase in Brazil and Argentina,<br />
we expect the domestic economy to remain strong. The<br />
trend to renationalization in several parts of South America<br />
makes it more difficult to conduct longterm investments.<br />
Midterm gross domestic product will grow somewhat<br />
stronger (+3.0%).<br />
Outlook for important customer industries<br />
As a result of the worldwide economic crisis, manufacturing<br />
will shrink considerably more than gross domestic<br />
product (–2.9%). Production will decline significantly primarily<br />
in the industrialized countries, however, lower<br />
growth is also expected for Asia.<br />
In the automotive industry, the number of units produced<br />
will decrease massively. A slump comparable to the<br />
decline after the first oil price crisis in 1974 is expected.<br />
This will especially affect the United States and Europe.<br />
Global production in the construction industry will<br />
decrease slightly in 2009. This downturn will be driven in<br />
particular by the formerly highly speculative housing markets<br />
in the United States, the United Kingdom and Spain.<br />
The growth in construction activities outside industrialized<br />
countries will weaken.<br />
Global growth in the electronics industry in 2009 is<br />
anticipated to be negative. Demand for capital goods and<br />
consumer demand for household appliances will also<br />
decrease.<br />
OuTlOOk FOR iMPORTAnT CuSTOMER induSTRiES in 2009:<br />
WORldWidE dROP in induSTRiAl PROduCTiOn OF –2.9%<br />
MAnAgEMEnT’S AnAlySiS<br />
Forecast Economic Environment<br />
The strong growth dynamic experienced up until now in<br />
the information and communications industry (iCT) will<br />
decrease significantly. In the United States and Japan,<br />
production will decline due to, among other things, the<br />
decline of investment in the financial sector and manufacturing.<br />
Production in the paper industry will decline worldwide,<br />
in the industrialized countries production will drop<br />
significantly.<br />
The textiles industry will grow only slightly. In develop<br />
ing countries, where the majority of global production<br />
takes place, growth will drop off substantially, in the industrialized<br />
countries production will continue to slump.<br />
Largely stable growth is expected for the production in<br />
the agricultural industry as well as the food industry in<br />
2009.<br />
• Automotive industry: massive decline, especially in the United States und Europe<br />
• Construction industry: slight decline following the housing crisis in the United States, the United Kingdom and Spain<br />
• Electronics industry: negative growth due to decline in demand for capital goods and consumer products<br />
• Information and communications industry (ICT): significant decrease in growth, especially in the United States<br />
and Japan<br />
• Paper industry: strong decline, above all in industrialized countries<br />
• Textiles industry: only slight growth, slump in industrialized countries<br />
• Agricultural and food industries: stable growth<br />
<strong>BASF</strong> REPORT <strong>2008</strong><br />
121
122<br />
MAnAgEMEnT’S AnAlySiS<br />
Forecast Economic Environment<br />
Outlook for the chemical industry<br />
As a result of its strong dependence on the crisishit automotive<br />
and construction industries, the worldwide chemical<br />
industry has been significantly impacted by the recession.<br />
We expect a decline (–2.0%) in worldwide chemical production<br />
(excluding pharmaceuticals) in 2009. We anticipate<br />
slight midterm growth (+1.5%).<br />
In Europe, we expect a decline in production (–4.7%)<br />
due to the poor economic climate and the partial shutdown<br />
of production capacities. This is due to both the<br />
downturn in the construction and automotive industries as<br />
well as the destocking occurring in many customer industries.<br />
Also, net exports overseas will decline. A moderate<br />
recovery (+1%) is forecasted for the beginning of 2010.<br />
In the united States, chemical production will decline<br />
(–5.6%) again in 2009, as a result of lower domestic<br />
demand. Sectorspecific conditions will improve somewhat<br />
in the second half of the year – provided the automotive<br />
and construction industries stabilize and customer industries<br />
rebuild their stocks. Production will only marginally<br />
increase (+1.2%) in 2010 and will normalize only from 2011<br />
onward.<br />
In Asia (excluding japan), we expect a significant<br />
weakening (+2.4%) in the chemical industry. Industrial production<br />
will also slow down considerably. China’s chemical<br />
industry growth will decline significantly, but remain<br />
Outlook for Chemical Production 2009 (excl. pharma)<br />
Real change compared with previous year<br />
0%<br />
World<br />
E.U.<br />
United States<br />
Asia (excl. Japan)<br />
Japan<br />
South America<br />
<strong>BASF</strong> REPORT <strong>2008</strong><br />
–5.6<br />
–5.4<br />
–4.7<br />
–2.0<br />
1.4<br />
strong (+6.1%) when compared internationally. Significant<br />
customer industries for the chemical industry, like the automotive,<br />
electronics, household appliance and toy industries,<br />
will reduce production. There will be an absence of<br />
the formerly strong growth from exports to industrialized<br />
countries and trade within Asia. In the midterm, we expect<br />
on average strong growth (+5.2%).<br />
In japan, chemical production will decrease (–5.4%) in<br />
2009. The slowdown will be the result of a weakening<br />
domestic market and the slump in exports.<br />
We reduced our forecast for chemical production in<br />
South America (+1.4%). Here, the global financial crisis<br />
will indirectly affect the real economy due to its impact on<br />
the exports of significant customer industries. Industrial<br />
activity will also weaken as a result of increasing interest<br />
rates. We expect a slight midterm recovery (+2.7%).<br />
OuTlOOk FOR ThE ChEMiCAl induSTRy 2009: WORldWidE dEClinE OF –2.0%<br />
• European Union: poorer business environment, shutdown of capacity, decline in production (–4.7%)<br />
• United States: slump in domestic demand, decline in chemical production (–5.6%)<br />
• Japan: weakening of domestic demand and exports, decline in chemical production (–5.4%)<br />
• Asia (excluding Japan): weakening in industrial and export growth, lower growth of trade within the region,<br />
increase in chemical production (+2.4%), strong growth in China (+6.1%)<br />
• South America: weaker industrial activity, lower exports, growth in chemical production (+1.4%)<br />
3%<br />
2.4<br />
Trends 2009 – 2011 (excl. pharma)<br />
Average annual real change<br />
0%<br />
World<br />
E.U.<br />
United States<br />
Asia (excl. Japan)<br />
Japan<br />
South America<br />
–0.7<br />
–0.8<br />
–0.8<br />
1.5<br />
3% 6%<br />
2.7<br />
5.2
MAnAgEMEnT’S AnAlySiS<br />
Forecast <strong>BASF</strong> Group Outlook and Opportunities<br />
<strong>BASF</strong> gROuP OuTlOOk And OPPORTuniTiES<br />
Shaping the future – especially in difficult times<br />
in a drastically worsening economic environment, <strong>BASF</strong><br />
is facing major challenges in 2009. Our global business<br />
declined sharply in the fourth quarter of <strong>2008</strong>. Since the<br />
beginning of 2009, there has been no recovery in the<br />
demand for chemical products, and there is currently<br />
no sign of a reversal of this trend. nevertheless, the<br />
current economic situation offers opportunities for our<br />
business.<br />
Opportunities<br />
Even in very difficult times, we want to maintain our leading<br />
position in the chemical industry and make a contribution<br />
to overcoming the economic crisis. With our innovative<br />
products and system solutions, we help companies in<br />
almost all industries to increase their innovative strength<br />
and thus lay the foundations for future growth. We will<br />
therefore continue our research and development efforts<br />
in highgrowth and innovative areas.<br />
Our corporate research is a strategic instrument in<br />
developing growth areas and securing the longterm technical<br />
and methodical competence of <strong>BASF</strong>. In so doing, we<br />
focus on five growth clusters that cover the most important<br />
approaches for future challenges: energy management,<br />
nanotechnology, white (industrial) biotechnology, plant biotechnology,<br />
and raw material change. <strong>BASF</strong> expects<br />
additional annual sales of between €2 billion and €4 billion<br />
as of 2015 from innovations based on projects in the<br />
growth clusters.<br />
Energy efficiency and climate protection are topics that<br />
are gaining ever more importance. <strong>BASF</strong> was the first<br />
company in the world to publish a comprehensive global<br />
carbon footprint. The results confirm that <strong>BASF</strong>’s innovative<br />
products save three times more greenhouse gas emissions<br />
than the entire amount released through the production<br />
and disposal of all <strong>BASF</strong> products. In this way, for<br />
example, our modern insulating materials can decrease the<br />
OuTlOOk<br />
energy consumption in residential buildings by more than<br />
70%. Automobiles will become more climate friendly<br />
through <strong>BASF</strong> products such as plastics, fuel additives and<br />
catalysts. German and European politicians are responding<br />
to the challenges of the economic crisis by significantly<br />
promoting investment in the fields of energy efficiency and<br />
climate protection. With our innovative products, we are<br />
well positioned to make a significant contribution.<br />
In the currently difficult economic environment, we<br />
reaffirm our position as global market leader in the chemical<br />
industry by shaping our portfolio to be even more<br />
robust and competitive. We are expanding our position in<br />
specialty chemicals through the purchase of Ciba Holding<br />
AG. Through the integration, we are extending our valueadding<br />
chains and in this way utilize the growth and earnings<br />
potential of Ciba to its full extent. In the Oil & Gas<br />
segment, the acquisition of Revus Energy ASA with its<br />
highly valuable development and exploration portfolio,<br />
strengthens the activities of <strong>BASF</strong> in the North Sea and<br />
creates growth potential.<br />
We are accelerating the implementation of our programs<br />
for restructuring and increasing efficiency. In addition<br />
to the ongoing costcutting activities, we started the<br />
operational excellence program NEXT in October <strong>2008</strong>,<br />
which encompasses a large number of measures for<br />
increased efficiency. As of 2012, we expect to increase<br />
earnings by more than €1 billion annually, a significant part<br />
of which will be realized in 2009 and 2010.<br />
The year 2009 will confront us with major challenges. The continuing global recession will cause the chemical market to<br />
shrink. Any forecast is currently subject to great uncertainty. In this environment, despite the acquisitions of Ciba Holding<br />
AG and Revus Energy ASA, we expect a decline in sales compared with <strong>2008</strong> and an even greater decline in income from<br />
operations. We nevertheless aim to at least earn our cost of capital and keep our dividend stable – all in all, extremely<br />
ambitious goals in the current economic climate.<br />
<strong>BASF</strong> REPORT <strong>2008</strong><br />
123
124<br />
MAnAgEMEnT’S AnAlySiS<br />
Forecast <strong>BASF</strong> Group Outlook and Opportunities<br />
Risks<br />
Based on currently available information, there are no substantial<br />
individual risks at the present time or in the foreseeable<br />
future that endanger the continued existence of<br />
the <strong>BASF</strong> Group. The total sum of individual risks also<br />
does not pose a threat to the continued existence of the<br />
<strong>BASF</strong> Group.<br />
More information can be found in the chapter “Risk <strong>Report</strong>” on<br />
pages 112-119<br />
Forecast<br />
The impact of the global financial crisis on our sales and<br />
procurement markets intensified dramatically in the fourth<br />
quarter. We are in the midst of a global recession: Growth<br />
rates are dropping significantly in all regions, customers<br />
continue to reduce their inventories, and a recovery is currently<br />
not in sight. The year 2009 will confront us with<br />
major challenges. The continuing global recession will<br />
cause the chemical market to shrink. Any forecast is currently<br />
subject to great uncertainty.<br />
More information can be found on page 27<br />
Despite the acquisitions of Ciba Holding AG and Revus<br />
Energy ASA, we expect a decline in sales compared with<br />
<strong>2008</strong> and an even greater decline in income from operations,<br />
which will be negatively impacted by integration<br />
costs. We nevertheless aim to at least earn our cost of<br />
capital and keep our dividend stable. These goals are<br />
extremely ambitious in the current economic climate. We<br />
will maintain strict cost and spending discipline and rigorously<br />
implement our global restructuring and efficiency<br />
programs.<br />
In the current environment, the improvement of operating<br />
cash flows and the reduction of our working capital<br />
take priority. For this purpose, we have reduced the capacity<br />
utilization rates of our production facilities.<br />
Planned capital expenditures by segment 2009-2013<br />
<strong>BASF</strong> REPORT <strong>2008</strong><br />
We remain committed to our conservative financing strategy.<br />
The planned investment in property, plant and equipment<br />
for the years 2009 to 2013 will be approximately<br />
€10.3 billion, and will therefore most likely be below the<br />
level of depreciation. This figure does not include acquisitions.<br />
dividends and share buybacks<br />
We aim to increase our dividend annually or at least<br />
maintain the level of the previous year.<br />
We are currently turning our main focus to the financing<br />
of the <strong>BASF</strong> Group, not least because of the acquisition of<br />
Ciba Holding AG. In view of the economic situation, we<br />
have stopped our share buyback program.<br />
Planned capital expenditures by segment 2009-2013<br />
1 -- Chemicals: 18%<br />
2 -- Plastics: 16%<br />
€10.3<br />
billion<br />
3 -- Performance Products: 14%<br />
4 -- Functional Solutions: 8%<br />
5 -- Agricultural Solutions: 5%<br />
6 -- Oil & Gas: 27% 1<br />
7<br />
1<br />
1 -- Europe: 58%<br />
6<br />
5<br />
4<br />
3<br />
2<br />
7 -- Other (infrastructure,<br />
R&D): 12%<br />
1<br />
4<br />
5<br />
2 -- North America: 14%<br />
3<br />
2<br />
€10.3<br />
billion<br />
1<br />
3 -- Asia Pacific: 18%<br />
4 -- South America, Africa,<br />
Middle East: 5%<br />
5 -- Alternative sites<br />
under review: 5%<br />
1 Excluding investments in the Nord Stream and Yuzhno Russkoye projects 1 Thereof 23 percentage points for Oil & Gas
SuPPlEMEnTARy REPORT<br />
<strong>BASF</strong> is pressing ahead with the optimization of its<br />
structures. The goal is an even stronger focus on its<br />
customer industries. At the same time, <strong>BASF</strong> is laying<br />
the foundation for the rapid and smooth integration<br />
of Ciba’s activities. in particular, <strong>BASF</strong>’s Performance<br />
Products segment is being developed further. The first<br />
organizational changes will take effect as of April 1,<br />
2009.<br />
Optimization of organizational structures<br />
The Performance Products segment currently consists of<br />
the Acrylics & Dispersions, Care Chemicals and Performance<br />
Chemicals divisions. The new Paper Chemicals<br />
division will be assigned to the segment as of April 1,<br />
2009. This division will initially consist of <strong>BASF</strong>’s paper<br />
chemicals and binders business as well as the kaolin minerals<br />
business, which are currently part of the Acrylics &<br />
Segment structure and divisions of <strong>BASF</strong> (as of April 1, 2009)<br />
ChEMiCAlS<br />
Inorganics<br />
Performance<br />
Polymers<br />
Dispersions &<br />
Pigments<br />
Petrochemicals Polyurethanes Care Chemicals<br />
Intermediates<br />
PlASTiCS<br />
PERFORMAnCE<br />
PROduCTS<br />
MAnAgEMEnT’S AnAlySiS<br />
Forecast Supplementary <strong>Report</strong><br />
Dispersions division. At a later time, Ciba’s business with<br />
products for paper manufacturing is to be integrated into<br />
the Paper Chemicals division.<br />
The current Acrylics & Dispersions division will be<br />
renamed dispersions & Pigments. This division will consist<br />
of <strong>BASF</strong>’s business with raw materials for the coating<br />
and paint industry. In addition, the dispersions business<br />
will be supplemented by the pigments and resins business,<br />
which is currently part of the Performance Chemicals<br />
division. The acrylic monomers business will be assigned<br />
to the Petrochemicals division, which will then encompass<br />
the key steps in the propylene valueadding chain. The<br />
superabsorbents business will be assigned to the Care<br />
Chemicals division. Later, the majority of business of<br />
Ciba’s Coating Effects segment will be integrated into the<br />
Dispersions & Pigments division.<br />
<strong>BASF</strong> PRESSES AhEAd WiTh ThE OPTiMizATiOn OF iTS STRuCTuRES<br />
• Performance Products segment sharpens focus on customer industries<br />
• New Paper Chemicals division will be established<br />
• Preparations to integrate Ciba’s activities<br />
• <strong>BASF</strong> reviews strategic options for its leather and textile chemicals business<br />
Catalysts Crop Protection Oil & Gas<br />
Construction<br />
Chemicals<br />
Paper Chemicals Coatings<br />
Performance<br />
Chemicals<br />
FunCTiOnAl<br />
SOluTiOnS<br />
AgRiCulTuRAl<br />
SOluTiOnS<br />
Oil & gAS<br />
<strong>BASF</strong> REPORT <strong>2008</strong><br />
125
126<br />
MAnAgEMEnT’S AnAlySiS<br />
Forecast Supplementary <strong>Report</strong><br />
In the Care Chemicals division, <strong>BASF</strong> is now combining,<br />
in addition to the human and animal nutrition units and<br />
pharmaceuticals business, all businesses the contribute to<br />
cleaning, personal care and hygiene. The assignment of<br />
the superabsorbents business to Care Chemicals will<br />
strengthen the division’s portfolio with consumerrelated<br />
products for personal care.<br />
In the future, the Performance Chemicals division will<br />
primarily offer innovative and specific solutions for a broad<br />
range of industries. These, for example, include the<br />
plastics processing industry, automotive suppliers, refineries,<br />
users of oil fields and mining chemicals, as well as<br />
leather and textiles processers. Ciba’s plastics additives<br />
business, among others, will be assigned to this division.<br />
For several years, the business with leather and textile<br />
chemicals has been characterized by low market growth<br />
and high competitive pressure. In order to improve<br />
compet itiveness, <strong>BASF</strong> has implemented a series of<br />
restructuring and efficiency programs in the past years.<br />
However, these measures have not been sufficient to<br />
en sure the longterm profitability of the business. The business<br />
unit has there fore introduced an additional program<br />
to further optimize efficiency and reduce costs by<br />
€25 million by 2011. Besides implementing this package of<br />
measures, <strong>BASF</strong> is reviewing future strategic options. In<br />
particular, these include the formation of a joint venture or<br />
the complete sale of the business.<br />
As of January 1, 2009, the styrene copolymers business<br />
was transferred from the Performance Polymers<br />
division to Styrenics. Styrenics does not belong to any<br />
segment, it is reported under “Other.”<br />
BOndS iSSuEd, lOWER CREdiT RATingS<br />
<strong>BASF</strong> REPORT <strong>2008</strong><br />
Bond issue<br />
In January 2009, <strong>BASF</strong> Finance Europe NV issued a bond<br />
with a nominal volume of €1.5 billion guaranteed by <strong>BASF</strong><br />
SE. The coupon of the bond is 5.125% and it matures on<br />
June 9, 2015.<br />
Change of credit ratings<br />
At the beginning of 2009, Standard & Poor’s downgraded<br />
the rating of <strong>BASF</strong> to “A+/A1/outlook negative” and<br />
Moody’s to “A1/P1/outlook stable.”<br />
• Longterm bond with a nominal volume of €1.5 billion and a coupon of 5.125 % issued in January 2009<br />
• Credit ratings downgraded at the beginning of 2009: Standard & Poor’s to “A+/A1/outlook negative,” Moody’s to<br />
“A1/P1/outlook stable”
THeresa egler<br />
is one of over 80 BasF compliance<br />
officers worldwide.<br />
* We believe that good corporate governance fosters<br />
trust among employees, investors, financial markets,<br />
business partners and the public.
Corporate GovernanCe<br />
ValUe FOr BasF<br />
long-term support<br />
Supporting employees in North America as compliance trainers:<br />
Theresa Egler, Jonathan Harper, David Stryker and Elizabeth Rodriguez<br />
(from right to left).<br />
earning Trust<br />
Trust in our company can be made visible: through motivated<br />
employees, who also want to profit from being long-term<br />
investors. Or through investors, who build on our sustainable<br />
strategy. The aim of our Compliance Program is to prevent<br />
legal violations through training and education and thereby<br />
avoid them. At the same time, we assess whether our guidelines<br />
and voluntary commitments are being implemented.<br />
This is just one element of the corporate governance system.<br />
Good corporate governance secures the long-term acceptance<br />
and support for our corporate conduct.<br />
ValUe FOr sOCIeTY<br />
Transparent companies<br />
<strong>BASF</strong> shareholders at the <strong>Annual</strong> Meeting in <strong>2008</strong>.<br />
securing the interests of investors<br />
Investors only invest in companies whose business models<br />
and management they trust. Transparent corporate management<br />
and control simplify the international comparison<br />
of company structures and prevent unwanted develop ments.<br />
Thus, responsible corporate governance protects the<br />
interests of investors and strengthens the credibility of<br />
companies.<br />
More information on compliance can be found on page 30 and on corporate<br />
governance from page 128 onward
03<br />
Corporate<br />
GovernanCe<br />
Corporate Governance of the BaSF Group 128<br />
Management and Supervisory Boards 133<br />
Compensation <strong>Report</strong> 137<br />
<strong>Report</strong> of the Supervisory Board 144<br />
Declaration of Conformity 148<br />
Corporate GovernanCe
128<br />
BaSF <strong>2008</strong><br />
Corporate Governance of the <strong>BASF</strong> Group<br />
Corporate GovernanCe<br />
oF the BaSF Group<br />
Corporate governance refers to the entire system for<br />
managing and supervising a company, including its<br />
organization, its commercial principles and guidelines<br />
as well as all internal and external regulatory and monitoring<br />
mechanisms. effective and transparent cor-<br />
p orate governance guarantees that BaSF is managed<br />
and monitored in a responsible and value-driven manner.<br />
this fosters the confidence of our domestic and<br />
international investors, the financial markets, our<br />
business partners, employees and the public in the<br />
company.<br />
Conversion of BaSF aktiengesellschaft into BaSF Se<br />
As of January 14, <strong>2008</strong>, <strong>BASF</strong> took on the new European<br />
legal form of a European Company. A highly significant<br />
goal of the conversion into <strong>BASF</strong> SE was the strengthening<br />
of <strong>BASF</strong>’s corporate governance structure. By reducing the<br />
size of the Supervisory Board to 12 members while maintaining<br />
the equal representation of shareholders and<br />
employees and broadening the European composition of<br />
the employee representatives’ side, the future direction for<br />
a modern and efficient corporate constitution has been<br />
set. Proven structures such as the two-tier administrative<br />
system of <strong>BASF</strong>’s Board of Executive Directors and Supervisory<br />
Board will be retained in the SE.<br />
Management and supervision in BaSF Se<br />
The legal foundations of <strong>BASF</strong> SE’s corporate constitution<br />
are primarily the SE Council Regulation of the European<br />
Union, the German SE Implementation Act and the German<br />
Stock Corporation Act. Despite these new legal foundations,<br />
the previous fundamental elements of <strong>BASF</strong><br />
Aktiengesellschaft’s corporate constitution remain<br />
unchanged in <strong>BASF</strong> SE: these are the two-tier system<br />
consisting of <strong>BASF</strong>’s Board of Executive Directors and the<br />
Supervisory Board, the equal representation of shareholders<br />
and employees in the Supervisory Board and the<br />
shareholders’ rights of co-administration and supervision<br />
at the <strong>Annual</strong> Meeting.<br />
BaSF report <strong>2008</strong><br />
Direction and management by the Board of executive<br />
Directors<br />
Under the two-tier administrative system of <strong>BASF</strong> SE, the<br />
Board of Executive Directors is responsible for the<br />
management of the company, and represents <strong>BASF</strong> SE in<br />
business undertakings with third parties. <strong>BASF</strong>’s Board of<br />
Executive Directors is strictly separated from the Supervisory<br />
Board: A member of the Supervisory Board cannot<br />
simultaneously be a member of the Board of Executive<br />
Directors. The Board of Executive Directors agrees on<br />
company goals and corporate strategy and manages and<br />
monitors the business units of the <strong>BASF</strong> Group through<br />
the planning and setting of the company budget, the allocation<br />
of resources and management capacities, the monitoring<br />
and decision making regarding significant individual<br />
measures, and the control of the operational management.<br />
The Board is obliged to act and decide in the company’s<br />
best interests. It is dedicated to the goal of increasing the<br />
company’s value in the long term. The decisions made by<br />
the Board of Executive Directors are based on a simple<br />
majority. In the case of a tied vote, the casting vote is<br />
given by the Chairman of the Board. However, the Chairman<br />
of the Board does not have the right to veto the decisions<br />
of the Board of Executive Directors.<br />
The Board of Executive Directors reports to the Supervisory<br />
Board regularly, comprehensively and in a timely<br />
manner on all relevant matters concerning the company<br />
with regard to strategic planning, business development,<br />
risks and risk management. Furthermore, the Board agrees<br />
on corporate strategy with the Supervisory Board. Where<br />
required by the Statutes of <strong>BASF</strong> SE, the Board of Executive<br />
Directors must have the approval of the Supervisory<br />
Board for certain transactions before they are concluded.<br />
Such cases include the acquisition and disposal of enterprises<br />
and parts of enterprises, the issuance of bonds or<br />
comparable financial instruments provided the acquisition<br />
or disposal price or the amount of the issue in an individual<br />
case exceeds 3% of the equity reported in the last Consolidated<br />
Financial Statements of the <strong>BASF</strong> Group.<br />
the members of the Board of executive Directors, including their membership<br />
of the supervisory bodies or other companies, are listed on pages 133 to 136.<br />
the compensation of the Board of executive Directors is described in detail in<br />
the Compensation report on pages 137 to 143.
Monitoring of company management by the<br />
Supervisory Board<br />
The Supervisory Board appoints the members of the Board<br />
of Executive Directors and monitors and advises the Board<br />
on management issues. Members of the Supervisory<br />
Board cannot simultaneously be members of the Board of<br />
Executive Directors. Structurally, this ensures a high level<br />
of autonomy with regards to the supervision of the Board<br />
of Executive Directors.<br />
The change in legal form to an SE has brought about<br />
substantial changes in the Supervisory Board. The German<br />
Codetermination Act, which is the relevant statutory foundation<br />
regarding the size and composition of the Supervisory<br />
Board of an Aktiengesellschaft, does not apply to the<br />
SE. Together with the SE Council Regulation, the relevant<br />
statutory foundations are the statutes of <strong>BASF</strong> SE and the<br />
Agreement Concerning the Involvement of Employees in<br />
<strong>BASF</strong> SE (Employee Participation Agreement) that was<br />
signed on November 15, 2007, by the company management<br />
and the representatives of <strong>BASF</strong> Group’s European<br />
employees.<br />
the statutes of BaSF Se and the employee participation agreement can be<br />
found on the Internet at basf.com/en/investor/cg<br />
While the Supervisory Board of <strong>BASF</strong> Aktiengesellschaft<br />
acting until January 14, <strong>2008</strong>, comprised 20 members, 10<br />
of whom elected at the <strong>Annual</strong> Meeting and 10 of whom<br />
elected by employees employed in Germany by the <strong>BASF</strong><br />
Group Companies, the Supervisory Board of <strong>BASF</strong> SE<br />
comprises 12 members. Six members are elected by the<br />
shareholders at the <strong>Annual</strong> Meeting. The remaining six<br />
members are elected by the “<strong>BASF</strong> Europa Betriebsrat,”<br />
the European employee representation body of the <strong>BASF</strong><br />
Group, as agreed to in the Employee Participation Agreement.<br />
the members of the Supervisory Board of BaSF aktiengesellschaft with effect<br />
until January 14, <strong>2008</strong>, and the members of the first Supervisory Board of<br />
BaSF Se including their membership of the supervisory bodies of other companies<br />
are listed on pages 133 to 136. the compensation of the Supervisory<br />
Board is described in detail in the Compensation report on pages 137 to 143.<br />
Corporate GovernanCe<br />
Corporate Governance of the <strong>BASF</strong> Group<br />
Resolutions of the Supervisory Board are passed by a simple<br />
majority of the votes of the participating members of<br />
the Supervisory Board. In the event of a tie, the vote of the<br />
Chairman of the Supervisory Board, who must always be a<br />
shareholder representative, shall be the casting vote. This<br />
resolution process is also applicable for the appointment<br />
and dismissal of members of the Board of Executive Directors<br />
by the Supervisory Board.<br />
<strong>BASF</strong> SE’s Supervisory Board established a total of<br />
three Supervisory Board Committees: the Personnel Committee,<br />
the Audit Committee and the Nomination Committee.<br />
The personnel Committee, among other things, prepares<br />
the appointment of members of the Board of Executive<br />
Directors by the Supervisory Board, develops the main<br />
features of the Board of Executive Directors’ compensation,<br />
and, based on the decisions of the Supervisory<br />
Board, sets the details of Board of Executive Directors<br />
members’ remuneration and related contractual issues. It<br />
comprises Supervisory Board Chairman Dr. Jürgen Strube<br />
(chairman) as well as Supervisory Board members Robert<br />
Oswald, Dr. Tessen von Heydebreck and Michael Vassiliadis.<br />
The audit Committee makes preparations for the negotiations<br />
and resolutions of the Supervisory Board for the<br />
approval of the financial statements and consolidated<br />
financial statements, considers the Quarterly and First-Half<br />
financial reports with the Board of Executive Directors prior<br />
to their publication and deals with risk monitoring and the<br />
internal control over financial reporting. The Audit Committee<br />
is also responsible for business relations with the company’s<br />
auditor: It prepares the Supervisory Board’s proposal<br />
to the <strong>Annual</strong> Meeting regarding the selection of an auditor,<br />
monitors the auditor’s independence, defines the key<br />
aspects of the audit together with the auditor, negotiates<br />
the auditing fees and establishes the conditions for the<br />
provision of the auditor’s non-audit services. The members<br />
of the Audit Committee are Max Dietrich Kley, Ralf-Gerd<br />
Bastian, Franz Fehrenbach and Michael Vassiliadis. The<br />
chairman of the Audit Committee is Max Dietrich Kley.<br />
Max Dietrich Kley has particular knowledge and experience<br />
in the application of accounting principles and internal<br />
control procedures, and has been named by the<br />
Supervisory Board as Audit Committee Financial Expert.<br />
BaSF report <strong>2008</strong><br />
129
130<br />
Corporate GovernanCe<br />
Corporate Governance of the <strong>BASF</strong> Group<br />
According to the recommendation of the German Corporate<br />
Governance Code, newly introduced in July 2007,<br />
<strong>BASF</strong>’s Supervisory Board established a nomination<br />
Committee that will prepare the proposals for the election<br />
of Supervisory Board members at the <strong>Annual</strong> Meeting. The<br />
members of the Nomination Committee are the members<br />
of the Supervisory Board elected at the <strong>Annual</strong> Meeting,<br />
in other words, Prof. Dr. Jürgen Strube, Prof. Dr. Francois<br />
Diederich, Michael Diekmann, Franz Fehrenbach,<br />
Dr. Tessen von Heydebreck and Max Dietrich Kley.<br />
Shareholders’ rights<br />
At the <strong>Annual</strong> Meeting, shareholders perform their rights<br />
of co-administration and supervision. Each <strong>BASF</strong> SE share<br />
represents one vote. Shareholders may exercise their<br />
voting rights at the <strong>Annual</strong> Meeting either personally,<br />
through a representative of their choice or through a company-appointed<br />
proxy authorized by the shareholders to<br />
vote according to their instructions. There are neither<br />
voting caps to limit the number of votes a shareholder<br />
may cast nor special voting rights. <strong>BASF</strong> has fully implemented<br />
the principle of “one share, one vote.” All shareholders<br />
are entitled to participate in the <strong>Annual</strong> Meeting, to<br />
have their say concerning any resolution and to demand<br />
information about company issues to the extent that it<br />
serves to help make an informed judgment about the resolution<br />
under discussion. Half of the members of the Supervisory<br />
Board are elected at the <strong>Annual</strong> Meeting where<br />
above all the formal discharge of the Board of Executive<br />
Directors and the Supervisory Board is decided on as<br />
well as the distribution of profits, capital measures, the<br />
authorization of share buy-backs and changes to the<br />
statutes.<br />
BaSF report <strong>2008</strong><br />
German Corporate Governance Code<br />
<strong>BASF</strong> accords good Corporate Governance great importance.<br />
We therefore support the German Corporate Governance<br />
Code, which we regard as an important tool in the<br />
capital market-focused continuing development of corporate<br />
governance and control, and advocate responsible<br />
corporate governance that focuses on a sustainable increase<br />
in the value of the company.<br />
<strong>BASF</strong> SE follows all recommendations of the German<br />
Corporate Governance Code in its revised version of June<br />
<strong>2008</strong>. This also applies to the new recommendations of the<br />
Code regarding the Supervisory Board’s dealing with the<br />
compensation of Board members, the limits on severance<br />
payments to Board members who cease their duties prior<br />
to the expiry of their term of office as well as the consideration<br />
of the interim reports by the Audit Committee.<br />
You can find the joint Declaration of Conformity <strong>2008</strong> of<br />
the Board of Executive Directors and Supervisory Board of<br />
<strong>BASF</strong> SE at the end of this section on page 148. In the<br />
same manner, <strong>BASF</strong> also fulfils most of the non-obligatory<br />
suggestions of the German Corporate Governance Code.<br />
Sole exceptions are suggestions regarding the Chair of the<br />
Audit Committee and the consideration of the compensation<br />
components of the Supervisory Board that are based<br />
on the long-term success of the company.<br />
the Declaration of Conformity <strong>2008</strong>, an overview of the implementation of the<br />
code’s suggestions and the German Corporate Governance Code are available<br />
on our website at basf.com/governance_e
values and principles of the BaSF Group/<br />
Code of Conduct<br />
In order to guarantee a high standard of corporate governance,<br />
the Board of Executive Directors has set down and<br />
published the “Values and Principles” of the <strong>BASF</strong> Group,<br />
and the “Code of Conduct/Compliance Program.” These<br />
lay down our business principles and guidelines for the<br />
conduct of all activities within the <strong>BASF</strong> Group. The Code<br />
of Conduct describes in detail the conduct we expect from<br />
<strong>BASF</strong> employees – based on the principle of integrity. Key<br />
areas for us include observing all relevant legislation, in<br />
particular antitrust and competition legislation, embargo<br />
and export controls legislation – including those on chemical<br />
weapons, labor laws and legislation relating to plant<br />
safety. Other issues covered are bans on insider dealing<br />
and bans on facilitation payments to, or from, business<br />
partners or government officials, and the responsible treatment<br />
of <strong>BASF</strong>’s assets. The Corporate Audit department,<br />
together with <strong>BASF</strong>’s Chief Compliance Officer, monitors<br />
compliance on a regular basis.<br />
the “values and principles” of the BaSF Group and the “Code of Conduct” are<br />
also available on the Internet at basf.com/values<br />
Disclosure according to Section 315 (4) of the German<br />
Commercial Code and the explanatory report of the<br />
Board of executive Directors according to Section 175<br />
(2) of the German Stock Corporation act<br />
As of December 31, <strong>2008</strong>, the subscribed capital of <strong>BASF</strong><br />
SE amounted to €1,181,604,565.76, divided into<br />
923,128,567 bearer shares with no par value (thereof<br />
4,649,873 bought back and designated for cancellation).<br />
Each share shall, at an <strong>Annual</strong> Meeting, entitle the holder<br />
to one vote. Restrictions on the right to vote or transfer<br />
shares do not exist. The same rights and duties are associated<br />
with all shares. According to the statutes, shareholders<br />
are not entitled to securitized shares (issued share<br />
certificates). There are neither different classes of shares<br />
nor shares with preferential voting rights (golden shares).<br />
The appointment and dismissal of members of the<br />
Board of Executive Directors is legally governed by the<br />
regulations in Article 39 of the SE Council Regulation, Section<br />
16 of the SE Implementation Act and Sections 84, 85<br />
of the German Stock Corporation Act as well as Section 7<br />
of the <strong>BASF</strong> SE statutes. Members of the Board of Executive<br />
Directors are appointed and dismissed by the Supervisory<br />
Board according to these Acts. The members of the<br />
Board of Executive Directors are appointed for a maximum<br />
of five years, re-appointments being permissible. The<br />
Supervisory Board can dismiss a member of the Board of<br />
Corporate GovernanCe<br />
Corporate Governance of the <strong>BASF</strong> Group<br />
Executive Directors if there is significant reason to do so.<br />
Examples include, in particular, a gross breach of the<br />
duties pertaining to the Board of Executive Directors or a<br />
motion of no confidence at the <strong>Annual</strong> Meeting. Appointments<br />
and dismissals are decided by the Supervisory<br />
Board according to their dutiful discretion.<br />
Amendments to the statutes of <strong>BASF</strong> SE require a<br />
resolution on the <strong>Annual</strong> Meeting adopted with at least a<br />
two-thirds majority of the votes cast, provided that the<br />
legal provisions applicable to German public limited liability<br />
companies do not stipulate or allow for larger majority<br />
requirements (Section 59, paragraph 1 SE Council Regulation).<br />
In the case of amendments to the statutes, the German<br />
Stock Corporation Act (Section 179, paragraph 2)<br />
requires a majority of at least three quarters, of the subscribed<br />
capital represented. Pursuant to Art. 12 No. 6 of<br />
the statutes of <strong>BASF</strong> SE, the Supervisory Board is authorized<br />
to make amendments to the statutes which only concern<br />
their wording. This applies, in particular to the alignment<br />
of share capital and the number of shares after a<br />
<strong>BASF</strong> share buyback and after a new issue of shares from<br />
the authorized capital.<br />
Until May 1, 2009, the Board of Executive Directors of<br />
<strong>BASF</strong> SE is empowered by a resolution passed at the<br />
<strong>Annual</strong> Meeting of April 29, 2004 to increase the subscribed<br />
capital, with the consent of the Supervisory Board,<br />
by a total amount of €500 million through the issue of new<br />
shares (authorized capital). This includes the authorization<br />
of the Board of Executive Directors to exclude the statutory<br />
subscription right of the shareholders in certain cases<br />
outlined in Section 5, paragraph 8 in the <strong>BASF</strong> SE statutes.<br />
Such cases include the acquisition of companies, parts of<br />
companies or holdings in companies, in return for the<br />
transfer of <strong>BASF</strong> shares and capital increases in return for<br />
cash contributions, provided that the issue price of the<br />
new shares is not substantially lower than the stock market<br />
price of the <strong>BASF</strong> share and the total number of shares<br />
issued under this authorization is not more than 10% of<br />
the subscribed capital on the date of issue.<br />
BaSF report <strong>2008</strong><br />
131
132<br />
Corporate GovernanCe<br />
Corporate Governance of the <strong>BASF</strong> Group<br />
The <strong>Annual</strong> Meeting of April 24, <strong>2008</strong>, empowered the<br />
Board of Executive Directors to buy back up to 10% of the<br />
shares until 23 October, 2009. The shares will be purchased<br />
at the discretion of the Board of Executive Directors, via<br />
the stock exchange or a public purchase offer addressed<br />
to all shareholders. The Board is empowered to cancel the<br />
shares bought back and to reduce share capital by the<br />
portion of the cancelled shares in the share capital. The<br />
shares bought back can be reissued after a resolution of<br />
the <strong>Annual</strong> Meeting passed with a three-quarters majority.<br />
However, notwithstanding the above, the Board of Executive<br />
Directors is authorized, with consent of the Supervisory<br />
Board to use the shares bought back for the acquisition<br />
of companies, parts of companies or holdings in companies<br />
without a resolution from the <strong>Annual</strong> Meeting.<br />
In the case of a change of control, members of the<br />
Board of Executive Directors shall, under certain additional<br />
conditions, receive compensation details of which are listed<br />
in the compensation report on page 140. A change of<br />
control is assumed when a shareholder informs <strong>BASF</strong> of a<br />
shareholding of at least 25% or the increase of such a<br />
holding. In addition, employees of <strong>BASF</strong> SE and its subsidiaries<br />
who are designated as ‘executives’ (Obere Führungskräfte)<br />
will receive a severance payment if their contract of<br />
employment is terminated by <strong>BASF</strong> within 18 months after<br />
the change-of-control event, provided the employee has<br />
not given cause for the termination. The employee whose<br />
service contract has been terminated in such a case will<br />
receive a severance payment to the maximum of 1.5 times<br />
the annual salary (fixed component) depending on the<br />
number of months that have passed since the change-ofcontrol<br />
event.<br />
The remaining specifications stipulated in Section 315,<br />
paragraph 4 of the German Commercial Code refer to situations<br />
that are not applicable to <strong>BASF</strong> SE.<br />
BaSF report <strong>2008</strong><br />
Directors’ and officers’ liability insurance<br />
<strong>BASF</strong> has taken out liability insurance that covers the<br />
activities of members of the Board of Executive Directors<br />
and the Supervisory Board (D&O insurance). The policy<br />
provides for a suitable level of deductibles.<br />
Share ownership by members of the Board of executive<br />
Directors and the Supervisory Board<br />
No member of the Board of Executive Directors or the<br />
Supervisory Board owns shares in <strong>BASF</strong> SE and related<br />
options or other derivatives that account for 1% or more of<br />
the share capital. Furthermore, the entire holdings by<br />
members of the Board of Executive Directors and the<br />
Supervisory Board account for less than 1% of the shares<br />
issued by the company.<br />
Share dealings of the Board of executive Directors<br />
and Supervisory Board (notifiable transactions under<br />
Section 15a of German Securities trading act)<br />
In accordance with Section 15a of the German Securities<br />
Trading Act (Wertpapierhandelsgesetz), all members of the<br />
Board of Executive Directors and the Supervisory Board,<br />
as well as certain of their relatives, are required to disclose<br />
the purchase or sale of <strong>BASF</strong> shares and other related<br />
rights to the German Financial Services Supervisory<br />
Authority (Bundesanstalt für Finanzdienstleistungsaufsicht)<br />
and to the company if transactions within the calendar<br />
year exceed the threshold of €5,000.<br />
In <strong>2008</strong>, there were a total of 37 reportable purchase<br />
transactions notified by the members of the Board of<br />
Executive Directors and the Supervisory Board and their<br />
relatives obliged to report. The transactions involved<br />
between 50 and 20,000 <strong>BASF</strong> shares, with a share price<br />
between €21.00 (after stock split) and €97.31 (before stock<br />
split). The volume of the individual trades was between<br />
€4,520.50 and €514,970.73.<br />
all transactions reported in <strong>2008</strong> are published on the Internet at<br />
basf.com/governance/sharedealings_e
Corporate GovernanCe<br />
Management and Supervisory Boards<br />
ManaGeMent anD SupervISory BoarDS<br />
Board of executive Directors<br />
as of December 31, <strong>2008</strong>, there were eight members on the Board of<br />
executive Directors of BaSF Se.<br />
DR. JüRGen HAMBReCHt Chairman of the Board of executive<br />
Directors<br />
responsibilities: Legal, Taxes & Insurance; Strategic Planning &<br />
Controlling; Communications <strong>BASF</strong> Group; Global HR – Executive<br />
Management & Development; Investor Relations; Chief Compliance<br />
Officer<br />
First appointed: 1997 (chairman since 2003)<br />
term expires: 2011<br />
Supervisory board memberships (excluding internal memberships):<br />
Bilfinger Berger AG (supervisory board member until May 21, <strong>2008</strong>)<br />
Daimler AG (supervisory board member since February 7, <strong>2008</strong>)<br />
Lufthansa AG (supervisory board member since April 29, <strong>2008</strong>)<br />
DR. KURt BOCK<br />
responsibilities: Catalysts; Market & Business Development North<br />
America; Regional Functions North America; Finance; Information<br />
Services; Corporate Controlling; Corporate Audit<br />
First appointed: 2003<br />
term expires: 2012<br />
Internal memberships as defined in Section 100 (2) of the German<br />
Stock Corporation act:<br />
Wintershall Holding AG (supervisory board member)<br />
Wintershall AG (supervisory board member until June 25, <strong>2008</strong>)<br />
Comparable German and non-German controlling bodies:<br />
The European Equity Fund, Inc. (member of the board of directors)<br />
The Central Europe and Russia Fund, Inc. (member of the board of directors)<br />
DR. MARtIn BRUDeRMüLLeR<br />
responsibilities: Performance Polymers; Polyurethanes; Styrenics;<br />
Market & Business Development Asia Pacific; Regional Functions &<br />
Country Management Asia Pacific<br />
First appointed: 2006<br />
term expires: 2013<br />
DR. HAnS-ULRICH enGeL (since March 4, <strong>2008</strong>)<br />
responsibilities: Oil & Gas; Region Europe; Global Procurement &<br />
Logistics<br />
First appointed: <strong>2008</strong><br />
term expires: 2011<br />
Internal memberships as defined in Section 100 (2) of the German<br />
Stock Corporation act:<br />
Wintershall Holding AG (supervisory board chairman since March 6, <strong>2008</strong>)<br />
Wintershall AG (supervisory board member since June 25, <strong>2008</strong>, supervisory<br />
board chairman since July 8, <strong>2008</strong>)<br />
DR. JOHn FeLDMAnn<br />
responsibilities: Construction Chemicals; Acrylics & Dispersions;<br />
Care Chemicals; Performance Chemicals; Polymer Research<br />
First appointed: 2000<br />
term expires: 2009<br />
Supervisory board memberships (excluding internal memberships):<br />
Bilfinger Berger AG (supervisory board member since May 21, <strong>2008</strong>)<br />
Internal memberships as defined in Section 100 (2) of the German<br />
Stock Corporation act:<br />
<strong>BASF</strong> Coatings AG (supervisory board member)<br />
Wintershall Holding AG (supervisory board chairman until March 6, <strong>2008</strong>,<br />
supervisory board member until June 25, <strong>2008</strong>)<br />
Wintershall AG (supervisory board chairman until June 25, <strong>2008</strong>)<br />
DR. AnDReAS KReIMeYeR<br />
responsibilities: Inorganics; Petrochemicals; Intermediates;<br />
Chemicals Research & Engineering; <strong>BASF</strong> Future Business<br />
First appointed: 2003<br />
term expires: 2012<br />
Internal memberships as defined in Section 100 (2) of the German<br />
Stock Corporation act:<br />
Wintershall Holding AG (supervisory board member since June 25, <strong>2008</strong>)<br />
DR. SteFAn MARCInOWSKI<br />
responsibilities: Crop Protection; Coatings; Region South America;<br />
Specialty Chemicals Research; <strong>BASF</strong> Plant Science<br />
First appointed: 1997<br />
term expires: 2012<br />
Supervisory board memberships (excluding internal memberships):<br />
DWS Investment GmbH (supervisory board member since April 3, <strong>2008</strong>)<br />
Internal memberships as defined in Section 100 (2) of the German<br />
Stock Corporation act:<br />
Wintershall Holding AG (supervisory board member)<br />
Wintershall AG (supervisory board member until June 25, <strong>2008</strong>)<br />
<strong>BASF</strong> Coatings AG (supervisory board chairman)<br />
BaSF report <strong>2008</strong><br />
133
134<br />
Corporate GovernanCe<br />
Management and Supervisory Boards<br />
DR. HARALD SCHWAGeR<br />
responsibilities: Human Resources; Engineering & Maintenance;<br />
Environment, Health & Safety; Verbund Site Management Europe;<br />
Corporate & Governmental Relations<br />
First appointed: <strong>2008</strong><br />
term expires: 2010<br />
Internal memberships as defined in Section 100 (2) of the German<br />
Stock Corporation act:<br />
<strong>BASF</strong> Schwarzheide GmbH (supervisory board chairman)<br />
Comparable German and non-German controlling bodies:<br />
<strong>BASF</strong> Antwerp N.V. (chairman of the administrative council)<br />
resigned from the Board of executive Directors of BaSF in <strong>2008</strong>:<br />
PeteR OAKLeY (resigned on January 14, <strong>2008</strong>)<br />
responsibilities: Agricultural Products; Fine Chemicals;<br />
Specialty Chemicals Research; <strong>BASF</strong> Plant Science<br />
First appointed: 1998<br />
DR. H.C. eGGeRt VOSCHeRAU (resigned on april 24, <strong>2008</strong>)<br />
Deputy Chairman of the Board of executive Directors<br />
responsibilities: Human Resources; Engineering & Maintenance;<br />
Environment, Health & Safety; Verbund Site Management Europe;<br />
Corporate & Governmental Relations<br />
First appointed: 1996<br />
Supervisory board memberships (excluding internal memberships):<br />
HDI Haftpflichtverband der Deutschen Industrie VVaG<br />
(supervisory board member)<br />
Talanx AG (supervisory board member)<br />
CropEnergies AG (supervisory board chairman)<br />
Deutsche Bahn AG (supervisory board member until December 31, <strong>2008</strong>)<br />
Zentrum für Europäische Wirtschaftsforschung GmbH (ZEW)<br />
(supervisory board deputy chairman)<br />
Comparable German and non-German controlling bodies:<br />
Nord Stream AG (supervisory board member)<br />
BaSF report <strong>2008</strong><br />
Supervisory Board<br />
In accordance with the statutes, the Supervisory Board of BaSF Se<br />
comprises 12 members. until the entry of the conversion from BaSF<br />
aktiengesellschaft into the legal form of a european company (Se) in<br />
the commercial register on January 14, <strong>2008</strong>, the Supervisory Board<br />
of BaSF aktiengesellschaft comprised 20 members. the term of all<br />
supervisory board members of BaSF aktiengesellschaft ended with<br />
the entry of the conversion in the commercial register. Based on Section<br />
35 (1) of the German act on the Involvement of employees in a<br />
european Company (Se Involvement act - SeBG), BaSF Se is following<br />
the principle of parity between shareholder representatives and<br />
employee representatives already applied for the constitution of the<br />
Supervisory Board of BaSF aktiengesellschaft. the six shareholder<br />
representatives were elected at the annual Meeting on april 26, 2007<br />
within the decision on the conversion into an Se. By way of deviation<br />
from Section 40 (2) of the Council regulation (eC) no. 2157/2001, the<br />
six employee representatives are not elected by the annual Meeting,<br />
but appointed by the representative body of the employees, the BaSF<br />
europa Betriebsrat, according to the agreement Concerning the Involvement<br />
of employees in BaSF Se concluded within the conversion<br />
procedure based on Section 21 ff. SeBG. the employee representatives<br />
on the first Supervisory Board of BaSF Se have been appointed<br />
directly by the agreement Concerning the Involvement of employees<br />
in BaSF Se and are, except for Mr. ralf Sikorski, members of the Supervisory<br />
Board with effect from January 14, <strong>2008</strong> (day of entry of<br />
BaSF Se in the commercial register of the Ludwigshafen district<br />
court). Mr. ralf Sikorski was appointed directly by the agreement<br />
Concerning the Involvement of employees in BaSF Se on May 31,<br />
<strong>2008</strong> as the substitute member of the Supervisory Board for Mr.<br />
ulrich Küppers, who resigned on May 30, <strong>2008</strong>. the term of office of<br />
all members of the first Supervisory Board of BaSF Se terminates<br />
upon the conclusion of the annual Meeting of BaSF Se to be held<br />
in 2009.<br />
MeMBeRS OF tHe FIRSt SUPeRVISORY BOARD OF <strong>BASF</strong> Se<br />
PROF. DR. JüRGen StRUBe, Mannheim, Germany<br />
Chairman of the Supervisory Board of BaSF Se<br />
Former Chairman of the Supervisory Board of BaSF aktiengesellschaft<br />
Supervisory board memberships (excluding internal memberships):<br />
Allianz Deutschland AG (supervisory board member)<br />
Bayerische Motoren Werke AG (supervisory board deputy chairman)<br />
Bertelsmann AG (supervisory board deputy chairman)<br />
Commerzbank AG (supervisory board member until May 15, <strong>2008</strong>)<br />
Fuchs Petrolub AG (supervisory board chairman)<br />
Hapag-Lloyd AG (supervisory board member)<br />
Linde AG (supervisory board member until June 3, <strong>2008</strong>)
MICHAeL DIeKMAnn, Munich, Germany<br />
Deputy Chairman of the Supervisory Board of BaSF Se<br />
Chairman of the Board of Management of allianz Se<br />
Supervisory board memberships (excluding internal memberships):<br />
Linde AG (supervisory board deputy chairman)<br />
Lufthansa AG (supervisory board member until April 29, <strong>2008</strong>)<br />
Siemens AG (supervisory board member since January 24, <strong>2008</strong>)<br />
Internal memberships as defined in Section 100 (2) of the German<br />
Stock Corporation act:<br />
Allianz Deutschland AG (supervisory board chairman)<br />
Allianz Global Investors AG (supervisory board chairman)<br />
Dresdner Bank AG (supervisory board chairman until January 12, 2009)<br />
Comparable German and non-German controlling bodies:<br />
Assurances Générales de France (member of the administrative council)<br />
Allianz S.p.A. (member of the administrative council)<br />
ROBeRt OSWALD, altrip, Germany<br />
Deputy Chairman of the Supervisory Board of BaSF Se<br />
Chairman of the works council of the Ludwigshafen site of BaSF Se<br />
and chairman of the joint works council of the BaSF Group<br />
RALF-GeRD BAStIAn, neuhofen, Germany<br />
Member of the works council of the Ludwigshafen site of BaSF Se<br />
WOLFGAnG DAnIeL, Limburgerhof, Germany<br />
Deputy chairman of the works council of the Ludwigshafen site of<br />
BaSF Se<br />
PROF. DR. FRAnÇOIS DIeDeRICH, Zurich, Switzerland<br />
professor at the Swiss Federal Institute of technology Zurich<br />
FRAnZ FeHRenBACH, Stuttgart, Germany<br />
Chairman of the Board of Management of robert Bosch Gmbh<br />
Comparable German and non-German controlling bodies:<br />
Robert Bosch Corporation (Member of the board of directors)<br />
DR. teSSen VOn HeYDeBReCK, Berlin, Germany<br />
Former Member of the Board of Managing Directors of Deutsche<br />
Bank aG<br />
Supervisory board memberships (excluding internal memberships):<br />
DWS Investment GmbH (supervisory board deputy chairman)<br />
Vattenfall Europa AG (supervisory board member since June 16, <strong>2008</strong>)<br />
Dussmann Verwaltungs AG (supervisory board member since January 1,<br />
2009)<br />
Comparable German and non-German controlling bodies:<br />
Deutsche Bank OOO (supervisory board chairman)<br />
Deutsche Bank Polska S.A. (supervisory board chairman)<br />
Deutsche Bank Rt. Budapest (supervisory board chairman until May 28, <strong>2008</strong>)<br />
Corporate GovernanCe<br />
Management and Supervisory Boards<br />
MAX DIetRICH KLeY, heidelberg, Germany<br />
Lawyer<br />
Former Deputy Chairman of the Board of executive Directors of<br />
BaSF aktiengesellschaft<br />
Supervisory board memberships (excluding internal memberships):<br />
HeidelbergCement AG (supervisory board member)<br />
Infineon Technologies AG (supervisory board chairman)<br />
Schott AG (supervisory board member)<br />
SGL Carbon AG (supervisory board chairman)<br />
Comparable German and non-German controlling bodies:<br />
Unicredito Italiano S.p.A. (member of the Board of Directors)<br />
DenISe SCHeLLeMAnS, Kalmthout, Belgium<br />
Full time trade union delegate<br />
RALF SIKORSKI, Wiesbaden, Germany (since May 31, <strong>2008</strong>)<br />
regional manager of the rhineland-palatinate/Saarland branch of<br />
the Mining, Chemical and energy Industries union<br />
Supervisory board memberships (excluding internal memberships):<br />
Villeroy & Boch AG (supervisory board member since April 8, <strong>2008</strong>)<br />
Villeroy & Boch Fliesen GmbH (supervisory board member since April 8,<br />
<strong>2008</strong>)<br />
Evonik Power Saar GmbH (supervisory board deputy chairman since May<br />
14, <strong>2008</strong>)<br />
Evonik New Energies GmbH (supervisory board deputy chairman since<br />
May 14, <strong>2008</strong>)<br />
MICHAeL VASSILIADIS, hemmingen, Germany<br />
Member of the Central Board of executive Directors of the Mining,<br />
Chemical and energy Industries union<br />
Supervisory board memberships (excluding internal memberships):<br />
K+S AG (supervisory board deputy chairman)<br />
K+S Kali GmbH (supervisory board deputy chairman)<br />
Henkel KGaA (supervisory board member)<br />
Evonik Steag GmbH (supervisory board deputy chairman)<br />
resigned from the Supervisory Board on May 30, <strong>2008</strong>:<br />
ULRICH KüPPeRS, Ludwigshafen, Germany<br />
Member of Management of treuhandstelle für Bergmannswohnstätten<br />
im rheinisch-westfälischen Steinkohlenbezirk Gmbh<br />
BaSF report <strong>2008</strong><br />
135
136<br />
Corporate GovernanCe<br />
Management and Supervisory Boards<br />
until the entry of the conversion from BaSF aktiengesellschaft into<br />
an Se in the commercial register on January 14, <strong>2008</strong>, the Supervisory<br />
Board of BaSF aktiengesellschaft comprised 20 members, half<br />
of which were elected by the annual Meeting and the other half by<br />
the employees.<br />
PROF. DR. JüRGen StRUBe, Mannheim, Germany<br />
Chairman of the Supervisory Board<br />
ROBeRt OSWALD, altrip, Germany<br />
Supervisory board deputy chairman<br />
RALF-GeRD BAStIAn, neuhofen, Germany<br />
Member of the works council of the Ludwigshafen site of BaSF Se<br />
WOLFGAnG DAnIeL, Limburgerhof, Germany<br />
Deputy chairman of the works council of the Ludwigshafen site of<br />
BaSF Se<br />
PROF. DR. FRAnÇOIS DIeDeRICH, Zurich, Switzerland<br />
professor at the Swiss Federal Institute of technology Zurich<br />
MICHAeL DIeKMAnn, Munich, Germany<br />
Chairman of the Board of Management of allianz Se<br />
DR. teSSen VOn HeYDeBReCK, Berlin, Germany<br />
Former Member of the Board of Managing Directors of<br />
Deutsche Bank aG<br />
ARtHUR KeLLY, Chicago, Illinois, uSa<br />
Managing partner of KeL enterprises L. p.<br />
ROLF KLeFFMAnn, Wehrbleck, Germany<br />
Chairman at the employee Council of erdölwerke Barnstorf der<br />
Wintershall holding aG<br />
MAX DIetRICH KLeY, heidelberg, Germany<br />
Lawyer<br />
BaSF report <strong>2008</strong><br />
PROF. DR. RenAte KÖCHeR, allensbach, Germany<br />
Managing Director of the ‘Institut für Demoskopie allensbach’,<br />
Gesellschaft zum Studium der öffentlichen Meinung mbh<br />
eVA KRAUt, Ludwigshafen, Germany<br />
Chairman of the works council of BaSF It Services Gmbh,<br />
Betrieb Ludwigshafen<br />
ULRICH KüPPeRS, Ludwigshafen, Germany<br />
Member of Management of treuhandstelle für Bergmannswohnstätten<br />
im rheinisch-westfälischen Steinkohlenbezirk Gmbh<br />
KOnRAD MAnteUFFeL, Bensheim, Germany<br />
Member of the works council of the Ludwigshafen site of BaSF Se<br />
HAnS DIeteR PÖtSCH, Wolfsburg, Germany<br />
Member of the Board of Management of volkswagen aG<br />
PROF. DR. HeRMAnn SCHOLL, Stuttgart, Germany<br />
Chairman of the Supervisory Council of robert Bosch Gmbh<br />
and Managing Director of robert Bosch Industrietreuhand KG<br />
RALF SIKORSKI, Ludwigshafen, Germany<br />
regional manager of the Ludwigshafen branch Mining, Chemical<br />
and energy Industries union<br />
ROBeRt StUDeR, Zurich, Switzerland<br />
Former Chairman of the Supervisory Board at union Bank of Switzerland<br />
MICHAeL VASSILIADIS, hemmingen, Germany<br />
Member of the Central Board of executive Directors of the Mining,<br />
Chemical and energy Industries union<br />
DR. FRIeDRICH WIRSInG, Kaiserslautern, Germany<br />
plant manager of the Ludwigshafen site of BaSF Se
CoMpenSatIon report<br />
this report outlines the main principles of the compensation<br />
system for the Board of executive Directors and<br />
discloses the amount and structure of the compen-<br />
sation for each individual Board member. Furthermore,<br />
this report provides information on end-of-service<br />
undertakings with respect to Board members. the<br />
report also includes information on the compensation<br />
of the Supervisory Board members.<br />
Compensation of Board members<br />
This report meets the disclosure requirements of the<br />
German Commercial Code extended by the additional<br />
requirements for the Board of Executive Directors based<br />
on the German Law on the Disclosure of Compensation of<br />
Members of the Board (Vorstandsvergütungs-Offenlegungsgesetz)<br />
and is aligned with the recommendations of<br />
the German Corporate Governance Code.<br />
The compensation of Board members is determined<br />
upon the proposal of the Personnel Committee (Personalausschuss,<br />
see page 129) and confirmed by the Supervisory<br />
Board (see page 134). The amount of compensation is<br />
individually determined by the Personnel Committee. The<br />
determination of the amount and structure of the compensation<br />
depends on the company’s size and its financial<br />
position as well as the performance of the Board of Executive<br />
Directors. Globally operating European-based companies<br />
serve as a reference. A review of the amount and<br />
structure of compensation of Board members regularly<br />
takes place every three years. The last review took place<br />
on April 27, 2006. This review resulted in an increase of<br />
the variable bonus as of 2007.<br />
The compensation of Board members is composed of:<br />
1. a fixed annual salary,<br />
2. an annual variable bonus,<br />
3. stock price-based compensation in the form of virtual<br />
stock options (hereafter options) as a long-term component,<br />
4. non-monetary compensation and other additional<br />
compensation in varying amounts, and<br />
5. company pension benefits.<br />
Corporate GovernanCe<br />
Compensation <strong>Report</strong><br />
The amount of the annual variable compensation, the value<br />
of the options granted and the company pension are largely<br />
determined by company performance. This means, in<br />
terms of total compensation, significance is attached to<br />
company performance.<br />
The compensation components are shown in detail below:<br />
1. The annual fixed compensation is paid in equal monthly<br />
payments.<br />
2. The return on assets (ROA) is used to determine the<br />
variable compensation of all groups of employees and<br />
also determines the Board member’s annual variable<br />
compensation (variable bonus). The variable bonus for<br />
the prior fiscal year is payable after the <strong>Annual</strong> Meeting.<br />
Board members, as other employee groups, may<br />
contribute a portion of their bonus up to a maximum of<br />
€30,000 annually into a deferred compensation<br />
program. Board members have taken advantage of this<br />
offering to varying degrees.<br />
3. Board members may also participate in the <strong>BASF</strong> option<br />
program (BOP) for senior executives (see table below).<br />
For further details on the <strong>BASF</strong> option program, see<br />
page 210.<br />
4. Non-monetary compensation and other additional<br />
compensation include: delegation allowances, accident<br />
insurance premiums and other similar benefits, as well<br />
as the personal use of, or benefit from, communication<br />
equipment, company cars and security measures made<br />
available by the company. The members of the Board<br />
did not receive loans or advances from the company.<br />
5. For details on the company pension benefits, see page<br />
139.<br />
Based on these principles, individual Board members<br />
received the following compensation:<br />
BaSF report <strong>2008</strong><br />
137
138<br />
Corporate GovernanCe<br />
Compensation <strong>Report</strong><br />
Thousand €<br />
Dr. Jürgen Hambrecht<br />
Chairman of the Board<br />
of Executive Directors<br />
In 2007, personnel expenses were allotted to the options<br />
issued, however in <strong>2008</strong> the options lead to earnings.<br />
These earnings refer to the sum of all options from the<br />
programs BOP 2001 to BOP <strong>2008</strong>. The figure is derived by<br />
the difference in the value of the options on December 31,<br />
<strong>2008</strong>, compared with the value on December 31, 2007,<br />
considering the options exercised and granted in <strong>2008</strong>.<br />
The value of the options is based primarily on the develop-<br />
BaSF report <strong>2008</strong><br />
Year Fixed salary<br />
Non-performance related<br />
compensation<br />
Non-monetarycompensation<br />
and other<br />
additional<br />
compensation<br />
Performance<br />
related compensation<br />
Options granted 2<br />
Variable<br />
bonus 1<br />
Total cash<br />
compensation<br />
Number<br />
Market value<br />
at option<br />
grant date<br />
Total compensation<br />
(cash<br />
compensation<br />
plus options<br />
granted)<br />
<strong>2008</strong> 1,100 112 2,220 3,432 74,328 967 4,399<br />
2007 1,100 140 2,800 4,040 60,168 1,172 5,212<br />
Dr. h.c. Eggert Voscherau<br />
Vice Chairman of the Board<br />
<strong>2008</strong> 244 33 492 769 – – 769<br />
of Executive Directors<br />
(until April 24, <strong>2008</strong>)<br />
2007 732 145 1,862 2,739 40,008 779 3,518<br />
Dr. Harald Schwager<br />
<strong>2008</strong> 550 337<br />
(since January 1, <strong>2008</strong>)<br />
3 1,110 1,997 14,728 192 2,189<br />
2007 – – – – – – –<br />
Dr. Kurt Bock <strong>2008</strong> 555 4 855 5 1,110 2,520 37,160 483 3,003<br />
2007 550 106 1,400 2,056 30,080 586 2,642<br />
Dr. John Feldmann <strong>2008</strong> 550 71 1,110 1,731 37,160 483 2,214<br />
2007 550 93 1,400 2,043 30,080 586 2,629<br />
Dr. Hans-Ulrich Engel<br />
<strong>2008</strong> 457 325<br />
(since March 4, <strong>2008</strong>)<br />
3 925 1,707 11,944 155 1,862<br />
2007 – – – – – – –<br />
Dr. Andreas Kreimeyer <strong>2008</strong> 550 98 1,110 1,758 37,160 483 2,241<br />
2007 550 96 1,400 2,046 30,080 586 2,632<br />
Dr. Stefan Marcinowski <strong>2008</strong> 550 83 1,110 1,743 37,160 483 2,226<br />
2007 550 102 1,400 2,052 30,080 586 2,638<br />
Dr. Martin Brudermüller <strong>2008</strong> 550 941 5 1,110 2,601 37,160 483 3,084<br />
2007 550 964 5 1,400 2,914 30,080 586 3,500<br />
Peter Oakley<br />
<strong>2008</strong> 113 22 231 366 – – 366<br />
(until January 14, <strong>2008</strong>)<br />
2007 550 123 1,400 2,073 30,080 586 2,659<br />
Klaus Peter Löbbe<br />
<strong>2008</strong> – – – – – – –<br />
(until July 31, 2007)<br />
2007 309 4 621 5 1,072 2,002 30,080 586 2,588<br />
total <strong>2008</strong>: 5,219 2,877 10,528 18,624 286,800 3,729 22,353<br />
Total 2007: 5,441 2,390 14,134 21,965 310,736 6,053 28,018<br />
1 The variable bonus is based on the return on assets, which is also used to determine the variable compensation of other groups of employees.<br />
The shown figure includes all contributions, if any, made to the deferred compensation program.<br />
2 The 2007 figures have been adjusted for the two-for-one stock split conducted in the second quarter of <strong>2008</strong>.<br />
3 Includes expenses for security measures on residence following appointment to the Board of Executive Directors.<br />
4 Payment is made in local currency based on a theoretical (pro rata temporis) net salary in Germany. As a result, there is a deviation from the contractually agreed<br />
fixed gross salary (€550,000 yearly).<br />
5 Includes delegation allowances, such as the assumption of prevailing local rental fees.<br />
ment of the <strong>BASF</strong> share price and its outperformance<br />
compared with the benchmark index chosen for the<br />
programs BOP 2001 to BOP <strong>2008</strong>. Because the value of<br />
the options on December 31, <strong>2008</strong> was lower than the<br />
value of the options on December 31, 2007, there were no<br />
personnel expenses for <strong>2008</strong>, but rather earnings. The<br />
main reason for the lower value of the options on December<br />
31, <strong>2008</strong> was the decreased price of <strong>BASF</strong> shares.
The earnings for the year <strong>2008</strong> relating to the options<br />
issued were as follows:<br />
Dr. Jürgen Hambrecht €1,055 thousand (2007: personnel<br />
expenses amounting to €6,268 thousand); Dr. h.c. Eggert<br />
Voscherau €766 thousand (2007: personnel expenses<br />
amounting to €3,226 thousand); Dr. Harald Schwager<br />
€151 thousand (2007: –); Dr. Kurt Bock €1,045 thousand<br />
(2007: personnel expenses amounting to €2,978 thousand);<br />
Dr. John Feldmann €621 thousand (2007: personnel<br />
expenses amounting to €3,333 thousand); Dr. Hans-Ulrich<br />
Engel €1,458 thousand (2007: –); Dr. Andreas Kreimeyer<br />
€416 thousand (2007: personnel expenses amounting to<br />
€1,327 thousand); Dr. Stefan Marcinowski €446 thousand<br />
(2007: personnel expenses amounting to €3,574 thousand);<br />
Dr. Martin Brudermüller €790 thousand (2007:<br />
personnel expenses amounting to €1,095 thousand); and<br />
Peter Oakley €1,755 thousand (2007: personnel expenses<br />
amounting to €3,788 thousand).<br />
The earnings and personnel expenses reported here<br />
are purely accounting figures which do not equate with the<br />
actual cash gains in case options are exercised. The members<br />
of the Board decide on the timing and scope of the<br />
exercise of options of the individual years while taking into<br />
account the general terms and conditions and ceilings of<br />
the <strong>BASF</strong> option program (BOP) for senior executives.<br />
Considering a deductible the members of the Board<br />
are covered by loss liability insurance concluded by the<br />
company (D & O insurance).<br />
More information on the BaSF option program (Bop) can be found from<br />
page 210 onward<br />
pension benefits<br />
<strong>Annual</strong> pension units are accrued for the members of the<br />
Board. The method of determination of the amount of the<br />
pension benefits generally corresponds to that used for<br />
other employee groups. The method is designed such that<br />
both the performance of the company and the progression<br />
of the individual Board member’s career significantly affect<br />
the pension entitlement.<br />
The annual pension benefits accruing to Board members<br />
in a given reporting year (pension unit) are composed<br />
of a fixed and a variable component. The fixed component<br />
is calculated by multiplying the annual fixed compensation<br />
above the Social Security Contribution Ceiling by 35%<br />
(contribution factor). The resulting amount is converted into<br />
a lifelong pension payable upon retirement using actuarial<br />
factors based on an interest rate (6%), the probability of<br />
death, invalidity and mortality (Heubeck-Richttafeln 1998)<br />
and an assumed pension increase (1.5% per annum).<br />
Corporate GovernanCe<br />
Compensation <strong>Report</strong><br />
The variable component of the pension unit depends on<br />
the return on assets (ROA) in the reporting year under consideration.<br />
The variable component of the pension unit is<br />
based on a ROA of 12% at which point the variable component<br />
is equal in value to the fixed component. Based on<br />
a ROA of 12%, there is a linear relationship between the<br />
variable component and the ROA figures between 10%<br />
and 14%. The fixed and the variable components together<br />
result in acquired pension unit for the reporting year. The<br />
sum of the pension units accumulated over the reporting<br />
years determines the respective Board member’s pension<br />
benefit. The pension benefit takes effect at the end of service<br />
upon reaching retirement age of 60 years or disability<br />
or death. Pension payments are adjusted on an annual<br />
basis, of at least 1% annually, according to the changes in<br />
the German consumer price index.<br />
The pension units also include survivor benefits. Upon<br />
the death of an active or former member of the Board, the<br />
surviving spouse receives a survivor pension amounting to<br />
60% of the Board member’s pension entitlement. The<br />
orphan pension amounts to 10% for each half-orphan,<br />
33% for an orphan, 25% each for two orphans, and 20%<br />
each for three or more orphans of the pension entitlement<br />
of the deceased Board member. The survivor benefits may<br />
not exceed 75% of the Board member’s total pension entitlement.<br />
If the survivor pensions exceed the upper limit,<br />
they will be proportionately reduced.<br />
Board members are members of the <strong>BASF</strong> Pensionskasse<br />
VVaG, as are generally all employees of <strong>BASF</strong> SE.<br />
Contributions and benefits are determined by the Statutes<br />
and general terms and conditions of the <strong>BASF</strong> Pensionskasse<br />
VVaG.<br />
The service cost attributable to the year <strong>2008</strong> are as<br />
follows:<br />
Dr. Jürgen Hambrecht €333 thousand (2007: €507 thousand),<br />
Dr. h.c. Eggert Voscherau €43 thousand (2007:<br />
€108 thousand), Dr. Harald Schwager €556 thousand<br />
(2007: –), Dr. Kurt Bock €546 thousand (2007: €633 thousand),<br />
Dr. John Feldmann €571 thousand (2007:<br />
€658 thousand), Dr. Hans-Ulrich Engel €448 thousand<br />
(2007: –), Dr. Andreas Kreimeyer €558 thousand € (2007:<br />
€652 thousand), Dr. Stefan Marcinowski €559 thousand<br />
(2006: €621 thousand), Dr. Martin Brudermüller €555 thousand<br />
(2007: €638 thousand), and Peter Oakley €117 thousand<br />
(2007: €577 thousand).<br />
These amounts include the costs for the pension<br />
claims arising from the deferred contribution program.<br />
As with the pension benefits for senior executives, in<br />
<strong>2008</strong> the basis for the future calculation of pension units<br />
BaSF report <strong>2008</strong><br />
139
140<br />
Corporate GovernanCe<br />
Compensation <strong>Report</strong><br />
for Board members was also adjusted. An updated interest<br />
rate of 5% (previously 6%) and an updated probability of<br />
death, invalidity and mortality (Heubeck-Richttafeln 2005G,<br />
previously Heubeck-Richttafeln 1998), are applied to pension<br />
units acquired as of January 1, 2009. For new Board<br />
members and mandate extensions beginning on January<br />
1, 2009, a contribution factor of 32% (previously 35%) is<br />
applied. The rest of the above mentioned method of calculating<br />
pension units remains the same.<br />
end of service benefits<br />
a) Board members, whose current mandate began<br />
before January 1, <strong>2008</strong><br />
A Board member, that leaves the company before the age<br />
of 60, whose employment contract is not renewed or is<br />
revoked, is entitled to pension benefits. In such a case, the<br />
company is entitled to offset compensation received for<br />
any other work done against pension benefits.<br />
End-of-service following a change-of-control event: A<br />
change-of-control event, in terms of this provision, occurs<br />
when a shareholder informs <strong>BASF</strong> of a shareholding of at<br />
least 25%, or the increase of such a holding.<br />
If a Board member’s position is revoked within one year<br />
following a change-of-control event, the Board member<br />
will continue to receive the contractually agreed payments<br />
(fixed compensation and variable bonus) for the remaining<br />
contractual term of office. In addition, the Board member<br />
will receive a severance payment, depending on the<br />
remaining contractual term of office, up to a maximum of<br />
2.5 years of compensation (based on the fixed compensation<br />
and the previous year’s variable bonus). The sum of<br />
the severance payment and continuing compensation may<br />
not exceed five years of compensation. Furthermore, the<br />
Board member may receive the fair value of the option<br />
rights acquired in connection with BOP within a period of<br />
three months. The premature termination of service due to<br />
the revocation of a Board member’s position entitles the<br />
Board member to pension benefits. When calculating the<br />
amount of the pension benefits, the missing years of<br />
service up to the age of 60 years will be considered.<br />
The aforementioned is also applicable upon the<br />
occurrence of a change-of-control event, if the time to the<br />
end of the current contractual term of office is less than<br />
two years and the appointment is not subsequently extended<br />
by a minimum of two years.<br />
The aforementioned payments are only payable if the<br />
Board member has not given cause for the termination or<br />
non-renewal of his service contract.<br />
BaSF report <strong>2008</strong><br />
b) Contracts as of January 1, <strong>2008</strong><br />
The contracts of new Board members since January 1,<br />
<strong>2008</strong> contain the following significant changes:<br />
A Board member who leaves the company before the<br />
age of 60 is only entitled to pension benefits, if the Board<br />
member served on the Board for at least 10 years or if the<br />
time needed to reach the legal retirement age is less than<br />
10 years. The company is entitled to offset compensation<br />
received for any other work done against pension benefits.<br />
If a Board member’s position is revoked within one year<br />
following a change-of-control event, the Board member<br />
will continue to receive the contractually agreed payments<br />
for the remaining contractual term of office as a one-off<br />
payment (fixed compensation and the variable bonus<br />
based on a ROA of 12%).<br />
As of January 1, 2009, these changes also apply to<br />
extensions of current contractual terms, which began<br />
before January 1, <strong>2008</strong>.<br />
A general limit on severance pay is contained within the<br />
contracts for new Board members and term extensions as<br />
of January 1, 2009. Accordingly, payments made to a<br />
Board member upon premature termination of their contract,<br />
without serious cause, may not exceed the value of<br />
two years’ compensation (severance payment cap) nor<br />
compensate more than the remaining term of the contract.<br />
The severance payment cap will be calculated on the basis<br />
of the total compensation for the past full financial year<br />
and if appropriate also the expected total compensation<br />
for the current financial year. Payments promised in the<br />
event of premature termination of a Management Board<br />
member’s contract due to a change-of-control should not<br />
exceed 150% of the severance payment cap.<br />
previous Board members<br />
Total compensation for previous Board members and their<br />
surviving dependents amounted to €6.0 million in <strong>2008</strong><br />
(2007: €7.1 million). This figure also contains payments<br />
which former Board members have themselves financed<br />
through the deferred compensation program. Pension<br />
provisions for previous Board members and their surviving<br />
dependents amounted to €83.4 million (2007: €76.9 mil lion).
Compensation of Supervisory Board members<br />
The disclosure of remuneration of the Supervisory Board is<br />
based on German Commercial Code and is aligned with<br />
the recommendations of the German Corporate Governance<br />
Code.<br />
The compensation of the Supervisory Board is regulated<br />
by the Articles of Association passed by the <strong>Annual</strong><br />
Meeting. The compensation of the Supervisory Board of<br />
<strong>BASF</strong> Aktiengesellschaft was regulated by Section 12 of<br />
the Articles of <strong>BASF</strong> Aktiengesellschaft. The regulations for<br />
the compensation of the Supervisory Board remained<br />
unchanged regarding content within the framework of the<br />
conversion of <strong>BASF</strong> Aktiengesellschaft into <strong>BASF</strong> SE and<br />
now are contained within Section 14 of the Articles of<br />
<strong>BASF</strong> SE. Each member of the Supervisory Board receives<br />
fixed compensation of €60,000 and a performance-<br />
oriented variable compensation for each full €0.01 by<br />
which the earnings per share of the <strong>BASF</strong> Group declared<br />
in the <strong>BASF</strong> Group Consolidated Financial Statements for<br />
the year for which the remuneration is being paid exceeds<br />
the minimum earnings per share.<br />
The minimum earnings per share for the year <strong>2008</strong> is<br />
€1.35. The performance-oriented variable remuneration is<br />
€800 for each full €0.01 of earnings per share up to an<br />
earnings per share of €2.10, €600 for each further €0.01 of<br />
earnings per share up to an earnings per share of €2.60,<br />
and €400 for each €0.01 beyond this. The performanceoriented<br />
variable remuneration is limited to a maximum<br />
amount of €120,000. The minimum earnings per share and<br />
the corresponding thresholds shall increase by €0.05 for<br />
each subsequent financial year. Based on the earnings per<br />
share of €3.13 published in the <strong>BASF</strong> Group Consolidated<br />
Statements <strong>2008</strong>, the performance-oriented compensation<br />
amounted to €111,200 in <strong>2008</strong>. The chairman of the<br />
Supervisory Board receives two-and-a-half times and a<br />
deputy chairman one-and-a-half times the remuneration of<br />
an ordinary member.<br />
Members of the Supervisory Board who are members<br />
of a committee, except for the Nomination Committee,<br />
shall receive a further fixed remuneration for this purpose<br />
in the amount of €12,500. For the Audit Committee, the<br />
further fixed remuneration shall be €25,000. The chairman<br />
of a committee shall receive twice and a deputy chairman<br />
one-and-half times the further fixed remuneration.<br />
The company reimburses members of the Supervisory<br />
Board for out-of-pocket expenses and value-added tax to<br />
be paid with regard to their activities as members of the<br />
Supervisory Board or of a committee. The company further<br />
grants the members of the Supervisory Board a fee of<br />
Corporate GovernanCe<br />
Compensation <strong>Report</strong><br />
€500 for attending a meeting of the Supervisory Board or<br />
one of its committees to which they belong and includes<br />
the performance of the duties of the members of the<br />
Supervisory Board in the cover of a consequential loss liability<br />
insurance concluded by it (D & O insurance).<br />
Compensation of Supervisory Board members of BaSF<br />
aktiengesellschaft<br />
With the conversion of <strong>BASF</strong> Aktiengesellschaft into <strong>BASF</strong><br />
SE on January 14, <strong>2008</strong>, the mandates for the previous<br />
Supervisory Board members ended. Therefore, they<br />
receive pro rata one twelfth of the above mentioned compensation<br />
according to Section 12 (4) of the Articles of<br />
<strong>BASF</strong> Aktiengesellschaft.<br />
For the individual members of the Supervisory Board<br />
of <strong>BASF</strong> Aktiengesellschaft (until January 14, <strong>2008</strong>), the<br />
following compensation results:<br />
BaSF report <strong>2008</strong><br />
141
142<br />
Corporate GovernanCe<br />
Compensation <strong>Report</strong><br />
Thousand €<br />
Prof. Dr. Jürgen Strube, Chairman of the<br />
Supervisory Board 2<br />
Robert Oswald, Vice Chairman of the<br />
Supervisory Board 3<br />
BaSF report <strong>2008</strong><br />
Fixed compensation<br />
Performance-oriented<br />
variable compensation<br />
Payment for committe<br />
membership(s) total compensation<br />
<strong>2008</strong> 1 2007 <strong>2008</strong> 1 2007 <strong>2008</strong> 1 2007 <strong>2008</strong> 1 2007<br />
12.5<br />
7.5<br />
150<br />
90<br />
Ralf-Gerd Bastian 5 60 9.3 120 – – 14.3 180<br />
Wolfgang Daniel 5 60 9.3 120 – – 14.3 180<br />
Prof. Dr. François Diederich 5 60 9.3 120 – – 14.3 180<br />
Michael Diekmann 5 60 9.3 120 – – 14.3 180<br />
Dr. Tessen von Heydebreck 3 5 60 9.3 120 1 12.5 15.3 192.5<br />
Arthur Kelly 5 60 9.3 120 – – 14.3 180<br />
Rolf Kleffmann 5 60 9.3 120 – – 14.3 180<br />
Max Dietrich Kley 4 5 60 9.3 120 4.2 50 18.5 230<br />
Prof. Dr. Renate Köcher 5 60 9.3 120 – – 14.3 180<br />
Eva Kraut 5 60 9.3 120 – – 14.3 180<br />
Ulrich Küppers 5 60 9.3 120 – – 14.3 180<br />
Konrad Manteuffel 5 60 9.3 120 – – 14.3 180<br />
Hans Dieter Pötsch 5 5 60 9.3 120 2.1 25 16.4 205<br />
Prof. Dr. Hermann Scholl 5 60 9.3 120 – – 14.3 180<br />
Ralf Sikorski 5 60 9.3 120 – – 14.3 180<br />
Robert Studer 5 60 9.3 120 – – 14.3 180<br />
Michael Vassiliadis 3, 5 5 60 9.3 120 3.1 37.5 17.4 217.5<br />
Dr. Friedrich Wirsing 5 5 40 9.3 80 2.1 12.5 16.4 132.5<br />
Dr. Karlheinz Messmer 5<br />
(until April 30, 2007)<br />
–<br />
20<br />
23.2<br />
13.9<br />
–<br />
300<br />
180<br />
total: 110 1,320 204.5 2,640 15.6 183.3 330.1 4,143.3<br />
1 To compare with the compensation for 2007, the membership of the Supervisory Board of <strong>BASF</strong> SE (see next table) should be taken into consideration<br />
2 Chairman of the Personnel Committee<br />
3 Member of the Personnel Committe<br />
4 Chairman of the Audit Committee<br />
5 Member of the Audit Committee<br />
40<br />
2.1<br />
1<br />
–<br />
25<br />
12.5<br />
8.3<br />
37.8<br />
22.4<br />
–<br />
475<br />
282.5<br />
68.3
Compensation of Supervisory Board members of<br />
BaSF Se<br />
The newly constituted Supervisory Board of <strong>BASF</strong> SE came<br />
into existence with the conversion from <strong>BASF</strong> Aktiengesellschaft<br />
to the legal structure of a European company (SE)<br />
on January 14, <strong>2008</strong>. Compensation for the tenure of a<br />
member of the first Supervisory Board up until the <strong>Annual</strong><br />
Meeting on April 30, 2009 can only be determined at the<br />
<strong>Annual</strong> Meeting according to Section 113 (2) of the German<br />
Thousand €<br />
Fixed compensation<br />
Corporate GovernanCe<br />
Compensation <strong>Report</strong><br />
Stock Corporation Act. The Board of Directors and the<br />
Supervisory Board will propose to bestow compensation<br />
according to the regulations of Section 14 of the Articles<br />
of <strong>BASF</strong> SE at the <strong>Annual</strong> Meeting. To avoid double-counting,<br />
compensation for January <strong>2008</strong> is bestowed only for<br />
those who first took on Supervisory Board functions in<br />
this month. According to this, the following compensation<br />
resulted:<br />
Performance-oriented<br />
variable compensation<br />
Payment for committe<br />
membership(s) Total compensation<br />
Prof. Dr. Jürgen Strube, Chairman of the Supervisory Board 1 137.5 254.8 22.9 415.2<br />
Michael Diekmann, Vice Chairman of the Supervisory Board 85 157.5 – 242.5<br />
Robert Oswald, Vice Chairman of the Supervisory Board 2 82.5 152.9 11.5 246.9<br />
Ralf-Gerd Bastian 4 55 101.9 25 181.9<br />
Wolfgang Daniel 55 101.9 – 156.9<br />
Prof. Dr. François Diederich 55 101.9 – 156.9<br />
Franz Fehrenbach 4 60 111.2 25 196.2<br />
Dr. Tessen von Heydebreck 2 55 101.9 11.5 168.4<br />
Max Dietrich Kley 3 55 101.9 45.8 202.7<br />
Ulrich Küppers (until May 30, <strong>2008</strong>) 20 37.1 – 57.1<br />
Denise Schellemans 60 111.2 – 171.2<br />
Ralf Sikorski (since May 31, <strong>2008</strong>) 40 74.1 – 114.1<br />
Michael Vassiliadis 2, 4 55 101.9 34.4 191.3<br />
1 Chairman of the Personnel Committee<br />
2 Member of the Personnel Committee<br />
3 Chairman of the Audit Committee<br />
4 Member of the Audit Committee<br />
Subject to a resolution at the <strong>Annual</strong> Meeting on April 30,<br />
2009, total compensation of the Supervisory Board of the<br />
company, including the attendance fee for the activity, in<br />
<strong>2008</strong> was €2.9 million (2007: €4.2 million).<br />
Compensation for Supervisory Board membership and<br />
membership of Supervisory Board committees is payable<br />
after the <strong>Annual</strong> Meeting, which approves the Consolidated<br />
Financial Statements upon which the variable compensation<br />
is based. Accordingly, compensation relating to the<br />
year <strong>2008</strong>, will be paid following the <strong>Annual</strong> Meeting on<br />
April 30, 2009.<br />
In the year <strong>2008</strong>, the company paid the Supervisory<br />
Board member, Prof. Dr. Diederich, approximately €24,200<br />
(2007: approximately €23,400), plus value-added taxes<br />
and out-of-pocket expenses for consulting work in the<br />
total 815 1,510.2 176.1 2,501.3<br />
area of chemical research based on a consulting contract<br />
approved by the Supervisory Board.<br />
Beyond this, Supervisory Board members did not<br />
receive any further compensation in <strong>2008</strong> for services<br />
rendered personally, in particular, the rendering of advisory<br />
and agency services.<br />
For information on the shareholdings of Board and Supervisory Board<br />
members see page 132<br />
BaSF report <strong>2008</strong><br />
143
144<br />
Corporate GovernanCe<br />
<strong>Report</strong> of the Supervisory Board<br />
report oF the SupervISory BoarD<br />
Dear Shareholders,<br />
The year <strong>2008</strong> marked the start for <strong>BASF</strong> in its new legal<br />
form as a Societas Europaea or SE. The conversion was,<br />
and is, connected with significant changes to the corporate<br />
governance system at <strong>BASF</strong>. Since January 14, <strong>2008</strong>, the<br />
Supervisory Board comprises 12 instead of 20 members,<br />
consisting in equal parts of shareholder representatives –<br />
elected by the <strong>Annual</strong> Meeting – and employee representatives.<br />
In place of the German Codetermination Act, the<br />
Employee Participation Agreement concluded between the<br />
company’s management and employee representatives<br />
forms the tailor-made legal basis for employee participation<br />
in the Supervisory Board and for the new <strong>BASF</strong> Europa<br />
Betriebsrat. This means that employee participation in fundamental<br />
corporate decisions is no longer exclusively limited<br />
to employees in Germany, but also includes other European<br />
employees. The Supervisory Board is convinced that<br />
these structural changes have further improved the quality<br />
and efficiency of the Supervisory Board’s activities and that<br />
the monitoring of and the strategic advice provided to, the<br />
Board of Executive Directors has been intensified.<br />
The Supervisory Board attaches the utmost importance<br />
to guaranteeing good corporate governance: The Supervisory<br />
Board and the Board of Executive Directors therefore<br />
decided to comply in the future with all recommendations of<br />
the German Corporate Governance Code in the version<br />
passed by the Code Commission on June 6, <strong>2008</strong>.<br />
From an economic point of view, <strong>2008</strong> was dominated<br />
by the existing crisis in the financial markets and the economic<br />
crisis that became more apparent over the course of<br />
the year, significantly impacting <strong>BASF</strong> in the last two<br />
months of the year. The crisis will continue into 2009, and at<br />
the moment it is not possible to forecast a turnaround. The<br />
fourth quarter of <strong>2008</strong> shows that great economic success<br />
and record results can be quickly followed by a slump in<br />
business. Nevertheless, the current situation also makes<br />
clear that <strong>BASF</strong> was right to pursue its strategy, with a<br />
broad spectrum of business fields and a forward looking<br />
orientation towards strongly growing and innovative markets<br />
in the field of chemistry itself and fields closely related<br />
to chemistry. <strong>BASF</strong> aims to continue on this path and further<br />
expand next-generation business fields. This includes<br />
the acquisition of Ciba, which strengthens <strong>BASF</strong>’s position<br />
in very attractive product lines. In the opinion of the<br />
Supervisory Board, the response of the company to the<br />
developments at the end of <strong>2008</strong> shows: <strong>BASF</strong> has a determined<br />
management team and highly motivated and qualified<br />
employees. They will ensure that <strong>BASF</strong> emerges even<br />
BaSF report <strong>2008</strong><br />
stronger from the current economic crisis. At the first indications<br />
of the crisis, the Board of Executive Directors rapidly<br />
adopted a balanced set of timely, consistent and highly<br />
flexible measures, limiting the negative consequences as far<br />
as possible. The Board of Executive Directors enjoyed the<br />
full support of the entire Supervisory Board for these measures.<br />
Monitoring and consultation in continual dialogue with<br />
the Board of executive Directors<br />
In <strong>2008</strong>, the Supervisory Board of <strong>BASF</strong> SE exercised its<br />
duties required by law and statutes with the utmost care.<br />
The Supervisory Board regularly monitored company management<br />
and provided advice on the company’s strategic<br />
development and important individual measures. To this<br />
end, the Supervisory Board received detailed information<br />
from the Board of Executive Directors at six meetings in<br />
written and verbal reports. Topics included business policies,<br />
the business situation and business development, profitability,<br />
the company’s planning including the planning of<br />
financing, capital expenditures and personnel resources at<br />
<strong>BASF</strong> SE and its major subsidiaries as well as deviations of<br />
the course of business from the planning. The Supervisory<br />
Board discussed in detail the reports of the Board of Executive<br />
Directors, as well as the company’s future prospects as<br />
a whole and those of its individual businesses. Also outside<br />
of Supervisory Board meetings the Chairman of the Supervisory<br />
Board regularly requested information from the Chairman<br />
of the Board of Executive Directors with regard to current<br />
business developments and important transactions.<br />
The Supervisory Board was always involved at an early<br />
stage in decisions of major importance. The Supervisory<br />
Board voted on all of those individual measures taken by<br />
the Board of Executive Directors, which by law or statutes<br />
required the approval of the Supervisory Board.<br />
The members of the Supervisory Board elected by<br />
shareholders and those elected by employees prepared for<br />
the meetings in separate preliminary discussions. With the<br />
exception of one meeting, which one member could not<br />
attend for important reasons, all members were present at<br />
each meeting.
In all meetings, the Supervisory Board dealt with the further<br />
development of the business activities of the <strong>BASF</strong> Group<br />
through acquisitions, divestitures and investment projects,<br />
and advised the Board of Executive Directors in those significant<br />
questions impacting the future of the company. The<br />
projects that the Supervisory Board discussed repeatedly<br />
included the successful takeover offers for Ciba Holding AG<br />
and Revus Energy ASA. The Supervisory Board views both<br />
acquisitions as valuable additions to <strong>BASF</strong>’s existing business<br />
fields. We also dealt repeatedly with the Styrenics<br />
business, which is highly cyclical and close to crude oil and<br />
which <strong>BASF</strong> wants to divest, as well as with the further<br />
development of the business with chemicals for textiles and<br />
leather, which is characterized by low market growth and<br />
fierce competition. At the meeting on July 4, <strong>2008</strong>, the<br />
emphasis was on the growth clusters identified by the<br />
Board of Executive Directors, where we see great opportunities<br />
for <strong>BASF</strong> in the future and which form a focus for research<br />
and development in the <strong>BASF</strong> Group. These clusters<br />
encompass: white (industrial) biotechnology; plant biotechnology,<br />
which includes the research and development<br />
cooperation with Monsanto; raw material change; energy<br />
management; and nanotechnology. At several meetings, we<br />
were informed on the regulatory environment impacting<br />
<strong>BASF</strong>‘s business operations, in particular emissions trading<br />
in the European Union and the effect of the E.U. chemicals<br />
directive REACH. At our meeting on December 3, <strong>2008</strong>, we<br />
discussed and approved the Board of Executive Directors’<br />
operational and financial planning for 2009 and empowered<br />
the Board of Executive Directors to procure financial instruments<br />
under certain conditions.<br />
Committees<br />
<strong>BASF</strong> SE’s Supervisory Board established a total of three<br />
Committees: the Committee for personnel affairs of the<br />
Board of Executive Directors as well as the granting of loans<br />
in accordance with Section 4 of the German Stock Corporation<br />
Act (Personnel Committee), the Audit Committee and<br />
the Nomination Committee. The Supervisory Board received<br />
regular reports on the activities of these committees.<br />
The Personnel Committee consists of Supervisory<br />
Board Chairman Dr. Jürgen Strube (chairman), Supervisory<br />
Board Deputy Chairman Robert Oswald (deputy chairman),<br />
Dr. Tessen von Heydebreck and Michael Vassiliadis. The<br />
Personnel Committee met five times in <strong>2008</strong>. At its meetings,<br />
sometimes with the Chairman of the Board of Executive<br />
Directors, it discussed, in particular, the long-term succession<br />
planning for the Board of Executive Directors as<br />
well as the compensation of the Board of Executive Direc-<br />
Corporate GovernanCe<br />
<strong>Report</strong> of the Supervisory Board<br />
tors. In addition, the decisions to be made by the Supervisory<br />
Board regarding appointments to the Board of Executive<br />
Directors were discussed intensively. The resolutions<br />
were proposed to the plenary session of the Supervisory<br />
Board. These included the appointment of Dr. Hans-Ulrich<br />
Engel as a member of the Board of Executive Directors<br />
(until March 3, 2011), and the extension of the membership<br />
of Dr. Martin Brudermüller (until the 2013 <strong>Annual</strong> Meeting).<br />
The Supervisory Board adopted the proposed resolutions of<br />
the Personnel Committee at its meetings on March 4, and<br />
on July 4, <strong>2008</strong>.<br />
The Audit Committee consists of Supervisory Board<br />
members Max Dietrich Kley, Ralf-Gerd Bastian, Franz<br />
Fehrenbach and Michael Vassiliadis. The chairman of the<br />
Audit Committee is Max Dietrich Kley, who has also been<br />
appointed “Audit Committee Financial Expert.” The Audit<br />
Committee met four times in <strong>2008</strong>. The core duties were to<br />
review the Financial Statements 2007 of <strong>BASF</strong> SE as well<br />
as the Consolidated Financial Statements 2007 and to discuss<br />
the quarterly and first-half financial reports before their<br />
publication with the Board of Executive Directors. Further<br />
focal points were advising the Board of Executive Directors<br />
on accounting issues, discussing and defining the focus of<br />
the audit; regulating business relations with the company’s<br />
auditor, including the adoption of a resolution regarding<br />
the provision of non-audit services by the audi tor; agreeing<br />
upon the auditing fees; and monitoring the auditor’s independence.<br />
The Audit Committee also discussed the<br />
implications of the new recommendations and provisions<br />
on the work of the Audit Committee, in particular of the<br />
German Corporate Governance Code in the amended<br />
version of June 6, <strong>2008</strong> and the German law “Bilanzrechtsmodernisierungsgesetz”<br />
which implements E.U. Direc-<br />
tive 2006/43/EC and which is currently in the legislative<br />
procedure.<br />
BaSF report <strong>2008</strong><br />
145
146<br />
Corporate GovernanCe<br />
<strong>Report</strong> of the Supervisory Board<br />
The members of the Nomination Committee are exclusively<br />
the members of the Supervisory Board elected by the<br />
<strong>Annual</strong> Meeting. These are Prof. Dr. Jürgen Strube, Prof. Dr.<br />
François Diederich, Michael Diekmann, Franz Fehrenbach,<br />
Dr. Tessen von Heydebreck and Max Dietrich Kley. The duty<br />
of the Nomination Committee is the preparation of candidate<br />
proposals for those Supervisory Board members who<br />
are elected by the <strong>Annual</strong> Meeting. The members of the<br />
Nomination Committee consulted on the selection of candidates<br />
for the coming election at the <strong>Annual</strong> Meeting on April<br />
30, 2009, and on March 2, 2009, decided on a candidate<br />
proposal and tabled it for resolution before the Supervisory<br />
Board meeting on March 3, 2009. This also included the<br />
proposal for the future Chairman of the Supervisory Board.<br />
The Supervisory Board confirmed the proposal of the Nomination<br />
Committee for the election at the <strong>Annual</strong> Meeting.<br />
Corporate governance and Declaration of Conformity<br />
In <strong>2008</strong>, the Supervisory Board again addressed in detail<br />
the standards of corporate governance applied by <strong>BASF</strong> as<br />
well as the legal framework for corporations and financial<br />
markets in Germany. This included in particular the amended<br />
German Corporate Governance Code in the version<br />
dated June 6, <strong>2008</strong>, which was dealt with at the meeting on<br />
October 23, <strong>2008</strong>. In particular, we discussed the implementation<br />
of the new code recommendations on board<br />
compensation, and decided to implement these.<br />
At the meeting held December 3, <strong>2008</strong>, the compen-<br />
sation system for the Board of Executive Directors was<br />
reported on in detail and the material elements of the<br />
Board of Executive Directors contracts were explained.<br />
On the basis of this and the proposal of the Personnel<br />
Committee, the Supervisory Board decided on the compensation<br />
system for the Board of Executive Directors and<br />
the significant contractual components. The Supervisory<br />
Board will review these regularly. In the dutiful opinion of<br />
the Supervisory Board, the existing compensation system<br />
does not require amendment.<br />
BaSF report <strong>2008</strong><br />
In its meeting on December 3, <strong>2008</strong>, the Supervisory<br />
Board approved the joint Declaration of Conformity by the<br />
Supervisory Board and the Board of Executive Directors<br />
in accordance with Section 161 of the German Stock<br />
Corporation Act. Furthermore, at this meeting the Supervisory<br />
Board carried out an examination of efficiency and<br />
an assessment of independence. <strong>BASF</strong> complies with the<br />
recommendations of the German Corporate Governance<br />
Code in its version of June 6, <strong>2008</strong>, without exception. The<br />
complete wording of the Declaration of Conformity is provided<br />
on page 148 and is also available to shareholders on<br />
<strong>BASF</strong>’s website.<br />
The compensation report containing full details on the<br />
structure and amount of the compensation for the Board of<br />
Executive Directors and the Supervisory Board, including<br />
the pension benefits of the members of the Board, can be<br />
found on pages 137 to 143.<br />
annual Financial Statements of BaSF Se and Consolidated<br />
Financial Statements<br />
On the basis of the preliminary review by the Audit Committee,<br />
on which the Chairman of the Audit Committee<br />
reported to the Supervisory Board, the Supervisory Board<br />
have examined the Financial Statements and Management’s<br />
Analysis of <strong>BASF</strong> SE for <strong>2008</strong>, the proposal by the Board of<br />
Executive Directors for the appropriation of profit, the Consolidated<br />
Financial Statements, and Management’s Analysis<br />
for the <strong>BASF</strong> Group for <strong>2008</strong>. KPMG AG Wirtschaftsprüfungsgesellschaft,<br />
the auditors elected by the <strong>Annual</strong><br />
Meeting for the fiscal year <strong>2008</strong>, have audited the Financial<br />
Statements of <strong>BASF</strong> SE and the Consolidated Financial<br />
Statements including Management’s Analysis under consideration<br />
of book keeping, and have approved them free of<br />
qualification. Furthermore the auditor certified that the<br />
Board of Executive Directors had taken the measures<br />
incumbent on it under Section 91, paragraph 2 of the German<br />
Stock Corporation Act in an appropriate way. In particular,<br />
it had instituted a suitable information and monitoring<br />
system that met the needs of the company and appeared<br />
suitable, both in design and the way in which it had been<br />
applied, to provide early warning of developments that pose<br />
a threat to the continued existence of the company.
The documents to be examined and the auditors’ reports<br />
were sent timely to every member of the Supervisory Board.<br />
The auditors attended the accounts review meeting of the<br />
Audit Committee on February 25, 2009, as well as the<br />
accounts meeting of the Supervisory Board on March 3,<br />
2009, and reported on the main findings of their audit. The<br />
auditors also provided detailed explanations of their reports<br />
on the day before the accounts review meeting of the Supervisory<br />
Board.<br />
We have reviewed the auditors’ reports and agree with<br />
them. The results of the preliminary review by the Audit<br />
Committee and the results of our own examination fully<br />
concur with those of the audit. The Supervisory Board sees<br />
no grounds for objections to the management and the submitted<br />
reports.<br />
At the Supervisory Boards accounts meeting on March<br />
3, 2009, we approved the Financial Statements of <strong>BASF</strong> SE<br />
prepared by the Board of Executive Directors and the Consolidated<br />
Financial Statements of the <strong>BASF</strong> Group, making<br />
the Financial Statements final. We concur with the proposal<br />
of the Board of Executive Directors regarding the appropriation<br />
of profit and the payment of a dividend of €1.95 per<br />
share.<br />
Composition of the Supervisory Board and Board of<br />
executive Directors<br />
Since January 14, <strong>2008</strong>, the Supervisory Board of <strong>BASF</strong> SE<br />
has been composed of the shareholder representatives who<br />
were elected at the <strong>Annual</strong> Meeting on April 26, 2007: Prof.<br />
Dr. Jürgen Strube, Prof. Dr. François Diederich, Michael<br />
Diekmann, Franz Fehrenbach, Dr. Tessen von Heydebreck<br />
and Max Dietrich Kley as well as the employee represen-<br />
tatives under the Employee Participation Agreement of<br />
November 15, 2007: Ralf-Gerd Bastian, Wolfgang Daniel,<br />
Robert Oswald, Denise Schellemans and Michael<br />
Vassiliadis. One Supervisory Board member under the<br />
Employee Participation Agreement, Ulrich Küppers, resigned<br />
as of May 30, <strong>2008</strong>. He was replaced by Ralf Sikorski,<br />
who was named substitute member under the Employee<br />
Participation Agreement. At the meeting on April 24, <strong>2008</strong>,<br />
Supervisory Board members Michael Diekmann and Robert<br />
Oswald were elected as Deputy Chairmen. The term of<br />
office of all members of the Supervisory Board terminates<br />
on the day of the <strong>Annual</strong> Meeting 2009.<br />
With effect on March 4, <strong>2008</strong>, the Supervisory<br />
Board appointed Dr. Hans-Ulrich Engel to the Board of<br />
Executive Directors. The long-serving Deputy Chairman<br />
Dr. h. c. Eggert Voscherau and Peter Oakley left the Board<br />
of Executive Directors in the course of <strong>2008</strong>.<br />
Corporate GovernanCe<br />
<strong>Report</strong> of the Supervisory Board<br />
thanks<br />
The Supervisory Board thanks all employees of the <strong>BASF</strong><br />
Group worldwide, the management of the company and the<br />
retired members of the Board of Executive Directors and the<br />
Supervisory Board for the work they performed in <strong>2008</strong>.<br />
Ludwigshafen, Germany, March 3, 2009<br />
The Supervisory Board<br />
professor Dr. Jürgen Strube<br />
Chairman of the Supervisory Board<br />
BaSF report <strong>2008</strong><br />
147
148<br />
Corporate GovernanCe<br />
Declaration of Conformity<br />
DeCLaratIon oF ConForMIty <strong>2008</strong><br />
of the Board of executive Directors and the Supervisory Board of BaSF Se<br />
the Board of executive Directors and the Supervisory<br />
Board of BaSF Se hereby declare pursuant to § 161<br />
aktG (Stock Corporation act)<br />
1. The recommendations of the Government Commission<br />
on the German Corporate Governance Code published by<br />
the Federal Ministry of Justice on August 8, <strong>2008</strong>, in the<br />
official section of the electronic Federal Gazette are complied<br />
with and will be complied with.<br />
2. The recommendations of the Government Commission<br />
on the German Corporate Governance Code published<br />
by the Federal Ministry of Justice on July 20, 2007 in the<br />
official section of the electronic Federal Gazette have been<br />
complied with since the submission of the last Declaration<br />
of Conformity on December 5, 2007, with the following<br />
exception:<br />
The structure of the compensation for the Board of Executive<br />
Directors was discussed in the Personnel Committee<br />
and was regularly reviewed (by way of deviation from Code<br />
number 4.2.2, paragraph 1).<br />
Ludwigshafen, December 3, <strong>2008</strong><br />
the Supervisory Board<br />
of <strong>BASF</strong> SE<br />
BaSF report <strong>2008</strong><br />
the Board of executive Directors<br />
of <strong>BASF</strong> SE
Fredy Mariscal<br />
helped develop the umbrella brand<br />
agcelence ® for the latin american<br />
crop protection market.<br />
* in particular as a result of active ingredients<br />
that make plants more resilient
Consolidated finanCial statements<br />
and notes<br />
ValUe FOr BasF<br />
increased sales with products<br />
for strong plants<br />
On-site consultancy: Fredy Mariscal visits customer Edson Cagnin on his farm.<br />
High earnings through new market segment<br />
We market our Plant Health concept in Latin America under<br />
the umbrella brand AgCelence: We offer farmers products<br />
that positively impact plant health as well as providing<br />
effective disease and pest control. One of the most important<br />
active ingredients with these characteristics is F 500 ® . It not<br />
only protects crops against fungal growth, but also strengthens<br />
their metabolism and natural defenses. These additional<br />
characteristics open up a new market and opportunities for<br />
business success for our Crop Protection division. The Plant<br />
Health concept was distinguished with <strong>BASF</strong>’s Business<br />
Excellence Award <strong>2008</strong>.<br />
ValUe FOr sOcieTy<br />
Better yields for farmers<br />
With <strong>BASF</strong>’s Plant Health products, farmers improve the yield and quality of<br />
their harvests even during droughts.<br />
Good harvests through healthy plants<br />
Our Plant Health products improve the health of crops, thereby<br />
increasing yields and improving the quality of harvests,<br />
even under extreme conditions such as drought. In this way,<br />
we help farmers to be more successful and to contribute to<br />
safeguarding sustainable food supplies.<br />
more information on our crop protection products can be found from<br />
page 75 onward
04<br />
Consolidated<br />
finanCial statements<br />
and notes<br />
statement by the Board of executive directors 150<br />
<strong>Report</strong> of the independent auditors 151<br />
Consolidated statements of income 152<br />
Consolidated Balance sheets 153<br />
Consolidated statements of Recognized income<br />
and expense 154<br />
Consolidated statements of Cash flows 155<br />
Consolidated statements of stockholders’<br />
equity 156<br />
Basf Group Consolidated financial statements<br />
and notes 157<br />
Consolidated finanCial statements<br />
and notes
150<br />
Consolidated finanCial statements<br />
Statement by the Board of Executive Directors<br />
Consolidated finanCial statements<br />
Basf GRouP<br />
statement By tHe BoaRd of exeCutive diReCtoRs and assuRanCe PuRsuant<br />
to seCtion 297(2), seCtion 315(1) GeRman CommeRCial Code<br />
The Board of Executive Directors of <strong>BASF</strong> SE is responsible<br />
for preparing the Consolidated Financial Statements<br />
and Management’s Analysis of the <strong>BASF</strong> Group.<br />
The Consolidated Financial Statements were prepared<br />
according to the International Financial <strong>Report</strong>ing Standards<br />
(IFRS), which are published by the International<br />
Accounting Standards Board (IASB), London, and have<br />
been endorsed by the European Union.<br />
In order to ensure the adherence of the Consolidated<br />
Financial Statements of the <strong>BASF</strong> Group and Management’s<br />
Analysis to the applicable accounting rules, and<br />
the accuracy of reporting, we have established effective<br />
internal control systems.<br />
The adherence to uniform, Group-wide accounting and<br />
reporting standards, and the reliability and effectiveness of<br />
our control systems are continually audited throughout the<br />
Group by our internal audit department. The risk management<br />
system we have set up complies with the requirements<br />
of the German Control and Transparency in Business<br />
Act (91(2), Stock Corporation Act) and is designed<br />
to identify material risks in a timely manner, thus enabling<br />
the Board of Executive Directors to take appropriate<br />
defensive measures as required.<br />
Ludwigshafen, February 25, 2009<br />
dR. JüRGen HamBReCHt<br />
Chairman of the Board of Executive Directors<br />
dR. maRtin BRudeRmülleR<br />
dR. JoHn feldmann<br />
dR. stefan maRCinowski<br />
Basf RePoRt <strong>2008</strong><br />
To the best of our knowledge, and in accordance with the<br />
applicable reporting principles, the Consolidated Financial<br />
Statements of the <strong>BASF</strong> Group give a true and fair view of<br />
the assets, liabilities, financial position and profit situation<br />
of the Group, and the Management’s Analysis includes<br />
a fair review of the development and performance of the<br />
business and the position of the Group, together with a<br />
description of the principal opportunities and risks associated<br />
with the expected development of the Group.<br />
KPMG AG Wirtschaftsprüfungsgesellschaft has audited<br />
the Consolidated Financial Statements of the <strong>BASF</strong> Group<br />
and Management’s Analysis and approved them free of<br />
qualification. The Consolidated Financial Statements of the<br />
<strong>BASF</strong> Group, the Management’s Analysis and the auditors’<br />
report were examined at length by the Audit Committee<br />
of the Supervisory Board in the presence of the auditors at<br />
its meeting on February 25, 2009. For the results of the<br />
Supervisory Board’s examination, please refer to the <strong>Report</strong><br />
of the Supervisory Board.<br />
dR. kuRt BoCk<br />
Chief Financial Officer<br />
dR. Hans-ulRiCH enGel<br />
dR. andReas kReimeyeR<br />
dR. HaRald sCHwaGeR
auditoR’s RePoRt<br />
We have audited the Consolidated Financial Statements<br />
prepared by the <strong>BASF</strong> SE (until January 13,<br />
<strong>2008</strong>, <strong>BASF</strong> Aktiengesellschaft), Ludwigshafen am<br />
Rhein, Germany, comprising the income statement,<br />
the balance sheet, the statement of changes in<br />
equity, the statement of recognized income and<br />
expense, the cash flow statement and the notes to<br />
the Consolidated Financial Statements, together with<br />
Management’s Analysis for the business year from<br />
January 1 to December 31, <strong>2008</strong>. The preparation of<br />
the Consolidated Financial Statements and Management’s<br />
Analysis in accordance with IFRSs as adopted<br />
by the E.U., and the additional requirements of<br />
German commercial law pursuant to § 315a Abs.<br />
[paragraph] 1 HGB [Handelsgesetzbuch „German<br />
Commercial Code“] are the responsibility of the parent<br />
company’s management. Our responsibility is to<br />
express an opinion on the Consolidated Financial<br />
Statements and on Management’s Analysis based<br />
on our audit. In addition we have been instructed to<br />
express an opinion as to whether the Consolidated<br />
Financial Statements comply with full IFRS.<br />
We conducted our audit of the Consolidated<br />
Financial Statements in accordance with § 317<br />
German Commercial Code and German generally<br />
accepted standards for the audit of financial statements<br />
promulgated by the Institut der<br />
Wirtschaftsprüfer [Institute of Public Auditors in Germany]<br />
(IDW). Those standards require that we plan<br />
and perform the audit such that misstatements<br />
materially affecting the presentation of the net assets,<br />
financial position and results of operations in<br />
the Consolidated Financial Statements in accordance<br />
with the applicable financial reporting frame-<br />
Frankfurt am Main, February 25, 2009<br />
KPMG AG<br />
Wirtschaftsprüfungsgesellschaft<br />
(formerly KPMG Deutsche Treuhand-Gesellschaft<br />
Aktiengesellschaft<br />
Wirtschaftsprüfungsgesellschaft)<br />
dR. sCHindleR<br />
Wirtschaftsprüfer<br />
kuHn<br />
Wirtschaftsprüfer<br />
Consolidated finanCial statements<br />
<strong>Report</strong> of Independent Auditors<br />
work and in Management’s Analysis are detected<br />
with reasonable assurance. Knowledge of the business<br />
activities and the economic and legal environment<br />
of the Group and expectations as to possible<br />
misstatements are taken into account in the determination<br />
of audit procedures. The effectiveness of<br />
the accounting-related internal control system and<br />
the evidence supporting the disclosures in the Consolidated<br />
Financial Statements and Management’s<br />
Analysis are examined primarily on a test basis within<br />
the framework of the audit. The audit includes<br />
assessing the annual financial statements of those<br />
entities included in consolidation, the determination<br />
of entities to be included in consolidation, the<br />
accounting and consolidation principles used and<br />
significant estimates made by management, as well<br />
as evaluating the overall presentation of the Consolidated<br />
Financial Statements and Management’s<br />
Analysis. We believe that our audit provides a reasonable<br />
basis for our opinion.<br />
Our audit has not led to any reservations. In our<br />
opinion, based on the findings of our audit, the Consolidated<br />
Financial Statements comply with IFRSs<br />
as adopted by the E.U., the additional requirements<br />
of German commercial law pursuant to § 315a Abs.<br />
1 HGB and full IFRS and give a true and fair view<br />
of the net assets, financial position and results of<br />
operations of the Group in accordance with these<br />
requirements. Management’s Analysis is consistent<br />
with the Consolidated Financial Statements and as a<br />
whole provides a suitable view of the Group’s position<br />
and suitably presents the opportunities and<br />
risks of future development.<br />
Basf RePoRt <strong>2008</strong><br />
151
152<br />
Consolidated finanCial statements<br />
Consolidated Statements of Income<br />
Consolidated statements of inCome<br />
Basf GRouP<br />
Consolidated statements of income (million €)<br />
Basf RePoRt <strong>2008</strong><br />
Explanations in Note <strong>2008</strong> 2007<br />
Sales (4) 62,304 57,951<br />
Cost of sales 46,455 41,899<br />
Gross profit on sales 15,849 16,052<br />
Selling expenses 5,777 5,586<br />
General and administrative expenses 1,058 1,067<br />
Research and development expenses 1,355 1,380<br />
Other operating income (5) 1,304 1,053<br />
Other operating expenses (6) 2,500 1,756<br />
income from operations (4) 6,463 7,316<br />
Income from companies accounted for using the equity method (66) 57<br />
Other income from participations 74 58<br />
Other expenses from participations 82 31<br />
Interest income 174 142<br />
Interest expense 601 614<br />
Other financial income 772 726<br />
Other financial expenses 758 719<br />
financial result (7) (487) (381)<br />
income before taxes and minority interests 5,976 6,935<br />
Income taxes (8) 2,671 2,610<br />
income before minority interests 3,305 4,325<br />
Minority interests (9) 393 260<br />
net income 2,912 4,065<br />
earnings per share (€) 1 (3) 3.13 4.16<br />
Dilution effect (3) – –<br />
diluted earnings per share (€) 1 (3) 3.13 4.16<br />
1 In the second quarter of <strong>2008</strong>, we conducted a two-for-one stock split. The earnings per share figure for 2007 has been adjusted accordingly.
Consolidated BalanCe sHeets<br />
Basf GRouP<br />
assets (million €)<br />
Consolidated finanCial statements<br />
Consolidated Balance Sheets<br />
Explanations in Note december 31, <strong>2008</strong> December 31, 2007<br />
Intangible assets (11) 9,889 9,559<br />
Property, plant and equipment (12) 15,032 14,215<br />
Investments accounted for using the equity method (13) 1,146 834<br />
Other financial assets (13) 1,947 1,952<br />
Deferred tax assets (8) 930 679<br />
Other receivables and miscellaneous long-term assets (15) 642 655<br />
long-term assets 29,586 27,894<br />
Inventories (14) 6,763 6,578<br />
Accounts receivable, trade (15) 7,752 8,561<br />
Other receivables and miscellaneous short-term assets (15) 3,948 2,337<br />
Marketable securities (16) 35 51<br />
Cash and cash equivalents (16) 2,776 767<br />
Assets of disposal groups (2) – 614<br />
short-term assets 21,274 18,908<br />
total assets 50,860 46,802<br />
stockholders’ equity and liabilities (million €)<br />
Explanations in Note december 31, <strong>2008</strong> December 31, 2007<br />
Subscribed capital (17) 1,176 1,224<br />
Capital surplus (17) 3,241 3,173<br />
Retained earnings (18) 13,250 14,556<br />
Other comprehensive income (18) (96) 174<br />
equity of shareholder of Basf se 17,571 19,127<br />
Minority interests (19) 1,151 971<br />
stockholders’ equity 18,722 20,098<br />
Provisions for pensions and similar obligations (20) 1,712 1,292<br />
Other provisions (21) 2,757 3,015<br />
Deferred tax liabilities (8) 2,167 2,060<br />
Financial indebtedness (22) 8,290 6,954<br />
Other liabilities (22) 917 901<br />
long-term liabilities 15,843 14,222<br />
Accounts payable, trade 2,734 3,763<br />
Provisions (21) 3,043 2,697<br />
Tax liabilities (8) 860 881<br />
Financial indebtedness (22) 6,224 3,148<br />
Other liabilities (22) 3,434 1,976<br />
Liabilities of disposal groups (2) – 17<br />
short-term liabilities 16,295 12,482<br />
total stockholders’ equity and liabilities 50,860 46,802<br />
Basf RePoRt <strong>2008</strong><br />
153
154<br />
Consolidated finanCial statements<br />
Consolidated Statements of Recognized Income and Expense<br />
Consolidated statements<br />
of ReCoGnized inCome and exPense<br />
Basf GRouP<br />
income and expense items (million €)<br />
Basf RePoRt <strong>2008</strong><br />
<strong>2008</strong> 2007<br />
income before minority interests 3,305 4,325<br />
Actuarial gains/losses and asset ceiling for defined benefit assets (782) 55<br />
Change in foreign currency translation adjustments (142) (532)<br />
Fair value changes in available-for-sale securities (12) 343<br />
Cash flow hedges (163) 33<br />
Revaluation due to acquisition of majority of shares (2) 12<br />
Deferred taxes 194 (155)<br />
Minority interests (12) (45)<br />
total income and expense recognized in equity (919) (289)<br />
total income and expense for the period 2,386 4,037<br />
Thereof <strong>BASF</strong> 2,005 3,822<br />
Thereof minority interests 381 215<br />
development of income and expense recognized directly in equity (million €)<br />
Retained<br />
earnings Other comprehensive income<br />
Actuarial gains/<br />
losses; asset<br />
ceiling<br />
Foreign<br />
currency<br />
translation<br />
adjustment<br />
Fair value<br />
changes in<br />
available-for-<br />
sale securities<br />
Cash flow<br />
hedges<br />
Revaluation<br />
due to<br />
acquisition of<br />
majority of<br />
shares<br />
Total of other<br />
comprehensive<br />
income<br />
Total income<br />
and expense<br />
recognized directly<br />
in equity<br />
as of January 1, <strong>2008</strong> (874) (497) 680 (21) 12 174 (700)<br />
Additions (782) (142) – (170) – (312) (1,094)<br />
Releases – – (12) 7 (2) (7) (7)<br />
Deferred taxes 145 2 . 47 – 49 194<br />
as of december 31, <strong>2008</strong> (1,511) (637) 668 (137) 10 (96) (1,607)<br />
as of January 1, 2007 (782) 27 341 (42) – 326 (456)<br />
Additions – (532) 349 (64) 12 (235) (235)<br />
Releases 55 – (6) 97 – 91 146<br />
Deferred taxes (147) 8 (4) (12) – (8) (155)<br />
as of december 31, 2007 (874) (497) 680 (21) 12 174 (700)
Consolidated finanCial statements<br />
Consolidated Statements of Cash Flows<br />
Consolidated statements of CasH flows<br />
Basf GRouP<br />
Consolidated statements of cash flows 1 (million €)<br />
<strong>2008</strong> 2007<br />
Net income 2,912 4,065<br />
Depreciation and amortization of intangible assets, property, plant and equipment and financial assets 3,180 2,947<br />
Changes in pension provisions, defined benefit assets and other non-cash items 271 (164)<br />
Net gains from disposal of long-term assets and securities (1) (42)<br />
Changes in inventories 136 (335)<br />
Changes in receivables (739) (864)<br />
Changes in operating liabilities and other provisions (736) 200<br />
Cash provided by operating activities 5,023 5,807<br />
Payments related to intangible assets and property, plant and equipment (2,521) (2,562)<br />
Payments related to financial assets and securities (976) (755)<br />
Payments related to acquisitions (637) (635)<br />
Proceeds from divestitures 73 99<br />
Proceeds from the disposal of long-term assets and securities 601 241<br />
Cash used in investing activities (3,460) (3,612)<br />
Capital increases/repayments and other equity transactions 45 150<br />
Share repurchases (1,618) (1,899)<br />
Proceeds from the addition of financial liabilities 6,271 3,162<br />
Repayment of financial liabilities<br />
Dividends paid<br />
(2,082) (2,025)<br />
To shareholders of <strong>BASF</strong> SE (1,831) (1,484)<br />
To minority shareholders (326) (140)<br />
Cash provided by (used in) financing activities 459 (2,236)<br />
net changes in cash and cash equivalents 2,022 (41)<br />
Effects on cash and cash equivalents<br />
From foreign exchange rates (31) (9)<br />
From changes in scope of consolidation 2 18 (17)<br />
Cash and cash equivalents at the beginning of the year 767 834<br />
Cash and cash equivalents at the end of the year 2,776 767<br />
1 More information on the Consolidated Statement of Cash Flows can be found in the Notes on pages 45 and 46.<br />
Other information on cash flow can be found in Note 10 on page 186.<br />
2 This includes liquid funds of €3 million from the reclassification of the disposal group (2007: minus €3 million).<br />
Basf RePoRt <strong>2008</strong><br />
155
156<br />
Consolidated finanCial statements<br />
Consolidated Statements of Stockholders’ Equity<br />
Consolidated statements<br />
of stoCkHoldeRs’ equity<br />
Basf GRouP<br />
Consolidated statements of stockholders’ equity (million €)<br />
Basf RePoRt <strong>2008</strong><br />
Number of<br />
subscribed<br />
shares<br />
outstanding 1<br />
Subscribed<br />
capital<br />
Capital<br />
surplus<br />
Retained<br />
earnings<br />
Other comprehensive<br />
income 2<br />
equity of<br />
shareholders<br />
of<br />
Basf se<br />
Minority<br />
interest<br />
total stockholders’<br />
equity<br />
January 1, <strong>2008</strong> 956,370,000 1,224 3,173 14,556 174 19,127 971 20,098<br />
Share buy-back and cancellation<br />
of own shares including own<br />
shares intended to be cancelled<br />
Effects of acquisitions achieved<br />
in stages<br />
(37,891,306)<br />
–<br />
(48)<br />
–<br />
74<br />
–<br />
Capital withdrawal/contribution – – – – – – 100 100<br />
Dividend paid – – – (1,831) – (1,831) (326) 3 (2,157)<br />
Net income – – – 2,912 – 2,912 393 3,305<br />
Income and expense recognized<br />
directly in equity<br />
–<br />
–<br />
–<br />
Changes in scope of consoli-<br />
dation and other changes – – (6) 4 (1) – (7) (2) (9)<br />
december 31, <strong>2008</strong> 918,478,694 1,176 3,241 13,250 (96) 17,571 1,151 18,722<br />
January 1, 2007 999,360,000 1,279 3,141 13,302 326 18,048 530 18,578<br />
Share buy-back and cancellation<br />
of own shares including own<br />
shares intended to be cancelled<br />
(42,990,000)<br />
(55)<br />
27<br />
Capital withdrawal/contribution – – – – – – 150 150<br />
Asset swap 5 – – – 634 – 634 216 850<br />
Dividend paid – – – (1,484) – (1,484) (140) 3 (1,624)<br />
Net income – – – 4,065 – 4,065 260 4,325<br />
Income and expense recognized<br />
directly in equity<br />
Changes in scope of consoli-<br />
dation and other changes<br />
–<br />
–<br />
–<br />
–<br />
–<br />
5 4<br />
december 31, 2007 956,370,000 1,224 3,173 14,556 174 19,127 971 20,098<br />
(1,644)<br />
(105)<br />
(637)<br />
(1,871)<br />
–<br />
–<br />
(270)<br />
–<br />
(1,618)<br />
1 The number of outstanding shares were adjusted retroactively for the two-for-one stock split conducted in the second quarter of <strong>2008</strong>.<br />
2 Details are provided in the Consolidated Statements of Recognized Income and Expense on page 154.<br />
3 Including profit and loss transfers<br />
4 Granting of <strong>BASF</strong> shares under the employee share program “Plus”<br />
5 More information on the asset swap with Gazprom can be found in Note 2 from page 170 onward.<br />
(92)<br />
2<br />
(152)<br />
–<br />
(105)<br />
(907)<br />
(1,899)<br />
(244)<br />
7<br />
–<br />
27<br />
(12)<br />
–<br />
(45)<br />
–<br />
(1,618)<br />
(78)<br />
(919)<br />
(1,899)<br />
(289)<br />
7
1 -- summaRy of aCCountinG PoliCies<br />
a -- Basis of presentation<br />
The Consolidated Financial Statements of <strong>BASF</strong> SE as of<br />
December 31, <strong>2008</strong>, have been prepared in accordance<br />
with the International Financial <strong>Report</strong>ing Standards (IFRS)<br />
and Section 315a (1) of the German Commercial Code<br />
(HGB). All of the binding IFRS in the reporting year <strong>2008</strong> as<br />
well as the pronouncements of the International Financial<br />
<strong>Report</strong>ing Interpretations Committee (IFRIC) were applied.<br />
Those IFRSs which had not been endorsed by the<br />
European Union at the balance sheet date had no effect on<br />
<strong>BASF</strong>’s Consolidated Financial Statements.<br />
The accounting policies and valuation methods that<br />
have been applied are the same as those of the previous<br />
year. Exceptions to this are changes required by the application<br />
of new or revised standards and interpretations. In<br />
this regard, there were no material changes in <strong>2008</strong>.<br />
On February 24, 2009, the Consolidated Financial Statements<br />
were authorized for issue by the Board of Executive<br />
Directors and submitted for approval by the Audit Committee<br />
to the Supervisory Board of <strong>BASF</strong> SE at their meeting on<br />
March 3, 2009.<br />
B -- scope of consolidation<br />
The Consolidated Financial Statements include <strong>BASF</strong> SE,<br />
the parent company, with its headquarters in Ludwigs-<br />
hafen, Germany, as well as all the material subsidiaries in<br />
which <strong>BASF</strong> SE directly or indirectly exercises a majority of<br />
the voting rights (collectively, the “Company”). Material,<br />
jointly operated companies are included on a proportional<br />
consolidation basis.<br />
scope of consolidated<br />
<strong>2008</strong> 2007<br />
Consolidated companies as of January 1 297 328<br />
Thereof proportionally consolidated 18 19<br />
First-time consolidations 22 20<br />
Thereof proportionally consolidated 1 (1)<br />
Deconsolidations 26 51<br />
Thereof proportionally consolidated – –<br />
Consolidated as of december 31 293 297<br />
Thereof proportionally consolidated 19 18<br />
Consolidated finanCial statements<br />
Notes<br />
Associated companies are accounted for using the equity<br />
method. These are companies in which the Company has<br />
an interest of at least 20% or can exercise a significant<br />
influence over the operating and financial policies. In total,<br />
this applies to:<br />
Companies consolidated using the equity method<br />
<strong>2008</strong> 2007<br />
Subsidiaries 8 10<br />
Joint ventures 4 4<br />
Other associated companies 5 6<br />
17 20<br />
First-time consolidations in <strong>2008</strong> comprised:<br />
• the formation of two new holding companies headquartered<br />
in Chile and Canada<br />
• three companies from the Revus Group acquired in<br />
December in the Oil & Gas segment<br />
• four companies from the Sorex Group acquired in<br />
December in the Agricultural Solutions segment<br />
• an additional 13 companies, which were consolidated<br />
due to their increased importance, headquartered in<br />
Germany, the Russian Federation, the Netherlands,<br />
Norway, Romania, Iran, Vietnam, Kazakhstan and the<br />
Dominican Republic<br />
In <strong>2008</strong>, 26 companies were deconsolidated due to merger<br />
or immateriality.<br />
First-time consolidations in 2007 comprised:<br />
• the formation of three companies headquartered in South<br />
Africa, the Netherlands and the United States<br />
• the Chinese manufacturer of catalysts for motorcycles<br />
and small engines, Guilin REEcat Catalyst Co., Ltd, in<br />
Guilin, China, acquired in April<br />
• a project company which was acquired through Wintershall’s<br />
asset swap with Gazprom<br />
• an additional 15 subsidiaries due to their increased<br />
importance, which were previously not consolidated,<br />
with headquarters in Germany, the Netherlands, India,<br />
the Czech Republic, China and the United States<br />
In 2007, 51 companies were deconsolidated due to<br />
merger, sale or immateriality.<br />
Basf RePoRt <strong>2008</strong><br />
157
158<br />
Consolidated finanCial statements<br />
Notes<br />
effects of changes in the scope of consolidation<br />
Basf RePoRt <strong>2008</strong><br />
<strong>2008</strong><br />
million €<br />
<strong>2008</strong><br />
%<br />
2007<br />
million €<br />
sales (43) (0.1) 18 .<br />
Long-term assets . . 1 .<br />
Thereof property, plant and equipment 24 0.2 1 .<br />
Short-term assets 38 0.2 . .<br />
Thereof cash and cash equivalents 15 0.5 (14) (1.6)<br />
total assets 38 0.1 1 .<br />
Stockholders’ equity 2 . 18 0.1<br />
Long-term liabilities 5 . (4) .<br />
Thereof financial indebtedness 7 0.1 2 .<br />
Short-term liabilities 31 0.2 (13) (0.1)<br />
Thereof financial indebtedness (10) (0.2) 8 0.2<br />
total stockholders’ equity and liabilities 38 0.1 1 .<br />
Contingent liabilities and other financial obligations . . 1 .<br />
financial information on proportionally consolidated companies (million €)<br />
2007<br />
%<br />
<strong>2008</strong> 2007<br />
income statement information<br />
Sales 5,392 4,178<br />
Gross profit on sales 278 368<br />
Income from operations 173 285<br />
Income before taxes and minority interest 169 301<br />
Net income 167 306<br />
Balance sheet information<br />
Long-term assets 1,282 1,238<br />
Thereof property, plant and equipment 1,178 1,159<br />
Short-term assets 959 960<br />
Thereof marketable securities, cash and cash equivalents 49 31<br />
total assets 2,241 2,198<br />
Stockholders’ equity 783 862<br />
Long-term liabilities 627 538<br />
Thereof financial indebtedness 296 218<br />
Short-term liabilities 831 798<br />
Thereof financial indebtedness 163 39<br />
total stockholders’ equity and liabilities 2,241 2,198<br />
Contingent liabilities and other financial obligations 175 137<br />
Consolidated statements of cash flows<br />
Cash provided by operating activities 320 280<br />
Cash used in investing activities (84) (129)<br />
Cash provided by (used in) financing activities (223) (198)<br />
Net changes in cash and cash equivalents 13 (47)
Proportionally and at equity consolidated companies<br />
Proportionally consolidated companies of major significance<br />
are as follows:<br />
• Wintershall Erdgas Handelshaus GmbH & Co. KG, Berlin,<br />
Germany; Wintershall Erdgas Handelshaus Zug AG, Zug,<br />
Switzerland as well as ZAO Achimgaz, Novy Urengoy, the<br />
Russian Federation, joint ventures with Gazprom through<br />
which gas trading activities and the production of natural<br />
gas and condensate in Siberia are operated<br />
• ELLBA C.V., Rotterdam, the Netherlands and ELLBA Eastern<br />
Private Ltd., Singapore, which are operated jointly with<br />
Shell and produce propylene oxide and styrene monomer<br />
• <strong>BASF</strong> DOW HPPO Production B.V.B.A., Antwerp, Belgium,<br />
which is operated jointly with Dow to produce propylene<br />
oxide (PO)<br />
• <strong>BASF</strong>-YPC Company Ltd., a joint venture between <strong>BASF</strong><br />
and Sinopec, that operates the Verbund site in Nanjing,<br />
China<br />
financial information on companies consolidated using the equity method (million €)<br />
Consolidated finanCial statements<br />
Notes<br />
A complete listing of all proportionally consolidated companies<br />
is available in the List of Shares Held.<br />
The following associated companies of major significance<br />
have been accounted for using the equity method: Solvin<br />
Group (<strong>BASF</strong> stake: 25%), Heesung Catalysts Corporation,<br />
Seoul, South Korea (<strong>BASF</strong> stake: 49%), N.E. Chemcat Corporation<br />
1 ,Tokyo, Japan (<strong>BASF</strong> stake: 42%), Nord Stream AG,<br />
Zug, Switzerland (<strong>BASF</strong> stake: 20%), OAO Severneftegazprom,<br />
Krasnoselskusky, the Russian Federation (<strong>BASF</strong> stake:<br />
25%, share of economic rewards: 35%), and Shanghai<br />
Lianheng Isocyanate Co. Ltd., Shanghai, China (<strong>BASF</strong> stake:<br />
35%). Consolidated financial information is shown below:<br />
1 The market capitalization of the 42% stake in N.E. Chemcat Corporation<br />
amounts to a total of €106 million as of December 31, <strong>2008</strong>.<br />
<strong>2008</strong> 2007<br />
income statement information<br />
Sales 3,132 2,736<br />
Gross profit on sales 1,912 475<br />
Income from operations 295 254<br />
Income before taxes and minority interests (234) 251<br />
Net income (198) 167<br />
<strong>BASF</strong>’s share of net income (68) 54<br />
Balance sheet information<br />
Long-term assets 2,971 2,467<br />
Thereof property, plant and equipment 2,205 2,261<br />
Short-term assets 2,453 1,851<br />
Thereof marketable securities, cash and cash equivalents 1,155 369<br />
total assets 5,424 4,318<br />
Stockholders’ equity 2,590 1,430<br />
Long-term liabilities 425 1,885<br />
Thereof financial indebtedness 233 1,379<br />
Short-term liabilities 2,409 1,003<br />
Thereof financial indebtedness 1,818 116<br />
total stockholders’ equity and liabilities 5,424 4,318<br />
<strong>BASF</strong>’s proportional interest 800 484<br />
Basf RePoRt <strong>2008</strong><br />
159
160<br />
Consolidated finanCial statements<br />
Notes<br />
C -- accounting policies<br />
Balance sheet date: The individual financial statements of<br />
the companies consolidated in the Consolidated Financial<br />
Statements of the <strong>BASF</strong> Group (hereinafter referred to as<br />
“consolidated companies”) are generally prepared as of the<br />
balance sheet date of the Consolidated Financial Statements.<br />
uniform valuation: Assets and liabilities of consolidated<br />
companies are accounted for and valued uniformly<br />
in accordance with the principles described herein. For<br />
companies accounted for using the equity method, material<br />
deviations from our accounting policies are adjusted.<br />
eliminations: Transactions between consolidated<br />
companies as well as inter-company profits resulting from<br />
sales and services rendered between consolidated companies<br />
are eliminated in full. For jointly operated companies<br />
this is conducted on a pro rata basis. Material inter-company<br />
profits related to companies accounted for using the<br />
equity method are eliminated.<br />
Capital consolidation: Capital consolidation is based<br />
on the purchase method. Initially, all assets, liabilities and<br />
intangible assets that are to be capitalized are valued at<br />
fair value. Finally, the acquisition cost is compared with the<br />
proportionate share of the net assets acquired at fair value.<br />
The resulting differences are capitalized as goodwill and<br />
are only written down in the case of impairment.<br />
Revenue recognition: Revenues from the sale of<br />
goods or the rendering of services are recognized upon the<br />
transfer of ownership and risk to the buyer. They are<br />
valued at the fair value of the consideration received and<br />
are reported without sales taxes. Expected rebates and<br />
other trade discounts are either accrued or deducted.<br />
Provisions are made to cover the return of products, estimated<br />
future warranty obligations and other claims.<br />
Revenues from the sale of precious metals to industrial<br />
customers as well as some revenues from natural gas trading<br />
are recognized at the time of shipment and the<br />
corresponding purchase price is recorded at cost of sales.<br />
Revenues from the trading of precious metals and their<br />
derivatives with broker-traders, where as a rule there is no<br />
physical delivery, are recorded on a net basis. Revenues<br />
from natural gas trading activities of a project company<br />
consolidated by <strong>BASF</strong> are also recorded on a net basis.<br />
In certain cases, customer acceptance is required on<br />
delivery. In these cases, revenues are recognized after<br />
customer acceptance occurs.<br />
Basf RePoRt <strong>2008</strong><br />
Long-term contracts primarily relate to the construction of<br />
chemical plants for third parties. Realization of revenues<br />
and costs takes place according to the stage of completion<br />
when the outcome of the construction contract can<br />
be reliably estimated. To the extent that the outcome of<br />
the construction cannot be estimated reliably, revenue<br />
is recognized based on the contract costs incurred.<br />
Expected losses on the construction contract are recognized<br />
with a write-down to the fair value.<br />
Payments relating to the sale or licensing of technologies<br />
or technological expertise are recognized in income<br />
according to the contractually agreed transfer of the rights<br />
and obligations associated with those technologies.<br />
Borrowing costs: If the construction phase of property,<br />
plant and equipment extends beyond a period of one<br />
year, the interest incurred on borrowed capital that is<br />
directly attributable to that asset is capitalized as part of<br />
the cost of that asset. Borrowing costs are capitalized up<br />
to the date the asset is ready for its intended use. All other<br />
borrowing costs are recognized as an expense in the<br />
period in which they are incurred.<br />
investment subsidies: Government grants related to<br />
the acquisition or construction of property, plant and<br />
equipment reduce the acquisition or construction cost of<br />
the respective assets. Other government grants or government<br />
assistance are treated as deferred income and<br />
recognized as income over the underlying period or the<br />
expected useful life of the related asset.<br />
foreign currency transactions: The cost of assets<br />
acquired in foreign currencies and revenues from sales in<br />
foreign currencies are recorded at the exchange rate on<br />
the date of the transaction. Foreign currency receivables<br />
and liabilities are valued at the exchange rates on the<br />
balance sheet date. Foreign exchange gains or losses<br />
resulting from the conversion of assets and liabilities are<br />
reported as other operating expenses or other operating<br />
income.<br />
translation of foreign currency financial statements:<br />
The translation of foreign currency financial statements<br />
depends on the functional currencies of the consolidated<br />
companies. Translation into the reporting currency is based<br />
on the current rate method: balance sheet items are translated<br />
to euro at year-end rates, expenses and income are<br />
translated to euro at monthly average rates and accumulated<br />
for the year. The translation adjustments due to the<br />
use of the closing rate method are shown under currency<br />
translation adjustments as a component of other comprehensive<br />
income in equity and are recognized in income<br />
only upon the disposal of a company.
For certain companies outside the euro or U.S. dollar zone,<br />
the euro or U.S. dollar is the functional currency.<br />
acquired intangible assets – excluding goodwill and<br />
intangible assets with indefinite useful lives - are valued<br />
at cost less scheduled straight-line amortization. The useful<br />
life is determined based on the period of the underlying<br />
contract and the period of time over which the intangible<br />
asset is expected to be used. Impairment losses are<br />
recognized if the recoverable amount of the asset is permanently<br />
lower than the carrying amount. The recoverable<br />
amount is the higher of fair value less selling costs and<br />
value-in-use. Impairment losses are reversed if the reasons<br />
behind the impairment no longer exist.<br />
Depending on the type of intangible asset, the amortization<br />
expense is recorded as cost of sales, selling<br />
expense, research and development expense or other<br />
operating expense.<br />
intangible assets with indefinite useful lives: Intangible<br />
assets with indefinite useful lives are trade names<br />
and trademarks that have been acquired as part of the<br />
2006 acquisitions. They are tested for impairment annually.<br />
internally generated intangible assets are primarily<br />
comprised of internally developed software. Such software,<br />
as well as other internally generated assets for internal<br />
use, are valued at cost and amortized over their useful<br />
lives. Impairments are recorded if the carrying amount of<br />
an asset exceeds the recoverable amount.<br />
Development costs also include, in addition to those<br />
costs directly attributable to the development of the asset,<br />
an appropriate allocation of overhead cost. Borrowing<br />
costs directly related to the development of the assets are<br />
capitalized to the extent that they are material and related<br />
to the period over which the asset is generated.<br />
The average straight-line amortization period for intangible<br />
assets was 11 years in <strong>2008</strong> and 10 years in 2007<br />
based on the following expected useful lives.<br />
amortization periods in years<br />
Consolidated finanCial statements<br />
Notes<br />
Distribution, supply and similar rights 2–20<br />
Product rights, licenses and trademarks 2–30<br />
Know-how, patents and production technologies 3–25<br />
Internally generated intangible assets 3–5<br />
Other rights and values 2–20<br />
Goodwill is only written down if there is an impairment.<br />
Impairment testing takes place annually or if there is an<br />
indication of an impairment. The goodwill impairment test<br />
is based on cash-generating units and compares the<br />
recoverable amount of the unit with the respective carrying<br />
amount. At <strong>BASF</strong>, cash-generating units are predominantly<br />
the business units, in individual cases, the divisions. The<br />
recoverable amount is the higher of net sales price and the<br />
value-in-use. Value-in-use is generally determined using<br />
the discounted cash flow method.<br />
If the impairment loss exceeds the carrying amount of<br />
goodwill, the goodwill is written off completely. Any impairment<br />
loss left over is allocated to the remaining assets of<br />
the cash-generating unit. Goodwill impairment losses are<br />
reported under other operating expenses.<br />
The goodwill of the <strong>BASF</strong> Group is primarily attributable<br />
to the Catalysts and Construction Chemicals divisions<br />
in the Functional Solutions segment and the Crop Protection<br />
division in the Agricultural Solutions segment.<br />
In <strong>2008</strong>, goodwill of €1,383 million relates to the Crop<br />
Protection division (2007: €1,304 million), €1,246 million<br />
relates to the Catalysts division (2007: €1,269 million),<br />
€620 million relates to the Construction Chemicals division<br />
(2007: €612 million) and €381 million relates to the Oil &<br />
Gas segment (2007: €64 million). Changes arose in <strong>2008</strong> in<br />
particular from foreign currency translation effects and the<br />
acquisition of Sorex Holdings Ltd. by the Crop Protection<br />
division and Revus SAS by the Oil & Gas segment.<br />
Basf RePoRt <strong>2008</strong><br />
161
162<br />
Consolidated finanCial statements<br />
Notes<br />
emission rights: Emission right certificates granted freeof-charge<br />
by the German Emissions Trading Authority<br />
(‘Deutsche Emissionshandelsstelle’) or a similar authority in<br />
other European countries, are recognized on the balance<br />
sheet date at their fair value at the time they are credited to<br />
the electronic register run by the relevant government<br />
authority. Purchased emission rights are recorded at cost.<br />
The measurement at the balance sheet date occurs at fair<br />
value. If the fair value at the balance sheet date is lower<br />
than the carrying amount, the emission rights are written<br />
down.<br />
Property, plant and equipment are stated at acquisition<br />
or production cost less scheduled depreciation over<br />
their estimated useful lives. Low-value assets are fully<br />
written off in the year of acquisition and are shown as<br />
disposals. The revaluation method is not used.<br />
The cost of self-constructed plants includes direct<br />
costs, appropriate allocations of material and manufacturing<br />
costs, and an appropriate share of the administrative<br />
costs for those areas involved in the construction of the<br />
plants. Borrowing costs that are incurred during the period<br />
of construction are capitalized. For companies in Germany,<br />
borrowing costs were capitalized at 4.5% whereas<br />
country-specific rates were used for Group companies<br />
outside Germany.<br />
Expected costs related to scheduled maintenance<br />
turnarounds of large-scale plants are capitalized as part of<br />
the asset and depreciated using the straight-line method<br />
over the period to the next planned turnaround.<br />
Both movable and immovable fixed assets are depreciated<br />
using the straight-line method. The weighted-average<br />
depreciation periods used were as follows:<br />
average depreciation in years<br />
Buildings and structural<br />
installations<br />
Basf RePoRt <strong>2008</strong><br />
<strong>2008</strong> 2007<br />
Machinery and technical equipment 11 11<br />
Factory, office equipment and other<br />
facilities<br />
24<br />
7<br />
23<br />
8<br />
Impairment losses are recorded whenever events or changes<br />
in circumstances indicate that the carrying amount of an<br />
asset may not be recoverable. The evaluation is based on<br />
the present value of the expected future cash flows less<br />
expected costs for the disposal of the asset. An impairment<br />
loss is recorded for the difference between the carrying<br />
amount and the value of discounted future cash flows.<br />
Investment properties held to realize capital gains or<br />
rental income are immaterial. They are valued at the lower<br />
of acquisition cost less scheduled depreciation and fair<br />
value.<br />
oil and gas exploration: Exploration and production<br />
costs are accounted for using the successful efforts<br />
method. Under this method, costs of successful exploratory<br />
drilling as well as successful and dry development<br />
wells are capitalized as property, plant and equipment.<br />
An exploration well is a well located outside of an area<br />
with proven oil and gas deposits. A development well is<br />
a well which is sunk to the depth of a deposit of oil or gas<br />
within an area with proved reserves.<br />
Production costs include all costs incurred to operate,<br />
repair and maintain the well and the associated plant. The<br />
costs for the operation, repair and maintenance as well as<br />
depreciation of ancillary production equipment are also<br />
included.<br />
Exploration expenses relate exclusively to the Oil & Gas<br />
segment. These expenses include all costs connected with<br />
non-proven oil and gas deposits. Included here are costs for<br />
the exploration of areas with possible oil or gas reserves.<br />
Costs for geological and geophysical investigations are, as<br />
a matter of principle, reported under exploration expenses.<br />
In addition, this item includes depreciation on exploration<br />
wells which have no proven reserves. Scheduled depreciation<br />
on successful exploration wells is part of cost of sales.<br />
Exploratory drilling is reported under construction in<br />
progress until its success can be determined. When the<br />
presence of hydrocarbons is proved such that the economic<br />
development of the field is probable, the costs<br />
remain capitalized as suspended well costs. Once a year,<br />
all suspended wells are assessed from an economic,<br />
technical and strategic viewpoint to see if development is<br />
still intended. If this is not the case, the well concerned is<br />
written off. When reserves are proven and the development<br />
of the field begins, the exploration wells are reclassified as<br />
machinery and technical equipment.
An Exploration and Production Sharing Agreement (EPSA)<br />
is a type of contract in crude oil and gas concessions<br />
whereby the expenses and profits from the exploration,<br />
development and production phases are divided between<br />
the state (National Oil Company) and one or more exploration<br />
and production companies using defined keys. The<br />
revenue <strong>BASF</strong> is entitled to under such contracts is<br />
reported as sales. The existing Libyan concessions are<br />
currently being renegotiated. They shall be replaced with<br />
Exploration and Production Sharing Agreements according<br />
to the EPSA-IV standard.<br />
Provisions for required recultivations associated with oil<br />
and gas operations primarily concern the filling of wells<br />
and the removal of production facilities upon the termination<br />
of production. Initial measurement is conducted when<br />
the obligation arises at the present value of the future<br />
recultivation costs. Interest on the provision is accrued<br />
annually until the time of the planned recultivation. An<br />
asset of the same value is capitalized as part of the carrying<br />
amount of the plant concerned and together they are<br />
depreciated.<br />
The unit of production method is used to depreciate<br />
assets from oil and gas exploration at the field or deposit<br />
level. As a matter of principal, depreciation is calculated on<br />
the basis of proven, developed reserves.<br />
In the natural gas trading business, long-distance<br />
natural gas pipelines are depreciated using the straight-line<br />
method. The weighted-average depreciation period<br />
amounted to 24 years in <strong>2008</strong> (2007: 24 years). The intangible<br />
asset from the marketing contract for natural gas<br />
from the Yuzhno Russkoye natural gas field is amortized<br />
based on <strong>BASF</strong>‘s share of the produced and distributed<br />
volumes.<br />
leases: According to IAS 17, leasing contracts are<br />
classified as either finance or operating leases. Assets<br />
which are subject to operating leases are not capitalized.<br />
Lease payments are charged to income in the year they<br />
are incurred.<br />
A lease is classified as a finance lease if it transfers substantially<br />
all of the risks and rewards related to the leased<br />
asset. Assets subject to a finance lease are recorded at the<br />
present value of the minimum lease payments. A leasing<br />
liability is recorded in the same amount. The periodic lease<br />
payments are divided into principal and interest components.<br />
The principal component reduces the outstanding<br />
liability, while the interest component represents an interest<br />
expense. Depreciation takes place over the shorter of the<br />
useful life of the asset or the period of the lease.<br />
Consolidated finanCial statements<br />
Notes<br />
Leases can be embedded within other contracts. If IFRS<br />
requires separation, then the embedded lease is recorded<br />
separately from its host contract and each component of<br />
the contract is carried and valued in accordance with the<br />
applicable regulations.<br />
investments in companies accounted for using the<br />
equity method: These investments are accounted for<br />
under the same principles as for consolidated subsidiaries.<br />
The carrying amounts of these companies are adjusted<br />
annually based on the pro rata share of income, dividends<br />
and other changes in stockholders’ equity. Should there be<br />
indications of a permanent reduction in the value of an<br />
investment, then an impairment expense is recognized<br />
through profit or loss.<br />
financial instruments: Financial assets and financial<br />
liabilities are recorded on the balance sheet when the<br />
<strong>BASF</strong> Group becomes a party to a financial instrument.<br />
Financial assets are derecognized when the contractual<br />
rights to the cash flows from the financial asset expire or<br />
when the financial asset, with all risks and rewards of<br />
ownership, is transferred. Financial liabilities are derecognized<br />
when the contractual obligation expires or is<br />
discharged or cancelled. Standard purchases and sales of<br />
financial instruments are accounted for using the settlement<br />
date and in precious metals trading using the day of<br />
trading.<br />
The fair value is the amount for which an instrument<br />
could be exchanged in an arm’s length transaction<br />
between knowledgeable, willing parties. When pricing on<br />
an active market is available, for example on a stock<br />
exchange, this price is used. In other cases, a valuation is<br />
based on internal valuation models using current market<br />
parameters or external valuations from banks. These internal<br />
valuations predominantly use net present value and<br />
option pricing models.<br />
Basf RePoRt <strong>2008</strong><br />
163
164<br />
Consolidated finanCial statements<br />
Notes<br />
If there is objective evidence of a permanent impairment of<br />
an available-for-sale financial instrument, an impairment<br />
charge is taken.<br />
If the reason for the impairment of loans and receivables<br />
as well as held-to-maturity financial instruments no<br />
longer exists, the amortization is reversed up to the amortized<br />
cost and recognized as income. Impairment losses<br />
on financial instruments are booked separately in an<br />
allowance account.<br />
Financial assets and liabilities are divided into the<br />
following valuation categories:<br />
• financial assets and liabilities that are measured at<br />
fair value and recognized through profit or loss consist<br />
of derivatives and other trading instruments. <strong>BASF</strong><br />
utilized this valuation category only for derivative instruments<br />
and does not make use of the fair value option<br />
under IAS 39. Derivatives are reported in other shortterm<br />
assets or other short-term liabilities.<br />
• loans and receivables comprise financial assets with<br />
fixed or determinable payments, which are not quoted on<br />
an active market and are not derivatives or classified as<br />
available-for-sale. Included in this category are trade<br />
accounts receivable, loans classified under other financial<br />
assets as well as other receivables and loans classified<br />
under other receivables and miscellaneous assets. Initial<br />
valuation is done at fair value, which generally matches<br />
the nominal value of the receivable or loan. Interest-free<br />
and low-interest long-term loans and receivables are<br />
recorded at present value. Subsequent valuations are<br />
generally done at amortized cost, under consideration<br />
of the effective interest method. If there is objective evidence<br />
for an impairment of a receivable or loan, an individual<br />
valuation adjustment is done. In addition, an impairment<br />
loss occurs when the contractual conditions which<br />
form the basis for the receivable or loan need to be changed<br />
through renegotiation in such a way that the present<br />
value of the future cash flows decreases. Receivables and<br />
loans are written off when their un collectibility is finally<br />
determined. Receivables for which no objective indication<br />
for an impairment exists may be impaired, if necessary,<br />
based on expected default rates. The company applies<br />
historic default rates. In addition, valuation adjustments<br />
on receivables for transfer risks in certain countries are<br />
established.<br />
Basf RePoRt <strong>2008</strong><br />
• Held-to-maturity financial assets consist of non-derivative<br />
financial assets with fixed or determinable<br />
payments and a fixed term, for which there is the ability<br />
and intent to hold until maturity, and which do not fall<br />
under other valuation categories. Initial valuation is made<br />
at fair value, which, in most cases, matches the nominal<br />
value. Subsequent valuations are done at amortized cost<br />
under consideration of the effective interest method. For<br />
<strong>BASF</strong>, there are no material financial assets that fall<br />
under this category.<br />
• available-for-sale financial assets comprise financial<br />
assets which are not derivatives and do not fall under<br />
any of the previously stated valuation categories. This<br />
valuation category comprises participations not accounted<br />
for using the equity method under the item ‘other<br />
financial assets’; ‘long-term securities’; and securities<br />
contained under the item ‘marketable securities’. Initial<br />
valuation is done at fair value. Changes in the fair value<br />
are booked to equity under the item other comprehensive<br />
income and are only recorded in the income statement<br />
when the assets are disposed of or have been<br />
impaired. Participations whose fair value cannot be<br />
reliably determined are carried at historical cost and are<br />
written down in the case of an impairment in value. For<br />
these participations, the book values represent the best<br />
estimates of value. In the case of available-for-sale securities,<br />
write-ups principally are not recognized in the<br />
income statement, but are taken directly to equity (other<br />
comprehensive income). Write-ups to the amount of the<br />
original write-down are recognized in income in the case<br />
of debt instruments; write-ups above this amount are<br />
recognized in equity.<br />
• financial liabilities which are not derivatives are initially<br />
valued at fair value. This normally corresponds to the<br />
amount received. Subsequent valuation is generally done<br />
at amortized cost, under consideration of the effective<br />
interest method.<br />
There were no reclassifications between the valuation<br />
categories in 2007 and <strong>2008</strong>. The option to reclassify<br />
certain assets given under the amendment to IAS 39 on<br />
October 15, <strong>2008</strong>, was not used.
Revenue from interest-bearing assets is recognized on the<br />
outstanding receivables at reporting date using the interest<br />
rates calculated under the effective interest method. Dividends<br />
from participations not accounted for under the<br />
equity method are recognized when the shareholders’ right<br />
to receive payment is established.<br />
Derivative financial instruments can be embedded<br />
within other contracts. If IFRS requires separation, then the<br />
embedded derivative is recorded separately from its host<br />
contract and shown at fair value.<br />
Cash flow Hedge accounting has been employed for<br />
selected deals to hedge future transactions. The effective<br />
portion of the change in fair value is thereby recognized<br />
directly in equity under other comprehensive income,<br />
taking deferred taxes into account. The ineffective portion<br />
is recognized immediately in income. In the case of future<br />
transactions that will lead to a non-financial asset or a nonfinancial<br />
debt, the cumulative fair value changes in equity<br />
are either charged against the acquisition cost on initial<br />
recognition or recognized in profit or loss in the reporting<br />
period in which the hedged item is recorded in the income<br />
statement. For hedges based on financial assets or debts,<br />
the cumulative fair value changes of the hedges are transferred<br />
from stockholders’ equity to the income statement<br />
in the reporting period in which the hedged item is recognized<br />
in the income statement. The maturity of the hedging<br />
instrument is based upon the effective date of the future<br />
transaction.<br />
The derivatives employed by <strong>BASF</strong> for hedging purposes<br />
are effective hedges from an economic point of<br />
view. Changes in the fair value of the derivatives almost<br />
completely offset the change in the value of the underlying<br />
contracts.<br />
deferred tax assets: Deferred tax assets are recorded<br />
for temporary differences between the carrying amount of<br />
assets and liabilities in the financial statements and the<br />
carrying amounts for tax purposes. In addition, deferred<br />
taxes are recorded for tax loss carryforwards to the extent<br />
that it is probable that future taxable profit for the relevant<br />
tax authority will be available against which the tax loss<br />
carryforwards can be utilized. For companies located in<br />
Germany, a 29% tax rate is applied; for other companies,<br />
the tax rates applicable in the individual countries are used.<br />
Appropriate valuation allowances are made if expected<br />
future earnings of a company make it seem more likely than<br />
not that the tax benefits will not be realized.<br />
Consolidated finanCial statements<br />
Notes<br />
The valuation of deferred tax assets depends on the<br />
estimation of the probability of a reversal of the valuation<br />
differences and the utilization of the tax loss carryforwards.<br />
A deferred tax asset is recognized for future tax benefits<br />
arising from temporary differences and for tax loss carryforwards<br />
to the extent that the tax benefits are likely to be<br />
realized. Based on experience and the expected development<br />
of taxable income, it is assumed that the benefit of<br />
deferred tax assets recognized will be realized.<br />
inventories: Inventories are carried at acquisition costs<br />
or production costs. If the listed, market, or fair value of<br />
the sales product which forms the basis for the net<br />
realizable value is lower, then this is applied. The net<br />
realizable value is based on the estimated selling price in<br />
the ordinary course of business less the estimated costs of<br />
completion and costs necessary to make the sale.<br />
Cost of sales include, in addition to direct costs, an<br />
appropriate allocation of production overhead costs based<br />
on normal utilization rates of the production plants. In<br />
addition, pensions, social services and voluntary social<br />
benefits are included as well as allocations for administrative<br />
costs, provided they relate to the production process.<br />
Financing costs are not included in production costs.<br />
Deductions on inventories result from price declines in<br />
sales products, lack of salability and high level of inventory<br />
on hand.<br />
IAS 2 “Inventories” does not apply to commodity<br />
broker-traders. Accordingly, precious metals held for<br />
trading purposes are measured at fair value. Changes in<br />
fair value are recognized in income.<br />
assets and liabilities of disposal groups: These comprise<br />
those assets and directly associated liabilities shown<br />
on the balance sheet whose sale in the context of a single<br />
transaction is highly probable. The assets and liabilities<br />
of disposal groups are recognized at the lower of the sum<br />
of their carrying amounts or fair value less costs to sell.<br />
Scheduled depreciation of long-term assets is suspended.<br />
Should a disposal group cease to be classified as such,<br />
then the depreciation and amortization for the period of<br />
suspension must be taken.<br />
further information on disposal groups is found in note 2 from page<br />
170 onward<br />
Basf RePoRt <strong>2008</strong><br />
165
166<br />
Consolidated finanCial statements<br />
Notes<br />
Provisions for pensions and similar obligations: Provisions<br />
for pensions are based on actuarial computations<br />
made according to the projected unit credit method.<br />
Similar obligations, especially those arising from commitments<br />
in North America to pay the healthcare costs and<br />
life insurance premiums of retired staff and their dependents,<br />
are included in pension provisions. Actuarial profits<br />
and losses are offset against retained earnings. The calculation<br />
of pension provisions is based on actuarial reports.<br />
other provisions: Other provisions are accrued when<br />
there is a present obligation as a result of a past event and<br />
when there is a probable outflow of resources whose<br />
amount can be reliably estimated. Provisions are made at<br />
the probable settlement value.<br />
Provisions for German trade income tax, German<br />
corporate income tax and similar income taxes are made<br />
in the amount necessary to meet the expected payment<br />
obligations, less any prepayments that have been made.<br />
Other taxes assessed are appropriately considered.<br />
Provisions are established for certain environmental<br />
protection measures and risks if the measures are considered<br />
likely as a result of legal or regulatory obligations<br />
or other events and these measures have not to be capitalized.<br />
Provisions for required recultivations primarily concern<br />
the filling of wells and the removal of production facilities<br />
upon the termination of production in the Oil & Gas<br />
segment. The present value of the obligation increases the<br />
cost of the respective asset when it is initially recognized.<br />
Provisions are made for expected severance payments<br />
or similar personnel expenses as well as for demolition<br />
expenses and other charges related to the closing down<br />
of operations that have been planned and publicly announced<br />
by management.<br />
Provisions for long service and anniversary bonuses<br />
are predominantly calculated based on actuarial principles.<br />
For contracts signed under the early retirement programs,<br />
provisions for the supplemental payments are provided in<br />
their full amount and the wage and salary payments due<br />
during the passive phase of agreements are accrued in<br />
installments. Provisions are recorded for the expected<br />
costs that are anticipated to be contracted during the term<br />
of the collective bargaining agreements.<br />
information on provisions for the Basf options program in note 25 from<br />
page 210 onward<br />
Basf RePoRt <strong>2008</strong><br />
The probable amount required to settle long-term obligations<br />
is discounted if the effect of discounting is material.<br />
In this case, valuation of the provision is done at present<br />
value. Related financing costs are shown in other financial<br />
results.<br />
deferred tax liabilities: Deferred tax liabilities are<br />
recorded for temporary differences between the carrying<br />
amount of assets and liabilities in the financial statements<br />
and the carrying amounts for tax purposes to the extent<br />
that there is a surplus of taxable temporary differences<br />
relating to a fiscal unit.<br />
Deferred tax liabilities resulted, in particular, from the<br />
revaluation of assets at fair value as part of the purchase<br />
price allocation of recent years.<br />
earnings per share: The calculation of earnings per<br />
share is based on the average number of common shares<br />
outstanding during the applicable period and the net<br />
income. Own shares are included in the calculation for the<br />
period of time that they were outstanding.<br />
use of estimates in the preparation of the Consolidated<br />
financial statements:<br />
The carrying amount of assets, liabilities and provisions,<br />
contingent liabilities and other financial obligations in the<br />
Consolidated Financial Statements depends on the use of<br />
estimates and assumptions. They are based on the<br />
circumstances and estimates at the balance sheet date<br />
and affect the reported amounts of income and expenses<br />
during the reporting periods. These assumptions affect the<br />
selection of useful lives of property, plant and equipment<br />
and intangible assets, the measurement of provisions, the<br />
carrying amount of investments, and other similar valuations<br />
of assets and obligations. Given the uncertainty<br />
regarding the determination of these factors, actual results<br />
could differ from these estimates.<br />
In business combinations, the acquired assets and<br />
liabilities are recognized at fair value on the date the<br />
acquirer effectively obtains control. The determination of<br />
fair value of the acquired intangible assets, property, plant<br />
and equipment and liabilities assumed at the date of<br />
exchange as well as the useful lives of the acquired intangible<br />
assets and property, plant and equipment is based<br />
on assumptions. The measurement is largely based on<br />
projected cash flows. The actual cash flows can differ<br />
significantly from the cash flows used to determine the fair<br />
values. The purchase price allocation of material acquisitions<br />
is based on external, independent expert reports. The<br />
measurement of business combinations is based on the<br />
information available on the acquisition date.
impairment tests on assets are required whenever events<br />
or changes in circumstances indicate that an assessment<br />
is necessary. Impairment tests are based on a comparison<br />
of the carrying amount and the recoverable amount. The<br />
recoverable amount is the higher of net realizable value<br />
and value-in-use. The determination of value-in-use<br />
requires the estimation and discounting of cash flows. The<br />
estimation of cash flows and assumptions used consider<br />
all information available on the respective balance sheet<br />
date on the future development of the operating business<br />
and may deviate from actual future developments. An<br />
impairment charge is taken for the difference between the<br />
recoverable amount and the carrying amount.<br />
Goodwill has to be allocated to cash-generating units<br />
and tested for impairment once a year. Impairment losses<br />
are recorded when the carrying amount of the cash-generating<br />
unit exceeds the recoverable value. Impairment<br />
testing relies upon long-term earnings predictions based<br />
on economic trends. The estimated cash flows are generally<br />
based on the current business plans for the next three<br />
years and on the expertise of the respective business unit<br />
management and take appropriate account of the relevant<br />
specific risks. For cash flow projections beyond the<br />
detailed planning period, growth rates ranging from 0% to<br />
3% were assumed depending on the individual business<br />
and cash-generating unit. The discount rates used depend<br />
on the underlying business and the country in which the<br />
business operates and correspond to after-tax rates<br />
ranging from 6.7% to 14.5%.<br />
intangible assets and property, plant and equipment:<br />
The estimated useful life and method chosen are<br />
based on historical values, plans and estimates. Estimates<br />
are made on the period and distribution of future cash<br />
inflows.<br />
Impairment charges are taken when circumstances<br />
lead to a permanent impairment. These circumstances<br />
could include lower profitability of the products concerned,<br />
the consequence of restructuring measures or poor economic<br />
conditions. Should the reasons for the impairment no<br />
longer be valid, then reversals are taken up to, but not<br />
exceeding, the value of the amortized cost.<br />
Intangible assets with indefinite useful lives are subject<br />
to an annual impairment test. An impairment test is<br />
conducted if certain triggering events indicate an impairment.<br />
This could include changes in customer industries,<br />
in technologies and in the business environment.<br />
Consolidated finanCial statements<br />
Notes<br />
deferred tax assets/liabilities: The realization of deferred<br />
tax assets depends on the future taxable profits of the<br />
respective group companies. Allowances are recorded<br />
when it is uncertain if future earnings will be sufficient to<br />
take advantage of the tax loss carryforwards. The continued<br />
valuation of deferred tax assets is based on internal<br />
projections, among other things based on the future<br />
earnings of the Group company.<br />
more information can be found in note 8 from page 183 onward<br />
Receivables and loans are valued at their amortized<br />
costs using the effective interest method. Impairments on<br />
receivables and loans are recognized in income. Such<br />
evidence for an impairment could, for example, be when<br />
the financial difficulties of a debtor become known or<br />
payment delays occur. When assessing the need for an<br />
impairment, regional and sector specific conditions are<br />
considered. In addition, use is made of external ratings as<br />
well as the assessments of debt collection agencies and<br />
credit insurers when available. A significant proportion of<br />
receivables is covered by credit insurance. Bank guarantees<br />
and letters of credit are used to a limited extent. Only<br />
those receivables which are not covered by insurance or<br />
other collateral are impaired. Receivables whose insurance<br />
includes a deductible are impaired to the value of the<br />
deductible. Impairments are based on historical values on<br />
customer solvency and the age, period overdue, insurance<br />
policies and customer-specific risks. If, in a subsequent<br />
period, the amount of the impairment loss decreases and<br />
the decrease can be related objectively to an event occurring<br />
after the impairment was recognized, the previously<br />
recognized impairment loss is be reversed through<br />
profit or loss. The write-up may not exceed the amortized<br />
cost.<br />
Basf RePoRt <strong>2008</strong><br />
167
168<br />
Consolidated finanCial statements<br />
Notes<br />
Pension provisions and defined benefit assets are<br />
measured using actuarial methods, applying among others<br />
the following valuation parameters: future developments in<br />
compensation and pensions, the expected performance of<br />
plan assets, employee turnover and the life expectancy of<br />
beneficiaries. The resulting obligations are discounted by<br />
reference to market yields at the balance sheet date on<br />
high quality corporate fixed-rate bonds with a AA rating.<br />
Actuarial gains and losses are recognized directly in<br />
retained earnings. They result from the variance between<br />
the actual development in pension obligations and pension<br />
assets and the assumptions made at the beginning of the<br />
year as well as the updating of actuarial assumptions.<br />
more information on provisions for pensions and similar obligations can be<br />
found in note 20 from page 200 onward<br />
other provisions also cover risks resulting from legal<br />
disputes and proceedings. In order to determine the<br />
amount of the provisions, the facts related to each case,<br />
the size of the claim, claims awarded in similar cases and<br />
independent expert advice are considered along with<br />
assumptions regarding the probability of a successful<br />
claim and the range of possible claims. The actual costs<br />
can deviate from these estimates.<br />
more information can be found in note 24 on page 209<br />
Other provisions also include expected charges for the<br />
rehabilitation of contaminated sites, the recultivation of<br />
landfills, the removal of environmental contamination at<br />
existing production or storage facilities and other similar<br />
measures. If <strong>BASF</strong> is the only responsible party that can be<br />
identified, the provision covers the entire expected claim.<br />
At sites operated together by one or more parties, the<br />
provision covers only <strong>BASF</strong>’s share of the expected claim.<br />
The determination of the amount of the provision is based<br />
on the available technical information on the site, the technology<br />
used, legal regulations and processes used as well<br />
as current regulations and official obligations.<br />
The estimation of future costs is subject to many<br />
uncertainties. This refers in particular to rehabilitation measures<br />
that involve several parties and longer time periods.<br />
Assumptions have to be made in determining the<br />
discount rate to be used in calculating long-term<br />
provisions.<br />
Basf RePoRt <strong>2008</strong><br />
ifRss and ifRiCs which do not yet have to be<br />
considered in the preparation of these statements<br />
The effects of IFRSs and IFRICs not yet in force or not yet<br />
endorsed by the European Union in the reporting year<br />
<strong>2008</strong> were reviewed:<br />
• ifRs 8 “operating segments”, which follows the<br />
Management Approach, replaces IAS 14 which follows<br />
the Risk-and-Reward Approach. This leads to segmentation<br />
based on the internal reporting structure and associated<br />
with this the disclosure of management information<br />
used for evaluating segment performance and deciding<br />
how to allocate resources to operating segments. IFRS 8<br />
shall be applied to financial years beginning on or after<br />
January 1, 2009. Earlier application is permitted. As<br />
<strong>BASF</strong> already uses the same performance indicators for<br />
external reporting as for internal management reporting,<br />
IFRS 8 will not have any effect on the Consolidated<br />
Financial Statements of the <strong>BASF</strong> Group.<br />
• ias 1 “Presentation of financial statements” was<br />
amended by the IASB as of September 6, 2007. The goal<br />
is to ease the analysis and comparison of financial statements.<br />
Additional information on stockholders’ equity<br />
must be presented, for example on the determination,<br />
planning and control of the capital structure, and on any<br />
supervisory requirements regarding the equity level. The<br />
amended version of IAS 1 applies to all financial years<br />
beginning on or after January 1, 2009, and has no noteworthy<br />
impact on <strong>BASF</strong>.<br />
• The IASB published an amended version of ias 23<br />
“Borrowing Costs” on March 29, 2007. It is mandatory<br />
to capitalize borrowing costs directly associated with<br />
the purchase, construction or production of a qualifying<br />
asset. The standard applies to all borrowing costs eligible<br />
for capitalization on or after January 1, 2009. <strong>BASF</strong><br />
took the option to capitalize such costs, hence there will<br />
be no impact on the <strong>BASF</strong> Group Consolidated Financial<br />
Statements.<br />
• ifRiC 12 “service Concession arrangements”<br />
regulates the accounting for service concession arrangements<br />
between private sector companies and government<br />
or other public sector entities to provide public<br />
services. IFRIC 12 will not have an effect on <strong>BASF</strong>.
• The amended versions of ifRs 3 “Business Combinations”<br />
and ias 27 “Consolidated and separate<br />
financial statements” allow the option of measuring<br />
minority interests at fair value or based on their identifiable<br />
net assets. In addition, changes in the ownership<br />
percentage without loss of control are recognized directly<br />
in equity. Changes in the ownership percentage with loss<br />
of control are recognized in profit and loss. Incidental<br />
acquisi tion costs are to be expensed in the future. The<br />
changes affect business combinations whose acquisition<br />
date falls in a reporting period beginning on or after of<br />
July 1, 2009. <strong>BASF</strong> will apply the changes as soon as<br />
they come into force, or are endorsed by the European<br />
Union.<br />
• ifRiC 15 “agreements for the Construction of Real<br />
estate” governs the recognition of revenue and the<br />
corresponding expense on the construction of real<br />
estate. IFRIC 15 will not have an effect on <strong>BASF</strong>.<br />
• ifRiC 16 “Hedges of a net investment in a foreign<br />
operation“ clarifies which exchange differences resulting<br />
from the difference between the functional currency<br />
of the group and the functional currency of the foreign<br />
operation can be designated as a hedged risk. IFRIC 16<br />
will not have an effect on <strong>BASF</strong>.<br />
• ifRiC 17 “distributions of non-cash assets to<br />
owners“ clarifies that the valuation difference between<br />
the book value of the asset and the fair value should be<br />
recognized in profit or loss, except for common control<br />
transactions. It shall be applied to financial years beginning<br />
on or after July 1, 2009. IFRIC 17 will not have an<br />
effect on <strong>BASF</strong>.<br />
• ifRiC 18 “transfers of assets from Customers“<br />
governs agreements in which an entity receives from a<br />
customer an asset that the entity must then use either to<br />
connect the customer to a network or to provide the<br />
customer with ongoing access to a supply of goods or<br />
services. The interpretation was published by the IASB<br />
on January 29, 2009, and shall be applied to agreements<br />
concluded on or after July 1, 2009. The impact on <strong>BASF</strong><br />
is currently being investigated.<br />
Consolidated finanCial statements<br />
Notes<br />
• The amendments to ias 1 and ias 32 “Puttable<br />
financial instruments and obligations arising on<br />
liquidation” clarify that under certain conditions<br />
puttable financial instruments and financial instruments<br />
with an enforceable claim on proportionate net assets<br />
should be classified as equity and not as liabilities. The<br />
amendments will have no impact on the <strong>BASF</strong> Group<br />
Consolidated Financial Statements.<br />
• Other amendments of the standards will have no material<br />
impact on <strong>BASF</strong>.<br />
Basf RePoRt <strong>2008</strong><br />
169
170<br />
Consolidated finanCial statements<br />
Notes<br />
2 -- aCquisitions/divestituRes<br />
In <strong>2008</strong>, <strong>BASF</strong> acquired Revus Energy ASA, Stavanger,<br />
Norway (Revus), an oil and gas exploration and production<br />
company listed on the Oslo Stock Exchange with stakes in<br />
60 licenses in Norway and Great Britain. On December 17,<br />
<strong>2008</strong>, <strong>BASF</strong> took over control of Revus on the transfer of<br />
the tendered shares to a wholly owned subsidiary of<br />
Wintershall Holding AG, Wintershall Norwegen Explorations-<br />
und Produktions-GmbH. The shares in Revus were<br />
acquired as part of a public tender offer. The remaining<br />
shares which were not tendered were acquired on<br />
Preliminary purchase price allocation of the acquisition of Revus energy asa in <strong>2008</strong> (million €)<br />
Basf RePoRt <strong>2008</strong><br />
December 18, <strong>2008</strong>, as part of the squeeze out resulting in<br />
<strong>BASF</strong> taking ownership of all shares in Revus. The minority<br />
shareholders are entitled to a compensation payment of<br />
€12 million. This amount has been accrued. The total<br />
purchase price is €558 million. Since December 22, <strong>2008</strong>,<br />
Revus Energy ASA has been trading as Wintershall Norge<br />
ASA. The following provides an overview of the preliminary<br />
carrying amounts and fair values of the acquired assets<br />
and liabilities on December 17, <strong>2008</strong>.<br />
Historical book<br />
value<br />
Adjustment to fair<br />
value<br />
Fair values at the<br />
date of acquisition<br />
long-term assets 296 420 716<br />
Property, plant and equipment 231 119 350<br />
Goodwill – – –<br />
Other intangible assets 2 301 303<br />
Other long-term assets 63 – 63<br />
short-term assets 106 – 106<br />
Inventories 2 – 2<br />
Other short-term assets 104 – 104<br />
total assets 402 420 822<br />
long-term liabilities 193 284 477<br />
Provision for pensions and similar obligations – . .<br />
Deferred tax liabilities 102 285 387<br />
Financial indebtedness 30 (1) 29<br />
Other liabilities 61 – 61<br />
short-term liabilities 104 – 104<br />
total liabilities 297 284 581<br />
net assets 105 136 241<br />
Goodwill 317<br />
total purchase price 558<br />
Thereof incidental acquisition costs .
In addition, <strong>BASF</strong> acquired the following businesses in<br />
<strong>2008</strong>:<br />
• <strong>BASF</strong> acquired Attapulgite Mining, Inc., Attapulgus,<br />
Georgia on September 26, <strong>2008</strong>. The acquired business<br />
provides access to attapulgite ore. Attapulgite is a<br />
magnesium aluminium phyllosilicate used mainly as a<br />
thickener in coatings.<br />
• <strong>BASF</strong> acquired the concrete admixture business of Kejie<br />
Admixture Science & Technology Co. Ltd. (Kejie), on<br />
December 15, <strong>2008</strong>. Kejie is one of the leading producers<br />
of concrete admixtures in Guangzhou, the capital of<br />
the Guangdong province in South China, and has a wide<br />
range of concrete admixtures and intermediate products.<br />
• <strong>BASF</strong> concluded the acquisition of Sorex Holdings Ltd.,<br />
Widnes, Great Britain on December 19, <strong>2008</strong>. Sorex is a<br />
leading manufacturer of branded chemical and non-chemical<br />
products for professional pest management. The<br />
transaction includes U.S.-based Whitmire Micro-Gen and<br />
U.K.-based Sorex Ltd. It will increase <strong>BASF</strong>’s presence in<br />
the two most important pest control markets worldwide,<br />
the United States and Europe.<br />
• <strong>BASF</strong> concluded an agreement with Recticel to acquire<br />
the company’s worldwide compounds business for<br />
polyurethane (PU) systems for glass encapsulation on<br />
December 30, <strong>2008</strong>. This transaction includes Recticel’s<br />
patented aliphatic light stable compounds under the<br />
brand name Colofast ® .<br />
The purchase price allocations for the individual acquisitions<br />
are preliminary and may, according to IFRS, be<br />
adjusted when finalized within one year after the date of<br />
acquisition.<br />
If Revus Energy ASA had been included in <strong>BASF</strong> Group<br />
Consolidated Financial Statements as of January 1, <strong>2008</strong>,<br />
the proforma sales would have been €62,482 million and<br />
net income would have been €3,348 million. This unaudited<br />
proforma information are provided for purposes of<br />
comparison only and do not necessarily reflect the results<br />
had the transaction had taken place on January 1, <strong>2008</strong>.<br />
The results reported are not guarantees of future performance.<br />
The remaining acquisitions in <strong>2008</strong> have no material<br />
impact on the proforma sales and net income of the <strong>BASF</strong><br />
Group.<br />
Consolidated finanCial statements<br />
Notes<br />
The following shows an overview of the purchase price<br />
allocation of the remaining acquisitions in <strong>2008</strong>.<br />
other acquisitions (million €)<br />
<strong>2008</strong><br />
Purchase price 102<br />
Incidental acquisition costs .<br />
total purchase price 102<br />
Net assets at their carrying amounts (4)<br />
difference 106<br />
adjustment to fair value<br />
long-term assets 51<br />
Property, plant and equipment (9)<br />
Goodwill –<br />
Other intangible assets 60<br />
Other long-term assets –<br />
short-term assets 1<br />
Inventories 1<br />
Other short-term assets –<br />
total assets 52<br />
long-term liabilities –<br />
short-term liabilities (1)<br />
total liabilities (1)<br />
total adjustments to fair value 51<br />
deferred tax liabilities on adjustments (3)<br />
Remaining goodwill/ negative difference 58<br />
In 2007, Wintershall acquired a stake of 25% less one<br />
share in OAO Severneftegazprom (SNG), through an asset<br />
swap with Gazprom. SNG holds the production license to<br />
the Yuzhno Russkoye natural gas field in Western Siberia.<br />
By means of an additional preference share, Wintershall<br />
holds a 35% share in the economic rewards of this field. In<br />
return, Gazprom received a 49% interest in a German<br />
company that holds onshore exploration and production<br />
rights in Libya. In addition, Gazprom’s stake in our natural<br />
gas trading company, WINGAS GmbH & Co. KG, Kassel,<br />
was increased from 35% to 50% minus one share. Both<br />
the Libyan activities and WINGAS GmbH & Co. KG continue<br />
to be consolidated in the <strong>BASF</strong> Group Consolidated<br />
Financial Statements. A cash payment of €598 million was<br />
made by <strong>BASF</strong> to compensate for the assets swapped<br />
with Gazprom.<br />
Basf RePoRt <strong>2008</strong><br />
171
172<br />
Consolidated finanCial statements<br />
Notes<br />
Gazprom’s additional shares have led to an increase in<br />
minority interests of €216 million in the balance sheet. The<br />
measurement of the swapped assets at fair value of<br />
€850 million resulted in an excess of €634 million which<br />
was recognized in retained earnings. The assets received<br />
comprised a marketing contract for natural gas with a fair<br />
value of €1,762 million and shares in SNG with a fair value<br />
of €110 million. Measurement at fair value resulted in<br />
deferred tax liabilities of €424 million.<br />
effects of acquisitions in the year of acquisition<br />
Basf RePoRt <strong>2008</strong><br />
<strong>2008</strong> 2007<br />
million € % Million € %<br />
long-term assets 1,177 4.0 34 0.1<br />
Property, plant and equipment 363 2.4 17 0.1<br />
Goodwill 380 8.0 11 0.3<br />
Other intangible assets 365 7.1 6 0.1<br />
Other assets 69 4.3 – –<br />
short-term assets 138 0.6 7 .<br />
Thereof cash and cash equivalents 11 0.4 1 0.1<br />
total assets 1,315 2.6 42 0.1<br />
stockholders’ equity 5 . – –<br />
long-term liabilities 489 3.1 2 .<br />
Thereof financial indebtedness 29 0.4 – –<br />
short-term liabilities 173 1.1 1 .<br />
Thereof financial indebtedness 31 0.5 – –<br />
total stockholders’ equity and liabilities 667 1.3 3 .<br />
Payments related to acquisitions 648 38<br />
Conditional purchase price 12 –<br />
Purchase price 660 38<br />
Contingent liabilities and other financial<br />
obligations<br />
281<br />
In addition, <strong>BASF</strong> acquired the following companies for a<br />
total of €38 million in 2007:<br />
• Guilin REEcat Catalyst Co. , Ltd. was taken over by <strong>BASF</strong><br />
on April 20, 2007. The Chinese company, which has a<br />
production site for small engine and motorcycle catalysts<br />
in Guilin, China, has strengthened <strong>BASF</strong>’s catalysts<br />
activities.<br />
• In addition, <strong>BASF</strong> acquired the remaining 50% stake<br />
in Prodrive Engelhard LLC Wixom, Michigan on July 26,<br />
2007. The company provides services connected with<br />
the testing of catalysts.<br />
• On December 31, 2007, <strong>BASF</strong> acquired SABIC<br />
Innovative Plastics’ shares in the PBT-Joint Venture –<br />
<strong>BASF</strong> GE Schwarzheide GmbH & Co. KG –, Schwarzheide,<br />
Germany.<br />
The following overview shows the preliminary purchase<br />
price allocations of the acquisitions conducted in <strong>2008</strong>, as<br />
well as the impact of the final purchase price allocations<br />
conducted in 2007 on the consolidated balance sheet.<br />
3.2<br />
1<br />
.
In <strong>2008</strong>, <strong>BASF</strong> divested the following activities:<br />
• In the course of <strong>2008</strong>, <strong>BASF</strong> sold further parts of the<br />
premix business, including sites in Japan, Taiwan, Chile<br />
and Columbia. Premixes are a mixture of vitamins and<br />
feed additives for animal nutrition. The activities were<br />
allocated to the Care Chemicals division.<br />
• On April 30, <strong>2008</strong>, <strong>BASF</strong> sold the Shreveport, Louisiana,<br />
site and the related contract manufacturing business for<br />
pharmaceuticals to Dr. Reddy‘s Laboratories. The activities<br />
were allocated to the Care Chemicals division.<br />
• On August 17, <strong>2008</strong>, <strong>BASF</strong> completed the divestiture of<br />
Seal Sands site in the north of England to INEOS Nitriles.<br />
The Seal Sands site operates production facilities for the<br />
intermediates acrylonitrile (AN), adipodinitrile (ADN) and<br />
hexamethylenediamine (HMD), as well as for by-products.<br />
The site was allocated to the Performance Polymers<br />
division.<br />
effects of divestitures in the year of divestiture<br />
<strong>2008</strong> 2007<br />
Consolidated finanCial statements<br />
Notes<br />
million € % Million € %<br />
sales (274) (0.4) (146) (0.3)<br />
long-term assets (12) . (55) (0.2)<br />
Thereof Property, plant and equipment (11) (0.1) (43) (0.3)<br />
short-term assets (24) (0.1) (60) (0.3)<br />
Thereof cash and cash equivalents – – (3) (0.4)<br />
total assets (36) (0.1) (114) (0.2)<br />
stockholders’ equity 30 0.2 26 0.1<br />
long-term liabilities – – (5) .<br />
Thereof financial indebtedness – – – –<br />
short-term liabilities 7 . (33) (0.3)<br />
Thereof financial indebtedness – – (1) .<br />
total stockholders’ equity and liabilities 37 0.1 (13) (0.1)<br />
Proceeds from divestitures 73 102<br />
Contingent liabilities and other financial<br />
obligations<br />
–<br />
In 2007, <strong>BASF</strong> divested the following activities:<br />
• On June 26, 2007, <strong>BASF</strong> concluded the divestiture of<br />
Chemische Fabrik WIBARCO GmbH to Hansa Chemie<br />
International AG, Zollikon-Zurich, Switzerland. The<br />
company, headquartered in Ibbenbüren, North Rhine-<br />
Westphalia, was assigned to the Performance Chemicals<br />
division.<br />
• On July 1, 2007, <strong>BASF</strong> sold its stake in an ethane<br />
cracker in Geismar, Louisiana to Williams Olefins, LLC.<br />
The associated infrastructure was sold to PetroLogistics,<br />
LLC.<br />
• On October 31, 2007, <strong>BASF</strong> sold a major part of its<br />
premix business to Nutreco, an animal feed group headquartered<br />
in the Netherlands. The divested business had<br />
sites in eight countries.<br />
The following shows the effects of the divestitures in <strong>2008</strong><br />
and 2007 on the consolidated balance sheet. The effect on<br />
stockholders’ equity is reported as the difference<br />
between the purchase price payment and the disposed<br />
assets. Any expenditures for restructuring measures<br />
connected with divestitures are not included.<br />
–<br />
(1)<br />
Basf RePoRt <strong>2008</strong><br />
.<br />
173
174<br />
Consolidated finanCial statements<br />
Notes<br />
assets and liabilities of disposal groups<br />
As of December 31, 2007, parts of the Styrenics division<br />
were classified as a disposal group. These concerned<br />
<strong>BASF</strong>’s styrene monomer (SM), polystyrene (PS), styrene<br />
butadiene copolymer (SBC) and acrylonitrile butadiene<br />
styrene (ABS) businesses with plants in Antwerp, Belgium;<br />
Altamira, Mexico; Sao Jose dos Campos, Brazil; Ulsan,<br />
South Korea; and Dahej, India.<br />
In <strong>2008</strong>, the planned sale could not be carried out. Due<br />
to poor macroeconomic conditions and the changes on<br />
the capital market, divestiture in the near future is not highly<br />
probable. As of December 31, <strong>2008</strong>, the assets and<br />
liabilities of the disposal group were reported under<br />
continuing operations.<br />
In the fourth quarter of <strong>2008</strong>, €73 million in depreciation<br />
and amortization had to be recognized for <strong>2008</strong>, as the<br />
assets were no longer classified as a disposal group. In<br />
addition, impairment charges of €121 million were recognized<br />
in connection with the restructuring of the business,<br />
particularly for the sites in Mexico and South Korea.<br />
All the depreciation and amortization for 2007 were<br />
reflected in the earnings for that year. Consequently, due<br />
to the reclassification of the disposal group no adjustment<br />
had to be made due to depreciation and amortization for<br />
2007.<br />
The values of the disposal group as of December 31,<br />
2007, are shown in the following table.<br />
disposal group of the styrenics division (million €)<br />
Basf RePoRt <strong>2008</strong><br />
dec. 31, 2007<br />
Intangible assets 59<br />
Property, plant and equipment 363<br />
Inventories 175<br />
Accounts receivable, trade 10<br />
Other receivables and miscellaneous short-term assets 4<br />
Cash and cash equivalents 3<br />
assets of the disposal group 614<br />
Provisions for pensions and similar obligations 15<br />
Accounts payable, trade 1<br />
Other liabilities 1<br />
liabilities of the disposal group 17<br />
Planned acquisitions/divestitures<br />
On September 15, <strong>2008</strong>, <strong>BASF</strong> announced its intention to<br />
acquire Ciba Holding AG (Ciba). On October 1, <strong>2008</strong>, a<br />
public tender offer of CHF 50.00 per share was made to<br />
the shareholders of Ciba.<br />
On November 13, <strong>2008</strong>, the Spanish investor group<br />
Bestinver sold its stake of approximately 13% in Ciba to<br />
<strong>BASF</strong> at a price of CHF 49.50 per share outside the public<br />
tender offer. <strong>BASF</strong> provided assurance to Ciba that it will<br />
not exercise the voting rights attached to these shares<br />
before the completion date. In the <strong>2008</strong> Consoli dated<br />
Financial Statements, the shares already held by <strong>BASF</strong><br />
before the announcement of the public tender offer, the<br />
additional shares acquired in the course of <strong>2008</strong>, as well as<br />
the shares in Ciba acquired from the Bestinver Group<br />
amounted to €351 million and were reported under longterm<br />
securities. This corresponds to a stake in Ciba of<br />
15.2%.<br />
The shares tendered as part of the public tender offer,<br />
the shares already held by <strong>BASF</strong>, the shares in Ciba<br />
acquired from the Bestinver Group and the Ciba shares<br />
held by Ciba would result in a <strong>BASF</strong> stake of 95.2%. The<br />
completion of the transaction is still subject to approval<br />
by the relevant antitrust authorities, which is expected in<br />
the first quarter of 2009. After payments to minority shareholders<br />
on the transfer of control, the total purchase price<br />
will amount to €2.2 billion (CHF 3.4 billion).<br />
The expected purchase price payment of €1,797 million<br />
to be paid as part of the public tender offer after the<br />
approval by the relevant antitrust authorities is reported<br />
under other financial obligations.<br />
more information can be found in note 23 from page 208 onward
3 -- eaRninGs PeR sHaRe<br />
earnings per share<br />
<strong>2008</strong> 2007<br />
Net income (million €) 2,912 4,065<br />
number of shares (1,000)<br />
Weighted-average number of<br />
outstanding shares<br />
930,103<br />
977,786<br />
earnings per share (€) 3.13 4.16<br />
4 -- RePoRtinG By seGment and ReGion<br />
As of January 1, <strong>2008</strong>, we restructured our segments on<br />
the basis of similar products, production processes and<br />
customer industries. In doing so, we are taking account of<br />
changes in our portfolio as a result of acquisitions, divestitures<br />
and restructuring measures over the past few years.<br />
The previous year’s figures for the segments and for Other<br />
have been adjusted accordingly.<br />
<strong>BASF</strong>’s worldwide business is conducted by operating<br />
divisions that are aggregated into six segments for reporting<br />
purposes.<br />
The Chemicals segment consists of the Inorganics,<br />
Petrochemicals and Intermediates divisions. The Catalysts<br />
division has been transferred to the new Functional Solutions<br />
segment.<br />
The Plastics segment is composed of the Performance<br />
Polymers and Polyurethanes divisions. The Specialty Plastics<br />
and Foams business units of the former Styrenics<br />
division have been integrated into the Performance Polymers<br />
division.<br />
The Performance Products segment comprises the<br />
Acrylics & Dispersions, Care Chemicals and Performance<br />
Chemicals divisions. The Functional Polymers division has<br />
been renamed Acrylics & Dispersions. The activities of the<br />
former Fine Chemicals division and the detergents and<br />
formulators business from the Performance Chemicals<br />
division have been included in the new Care Chemicals<br />
division.<br />
Consolidated finanCial statements<br />
Notes<br />
The calculation of earnings per share is based on the<br />
weighted-average number of common shares outstanding.<br />
The calculation of diluted earnings per common share<br />
reflects all possible outstanding common shares and their<br />
effect on income of the <strong>BASF</strong> employee participation program<br />
“Plus.”<br />
In <strong>2008</strong> and 2007 there were no dilutive effects. All<br />
figures for the number of shares and earnings per share<br />
have been adjusted to reflect the two-for-one stock split<br />
conducted in the second quarter of <strong>2008</strong>.<br />
In the Functional Solutions segment, which consists of<br />
the Catalysts, Construction Chemicals and Coatings<br />
divisions, we bundle the majority of our systems solutions<br />
and products for the automotive and construction industries.<br />
The Agricultural Products & Nutrition segment has<br />
been renamed Agricultural Solutions and its Agricultural<br />
Products division has been renamed Crop Protection.<br />
The Oil & Gas segment is composed of the Oil & Gas<br />
division with the Exploration & Production and Natural Gas<br />
Trading business sectors.<br />
Activities not assigned to a particular division are<br />
reported in Other. In particular, they include the styrene<br />
(SM), polystyrene (PS), styrene-butadiene-copolymer (SBS)<br />
and acrylonitrile butadiene styrene (ABS) businesses, which<br />
are managed under the name Styrenics, as well as fertilizer<br />
activities. In addition, the sale of feedstock, engineering<br />
and other services, rental income and leases are reported<br />
in Other. In <strong>2008</strong>, Styrenics accounted for €3,082 million of<br />
the sales reported under Other.<br />
With our corporate research, which is also reported in<br />
Other, we develop cross-divisional growth clusters and<br />
secure <strong>BASF</strong>’s long-term competence with regard to<br />
technology and methods.<br />
Basf RePoRt <strong>2008</strong><br />
175
176<br />
Consolidated finanCial statements<br />
Notes<br />
As of January 1, <strong>2008</strong>, Group corporate costs are no<br />
longer allocated to the segments but reported in Other.<br />
Group corporate costs consist of the expenses for steering<br />
the <strong>BASF</strong> Group.<br />
Foreign currencies results reported in Other relate to<br />
the results from the hedging of forecasted sales not<br />
allocated to the segments; the hedging of cross-segment<br />
net positions of monetary assets and liabilities; and the<br />
translation of financial indebtedness.<br />
In <strong>2008</strong>, hedging and valuation effects were related to<br />
negative earnings resulting from hedging for raw material<br />
price risks that are not allocated to the segments, as well<br />
as income from the reversal of provisions for <strong>BASF</strong>’s<br />
option program.<br />
Earnings in the styrenics business were negative due<br />
to lower demand and writedowns on sites in Mexico and<br />
Korea. Earnings with fertilizers and other business<br />
increased, however.<br />
income from operations (eBit) of other (million €)<br />
Basf RePoRt <strong>2008</strong><br />
<strong>2008</strong> 2007<br />
Corporate research costs (325) (323)<br />
Costs of the corporate center (243) (237)<br />
Styrenics, fertilizers, other business (121) 167<br />
Foreign currency results, hedging and other measurement effects (209) 90<br />
Miscellaneous income and expenses (32) (118)<br />
assets of other (million €)<br />
Intersegmental transfers are predominantly conducted<br />
on the basis of market prices. The allocation of assets<br />
and depreciation to the segments is based on economic<br />
control. Assets used by more than one segment are<br />
allocated based on the percentage of usage.<br />
(930) (421)<br />
<strong>2008</strong> 2007<br />
Assets of businesses included under Other 3,081 3,045<br />
Financial assets 3,093 2,786<br />
Deferred tax assets 930 679<br />
Cash and cash equivalents/marketable securities 2,811 818<br />
Defined benefit assets 165 417<br />
Miscellaneous receivables/prepaid expenses 2,512 1,140<br />
12,592 8,885
The reconciliation Oil & Gas shows the reconciliation of<br />
income from operations in the Oil & Gas segment and the<br />
contribution of the segment to the net income of the <strong>BASF</strong><br />
Group.<br />
The miscellaneous earnings relates to income and<br />
expenses not included in the income from operations of<br />
the segment, the interest result as well as the miscellaneous<br />
financial result. The decline in income from operations<br />
resulted chiefly from losses on loan commitments<br />
denominated in the U.S. dollar and euro at OAO Severneftegazprom<br />
due to the depreciation of the Russian<br />
Ruble. The increase in the miscellaneous result relates<br />
chiefly to results from foreign currency hedging not allocated<br />
to the segments that is reported under Other.<br />
Reconciliation oil & Gas (million €)<br />
Consolidated finanCial statements<br />
Notes<br />
<strong>2008</strong> 2007<br />
income from operations 3,844 3,031<br />
Income from financial assets (68) 5<br />
Miscellaneous earnings 121 8<br />
income before taxes and minority interests 3,897 3,044<br />
Income taxes 2,573 2,121<br />
Thereof income taxes on oil-producing operations non-compensable with German<br />
corporate income tax<br />
Minority interests increased in <strong>2008</strong> compared with the<br />
previous year. This resulted chiefly from the increase in the<br />
Gazprom’s stakes in a German Wintershall subsidiary<br />
which holds production and exploration rights to onshore<br />
concessions 96 and 97 in Libya and in a natural gas trading<br />
company, WINGAS GmbH & Co KG, Kassel, to 50%<br />
minus one share.<br />
income before minority interests 1,324 923<br />
Minority interests 373 134<br />
net income 951 789<br />
1,851<br />
1,302<br />
Basf RePoRt <strong>2008</strong><br />
177
178<br />
Consolidated finanCial statements<br />
Notes<br />
segments<br />
<strong>2008</strong> (million €)<br />
Basf RePoRt <strong>2008</strong><br />
Chemicals Plastics<br />
Performance<br />
Products<br />
Functional<br />
Solutions<br />
Agri cultural<br />
Solutions Oil & Gas<br />
Thereof<br />
Exploration<br />
&<br />
Production Other<br />
Sales 10,324 9,675 8,967 9,388 3,409 14,445 5,308 6,096 62,304<br />
Change (%) 10.3 (3.0) 1.2 (1.1) 8.7 37.3 21.6 (7.8) 7.5<br />
Intersegmental transfers 5,503 642 422 147 28 1,235 237 444 8,421<br />
Sales including intersegmental transfers 15,827 10,317 9,389 9,535 3,437 15,680 5,545 6,540 70,725<br />
Income from operations 1,376 530 787 151 705 3,844 3,319 (930) 6,463<br />
Change (%) (27.7) (54.8) 15.6 (65.2) 36.6 26.8 33.5 . (11.7)<br />
Assets 5,455 5,060 6,352 8,693 4,352 8,356 4,740 12,592 50,860<br />
Thereof goodwill 120 119 755 1,898 1,383 381 381 92 4,748<br />
property, plant and<br />
equipment<br />
3,313<br />
2,570<br />
2,396<br />
Debt 1,497 1,044 1,354 2,100 929 3,107 1,487 22,107 32,138<br />
Research and development expenses 125 147 231 186 325 10 10 331 1,355<br />
Additions to property, plant and<br />
equipment and intangible assets 528 478 432 234 196 1,651 1,364 115 3,634<br />
Amortization of intangible assets and<br />
depreciation of property, plant and<br />
equipment<br />
612<br />
432<br />
499<br />
Thereof impairments 62 . 38 50 . . . 141 291<br />
2007 (million €)<br />
Chemicals Plastics<br />
Performance<br />
Products<br />
1,562<br />
413<br />
Functional<br />
Solutions<br />
502<br />
200<br />
3,638<br />
565<br />
Agri cultural<br />
Solutions Oil & Gas<br />
1,830<br />
425<br />
1,051<br />
378<br />
Thereof<br />
Exploration<br />
&<br />
Production Other<br />
Sales 9,358 9,976 8,862 9,491 3,137 10,517 4,365 6,610 57,951<br />
Change (%) 2.2 5.4 4.3 60.7 1.9 (1.6) (4.2) 13.5 10.2<br />
Intersegmental transfers 4,829 828 361 141 19 1,189 514 336 7,703<br />
Sales including intersegmental transfers 14,187 10,804 9,223 9,632 3,156 11,706 4,879 6,946 65,654<br />
Income from operations 1,903 1,172 681 434 516 3,031 2,486 (421) 7,316<br />
Change (%) 42.3 (0.7) 58.0 28.4 9.3 (7.2) (6.5) (54.8) 8.4<br />
Assets 5,971 5,605 6,397 8,730 4,157 7,057 4,037 8,885 46,802<br />
Thereof goodwill 115 114 722 1,914 1,304 64 64 72 4,305<br />
property, plant and<br />
equipment<br />
3,220<br />
2,500<br />
2,429<br />
Debt 1,804 1,182 1,495 2,193 813 2,624 1,456 16,593 26,704<br />
Research and development expenses 123 142 267 181 328 9 9 330 1,380<br />
Additions to property, plant and<br />
equipment and intangible assets 668 510 434 315 83 2,280 2,162 135 4,425<br />
Amortization of intangible assets and<br />
depreciation of property, plant and<br />
equipment<br />
513<br />
483<br />
462<br />
Thereof impairments . 58 6 90 . . . 7 161<br />
1,530<br />
442<br />
507<br />
202<br />
3,125<br />
561<br />
1,460<br />
415<br />
904<br />
246<br />
Basf<br />
Group<br />
15,032<br />
3,099<br />
Basf<br />
Group<br />
14,215<br />
2,909
Regions<br />
<strong>2008</strong> (million €)<br />
Europe<br />
Thereof<br />
Germany<br />
North<br />
America<br />
Consolidated finanCial statements<br />
Notes<br />
Asia<br />
Pacific<br />
South<br />
America,<br />
Africa,<br />
Middle East<br />
location of customers<br />
Sales 36,693 13,796 11,932 9,320 4,359 62,304<br />
Change (%) 13.4 15.3 0.0 (2.7) 6.4 7.5<br />
Share (%)<br />
location of companies<br />
58.8 22.1 19.2 15.0 7.0 100.0<br />
Sales 38,652 27,497 11,937 8,664 3,051 62,304<br />
Sales including intersegmental transfers 42,874 30,626 13,050 8,911 3,197 68,032<br />
Income from operations 5,822 4,744 73 254 314 6,463<br />
Assets 32,704 19,950 9,991 5,771 2,394 50,860<br />
Thereof property, plant and equipment 8,778 5,485 3,227 2,477 550 15,032<br />
Additions to property, plant and equipment and intangible assets 2,818 1,249 542 172 102 3,634<br />
Amortization of intangible assets and depreciation of property,<br />
plant and equipment<br />
1,801<br />
Employees as of December 31 61,889 47,364 15,168 13,734 6,133 96,924<br />
2007 (million €)<br />
Europe<br />
1,011<br />
Thereof<br />
Germany<br />
690<br />
North<br />
America<br />
510<br />
Asia<br />
Pacific<br />
98<br />
South<br />
America,<br />
Africa,<br />
Middle East<br />
location of customers<br />
Sales 32,347 11,967 11,928 9,579 4,097 57,951<br />
Change (%) 9.5 8.2 3.5 18.2 18.5 10.2<br />
Share (%)<br />
location of companies<br />
55.8 20.7 20.6 16.5 7.1 100.0<br />
Sales 34,316 24,312 12,007 8,785 2,843 57,951<br />
Sales including intersegmental transfers 41,599 27,278 14,203 11,761 2,969 70,532<br />
Income from operations 5,415 4,226 762 828 311 7,316<br />
Assets 26,799 16,483 11,704 6,185 2,114 46,802<br />
Thereof property, plant and equipment 8,082 5,198 2,984 2,569 580 14,215<br />
Additions to property, plant and equipment and intangible assets 3,513 873 634 184 94 4,425<br />
Amortization of intangible assets and depreciation of property,<br />
plant and equipment<br />
1,763<br />
Employees as of December 31 61,020 46,890 15,191 13,278 5,686 95,175<br />
1,004<br />
677<br />
376<br />
93<br />
Basf<br />
Group<br />
3,099<br />
Basf<br />
Group<br />
2,909<br />
Basf RePoRt <strong>2008</strong><br />
179
180<br />
Consolidated finanCial statements<br />
Notes<br />
5 -- otHeR oPeRatinG inCome<br />
Million € <strong>2008</strong> 2007<br />
Reversal and adjustment of provisions 209 152<br />
Revenue from miscellaneous revenue-generating activities 178 150<br />
Income from foreign currency and hedging transactions 433 222<br />
Income from the translation of financial statements in foreign currencies 24 27<br />
Gains from disposal of property, plant and equipment and divestitures 70 105<br />
Gains on the reversal of allowances for doubtful trade receivables 30 39<br />
Other 360 358<br />
The reversal and adjustment of provisions primarily<br />
related to risks arising from shutdown and restructuring<br />
costs, employee obligations, risks from sales as well as<br />
from various other items as part of the normal course of<br />
business. Provisions were reversed or adjusted if the<br />
circumstances on the balance sheet date changed.<br />
Revenue from miscellaneous revenue-generating<br />
activities primarily represents income from rentals and<br />
logistics services.<br />
income from foreign currency and hedging transactions<br />
related to foreign currency transactions, the<br />
measurement of receivables and payables in foreign<br />
currencies and currency derivatives as well as other<br />
hedging transactions with market values.<br />
Basf RePoRt <strong>2008</strong><br />
1,304 1,053<br />
income from the translation of financial statements in<br />
foreign currencies included gains arising from the use of<br />
the temporal method.<br />
In <strong>2008</strong>, gains on the disposal of property, plant and<br />
equipment and divestitures resulted from the sale of the<br />
site in Shreveport, Louisiana, and the continuation of the<br />
divestiture of the premix business.<br />
Gains in the reversal of allowances for doubtful<br />
trade receivables resulted chiefly from the repayment of<br />
written down receivables in the Agricultural Solutions<br />
segment.<br />
other gains comprises refunds and settlements; writeups<br />
on property, plant and equipment; gains from precious<br />
metal trading and miscellaneous sales as well as a number<br />
of other items.
6 -- otHeR oPeRatinG exPenses<br />
Restructuring measures in <strong>2008</strong> related primarily to<br />
expenses for shutdowns and restructuring at several sites<br />
in Europe, North America and Asia, in particular in the<br />
Intermediates and Coatings divisions. In 2007, expenses<br />
related chiefly to impairment losses on property, plant and<br />
equipment and integration costs.<br />
amortization of intangible assets and depreciation<br />
of property, plant and equipment in <strong>2008</strong> related among<br />
other things to impairment losses in the Coatings, Care<br />
Chemicals divisions and in the Styrenics business.<br />
Further expenses were related to demolition and<br />
removal measures as well as the preparation of capital<br />
expenditure projects to the extent that they were not<br />
subject to mandatory capitalization according to IFRS.<br />
Costs from miscellaneous revenue-generating<br />
activities refer to costs related to the items shown as<br />
miscellaneous revenue-generating activities.<br />
more information can be found in note 5 on page 180<br />
Consolidated finanCial statements<br />
Notes<br />
Million € <strong>2008</strong> 2007<br />
Restructuring measures 147 119<br />
Environmental protection and safety measures, costs of demolition and removal, and planning expenses<br />
related to capital expenditures that are not subject to mandatory capitalization 147 173<br />
Amortization of intangible assets and depreciation of property, plant and equipment 384 212<br />
Costs from miscellaneous revenue-generating activities 139 126<br />
Expenses from foreign currency and hedging transactions 751 149<br />
Losses from the translation of the financial statements in foreign currencies 50 40<br />
Losses from the disposal of property, plant and equipment and divestitures 27 98<br />
Oil and gas exploration expenses 227 268<br />
Expenses from additions to allowances for doubtful trade receivables 44 66<br />
Other 584 505<br />
2,500 1,756<br />
expenses from foreign currency and hedging transactions<br />
related to foreign currency transactions, the<br />
measurement of receivables and payables in foreign<br />
currencies, currency derivatives as well as other hedging<br />
transactions with market values.<br />
other expenses were incurred as a result of write off<br />
of obsolete inventory in <strong>2008</strong> of €116 million (2007:<br />
€91 million). In addition, there were losses resulting from<br />
numerous other items.<br />
Basf RePoRt <strong>2008</strong><br />
181
182<br />
Consolidated finanCial statements<br />
Notes<br />
7 -- finanCial Result<br />
Million € <strong>2008</strong> 2007<br />
income from companies accounted for using the equity method (66) 57<br />
Income from participations in affiliated and associated companies 60 43<br />
Income from the disposal of participations 5 11<br />
Income from profit transfer agreements 7 3<br />
Income from tax allocation to participating interests 2 1<br />
other income from participations 74 58<br />
Losses from loss transfer agreements (2) (23)<br />
Write-down of/losses from the sales of participations (80) (8)<br />
other expenses from participations (82) (31)<br />
Interest income from cash and cash equivalents 124 118<br />
Interest and dividend income from securities and loans 50 24<br />
interest income 174 142<br />
interest expenses (601) (614)<br />
Write-ups/profits from the sale of securities and loans – 9<br />
Expected income from pension assets and similar assets 677 662<br />
Expected income from plan assets from other long-term employee obligations 27 11<br />
Income from the capitalization of construction interest 43 44<br />
Miscellaneous financial income 25 –<br />
other financial income 772 726<br />
Write-downs/losses from the disposal of securities and loans (20) (13)<br />
Compounding of pension obligations and other similar obligations (655) (615)<br />
Expenses from other long-term employee obligations (48) (32)<br />
Compounding of other long-term personnel provisions (35) (36)<br />
Miscellaneous financial expenses – (23)<br />
other financial expenses (758) (719)<br />
financial result (487) (381)<br />
The negative result from companies accounted for using<br />
the equity method results primarily from losses on loan<br />
commitments in U.S. dollar and euro at OAO Severneftegazprom<br />
due to the depreciation of the Russian Ruble.<br />
Interest income and expenses relate to expenses and<br />
income from interest-bearing liabilities and financial investments,<br />
including dividend income on securities. In addition,<br />
these items take into account the ongoing interest<br />
expenses and income from interest rate and currency<br />
swaps with banks. The interest result increased compared<br />
with the previous year primarily due to interest income<br />
from loans to finance the natural gas production company<br />
in the Yuzhno Russkoye natural gas field. This company<br />
is accounted for using the equity method. In addition,<br />
the lower interest rate level in the United States led to a<br />
decline in interest expenses.<br />
Basf RePoRt <strong>2008</strong><br />
Miscellaneous financial income and miscellaneous financial<br />
expenses relate to gains and losses from the translation<br />
of individual hedged financing-related receivables and<br />
payables and the associated hedging instruments. Furthermore,<br />
these items included, among other things, expense<br />
and income from the compounding/discounting of longterm<br />
liabilities and receivables as required by IFRS.
8 -- inCome taxes<br />
Consolidated finanCial statements<br />
Notes<br />
Million € <strong>2008</strong> 2007<br />
German corporate income tax, solidarity surcharge, German trade taxes 377 341<br />
Foreign income tax 2,781 2,355<br />
Taxes for prior years (208) (86)<br />
Current taxes 2,950 2,610<br />
Deferred tax expense (+)/income (–) (279) .<br />
income taxes 2,671 2,610<br />
Thereof income taxes on oil-producing operations 2,206 1,768<br />
Other taxes as well as sales and consumption taxes 269 245<br />
tax expense 2,940 2,855<br />
Income before taxes and minority interests is broken down into domestic and foreign as follows:<br />
Million € <strong>2008</strong> 2007<br />
Germany 1,870 1,759<br />
Foreign oil production branches of German companies 2,389 1,895<br />
Foreign 1,717 3,281<br />
In Germany, a uniform corporate tax rate of 15% (until<br />
2007: 25%) and thereon a solidarity surcharge of 5.5% is<br />
levied on all paid out and retained earnings. In addition to<br />
corporate income tax, income generated in Germany is<br />
subject to a trade tax that varies depending on the<br />
municipality in which the company is located. In <strong>2008</strong>, the<br />
weighted average tax rate amounted to 12.7% (2007:<br />
15.4%). The profits of foreign Group companies are<br />
assessed using the tax rates applicable in the respective<br />
countries.<br />
Deferred tax assets and liabilities in the Consolidated<br />
Financial Statements have to be valued using the tax<br />
rates applicable for the period in which the asset or<br />
liabi lity is realized or settled.<br />
5,976 6,935<br />
For German Group companies, deferred taxes were<br />
calculated using a uniform 29% rate. The transition to this<br />
tax rate as a result of the German Tax Reform <strong>2008</strong> led to<br />
non-recurring non-cash income of €229 million in 2007.<br />
For foreign Group companies, deferred taxes were<br />
calculated using the tax rates applicable in the individual<br />
foreign countries. Such rates averaged 27% in <strong>2008</strong> and<br />
30% in 2007. In <strong>2008</strong>, there was €61 million in non-<br />
recurring, non-cash income from changes in tax rates,<br />
predominantly in the Russian Federation.<br />
Income from deferred taxes of €279 million resulted in<br />
particular for tax loss carryforwards.<br />
Basf RePoRt <strong>2008</strong><br />
183
184<br />
Consolidated finanCial statements<br />
Notes<br />
Income taxes on foreign oil-producing operations in<br />
certain regions are compensable up to the level of the<br />
German corporate income tax on this foreign taxable<br />
income. The non-compensable amount is shown separately<br />
in the following table. In <strong>2008</strong>, non-compensable<br />
foreign income taxes for oil production amounted to<br />
€1,851 million. This is based on a corporate income tax<br />
rate of 15%.<br />
Reconciliation from the statutory tax rate in Germany to the effective tax rate<br />
Basf RePoRt <strong>2008</strong><br />
<strong>2008</strong> 2007<br />
million € % Million € %<br />
Expected German corporate income tax (15%; 2007: 25%) 896 15.0 1,734 25.0<br />
Solidarity surcharge 9 0.1 9 0.1<br />
German trade income tax 202 3.4 107 1.5<br />
Foreign tax-rate differential 200 3.3 158 2.3<br />
Tax exempt income (142) (2.4) (338) (4.9)<br />
Non-deductible expenses 135 2.3 74 1.1<br />
Income after taxes of companies accounted for using the equity method 10 0.2 (14) (0.2)<br />
Taxes for prior years (208) (3.5) (86) (1.2)<br />
Income taxes on oil-producing operations non-compensable with German corporate<br />
income tax<br />
Deferred tax liabilities for planned dividend distributions of Group companies (50) (0.8) 31 0.4<br />
Adjustment to deferred tax liabilities due to changes in tax rates (61) 1 (1.0) (229) 2 (3.3)<br />
Other (171) (2.9) (140) (2.0)<br />
income taxes/effective tax rates 2,671 44.7 2,610 37.6<br />
1 Non-cash income from the reduction in corporate income taxes, primarily in the Russian Federation<br />
2 Non-cash income from the German Tax Reform <strong>2008</strong><br />
Other taxes include real estate taxes and other comparable<br />
taxes in the amount of €80 million in <strong>2008</strong> and<br />
€77 million in 2007; they are allocated to the appropriate<br />
functional costs.<br />
Changes in valuation allowances on deferred tax<br />
assets for tax loss carryforwards resulted in charges of<br />
€34 million in <strong>2008</strong> and €23 million in 2007.<br />
1,851<br />
31.0<br />
1,302<br />
18.8
deferred tax assets and liabilities (million €)<br />
Consolidated finanCial statements<br />
Notes<br />
Deferred tax assets Deferred tax liabilities<br />
<strong>2008</strong> 2007 <strong>2008</strong> 2007<br />
Intangible assets 37 27 1,448 1,374<br />
Property, plant and equipment 191 146 1,534 1,358<br />
Financial assets 18 9 66 113<br />
Inventories and accounts receivable 276 163 776 271<br />
Provisions for pensions 698 484 258 102<br />
Other provisions and liabilities 541 661 110 54<br />
Tax loss carryforwards 928 637 – –<br />
Other 499 62 81 216<br />
Netting (2,106) (1,428) (2,106) (1,428)<br />
Valuation allowances for deferred tax assets (152) (82) – –<br />
Thereof for tax loss carryforwards (112) (78) – –<br />
total 930 679 2,167 2,060<br />
Thereof short term 305 445 247 260<br />
Deferred taxes result primarily from temporary differences<br />
between tax balances and the valuation of assets and<br />
liabilities according to IFRS as well as from tax loss carryforwards.<br />
The revaluation of all the assets and liabilities<br />
associated with acquisitions according to IFRS 3 has<br />
resulted in significant deviations between fair values and<br />
the values in the tax accounts. This has primarily led to<br />
deferred tax liabilities.<br />
Deferred tax assets were offset against deferred tax<br />
liabilities of the same maturity if they were related to the<br />
same taxation authority.<br />
Deferred tax liabilities for undistributed earnings of<br />
subsidiaries in the amount of €6,305 million in <strong>2008</strong> and<br />
€4,986 million in 2007 were not recognized, as they are<br />
either not subject to taxation on pay out or they are<br />
expected to be reinvested for indefinite periods of time.<br />
The regional distribution of tax loss carryforwards is<br />
as follows:<br />
tax loss carryforwards (million €)<br />
<strong>2008</strong> 2007<br />
Germany 8 34<br />
Foreign 2,507 1,583<br />
2,515 1,617<br />
German tax losses may be carried forward indefinitely.<br />
Foreign tax loss carryforwards exist primarily in North<br />
America. These expire starting in 2022. In <strong>2008</strong>, tax loss<br />
carryforwards increased. Loss carryforwards in North<br />
America were reduced in 2007 and 2006 as a result of<br />
high earnings. For tax loss carryforwards of €361 million in<br />
<strong>2008</strong> and €196 million in 2007, valuation allowances were<br />
recorded.<br />
Tax obligations are comprised of both tax liabilities and<br />
short-term tax provisions. Tax liabilities primarily concern<br />
the assessed income tax and other taxes. Tax provisions<br />
concern estimated income taxes not yet assessed for the<br />
current and previous years.<br />
tax liabilities (million €)<br />
<strong>2008</strong> 2007<br />
Tax provisions 257 347<br />
Tax liabilities 603 534<br />
860 881<br />
Basf RePoRt <strong>2008</strong><br />
185
186<br />
Consolidated finanCial statements<br />
Notes<br />
9 -- minoRity inteRests<br />
Million € <strong>2008</strong> 2007<br />
Minority interests in profits 434 275<br />
Minority interests in losses 41 15<br />
Minority interest in profits resulted chiefly from Group<br />
companies engaged in natural gas trading and from<br />
Gazprom’s stake in a German Wintershall subsidiary which<br />
holds production and exploration rights in Libya.<br />
10 -- otHeR infoRmation<br />
additional information related to the Consolidated<br />
statements of Cash flows<br />
Cash provided by operating activities includes the following<br />
cash flows:<br />
Million € <strong>2008</strong> 2007<br />
Income tax payments 3,322 2,432<br />
Interest payments 466 502<br />
Dividends received 68 57<br />
information related to subsidiaries<br />
German subsidiaries which are either joint-stock companies<br />
or partnerships make use of the exemptions according<br />
to Section 264 (3) and Section 264b of the German<br />
Commercial Code (HGB). The individual companies are<br />
listed in the List of Shares Held.<br />
Basf RePoRt <strong>2008</strong><br />
Minority interests in losses related primarily to <strong>BASF</strong> Plant<br />
Science GmbH, Ludwigshafen, Germany.<br />
more information on minority interests in consolidated companies can be<br />
found in note 19 on page 200<br />
list of shares Held<br />
A list of companies included in the Consolidated Financial<br />
Statements and a list of all companies in which <strong>BASF</strong> SE<br />
has a participation as required by Section 313 (2) (in connection<br />
with Section 313 (4)) of the German Commercial<br />
Code is provided separately in the List of Shares Held. The<br />
List of Shares Held together with the Consolidated Financial<br />
Statements have been submitted to the electronic<br />
Federal Gazette as required by Section 325 of the German<br />
Commercial Code and are available from <strong>BASF</strong> SE. It is<br />
also published on the internet at:<br />
basf.com/cg_reports<br />
statement of compliance according to section 161 of<br />
the German stock Corporation act<br />
The annual statement of compliance with the German Corporate<br />
Governance Code according to Section 161 of the<br />
German Stock Corporation Act was signed by the Board of<br />
Executive Directors and the Supervisory Board of <strong>BASF</strong> SE<br />
on December 3, <strong>2008</strong>, and is published on the internet at:<br />
basf.com/governance_e<br />
393 260
Personnel costs and number of employees<br />
On December 31, <strong>2008</strong>, the number of employees was<br />
96,924 and on December 31, 2007, 95,175.<br />
The number of employees in proportionally-consolidated<br />
companies is included in full in the table below.<br />
Considered pro-rata, the average number of employees in<br />
the <strong>BASF</strong> Group was 95,885 in <strong>2008</strong> and 94,893 in 2007.<br />
Personnel costs (million €)<br />
Consolidated finanCial statements<br />
Notes<br />
<strong>2008</strong> 2007<br />
Wages and salaries 5,158 5,379<br />
Social security contributions and expenses for pensions and assistance 1,206 1,269<br />
Thereof for pension benefits 310 359<br />
average number of employees<br />
Consolidated companies<br />
6,364 6,648<br />
Proportionally consolidated<br />
companies <strong>BASF</strong> Group<br />
<strong>2008</strong> 2007 <strong>2008</strong> 2007 <strong>2008</strong> 2007<br />
Europe 61,042 60,754 440 428 61,482 61,182<br />
Thereof Germany 46,902 46,738 22 24 46,924 46,762<br />
North America 14,992 15,088 452 454 15,444 15,542<br />
Asia Pacific 12,446 12,080 1,906 1,814 14,352 13,894<br />
South America, Africa, Middle East 6,006 5,623 – – 6,006 5,623<br />
Basf Group 94,486 93,545 2,798 2,696 97,284 96,241<br />
Thereof with trainee contracts 1,907 1,936 2 3 1,909 1,939<br />
employees with limited-term<br />
contracts<br />
2,337<br />
2,268<br />
Personnel costs decreased by 4.3% from €6,648 million<br />
in 2007 to €6,364 million in <strong>2008</strong> due to the reversal of<br />
provisions for the <strong>BASF</strong> option program that resulted from<br />
decreased obligations under these options. Furthermore,<br />
there were lower expenses for variable compensation as<br />
the return on assets was below the previous year’s<br />
level.<br />
31<br />
37<br />
2,368<br />
2,305<br />
Basf RePoRt <strong>2008</strong><br />
187
188<br />
Consolidated finanCial statements<br />
Notes<br />
11 -- intanGiBle assets<br />
development <strong>2008</strong> (million €)<br />
acquisition costs<br />
Balance as of<br />
January 1, <strong>2008</strong><br />
Changes in scope of<br />
consolidation<br />
Basf RePoRt <strong>2008</strong><br />
Distribution,<br />
supply and<br />
similar rights<br />
3,472<br />
(1)<br />
Product rights,<br />
licenses and<br />
trademarks<br />
1,165<br />
.<br />
Know-how,<br />
patents and<br />
production<br />
technology<br />
1,651<br />
–<br />
Internally<br />
generated<br />
intangible<br />
assets<br />
135<br />
.<br />
Other rights and<br />
values 1 Goodwill total<br />
Additions 29 327 19 17 53 380 825<br />
Disposals (17) (9) (47) (22) (25) (16) (136)<br />
Transfers 2 23 (3) 1 177 34 234<br />
Exchange differences (119) 12 12 2 16 40 (37)<br />
Balance as of<br />
December 31, <strong>2008</strong><br />
amortization<br />
Balance as of<br />
January 1, <strong>2008</strong><br />
Changes in scope of<br />
consolidation<br />
3,366<br />
459<br />
.<br />
1,518<br />
417<br />
.<br />
1,632<br />
545<br />
Additions 214 82 139 22 145 16 618<br />
Disposals (17) (7) (48) (21) (24) (16) (133)<br />
Transfers . 20 . . 21 – 41<br />
Exchange differences 12 7 5 1 10 – 35<br />
Balance as of<br />
December 31, <strong>2008</strong><br />
net carrying amount as<br />
of december 31, <strong>2008</strong><br />
668<br />
2,698<br />
1 Including licenses on such rights and values<br />
Additions of €303 million for exploration licenses for the<br />
British and Norwegian North Sea resulted from the acquisition<br />
of Revus Energy ASA and its preliminary purchase<br />
price allocation in <strong>2008</strong>.<br />
In <strong>2008</strong>, impairments of €37 were taken. Disposals of<br />
goodwill related, among other things, to impairment<br />
charges of €9 million as part of the restructuring of the<br />
Styrenics business. Impairments are reported under other<br />
operating expenses.<br />
Concessions for oil and gas production with a net carrying<br />
amount of €362 million in <strong>2008</strong> and €62 million in 2007<br />
convey the right to produce oil and gas at certain sites. To<br />
a limited extent, these rights entail obligations to deliver a<br />
portion of the produced amount to local companies. At the<br />
end of the term of a concession, the rights are returned.<br />
519<br />
999<br />
.<br />
641<br />
991<br />
133<br />
80<br />
.<br />
82<br />
51<br />
789<br />
1<br />
1,011<br />
457<br />
.<br />
609<br />
402<br />
4,305<br />
5<br />
4,748<br />
–<br />
–<br />
–<br />
4,748<br />
11,517<br />
5<br />
12,408<br />
The amounts recorded under transfers resulted primarily<br />
from the reclassification of assets held for sale as intangible<br />
assets.<br />
1,958<br />
.<br />
2,519<br />
9,889<br />
more information on the reclassification of the disposal group can be found in<br />
note 2 from page 170 onward<br />
The valuation adjustments of emission rights as of the<br />
balance sheet date are included in the line item transfers in<br />
the column ‘Other rights and values’.<br />
There were no material write-ups in <strong>2008</strong>.
development 2007 (million €)<br />
acquisition costs<br />
Balance as of<br />
January 1, 2007<br />
Changes in scope of<br />
consolidation<br />
Distribution,<br />
supply and<br />
similar rights<br />
Product rights,<br />
licenses and<br />
trademarks<br />
Additions in 2007 resulted primarily from the asset swap<br />
with Gazprom and the associated intangible assets from<br />
the marketing contract for the natural gas from the Yuzhno<br />
Russkoye gas field.<br />
Know-how,<br />
patents and<br />
production<br />
technology<br />
Internally<br />
generated<br />
intangible<br />
assets<br />
Consolidated finanCial statements<br />
Notes<br />
Other rights and<br />
values 1 Goodwill total<br />
1,835 1,212 1,684 215 964 4,713 10,623<br />
6<br />
–<br />
Additions 1,773 6 6 20 45 11 1,861<br />
Disposals (10) (2) (28) (95) (68) (91) (294)<br />
Transfers 1 (25) 34 . (108) 31 (67)<br />
Exchange differences (133) (26) (47) (5) (46) (365) (622)<br />
Balance as of<br />
December 31, 2007<br />
amortization<br />
Balance as of<br />
January 1, 2007<br />
Changes in scope of<br />
consolidation<br />
3,472<br />
297<br />
.<br />
1,165<br />
377<br />
.<br />
2<br />
1,651<br />
427<br />
Additions 178 83 143 26 120 65 615<br />
Disposals (7) (2) (28) (94) (62) (65) (258)<br />
Transfers 7 (28) 7 – (31) – (45)<br />
Exchange differences (16) (13) (5) (2) (22) – (58)<br />
Balance as of<br />
December 31, 2007<br />
net carrying amount as<br />
of december 31, 2007<br />
459<br />
3,013<br />
1 Including licenses on such rights and values<br />
417<br />
748<br />
1<br />
545<br />
1,106<br />
–<br />
135<br />
150<br />
–<br />
80<br />
55<br />
2<br />
789<br />
451<br />
1<br />
457<br />
332<br />
6<br />
4,305<br />
–<br />
–<br />
–<br />
4,305<br />
16<br />
11,517<br />
1,702<br />
2<br />
1,958<br />
9,559<br />
Impairment losses of €84 million in 2007 related to goodwill<br />
and various intangible assets. These were reported<br />
under other operating expenses.<br />
There were no material write-ups.<br />
Basf RePoRt <strong>2008</strong><br />
189
190<br />
Consolidated finanCial statements<br />
Notes<br />
12 -- PRoPeRty, Plant and equiPment<br />
development <strong>2008</strong> (million €)<br />
Basf RePoRt <strong>2008</strong><br />
Land, land rights<br />
and buildings<br />
Machinery<br />
and technical<br />
equipment<br />
Miscellaneous<br />
equipment and<br />
fixtures<br />
Advance payments<br />
and construction in<br />
progress total<br />
acquisition costs<br />
Balance as of January 1, <strong>2008</strong> 7,212 34,277 2,694 1,574 45,757<br />
Changes in scope of consolidation 4 (8) 4 21 21<br />
Additions 58 986 114 1,651 2,809<br />
Disposals (106) (858) (95) (60) (1,119)<br />
Transfers 208 2,228 73 (1,318) 1,191<br />
Exchange differences 94 354 27 13 488<br />
Balance as of December 31, <strong>2008</strong><br />
accumulated valuation adjustments<br />
7,470 36,979 2,817 1,881 49,147<br />
Balance as of January 1, <strong>2008</strong> 4,213 25,136 2,177 16 31,542<br />
Changes in scope of consolidation 1 (8) 2 – (5)<br />
Additions 255 2,064 161 1 2,481<br />
Disposals (78) (808) (88) (11) (985)<br />
Transfers 1 787 51 . 839<br />
Exchange differences 35 186 22 – 243<br />
Balance as of December 31, <strong>2008</strong> 4,427 27,357 2,325 6 34,115<br />
net carrying amount as of<br />
december 31, <strong>2008</strong><br />
3,043<br />
Additions to property, plant and equipment in <strong>2008</strong> arose<br />
from a number of investments. The material ones included:<br />
the expansion of the synthesis gas plants and the construction<br />
of a plant to produce cyclododecanon at the<br />
Ludwigshafen site; the construction of a plant to produce<br />
resins in Wyandotte, Michigan, the expansion of a polyol<br />
plant in Geismar, Louisiana, the construction of the HPPO<br />
plant and the plants for acrylic acid and superabsorbents<br />
in Antwerp, Belgium; and the construction of the Nord<br />
Stream gas pipeline. Furthermore, the acquisition of Revus<br />
Energy ASA and its purchase price allocation resulted in<br />
additions to property, plant and equipment of €350 million.<br />
The amounts recorded under transfers resulted from the<br />
reclassification of the property, plant and equipment of the<br />
Styrenics business from assets held for sale.<br />
more information on the reclassification of the disposal group can be found in<br />
note 2 from page 170 onward<br />
9,622<br />
492<br />
1,875<br />
15,032<br />
In <strong>2008</strong>, impairments of €254 million were taken. Impairment<br />
charges of €112 million were recognized in connection<br />
with the restructuring of the Styrenics business,<br />
primarily at the sites in Mexico and South Korea. Further<br />
material impairments related to the butan diol plant at our<br />
site in Kuantan, Malaysia, and the continued restructuring<br />
of the coatings business in North America, Asia and<br />
Europe.
development 2007 (million €)<br />
acquisition costs<br />
Land, land rights<br />
and buildings<br />
Machinery<br />
and technical<br />
equipment<br />
Miscellaneous<br />
equipment and<br />
fixtures<br />
Consolidated finanCial statements<br />
Notes<br />
Advance payments<br />
and construction in<br />
progress total<br />
Balance as of January 1, 2007 7,444 34,827 2,762 1,598 46,631<br />
Changes in scope of consolidation 6 8 2 2 18<br />
Additions 79 962 114 1,409 2,564<br />
Disposals (115) (703) (156) (32) (1,006)<br />
Transfers (11) 144 31 (1,351) (1,187)<br />
Exchange differences (191) (960) (60) (51) (1,263)<br />
Balance as of December 31, 2007 7,212 34,277 2,694 1,574 45,757<br />
accumulated valuation adjustments<br />
Balance as of January 1, 2007 4,222 25,268 2,237 3 31,729<br />
Changes in scope of consolidation 3 2 2 – 6<br />
Additions 208 1,900 170 16 2,294<br />
Disposals (74) (673) (143) . (890)<br />
Transfers (58) (761) (38) (3) (860)<br />
Exchange differences (87) (600) (50) – (737)<br />
Balance as of December 31, 2007 4,213 25,136 2,177 16 31,542<br />
net carrying amount as of<br />
december 31, 2007<br />
2,999<br />
In 2007, additions related primarily to expansion projects<br />
at our Verbund site in Antwerp, the construction of a<br />
superabsorbents plant in Freeport, Texas, and investments<br />
associated with field development of the Achimov formation<br />
in the Urengoy gas and condensate field.<br />
Impairment losses of €78 million in 2007 related<br />
primarily to the restructuring at two European sites and the<br />
North American coatings business. They were reported as<br />
other operating expenses.<br />
9,141<br />
517<br />
1,558<br />
14,215<br />
The amounts recorded under transfers resulted from the<br />
classification of property, plant and equipment to ‘assets<br />
of disposal groups’.<br />
further information on disposal groups is found in note 2 from page 170<br />
onward<br />
In 2007, write-ups were made on the vitamin B2 plant at<br />
the site in Gunsan, Korea, and on the cushion gas in the<br />
Rehden natural gas storage facility.<br />
Basf RePoRt <strong>2008</strong><br />
191
192<br />
COnSOlidATEd FinAnCiAl STATEmEnTS<br />
Notes<br />
13 -- invESTmEnTS ACCOunTEd FOR uSing ThE EquiTy mEThOd And OThER<br />
FinAnCiAl ASSETS<br />
development <strong>2008</strong> (million €)<br />
<strong>BASF</strong> REPORT <strong>2008</strong><br />
Investments<br />
accounted for<br />
using the equity<br />
method<br />
Investments in affiliated<br />
companies<br />
Investments in<br />
associated<br />
companies<br />
Shares in other<br />
participations<br />
Long-term<br />
securities<br />
Acquisition cost<br />
Balance as of January 1, <strong>2008</strong> 890 327 68 904 29<br />
Changes in scope of consolidation (13) (10) . . .<br />
Additions 450 58 22 350 2<br />
Disposals (96) (51) (9) (6) (2)<br />
Transfers/Changes in market value (81) 9 2 (9) (2)<br />
Exchange differences 46 2 1 1 2<br />
Balance as of December 31, <strong>2008</strong><br />
Accumulated valuation adjustments<br />
1,196 335 84 1,240 29<br />
Balance as of January 1, <strong>2008</strong> 56 92 7 31 1<br />
Changes in scope of consolidation – (2) – . –<br />
Additions 50 14 2 2 1<br />
Disposals (56) . (6) . .<br />
Transfers – – . – .<br />
Exchange differences – . . – –<br />
Balance as of December 31, <strong>2008</strong> 50 104 3 33 2<br />
net carrying amount as of december 31, <strong>2008</strong> 1,146 231 81 1,207 27<br />
development <strong>2008</strong> (million €)<br />
Loans to affiliated<br />
companies<br />
Loans to associated<br />
companies<br />
and participating<br />
interests Other loans<br />
Other financial<br />
assets<br />
Investments<br />
accounted for using<br />
the equity method<br />
and other financial<br />
assets Total<br />
Acquisition cost<br />
Acquisition cost<br />
Balance as of January 1, <strong>2008</strong> 135 694 54 2,211 3,101<br />
Changes in scope of consolidation – – . (10) (23)<br />
Additions 6 31 4 473 923<br />
Disposals (3) (374) (5) (450) (546)<br />
Transfers/Changes in market value . . (2) (2) (83)<br />
Exchange differences . 3 (4) 5 51<br />
Balance as of December 31, <strong>2008</strong><br />
Accumulated valuation adjustments<br />
138 354 47 2,227 3,423<br />
Balance as of January 1, <strong>2008</strong> 121 3 4 259 315<br />
Changes in scope of consolidation – – . (2) (2)<br />
Additions 5 5 2 31 81<br />
Disposals . – . (6) (62)<br />
Transfers – . (2) (2) (2)<br />
Exchange differences – – – . .<br />
Balance as of December 31, <strong>2008</strong> 126 8 4 280 330<br />
net carrying amount as of december 31, <strong>2008</strong> 12 346 43 1,947 3,093
development 2007 (million €)<br />
Investments<br />
accounted for<br />
using the equity<br />
method<br />
Investments in affiliated<br />
companies<br />
Investments in<br />
associated<br />
companies<br />
COnSOlidATEd FinAnCiAl STATEmEnTS<br />
Notes<br />
Shares in other<br />
participations<br />
Long-term<br />
securities<br />
Acquisition cost<br />
Balance as of January 1, 2007 706 361 62 563 43<br />
Changes in scope of consolidation (5) 6 – – –<br />
Additions 174 3 11 5 .<br />
Disposals (1) (38) (1) (2) (11)<br />
Transfers/Changes in market value 52 . (2) 340 .<br />
Exchange differences (36) (5) (2) (1) (3)<br />
Balance as of December 31, 2007<br />
Accumulated valuation adjustments<br />
890 327 68 904 29<br />
Balance as of January 1, 2007 56 89 9 31 1<br />
Changes in scope of consolidation – (1) – – –<br />
Additions – 6 1 1 .<br />
Disposals – (5) . (1) –<br />
Transfers – 3 (3) . –<br />
Exchange differences – . – – –<br />
Balance as of December 31, 2007 56 92 7 31 1<br />
net carrying amount as of december 31, 2007 834 235 61 873 28<br />
development 2007 (million €)<br />
Loans to affiliated<br />
companies<br />
Loans to associated<br />
companies<br />
and participating<br />
interests Other loans<br />
Other financial<br />
assets<br />
Investments<br />
accounted for using<br />
the equity method<br />
and other financial<br />
assets Total<br />
Acquisition cost<br />
Acquisition cost<br />
Balance as of January 1, 2007 132 202 59 1,421 2,127<br />
Changes in scope of consolidation . – – 6 1<br />
Additions 11 518 15 562 737<br />
Disposals (9) (16) (9) (85) (86)<br />
Transfers/Changes in market value 1 (1) (8) 330 381<br />
Exchange differences . (9) (2) (23) (58)<br />
Balance as of December 31, 2007<br />
Accumulated valuation adjustments<br />
135 694 54 2,211 3,101<br />
Balance as of January 1, 2007 92 4 3 231 286<br />
Changes in scope of consolidation – – – (1) (1)<br />
Additions 28 1 1 38 38<br />
Disposals – (2) – (8) (8)<br />
Transfers – – . . .<br />
Exchange differences – . – (1) (1)<br />
Balance as of December 31, 2007 121 3 4 259 315<br />
net carrying amount as of december 31, 2007 14 691 50 1,952 2,786<br />
<strong>BASF</strong> REPORT <strong>2008</strong><br />
193
194<br />
COnSOlidATEd FinAnCiAl STATEmEnTS<br />
Notes<br />
In <strong>2008</strong>, the additions to investments accounted for using<br />
the equity method resulted primarily from the capital injections<br />
in Nord Stream AG and OAO Severneftegazprom.<br />
In 2007, the additions to investments accounted for using<br />
the equity method were primarily due to the purchase of a<br />
stake in OAO Severneftegazprom and the increase in the<br />
share capital of Nord Stream AG.<br />
The shares in other participations and long-term<br />
securities are recognized at fair value. Additions in <strong>2008</strong><br />
resulted from the acquisition of the 15.2% stake in Ciba<br />
Holding AG for €344 million. The amounts recorded under<br />
transfers resulted primarily from the measurement at fair<br />
value of our stakes in K+S AG and Ciba Holding AG.<br />
Investments contain impairments of €68 million in<br />
<strong>2008</strong>, chiefly as a result of our 42% stake in N.E. Chemcat<br />
Corporation. Due to impairments of other participations<br />
and long-term securities, impairment losses of €8 million<br />
market values of available for sale securities (million €)<br />
Million € <strong>2008</strong> 2007<br />
Raw materials and factory supplies 1,769 1,800<br />
Work-in-process, finished goods and<br />
merchandise<br />
Advance payments and services-<br />
in-process<br />
<strong>BASF</strong> REPORT <strong>2008</strong><br />
Original<br />
acquisition<br />
cost<br />
4,924<br />
70<br />
4,708<br />
70<br />
6,763 6,578<br />
Work-in-process, finished goods and merchandise are combined<br />
into one item due to the production conditions in the<br />
chemical industry. Services-in-process relate primarily to<br />
inventory not invoiced at the balance sheet date.<br />
were charged to income in 2007. The disposal of other<br />
investments resulted in a loss of €7 million in <strong>2008</strong> and a<br />
gain of €11 million in 2007.<br />
The disposals of loans to associated companies and<br />
participating interests resulted from the partial repayment<br />
of the loan to OAO Severneftegazprom granted in 2007.<br />
This company is accounted for using the equity method.<br />
In 2007, loans to associated companies and participating<br />
interests related primarily to <strong>BASF</strong>’s share of the financing<br />
of OAO Severneftegazprom.<br />
The market values of available-for-sale shares on the<br />
balance sheet date are summarized below:<br />
<strong>2008</strong> 2007<br />
Book/market<br />
value<br />
Recognized in<br />
other comprehensive<br />
income<br />
Original<br />
acquisition cost<br />
Book/market<br />
value<br />
Recognized in<br />
other comprehensive<br />
income<br />
Shares in funds 29 25 (2) 29 26 (2)<br />
Shares in other participations and<br />
securities<br />
14 -- invEnTORiES<br />
561<br />
1,209<br />
652<br />
590 1,234 650 238 901 671<br />
209<br />
Price declines in the second half of <strong>2008</strong> led to an increase<br />
in the allowances for raw materials, intermediates and end<br />
products. Overall, impairment losses on inventory amounted<br />
to €159 million in <strong>2008</strong> and €16 million in 2007. Of the total<br />
inventory, €1,343 million in <strong>2008</strong> and €1,444 million in 2007<br />
was valued at net realizable value.<br />
Reversals of impairment losses are made if the reasons<br />
for the impairment no longer apply. Reversals amounted to<br />
€5 million in <strong>2008</strong> and €4 million in 2007.<br />
Inventories were valued using the weighted-average cost<br />
method.<br />
874<br />
673
15 -- RECEivABlES And miSCEllAnEOuS ASSETS<br />
Other receivables and miscellaneous assets (million €)<br />
COnSOlidATEd FinAnCiAl STATEmEnTS<br />
Notes<br />
<strong>2008</strong> 2007<br />
Thereof<br />
short-term<br />
Thereof<br />
short-term<br />
Receivables from affiliated companies 326 324 284 284<br />
Prepaid expenses 217 195 197 167<br />
Defined benefit assets 165 – 417 –<br />
Receivables from associated companies and other participating<br />
interests<br />
Tax refund claims 648 536 488 419<br />
Loans and interest receivables 90 90 3 3<br />
Derivatives with positive fair values 1,192 1,172 233 229<br />
Employee receivables 25 16 43 34<br />
Rents and deposits 58 28 51 24<br />
Insurance claims 24 22 25 25<br />
Receivables from joint venture partners 28 28 87 70<br />
Precious metal trading positions 540 540 601 601<br />
Other 1,062 807 367 290<br />
4,590 3,948 2,992 2,337<br />
Prepaid expenses include prepayments for operating<br />
expenses of €31 million in <strong>2008</strong> and €14 million in 2007 as<br />
well as prepayments for insurance premiums of €28 million<br />
in <strong>2008</strong> and €25 million in 2007.<br />
Precious metal trading positions comprise above all<br />
long positions in precious metals, which are largely hedged<br />
through sales or derivatives. Unhedged precious metal<br />
positions are also included in this item. On the balance<br />
sheet date, precious metal trading positions contained<br />
derivatives with a positive fair value of €188 million in <strong>2008</strong><br />
(2007: €16 million). Forward contracts made up the bulk<br />
of these.<br />
valuation allowances for doubtful receivables (million €)<br />
Balance as of<br />
January 1, <strong>2008</strong><br />
Additions<br />
affecting<br />
income<br />
215<br />
190<br />
On December 31, <strong>2008</strong>, market values of derivatives concluded<br />
to hedge currency fluctuations and rising raw material<br />
prices were higher than the previous year’s level. On<br />
the other hand, there were derivatives with negative fair<br />
values contained in other liabilities. Margin calls for<br />
publicly-traded and over the counter commodity derivatives<br />
amounting to €486 million and prepayments for precious<br />
metal trading transactions are contained in Other.<br />
The prepaid expenses amounted to €5 million in <strong>2008</strong><br />
and €3 million in 2007.<br />
Reversals<br />
affecting<br />
income<br />
Additions<br />
not affecting<br />
income<br />
196<br />
Reversals<br />
not affecting<br />
income<br />
191<br />
Balance as of<br />
december 31,<br />
<strong>2008</strong><br />
Accounts receivable, trade 364 71 74 15 70 306<br />
Other receivables 31 1 3 – 4 25<br />
395 72 77 15 74 331<br />
<strong>BASF</strong> REPORT <strong>2008</strong><br />
195
196<br />
COnSOlidATEd FinAnCiAl STATEmEnTS<br />
Notes<br />
valuation allowances for doubtful receivables (million €)<br />
Reversals affecting income were due primarily to the reversal<br />
of allowances for doubtful receivables resulting from the<br />
repayment of written down receivables in the Agricultural<br />
Solutions segment.<br />
A significant portion of receivables is covered by credit<br />
insurance.<br />
The reversals not affecting income related primarily to<br />
changes in the scope of consolidation, translation adjustments<br />
and write-offs of uncollectible receivables.<br />
Even in the current economic conditions, we did not<br />
note any material changes in the credit quality of our receivables.<br />
In <strong>2008</strong>, after being individually assessed for impairment,<br />
valuation allowances of €58 million were established<br />
for trade accounts receivable (reversals €68 million) and<br />
Aged list of trade accounts receivable (million €)<br />
<strong>BASF</strong> REPORT <strong>2008</strong><br />
€1 million for miscellaneous receivables (reversals €3 million).<br />
In 2007, after being individually assessed for impairment,<br />
valuation allowances of €51 million were established<br />
for trade accounts receivable (reversals €37 million) and<br />
€8 million for miscellaneous receivables (reversals €14 million).<br />
Receivables did not need to be re-negotiated to any<br />
major extent in 2007 and <strong>2008</strong> as contractual conditions<br />
did not change.<br />
Overdue trade accounts receivables which have not<br />
been individually assessed for impairment, but which were<br />
included in credit insurance policies, amounted to<br />
€378 million on December 31, <strong>2008</strong> (€659 million on December<br />
31, 2007).<br />
Contingent assets amounted to €216 million in <strong>2008</strong>.<br />
<strong>2008</strong> 2007<br />
Not yet due 6,807 7,658<br />
Less than 30 days 615 593<br />
Between 30 and 89 days 215 176<br />
More than 90 days 115 134<br />
Aged list of other receivables (million €)<br />
Balance as of<br />
January 1,<br />
2007<br />
Additions<br />
affecting<br />
income<br />
Reversals<br />
affecting<br />
income<br />
Additions<br />
not affecting<br />
income<br />
Reversals<br />
not affecting<br />
income<br />
Balance as of<br />
December 31,<br />
2007<br />
Accounts receivable, trade 353 58 69 57 35 364<br />
Other receivables 43 8 14 2 8 31<br />
396 66 83 59 43 395<br />
7,752 8,561<br />
<strong>2008</strong> 2007<br />
Not yet due 1,538 790<br />
Less than 30 days 188 209<br />
Between 30 and 89 days 80 8<br />
More than 90 days 21 49<br />
1,827 1,056
16 -- mARkETABlE SECuRiTiES, CASh And CASh EquivAlEnTS<br />
Cash and cash equivalents of €2,776 million in <strong>2008</strong> and<br />
€767 million in 2007 consisted primarily of cash on hand<br />
and bank balances.<br />
marketable short-term securities (million €)<br />
The sale of marketable securities in <strong>2008</strong> resulted in<br />
proceeds of €13 million and a profit of €0.1 million. In 2007,<br />
COnSOlidATEd FinAnCiAl STATEmEnTS<br />
Notes<br />
In addition, on the balance sheet date marketable securities<br />
of €35 million in <strong>2008</strong> (2007: €51 million) were held.<br />
<strong>2008</strong> 2007<br />
Original<br />
acquisition cost Book/market value<br />
Original<br />
acquisition cost Book/market value<br />
Fixed-term, interest-bearing certificates 5 5 15 16<br />
Shares 27 29 36 33<br />
Other securities 1 1 2 2<br />
maturities of fixed-term securities (million €)<br />
17 -- CAPiTAl And RESERvES<br />
33 35 53 51<br />
the sale of marketable securities resulted in proceeds of<br />
€28 million and a profit of €6 million.<br />
<strong>2008</strong> 2007<br />
Original<br />
acquisition cost Book/market value<br />
Original<br />
acquisition cost Book/market value<br />
Less than 1 year 1 1 7 7<br />
Between 1 and 5 years – – 3 4<br />
More than 5 years 5 5 5 5<br />
On April 24, <strong>2008</strong>, the <strong>Annual</strong> Meeting of <strong>BASF</strong> resolved<br />
a two-for-one stock split. Shareholders received one<br />
additional share for each <strong>BASF</strong> share held at no additional<br />
cost. The adjustment of the securities deposit accounts<br />
and the stock exchange listing took place on June 27,<br />
<strong>2008</strong>. All shares are qualifying for <strong>2008</strong>. <strong>BASF</strong>’s shares are<br />
no-par-value shares. All figures have been adjusted<br />
accordingly.<br />
6 6 15 16<br />
In <strong>2008</strong>, a total of 37,891,306 shares were repurchased for<br />
cancellation. Of these 4,649,873 shares had not been<br />
cancelled as of December 31, <strong>2008</strong>, but were deducted<br />
from capital. A total of 57,841,433 shares were cancelled<br />
in <strong>2008</strong>. Thereof were included 24,600,000 shares that<br />
were acquired for the purpose of cancellation in 2007. The<br />
subscribed capital of <strong>BASF</strong> was reduced by the resulting<br />
attributable amount of €74 million (57,841,433 shares).<br />
<strong>BASF</strong> REPORT <strong>2008</strong><br />
197
198<br />
COnSOlidATEd FinAnCiAl STATEmEnTS<br />
Notes<br />
Subscribed capital (million €)<br />
Share buyback/Own shares<br />
The Board of Executive Directors received approval at the<br />
<strong>Annual</strong> Meeting on April 24, <strong>2008</strong>, to buy back <strong>BASF</strong><br />
shares to a maximum amount of 10% of subscribed capital<br />
by October 23, 2009. The shares shall be purchased on<br />
the stock exchange or through a public purchase offer<br />
open to all shareholders. If <strong>BASF</strong> shares are purchased on<br />
a stock exchange, the price paid for the shares may not be<br />
higher than the highest market price on the buying day and<br />
may not be more than 25% lower than that highest price.<br />
In the case of a public purchase offer, the price offered<br />
by <strong>BASF</strong> may be a maximum of 10% higher than the<br />
highest market price on the third trading day prior to the<br />
announcement of the public purchase offer. This authorization<br />
supersedes the validity of the prior authorization to<br />
repurchase <strong>BASF</strong> shares granted by the <strong>Annual</strong> Meeting<br />
on April 26, 2007.<br />
The Board of Executive Directors is authorized to<br />
cancel the repurchased shares without the approval of a<br />
further resolution at an <strong>Annual</strong> Meeting.<br />
A sale of treasury shares is only authorized after a corresponding<br />
resolution at the <strong>Annual</strong> Meeting, unless, with<br />
the approval of the Supervisory Board, the shares are used<br />
to acquire companies, parts of companies or participations<br />
in companies in return for shares.<br />
In <strong>2008</strong>, a total of 37,891,306 shares, or 3.86% of the<br />
issued shares, were acquired under the respective approvals.<br />
The average purchase price was €42.70 per share. As<br />
of the balance sheet date, 4,649,873 shares of <strong>BASF</strong> stock<br />
were held by <strong>BASF</strong>. They were purchased for cancellation<br />
and are deducted from subscribed capital.<br />
<strong>BASF</strong> REPORT <strong>2008</strong><br />
Number of<br />
shares<br />
Subscribed<br />
capital<br />
Outstanding shares as of December 31, 2007 490,485,000 1,256<br />
Shares cancelled until June 27, <strong>2008</strong> (17,470,000) (45)<br />
Outstanding shares before the stock split 473,015,000 1,211<br />
Issuance of new shares as part of the stock split 473,015,000 –<br />
Outstanding shares as of June 27, <strong>2008</strong> 946,030,000 1,211<br />
Cancelled shares until December 31, <strong>2008</strong> (22,901,433) (29)<br />
Outstanding shares as of december 31, <strong>2008</strong> 923,128,567 1,182<br />
Repurchased shares intended to be cancelled (4,649,873) (6)<br />
Outstanding shares as disclosed in the financial statements 918,478,694 1,176<br />
<strong>BASF</strong> spent a total of €1,618 million on the share buy-<br />
back program in <strong>2008</strong>. €48 million thereof was expensed<br />
through the reduction of subscribed capital and €1,570 million<br />
through the reduction of other retained earnings.<br />
Retained earnings were also reduced by €74 million due to<br />
the reclassification of computed nominal value of the own<br />
shares cancelled in <strong>2008</strong> to capital surplus. Of this amount,<br />
€31 million related to shares purchased for cancellation in<br />
the previous year.<br />
In 2007, 42,990,000 shares, or 4.29% of the issued<br />
shares, were acquired. The average purchase price was<br />
€44.18 per share.<br />
Conditional capital<br />
A residual amount of less than €10,000 is reserved to<br />
meet compensation claims of former shareholders of<br />
Wintershall. These compensation claims expired in July<br />
2004. <strong>BASF</strong> SE will therefore issue no more shares from<br />
conditional capital nor fulfill compensation claims.<br />
Authorized capital<br />
At the <strong>Annual</strong> Meeting of April 29, 2004, shareholders<br />
authorized the Board of Executive Directors to increase<br />
subscribed capital by issuing new shares in an amount of<br />
up to €500 million against cash or contribution in kind with<br />
the approval of the Supervisory Board through May 1,<br />
2009. The Board of Executive Directors is empowered to<br />
decide on the exclusion of shareholders’ subscription<br />
rights for these new shares.<br />
Capital surplus<br />
Capital surplus includes share premiums from the issuance<br />
of shares, the fair value of options and negative goodwill<br />
from the capital consolidation resulting from acquisitions of<br />
subsidiaries in exchange for the issue of <strong>BASF</strong> shares at<br />
par value.
Capital structure management<br />
The goal of capital structure management is to maintain<br />
the financial flexibility needed to continually develop our<br />
business portfolio and take advantage of strategic opportunities.<br />
The objectives of our financing policy are to<br />
ensure liquidity, limit financial risks and optimize capital<br />
costs by means of an appropriate capital structure. The<br />
capital structure is orientated to the needs of the operational<br />
business and the company’s strategic direction.<br />
18 -- RETAinEd EARningS And OThER COmPREhEnSivE inCOmE<br />
Million € <strong>2008</strong> 2007<br />
Legal reserves 420 354<br />
Other retained earnings 12,830 14,201<br />
13,250 14,556<br />
Changes in the scope of consolidation led to no changes<br />
in the legal reserves in <strong>2008</strong>. In 2007, there was an<br />
increase of €3 million. Transfers from other retained earnings<br />
increased legal reserves by €66 million in <strong>2008</strong> and<br />
€40 million in 2007.<br />
The acquisition of stakes in companies which <strong>BASF</strong><br />
controls are treated as transactions between shareholders.<br />
In <strong>2008</strong>, minority interests were acquired in <strong>BASF</strong> India<br />
Ltd., Mumbai, India, <strong>BASF</strong> Construction Chemicals Central<br />
Asia LLP, Almati, Kazakhstan, and OOO <strong>BASF</strong> Stroitelnye<br />
Sistemy, Moscow, the Russian Federation. In addition, a<br />
40% stake in Svalöf Weibull AB, Svalöv, Sweden (which<br />
had been accounted for using the equity method), was<br />
swapped with Svenska Lantmännen for the 15% stake in<br />
<strong>BASF</strong> Plant Science GmbH, Ludwigshafen. The amount<br />
resulting from the difference between the acquisition price/<br />
value of the shares given and the proportionate value of<br />
the net assets received of €105 million was netted against<br />
retained earnings.<br />
In 2007, the effect of applying the fair value option to<br />
the asset swap with Gazprom resulted in an excess of<br />
€634 million which was recognized in retained earnings.<br />
The offsetting of actuarial gains and losses resulted<br />
in a decrease in retained earnings of €637 million in <strong>2008</strong><br />
and €92 million in 2007.<br />
COnSOlidATEd FinAnCiAl STATEmEnTS<br />
Notes<br />
Capital structure management at <strong>BASF</strong> is in line with the<br />
definition of stockholders’ equity. We plan and control<br />
the capital structure of <strong>BASF</strong> using selected financial<br />
ratios, within the framework of our financial management.<br />
The stockholders’ equity as reported on the balance sheet<br />
amounted to €18,722 million as of December 31, <strong>2008</strong><br />
(December 31, 2007: €20,098 million). The equity ratio<br />
amounted to 36.8% on December 31, <strong>2008</strong> (December 31,<br />
2007: 42.9%).<br />
Other comprehensive income<br />
According to IFRS, certain expenses and income have<br />
been recorded in ‘other comprehensive income’. This<br />
includes translation adjustments, the valuation of securities<br />
at fair value, changes in the fair value of derivatives held to<br />
hedge future cash flows and effects from the revaluation<br />
of assets and liabilities on takeover. In 2007, there was an<br />
effect from the revaluation following the purchase of the<br />
remaining 50% stake in <strong>BASF</strong> GE Schwarzheide GmbH &<br />
Co. KG of €12 million.<br />
Translation adjustments<br />
The translation adjustments due to the use of the current<br />
rate method are shown under currency translations adjustments<br />
as a component of other comprehensive income in<br />
equity (translation adjustments) and are recognized in<br />
income only upon the disposal of a company.<br />
valuation of securities at fair value<br />
Changes in value of available-for-sale securities are<br />
accounted for in other comprehensive income, without<br />
impacting the income statement, until the securities are<br />
disposed of. Upon disposal, the changes accumulated in<br />
other comprehensive income are recognized in income.<br />
<strong>BASF</strong> REPORT <strong>2008</strong><br />
199
200<br />
COnSOlidATEd FinAnCiAl STATEmEnTS<br />
Notes<br />
19 -- minORiTy inTERESTS<br />
Group company Partner<br />
WINGAS GmbH & Co. KG,<br />
Kassel, Germany<br />
Wintershall AG,<br />
Kassel, Germany<br />
Yangzi-<strong>BASF</strong> Styrenics Co. Ltd.,<br />
Nanjing, China<br />
<strong>BASF</strong> India Ltd.,<br />
Mumbai, India<br />
<strong>BASF</strong> PETRONAS Chemicals Sdn. Bhd.,<br />
Subang Jaya, Malaysia<br />
<strong>BASF</strong> Sonatrach PropanChem S.A.,<br />
Tarragona, Spain<br />
<strong>BASF</strong> Fina Petrochemicals L.P.,<br />
Port Arthur, Texas<br />
Shanghai <strong>BASF</strong> Polyurethane Company,<br />
Shanghai, China<br />
In addition to state pension plans, most employees are<br />
entitled to Company pension benefits from either defined<br />
contribution or defined benefit plans. Benefits generally<br />
depend on years of service, contributions or compensation,<br />
and take into consideration the legal framework of labor, tax<br />
and social security laws of the countries where companies<br />
are located. To control the risks of changing market conditions,<br />
as well as increasing life-expectancies, over the last<br />
few years new employees have been increasingly offered<br />
defined contribution plans.<br />
For <strong>BASF</strong> SE and other German subsidiaries, a basic<br />
level of benefits is provided by the legally independent<br />
funded plan, <strong>BASF</strong> Pensionskasse VVaG, which is financed<br />
by contributions of employees and the Company and the<br />
return on its assets. <strong>BASF</strong> SE will ensure the necessary contributions<br />
to adequately finance the benefits promised by<br />
<strong>BASF</strong> Pensionskasse VVaG. In mid-2004, the defined benefit<br />
plan of <strong>BASF</strong> Pensionskasse VVaG was closed for new hired<br />
<strong>BASF</strong> REPORT <strong>2008</strong><br />
Gazprom Group,<br />
Moscow, Russia<br />
Gazprom Group,<br />
Moscow, Russia<br />
Yangzi Petrochemical<br />
Corp. Ltd., Nanjing, China<br />
Shares are publicly trated<br />
PETRONAS (Petroliam<br />
Nasional Bhd.),<br />
Kuala Lumpur, Malaysia<br />
SONATRACH, Algier, Algeria<br />
Total Petrochemicals Inc.,<br />
Houston, Texas<br />
Shanghai Hua Yi (Group) Company,<br />
Shanghai, China, and Sinopec<br />
Shanghai Gao Qiao Petrochemical<br />
Corporation, Shanghai, China<br />
<strong>2008</strong> 2007<br />
Equity stake<br />
(%) million €<br />
49.98<br />
49.00<br />
40.00<br />
28.82<br />
362<br />
177<br />
41<br />
25<br />
Equity stake<br />
(%) Million €<br />
Other 90 54<br />
1,151 971<br />
20 -- PROviSiOnS FOR PEnSiOnS And SimilAR OBligATiOnS<br />
40.00<br />
49.00<br />
40.00<br />
30.00<br />
145<br />
60<br />
161<br />
90<br />
49.98<br />
49.00<br />
40.00<br />
47.31<br />
40.00<br />
49.00<br />
40.00<br />
30.00<br />
employees and a new defined contribution plan was introduced.<br />
Additional occupational pension commitments at<br />
German Group companies are financed almost exclusively<br />
via pension provisions.<br />
In the case of non-German subsidiaries, pension benefits<br />
are covered in some cases by pension provisions, but mainly<br />
by external insurance companies or pension funds.<br />
The measurement date for the pension plans is set as<br />
December 31. The most recent actuarial mortality tables are<br />
used.<br />
269<br />
152<br />
44<br />
32<br />
152<br />
57<br />
147<br />
64
COnSOlidATEd FinAnCiAl STATEmEnTS<br />
Notes<br />
The valuations using the projected unit credit method per IAS 19 were carried out under the following assumptions:<br />
Assumptions used to determine the defined benefit obligation as of december 31<br />
(weighted average in %)<br />
The assumptions used to ascertain the defined benefit<br />
obligation as of December 31, are used in the following<br />
year to determine the expenses for pension plans.<br />
Similar obligations refer to commitments by <strong>BASF</strong><br />
North American Group companies to provide for the costs<br />
of medical and life insurance benefits for employees and<br />
eligible dependents after retirement. They are based upon<br />
an actuarial valuation, considering the future cost trend<br />
and a discount rate of 6.0% in <strong>2008</strong> (2007: 6.25%).<br />
The assumptions regarding the overall expected longterm<br />
rate of return are based on forecasts of expected<br />
individual asset class returns and the desired portfolio<br />
structure. The forecasts are based on long-term historical<br />
average returns and take into consideration the current<br />
yield level and the inflation trend. In <strong>2008</strong>, the discount rate<br />
used in this calculation was adjusted to account for<br />
developments in the capital markets.<br />
Germany Foreign<br />
<strong>2008</strong> 2007 <strong>2008</strong> 2007<br />
Discount rate 6.00 5.25 5.84 5.82<br />
Projected increase of wages and salaries 2.75 2.75 4.37 4.50<br />
Projected pension increase 2.00 2.00 0.57 0.68<br />
Assumptions used to determine expenses for pension plans<br />
(weighted average in %)<br />
Germany Foreign<br />
<strong>2008</strong> 2007 <strong>2008</strong> 2007<br />
Discount rate 5.25 4.50 5.82 5.31<br />
Projected increase of wages and salaries 2.75 2.50 4.50 4.46<br />
Projected pension increase 2.00 1.75 0.68 0.56<br />
Expected return on plan assets 5.18 4.93 7.20 7.35<br />
The target asset allocation has been defined by using<br />
asset liability studies and is reviewed regularly. Accordingly,<br />
plan assets are aligned with long-term pension<br />
liabilities, taking into consideration investment risks and<br />
adherence to government regulations. The existing portfolio<br />
structure is oriented towards the target asset allocation.<br />
In addition, current market views are taken into<br />
consideration. In order to mitigate risks and maximize<br />
returns, a widely spread global portfolio of individual<br />
asset classes is held.<br />
Portfolio structure of plan assets (%)<br />
Target<br />
allocation Share of plan assets<br />
2009 <strong>2008</strong> 2007<br />
Shares 29 22 30<br />
Bonds 60 66 60<br />
Property 4 4 3<br />
Other 7 8 7<br />
Total 100 100 100<br />
<strong>BASF</strong> REPORT <strong>2008</strong><br />
201
202<br />
COnSOlidATEd FinAnCiAl STATEmEnTS<br />
Notes<br />
development of defined benefit obligation (million €)<br />
development of plan assets (million €)<br />
On December 31, <strong>2008</strong>, plan assets contained securities<br />
issued by <strong>BASF</strong> Group companies with a market value of<br />
€10 million (December 31, 2007: €16 million). The market<br />
value of the properties of legally independent pension<br />
funds rented to <strong>BASF</strong> Group companies amounted to<br />
€51 million both on December 31, <strong>2008</strong> and 2007.<br />
Reconciliation of funded status to provisions for pensions and similar obligations (million €)<br />
<strong>BASF</strong> REPORT <strong>2008</strong><br />
<strong>2008</strong> 2007<br />
Defined benefit obligation as of January 1 11,914 12,693<br />
Service cost 243 270<br />
Interest cost 630 588<br />
Benefits paid (637) (660)<br />
Participants’ contributions 40 41<br />
Actuarial gains (874) (722)<br />
Settlements and other plan changes 42 .<br />
Exchange differences 12 (296)<br />
defined benefit obligation as of december 31 11,370 11,914<br />
<strong>2008</strong> 2007<br />
Plan assets as of January 1 12,012 12,079<br />
Expected return on plan assets 675 660<br />
Actuarial losses (2,159) (119)<br />
Employer contributions 119 131<br />
Participants’ contributions 40 41<br />
Benefits paid (443) (516)<br />
Other changes 58 6<br />
Exchange differences 11 (270)<br />
Plan assets as of december 31 10,313 12,012<br />
No material transactions took place between the legally<br />
independent pension funds and <strong>BASF</strong> Group companies in<br />
<strong>2008</strong>.<br />
<strong>2008</strong> 2007<br />
Plan assets as of December 31 10,313 12,012<br />
Less defined benefit obligation as of December 31 11,370 11,914<br />
Funded status of pension plans (1,057) 98<br />
Unrecognized past service cost . .<br />
Asset ceiling in accordance with IAS 19.58 (34) (538)<br />
Provisions for similar obligations (456) (436)<br />
net obligation recognized on the balance sheet (1,547) (876)<br />
Thereof defined benefit assets 165 417<br />
Thereof provisions for pensions (1,256) (857)<br />
Thereof provisions for similar obligations (456) (436)
The change in the asset ceiling is primarily attributable to the<br />
reduction in the funded status at <strong>BASF</strong> Pensionskasse<br />
VVaG. Actuarial gains and losses are recognized directly in<br />
retained earnings in the reporting period in which they occur.<br />
Past service costs are amortized over the average service<br />
period of the entitled employees until the benefits become<br />
Current funding situation of the plans (million €)<br />
COnSOlidATEd FinAnCiAl STATEmEnTS<br />
Notes<br />
vested. Actuarial losses of €1,285 million in <strong>2008</strong> and actuarial<br />
gains of €583 million in 2007 were recognized in<br />
retained earnings. Since the introduction of this accounting<br />
policy, a total actuarial loss of €1,983 million has been<br />
charged against retained earnings, not taking deferred taxes<br />
into account.<br />
<strong>2008</strong> 2007<br />
defined benefit<br />
obligation Plan assets<br />
Defined benefit<br />
obligation Plan assets<br />
Unfunded pension plans 611 – 643 –<br />
Partially funded pension plans 2,803 2,158 2,495 2,340<br />
Total of pension plans that are not fully funded 3,414 2,158 3,138 2,340<br />
Fully funded pension plans 7,956 8,155 8,776 9,672<br />
deviation between actuarial assumptions and the actual development (million €)<br />
11,370 10,313 11,914 12,012<br />
<strong>2008</strong> 2007 2006 2005 2004<br />
Defined benefit obligation 11,370 11,914 12,693 11,908 9,814<br />
Thereof impact of experience adjustments 36 (138) (59) 20 23<br />
Plan assets 10,313 12,012 12,079 11,015 6,204<br />
Thereof impact of experience adjustments (2,159) (119) 159 438 193<br />
Funded status (1,057) 98 (615) (892) (3,610)<br />
Expected payments resulting from pension obligations existing as of december 31, <strong>2008</strong> (million €)<br />
2009 628<br />
2010 678<br />
2011 689<br />
2012 696<br />
2013 736<br />
2014 through 2018 4,241<br />
<strong>BASF</strong> REPORT <strong>2008</strong><br />
203
204<br />
COnSOlidATEd FinAnCiAl STATEmEnTS<br />
Notes<br />
Composition of expenses for pension plans (million €)<br />
<strong>2008</strong> 2007<br />
Service cost 243 270<br />
Amortization of past service cost . 8<br />
Settlement gains (23) (3)<br />
Expenses for similar obligations 4 6<br />
Expenses for defined benefit plans charged to income from operations 224 281<br />
Interest cost 630 588<br />
Expected return on plan assets (675) (660)<br />
Expenses for similar obligations 23 25<br />
income from defined benefit plans in the financial result (22) (47)<br />
Expenses for defined contribution plans charged to income from operations 86 78<br />
Expenses for pension plans 288 312<br />
In <strong>2008</strong>, contributions to public pension plans were<br />
€392 million (2007: €364 million).<br />
21 -- OThER PROviSiOnS<br />
Million €<br />
Recultivation obligations relate to the estimated costs<br />
for the filling of wells and the removal of production<br />
equipment after the end of production.<br />
Environmental protection and remediation costs<br />
concern expected costs for rehabilitating contaminated<br />
sites, recultivating landfills, removal of environmental<br />
contamination at existing production or storage sites and<br />
other measures.<br />
<strong>BASF</strong> REPORT <strong>2008</strong><br />
The estimated contribution payments for defined benefit<br />
plans for 2009 are €126 million.<br />
<strong>2008</strong> 2007<br />
Thereof<br />
Thereof<br />
Total<br />
short-term Total<br />
short-term<br />
Recultivation obligations 796 1 703 4<br />
Environmental protection and remediation costs 377 132 255 31<br />
Personnel costs 1,369 947 1,756 1,091<br />
Sales and purchase risks 1,282 1,264 1,033 997<br />
Restructuring measures 105 83 79 62<br />
Legal, damage claims, guarantees and related commitments 164 83 156 81<br />
Other 1,707 533 1,730 431<br />
5,800 3,043 5,712 2,697<br />
The increase in short-term provisions for environmental<br />
protection resulted chiefly from the allocation of emission<br />
certificates from the German Emissions Trading Authority<br />
or other similar bodies in the European Union.
The personnel cost provision includes obligations for the<br />
granting of long-service bonuses and anniversary payments,<br />
variable compensation including related social<br />
security contributions, and other accruals as well as provisions<br />
for early retirement programs for employees nearing<br />
retirement. <strong>BASF</strong>’s German Group companies have<br />
various programs that entitle employees who are at least<br />
55 years old to reduce their working hours to 50% for up<br />
to 8 years.<br />
Under such arrangements, employees generally work<br />
full time during the first half of the transition period and<br />
leave the Company at the start of the second half.<br />
Employees receive a minimum 85% of their net salary<br />
throughout the transition period.<br />
The reduction in the personnel cost provision is<br />
primarily due to lower provisions for the <strong>BASF</strong> option<br />
program and variable compensation.<br />
The sales and purchase risks provision includes<br />
warranties, product liability, customer rebates, payment<br />
discounts and other price reductions, sales commissions<br />
and provisions for expected losses on committed purchases<br />
as well as provisions for onerous contracts.<br />
development of other provisions in <strong>2008</strong> (million €)<br />
January 1, <strong>2008</strong> Additions<br />
COnSOlidATEd FinAnCiAl STATEmEnTS<br />
Notes<br />
Interest<br />
compounding Utilization Reversals Other changes Dec. 31, <strong>2008</strong><br />
Recultivation obligations 703 58 11 (19) (20) 63 796<br />
Environmental protection<br />
and remediation costs<br />
255<br />
191<br />
Personnel costs 1,756 828 25 (979) (214) (47) 1,369<br />
Sales and purchase risks 1,033 1,541 1 (1,232) (117) 56 1,282<br />
Restructuring measures 79 85 – (25) (28) (6) 105<br />
Legal, damage claims,<br />
guarantees and related<br />
commitments<br />
156<br />
33<br />
2<br />
5<br />
Restructuring costs provisions include severance payments<br />
to employees as well as specific site shutdowns or<br />
restructuring costs, including the costs for demolition and<br />
similar measures.<br />
The increase resulted from restructuring measures in<br />
<strong>2008</strong>, primarily for severance payments.<br />
Provisions for legal, damage claims, guarantees<br />
and related commitments include the expected costs of<br />
litigation, obligations under damage claims, other guarantees<br />
and antitrust proceedings.<br />
Others include long-term tax provisions. The reversal<br />
in <strong>2008</strong> was justified by the reassessment of provisions<br />
for previous years.<br />
Other changes relate primarily to currency effects<br />
and the transfer to liabilities of obligations that have<br />
become more concrete as to the amount and timing. In<br />
addition, changes in the scope of consolidation led to<br />
an increase in provisions.<br />
Other 1,730 518 3 (376) (179) 11 1,707<br />
5,712 3,254 47 (2,702) (585) 74 5,800<br />
(61)<br />
(10)<br />
(13)<br />
(14)<br />
3<br />
(6)<br />
377<br />
164<br />
<strong>BASF</strong> REPORT <strong>2008</strong><br />
205
206<br />
COnSOlidATEd FinAnCiAl STATEmEnTS<br />
Notes<br />
22 -- liABiliTiES<br />
Financial indebtedness (million €)<br />
Breakdown of financial liabilities by currency (million €)<br />
<strong>BASF</strong> REPORT <strong>2008</strong><br />
<strong>2008</strong> 2007<br />
Euro 7,876 5,741<br />
U.S. dollar 5,598 3,855<br />
Chinese renminbi 436 355<br />
Swiss franc 335 –<br />
Brazilian real 67 76<br />
Norwegian krone 54 –<br />
Turkish lira 39 12<br />
Other 109 63<br />
maturities of financial liabilities (million €)<br />
14,514 10,102<br />
<strong>2008</strong> 2007<br />
Following year 1 6,224 3,148<br />
Following year 2 1,027 609<br />
Following year 3 1,401 1,334<br />
Following year 4 1,418 1,019<br />
Following year 5 1,999 1,589<br />
Following year 6 and thereafter 2,445 2,403<br />
14,514 10,102<br />
Nominal volume<br />
Carrying amounts based on effective<br />
interest method<br />
Effective interest<br />
rate <strong>2008</strong> 2007<br />
3.5% Euro Bond 2003/2010 of <strong>BASF</strong> SE 1,000 3.63% 998 997<br />
3.375% Euro Bond 2005/2012 of <strong>BASF</strong> SE 1,400 3.42% 1,398 1,397<br />
4% Euro Bond 2006/2011 of <strong>BASF</strong> SE 1,000 4.05% 999 999<br />
4.5% Euro Bond 2006/2016 of <strong>BASF</strong> SE 500 4.62% 496 496<br />
3 Month EURIBOR Bond 2006/2009 of <strong>BASF</strong> SE 500 variable 500 500<br />
3.25% CHF Bond <strong>2008</strong>/2011 of <strong>BASF</strong> Finance Europe N.V. 300 3.39% 201 –<br />
3.625% CHF Bond <strong>2008</strong>/2015 of <strong>BASF</strong> Finance Europe N.V. 200 3.77% 134 –<br />
5% Euro Bond 2007/2014 of <strong>BASF</strong> Finance Europe N.V. 1,000 5.09% 996 996<br />
5% Euro Bond 2007/2014 of <strong>BASF</strong> Finance Europe N.V. 250 4.83% 252 253<br />
6% Euro Bond <strong>2008</strong>/2013 of <strong>BASF</strong> Finance Europe N.V. 1,250 6.15% 1,242 –<br />
USD Extendible Floating Rate Notes of <strong>BASF</strong> Finance Europe N.V. 4.51% 330 917<br />
Other bonds 621 548<br />
USD Commercial Papers 6,140 4,406 1,878<br />
Bonds and other liabilities to the capital markets 12,573 8,981<br />
Liabilities to credit institutions 1,941 1,121<br />
14,514 10,102<br />
Bonds and other liabilities to the capital markets<br />
Other bonds consist primarily of bonds from <strong>BASF</strong><br />
Catalyst LLC and industrial revenue and pollution control<br />
bonds from the <strong>BASF</strong> Corporation Group that are used to<br />
finance investments in the United States. The weightedaverage<br />
interest rate was 3.1% in <strong>2008</strong> (2007: 3.8%). The<br />
weighted-average effective interest rate was 3.1% in <strong>2008</strong><br />
(2007: 3.9%).The average residual term amounted to<br />
189 months as of December 31, <strong>2008</strong>, and 205 months<br />
as of December 31, 2007.<br />
liabilities to credit institutions<br />
Liabilities to credit institutions relate to a large number of<br />
different credit institutions in various countries. Liabilities to<br />
credit institutions denominated in renminbi and Turkish lira<br />
resulted from the local financing of investments in China<br />
and Turkey.<br />
<strong>BASF</strong> SE had committed and unused credit lines with<br />
variable interest rates of €6,668 million as of December 31,<br />
<strong>2008</strong>, and €4,076 million as of December 31, 2007.
Additional uncommitted credit lines of <strong>BASF</strong> SE amounted to<br />
€90 million as of December 31, <strong>2008</strong>, and €227 million as of<br />
December 31, 2007 – these are free of any commitment fees.<br />
The weighted-average interest rate on borrowings was 5.3%<br />
in <strong>2008</strong> (2007: 6.2%).<br />
Other liabilities<br />
The increase in other liabilities in <strong>2008</strong> related primarily to the<br />
negative fair value of derivatives, concluded to hedge currency<br />
fluctuations and rising raw material prices. On the other<br />
hand, there are derivatives with positive fair values in other<br />
receivables.<br />
Other liabilities (million €)<br />
COnSOlidATEd FinAnCiAl STATEmEnTS<br />
Notes<br />
<strong>2008</strong> 2007<br />
Short-term long-term Short-term Long-term<br />
Advances received on orders 116 – 111 –<br />
Liabilities on bills 11 27 11 5<br />
Liabilities related to social security 151 16 148 17<br />
Non-trade liabilities to joint venture partners 334 344 269 457<br />
Derivative instruments 1,414 1 88 3<br />
Liabilities arising from finance leases 15 65 23 73<br />
Miscellaneous liabilities 1,255 301 1,191 184<br />
Deferred income 138 163 135 162<br />
Secured liabilities (million €)<br />
3,434 917 1,976 901<br />
<strong>2008</strong> 2007<br />
Liabilities to credit institutions 35 9<br />
Miscellaneous liabilities 504 15<br />
On December 31, <strong>2008</strong>, material margins had to be provided<br />
for derivatives with negative fair values. Derivatives<br />
with negative fair values are reported under other liabilities<br />
Liabilities to companies in which participations are held<br />
include the proportionate amount of liabilities of joint venture<br />
companies accounted for using the proportional consolidation<br />
method of €242 million in <strong>2008</strong> and €173 million in 2007.<br />
Further other liabilities relating to associated companies<br />
accounted for using the equity or cost method were<br />
€224 million in <strong>2008</strong> and €221 million in 2007. In addition,<br />
other liabilities contained precious metal derivatives with a<br />
negative fair value of €39 million as of the balance sheet<br />
date <strong>2008</strong>.<br />
more information on financial risks and derivative financial instruments is<br />
available in note 26 from page 212 onward<br />
more information on finance lease payables is available in note 27 from page<br />
218 onward<br />
539 24<br />
in the balance sheet. Liabilities to credit institutions are<br />
secured primarily with registered land charges. There are<br />
no secured contingent liabilities.<br />
<strong>BASF</strong> REPORT <strong>2008</strong><br />
207
208<br />
COnSOlidATEd FinAnCiAl STATEmEnTS<br />
Notes<br />
23 -- COnTingEnT liABiliTiES And OThER FinAnCiAl OBligATiOnS<br />
The contingencies listed below are stated at nominal value:<br />
Contingent liabilities (million €)<br />
<strong>BASF</strong> REPORT <strong>2008</strong><br />
<strong>2008</strong> 2007<br />
Bills of exchange 4 13<br />
Thereof to affiliated companies – –<br />
Guarantees 788 374<br />
Thereof to affiliated companies 62 60<br />
Warranties 84 68<br />
Granting collateral on behalf of third-party liabilities 18 20<br />
The increase in liabilities from guarantees is due to the financial guarantee given in <strong>2008</strong> for the financing of<br />
OAO Severneftegazprom.<br />
Other financial obligations (million €)<br />
894 475<br />
<strong>2008</strong> 2007<br />
Construction in progress 4,753 4,974<br />
Thereof purchase commitments 803 983<br />
Thereof for the purchase of intangible assets 99 24<br />
Obligation arising from long-term leases (excluding financing leases) 1,449 1,272<br />
Payment and loan commitments and other financial obligations 1,803 7<br />
Payment and loan commitments and other financial obligations<br />
in <strong>2008</strong> of €1,797 million are related to the purchase<br />
of shares in Ciba Holding AG as part of the public tender<br />
for that company.<br />
more information is available in note 2 from page 170 onward<br />
8,005 6,253<br />
Property, plant and equipment used under long-term<br />
leases<br />
Property, plant and equipment used under long-term<br />
leases primarily concern buildings and IT infrastructure.<br />
more information can be found in note 27 from page 218 onward<br />
Obligations from long-term rental and lease contracts<br />
(excluding financing leases) (million €)<br />
2009 280<br />
2010 199<br />
2011 160<br />
2012 136<br />
2013 118<br />
2014 and thereafter 556<br />
1,449
Purchase obligations from long-term natural gas and<br />
raw material supply contracts<br />
The Company has entered into long-term purchase contracts<br />
for natural gas in the Natural Gas Trading business<br />
sector, which are subject to continual price adjustments.<br />
These purchase obligations relate to long-term supply<br />
contracts with customers with terms between one and<br />
twenty years. The increase in purchase commitments<br />
compared with 2007 was due primarily to contract extensions<br />
and higher expected purchasing costs.<br />
24 -- RiSkS FROm liTigATiOn And ClAimS<br />
Since 2005, several class action lawsuits, among others,<br />
against <strong>BASF</strong> SE and <strong>BASF</strong> Corporation have been filed at<br />
U.S. courts. It was alleged that sales of TDI, MDI and<br />
polyether polyols had violated antitrust laws on price<br />
fixing. <strong>BASF</strong> is defending itself against these lawsuits. At<br />
the end of 2007, the U.S. Department of Justice ceased an<br />
inquiry on alleged price fixing.<br />
<strong>BASF</strong> Corporation, Bayer Corporation and Bayer Crop-<br />
Science Corporation have been sued by a number of<br />
plaintiffs for damages because of alleged price fixing in the<br />
distribution of the termiticides Premise ® (Bayer) and Termidor<br />
® (<strong>BASF</strong>) in the United States. The plaintiffs contend<br />
that <strong>BASF</strong> and Bayer have each engaged in unlawful resale<br />
price maintenance resulting in overcharges to plaintiff<br />
purchasers who are professionals in termite control. The<br />
plaintiffs are suing for trebled damages of US$600 million.<br />
<strong>BASF</strong> maintains that its pricing was lawful because its<br />
sales were through agency agreements rather than through<br />
distributors and therefore the claims are without merit. The<br />
court dismissed the action on July 13, 2007. The plaintiffs<br />
have appealed against this decision. A decision on the<br />
appeal has not been made.<br />
COnSOlidATEd FinAnCiAl STATEmEnTS<br />
Notes<br />
The Company purchases raw materials, both on the basis<br />
of long-term contracts and on spot markets. The fixed<br />
purchase obligations of long-term purchase contracts with<br />
a remaining term of more than one year as of December<br />
31, <strong>2008</strong>, are as follows:<br />
Purchase obligations from natural gas and raw material<br />
supply contracts (million €)<br />
2009 11,999<br />
2010 8,324<br />
2011 7,780<br />
2012 7,467<br />
2013 6,777<br />
2014 and thereafter 111,385<br />
153,733<br />
In addition, <strong>BASF</strong> SE and its affiliated companies are<br />
defendants in or parties to further judicial and arbitrational<br />
proceedings. Based on the current state of knowledge<br />
these proceedings will have no material influence on the<br />
economic situation of <strong>BASF</strong>.<br />
<strong>BASF</strong> REPORT <strong>2008</strong><br />
209
210<br />
COnSOlidATEd FinAnCiAl STATEmEnTS<br />
Notes<br />
25 -- STOCk PRiCE-BASEd COmPEnSATiOn PROgRAm And <strong>BASF</strong> inCEnTivE ShARE<br />
PROgRAm<br />
Stock price-based compensation program<br />
In <strong>2008</strong>, <strong>BASF</strong> continued the <strong>BASF</strong> option program (BOP)<br />
for senior executives of the <strong>BASF</strong> Group. This program<br />
has existed since 1999. Approximately 1,000 senior<br />
executives, including the Board of Executive Directors,<br />
are currently entitled to participate in this program. The<br />
options are settled in cash when exercised.<br />
To participate in the <strong>BASF</strong> option program, each<br />
participant must hold as a personal investment <strong>BASF</strong><br />
shares in the amount of 10% to 30% of his or her individual<br />
variable compensation. The number of shares to be<br />
held is determined by the amount of variable compensation<br />
designated by the participant and the weighted-average<br />
market price for <strong>BASF</strong> shares on the first business<br />
day after the <strong>Annual</strong> Meeting, which was €45.21 on April<br />
25, <strong>2008</strong> (base price after the stock split).<br />
For each <strong>BASF</strong> share held as an individual investment,<br />
a participant receives four options. Each option consists<br />
of two parts, right A and right B, which may be exercised<br />
if defined thresholds have been met: The threshold of<br />
right A is met if the price of the <strong>BASF</strong> share has increased<br />
by more than 30% in comparison to the base price (absolute<br />
threshold). The value of right A will be the difference<br />
between the market price of <strong>BASF</strong> shares at the exer cise<br />
date and the base price; it is limited to 100% of the base<br />
price. Right B may be exercised if the cumulative percentage<br />
performance of <strong>BASF</strong> shares exceeds (relative threshold)<br />
the percentage performance of the MSCI World<br />
Chemicals Index SM (MSCI Chemicals). The value of right B<br />
will be the base price of the option multiplied by twice the<br />
percentage outperformance of <strong>BASF</strong> shares compared to<br />
the MSCI Chemicals index on the exercise date. It is<br />
limited to the closing price on the date of exercise minus<br />
computed nominal value of <strong>BASF</strong> shares. Shares of the<br />
Fair value and parameters used 1<br />
<strong>BASF</strong> REPORT <strong>2008</strong><br />
<strong>BASF</strong> option program of the year<br />
<strong>2008</strong> 2007<br />
Fair value € 7.19 20.50<br />
Dividend yield % 7.03 2.96<br />
Risk-free interest rate % 2.92 4.33<br />
Volatility <strong>BASF</strong> shares % 24.61 21.67<br />
Volatility MSCI Chemicals % 18.91 15.44<br />
Correlation <strong>BASF</strong> share price: MSCI Chemicals % 84.80 83.27<br />
1 It is assumed that the options will be exercised based upon the potential gains.<br />
individual investment must be held for at least two years<br />
following the granting of the options. The options were<br />
granted on July 1, <strong>2008</strong>, and may be exercised following<br />
a two-year vesting period, between July 1, 2010, and<br />
June 30, 2016. During the exercise period, it is not possible<br />
to exercise options during certain periods (closed<br />
periods). Each option right may only be exercised if the<br />
performance targets are achieved and may only be exercised<br />
once, meaning that if only one performance target<br />
is met and that option is exercised, the other option right<br />
lapses. The maximum gain for a participant from the BOP<br />
program is limited to 10 times the original individual<br />
investment. Option rights are forfeited if the option holders<br />
no longer work for <strong>BASF</strong> or have sold part of their<br />
individual investment before the two-year holding period.<br />
They remain valid in the case of retirement.<br />
The option programs BOP 2001 to 2007 were structured<br />
in a similar way to BOP <strong>2008</strong>.<br />
The benchmark index used to determine the value of<br />
right B for BOP 2001 to 2004 is the Dow Jones Chemicals<br />
Total Return Index (DJ Chemicals). This index was<br />
replaced by the MSCI Chemicals starting with the option<br />
program 2005. The MSCI Chemicals is a global industry<br />
index for the chemical industry that measures the performance<br />
of the companies contained within it in their<br />
respective local currencies, which significantly reduces<br />
currency effects.<br />
The model used in the valuation of the option plans<br />
is based on the arbitrage-free valuation model according<br />
to Black-Scholes.<br />
Due to the complexity of the option programs, a<br />
numerical solution method was used (Monte Carlo<br />
simulation).
The fair values and the valuation parameters relate to the<br />
option programs <strong>2008</strong> and 2007. For the option programs<br />
from preceding years, corresponding fair values were<br />
computed and valuation parameters were used.<br />
The number of options granted amounted to<br />
2,859,472 in <strong>2008</strong> and 3,080,808 1 in 2007.<br />
Volatility was determined on the basis of the monthly<br />
closing prices over a historical period corresponding to<br />
the remaining term of the options.<br />
As a result of a resolution by the Board of Executive<br />
Directors in 2002, to settle options in cash, options outstanding<br />
as of December 31, <strong>2008</strong>, from the BOP 2001 to<br />
<strong>2008</strong> were valued with the fair value as of the balance<br />
sheet date as of December 31, <strong>2008</strong>. This amount is<br />
accrued as a provision over the respective vesting period.<br />
This provision declined due to lower fair values from<br />
€239 million as of December 31, 2007, to €80 million as<br />
of December 31, <strong>2008</strong>. The reversal of the provision led to<br />
income of €112 million, which reduces personnel costs.<br />
The utilization of provisions amounted to €47 million. In<br />
2007, personnel costs from the <strong>BASF</strong> option program<br />
amounted to €235 million.<br />
The total intrinsic value of exercisable options<br />
amounted to €47 million as of December 31, <strong>2008</strong>, and<br />
€141 million as of December 31, 2007.<br />
1 The number of options were adjusted retroactively for the two-for-one stock<br />
split conducted in the second quarter of <strong>2008</strong>.<br />
<strong>BASF</strong> incentive share program<br />
In 1999, <strong>BASF</strong> started an incentive share program called<br />
“Plus” for all eligible employees except the senior executives<br />
entitled to participate in the BOP. Currently, employees<br />
of German and of various European and Mexican subsidiaries<br />
are entitled to participate in the program. Each<br />
participant must make an individual investment in <strong>BASF</strong><br />
shares from his or her variable compensation. For every<br />
ten <strong>BASF</strong> shares purchased in the program, a participant<br />
receives one <strong>BASF</strong> share at no cost after one, three, five,<br />
seven and ten years of holding the <strong>BASF</strong> shares. The first<br />
ten shares entitle the participant to receive one <strong>BASF</strong><br />
share at no extra cost for each year for the next ten years.<br />
The right to receive free <strong>BASF</strong> shares lapses if a participant<br />
sells the individual investment in <strong>BASF</strong> shares, if the<br />
participant stops working for the Company or one year<br />
after retirement.<br />
COnSOlidATEd FinAnCiAl STATEmEnTS<br />
Notes<br />
The number of free shares to be granted developed as<br />
follows:<br />
number of free shares to be granted<br />
<strong>2008</strong> 2007 2<br />
As of January 1 2,899.824 2,846.564<br />
Newly acquired entitlements 681,770 607,300<br />
Bonus shares issued (429,284) (403,960)<br />
Lapsed entitlements (98,206) (150,080)<br />
As of december 31 3,054.104 2,899.824<br />
2 The number of free shares to be granted were adjusted retroactively for the<br />
two-for-one stock split conducted in the second quarter of <strong>2008</strong>.<br />
The free shares to be provided by the company are valued at<br />
the fair value on the grant date. Fair value is determined on<br />
the basis of the stock price of <strong>BASF</strong> shares, taking into<br />
account the present value of dividends, which are not paid<br />
during the term of the program. The weighted-average fair<br />
value at grant date amounted to €34.71 for the <strong>2008</strong> program<br />
and €36.57 for the 2007 program.<br />
The fair value of the free shares to be granted is booked<br />
through the income statement against capital surplus over<br />
the period until the shares are issued.<br />
Provisions for the costs for the 1999 to 2002 programs<br />
continue to be accrued proportionally on the basis of the<br />
<strong>BASF</strong> closing stock price.<br />
Personnel costs of €9 million were recorded in <strong>2008</strong> for<br />
the employee stock program (2007: €19 million).<br />
<strong>BASF</strong> REPORT <strong>2008</strong><br />
211
212<br />
COnSOlidATEd FinAnCiAl STATEmEnTS<br />
Notes<br />
26 -- Financial risks and derivative financial instruments<br />
market risks<br />
Foreign currency risks: Changes in exchange rates<br />
could lead to negative changes in the value of financial<br />
instruments and adverse changes in future cash flows<br />
from planned transactions. Foreign currency risks from<br />
financial instruments result for <strong>BASF</strong> from the conversion<br />
of financial receivables, loans, securities, cash, as well<br />
as financial liabilities into the functional currency of the<br />
respective Group company. Foreign currency contracts<br />
in a variety of currencies are used to hedge foreign<br />
exchange risks from primary financial instruments and<br />
planned transactions.<br />
The foreign currency risk exposure corresponds to the<br />
net amount of the nominal volume of the primary and<br />
derivative financial instruments which are exposed to<br />
currency risk. In addition, all planned purchase and sales<br />
transactions of the respective following year are included,<br />
if they fall under the currency risk management system.<br />
Opposite positions in the same currency are offset<br />
against each other. Companies whose functional currency<br />
is not the euro can be exposed to foreign currency risks<br />
arising from the euro.<br />
The sensitivity analysis is conducted by simulating a<br />
depreciation by 10% of all currencies against the respective<br />
functional currency and quantifying the effect on<br />
<strong>BASF</strong>’s income before taxes and minority interests. This<br />
sensitivity of these instruments amounted to €(244) million<br />
on December 31, <strong>2008</strong> (December 31, 2007: €(29) million).<br />
Carrying amount of non-derivative interest-bearing financial instruments (million €)<br />
<strong>BASF</strong> REPORT <strong>2008</strong><br />
Fixed interest<br />
rate<br />
Due to the use of options to hedge currency risks,<br />
the sensitivity analysis is not a linear function of the<br />
assumed changes in exchange rates.<br />
Foreign currency risk exposure (million €)<br />
<strong>2008</strong> 2007<br />
U.S. dollar (40) (120)<br />
Swiss franc 1,948 .<br />
Pound sterling 91 39<br />
Euro 158 (3)<br />
Other 85 251<br />
2,242 167<br />
interest rate risks: Interest rate risk results from changes<br />
in prevailing market interest rates, which can cause a<br />
change in the present value of fixed-rate instruments, and<br />
changes in the interest payments of variable-rate<br />
instruments. To hedge this risk, interest rate swaps and<br />
combined interest rate and currency derivatives are used.<br />
These risks are relevant to the financing activities of <strong>BASF</strong>,<br />
however, they are not of material significance for <strong>BASF</strong>’s<br />
operating activities.<br />
An increase in all relevant interest rates by one<br />
percentage point on December 31, 2007 and <strong>2008</strong>, would<br />
have lowered income before taxes and minority interests<br />
by €43 million. The sensitivity of stockholders’ equity to<br />
changes in interest rates is not material.<br />
<strong>2008</strong> 2007<br />
variable interest<br />
rate<br />
Fixed interest<br />
rate<br />
Variable interest<br />
rate<br />
Loans 98 303 628 127<br />
Securities 6 26 16 4<br />
Financial indebtedness 11,940 2,574 8,055 2,047
nominal and fair value of interest rate and combined interest and cross currency swaps (million €)<br />
<strong>2008</strong> 2007<br />
COnSOlidATEd FinAnCiAl STATEmEnTS<br />
Notes<br />
nominal value Fair value Nominal value Fair value<br />
interest rate swaps 150 (3) 296 (11)<br />
Thereof payer swaps 150 (3) 166 (10)<br />
Thereof receiver swaps – – 130 (1)<br />
Combined interest and cross currency swaps 384 31 63 (5)<br />
Thereof fixed rate 326 27 18 .<br />
Thereof variable rate 58 4 45 (5)<br />
Equity price risks: <strong>BASF</strong> holds shares in listed companies<br />
and mutual stock funds as a vehicle for investing liquid<br />
funds and, to a limited extent, with a view to taking<br />
strategic stakes in companies. They are included under<br />
participations, long-term and short-term securities, and are<br />
classified as available-for-sale in the <strong>BASF</strong> Group. A<br />
decline in all relevant stock prices by 10% would have<br />
lowered stockholders’ equity by €84 million on December<br />
31, <strong>2008</strong> (December 31, 2007: €78 million), before taking<br />
income taxes into consideration.<br />
Commodity price risks: Some of <strong>BASF</strong>’s divisions are<br />
occasionally exposed to strong fluctuations in raw material<br />
prices. These result primarily from the following raw<br />
materials: naphtha, propylene, benzene, titanium dioxide,<br />
cyclohexane, methanol, natural gas, butadiene, LPG<br />
Condensate, ammonia and precious metals. <strong>BASF</strong> takes<br />
the following measures to reduce price risks associated<br />
with the purchase of raw materials:<br />
• <strong>BASF</strong> uses commodity derivatives to hedge the risks<br />
from the volatility of raw material prices. These are<br />
primarily options and swaps on crude oil, oil products<br />
and natural gas.<br />
• In order to secure margins, the Oil & Gas segment uses<br />
commodity derivatives, primarily swaps and options, in<br />
natural gas trading. Risks to margins arise in volatile<br />
markets when purchase and sales contracts are priced<br />
differently.<br />
• The Catalysts division enters into both short-term and<br />
long-term purchase contracts with precious metal<br />
producers. It also buys precious metals on spot markets<br />
from a variety of business partners. The price risk from<br />
precious metals purchased to be sold on to third parties,<br />
or for use in the production of catalysts, are hedged<br />
using derivative instruments. Forward contracts are<br />
primarily used and they are settled by entering into<br />
offsetting contracts or by delivering the precious metals.<br />
In addition, the Catalysts division also holds limited<br />
unhedged precious metal positions, which could also include<br />
derivatives, for trading on its own account. The value<br />
of these positions is exposed to market price volatility<br />
and is subject to constant monitoring.<br />
<strong>BASF</strong> is exposed to price risk as a result of holding<br />
commodity derivatives and precious metal trading<br />
positions. The valuation of commodity derivatives and<br />
precious metal trading positions at fair value means that<br />
adverse changes in market prices could negatively affect<br />
the earnings and equity of <strong>BASF</strong>.<br />
<strong>BASF</strong> performs “Value-at-Risk” analyses for all<br />
commodity derivatives and precious metals trading<br />
positions. Using the value-at-risk analysis, we continually<br />
quantify market risk and forecast the maximum possible<br />
loss within a given confidence interval over a defined<br />
period. Our value at risk calculation is based on a<br />
confidence interval of 95% and a holding period of one<br />
day. The use of a confidence interval of 95% means that<br />
the maximum loss does not exceed the value-at-risk in a<br />
one-day period with a probability of 95%. <strong>BASF</strong> uses the<br />
variance-covariance approach.<br />
<strong>BASF</strong> uses value at risk as a supplement to other risk<br />
management tools. We also use volume-based, exposure<br />
and stop loss limits.<br />
<strong>BASF</strong> REPORT <strong>2008</strong><br />
213
214<br />
COnSOlidATEd FinAnCiAl STATEmEnTS<br />
Notes<br />
Exposure to commodity derivatives (million €)<br />
Crude oil, oil products and<br />
natural gas<br />
<strong>BASF</strong> REPORT <strong>2008</strong><br />
Exposure<br />
230<br />
<strong>2008</strong> 2007<br />
value at<br />
Risk Exposure<br />
49<br />
72<br />
Value at<br />
Risk<br />
Precious metals 20 1 40 1<br />
Swaps on CO 2 emissions<br />
certificates<br />
10<br />
1<br />
19<br />
260 51 131 7<br />
The exposure corresponds to the net amount of all long<br />
and short positions of the respective commodity category.<br />
Further information regarding financial risks and <strong>BASF</strong>’s risk management<br />
can be found in <strong>BASF</strong> management‘s Analysis, “Risk <strong>Report</strong>” from page 112<br />
onward.<br />
Swaps in which various types of CO 2 certificates are<br />
swapped are entered into in connection with CO 2<br />
emissions trading. The goal of these transactions is to<br />
exploit market price differences. These deals are settled<br />
by physical delivery.<br />
maturities of contractual cash flows from financial liabilities <strong>2008</strong> (million €)<br />
5<br />
1<br />
default and credit risk<br />
This is the risk that counterparties do not fulfill their contractual<br />
obligations. <strong>BASF</strong> regularly analyzes the creditworthiness<br />
of each significant debtor, and on the basis of this analysis<br />
grants credit limits. Due to the global activities and diversified<br />
customer structure of the <strong>BASF</strong> Group, there is no significant<br />
concentration of default risk. The carrying amount of all<br />
receivables, loans and interest-bearing securities plus the<br />
nominal value of contingent liabilities excluding potential<br />
warranty obligations represents the maximum default risk.<br />
more information on credit risks can be found in note 15 from page 195<br />
onward<br />
liquidity risks<br />
We promptly recognize any risks from cash flow fluctuations<br />
as part of the liquidity planning. We have ready<br />
access to sufficient liquid funds from our ongoing commercial<br />
paper program and confirmed lines of credit from<br />
banks. Despite the current financial crisis, the commercial<br />
paper market for <strong>BASF</strong> continues to be liquid due to our<br />
good rating.<br />
Bonds and other<br />
liabilities to the<br />
capital markets<br />
Liabilities to<br />
credit institutions<br />
Liabilities<br />
resulting from derivative<br />
financial<br />
instruments<br />
Miscellaneous<br />
liabilities<br />
2009 5,691 943 1,497 1,012<br />
2010 1,318 186 19 75<br />
2011 1,501 201 2 31<br />
2012 1,631 104 – 33<br />
2013 1,531 619 – 31<br />
2014 and thereafter 2,580 77 – 313<br />
14,252 2,130 1,518 1,495
maturities of contractual cash flows from financial liabilities 2007 (million €)<br />
Bonds and other<br />
liabilities to the<br />
capital markets<br />
Liabilities to<br />
credit institutions<br />
COnSOlidATEd FinAnCiAl STATEmEnTS<br />
Notes<br />
Liabilities<br />
resulting from derivative<br />
financial<br />
instruments<br />
Miscellaneous<br />
liabilities<br />
<strong>2008</strong> 2,781 689 83 1,411<br />
2009 845 96 7 161<br />
2010 1,560 89 1 39<br />
2011 1,195 88 18 45<br />
2012 1,555 82 – 30<br />
2013 and thereafter 2,696 247 2 370<br />
The interest and principal payments as well as other<br />
payments for derivative financial instruments are relevant<br />
for the presentation of the maturities of the contractual<br />
cash flows from financial liabilities. Future cash flows are<br />
not discounted here.<br />
Derivatives are included using their net cash flows, provided<br />
they have a negative fair value and therefore represent<br />
a liability. Derivatives with positive fair values are assets<br />
and are not considered.<br />
Trade accounts payable are generally interest free and<br />
fall due within one year. Therefore the carrying amount of<br />
trade accounts payable equals the sum of future cash<br />
flows.<br />
differences between book and fair values of financial<br />
instruments<br />
For accounts receivable, trade, other receivables and<br />
miscellaneous assets, loans, cash and cash equivalents,<br />
as well as trade accounts payable and other liabilities, the<br />
carrying amount approximates the fair value. Participations<br />
Carrying value of financial instruments (million €)<br />
10,632 1,291 111 2,056<br />
which are not traded on an active market and whose fair<br />
value could not be reliably determined are recognized<br />
at amortized cost and contained within ‘other financial<br />
assets’.<br />
The carrying amount of participations which are traded<br />
on an active market and hence recognized at fair value<br />
amounted to €1,049 million on December 31, <strong>2008</strong><br />
(December 31, 2007: €708 million). They are included in<br />
the item ‘shares in other participations’.<br />
more information can be found in note 13 from page 192 onward<br />
The carrying amount of financial indebtedness amounted<br />
to €14,514 million on December 31, <strong>2008</strong> (December 31,<br />
2007: €10,102 million). The fair value of financial indebtedness<br />
amounted to €14,822 million at the end of <strong>2008</strong> (end<br />
of 2007: €10,020 million).The fair value of financial debt is<br />
determined on the basis of interbank interest rates. The<br />
difference between book and fair values resulted primarily<br />
from changes in market interest rates.<br />
<strong>2008</strong> 2007<br />
Financial assets at fair value through profit or loss 1,380 249<br />
Financial liabilities at fair value through profit or loss 1,333 124<br />
Derivatives designated as hedging instruments under cash flow hedge accounting (121) –<br />
Loans and receivables 9,956 10,372<br />
Cash and cash equivalents 2,776 767<br />
Available-for-sale financial assets 1,581 1,248<br />
Liabilities measured at amortized cost 19,600 16,044<br />
Thereof financial indebtedness 14,514 10,102<br />
<strong>BASF</strong> REPORT <strong>2008</strong><br />
215
216<br />
COnSOlidATEd FinAnCiAl STATEmEnTS<br />
Notes<br />
net gains and losses from financial instruments (million €)<br />
<strong>BASF</strong> REPORT <strong>2008</strong><br />
<strong>2008</strong> 2007<br />
Receivables and loans 201 (814)<br />
Thereof interest result 138 131<br />
Available-for-sale financial assets (15) 43<br />
Thereof interest result 1 2<br />
Liabilities measured at amortized cost (911) 58<br />
Thereof interest result (523) (508)<br />
Financial instruments at fair value through profit or loss 746 472<br />
Net gains and losses of financial instruments comprise the<br />
results of valuations, the amortization of discounts, the<br />
recognition and derecognition of impairment losses, results<br />
from the translation of foreign currencies as well as<br />
interest, dividends and all other effects on profit of financial<br />
instruments. The item ‘financial instruments at fair value<br />
through profit or loss’ contains only those gains and losses<br />
from instruments which are not designated as hedging<br />
instruments as defined by IAS 39. Net gains or net losses<br />
from available-for-sale financial assets contain income<br />
from write-downs/write-ups, interest, dividends and the<br />
transfers of valuation effects from stockholders’ equity on<br />
the sale of the securities and participations.<br />
The net loss from receivables and loans, and net gains<br />
from financial liabilities measured at amortized cost relate<br />
primarily to income from the translation of foreign currencies.<br />
The gains and losses from the valuation of securities and participations taken<br />
directly to equity are shown in the Consolidated Statements of Recognized<br />
income and Expense on page 154.<br />
The use of derivative financial instruments<br />
The Company is exposed to foreign currency, interest rate<br />
and commodity price risks during the normal course of<br />
business. In addition, financial assets are also exposed to<br />
equity price risk. These risks are hedged through a centrally<br />
determined strategy employing derivative instruments.<br />
In addition, derivative instruments are used to<br />
replace transactions in original financial instruments, such<br />
as shares or fixed-interest securities. Hedging is only<br />
employed for underlying positions from the operating<br />
business, cash investments, financing or planned sales<br />
and raw material purchases. The risks from the underlying<br />
transactions and the derivatives are constantly monitored.<br />
Where derivatives have a positive market value, the<br />
Company is exposed to credit risks in the event of nonperformance<br />
of their counterparts. This credit risk is minimized<br />
by trading contracts exclusively with creditworthy<br />
banks and partners within predefined credit limits.<br />
To ensure effective risk management, risk positions<br />
are centralized at <strong>BASF</strong> SE and certain Group companies.<br />
Contracting and execution of derivative financial instruments<br />
for hedging purposes is conducted according to<br />
internal guidelines, and are subject to strict control<br />
mechanisms.
derivative instruments (million €)<br />
COnSOlidATEd FinAnCiAl STATEmEnTS<br />
Notes<br />
<strong>2008</strong> 2007<br />
Foreign currency forward contracts 183 111<br />
Currency options 133 63<br />
Foreign currency derivatives 316 174<br />
Interest rate swaps (3) (11)<br />
Combined interest and cross currency swaps 31 (5)<br />
interest derivatives 28 (16)<br />
Commodity derivatives (418) (33)<br />
Thereof designated hedging instrument as defined by IAS 39 (Hedge Accounting) (121) –<br />
hedge Accounting<br />
In <strong>2008</strong> and 2007, some of the planned purchases of<br />
naphtha were hedged using swaps and options on oil and<br />
oil products. Some of these hedges were shown in the<br />
Consolidated Financial Statements of the <strong>BASF</strong> Group by<br />
means of cash flow Hedge Accounting, where gains and<br />
losses from hedges were recognized directly in equity.<br />
Gains and losses from hedges are included in cost of sales<br />
at the point in time in which the hedged item is recognized<br />
in the statement of income.<br />
In <strong>2008</strong>, cash flow hedge accounting was applied in<br />
the Natural Gas Trading business sector for swaps on<br />
crude oil concluded to hedge price risks from purchase<br />
contracts for natural gas. The purchase contracts have<br />
variable prices and the price formula is coupled to the oil<br />
price.<br />
The majority of the planned transactions and their<br />
effect on earnings occur in the year following the balance<br />
sheet date. A small part relates to 2010 and 2011. In <strong>2008</strong>,<br />
€(183) million (2007: €97 million) in effective changes in the<br />
fair value of hedging instruments were recognized in stockholders’<br />
equity of the shareholders’ of <strong>BASF</strong> SE. In <strong>2008</strong>,<br />
€(12) million was derecognized from stockholders‘ equity<br />
of the shareholders of <strong>BASF</strong> SE and recorded as income in<br />
cost of sales (2007: €(15) million). The ineffective part in the<br />
change in value of the hedge was €(33) million in <strong>2008</strong><br />
(2007: €7 million). This amount was recorded in the income<br />
statement in cost of sales.<br />
In 2004 and 2005, fair value changes from forward interest<br />
swaps entered into to hedge interest-rate risk from the<br />
refinancing of an expiring bond were recognized directly in<br />
equity using cash flow Hedge Accounting. The hedge was<br />
closed in 2005 as a new bond was issued to refinance the<br />
expiring bond. The new bond is due in 2012. Over the<br />
maturity of the bond, the changes in fair value of interest<br />
rate swaps recognized in stockholders’ equity are reclassified<br />
proportionally from stockholders’ equity to the income<br />
statement. In both <strong>2008</strong> and 2007, €(8) million was derecognized<br />
from stockholders’ equity of the shareholders’ of<br />
<strong>BASF</strong> SE and recorded as interest income.<br />
<strong>BASF</strong> REPORT <strong>2008</strong><br />
217
218<br />
COnSOlidATEd FinAnCiAl STATEmEnTS<br />
Notes<br />
27 -- lEASing<br />
leased assets<br />
Property, plant and equipment include those assets which are considered to be economically owned through a finance<br />
lease. They primarily concern the following items:<br />
leased assets (million €)<br />
<strong>BASF</strong> REPORT <strong>2008</strong><br />
Acquisition cost<br />
<strong>2008</strong> 2007<br />
net book value<br />
Acquisition cost<br />
Net book value<br />
Land, land rights and buildings 20 13 26 18<br />
Machinery and technical equipment 223 96 226 118<br />
Miscellaneous equipment and fixtures 73 18 71 20<br />
Advance payments and construction in progress – – – –<br />
liabilities from finance leases (million €)<br />
minimum lease<br />
payments<br />
316 127 323 156<br />
<strong>2008</strong> 2007<br />
interest portion<br />
leasing liability<br />
Minimum lease<br />
payments<br />
Interest portion<br />
Leasing liability<br />
Following year 1 20 5 15 29 6 23<br />
Following year 2 20 5 14 19 5 13<br />
Following year 3 22 5 18 18 5 13<br />
Following year 4 11 2 9 21 5 16<br />
Following year 5 7 2 4 10 3 8<br />
Over 5 years 29 10 20 35 12 23<br />
In the current business year and in 2007, no additional<br />
lease payments arising from contractual obligations were<br />
recognized in income above the minimum lease payments.<br />
In <strong>2008</strong>, leasing liabilities were not offset by any<br />
expected minimum lease payments from sub-leases.<br />
In addition, <strong>BASF</strong> is a lessee under operating lease<br />
contracts. The resulting lease obligations totaling<br />
€1,449 million in <strong>2008</strong> and €1,272 million in 2007 are due<br />
in the following years:<br />
108 29 80 132 36 96<br />
Commitments due to operating lease contracts (million €)<br />
Nominal value of the future<br />
minimum payments<br />
december 31,<br />
<strong>2008</strong><br />
December 31,<br />
2007<br />
Less than 1 year 280 292<br />
1–5 years 613 505<br />
Over 5 years 556 475<br />
1,449 1,272
In <strong>2008</strong>, commitments due to operating lease contracts of<br />
less than one year contained leases of precious metals of<br />
€35 million (2007: €93 million). These metals were immediately<br />
leased to third parties. Offsetting the other leasing<br />
commitments are expected minimum lease payments from<br />
sub-leases of €11 million in <strong>2008</strong> (2007: €12 million).<br />
Minimum lease payments of €269 million (2007:<br />
€242 million), no conditional lease payments (2007:<br />
€0.3 million), and payments received from subleases of<br />
€4 million (2007: €4 million) were included in income from<br />
operations in <strong>2008</strong>.<br />
COnSOlidATEd FinAnCiAl STATEmEnTS<br />
Notes<br />
28 -- COmPEnSATiOn FOR ThE BOARd OF ExECuTivE diRECTORS And SuPERviSORy<br />
BOARd OF <strong>BASF</strong> SE<br />
Million € <strong>2008</strong> 2007<br />
Performance-related and fixed payments to the Board of Executive Directors 18.6 22.0<br />
Market value of options granted to the Board of Executive Directors in the fiscal year on date of grant 3.7 6.0<br />
Total compensation for the Board of Executive directors 22.3 28.0<br />
Service cost of the Board of Executive Directors 4.3 4.5<br />
Compensation for the Supervisory Board 2.9 4.2<br />
Total compensation for former members of the Board of Executive Directors and their surviving dependents 6.0 7.1<br />
Pension provisions for former members of the Board of Executive Directors and their surviving dependents 83.4 76.9<br />
Loans to members of the Board of Executive Directors and the Supervisory Board – –<br />
Guarantees to members of the Board of Executive Directors and the Supervisory Board – –<br />
Performance-related compensation for the Board of<br />
E xecutive Directors is based on the return on assets,<br />
which corresponds to earnings before taxes plus<br />
borrowing costs as a percentage of average assets.<br />
Moreover, in <strong>2008</strong>, the members of the Board of<br />
E xecutive Directors were granted 286,800 options under<br />
the <strong>BASF</strong> option program (BOP).<br />
<strong>BASF</strong> as lessor<br />
<strong>BASF</strong> acts as both a lessee and a lessor under finance<br />
leases. <strong>BASF</strong> acts as a lessor for finance leases in a minor<br />
capacity only. Receivables on finance leases were €17 million<br />
in <strong>2008</strong> and of €1 million in 2007. In <strong>2008</strong>, nominal<br />
minimum payments arising from operating leases amount<br />
to €42 million within one year, and €19 million within the<br />
next five years. For 2007, these figures amounted to<br />
€101 million within one year, and €23 million within the<br />
next five years.<br />
In <strong>2008</strong>, precious metal accounts of €505 million (2007:<br />
€598 million) continue to be held for customers where the<br />
metals are stored physically at <strong>BASF</strong>.<br />
Option rights of active and former members of the Board<br />
of Executive Directors resulted in income from the reversal<br />
of provisions of €9.5 million. In 2007, the option rights<br />
resulted in personnel costs of €29.7 million.<br />
more information on the compensation of members of the Board of Executive<br />
directors can be found from page 138 onward<br />
more information on the members of the Supervisory Board and Board of<br />
Executive directors, including their memberships on other boards can be<br />
found from page 133 onward<br />
<strong>BASF</strong> REPORT <strong>2008</strong><br />
219
220<br />
COnSOlidATEd FinAnCiAl STATEmEnTS<br />
Notes<br />
29 -- RElATEd PARTy TRAnSACTiOnS<br />
IAS 24 “Related Party Disclosures” requires the disclosure<br />
of transactions with related parties; both with related<br />
companies that are not fully consolidated, as well as with<br />
related individuals.<br />
Material supply relationships exist between the proportionally<br />
consolidated joint venture companies Wintershall<br />
Erdgas Handelshaus GmbH & Co. KG, Berlin, Germany,<br />
Wintershall Erdgas Handelshaus Zug AG, Zug, Switzerland,<br />
and companies of the <strong>BASF</strong> Group for the supply of<br />
oil and gas. The unconsolidated portion of these supplies<br />
amounted to €1,402 million in <strong>2008</strong> (2007: €726 million).<br />
30 -- SERviCES PROvidEd By ThE ExTERnAl AudiTOR<br />
<strong>BASF</strong> Group companies have used the following services from KPMG:<br />
Of this amount, €7.8 million in <strong>2008</strong> and €6.6 million in<br />
2007 related to fees for annual audits paid to KPMG AG<br />
Wirtschaftsprüfungsgesellschaft (formerly KPMG<br />
Deutsche Treuhand-Gesellschaft Aktiengesellschaft<br />
Wirtschaftsprüfungsgesellschaft) and its affiliated companies.<br />
As of October 1, <strong>2008</strong>, the KPMG companies in<br />
Germany, Spain and Great Britain merged. The KPMG<br />
<strong>BASF</strong> REPORT <strong>2008</strong><br />
In addition, there are material supply relationships with<br />
Ellba C.V., the Netherlands, and Ellba Eastern Private Ltd.,<br />
Singapore. The unconsolidated portion of these supplies<br />
amounted to €493 million in <strong>2008</strong> and €446 million in 2007.<br />
There were no reportable related party transactions<br />
with members of the Board of Executive Directors or the<br />
Supervisory Board.<br />
<strong>BASF</strong> has not issued loans to members of the Board of<br />
Executive Directors or the Supervisory Board.<br />
more information on receivables and payables with companies accounted for<br />
proportionally, at acquisition cost or according to the equity method can be<br />
found in note 15 from page 195 onward and note 22 from page 206 onward<br />
Million € <strong>2008</strong> 2007<br />
<strong>Annual</strong> audit 19.8 19.1<br />
Thereof domestic 6.3 6.2<br />
Audit-related services 0.4 0.4<br />
Thereof domestic 0.2 0.1<br />
Tax consultation services . 0.1<br />
Thereof domestic – –<br />
Other services 0.3 0.4<br />
Thereof domestic 0.3 0.3<br />
20.5 20.0<br />
companies in Germany and Great Britain had already<br />
merged as of October 1, 2007.<br />
The annual audit related to the audit of the annual<br />
financial statements of the <strong>BASF</strong> Group as well as the<br />
legally required audit of the financial statements of<br />
<strong>BASF</strong> SE and the consolidated subsidiary companies<br />
and joint ventures.
Theo Bergers<br />
as a project manager helped to<br />
build a radio control system for<br />
gas production platforms.<br />
* through radio control and monitoring of<br />
North sea platforms
Supplementary InformatIon<br />
on oIl and GaS producInG<br />
actIvItIeS<br />
VALUe For BAsF<br />
economic production of<br />
natural gas<br />
In one of the most modern control centers in the world, the <strong>BASF</strong> subsidiary<br />
Wintershall operates gas production platforms in the Dutch North Sea.<br />
Natural gas production by satellite<br />
The Center for Remote Controlled Operations (RCO) in Den<br />
Helder, the Netherlands, contributes to the economic use<br />
of small and medium-sized deposits. The remote controlled<br />
operations result in savings of €2.6 million annually, among<br />
other things, in helicopter logistics. In this way, the RCO<br />
team contributes to the economically effective development<br />
of offshore reserves, while at the same time significantly<br />
improving <strong>BASF</strong>’s competitiveness as a natural gas operator.<br />
The project won <strong>BASF</strong>’s Innovation Award <strong>2008</strong>.<br />
VALUe For soCIeTY<br />
Conserving resources<br />
The F16 is one of 18 offshore platforms that Wintershall monitors by radio.<br />
safeguarding supplies through rCo<br />
The radio monitoring system RCO supports our Gas for<br />
Europe strategy, with which we are helping to meet Europe’s<br />
increasing natural gas needs. Our strategy makes a contribution<br />
to ensuring energy supplies for the future. Natural<br />
gas is the fossil fuel with the least amount of specific CO 2<br />
emissions.<br />
more information on our oil and gas business can be found from<br />
page 80 onward
05<br />
Supplementary InformatIon<br />
on oIl and GaS<br />
producInG actIvItIeS<br />
Supplementary Information on<br />
oil and Gas producing activities 222<br />
Supplementary InformatIon<br />
on oIl and GaS producInG<br />
actIvItIeS
222<br />
Supplementary InformatIon on oIl and GaS producInG actIvItIeS<br />
Supplementary InformatIon<br />
on oIl and GaS producInG actIvItIeS<br />
(unaudited)<br />
the following tables provide supplemental information<br />
on the exploration and production business sector of<br />
the oil & Gas segment. In the absence of detailed disclosure<br />
rules in this area under IfrS, the Group has<br />
elected to voluntarily disclosure the data that would<br />
have been required under SfaS no. 69 (disclosure of<br />
oil and Gas producing activities). In order to present<br />
an economically meaningful reporting of the cooperation<br />
with Gazprom in the yuzhno russkoye project,<br />
several modifications have been made to SfaS 69.<br />
BaSf has an interest of 35% in the economic rewards<br />
of this field through Severneftegazprom (SnG), the<br />
company which holds the production license. SnG is<br />
accounted for using the equity method. a consolidated<br />
project company was established for these operations.<br />
In the following, the stake in the Yuzhno Russkoye project<br />
is reported under Russia/Caspian Sea region. In addition,<br />
the values for SNG, which is accounted for using the<br />
equity method, are presented separately.<br />
All consolidated subsidiaries are included with 100%.<br />
To the extent that other investors have a stake in these<br />
companies, their share is presented separately. This<br />
relates to a stake in a German Wintershall subsidiary which<br />
was part of the asset swap with Gazprom. This company<br />
holds the production and exploration rights to the Libyan<br />
onshore concession 96 and 97. Due to contractual rules,<br />
the following does not include any volumes or values from<br />
the Achimgaz project.<br />
BaSf report <strong>2008</strong><br />
The regions include the following countries with<br />
operational activities:<br />
• russia/caspian Sea region:<br />
Russia, Turkmenistan<br />
• rest of europe:<br />
Denmark, the United Kingdom, the Netherlands, Norway,<br />
Romania<br />
• north africa/middle east:<br />
Dubai (until 2007), Qatar, Libya, Mauritania,<br />
Oman (since <strong>2008</strong>)<br />
• South america:<br />
Argentina, Chile (since <strong>2008</strong>)<br />
Statistical information on the concession areas or the number<br />
of wells is not given due to its limited economic value.<br />
oil and gas reserves<br />
Proved oil and gas reserves are the estimated volumes of<br />
crude oil, natural gas and natural gas liquids that are<br />
shown by geological and engineering data with reasonable<br />
certainty to be recoverable in future years from known<br />
reserves under existing economic and operating conditions.<br />
Accordingly, reserve estimates could be materially<br />
different from the quantities of oil and natural gas that are<br />
ultimately recovered. To reduce uncertainties, Wintershall<br />
has used independent, internationally recognized reserve<br />
auditors for some years to perform reserves audits of its<br />
major oil and gas fields.<br />
The tables below show the estimated net quantities as of<br />
December 31, <strong>2008</strong> and 2007, of the Company’s proved oil<br />
and gas reserves and proved developed oil and gas<br />
reserves as well as changes in estimated proved reserves<br />
as a result of production and other factors.
<strong>2008</strong><br />
proved developed and undeveloped oil reserves as of<br />
January 1, millions of barrels (mmbbl)<br />
Germany<br />
63<br />
Supplementary InformatIon on oIl and GaS producInG actIvItIeS<br />
Rest of<br />
Europe<br />
1<br />
Russia,<br />
Caspian Sea<br />
region<br />
11<br />
North Africa,<br />
Middle East<br />
270<br />
South<br />
America total<br />
Revisions und other changes – – 2 60 (1) 61<br />
Extensions and discoveries – – – – – –<br />
Purchase/ sale of reserves – 12 – – – 12<br />
Production 8 1 1 44 5 59<br />
proved reserves as of december 31 55 12 12 286 39 404<br />
Minority interests – – – 133 – 133<br />
proved reserves after minority interests 55 12 12 153 39 271<br />
Thereof at equity companies – – 12 – – 12<br />
proved reserves after minority interests and at equity<br />
companies<br />
55<br />
Minority interests in production – – – 21 – 21<br />
Proved developed reserves as of December 31 40 7 12 282 32 373<br />
<strong>2008</strong><br />
proved developed and undeveloped gas reserves as of<br />
January 1, Billion Standard cubic feet (BScf) 1<br />
Germany<br />
365<br />
12<br />
Rest of<br />
Europe<br />
170<br />
–<br />
Russia,<br />
Caspian Sea<br />
region<br />
3,239<br />
153<br />
North Africa,<br />
Middle East<br />
194<br />
45<br />
39<br />
390<br />
259<br />
South<br />
America total<br />
Revisions und other changes (11) 16 375 25 63 468<br />
Extensions and discoveries – 24 – – – 24<br />
Purchase/ sale of reserves – (4) – – – (4)<br />
Production 41 62 182 27 119 431<br />
proved reserves as of december 31 313 144 3,432 192 1,281 5,362<br />
Minority interests – – – 94 – 94<br />
proved reserves after minority interests 313 144 3,432 98 1,281 5,268<br />
Thereof at equity companies – – 3,432 – – 3,432<br />
proved reserves after minority interests and at equity<br />
companies<br />
313<br />
Minority interests in production – – – 13 – 13<br />
Proved developed reserves as of December 31 308 126 2,512 190 1,007 4,143<br />
1 The natural gas volumes can be converted with the factor 6 BSCF per MMBOE (Million Barrel Oil Equivalent).<br />
144<br />
–<br />
98<br />
1,337<br />
1,281<br />
5,305<br />
1,836<br />
BaSf report <strong>2008</strong><br />
223
224<br />
Supplementary InformatIon on oIl and GaS producInG actIvItIeS<br />
2007<br />
proved developed and undeveloped oil reserves as of<br />
January 1, millions of barrels (mmbbl)<br />
BaSf report <strong>2008</strong><br />
Germany<br />
68<br />
Rest of<br />
Europe<br />
2<br />
Russia,<br />
Caspian Sea<br />
region<br />
12<br />
North Africa,<br />
Middle East<br />
306<br />
South<br />
America total<br />
Revisions und other changes 4 – 1 8 (4) 9<br />
Extensions and discoveries – – – 3 – 3<br />
Purchase/ sale of reserves – – – – – –<br />
Production 9 1 2 47 5 64<br />
proved reserves as of december 31 63 1 11 270 45 390<br />
Minority interests – – – 126 – 126<br />
proved reserves after minority interests 63 1 11 144 45 264<br />
Thereof at equity companies – – 11 – – 11<br />
proved reserves after minority interests and at equity<br />
companies<br />
63<br />
Minority interests in production – – – 2 – 2<br />
Proved developed reserves as of December 31 44 1 11 265 37 358<br />
2007<br />
proved developed and undeveloped gas reserves as of<br />
January 1, Billion Standard cubic feet (BScf) 1<br />
Germany<br />
376<br />
1<br />
Rest of<br />
Europe<br />
214<br />
–<br />
Russia,<br />
Caspian Sea<br />
region<br />
–<br />
144<br />
North Africa,<br />
Middle East<br />
232<br />
54<br />
45<br />
442<br />
253<br />
South<br />
America total<br />
Revisions und other changes 34 32 – (14) 55 107<br />
Extensions and discoveries – 2 – 4 – 6<br />
Purchase/ sale of reserves – (1) 3,254 – – 3,253<br />
Production 45 77 15 28 126 291<br />
proved reserves as of december 31 365 170 3,239 194 1,337 5,305<br />
Minority interests – – – 95 – 95<br />
proved reserves after minority interests 365 170 3,239 99 1,337 5,210<br />
Thereof at equity companies – – 3,239 – – 3,239<br />
proved reserves after minority interests and at equity<br />
companies<br />
365<br />
Minority interests in production – – – 1 – 1<br />
Proved developed reserves as of December 31 332 170 1,275 190 956 2,923<br />
1 The natural gas volumes can be converted with the factor 6 BSCF per MMBOE (Million Barrel Oil Equivalent).<br />
170<br />
–<br />
99<br />
1,408<br />
1,337<br />
2,230<br />
1,971
operating results of operations from oil and gas producing<br />
activities<br />
This represents only those revenues and expenses directly<br />
associated with Wintershall’s oil and gas production. These<br />
amounts do not include financing costs (such as interest<br />
expenses) or corporate overheads and do not correspond<br />
<strong>2008</strong> (million €)<br />
Germany<br />
Supplementary InformatIon on oIl and GaS producInG actIvItIeS<br />
Rest of<br />
Europe<br />
Russia,<br />
Caspian Sea<br />
region<br />
North Africa,<br />
Middle East<br />
South<br />
America total<br />
Sales crude oil (incl. condensate and LPG) 460 39 62 2,753 145 3,459<br />
Sales natural gas 300 452 456 8 147 1,363<br />
Local duties (royalties, export etc.) 129 5 53 136 80 403<br />
total sales (net of duties) 631 486 465 2,625 212 4,419<br />
Production costs 97 82 25 158 63 425<br />
Exploration expenses 12 134 27 44 12 229<br />
Depreciation, amortization and impairment 59 111 55 57 37 319<br />
Other (4) 9 20 19 4 48<br />
operating income before taxes 467 150 338 2,347 96 3,398<br />
Income taxes 136 51 92 2,203 23 2,505<br />
operating income after taxes 331 99 246 144 73 893<br />
Minority interests – – – 87 – 87<br />
operating income after taxes and minority interests 331 99 246 57 73 806<br />
Thereof at equity companies – – 78 – – 78<br />
operating income after taxes, minority interests and at<br />
equity companies<br />
2007 (million €)<br />
331<br />
Germany<br />
99<br />
Rest of<br />
Europe<br />
168<br />
Russia,<br />
Caspian Sea<br />
region<br />
57<br />
North Africa,<br />
Middle East<br />
73<br />
728<br />
South<br />
America total<br />
Sales crude oil (incl. condensate and LPG) 400 28 60 2,365 142 2,995<br />
Sales natural gas 265 419 26 9 128 847<br />
Local duties (royalties, export etc.) 102 6 27 152 54 341<br />
total sales (net of duties) 563 441 59 2,222 216 3,501<br />
Production costs 94 88 15 171 65 433<br />
Exploration expenses 13 150 42 62 9 276<br />
Depreciation, amortization and impairment 67 126 5 56 39 293<br />
Other 23 (1) 2 (6) (33) (15)<br />
operating income before taxes 366 78 (5) 1,939 136 2,514<br />
Income taxes 131 15 (3) 1,759 31 1,933<br />
operating income after taxes 235 63 (2) 180 105 581<br />
Minority interests – – – 6 – 6<br />
operating income after taxes and minority interests 235 63 (2) 174 105 575<br />
Thereof at equity companies – – 12 – – 12<br />
operating income after taxes, minority interests and at<br />
equity companies<br />
235<br />
to the contributions to the Oil & Gas segment. The differences<br />
in sales compared to the segment reporting results<br />
from sales for merchandise and services. Estimated<br />
income taxes were computed by applying the statutory<br />
income tax rates to the pretax income from producing<br />
activities.<br />
63<br />
(14)<br />
174<br />
105<br />
563<br />
BaSf report <strong>2008</strong><br />
225
226<br />
Supplementary InformatIon on oIl and GaS producInG actIvItIeS<br />
costs incurred in oil and gas property acquisition, exploration and development activities<br />
Costs incurred represent amounts capitalized or charged against income as incurred in connection with oil and gas property<br />
acquisition, exploration and development activities.<br />
<strong>2008</strong> (million €)<br />
BaSf report <strong>2008</strong><br />
Germany<br />
Rest of<br />
Europe<br />
Russia,<br />
Caspian Sea<br />
region<br />
North Africa,<br />
Middle East<br />
South<br />
America total<br />
Acquisitions – 559 – – – 559<br />
Exploration 15 113 24 75 12 239<br />
Development 75 33 50 89 40 287<br />
total net costs 90 705 74 164 52 1,085<br />
2007 (million €)<br />
Germany<br />
Rest of<br />
Europe<br />
Russia,<br />
Caspian Sea<br />
region<br />
North Africa,<br />
Middle East<br />
South<br />
America total<br />
Acquisitions – – 1,448 – – 1,448<br />
Exploration 17 115 22 70 6 230<br />
Development 57 57 532 1 73 41 760<br />
total net costs 74 172 2,002 143 47 2,438<br />
1 Includes <strong>BASF</strong> shares in the financing of the investments made by SNG
Supplementary InformatIon on oIl and GaS producInG actIvItIeS<br />
capitalized costs relating to oil and gas producing activities<br />
Capitalized costs represent total expenditures on proved and unproved oil and gas properties with related accumulated<br />
depreciation, depletion and amortization.<br />
<strong>2008</strong> (million €)<br />
Germany<br />
Rest of<br />
Europe<br />
Russia,<br />
Caspian Sea<br />
region<br />
North Africa,<br />
Middle East<br />
South<br />
America total<br />
Proved properties 575 689 2,082 1,247 891 5,484<br />
Unproved properties 19 748 7 5 – 779<br />
Other equipment 602 559 4 39 – 1,204<br />
total gross costs 1,196 1,996 2,093 1,291 891 7,467<br />
Accumulated depreciation 865 1,087 64 795 573 3,384<br />
total net costs 331 909 2,029 496 318 4,083<br />
2007 (million €)<br />
Germany<br />
Rest of<br />
Europe<br />
Russia,<br />
Caspian Sea<br />
region<br />
North Africa,<br />
Middle East<br />
South<br />
America total<br />
Proved properties 534 430 1,993 1,120 849 4,926<br />
Unproved properties 10 288 5 3 – 306<br />
Other equipment 582 547 11 49 – 1,189<br />
total gross costs 1,126 1,265 2,009 1,172 849 6,421<br />
Accumulated depreciation 817 928 74 744 534 3,097<br />
total net costs 309 337 1,935 428 315 3,324<br />
BaSf report <strong>2008</strong><br />
227
228<br />
Supplementary InformatIon on oIl and GaS producInG actIvItIeS<br />
capitalized exploration well-drilling costs:<br />
suspended well costs<br />
Exploratory drilling costs are capitalized until the drilling of<br />
the well is complete. If hydrocarbons are found, and, subject<br />
to further appraisal activity which may include the drilling<br />
of further wells, are likely to be capable of commercial<br />
development, the costs continue to be carried as an asset.<br />
All such carried costs are subject to technical, commercial<br />
and management review at least once a year to confirm<br />
the continued intent to develop or otherwise extract value<br />
from the discovery. When this is no longer the case, the<br />
costs are written off. When proved reserves of oil or natural<br />
gas are determined and development is sanctioned, the<br />
relevant expenditure is transferred to property, plant and<br />
equipment. Unsuccessful exploration wells are impaired in<br />
exploration expenses.<br />
The following table indicates the changes to the company’s<br />
capitalized exploration well-drilling costs.<br />
capitalized exploration well-drilling costs (million €) 1<br />
BaSf report <strong>2008</strong><br />
<strong>2008</strong> 2007<br />
at January 1 75.3 86.3<br />
Additions pending determination of proved reserves 118.4 71.6<br />
Capitalized exploratory well costs charged to<br />
expense<br />
(60.1)<br />
(51.0)<br />
Reclassifications to wells, facilities and equipment (42.5) (31.6)<br />
ending balance at december 31 91.1 75.3<br />
1 Only consolidated companies<br />
The following table provides an aging of capitalized well<br />
costs (million €) and, on the last line, the number of suspend<br />
exploration wells.<br />
capitalized exploration well-drilling costs (million €) 1<br />
<strong>2008</strong> 2007<br />
Wells for which drilling is not complete 25.8 13.8<br />
Wells capitalized less than one year 30.6 36.8<br />
Wells capitalized more than one year 34.7 24.8<br />
total 91.1 75.3<br />
number of wells 13 15<br />
1 Only consolidated companies<br />
Standardized measure of discounted future net cash<br />
flows relating to proved oil and gas reserves (SmoG)<br />
The following information has been prepared in accordance<br />
with SFAS No. 69, which requires the standardized<br />
measure of discounted future net cash flows to be based<br />
on year-end sales prices, costs and statutory income tax<br />
rates and a 10% annual discount rate. Because prices<br />
used in the calculation are as of December 31, the standardized<br />
measure could vary significantly from year to year<br />
depending on market conditions at that specific date.<br />
The projection should not be viewed as realistic estimates<br />
of future cash flows nor should the “standardized measure”<br />
be interpreted as representing current value to the company.<br />
Material revisions of estimates of proved reserves may<br />
occur in the future, development and production of the reserves<br />
may not occur in the period assumed, actual prices<br />
realized are expected to vary significantly from those used<br />
and actual costs may also vary.<br />
The company’s investment and operating decisions are<br />
not based on the information presented below, but on a wide<br />
range of reserves, and on different price and cost assumptions<br />
from those reflected in this information.<br />
Beyond the above considerations, the “standardized<br />
measure” is also not directly comparable with asset balances<br />
appearing elsewhere in the Consolidated Financial Statements<br />
because any such comparison would require a reconciling<br />
adjustment.
<strong>2008</strong> (million €)<br />
Germany<br />
Supplementary InformatIon on oIl and GaS producInG actIvItIeS<br />
Rest of<br />
Europe<br />
Russia,<br />
Caspian Sea<br />
region<br />
North Africa,<br />
Middle East<br />
South<br />
America total<br />
Future revenues 2,919 1,480 8,594 6,394 2,539 21,926<br />
Future production/development costs 1,649 762 862 2,441 1,254 6,968<br />
Future income taxes 273 379 1,489 3,161 166 5,468<br />
Future net cash flows 997 339 6,243 792 1,119 9,490<br />
Discounted to present value at a 10 % annual rate 371 22 2,449 290 505 3,637<br />
Standardized measures of discounted future cash flows 626 317 3,794 502 614 5,853<br />
Minority interests – – – 193 – 193<br />
Standardized measures of discounted future cash flows<br />
after minority interests<br />
626<br />
Thereof at equity companies – – 652 – – 652<br />
Standardized measures of discounted future cash flows<br />
after minority interests and at equity companies<br />
2007 (million €)<br />
626<br />
Germany<br />
317<br />
317<br />
Rest of<br />
Europe<br />
3,794<br />
3,142<br />
Russia,<br />
Caspian Sea<br />
region<br />
309<br />
309<br />
North Africa,<br />
Middle East<br />
614<br />
614<br />
5,660<br />
5,008<br />
South<br />
America total<br />
Future revenues 4,776 1,062 8,120 16,547 2,629 33,134<br />
Future production/development costs 1,577 496 913 2,204 936 6,126<br />
Future income taxes 850 263 1,644 12,445 222 15,424<br />
Future net cash flows 2,349 303 5,563 1,898 1,471 11,584<br />
Discounted to present value at a 10 % annual rate 960 8 2,248 663 655 4,534<br />
Standardized measures of discounted future cash flows 1,389 295 3,315 1,235 816 7,050<br />
Minority interests – – – 410 – 410<br />
Standardized measures of discounted future cash flows<br />
after minority interests<br />
1,389<br />
Thereof at equity companies – – 531 – – 531<br />
Standardized measures of discounted future cash flows<br />
after minority interests and at equity companies<br />
1,389<br />
295<br />
295<br />
3,315<br />
2,784<br />
825<br />
825<br />
816<br />
816<br />
6,640<br />
6,109<br />
BaSf report <strong>2008</strong><br />
229
230<br />
Supplementary InformatIon on oIl and GaS producInG actIvItIeS<br />
Summary of changes in standardized measure of discounted future net cash flows <strong>2008</strong> (million €)<br />
BaSf report <strong>2008</strong><br />
Germany<br />
Rest of<br />
Europe<br />
Russia,<br />
Caspian Sea<br />
region<br />
North Africa,<br />
Middle East<br />
South<br />
America total<br />
Balance as of January 1 1,389 295 3,315 1,235 816 7,050<br />
Sales and transfers of oil and gas produced, net of production<br />
costs<br />
Net changes in price and in development and production<br />
costs<br />
Extension, discoveries and improved recovery, less related<br />
costs<br />
(534)<br />
(746)<br />
–<br />
Revisions of previous quantity estimates 50 91 98 625 131 995<br />
Development costs incurred during the period 75 23 170 80 32 380<br />
Changes in estimated future development costs (96) (7) (3) (254) (63) (423)<br />
Purchase/sale reserves – 6 – – – 6<br />
Net change in income taxes 320 (86) 76 6,118 64 6,492<br />
Accretion of discounts 170 26 416 832 91 1,535<br />
Other (2) – – 2 (2) (2)<br />
Balance as of december 31 626 317 3,794 502 614 5,853<br />
Minority interests – – – 193 – 193<br />
Standardized measures of discounted future cash flows<br />
(SmoG) after minority interests<br />
626<br />
Thereof at equity companies – – 652 – – 652<br />
Standardized measure of discounted future cash flows<br />
after minority interests and at equity companies<br />
Summary of changes in standardized measure of discounted future net cash flows 2007 (million €)<br />
626<br />
Germany<br />
(404)<br />
268<br />
105<br />
317<br />
317<br />
Rest of<br />
Europe<br />
(440)<br />
162<br />
–<br />
3,794<br />
3,142<br />
Russia,<br />
Caspian Sea<br />
region<br />
(2,467)<br />
(5,669)<br />
–<br />
309<br />
309<br />
North Africa,<br />
Middle East<br />
(149)<br />
(306)<br />
–<br />
614<br />
614<br />
(3,994)<br />
(6,291)<br />
105<br />
5,660<br />
5,008<br />
South<br />
America total<br />
Balance as of January 1 1,011 400 59 866 697 3,033<br />
Sales and transfers of oil and gas produced, net of production<br />
costs<br />
Net changes in price and in development and production<br />
costs<br />
Extension, discoveries and improved recovery, less related<br />
costs<br />
(470)<br />
547<br />
–<br />
Revisions of previous quantity estimates 113 145 18 172 (3) 445<br />
Development costs incurred during the period 47 21 – 68 40 176<br />
Changes in estimated future development costs (21) (3) (2) (39) 22 (43)<br />
Purchase/sale reserves – – 3,196 – – 3,196<br />
Net change in income taxes 27 54 (20) (2,375) 7 (2,307)<br />
Accretion of discounts 136 79 8 591 80 894<br />
Other (1) (18) 5 18 2 6<br />
Balance as of december 31 1,389 295 3,315 1,235 816 7,050<br />
Minority interests – – – 410 – 410<br />
Standardized measures of discounted future cash flows<br />
(SmoG) after minority interests<br />
1,389<br />
Thereof at equity companies – – 531 – – 531<br />
Standardized measure of discounted future cash flows<br />
after minority interests and at equity companies<br />
1,389<br />
(354)<br />
(39)<br />
10<br />
295<br />
295<br />
(44)<br />
95<br />
–<br />
3,315<br />
2,784<br />
(2,050)<br />
3,890<br />
94<br />
825<br />
825<br />
(151)<br />
122<br />
–<br />
816<br />
816<br />
(3,069)<br />
4,615<br />
104<br />
6,640<br />
6,109
GlOSSARY<br />
-- A<br />
Acrylic monomers<br />
Acrylic monomers are part of the product range of the Functional Polymers<br />
division and are used among other things as starting materials in the<br />
production of polymer dispersions.<br />
Admixture Systems<br />
The concrete admixtures from the Admixture Systems business unit ensure<br />
optimal concrete characteristics, even under extreme conditions, for<br />
sky scrapers, complex bridge constructions and tunnels.<br />
Audits for Environment, Health and Safety<br />
Audits are a strategic tool for managing safety and environmental protection<br />
standards. During a site or plant audit, a profile is created using<br />
clearly defined environmental, safety or health criteria.<br />
Automotive OEm coatings<br />
Coating systems for vehicle bodies that protect the vehicle from corrosion<br />
(cathodic dip) and gravel and chippings (primer), provide color (basecoat)<br />
and offer protection from environmental factors (topcoat).<br />
-- B<br />
Barrels of Oil Equivalent (BOE)<br />
International standard for comparing the thermal energy of different fuels.<br />
<strong>BASF</strong> Plant Science<br />
Founded in 1998, the goal of the Research and Technology Verbund<br />
with over 700 employees is to create more efficient farming, renewable<br />
resources and better nutrition. Crop design and metanomics are units<br />
in this Verbund.<br />
Biotechnology<br />
This term covers all processes and products that use living organisms,<br />
for example bacteria and yeasts, or their cellular constituents. Plant biotechnology<br />
and white biotechnology belong to the five growth clusters<br />
of <strong>BASF</strong>.<br />
-- c<br />
carbon Disclosure Project<br />
The Carbon Disclosure Project represents 385 institutional investors<br />
worldwide. The organization collects information on addressing the challenges<br />
of climate change and the strategies on climate change of the<br />
1,550 largest corporations worldwide.<br />
clean Development mechanism<br />
The Clean Development Mechanism (CDM) is one the flexible mechanisms<br />
for the reduction of greenhouse gas emissions as laid down in the<br />
Kyoto Protocol. In CDM, companies from industrialized or transitional<br />
countries participate in emission reducing and quality examining projects<br />
in developing and transitional countries, and in doing so acquire tradable<br />
emission vouchers.<br />
cmR Substances<br />
Substances with carcinogenic (cancer causing), mutagenic (genetically<br />
altering) and reprotoxic (reproduction toxic) effects.<br />
InFORmATIOn, SERvIcE<br />
Glossary<br />
cO 2 Equivalent<br />
A parameter to describe the effect of greenhouse gas emissions. A factor<br />
known as the global warming potential (GWP) shows the effect of the individual<br />
gases compared with CO 2 (reference value).<br />
cO 2 Scrubbing<br />
CO 2 scrubbing is another name for CO 2 capture. After being compressed<br />
the captured, CO 2 is transported and stored in underground repositories.<br />
compliance<br />
Compliance is an important element of corporate governance. It refers<br />
to the company’s behavior in accordance with laws, guidelines and voluntary<br />
codices.<br />
concrete Additives<br />
Concrete additives accelerate or slow the hardening of concrete in order<br />
for it to be used optimally in warm and cold climates. The additives<br />
further increase the strength of concrete and thus add to the durability<br />
of construction work.<br />
corporate Governance<br />
Corporate governance refers to the entire system of managing and overseeing<br />
a company. This includes the organization of a company, its principles<br />
and guidelines as well as all internal and external regulatory and<br />
monitoring mechanisms.<br />
-- D<br />
Dividend Yield<br />
The dividend yield is the return received by a shareholder in the form of a<br />
dividend in relation to the year-end share price. It is calculated by dividing<br />
the per-share dividend by the year-end share price and multiplying by<br />
100.<br />
-- E<br />
Earnings per Share<br />
The amount earned by <strong>BASF</strong> in euros per share based on the weighted<br />
number of shares.<br />
EBITDA margin<br />
This is the margin that we earn on sales from our operating activities before<br />
depreciation and amortization. It is calculated as income from operations<br />
before depreciation and amortization as a percentage of sales.<br />
EBIT after cost of capital<br />
The EBIT after cost of capital is calculated by deducting the cost of capital<br />
from the operating income earned by <strong>BASF</strong>’s operating divisions. If the<br />
EBIT after cost of capital has a positive value <strong>BASF</strong> has earned a premium<br />
on the expected return of its providers of debt and equity. The EBIT<br />
after cost of capital is the key performance and management indicator.<br />
We use this key performance and management indicator for our operating<br />
divisions and business units to ensure that we meet the interest rate payments<br />
to providers of debt, satisfy the returns expected by providers of<br />
equity and cover tax expenses.<br />
<strong>BASF</strong> REPORT <strong>2008</strong><br />
231
232<br />
InFORmATIOn, SERvIcE<br />
Glossary<br />
Eco-Efficiency Analysis<br />
This analysis allows both economic and environmental aspects to be<br />
considered when developing and optimizing products and processes.<br />
The aim is to offer the best possible cost-effective products with good<br />
environmental performance.<br />
Energy management<br />
The development of new materials and technologies to convert and store<br />
energy. Energy management also refers to the responsible use of fossil<br />
fuels, for example through the development of energy-saving materials<br />
such as insulation.<br />
Epoxy Resin<br />
Epoxy resin is a thermosetting plastic of high cohesiveness and chemical<br />
durability. Depending on temperature and amount of the hardener, the<br />
hardening of this plastic can take from a few minutes to up to several<br />
hours. A further characteristic is the high amount of cohesiveness compared<br />
to its low weight.<br />
EPSA<br />
An Exploration and Production Sharing Agreement is the prevalent type of<br />
contract between a national oil company and an international oil company<br />
in the exploration and production of hydrocarbons.<br />
European Water Partnership<br />
The European Water Partnership was founded in 2006 as an independent<br />
non-profit organization to promote sustainable water management. It<br />
serves as a discussion forum, promotes partnerships as well as the<br />
exchange of information among relevant stakeholders, and initiates and<br />
coordinates initiatives.<br />
Exploration<br />
To investigate and explore an area in the search for mineral resources<br />
such as crude oil or natural gas. For successful exploration, it is important<br />
to discover oil and gas-bearing structures (deposits, fields) using suitable<br />
geophysical processes at sea or on land rather than by means of expensive<br />
drilling.<br />
-- F<br />
Fermentation<br />
Fermentation is a process in which renewable raw materials are reacted<br />
with the aid of microorganisms such as bacteria, fungi or cell cultures.<br />
Free cash Flow<br />
Cash provided by operating activities less payments related to property,<br />
plant and equipment and intangible assets.<br />
Fungicide<br />
An active ingredient that kills fungi or inhibits their growth (for example<br />
in plants).<br />
-- G<br />
Growth cluster<br />
<strong>BASF</strong> combines the important technology-driven issues of the future<br />
in five growth clusters: energy management, raw material change, nanotechnology,<br />
plant biotechnology and white biotechnology.<br />
<strong>BASF</strong> REPORT <strong>2008</strong><br />
-- H<br />
Herbicide<br />
An active ingredient used to destroy weeds.<br />
HPPO<br />
Technology to produce propylene oxide (PO) from hydrogen peroxide<br />
(HP). HPPO technology is more environmentally and economically viable<br />
than conventional PO methods of production, because no by-products<br />
are produced besides water. PO is an intermediate, for example, in the<br />
production of polyurethane.<br />
-- I<br />
IAS<br />
International Accounting Standards (see also IFRS)<br />
IFRIc<br />
The International Financial <strong>Report</strong>ing Interpretations Committee is a<br />
committee that publishes proposed guidance on IFRS and IAS.<br />
IFRS<br />
International Financial <strong>Report</strong>ing Standards (until 2001: International<br />
Accounting Standards, IAS) are developed and published by the Inter-<br />
national Accounting Standards Board (IASB) headquartered in London,<br />
United Kingdom. In accordance with the IAS Regulations, IFRS are<br />
mandatory for listed companies headquartered in the European Union<br />
since 2005.<br />
Insecticide<br />
An active ingredient used to destroy harmful insects.<br />
International Standard in Assurance Engagements 3000 (ISAE 3000)<br />
ISAE 3000 is published by the International Audit and Assurance Standards<br />
Board (IAASB). It provides guidelines for comprehensive audits,<br />
which contain non-financial data, for example for the audits of sustainability<br />
reports.<br />
ISO 14001<br />
ISO 14001 is an international standard that determines the general<br />
requirements for an environmental management system for voluntary<br />
certification.<br />
ISO 19011<br />
ISO 19011 is an international standard that determines requirements for<br />
audits of quality management and environmental management systems.<br />
-- K<br />
Kyoto Protocol<br />
The Kyoto Protocol is a supplement to the United Nations Framework<br />
Convention on Climate Control. Its main goal is to reduce emissions of<br />
greenhouse gases.<br />
-- l<br />
liquefied Petroleum Gas (lPG)<br />
LPG contains liquefied elements of natural gas (except for methane), e.g.,<br />
propane, butane and propane-butane blends, are used as an alternative<br />
feedstock for cracker operations and for other chemical processes.
-- m<br />
materiality matrix<br />
The materiality matrix identifies and evaluates societal interest as well as<br />
the potential impact of sustainability topics for <strong>BASF</strong>. The aim is to develop<br />
strategies for addressing potential new risks and opportunities at<br />
an early stage. A detailed examination of stakeholder expectations forms<br />
the basis of this analysis.<br />
monitoring<br />
Monitoring systems and tools serve to measure and ensure the adherence<br />
to standards. The objective of monitoring is, among other things,<br />
voluntary commitments such as the adherence to human rights and<br />
internationally recognized labor standards.<br />
mWh<br />
Megawatt hour: a measuring unit for energy.<br />
-- n<br />
nanotechnology<br />
The term nanotechnology applies to materials, structures and technologies<br />
with one thing in common: the creation or presence of at least one<br />
spatial dimension smaller than one hundred nanometer.<br />
naphtha<br />
Liquid petroleum that is obtained as a by-product of oil refining. Heavy<br />
naphtha is the starting point for gasoline production. Light naphtha is the<br />
most important feedstock for steam crackers.<br />
-- O<br />
OEcD<br />
The Organization for Economic Cooperation and Development is an international<br />
body headquartered in Paris, France.<br />
OHSAS 18001<br />
The Occupational Health and Safety Assessment Series (OHSAS) comprises,<br />
among other things, the standard OHSAS 18001 which includes a<br />
management system for occupational safety. This system can be integrated<br />
into an existing quality and environmental protection management<br />
system and certified accordingly.<br />
-- P<br />
Payout Ratio<br />
The payout ratio shows what proportion of earnings is distributed in the<br />
form of a dividend. It is calculated by dividing the total dividend paid by<br />
net income and multiplying by 100.<br />
Perspectives<br />
<strong>BASF</strong> aims to optimally align business models with customer needs and<br />
the market situation. The company initiative “perspectives” supports the<br />
<strong>BASF</strong> business units through, among other things, specific coaching and<br />
the exchange of experiences in the areas of marketing and sales.<br />
Photovoltaics<br />
Photovoltaics convert sunlight directly into electricity via solar cells.<br />
Organic photovoltaics are solar cells made of organic materials.<br />
InFORmATIOn, SERvIcE<br />
Glossary<br />
Plant Biotechnology<br />
An area of biotechnology in which methods of traditional cultivation are<br />
optimized using methods from molecular biology and biochemistry.<br />
Plants can be developed for more efficient agriculture, a healthier diet as<br />
well as for use as renewable resources.<br />
Plant Health<br />
The Plant Health concept involves crop protection products that increase<br />
crop yield and improve quality beyond just disease and insect control.<br />
Product Innovations<br />
New or improved products and applications, which have been on the<br />
market for less than five years.<br />
-- R<br />
Raw material change<br />
Analysis and evaluation of processes to use natural gas, coal and renewable<br />
raw materials for chemical value-adding chains.<br />
REAcH<br />
An E.U. regulatory framework for the registration, evaluation and authorization<br />
of chemicals.<br />
Responsible care ®<br />
A worldwide initiative by the chemical industry to continuously improve its<br />
performance in the fields of environmental protection, health and safety.<br />
Retention<br />
There are two applications for generated profits: distribution to shareholders<br />
or continuance in the company. The latter is refered to as retention.<br />
Return on Assets<br />
This describes the return we make on the average assets employed<br />
during the year. It is calculated as income from ordinary activities plus<br />
interest expenses as a percentage of average assets.<br />
Return on Equity after Tax<br />
This describes the return we make on the average equity used during<br />
a fiscal year. It is calculated as income before minority interests as a percentage<br />
of average equity.<br />
-- S<br />
ScR catalysts<br />
SCR (Selective Catalytic Reduction) is one of <strong>BASF</strong>’s many solutions to<br />
meet the increasing demand of emission technologies which have arisen<br />
due the increasingly stricter regulations of diesel vehicles. The SCR catalysts<br />
are comprised of ceramic combs with an active catalyst component.<br />
Seed Treatment Products<br />
These are crop protection products applied with specific technologies<br />
directly on the seed and thus protect crops in the emerging stages<br />
against diseases and harmful insects.<br />
Special Items<br />
One-time charges or one-time income that significantly affect the earnings<br />
of a segment or the <strong>BASF</strong> Group. Special items include, for example,<br />
charges arising from restructuring measures and severance payments.<br />
<strong>BASF</strong> REPORT <strong>2008</strong><br />
233
234<br />
InFORmATIOn, SERvIcE<br />
Glossary<br />
Spot market<br />
A market where an agreed deal including delivery, acceptance and payment<br />
occurs immediately. In contrast to forward contracts where the<br />
delivery, acceptance and payment occurs at point in time after the conclusion<br />
of the deal.<br />
Stakeholder<br />
The term refers to persons or groups whose interests are interlinked with<br />
those of a company in a variety of ways. <strong>BASF</strong>’s stakeholders include<br />
shareholders, business partners, employees, neighbors and society, and<br />
the environment.<br />
Steamcracker<br />
A plant in which steam is used to “crack” naphtha (petroleum) or natural<br />
gas. The resulting petrochemicals – above all, ethylene and propylene –<br />
are the starting materials used to manufacture most of <strong>BASF</strong>’s products.<br />
Styrenics<br />
The production of the primary product styrene is primarily for<br />
captive use (backward integration). Styrenics are used in many fields,<br />
including the construction, packaging, automotive, electric and leisure<br />
industries.<br />
Substances and Products<br />
<strong>BASF</strong> sells a wide range of products from its own production as well as<br />
merchandise. Products can be made of a single substance or a mixture<br />
of different substances.<br />
Sustainability<br />
The objective of sustainable development is to meet the economic, environmental<br />
and social needs of society without harming the development<br />
opportunities of future generations.<br />
Swap<br />
An agreement between two parties to exchange payment flows in the<br />
future. In an interest swap, a fixed (variable) interest rate is exchanged for<br />
a floating (fixed) rate for an agreed nominal amount.<br />
-- T<br />
Technology Platforms<br />
Our four global technology platforms – Polymer Research, Specialty<br />
Chemicals Research, Chemicals Research & Engineering and Plant Biotechnology<br />
Research – form the heart of our Know-how Verbund.<br />
Tetrahydrofuran (THF)<br />
Tetrahydrofuran is a starting compound for Polytetrahydrofuran<br />
(PolyTHF ® ), a component for the production of elastic fibers.<br />
Training verbund<br />
The Training Verbund is a cooperation between <strong>BASF</strong> and small to midsize<br />
companies. The goal is to secure additional apprenticehips with partner<br />
companies in the Rhine Neckar Region.<br />
<strong>BASF</strong> REPORT <strong>2008</strong><br />
-- U<br />
U.n. millennium Development Goals<br />
In 2000, the member states of the United Nations adopted eight global<br />
development goals. The goals are measured by means of indicators and<br />
are to be reached by 2015. These include the fight against extreme<br />
poverty and hunger, the reduction of child mortality and environmental<br />
sustainability.<br />
-- v<br />
verbund<br />
The Verbund is one of <strong>BASF</strong>’s greatest strengths: At our major sites, we<br />
link our production plants in a sophisticated system along our value-adding<br />
chains. We thus save energy and raw materials, reduce logistics<br />
costs and use infrastructure facilities jointly.<br />
value-adding chain<br />
Successive steps in a production process, from the raw materials through<br />
various intermediate steps to the finished product.<br />
-- W<br />
White Biotechnology<br />
An area of biotechnology that uses microorganisms and/or enzymes to<br />
produce chemical products, utilized in many levels of the value-adding<br />
chain in the chemical industry. This involves, for example, the biotechnological<br />
production of enzymes and chirale intermediates.<br />
WInGAS GmbH & co. KG<br />
WINGAS GmbH & Co.KG is a joint venture company with our Russian<br />
partner Gazprom. At the end of <strong>2008</strong>, <strong>BASF</strong> held 50% plus one share of<br />
WINGAS through its 100% subsidiary Wintershall Holding AG. WINGAS is<br />
an European company active in natural gas trading, storage and distribution.<br />
Its customers include regional and communal gas suppliers, industrial<br />
companies and power plant operators.
InDEx<br />
-- A<br />
Acquisitions . . . . . . . . . . . . . . . . . . . . . . . . . 14, 40, 44, 46 f., 80 f., 118, 123 f., 157<br />
Acrylics & Dispersions .................................63 ff., 87 ff., 125, 175<br />
Added value ...........................................8, 14, 18, 22, 162, 209<br />
Agricultural Solutions ................ 40 f., 48 f., 75 ff.,87 ff., 157, 161, 175<br />
Architectural coatings . . . . . . . . . . . . . . . . . . . . . . . . . . . . . . . . . . . . . . . . . . . . . . 69, 74, 89<br />
Auditor’s report . . . . . . . . . . . . . . . . . . . . . . . . . . . . . . . . . . . . . . . . . . . . . . . . . . . . . . . . . . . . 151<br />
Audits .................................................. 28, 30, 96, 106f., 110<br />
Automotive coatings ......................................................74 f.<br />
-- B<br />
<strong>BASF</strong> Plant Science . . . . . . . . . . . . . . . . . . . . . . . . . . . . . . . . . . . . . . . . . . . . . . . . . 26, 76 ff.<br />
Biotechnology .................................................34 f., 77 f., 103<br />
Board of Executive Directors ...................2, 8 f., 10, 30, 113 f., 129 ff.<br />
-- c<br />
Care Chemicals . . . . . . . . . . . . . . . . . . . . . . . 41 f., 63 f., 67 f., 87 ff., 126 ff.,175 ff.<br />
Cash flow ................................................... 45 ff., 123, 154 ff.<br />
Catalysts . . . . . . . . . . . . . . . . . . . . . . . . . . . . . . . . . . . . . . . . . . . . 40, 69 ff., 161, 175, 213<br />
Chemicals . . . . . . . . . . . . . . . . . . . . . . . . . . . . . . . . . . . . . . . 40 f., 48 f., 50 ff., 87 f., 175<br />
Climate protection . . . . . . . . . . . . . . . . . . . 1, 3, 7, 16, 22, 28, 34, 99 ff., 102, 122<br />
Coatings ...................................... 40, 69 ff., 74 f., 89 f., 119, 175<br />
Compliance Program . . . . . . . . . . . . . . . . . . . . . . . . . . . . . . . . . . . . . . . . . . . 12, 29 f., 119<br />
Consolidated balance sheets . . . . . . . . . . . . . . . . . . . . . . . . . . . . . . . . . . . . . . . . . . . 43 ff.<br />
Construction Chemicals ..........................40, 69 ff., 125, 161 f., 175<br />
Cooperation ..................................14, 23, 34 f., 52, 76 f., 80 f., 89<br />
Corporate Governance . . . . . . . . . . . . . . . . . . . . . . . . . . . . . . . . . . . . . . . . . . . 128 ff., 186<br />
Crop Protection . . . . . . . . . . . . . . . . . . . . . . . . . . . . . . . . . . . . . . . . . 75, 78 f., 161 ff., 175<br />
Customers . . . . . . . . . . . . . . . . . 12, 14 f., 24 f., 28 ff., 34, 38, 50 ff., 57 ff., 63 ff.,<br />
. . . . . . . . . . . . . . . . . . . . . . . . . . 69 ff., 75 ff., 80 ff., 87 f., 91, 96, 99 ff., 104 f., cover<br />
-- D<br />
Demographic change ........................................... 14, 90 f., 118<br />
Derivative financial instruments ......................................165, 212<br />
Dispersions ................................................................63 f.<br />
Diversity . . . . . . . . . . . . . . . . . . . . . . . . . . . . . . . . . . . . . . . . . . . . . . . . . . . . . . . . . . . . . . . . . . .1, 91<br />
Divestitures ................................ 40 ff. 45 f., 145, 155, 170 ff., 175<br />
Dividend .................................. 18 ff., 44 ff., 123 f., 147, 155, 163<br />
Donations and sponsoring . . . . . . . . . . . . . . . . . . . . . . . . . . . . . . . . . . . . 33, 97f, cover<br />
-- E<br />
Eco-Efficiency Analysis ................................................31, 105<br />
Education . . . . . . . . . . . . . . . . . . . . . . . . . . . . . . . . . . . . . . . . . . . . . . . . . . . . . . . . . . . . . . . . . . 97 f.<br />
Employee representatives ..................................................94<br />
Employees . . . . . . . . . . . . . . . . . . . . . . .1, 2 f., 6, 12 f., 14 f., 17, 19, 24, 27, 29 ff.,<br />
. . . . . . . . . . . . . . . . . . . . . . . . . . 33, 34, 76, 90 ff., 95, 96, 97 f., 106 ff., 117 f., cover<br />
Energy efficiency ....................14, 16, 22, 34, 69 f., 99 ff., 102 ff., 122<br />
Environmental protection .......3, 12, 28 f., 34, 88, 106 ff., 167, 181, 204 f.,<br />
. . . . . . . . . . . . . . . . . . . . . . . . . . . . . . . . . . . . . . . . . . . . . . . . . . . . . . . . . . . . . . . . . . . . . . . 206, cover<br />
-- F<br />
Functional Solutions ...................... 40 f., 48 f., 69 ff., 87 ff., 161, 175<br />
-- G<br />
Global Compact . . . . . . . . . . . . . . . . . . . . . . . . . . . . . . . . . . . . . . . . . . . 2 f., 12 f., 98, 240<br />
Global <strong>Report</strong>ing Initiative ...........................................2 f., 240<br />
Growth clusters . . . . . . . . . . . . . . . . . . . . . . . . . . . . . . . . . . . . . . . .14, 22 f., 35, 103, 123<br />
InFORmATIOn, SERvIcE<br />
Index<br />
--H<br />
Health protection . . . . . . . . . . . . . . . . . . . . . . . . . .12,17, 28, 90, 95, 96, 106 ff, 118<br />
-- I<br />
Incentive share program “Plus” ...........................................210<br />
Income, statement of ......................................................152<br />
Industrial coatings . . . . . . . . . . . . . . . . . . . . . . . . . . . . . . . . . . . . . . . . . . . . . . . . . . . . . . . . . . 74<br />
Innovation . . . . . . . . . . . . . . . 12, 14, 34 f., 51, 59, 63 f., 69, 75 ff., 110, 118,123<br />
Inorganics . . . . . . . . . . . . . . . . . . . . . . . . . . . . . . . . . . . . . . . . . 35, 50, 54 f., 85, 125, 175<br />
Intermediates ...................................42, 50 ff., 56, 125, 175, 181<br />
Investments ....................... 36, 45 ff., 48, 52, 60, 65, 71, 77, 83, 147<br />
Investor Relations ...........................................................22<br />
-- K<br />
Knowledge Factory . . . . . . . . . . . . . . . . . . . . . . . . . . . . . . . . . . . . . . . . . . . . . . . . . . . . . . . . . 98<br />
-- m<br />
Monitoring ........................................... 13, 28 ff., 101, 114, 118<br />
-- n<br />
Nanotechnology . . . . . . . . . . . . . . . . . . . . . .9, 14, 23, 32, 35, 70, 111, 122 f., 145<br />
Naphtha . . . . . . . . . . . . . . . . . . . . . . . . . . . . . . . . . . . . . . . . . . . . . . . . . .38, 50, 55, 213, 217<br />
-- O<br />
Oil & Gas . . . . . . . . . . . . . . . . . . . . . . . . . 25, 41, 48, 80 ff., 157, 162, 175, 213, 225<br />
Option program . . . . . . . . . . . . . . . . . . . . . . . . . . . . . . . . . . . . . . . . . . . . . . . . .41, 94, 199 ff.<br />
-- P<br />
Performance Chemicals ........................... 41, 63,ff., 68, 125 f., 175<br />
Performance Polymers . . . . . . . . . . . . . . . . . . . . . . 40 f., 57 f., 61, 87 ff., 125, 173<br />
Performance Products . . . . . . . . . . . . . . . . . . . . . . . . . . . 40 f., 63 ff., 87 ff., 125, 175<br />
Personnel costs ..................... 94, 139 f., 187, 210 f., 219, 239, cover<br />
Petrochemicals . . . . . . . . . . . . . . . . . . . . . . . . . . . . . . . . . . . . . 41, 50, 55, 88, 125, 175<br />
Plastics . . . . . . . . . . . . . . . . . . . . . . . . . . . . . . . . . . . . . . 40 f., 57 ff., 87 f., 125, 175, 178<br />
Polyurethanes ...............................................40, 57 f., 62, 175<br />
-- R<br />
Rating ........................................................ 20, 46, 126, 168<br />
REACH . . . . . . . . . . . . . . . . . . . . . . . . . . . . . . . . . . . . . . . . . . . . . . . . . . . 16, 110 f., 117, 145<br />
Regions .................... 25, 36, 40, 66, 73 f., 80, 87 ff., 113, 124, 175 ff.<br />
Renewable raw materials .....................34 f., 58 f., 77, 99, 103, cover<br />
Research and development ......... 14, 34 ff., 51, 59, 64, 69 f., 75 ff., 118<br />
Responsible Care ......................... 28, 100, 102., 106 ff., 238, cover<br />
Resources ..................... 1, 14, 24 f., 31, 34, 51, 57, 64, 70, 97 f., 99,<br />
. . . . . . . . . . . . . . . . . . . . . . . . . . . . . . . . . . . . . . . . 102 f., 104f., 111, 128, 166, 169, 221<br />
-- S<br />
Safety ...........3, 12, 16 f., 28 ff., 80 ff., 95, 106 ff., 106 ff., 110 f., 115 ff.,<br />
Sales .....................40 f., 44, 54 ff., 61 f., 66 ff., 72 ff., 76, 78 f., 85 ff.,<br />
. . . . . . . . . . . . . . . . . . . . . . . . . . . . . . . . . . . . . . . . . . . . . . . . . . . . . . . . . . . . . . . 88 f., 150, 168 ff.<br />
Segment data . . . . . . . . . . . 28 f., 54, 61, 66, 72, 78, 84, 109, 118 f., 151, 207<br />
. . . . . . . . . . . . . . . . . . . . . . . . . . . . . . . . . . . . . . . . . . . . . . . . . 131, 138f., 149, 181, 206, 221<br />
Share buyback program ................................................19, 46<br />
Shareholders .......................................................19, 46, 130<br />
Shares . . . . . . . . . . . . . . . . . . . . . . . . . . . . . . . . . .16, 18 ff., 39, 42, 45 , 48, 124, 131 f.<br />
Socio-Eco-Efficiency Analysis . . . . . . . . . . . . . . . . . . . . . . . . . . . . . . . . . . . . . . 31, 97 f.,<br />
Special items ...........................................41 f., 56, 68, 73, 88 f.<br />
Stakeholder . . . . . . . . . . . . . . . . . . . . . . . . . . . . . . . . . . . . . . . . . . . . . . . . . . . 12, 32, 90, 242<br />
Statement by the Board of Executive Directors ..........................148<br />
<strong>BASF</strong> REPORT <strong>2008</strong><br />
235
236<br />
InFORmATIOn, SERvIcE<br />
Index<br />
Steamcracker . . . . . . . . . . . . . . . . . . . . . . . . . . . . . . . . . . . . . . . . . . . . . . . . . . . 50, 176, 66 f.<br />
Stockholder’s equity ...................................... 43 f., 45 ff., 153 ff.<br />
Strategy . . . . . . . . . . . . . . . . . . . . . . . 1, 2, 8 f., 14 f., 20, 28, 50, 57, 63, 69, 75 ff.,<br />
. . . . . . . . . . . . . . . . . . . . . . 80 ff., 90, 92, ,99, 102, 109 ff., 112, 127, 216, 222, 242<br />
Success . . . . . . . . . . . . . . . . . . . . . . . . . . . . . . . . . . . . . . . . . . . . . . . . . . . . . . . . . . . . . 28 ff., 105<br />
Supervisory Board .............................................30, 129 f., 134<br />
Suppliers . . . . . . . . . . . . . . . . . . . . . . . . . . . . . . . . . . . . . . . . . . . . . . . . . . 29 ff., 51, 108, 115<br />
Sustainability ......................1, 2 f., 9, 15, 20 ff., 28 ff., 63, 70, 97, 99,<br />
. . . . . . . . . . . . . . . . . . . . . . . . . . . . . . . . . . . . . . . . . . . . . . . . . . . . . . . . . . . . . . . . . .105, 118, cover<br />
-- T<br />
Training . . . . . . . . . . . . . . . . . . . . . . . . . . . . . . . . . . . . . . . . . . . . . . . . . . . . . . .27, 90 ff., 107 ff.<br />
Registered Trademarks 1<br />
Adblue: ...reg. trademark of the Association of the Automotive Industry<br />
Agcelence: .............................................reg. trademark of <strong>BASF</strong> Group<br />
Amflora: ..................................................reg. trademark of <strong>BASF</strong> Group<br />
Arashi: .....................................................reg. trademark of <strong>BASF</strong> Group<br />
Basotect: ................................................reg. trademark of <strong>BASF</strong> Group<br />
Baxxodur: ...............................................reg. trademark of <strong>BASF</strong> Group<br />
capron: ...................................................reg. trademark of <strong>BASF</strong> Group<br />
cellasto: .................................................reg. trademark of <strong>BASF</strong> Group<br />
Ecoflex: ...................................................reg. trademark of <strong>BASF</strong> Group<br />
Ecovio: ....................................................reg. trademark of <strong>BASF</strong> Group<br />
Elastocoast: ...........................................reg. trademark of <strong>BASF</strong> Group<br />
Elastollan: ...............................................reg. trademark of <strong>BASF</strong> Group<br />
Elastopir: ................................................reg. trademark of <strong>BASF</strong> Group<br />
Elastopor: ...............................................reg. trademark of <strong>BASF</strong> Group<br />
Elastoskin: ..............................................reg. trademark of <strong>BASF</strong> Group<br />
Enluxtra: ........................................................trademark of <strong>BASF</strong> Group<br />
F 500: ......................................................reg. trademark of <strong>BASF</strong> Group<br />
Glasurit: ..................................................reg. trademark of <strong>BASF</strong> Group<br />
Greenloop: ............................................reg. trademark of <strong>BASF</strong> Group<br />
Headline: ................................................reg. trademark of <strong>BASF</strong> Group<br />
Kaurit: .....................................................reg. trademark of <strong>BASF</strong> Group<br />
Kixor: ......................................................reg. trademark of <strong>BASF</strong> Group<br />
lumogen: ...............................................reg. trademark of <strong>BASF</strong> Group<br />
lupranol: ................................................reg. trademark of <strong>BASF</strong> Group<br />
luran: ......................................................reg. trademark of <strong>BASF</strong> Group<br />
luredur: ..................................................reg. trademark of <strong>BASF</strong> Group<br />
lutensol: .................................................reg. trademark of <strong>BASF</strong> Group<br />
micronal: .................................................reg. trademark of <strong>BASF</strong> Group<br />
1 Trademarks are not necessarily internationally registered.<br />
<strong>BASF</strong> REPORT <strong>2008</strong><br />
-- v<br />
Values . . . . . . . . . . . . . . . . . . . . . . . . . . . . . . . . . . . . . . . . . . . . . . . . . . . . . . . . . .12 f., 29 ff., 129<br />
Value-based management . . . . . . . . . . . . . . . . . . . . . . . . . . . . . . . . . . . . . . . . . . . . . 15, 27<br />
Verbund . . . . . . . . 24 ff.,50 ff., 62, 63, 77, 89, 93, 102, 112 ff., 134, 159, 191<br />
-- W<br />
Wintershall . . . . . . . . . . . . . . . . . . . . . 42, 85, 88 ff., 100, 133, 186, 170, 198, 222<br />
miramid: .................................................reg. trademark of <strong>BASF</strong> Group<br />
naphthamax: .................................................trademark of <strong>BASF</strong> Group<br />
neopor: ...................................................reg. trademark of <strong>BASF</strong> Group<br />
Oppanol: .................................................reg. trademark of <strong>BASF</strong> Group<br />
Paliogen: .................................................reg. trademark of <strong>BASF</strong> Group<br />
Plasticeram: ...........................................reg. trademark of <strong>BASF</strong> Group<br />
Poly THF: ................................................reg. trademark of <strong>BASF</strong> Group<br />
Pursuit: ...................................................reg. trademark of <strong>BASF</strong> Group<br />
Premise: ..................................................... reg. trademark of Bayer AG<br />
Responsible care: .................................. reg. trademark of the Conseil<br />
Européen de l’Industrie Chimique<br />
Rheocel: .................................................reg. trademark of <strong>BASF</strong> Group<br />
R-m: ........................................................reg. trademark of <strong>BASF</strong> Group<br />
Salcomix: .......................................................trademark of <strong>BASF</strong> Group<br />
SEEBAlAncE: .......................................reg. trademark of <strong>BASF</strong> Group<br />
Sicopal: ...................................................reg. trademark of <strong>BASF</strong> Group<br />
Smart Dynamic<br />
construction: ................................ non-reg. trademark of <strong>BASF</strong> Group<br />
Styropor: .................................................reg. trademark of <strong>BASF</strong> Group<br />
Suvinil: ....................................................reg. trademark of <strong>BASF</strong> Group<br />
Termidor: ................................................reg. trademark of <strong>BASF</strong> Group<br />
Trilon: ......................................................reg. trademark of <strong>BASF</strong> Group<br />
Ucrete: ....................................................reg. trademark of <strong>BASF</strong> Group<br />
Ultradur: .................................................reg. trademark of <strong>BASF</strong> Group<br />
Ultraform: ...............................................reg. trademark of <strong>BASF</strong> Group<br />
Ultramid: .................................................reg. trademark of <strong>BASF</strong> Group<br />
Ultrason: .................................................reg. trademark of <strong>BASF</strong> Group
TEn-YEAR SUmmARY<br />
Million €<br />
Sales and Earnings 1<br />
InFORmATIOn, SERvIcE<br />
Ten-year Summary<br />
1999 2000 2001 2002 2003 2004 2005 2006 2007 <strong>2008</strong><br />
Sales 29,473 35,946 32,500 32,216 33,361 37,537 42,745 52,610 57,951 62,304<br />
Income from operations before depreciation and<br />
amortization (EBITDA)<br />
4,671<br />
5,986<br />
4,142<br />
5,105<br />
5,110<br />
7,685<br />
8,233<br />
9,723<br />
10,225 9,562<br />
Income from operations (EBIT) 2,009 3,070 1,217 2,641 2,658 5,193 5,830 6,750 7,316 6,463<br />
Income from ordinary activities 2,606 2,827 609 2,641 2,168 4,347 5,926 6,527 6,935 5,976<br />
Extraordinary income – – 6,121 – – – – – – –<br />
Income before taxes and minority interests 2,606 2,827 6,730 2,641 2,168 4,347 5,926 6,527 6,935 5,976<br />
Income before minority interests 1,245 1,282 5,826 1,599 976 2,133 3,168 3,466 4,325 3,305<br />
Net income 1,237 1,240 5,858 1,504 910 2,004 3,007 3,215 4,065 2,912<br />
capital expenditures and depreciation 1<br />
Additions to property, plant and equipment and<br />
intangible assets<br />
3,253<br />
6,931<br />
3,313<br />
Thereof property, plant and equipment 2,764 3,631 3,037 2,677 2,293 2,022 2,188 4,068 2,564 2,809<br />
Depreciation and amortization of property, plant<br />
and equipment and intangible assets<br />
2,662<br />
2,916<br />
2,925<br />
Thereof property, plant and equipment 2,018 2,245 2,307 2,012 1,951 2,053 2,035 2,482 2,294 2,481<br />
number of employees<br />
At year-end 104,628 103,273 92,545 89,389 87,159 81,955 80,945 95,247 95,175 96,924<br />
<strong>Annual</strong> average 107,163 105,784 94,744 90,899 88,167 85,022 80,992 88,160 94,893 95,885<br />
Personnel costs 1 6,180 6,596 6,028 5,975 5,891 5,615 5,574 6,210 6,648 6,364<br />
Key data 1<br />
Earnings per share (€) 8 1.00 1.01 4.86 2 1.30 0.81 1.83 2.87 3.19 4.16 3.13<br />
Cash provided by operating activities 3,255 2,992 2,319 2,313 4,878 4,634 5,250 3 5,940 5,807 5,023<br />
EBITDA in percent of sales 15.8 16.7 12.7 15.8 15.3 20.5 19.3 18.5 17.6 15.3<br />
Return on assets (%) 10.2 9.9 3.1 8.4 7.4 13.2 17.7 17.5 16.4 13.5<br />
Return on equity after tax (%) 9.1 9.0 36.6 2 9.3 6.0 12.9 18.6 19.2 22.4 17.0<br />
Appropriation of profits<br />
Net income of <strong>BASF</strong> SE 4 1,007 1,265 5,904 1,045 1,103 1,363 1,273 1,951 2,267 2,982<br />
Transfer to retained earnings 4 304 50 5,153 247 334 449 – – – –<br />
Dividend 695 1,214 758 789 774 904 1,015 1,484 1,831 1,791 5<br />
Dividend per share (€) 8 0.57 0.65 0.65 0.70 0.70 0.85 1.00 1.50 1.95 1,95<br />
number of shares as of December 31<br />
7, 8 (million)<br />
1,242.0<br />
+0.35 6<br />
1,214.8<br />
1 Starting in 2005, the accounting and reporting of the <strong>BASF</strong> Group is<br />
performed in accordance with International Financial <strong>Report</strong>ing Standards<br />
(IFRS). The previous year’s figures have been restated in accordance with<br />
IFRS. The figures for the years up to and including 2003 were prepared according<br />
to German GAAP.<br />
2 Including extraordinary income<br />
3 Before external financing of pension obligations<br />
4 Calculated in accordance with German GAAP<br />
1,166.8<br />
3,055<br />
2,464<br />
1,140.6<br />
3,415<br />
2,452<br />
1,113.3<br />
2,163<br />
2,492<br />
1,080.9<br />
2,523<br />
2,403<br />
1,028.8<br />
10,039<br />
2,973<br />
999.4<br />
4,425<br />
2,909<br />
956.4<br />
3,634<br />
3,099<br />
918.5<br />
5 With regard to the number of qualifying shares on December 31, <strong>2008</strong><br />
6 Special dividend of stockholders’ equity charged with 45% corporate income<br />
tax<br />
7 After deduction of repurchased shares earmarked for cancellation<br />
8 In the second quarter of <strong>2008</strong>, we conducted a two-for-one stock split. The<br />
previous years’ figures for earnings per share, dividend per share and number<br />
of shares have been adjusted accordingly.<br />
<strong>BASF</strong> REPORT <strong>2008</strong><br />
237
238<br />
InFORmATIOn, SERvIcE<br />
Ten-year Summary<br />
consolidated Balance Sheets (German GAAP) (million €)<br />
<strong>BASF</strong> REPORT <strong>2008</strong><br />
1999 2000 2001 2002 2003<br />
Intangible assets 2,147 4,538 3,943 3,464 3,793<br />
Property, plant and equipment 12,416 13,641 14,190 13,745 13,070<br />
Financial assets 1,507 3,590 3,360 3,249 2,600<br />
Fixed assets 16,070 21,769 21,493 20,458 19,463<br />
Inventories 4,028 5,211 5,007 4,798 4,151<br />
Accounts receivable, trade 4,967 6,068 5,875 5,316 4,954<br />
Other receivables 2,211 3,369 2,384 2,947 3,159<br />
Deferred taxes 1,225 1,270 1,373 1,204 1,247<br />
Marketable securities 518 364 383 132 147<br />
Cash and cash equivalents 990 506 360 231 481<br />
current assets 13,939 16,788 15,382 14,628 14,139<br />
Total assets 30,009 38,557 36,875 35,086 33,602<br />
Subscribed capital 1,590 1,555 1,494 1,460 1,425<br />
Capital surplus 2,675 2,746 2,914 2,948 2,983<br />
Paid-in capital 4,265 4,301 4,408 4,408 4,408<br />
Retained earnings 9,002 8,851 12,222 12,468 12,055<br />
Currency translation adjustment 549 662 532 (330) (972)<br />
Minority interests 329 481 360 396 388<br />
Stockholders’ equity 14,145 14,295 17,522 16,942 15,879<br />
Pensions and other long-term provisions 5,812 6,209 6,809 6,233 6,205<br />
Tax and other short-term provisions 2,826 3,334 3,332 2,764 2,982<br />
Provisions 8,638 9,543 10,141 8,997 9,187<br />
Financial indebtedness 1,294 7,892 2,835 3,610 3,507<br />
Accounts payable, trade 2,316 2,848 2,467 2,344 2,056<br />
Other liabilities 3,616 3,979 3,910 3,193 2,973<br />
liabilities 7,226 14,719 9,212 9,147 8,536<br />
Provisions and liabilities 15,864 24,262 19,353 18,144 17,723<br />
Thereof long-term liabilities 7,529 9,059 9,955 9,211 10,285<br />
Total stockholders’ equity and liabilities 30,009 38,557 36,875 35,086 33,602
consolidated Balance Sheets (IFRS) (million €)<br />
InFORmATIOn, SERvIcE<br />
Ten-year Summary<br />
2004 2005 2006 2007 <strong>2008</strong><br />
Intangible assets 3,607 3,720 8,922 9,559 9,889<br />
Property, plant and equipment 13,063 13,987 14,902 14,215 15,032<br />
Investments accounted for using the equity method 1,100 244 651 834 1,146<br />
Other financial assets 938 813 1,190 1,952 1,947<br />
Deferred taxes 1,337 1,255 622 679 930<br />
Other receivables and miscellaneous long-term assets 473 524 612 655 642<br />
long-term assets 20,518 20,543 26,899 27,894 29,586<br />
Inventories 4,645 5,430 6,672 6,578 6,763<br />
Accounts receivable, trade 5,861 7,020 8,223 8,561 7,752<br />
Other receivables and miscellaneous short-term assets 2,133 1,586 2,607 2,337 3,948<br />
Marketable securities 205 183 56 51 35<br />
Cash and cash equivalents 2,086 908 834 767 2,776<br />
Assets of disposal groups – – – 614 –<br />
Short-term assets 14,930 15,127 18,392 18,908 21,274<br />
Total assets 35,448 35,670 45,291 46,802 50,860<br />
Subscribed capital 1,383 1,317 1,279 1,224 1,176<br />
Capital surplus 3,028 3,100 3,141 3,173 3,241<br />
Retained earnings 11,923 11,928 13,302 14,556 13,250<br />
Other comprehensive income (60) 696 325 174 (96)<br />
Minority interests 328 482 531 971 1,151<br />
Stockholders’ equity 16,602 17,523 18,578 20,098 18,722<br />
Provisions for pensions and similar obligations 4,124 1,547 1,452 1,292 1,712<br />
Other provisions 2,376 2,791 3,080 3,015 2,757<br />
Deferred taxes 948 699 1,441 2,060 2,167<br />
Financial indebtedness 1,845 3,682 5,788 6,954 8,290<br />
Other liabilities 1,079 1,043 972 901 917<br />
long-term liabilities 10,372 9,762 12,733 14,222 15,843<br />
Accounts payable, trade 2,372 2,777 4,755 3,763 2,734<br />
Provisions 2,364 2,763 2,848 2,697 3,043<br />
Tax liabilities 644 887 858 881 860<br />
Financial indebtedness 1,453 259 3,695 3,148 6,224<br />
Other liabilities 1,641 1,699 1,824 1,976 3,434<br />
Liabilities of disposal groups – – – 17 –<br />
Short-term liabilities 8,474 8,385 13,980 12,482 16,295<br />
Total stockholders‘ equity and liabilities 35,448 35,670 45,291 46,802 50,860<br />
<strong>BASF</strong> REPORT <strong>2008</strong><br />
239
240<br />
InFORmATIOn, SERvIcE<br />
GRI- and Global Compact Index<br />
GRI AnD GlOBAl cOmPAcT InDEx<br />
An extended overview with information on the GRI core and additional indicators as well as the principles of the United Nations Global<br />
Compact can be found at basf.com/gri_gc_e<br />
Global<br />
compact<br />
Principle GRI Indicator<br />
Strategy and Profile<br />
vision and strategy<br />
Subject Page<br />
1.1 Chief executive statement 8–9<br />
1.2<br />
Profile<br />
Description key risks and opportunities 14-15, 28–32, 112–119, 123–124<br />
2.1–2.10<br />
<strong>Report</strong> parameters<br />
Organizational profile, structures, markets Cover, 3, 14, 19–20, 22, 24–26, 30–32, 39–44, 50, 59, 86, 92-93,<br />
96, 100, 106<br />
3.1, 3.3 <strong>Report</strong>ing period 2–3<br />
3.4–3.13<br />
Governance, commitments<br />
and engagement<br />
<strong>Report</strong> scope, assurance Cover, 2–3, 16, 151, 240<br />
10 4.1–4.7 Structure and governance 10–11, 12, 20, 28, 128–132, 133–143<br />
1 – 10 4.8–4.13 Guidelines and policies 3, 12–13, 15, 20, 28–32, 90, 98, 99–111, 128–129<br />
1, 3, 7, 8, 10 4.14–4.17<br />
Economic performance indicators<br />
Stakeholder engagement 2, 12–13, 22, 28–32, 77, 90, 92, 94, 95, 98<br />
EC1 Economic value generated and distributed 33, 39–42, 48–49, 93–94, 97–98<br />
7, 8, 9 EC2 Financial implications due to climate change 35, 99, 117, 123<br />
EC3 Coverage of benefit plan obligations 94<br />
6 EC7 Procedures for local hiring 13, 90–91, 93<br />
EC8 Development and impact of investments for public benefit 97–98<br />
EC9<br />
Environmental performance indicators<br />
Indirect economic impact 33, 98<br />
7, 8, 9 EN1–EN2 Materials used 29, 32, 102–103, 104–105<br />
7, 8, 9 EN3–EN7 Energy 34–35, 51, 57, 63, 70, 99–101, 102–103<br />
8, 9 EN8–EN10<br />
Emissions, effluents and waste<br />
Water consumption 104–105<br />
7, 8, 9 EN16–EN20 Greenhouse gases, ozone-depleting substances, air 16, 34–35, 51, 57, 63, 70, 99–101, 106–107<br />
8 EN21 Waste water 104–105<br />
8 EN22<br />
Products and services<br />
Waste 107<br />
7, 8, 9 EN26 Products and services 31–32, 51, 57, 63–64, 69–70, 82, 99, 101, 103, 105, 106–109,<br />
110-111<br />
7, 8, 9 EN29, EN30<br />
Social performance indicators<br />
labor practices and labor quality<br />
Distribution and transport, environmental expenditures 108–109, 204<br />
1, 2, 3, 4, 5, 6 LA1, LA2–LA5 Employment 13, 28–29, 90–94<br />
1 LA7, LA8 Health and safety 95, 96<br />
1 LA10, LA11 Training and education 90, 93<br />
1, 6 LA13 Composition of governance bodies 91<br />
1, 6 LA14<br />
Human rights<br />
Equal employment 91<br />
1, 2, 3, 4, 5, 6 HR1 Significant investment agreements 12–13, 28–29<br />
1, 2, 3, 4, 5, 6 HR2 Screening of suppliers 12–13, 29, 109<br />
1, 2, 6 HR4 Non-discrimination 12–13, 28–30, 91<br />
1, 2, 3 HR5 Freedom of association 12–13, 28–29, 94<br />
1, 2, 4, 5 HR6, HR7 Child labor, forced labor, compulsory labor 12–13, 28–29<br />
1, 2 HR8<br />
Society<br />
Training security personnel 109<br />
SO1 Community 32, 33<br />
10 SO2–SO4 Bribery and corruption 12, 30<br />
1 – 10 SO5, SO6<br />
Product stewardship<br />
Political contributions 32, 97<br />
1, 7 PR1 Consumer health and safety 16, 28, 31–32, 34, 106–109, 110–111<br />
8 PR 3 Product and service information 31–32, 34, 110–111<br />
PR 5 Customer satisfaction 31<br />
Since 2003, <strong>BASF</strong> has been participating in the feedback meetings of the Global<br />
<strong>Report</strong>ing Initiative (GRI) and has been working to further develop the guidelines<br />
together with experts from industry, non-governmental organizations, analysts and<br />
financial auditors. We reported on the basis of the GRI for the first time in our Corporate<br />
<strong>Report</strong> 2003. The GRI aims to make international reporting comparable. Since<br />
2005, we have been supporting the Global <strong>Report</strong>ing Initiative as an Organizational<br />
Stakeholder. The <strong>BASF</strong> <strong>Report</strong> <strong>2008</strong> has been aligned with the indicators of the<br />
current GRI-guideline G3.<br />
<strong>BASF</strong> REPORT <strong>2008</strong><br />
This short index shows where to find information on the GRI core and additional indicators,<br />
as well as topics relevant to the Principles of the United Nations Global Compact,<br />
in this report. An extended overview is available on the Internet at<br />
basf.com/gri_gc_e. The online index contains all GRI reporting elements, all GRI core<br />
and additional indicators and shows where details are to be found in our printed and<br />
online reporting. We also give a brief explanation if no data is available for a given<br />
indicator.<br />
more information on the GRI can be found at www.globalreporting.org
pRIZES And AwARdS<br />
dow JonES SuStAInABIlIty IndEx<br />
Best Chemical Company<br />
In <strong>2008</strong>, <strong>BASF</strong> was named as the chemical sector leader<br />
in the Dow Jones Sustainability Index (DJSI World). For<br />
the eighth year in succession, <strong>BASF</strong> shares were included<br />
in the most important sustainability index worldwide.<br />
CARBon dISCloSuRE<br />
lEAdERShIp IndEx<br />
top Ranking<br />
In <strong>2008</strong>, <strong>BASF</strong> achieved top ranking in the Carbon Disclosure<br />
Leadership Index (carbon intensive industries). The<br />
index contains companies who distinguish themselves in<br />
addressing the challenges of climate change.<br />
This report is printed on FSC certified real art paper (Job Parilux).<br />
More information on the production process, selection of paper<br />
and printing of this report can be found at basf.com/report_production<br />
foRwARd-looKInG StAtEMEntS<br />
GERMAn SuStAInABIlIty<br />
AwARd <strong>2008</strong><br />
Most Sustainable Company<br />
<strong>BASF</strong> SE took second place in the category of “Most<br />
Sustainable Company” – as a role model in integrating<br />
economic success with sustainable business.<br />
BESt EMployER<br />
Brazil <strong>2008</strong><br />
For the third year in a row, <strong>BASF</strong> in Brazil was ranked<br />
as one of the best employers in the country by the business<br />
newspaper Guia Você S. A. – Exame.<br />
publisher:<br />
<strong>BASF</strong> SE<br />
Communications & Government Relations<br />
67056 Ludwigshafen, Germany<br />
design:<br />
Strichpunkt<br />
photography:<br />
Steffen Jänicke; Andreas Pohlmann (Photography: Board of Directors);<br />
<strong>BASF</strong> Archive<br />
This report contains forward-looking statements. These statements are based on current experience, estimates and<br />
projections of <strong>BASF</strong> management and currently available information. They are not guarantees of future performance,<br />
involve certain risks and uncertainties that are difficult to predict, and are based upon assumptions as to future events<br />
that may not be accurate. Many factors could cause the actual results, performance or achievements of <strong>BASF</strong> to be<br />
materially different from those that may be expressed or implied by such statements. Such factors include those discussed<br />
in the Risk <strong>Report</strong> from page 112 to 119. We do not assume any obligation to update the forward-looking<br />
statements contained in this report.
topICS<br />
At A GlAnCE<br />
overview<br />
About this report 2–3<br />
Index 235<br />
ShApInG thE futuRE<br />
Strategy<br />
Goals 16–17, 27, 30, 45-47, 77, 90–91, 93, 95, 97, 111–112, 117<br />
Opportunities 14–15, 28, 31, 34, 118–119, 122<br />
Minimizing risks 12, 15, 28, 30, 47, 112–119<br />
Portfolio 14, 25, 40, 42, 45–47, 62–63, 75, 88, 125–126<br />
Efficiency 14, 27, 34<br />
Segment strategies 50, 57, 63, 69, 75, 77, 80<br />
Solutions for global challenges<br />
Climate protection 34, 51–52, 63, 69–70, 99–101<br />
Resources 34–35, 63–64, 69–70, 80–82, 102–107<br />
Health and nutrition 35, 63–64, 67, 75–77, 95–96, 98, 110–111<br />
Demographic change 14, 90–93, 117–118<br />
Construction and housing 51, 57–59, 63, 69–70, 101<br />
Assets, financial position and financial performance<br />
Shares 18–19, 21, 39<br />
Balance sheet structure 43–44<br />
Financial position 45–47<br />
Financial performance 39–42<br />
Business development<br />
of segments 54–56, 61–62, 66–68, 72–74, 78–79, 84–86<br />
outlook<br />
Economic environment 120–122<br />
<strong>BASF</strong> Group forecast 123–124<br />
Innovations<br />
Growth clusters 14, 35, 103<br />
Innovations create value 14, 34–35, 51, 59, 64, 69, 75–77, 101, 105<br />
partnerships<br />
Strategic partnerships 14, 77, 80<br />
Cooperations 12, 31, 34–35, 77, 81–82, 98, 101, 104, 108–111<br />
Sustainability services 15, 28, 31–32<br />
dialogue<br />
Customers 31, 51–52, 57–59, 64, 70, 76, 96<br />
Other stakeholders 2, 12, 22, 32, 90, 93–94, 96–99, 110–111<br />
GLOBAL COMPACT RELEVANCE<br />
GRI ANd GLOBAL<br />
COMPACT INdEx<br />
pAGE 240<br />
prizes and awards back cover
AnnuAl MEEtInG 2009 / IntERIM REpoRt fIRSt quARtER 2009<br />
April 30, 2009<br />
IntERIM REpoRt fIRSt hAlf 2009<br />
July 30, 2009<br />
IntERIM REpoRt thIRd quARtER 2009<br />
oct. 29, 2009<br />
full yEAR RESultS 2009<br />
feb. 25, 2010<br />
AnnuAl MEEtInG 2010 / IntERIM REpoRt fIRSt quARtER 2010<br />
April 29, 2010<br />
fuRthER InfoRMAtIon ContACtS<br />
You can find this and other publications from<br />
<strong>BASF</strong> on the internet at www.basf.com<br />
You can also order the reports:<br />
• by telephone: +49 621 60-91827<br />
• on the Internet: basf.com/mediaorders<br />
<strong>BASF</strong> supports the chemical industry’s global<br />
initiative Responsible Care ® .<br />
General inquiries<br />
Phone: +49 621 60-0, Fax: +49 621 60-42525<br />
Corporate Media Relations<br />
Michael Grabicki, Phone +49 621 60-99938, Fax: +49 621 60-92693<br />
Sustainability Center<br />
Dr. Lothar Meinzer, Phone: +49 621 60-41976, Fax: +49 621 60-95873<br />
Investor Relations<br />
Magdalena Moll, Phone: +49 621 60-48230, Fax: +49 621 60-22500<br />
Internet<br />
www.basf.com