Association for Education and Rehabilitation of the Blind - AER Online
Association for Education and Rehabilitation of the Blind - AER Online
Association for Education and Rehabilitation of the Blind - AER Online
Create successful ePaper yourself
Turn your PDF publications into a flip-book with our unique Google optimized e-Paper software.
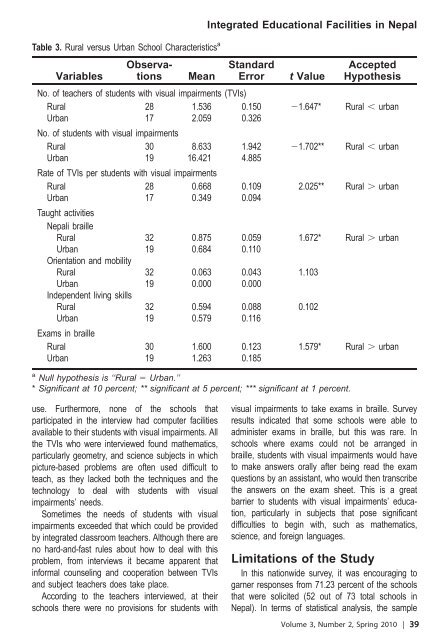
Table 3. Rural versus Urban School Characteristics a<br />
Variables<br />
Observations<br />
Mean<br />
use. Fur<strong>the</strong>rmore, none <strong>of</strong> <strong>the</strong> schools that<br />
participated in <strong>the</strong> interview had computer facilities<br />
available to <strong>the</strong>ir students with visual impairments. All<br />
<strong>the</strong> TVIs who were interviewed found ma<strong>the</strong>matics,<br />
particularly geometry, <strong>and</strong> science subjects in which<br />
picture-based problems are <strong>of</strong>ten used difficult to<br />
teach, as <strong>the</strong>y lacked both <strong>the</strong> techniques <strong>and</strong> <strong>the</strong><br />
technology to deal with students with visual<br />
impairments’ needs.<br />
Sometimes <strong>the</strong> needs <strong>of</strong> students with visual<br />
impairments exceeded that which could be provided<br />
by integrated classroom teachers. Although <strong>the</strong>re are<br />
no hard-<strong>and</strong>-fast rules about how to deal with this<br />
problem, from interviews it became apparent that<br />
in<strong>for</strong>mal counseling <strong>and</strong> cooperation between TVIs<br />
<strong>and</strong> subject teachers does take place.<br />
According to <strong>the</strong> teachers interviewed, at <strong>the</strong>ir<br />
schools <strong>the</strong>re were no provisions <strong>for</strong> students with<br />
Integrated <strong>Education</strong>al Facilities in Nepal<br />
St<strong>and</strong>ard<br />
Error t Value<br />
Accepted<br />
Hypo<strong>the</strong>sis<br />
No. <strong>of</strong> teachers <strong>of</strong> students with visual impairments (TVIs)<br />
Rural 28 1.536 0.150 21.647* Rural , urban<br />
Urban 17 2.059 0.326<br />
No. <strong>of</strong> students with visual impairments<br />
Rural 30 8.633 1.942 21.702** Rural , urban<br />
Urban 19 16.421 4.885<br />
Rate <strong>of</strong> TVIs per students with visual impairments<br />
Rural 28 0.668 0.109 2.025** Rural . urban<br />
Urban<br />
Taught activities<br />
Nepali braille<br />
17 0.349 0.094<br />
Rural 32 0.875 0.059 1.672* Rural . urban<br />
Urban<br />
Orientation <strong>and</strong> mobility<br />
19 0.684 0.110<br />
Rural 32 0.063 0.043 1.103<br />
Urban<br />
Independent living skills<br />
19 0.000 0.000<br />
Rural 32 0.594 0.088 0.102<br />
Urban<br />
Exams in braille<br />
19 0.579 0.116<br />
Rural 30 1.600 0.123 1.579* Rural . urban<br />
Urban 19 1.263 0.185<br />
a Null hypo<strong>the</strong>sis is ‘‘Rural 5 Urban.’’<br />
* Significant at 10 percent; ** significant at 5 percent; *** significant at 1 percent.<br />
visual impairments to take exams in braille. Survey<br />
results indicated that some schools were able to<br />
administer exams in braille, but this was rare. In<br />
schools where exams could not be arranged in<br />
braille, students with visual impairments would have<br />
to make answers orally after being read <strong>the</strong> exam<br />
questions by an assistant, who would <strong>the</strong>n transcribe<br />
<strong>the</strong> answers on <strong>the</strong> exam sheet. This is a great<br />
barrier to students with visual impairments’ education,<br />
particularly in subjects that pose significant<br />
difficulties to begin with, such as ma<strong>the</strong>matics,<br />
science, <strong>and</strong> <strong>for</strong>eign languages.<br />
Limitations <strong>of</strong> <strong>the</strong> Study<br />
In this nationwide survey, it was encouraging to<br />
garner responses from 71.23 percent <strong>of</strong> <strong>the</strong> schools<br />
that were solicited (52 out <strong>of</strong> 73 total schools in<br />
Nepal). In terms <strong>of</strong> statistical analysis, <strong>the</strong> sample<br />
Volume 3, Number 2, Spring 2010 | 39


