Marc Raimondo - CMI
Marc Raimondo - CMI
Marc Raimondo - CMI

Create successful ePaper yourself
Turn your PDF publications into a flip-book with our unique Google optimized e-Paper software.
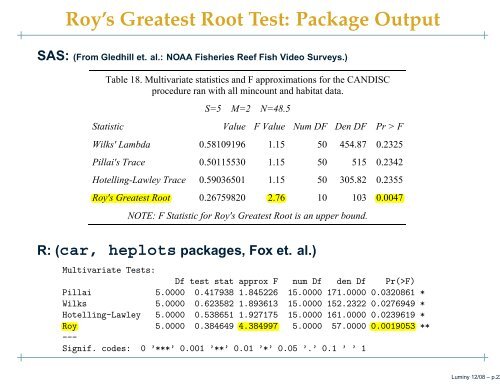
Roy’s Greatest Root Test: Package Output<br />
SAS: (From Gledhill et. al.: NOAA Fisheries Reef Fish Video Surveys.)<br />
Table 18. Multivariate statistics and F approximations for the CANDISC<br />
procedure ran with all mincount and habitat data.<br />
S=5 M=2 N=48.5<br />
Statistic Value F Value Num DF Den DF Pr > F<br />
Wilks' Lambda 0.58109196 1.15 50 454.87 0.2325<br />
Pillai's Trace 0.50115530 1.15 50 515 0.2342<br />
Hotelling-Lawley Trace 0.59036501 1.15 50 305.82 0.2355<br />
Roy's Greatest Root 0.26759820 2.76 10 103 0.0047<br />
NOTE: F Statistic for Roy's Greatest Root is an upper bound.<br />
R: (car, heplots packages, Fox et. al.)<br />
Multivariate Tests:<br />
Df test stat approx F num Df den Df Pr(>F)<br />
Pillai 5.0000 0.417938 1.845226 15.0000 171.0000 0.0320861 *<br />
Wilks 5.0000 0.623582 1.893613 15.0000 152.2322 0.0276949 *<br />
Hotelling-Lawley 5.0000 0.538651 1.927175 15.0000 161.0000 0.0239619 *<br />
Roy<br />
---<br />
5.0000 0.384649 4.384997 5.0000 57.0000 0.0019053 **<br />
Signif. codes: 0 ’***’ 0.001 ’**’ 0.01 ’*’ 0.05 ’.’ 0.1 ’ ’ 1<br />
Luminy 12/08 – p.22