Evaluation of Bioassays and Wastewater Quality ... - Oekotoxzentrum
Evaluation of Bioassays and Wastewater Quality ... - Oekotoxzentrum
Evaluation of Bioassays and Wastewater Quality ... - Oekotoxzentrum

You also want an ePaper? Increase the reach of your titles
YUMPU automatically turns print PDFs into web optimized ePapers that Google loves.
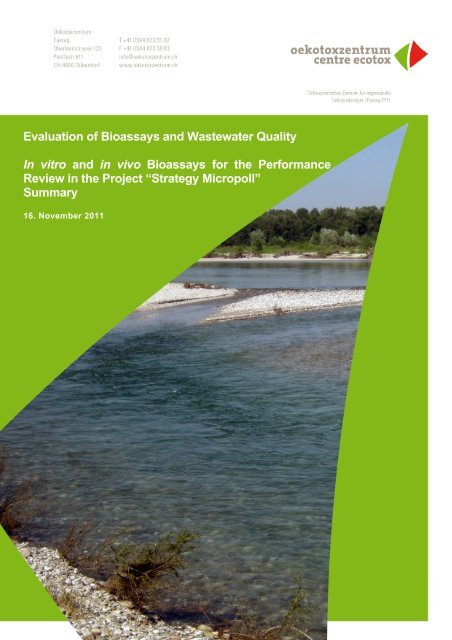
<strong>Evaluation</strong> <strong>of</strong> <strong>Bioassays</strong> <strong>and</strong> <strong>Wastewater</strong> <strong>Quality</strong><br />
In vitro <strong>and</strong> in vivo <strong>Bioassays</strong> for the Performance<br />
Review in the Project “Strategy Micropoll”<br />
Summary<br />
16. November 2011
Imprint<br />
Publisher<br />
Swiss Centre for Applied Ecotoxicology (Ecotox Centre), Eawag-EPFL, 8600 Dübendorf, Switzerl<strong>and</strong><br />
Authors<br />
Swiss Centre for Applied<br />
Ecotoxicology, Eawag/EPFL<br />
Cornelia Kienle, Robert Kase, Inge Werner<br />
Acknowledgements<br />
The initiators <strong>of</strong> the project as well as the authors would like to thank the following persons for their<br />
valuable comments <strong>and</strong> contributions:<br />
Federal Office for the<br />
Environment<br />
WWTP Vidy Lausanne<br />
Expert group ecotoxicology<br />
within the project “Strategy<br />
Micropoll”<br />
AWEL Zürich Barbara Känel<br />
BMG Engineering René Gälli<br />
Eawag<br />
Michael Schärer, Sebastién Lehmann, Bettina Hitzfeld<br />
Denis Thonney, Anoÿs Magnet<br />
University <strong>of</strong> Lausanne Nathalie Chèvre<br />
EPF Lausanne Jonas Margot<br />
Pius Niederhauser (AWEL ZH), Andreas Häner (BMG<br />
Engineering), Sergio Santiago (Soluval Santiago), Christoph<br />
Hafner (Hydrotox), Tilman Floehr (RWTH Aachen), Mirco<br />
Bundschuh, Ralf Schulz (University <strong>of</strong> L<strong>and</strong>au), Mirco Weil (ECT),<br />
Helmut Segner (University <strong>of</strong> Bern), Matthias Liess (Helmholtz-<br />
Zentrum für Umweltforschung Leipzig-Halle), Phillipe Vioget<br />
(Canton de Vaud), Jörg Oehlmann (University <strong>of</strong> Frankfurt),<br />
Jeanne Garric, Benoit Ferrari (Cemagref)<br />
Christian Abegglen, Roman Ashauer, Rik Eggen, Juliane<br />
Hollender, Kristin Schirmer<br />
Biodetection Systems Peter Behnisch, Harrie Besselink, S<strong>and</strong>er van der Linden,<br />
RWTH Aachen Henner Hollert, Sibylle Maletz, Tilman Floehr<br />
Entrix Inc., CA Markus Hecker, Eric Highley<br />
Swiss Centre for Applied<br />
Ecotoxicology, Eawag/EPFL<br />
Marion Junghans, Petra Kunz, Tamas Mengesha, Rebecca Flück<br />
Cover picture:
Note<br />
This study was carried out on behalf <strong>of</strong> the Federal Office for the Environment (FOEN) <strong>of</strong> the<br />
Federal Department <strong>of</strong> the Environment, Transport, Energy <strong>and</strong> Communications (DETEC)<br />
within the project “Strategy Micropoll” <strong>and</strong> was co-funded by the Swiss Centre for Applied<br />
Ecotoxicology. The publisher bears sole responsibility for the content.<br />
Contact<br />
Cornelia Kienle cornelia.kienle@oekotoxzentrum.ch, +41(0)58 765 5563<br />
Robert Kase robert.kase@oekotoxzentrum.ch, +41(0)58 765 5197<br />
Citation Proposal<br />
Kienle, C., Kase, R., Werner, I. 2011. <strong>Evaluation</strong> <strong>of</strong> bioassays <strong>and</strong> wastewater quality: In<br />
vitro <strong>and</strong> in vivo bioassays for the performance review in the Project "Strategy MicroPoll".<br />
Swiss Centre for Applied Ecotoxicology, Eawag-EPFL, Duebendorf.<br />
This study was initiated by the Swiss Federal Office for the Environment.<br />
Dübendorf, Swiss Centre for Applied Ecotoxicology, Eawag/EPFL, 16.11.2011<br />
Cover picture: Andri Bryner, Eawag
Summary<br />
The goal <strong>of</strong> the FOEN project “Strategy Micropoll“ was to develop a strategy regarding<br />
micropollutants originating from wastewater. Besides an analysis <strong>of</strong> water quality in<br />
Switzerl<strong>and</strong> <strong>and</strong> other aspects, this included the evaluation <strong>of</strong> the efficiency <strong>of</strong><br />
complementary wastewater treatments such as ozonation followed by s<strong>and</strong> filtration<br />
(ozonation-SF) <strong>and</strong> different processes including powdered activated carbon addition (PAC)<br />
in eliminating micropollutants from wastewater treatment effluent. Two large-scale pilot<br />
studies were conducted at the wastewater treatment plants (WWTP) Wüeri in Regensdorf<br />
(ozonation followed by s<strong>and</strong>-filtration) <strong>and</strong> Vidy in Lausanne (ozonation followed by s<strong>and</strong>filtration<br />
<strong>and</strong> PAC followed by ultrafiltration). The studies were done in close collaboration<br />
with experts from research, practice <strong>and</strong> with personnel <strong>and</strong> financial support <strong>of</strong> cantonal<br />
water protection agencies (Gewässerschutzfachstellen) <strong>and</strong> the operators <strong>of</strong> the WWTPs.<br />
In both studies, samples before <strong>and</strong> after various treatment steps were analysed for<br />
micropollutants <strong>and</strong> ecotoxicological effects, in order to get insight into the efficiency <strong>of</strong> the<br />
different treatment steps. The focus laid on studying the effects <strong>of</strong> the advanced treatment<br />
technologies, ozonation <strong>and</strong> PAC, on the removal efficiency for polar, persistent <strong>and</strong><br />
bioactive substances as well as possible side products <strong>and</strong> their biological effects.<br />
This report focuses on the study performed at the WWTP Vidy in Lausanne from April 2009<br />
to July 2010 with four major measurement campaigns being conducted. Detailed information<br />
on the Regensdorf study can be found in Abegglen et al. (2009). The Lausanne study is<br />
described in Margot et al. (2011).<br />
Results at the WWTP Vidy showed that both ozonation-SF <strong>and</strong> PAC-UF treatments are<br />
useful measures to reduce the concentration <strong>and</strong> biological effects <strong>of</strong> micropollutants in<br />
treated wastewater <strong>and</strong> therefore in surface water bodies. Total elimination efficiency with<br />
regard to the measured specific effects was generally above 80 %. Similarly, advanced<br />
treatment led to lowered risk quotients, i.e. the relationship between measured<br />
concentrations <strong>and</strong> environmental quality st<strong>and</strong>ards, as well as reduced toxicity in<br />
bioassays, <strong>and</strong> thus lowered risk <strong>of</strong> adverse effects. There was no evidence <strong>of</strong> toxic effects<br />
due to the formation <strong>of</strong> stable by-products during ozonation (i.e. by-products still present<br />
after the final filtration step). A final filtration step with biological activity (such as a s<strong>and</strong> filter)<br />
after ozonation is recommended, in order to minimize the risk <strong>of</strong> reactive <strong>and</strong> potentially toxic<br />
ozonation by-products being released in waterbodies.<br />
Overall, the application <strong>of</strong> bioassays for comparing the performance <strong>of</strong> advanced<br />
wastewater treatment methods has proven to be relevant <strong>and</strong> useful. In general, in vitro<br />
bioassays were deemed most promising for the routine monitoring <strong>of</strong> the performance <strong>of</strong><br />
advanced treatment in WWTPs, however only specific cellular effects are assessed in those<br />
tests. Certain in vivo bioassays also showed the beneficial effects <strong>of</strong> ozonation-SF <strong>and</strong> PAC-<br />
UF treatment such as the fish early life stage test with Oncorhynchus mykiss.<br />
Swiss Centre for Applied Ecotoxicology, Eawag/EPFL · Überl<strong>and</strong>strasse 133 · CH-8600 Dübendorf i<br />
www.oekotoxzentrum.ch
Main conclusions<br />
� A broad range <strong>of</strong> micropollutants <strong>and</strong> their effects were<br />
eliminated by more than 80% after the advanced treatments.<br />
� There was no evidence for a toxicity increase due to a constant<br />
formation <strong>of</strong> stable toxic ozonation by-products.<br />
� An ozonation should be followed by a final filtration step with<br />
biological activity.<br />
� <strong>Quality</strong> <strong>of</strong> treated effluent was significantly improved, leading to<br />
improved surface water quality.<br />
Swiss Centre for Applied Ecotoxicology, Eawag/EPFL · Überl<strong>and</strong>strasse 133 · CH-8600 Dübendorf ii<br />
www.oekotoxzentrum.ch
Table <strong>of</strong> contents<br />
Summary _____________________________________________________________________ i<br />
Abbreviations __________________________________________________________________ v<br />
1. Introduction _______________________________________________________________ 1<br />
1.1. Project Strategy Micropoll _________________________________________________ 1<br />
1.2. Aims <strong>of</strong> the performance review at the WWTP Vidy, Lausanne _____________________ 1<br />
1.3. Questions to be addressed by the performance review ___________________________ 2<br />
2. Executive Summary ________________________________________________________ 3<br />
2.1. Research Questions Addressed ____________________________________________ 3<br />
2.2. Summary ______________________________________________________________ 5<br />
3. Approach _________________________________________________________________ 6<br />
3.1. <strong>Bioassays</strong> _____________________________________________________________ 6<br />
3.2. Sample Collection <strong>and</strong> Preparation _________________________________________ 12<br />
4. Performance Analysis <strong>of</strong> Advanced <strong>Wastewater</strong> Treatment _______________________ 14<br />
4.1. Toxicity Parameters _____________________________________________________ 14<br />
4.2. Change Index _________________________________________________________ 15<br />
4.3. Comparison <strong>of</strong> Bioassay Results ___________________________________________ 17<br />
4.3.1. In vitro <strong>Bioassays</strong> ____________________________________________________________ 17<br />
4.3.2. Laboratory In Vivo <strong>Bioassays</strong> ___________________________________________________ 19<br />
4.3.3. In Situ <strong>Bioassays</strong> _____________________________________________________________ 21<br />
4.3.4. Assessment <strong>of</strong> different filter types _______________________________________________ 23<br />
4.4. Elimination efficiency <strong>of</strong> treatment steps _____________________________________ 24<br />
4.5. Comparison <strong>of</strong> bioassays with chemical measurements _________________________ 27<br />
4.6. Mutagenicity <strong>and</strong> genotoxicity _____________________________________________ 28<br />
4.7. Conclusions from the performance review ____________________________________ 28<br />
5. <strong>Evaluation</strong> <strong>of</strong> wastewater quality regarding micropollutants <strong>and</strong> their effects ________ 30<br />
5.1. Risk quotients <strong>of</strong> three relevant micropollutants during wastewater treatment _________ 31<br />
5.2. Estrogenicity during wastewater treatment ___________________________________ 32<br />
5.3. Conclusions for the evaluation <strong>of</strong> wastewater quality regarding micropollutants <strong>and</strong> their<br />
effects ____________________________________________________________________ 32<br />
6. Main conclusions __________________________________________________________ 33<br />
7. References _______________________________________________________________ 34<br />
8. Figures __________________________________________________________________ 41<br />
Tables _____________________________________________________________________ 42<br />
Swiss Centre for Applied Ecotoxicology, Eawag/EPFL · Überl<strong>and</strong>strasse 133 · CH-8600 Dübendorf iii<br />
www.oekotoxzentrum.ch
9. Appendix ________________________________________________________________ 45<br />
Appendix for chapter 5 _________________________________________________________ 45<br />
Figures _____________________________________________________________________ 48<br />
Tables _____________________________________________________________________ 52<br />
Swiss Centre for Applied Ecotoxicology, Eawag/EPFL · Überl<strong>and</strong>strasse 133 · CH-8600 Dübendorf iv<br />
www.oekotoxzentrum.ch
Abbreviations<br />
AA-EQS Annual average environmental quality st<strong>and</strong>ard<br />
AR CALUX Androgen receptor CALUX<br />
BOD Biochemical oxygen dem<strong>and</strong><br />
CAG Effluent carbon filter (sortie charbon actif granulé)<br />
CALUX Chemically Activated LUciferase gene EXpression<br />
COD Chemical oxygen dem<strong>and</strong><br />
CI Change Index<br />
DEQ Diuron equivalent concentration<br />
DOC Dissolved organic carbon<br />
ECx<br />
Effect concentration at which x % <strong>of</strong> the test organisms show a defined<br />
effect in a concentration response curve<br />
EEQ Estradiol equivalent concentration<br />
EN WWTP Influent (Entrée STEP)<br />
EQS Environmental quality st<strong>and</strong>ard<br />
ERα CALUX Estrogen receptor α CALUX<br />
FELST Fish Early Life Stage Test<br />
GR CALUX Glucocorticoid receptor CALUX<br />
ISO International Organisation for St<strong>and</strong>ardisation<br />
LF Effluent moving bed biology (sortie Lit fluidisé)<br />
LOEC Lowest observed effect concentration<br />
MAC-EQS Maximum acceptable concentration EQS<br />
MC Measurement campaign<br />
MEC Measured environmental concentration<br />
NOEC No observed effect concentration<br />
OECD Organisation for Economic Co-operation <strong>and</strong> Development<br />
OZ Effluent ozonation, Sortie O3<br />
PAC-UF Effluent powdered activated carbon treatment followed by ultrafiltration<br />
(sortie charbon actif en poudre – UF)<br />
PEC Predicted environmental concentration<br />
PPARg1 CALUX Peroxisome proliferator activated receptor g1 CALUX<br />
PR CALUX Progesterone receptor CALUX<br />
Q347<br />
Low tide discharge<br />
Swiss Centre for Applied Ecotoxicology, Eawag/EPFL · Überl<strong>and</strong>strasse 133 · CH-8600 Dübendorf v<br />
www.oekotoxzentrum.ch
RQ Risk quotient<br />
SB Effluent biological treatment, "old" biology (sortie biologie)<br />
SF Effluent s<strong>and</strong> filtration (sortie filtre à sable)<br />
SOP St<strong>and</strong>ard operation procedure<br />
STEP Station d’épuration des eaux usées<br />
TEQ Toxic equivalent concentration<br />
TRβ CALUX Thyroxin receptor β CALUX<br />
WWTP <strong>Wastewater</strong> treatment plant<br />
YES Yeast Estrogen Screen<br />
Swiss Centre for Applied Ecotoxicology, Eawag/EPFL · Überl<strong>and</strong>strasse 133 · CH-8600 Dübendorf vi<br />
www.oekotoxzentrum.ch
1. Introduction<br />
1.1. Project Strategy Micropoll<br />
The aim <strong>of</strong> the project “Strategy Micropoll” <strong>of</strong> the Swiss Federal Office for the Environment<br />
(FOEN) was to develop a strategy regarding micropollutants originating from municipal<br />
wastewater.<br />
In the frame <strong>of</strong> this project, a situation analysis was conducted in order to assess the<br />
contamination <strong>of</strong> Swiss surface waters with micropollutants (Gälli et al., 2009), <strong>and</strong> an evaluation<br />
concept for Swiss specific micropollutants was developed (Götz et al., 2010; Götz et al., 2011). A<br />
further step <strong>of</strong> the project consisted <strong>of</strong> a performance review aiming to define suitable indicators<br />
<strong>and</strong> methods to detect organic micropollutants in surface water <strong>and</strong> wastewater, which should be<br />
used to assess the efficiency <strong>of</strong> the applied advanced treatment methods. Additionally,<br />
possibilities for financing measures for advanced wastewater treatment were evaluated.<br />
In order to evaluate possible technical treatments to reduce the concentrations <strong>and</strong> effects <strong>of</strong><br />
organic micropollutants in Swiss surface waters, two large-scale pilot studies were conducted,<br />
one at the WWTP Wüeri in Regensdorf <strong>and</strong> the other at the WWTP Vidy in Lausanne. In both<br />
studies the efficiency <strong>of</strong> complementary wastewater treatment for the elimination <strong>of</strong><br />
micropollutants from wastewater treatment effluent was assessed, such as ozonation followed by<br />
s<strong>and</strong> filtration (ozonation-SF) <strong>and</strong> different processes including powdered activated carbon<br />
addition (PAC). Technical aspects as well as a performance review regarding the elimination <strong>of</strong><br />
micropollutants using chemical measurements <strong>and</strong> ecotoxicological test systems were included.<br />
Regarding the ecotoxicological methods, the Federal Office for the Environment was advised by<br />
a board <strong>of</strong> international experts within the project “Strategy Micropoll”.<br />
The present report is focused on the bioassay results <strong>of</strong> the pilot study at the WWTP Vidy in<br />
Lausanne. The results for the pilot study at the WWTP Wüeri in Regensdorf are reported in<br />
Abegglen et al. (2009).<br />
1.2. Aims <strong>of</strong> the performance review at the WWTP Vidy, Lausanne<br />
The aim <strong>of</strong> the performance review on the WWTP Vidy in Lausanne was to gain knowledge from<br />
trace analytics <strong>and</strong> ecotoxicological test systems regarding the effects <strong>of</strong> complementary<br />
treatments on the contamination <strong>of</strong> wastewater with organic micropollutants.<br />
The first part <strong>of</strong> the performance review focused on the effects <strong>of</strong> the advanced treatment<br />
technologies ozonation followed by s<strong>and</strong> filtration (ozonation-SF) <strong>and</strong> powdered activated carbon<br />
treatment followed by ultrafiltration (PAC-UF) on the removal efficiency <strong>of</strong> polar, persistent <strong>and</strong><br />
bioactive substances as well as possible by-products. In a second part, the wastewater quality<br />
was investigated regarding micropollutants <strong>and</strong> their effects, followed by a discussion on the<br />
relevance <strong>of</strong> the observed reduction in micropollutant concentrations <strong>and</strong> effects.<br />
As shown in earlier studies, micropollutants can seriously affect the aquatic ecosystem, e.g.<br />
influence the macrozoobenthos community (Ashauer, in preparation; Bundschuh et al., 2011a) or<br />
influence the reproduction <strong>of</strong> fish (e.g. estrogens) (Jobling et al., 2006; Kidd et al., 2007;<br />
Sumpter, 1998).<br />
Swiss Centre for Applied Ecotoxicology, Eawag/EPFL · Überl<strong>and</strong>strasse 133 · CH-8600 Dübendorf<br />
www.oekotoxzentrum.ch<br />
1
1.3. Questions to be addressed by the performance review<br />
The following central questions were to be answered through the evaluation <strong>and</strong> comparison <strong>of</strong><br />
bioassays in the performance review:<br />
� How effective is ozonation-SF or PAC-UF treatment for the removal <strong>of</strong> micropollutants<br />
<strong>and</strong> their biological effects? What is the expected effect on aquatic organisms?<br />
� What is the significance/informative power <strong>of</strong> the tests regarding elimination efficiency?<br />
Are the tests able to detect differences between the different treatment steps?<br />
� If a test shows no effect <strong>of</strong> WWTP influent, does that mean that the wastewater is<br />
unproblematic?<br />
� How reproducible are the bioassay results? If a test shows variable effects, can this<br />
variability be explained? Do similarly treated or untreated samples cause similar effects<br />
(e.g. WWTP influent samples, ozonated samples etc.)?<br />
� How relevant are the various assays for a monitoring programme (performance<br />
assessment <strong>of</strong> advanced treatment steps)? Can bioassays be applied for this purpose?<br />
Swiss Centre for Applied Ecotoxicology, Eawag/EPFL · Überl<strong>and</strong>strasse 133 · CH-8600 Dübendorf<br />
www.oekotoxzentrum.ch<br />
2
2. Executive Summary<br />
In the pilot study at the WWTP Vidy, Lausanne, a variety <strong>of</strong> parameters were measured,<br />
including classical water quality parameters (DOC, COD, BOD, pH, conductivity, nutrients etc.),<br />
aqueous concentrations <strong>of</strong> 58 micropollutants (EPF Lausanne) <strong>and</strong> 120 other micropollutants, as<br />
well the formation <strong>of</strong> the by-products nitrosamines <strong>and</strong> bromates (Eawag, Dübendorf).<br />
Additionally a biological effect assessment <strong>of</strong> the different treatment steps was made with 16 in<br />
vitro- <strong>and</strong> 9 in vivo-assays to cover a broad range <strong>of</strong> ecotoxicological effects.<br />
2.1. Research Questions Addressed<br />
In the following section, the questions addressed in chapter 1.3 are answered based on the<br />
results obtained during the pilot study. Details on the used approach <strong>and</strong> the results can be<br />
found in the chapters 3 to 5.<br />
How effective is ozonation-SF or PAC-UF treatment for the removal <strong>of</strong> micropollutants<br />
<strong>and</strong> their biological effects? What is the expected effect on aquatic organisms?<br />
Various studies showed that a considerable number <strong>of</strong> micropollutants are not or incompletely<br />
removed during biological treatment (e.g. Abegglen et al., 2009; Gälli et al., 2009; Götz et al.,<br />
2010; Schärer et al., 2010). Additional treatment by ozonation-SF or PAC-UF increased the<br />
removal efficiency <strong>of</strong> most <strong>of</strong> those substances significantly. These techniques were able to<br />
eliminate the majority <strong>of</strong> the specifically acting substance classes (see chapter 4.4) as well as<br />
most <strong>of</strong> the toxicity observed in in vivo assays (see chapter 4.3.2 <strong>and</strong> 4.3.3).<br />
Ozonation-SF <strong>and</strong> PAC-UF treatments proved to be very effective in the removal <strong>of</strong><br />
micropollutants. Chemical analyses showed improved elimination efficiency for most <strong>of</strong> the<br />
micropollutants compared to the biological treatment. For both advanced treatments the overall<br />
elimination efficiency <strong>of</strong> micropollutants ranged from ~75 to 90 % (Margot et al., 2011).<br />
Most mechanism-oriented, cellular in vitro bioassays <strong>and</strong> one integrative in vivo bioassay (Fish<br />
Early Life Stage Test) showed a significant reduction in toxicity through ozonation-SF <strong>and</strong> PAC-<br />
UF treatment. Importantly, there was no consistent increase in toxicity due to the additional<br />
treatments.<br />
What is the significance/informative power <strong>of</strong> the tests with regard to elimination<br />
efficiency? Are the tests able to detect differences between the different treatment steps?<br />
The evaluation <strong>of</strong> the elimination efficiency <strong>of</strong> different substance classes is only possible with<br />
mechanism-oriented cellular in vitro bioassays with sample enrichment, as they refer to toxic<br />
equivalent concentrations (see chapters 4.1 <strong>and</strong> 4.4).<br />
Generally, it has to be kept in mind that the enrichment <strong>of</strong> samples eliminates matrix components<br />
such as salts (e.g. nutrients, which might mask the toxicity <strong>of</strong> the samples) as well as metals<br />
(Macova et al., 2010). Enrichment <strong>of</strong> water samples also enables a detection <strong>of</strong> low<br />
concentrations <strong>of</strong> substances using short-term bioassays. However, the sample composition<br />
may be altered <strong>and</strong> substances might be lost during the enrichment procedure. Such issues<br />
Swiss Centre for Applied Ecotoxicology, Eawag/EPFL · Überl<strong>and</strong>strasse 133 · CH-8600 Dübendorf<br />
www.oekotoxzentrum.ch<br />
3
have to be assessed thoroughly before an extraction procedure is selected, <strong>and</strong> for more<br />
information on this topic refer to Escher et al. (2005), Escher et al. (2008b). In native wastewater<br />
samples the undisturbed sample is measured, however toxic effects might be masked by<br />
positive effects <strong>of</strong> nutrients, e.g. growth promotion due to nutrients in algae assays.<br />
In the Lausanne pilot study, the in vitro bioassays with sample enrichment showed a decrease <strong>of</strong><br />
specific substance classes both after ozonation-SF <strong>and</strong> PAC-UF treatment. The overall reduction<br />
<strong>of</strong> specific activities was above 80% in most cases. One in vivo bioassay was able to detect the<br />
decrease in micropollutant concentrations as well (by indicating decreasing effects after<br />
ozonation-SF <strong>and</strong> PAC-UF treatments compared to the biological treatment), the Fish Early Life<br />
Stage Test with rainbow trout, Oncorhynchus mykiss. This assay is especially relevant as O.<br />
mykiss is a representative <strong>of</strong> sensitive cold water fish species, <strong>and</strong> therefore relevant for Swiss<br />
surface waters. Also a decrease in trout catches <strong>of</strong> more than 60% since the early 80s indicates<br />
its sensitivity for multiple stressors which are not yet identified (Burkhardt-Holm et al., 2005).<br />
A decrease in toxicity following biological treatment was observed in most <strong>of</strong> the applied in vivo<br />
bioassays when the WWTP influent was toxic. However, most in vivo assays were unable to<br />
detect any additional reduction in toxicity following the ozonation-SF or PAC-UF treatment steps.<br />
This could be due to the lack <strong>of</strong> sensitivity <strong>of</strong> the respective bioassay endpoints (e.g. mortality,<br />
growth) for micropollutants (for details see chapter 4.3).<br />
If a test shows no effect <strong>of</strong> WWTP influent, does that mean that the wastewater is<br />
unproblematic?<br />
This question can clearly be answered: No.<br />
There is evidence in the literature that there are effects in ecosystems (e.g. Ashauer, in<br />
preparation; Bundschuh et al., 2011a), even when some tests show no toxicity. There are<br />
several factors which may play a role for the toxicity <strong>of</strong> a wastewater sample, such as:<br />
- Test duration (e.g. acute, chronic, whole-life-cycle)<br />
- Test organism<br />
- Sensitivity <strong>of</strong> the test regarding the specific type <strong>of</strong> wastewater<br />
- Sensitivity <strong>and</strong> selectivity <strong>of</strong> the chosen endpoint<br />
Many st<strong>and</strong>ard test organisms are not the most sensitive species <strong>of</strong> the respective taxonomic<br />
group, due to e.g. difficulties with lab cultivation or longer life cycles. At the same time, some<br />
st<strong>and</strong>ard test organisms are sensitive to other types <strong>of</strong> wastewater e.g. l<strong>and</strong>fill leachate, industrial<br />
waste water, but are apparently not that suitable to detect effects <strong>of</strong> micropollutants in urban<br />
wastewater. However, as organisms integrate the effects <strong>of</strong> all potentially toxic substances in an<br />
environmental sample it cannot be concluded for sure that the observed effects result from<br />
micropollutants.<br />
How reproducible are the bioassay results? If a test shows variable effects, can this<br />
variability be explained? Do similarly treated or untreated samples cause similar effects<br />
(e.g. WWTP influent samples, ozonated samples etc.)?<br />
Differences in the results <strong>of</strong> the different measurement campaigns were observed. Due to<br />
differences in wastewater composition <strong>and</strong> in changes <strong>of</strong> process parameters like dosage <strong>of</strong><br />
Swiss Centre for Applied Ecotoxicology, Eawag/EPFL · Überl<strong>and</strong>strasse 133 · CH-8600 Dübendorf<br />
www.oekotoxzentrum.ch<br />
4
ozone or PAC, it is difficult to assess the reproducibility <strong>of</strong> the assays from the Lausanne pilot<br />
study. Indeed this variability was reflected in the chemical analyses as well (Margot et al., 2011).<br />
Variability in the bioassays performed in this study might reflect differences in the wastewater<br />
composition during different sampling campaigns, changes <strong>of</strong> process parameters during<br />
treatment, differences in sample h<strong>and</strong>ling between measurement campaigns <strong>and</strong> in the<br />
laboratories, <strong>and</strong> the variability <strong>of</strong> the respective test procedure itself.<br />
Nevertheless a reduction in toxicity for the different treatment steps was detected by:<br />
- mechanism-oriented cellular in vitro bioassays after sample enrichment for all<br />
measurement campaigns,<br />
- integrative in vivo bioassays for selected measurement campaigns.<br />
Additionally, the sampling procedure <strong>and</strong> the sample h<strong>and</strong>ling are important factors which might<br />
cause differences in the test results. Therefore these procedures must be determined in advance<br />
considering the analyses to be made (e.g. what sampling devices <strong>and</strong> material to use, which<br />
filtration technique, how should the samples be stored etc.), <strong>and</strong> integrated in the study design in<br />
order to enable good comparability <strong>of</strong> the results <strong>and</strong> to eliminate the possibility that measured<br />
effects may be based on different sample h<strong>and</strong>ling <strong>and</strong> storage conditions.<br />
2.2. Summary<br />
In the pilot study at the WWTP Vidy, Lausanne, it was demonstrated that ozonation-SF <strong>and</strong><br />
PAC-UF treatment are both useful measures to reduce the concentrations <strong>and</strong> biological effects<br />
<strong>of</strong> micropollutants in waterbodies. The overall elimination efficiency regarding specific effects was<br />
generally above 80% (see chapters 4.3 <strong>and</strong> 4.4).<br />
There was no evidence for a toxicity increase due to a constant formation <strong>of</strong> stable toxic byproducts<br />
in the ozonation, i.e. by-products still present after the final filtration step (see chapters<br />
4.3 <strong>and</strong> 4.6).<br />
In order to reduce the risk <strong>of</strong> reactive <strong>and</strong> potentially toxic ozonation by-products being released<br />
in waterbodies, a final filtration step with biological activity after ozonation is recommended (for<br />
example s<strong>and</strong> filtration).<br />
Overall the advanced treatments led to strongly lowered risk quotients (between 6 <strong>and</strong> 13 times)<br />
as well as to a reduction in toxicity in bioassays compared to the effluent <strong>of</strong> the biological<br />
treatment, <strong>and</strong> thus a lowered risk <strong>of</strong> adverse effects for aquatic organisms in receiving<br />
waterbodies (see chapter 5).<br />
The application <strong>of</strong> bioassays for the performance review <strong>of</strong> advanced wastewater treatment has<br />
proven to be relevant <strong>and</strong> useful. In general, mechanism-oriented, cellular in vitro bioassays<br />
were deemed most promising for a routine monitoring <strong>of</strong> the performance <strong>of</strong> advanced treatment<br />
in WWTPs, however only specific effects are assessed in these tests. Certain in vivo bioassays<br />
could also show the beneficial effect <strong>of</strong> ozonation <strong>and</strong> PAC-UF treatment, such as the Fish Early<br />
Life Stage Test with rainbow trout (Oncorhynchus mykiss).<br />
It can be concluded that the quality <strong>of</strong> the treated effluent was significantly improved, leading to<br />
improved surface water quality.<br />
Swiss Centre for Applied Ecotoxicology, Eawag/EPFL · Überl<strong>and</strong>strasse 133 · CH-8600 Dübendorf<br />
www.oekotoxzentrum.ch<br />
5
3. Approach<br />
3.1. <strong>Bioassays</strong><br />
A broad range <strong>of</strong> biotests for the evaluation <strong>of</strong> water <strong>and</strong> wastewater quality is available. An<br />
important goal <strong>of</strong> this project was to identify appropriate bioassays sensitive enough to detect the<br />
effects <strong>of</strong> micropollutants. The selection <strong>of</strong> ecotoxicological test systems was based on<br />
preliminary studies conducted before the first pilot study at the WWTP Wüeri Regensdorf, <strong>and</strong> on<br />
surveys performed during the Regensdorf pilot study with 17 bioassays, including tests for<br />
measuring specific cellular effects, as well as integrative tests with whole organisms (Abegglen et<br />
al., 2009). Based on the results <strong>of</strong> these studies, <strong>and</strong> on the input from an international expert<br />
group on ecotoxicology, the most suitable tests as well as several additional mechanism-oriented<br />
in vitro assays were chosen for the Lausanne pilot study. A set <strong>of</strong> 16 in vitro <strong>and</strong> 9 in vivo<br />
bioassays was selected based on one or more <strong>of</strong> the following selection criteria (Abegglen et al.,<br />
2009):<br />
� Test sensitivity is high enough to detect contaminant effects in treated wastewater<br />
(WWTP effluent) in the preliminary studies<br />
� St<strong>and</strong>ardised test methods are available (OECD-, DIN or ISO certification)<br />
� Consideration <strong>of</strong> different trophic levels (bacteria, algae, macrophytes, invertebrates,<br />
vertebrates)<br />
� Application <strong>of</strong> different types <strong>of</strong> sample processing <strong>and</strong> test systems:<br />
a) assessment <strong>of</strong> enriched wastewater samples<br />
b) assessment <strong>of</strong> wastewater samples without sample enrichment<br />
c) effect measurements with organisms in flow-through systems (channels,<br />
microcosms)<br />
Two types <strong>of</strong> bioassays were used:<br />
� In vitro bioassays based on specific cellular mechanisms measure cellular effects specific<br />
to groups <strong>of</strong> toxicants with similar modes <strong>of</strong> action. These assays use cell cultures or<br />
transgenic bacteria or yeast to detect changes in receptor activation or enzyme function,<br />
e.g. endocrine, genotoxic or mutagenic effects; or inhibition <strong>of</strong> signal transduction.<br />
� For a better evaluation <strong>of</strong> integrative effects on whole organisms, validated <strong>and</strong><br />
st<strong>and</strong>ardised in vivo assays with test species from different trophic levels (algae,<br />
macrophytes, invertebrates <strong>and</strong> fish) are applied. These assays measure effects on<br />
parameters such as growth, reproduction, feeding activity <strong>and</strong> mortality, as well as effects<br />
based on more specific biochemical endpoints, e.g. vitellogenin concentration in the fish<br />
early life stage assay.<br />
In this report, the following assays were referred to as in vitro bioassays based on the specific<br />
endpoints measured: Ames, micronucleus <strong>and</strong> umuC assay, YES <strong>and</strong> CALUX assays, H295R<br />
assay <strong>and</strong> combined algae assay, similar to Ratte <strong>and</strong> Ratte (2009). The term in vivo bioassays<br />
was used for assays with bacteria, algae, duckweed, aquatic crustaceans, oligochaetes, snails<br />
<strong>and</strong> fish.<br />
Swiss Centre for Applied Ecotoxicology, Eawag/EPFL · Überl<strong>and</strong>strasse 133 · CH-8600 Dübendorf<br />
www.oekotoxzentrum.ch<br />
6
It is important to note that both test types, in vitro <strong>and</strong> in vivo bioassays, answer qualitatively<br />
different questions. In vitro bioassays based on specific cellular mechanisms, <strong>of</strong>ten combined<br />
with sample enrichment, enable a highly sensitive detection <strong>of</strong> certain chemical substance<br />
classes such as estrogens or herbicides, which are also relevant as micropollutants. However,<br />
interpretation <strong>of</strong> the results in an ecological context <strong>and</strong> extrapolation to potential consequences<br />
for whole organisms is difficult.<br />
On the other h<strong>and</strong>, integrative in vivo bioassays without the need for sample enrichment provide<br />
conclusive information about biological <strong>and</strong> potentially ecological effects such as growth,<br />
reproduction, <strong>and</strong> mortality. They integrate the effects <strong>of</strong> all substances in a wastewater sample<br />
such as chemicals, nutrients etc., but, depending on the used assays they give none or only<br />
limited information about the causative substance classes or relevant molecular processes.<br />
Another important point is that, depending on the endpoints used in the assay, the sensitivity <strong>of</strong><br />
the frequently applied test systems is <strong>of</strong>ten too low for the evaluation <strong>of</strong> the contamination with<br />
micropollutants. This may be due in part to the limited exposure time or the lower sensitivity <strong>of</strong><br />
the st<strong>and</strong>ard bioassay species when compared to native species, as well as to the lack <strong>of</strong><br />
sensitivity <strong>of</strong> the investigated endpoints.<br />
Figure 1 <strong>and</strong> Table 1 provide an overview <strong>of</strong> the tests performed in this study. The appropriate<br />
bioassays selection aimed to cover relevant modes <strong>of</strong> action, such as mutagenicity, genotoxicity,<br />
endocrine disruption (e.g. <strong>and</strong>rogen, estrogen, <strong>and</strong> glucocorticoid receptor activation, modulation<br />
<strong>of</strong> steroidogenesis), <strong>and</strong> herbicidal effects. Integrative in vivo bioassays were chosen to detect<br />
general toxicity <strong>of</strong> the wastewater to whole organisms from different trophic levels, as well as<br />
effects based on more specific endpoints, such as vitellogenin induction <strong>and</strong> number <strong>of</strong> <strong>of</strong>fspring.<br />
Figure 1: Overview <strong>of</strong> test organisms <strong>and</strong> test systems used in the two pilot studies Regensdorf <strong>and</strong><br />
Lausanne<br />
Swiss Centre for Applied Ecotoxicology, Eawag/EPFL · Überl<strong>and</strong>strasse 133 · CH-8600 Dübendorf<br />
www.oekotoxzentrum.ch<br />
7
Table 1: Overview <strong>of</strong> the applied test systems, test organisms <strong>and</strong> detectable effects.<br />
Test Organism Detectable Effect<br />
(endpoint, test duration)<br />
Swiss Centre for Applied Ecotoxicology, Eawag/EPFL · Überl<strong>and</strong>strasse 133 · CH-8600 Dübendorf<br />
www.oekotoxzentrum.ch<br />
Performing Laboratory<br />
Test systems based on specific cellular mechanisms (without sample enrichment) / in vitro – assays<br />
Ames test according to ISO<br />
16240<br />
(International Organization for<br />
St<strong>and</strong>ardization, 2005b)<br />
Micronucleus assay according to<br />
ISO 21427-2<br />
(International Organization for<br />
St<strong>and</strong>ardization, 2006)<br />
Salmonella<br />
typhimurium<br />
cell line VC79 <strong>of</strong> the<br />
Chinese hamster<br />
mutagenicity (number <strong>of</strong><br />
revertant/mutated<br />
colonies)<br />
genotoxicity (formation <strong>of</strong><br />
micronuclei as indication<br />
<strong>of</strong> DNA damage)<br />
Hydrotox (D)<br />
Hydrotox (D)<br />
Test systems based on specific cellular mechanisms (with sample enrichment) / in vitro – assays<br />
UmuC assay according to ISO<br />
13829<br />
(International Organization for<br />
St<strong>and</strong>ardization, 2000)<br />
Yeast Estrogen Screen (YES)<br />
(Routledge <strong>and</strong> Sumpter, 1996)<br />
CALUX10-Panel (ERα- + Anti-<br />
ERα- CALUX, AR- + Anti-AR-<br />
CALUX, GR- + Anti-GR- CALUX,<br />
PR- + Anti-PR- CALUX,<br />
PPARg1-+ Anti-PPARg1-CALUX,<br />
TRβ- CALUX)<br />
(Van der Linden et al., 2008)<br />
H295R Steroidogenesis Assay<br />
(Gracia et al., 2006)<br />
Combined algae assay<br />
(Chlorophyll fluorescence/ algae<br />
growth)<br />
(Quayle et al., 2008)<br />
Salmonella<br />
typhimurium<br />
Saccharomyces<br />
cerevisiae<br />
genotoxicity (induction <strong>of</strong><br />
the SOS response <strong>of</strong> the<br />
cell)<br />
estrogenic effects<br />
(receptor binding)<br />
human cell line effects on various<br />
hormone receptors<br />
(receptor binding)<br />
human cell line <strong>of</strong><br />
adenocarcinoma cells<br />
Pseudokirchneriella<br />
subcapitata<br />
effects on the genesis <strong>of</strong><br />
steroidal hormones<br />
(production <strong>of</strong> estradiol<br />
<strong>and</strong> testosterone)<br />
a) Inhibition <strong>of</strong><br />
photosynthesis after 2h<br />
(herbicide action)<br />
(chlorophyll fluorescence)<br />
b) unspecific growth<br />
inhibition after 24 h (OD)<br />
Ecotox Centre,(CH),<br />
Hydrotox (D)<br />
Ecotox Centre (CH)<br />
BDS (Biodetection<br />
Systems) (NL)<br />
RWTH Aachen (D)<br />
Entrix Inc. (CA)<br />
Ecotox centre (CH)<br />
St<strong>and</strong>ardised test systems without enrichment <strong>of</strong> the wastewater samples / in vivo – assays conducted in the<br />
laboratory<br />
Bacteria luminescence inhibition<br />
assay according to ISO 11348-3<br />
(International Organization for<br />
St<strong>and</strong>ardization, 2007b)<br />
Green algae growth assay<br />
according to ISO 8692<br />
(International Organization for<br />
St<strong>and</strong>ardization, 2004)<br />
Vibrio fischeri disturbance <strong>of</strong> ATP<br />
synthesis, (inhibition <strong>of</strong><br />
bioluminescence after 30<br />
min)<br />
Pseudokirchneriella<br />
subcapitata<br />
growth (cell number after<br />
72 h)<br />
Soluval Santiago (CH)<br />
Soluval Santiago (CH)<br />
8
Lemna minor growth assay<br />
according to ISO 20079<br />
(International Organization for<br />
St<strong>and</strong>ardization, 2005c)<br />
Chronic daphnia reproduction<br />
assay according to ISO 20665<br />
(International Organization for<br />
St<strong>and</strong>ardization, 2005a)<br />
Investigations on amphipods<br />
(Bundschuh et al., 2011b)<br />
Snail reproduction assay<br />
(Duft et al., 2002)<br />
Fish egg assay according to DIN<br />
38415-6/ ISO 15088:2007<br />
(Deutsches Institut für Normung,<br />
2003; International Organization<br />
for St<strong>and</strong>ardization, 2007a)<br />
Lemna minor growth (frond number <strong>and</strong><br />
biomass after 7 d)<br />
Ceriodaphnia dubia reproduction, mortality<br />
(after 7/8 d)<br />
Gammarus fossarum feeding activity, mortality<br />
(after 7 d)<br />
Potamopyrgus<br />
antipodarum<br />
reproduction, mortality<br />
(after 28 <strong>and</strong> 56 d)<br />
endocrine disruption<br />
Danio rerio mortality, lethal endpoints<br />
(48 h)<br />
Swiss Centre for Applied Ecotoxicology, Eawag/EPFL · Überl<strong>and</strong>strasse 133 · CH-8600 Dübendorf<br />
www.oekotoxzentrum.ch<br />
Soluval Santiago (CH)<br />
Soluval Santiago (CH)<br />
Institute for<br />
Environmental<br />
Sciences, University <strong>of</strong><br />
L<strong>and</strong>au (D)<br />
RWTH Aachen (D)<br />
ECT (D)<br />
St<strong>and</strong>ardised test systems without enrichment <strong>of</strong> the wastewater samples / in vivo – assays conducted in flow<br />
through systems at the WWTP Vidy<br />
Lumbriculus-Reproduction assay<br />
according to OECD Guideline<br />
225<br />
(OECD, 2007)<br />
Fish Early Life Stage Test<br />
(FELST) according to OECD<br />
Guideline 210<br />
(OECD, 1992)<br />
Lumbriculus<br />
variegatus<br />
Oncorhynchus<br />
mykiss<br />
reproduction, biomass<br />
(28 d)<br />
hatching rate, mortality,<br />
deformations, behavioural<br />
disturbances (swim up <strong>of</strong><br />
larvae), growth (length<br />
<strong>and</strong> weight), vitellogenin<br />
concentration (endpoint<br />
for endocrine disruption)<br />
(69 d)<br />
ECT (D)<br />
ECT (D)<br />
Background information on effects <strong>and</strong> respective bioassays used in this study is provided<br />
below.<br />
Test systems based on specific cellular mechanisms, in vitro – assays<br />
DNA Damage: In order to address the possible formation <strong>of</strong> reactive ozonation by-products,<br />
which are known to damage DNA (for review see Victorin, 1992, 1996), in this study, genotoxicity<br />
as well as mutagenicity were measured using the micronucleus <strong>and</strong> umuC assay (genotoxicity)<br />
<strong>and</strong> the Ames assay (mutagenicity).<br />
Genotoxicity describes any damage to the genome (Williams, 1989), <strong>and</strong> when genotoxic<br />
substances act on the cell, they can elicit DNA str<strong>and</strong> breaks, the insertion or deletion <strong>of</strong> bases,<br />
<strong>and</strong> shifts <strong>of</strong> the DNA reading frame. The majority <strong>of</strong> those changes is detected <strong>and</strong> reversed by<br />
the cellular repair system, however if repair is not possible the changes are passed on during cell<br />
9
division. This event is referred to as mutagenicity, the heritable, irreparable consequences <strong>of</strong><br />
genotoxicity.<br />
Hormonal Effects: WWTPs are the main source <strong>of</strong> hormonally active chemicals, <strong>and</strong> discharge<br />
their effluent directly into surface waters. Estrogenic substances have a high risk potential in<br />
susceptible waterbodies (NFP 50, 2008), being especially important as they have a wide range<br />
<strong>of</strong> implications on organisms <strong>and</strong> ecosystems (e.g. Kidd et al., 2007) <strong>and</strong> may affect the health<br />
<strong>and</strong> reproduction <strong>of</strong> wildlife in very low concentrations (e.g. Burkhardt-Holm et al., 2005; NFP 50,<br />
2008). Therefore, special attention to those substances was paid in the performance<br />
assessment.<br />
Estrogenicity was measured using receptor-based in vitro systems. The binding <strong>of</strong> estrogenic<br />
substances to the human estrogen receptor (hER) was assessed using the YES (Routledge <strong>and</strong><br />
Sumpter, 1996) <strong>and</strong> the ER CALUX assays (Van der Linden et al., 2008).<br />
Apart from estrogenic substances, various other hormonally active substances can be present in<br />
the water which may exert effects on organisms. To test if those substances can also be<br />
removed by advanced wastewater treatment, the effects on various hormone receptors (such as<br />
the <strong>and</strong>rogen, glucocorticoid, progesterone <strong>and</strong> thyroid hormone receptor) were assessed with<br />
several CALUX assays (Van der Linden et al., 2008).<br />
The cellular effects <strong>of</strong> hormonally active substances on hormone production <strong>and</strong> metabolism was<br />
measured by quantifying cellular hormone levels through the H295R steroidogenesis assay,<br />
which uses a human cell line <strong>of</strong> adenocarcinoma cells able to produce steroid hormones (such<br />
as testosterone or estradiol) <strong>and</strong> integrates effects on all relevant metabolism pathways leading<br />
to the production <strong>of</strong> those hormones (Gracia et al., 2006).<br />
Herbicidal Effects: To assess specific effects <strong>of</strong> herbicides, in particular inhibitors <strong>of</strong> the<br />
photosystem II, the combined algae assay with the green algae Pseudokirchneriella subcapitata<br />
was performed. It detects specific effects on the photosynthesis <strong>of</strong> unicellular green algae as well<br />
as unspecific effects on cell growth (Schreiber et al., 2002).<br />
Most samples used for the bioassays described above were tested in enriched form, except for<br />
the micronucleus <strong>and</strong> the Ames assay, where native wastewater samples were assessed. In<br />
both variations different dilution steps were tested.<br />
St<strong>and</strong>ardised whole organism tests at different trophic levels, in vivo –assays<br />
Primary Producers: To assess effects <strong>of</strong> municipal wastewater on primary producers, growth<br />
tests were performed with the single-celled green algae P. subcapitata (using native wastewater<br />
samples, <strong>and</strong> growth as sole endpoint), <strong>and</strong> with the duckweed Lemna minor as representatives<br />
<strong>of</strong> higher water plants or macrophytes. Both organisms play a central role in the aquatic<br />
ecosystem. They serve as food source for organisms <strong>of</strong> higher trophic levels, such as<br />
crustaceans, mussels <strong>and</strong> other filtering <strong>and</strong> detritus feeding invertebrates or vertebrates.<br />
Additionally, macrophytes play an important role for the structure <strong>of</strong> a waterbody <strong>and</strong> serve as<br />
habitat for numerous species.<br />
Primary Consumers: The water flea Ceriodaphnia dubia was chosen as primary consumer <strong>and</strong><br />
filter feeder. They are amongst others feeding on green algae, <strong>and</strong> serve as an important food<br />
source for larval fish <strong>and</strong> other aquatic species. St<strong>and</strong>ardised tests with C. dubia are one <strong>of</strong> the<br />
Swiss Centre for Applied Ecotoxicology, Eawag/EPFL · Überl<strong>and</strong>strasse 133 · CH-8600 Dübendorf<br />
www.oekotoxzentrum.ch<br />
10
most widespread bioassays used for evaluating the quality <strong>of</strong> surface water <strong>and</strong> effluent samples<br />
(e.g. U.S. Environmental Protection Agency, 2002).<br />
Among sediment feeders, aquatic oligochaetes, such as Lumbriculus variegatus play an<br />
important ecological role <strong>and</strong> serve as food source for benthivorous fish. Sediment feeding <strong>and</strong><br />
inhabiting (endobenthic) organisms are directly exposed to toxic substances. They can alter the<br />
bioavailability <strong>of</strong> substances bound to the sediment to other organisms (OECD, 2007; Phipps et<br />
al., 1993) as they mix sediments (bioturbation) <strong>and</strong> bioaccumulate chemicals.<br />
The New Zeal<strong>and</strong> mud snail Potamopyrgus antipodarum belongs to the group <strong>of</strong> detritus<br />
feeders, living as grazer on stones <strong>and</strong> water plants. Original from New Zeal<strong>and</strong>, the species is<br />
now abundant in Switzerl<strong>and</strong> as well. P. antipodarum reproduces parthenogenetically <strong>and</strong> is<br />
viviparous, its fecundity being a sensitive indicator for exposure to estrogenic or <strong>and</strong>rogenic<br />
active substances (Duft et al., 2002). Therefore, this test organism was included in the set <strong>of</strong><br />
biotests.<br />
The freshwater amphipod Gammarus fossarum is a key species in stream ecosystems. It shreds<br />
organic material, thus assisting in the recycling <strong>of</strong> nutrients <strong>and</strong> organic carbon, <strong>and</strong> is an<br />
important prey organism e.g. for fish (Karaman <strong>and</strong> Pinkster, 1977; Kunz et al., 2010).<br />
Laboratory <strong>and</strong> in situ tests with these organisms can provide valuable information on the effects<br />
<strong>of</strong> pollutants on important ecological functions in aquatic ecosystems (e.g. Bundschuh <strong>and</strong><br />
Schulz, 2011; Kunz et al., 2010).<br />
Secondary Consumers: Fish are the most important secondary consumers in aquatic<br />
ecosystems. As embryos <strong>and</strong> larvae are considered especially sensitive to pollutants (e.g.<br />
Pascoe <strong>and</strong> Shazili, 1986); effects <strong>of</strong> wastewater were assessed using two st<strong>and</strong>ardized early<br />
life stage tests:<br />
� the zebrafish (Danio rerio) embryo assay was used to assess mortality <strong>and</strong> lethal<br />
endpoints in fish embryos. It is a test which is <strong>of</strong>ten used for the toxicity assessment <strong>of</strong><br />
wastewater samples <strong>and</strong> replaces the acute fish test with adults in the German<br />
wastewater regulation (Deutsches Institut für Normung, 2003; Nagel, 2002).<br />
� the fish early life stage test (FELST) with rainbow trout (Oncorhynchus mykiss), a cold<br />
water fish species <strong>and</strong> therefore especially relevant for Swiss waterbodies. In previous<br />
studies, effects <strong>of</strong> estrogenic substances (vitellogenin induction) on this fish species were<br />
detected (e.g. Pawlowski et al., 2003; Stalter et al., 2010b). Vitellogenin is a precursor<br />
protein <strong>of</strong> egg yolk normally only found in female fish. Induction <strong>of</strong> vitellogenin<br />
concentration in fish was used as an indicator for estrogenic activity elicited by the test<br />
medium (Weil, 2010). In addition, hatching rate, mortality, deformations, behavioural<br />
disturbances (swim up <strong>of</strong> larvae) <strong>and</strong> growth (length <strong>and</strong> weight) were assessed.<br />
A number <strong>of</strong> in vivo bioassays were found not to be sensitive enough to assess the elimination<br />
efficiency <strong>of</strong> the complementary wastewater treatments studied here: the bioassays based on<br />
ISO 11348-3 (V. fischeri), ISO 8692 (P. subcapitata), ISO 20079 (L. minor), ISO 20665 (C.<br />
dubia) <strong>and</strong> DIN 38415-6 (D. rerio) (see Abegglen et al., 2009). Nevertheless, these assays as<br />
well as the bioassays measuring genotoxicity <strong>and</strong> mutagenicity were used in this study in order<br />
to detect potential adverse effects <strong>of</strong> ozonation by-products. Additionally, they are capable <strong>of</strong><br />
detecting toxicity <strong>of</strong> untreated wastewater samples (without enrichment) <strong>and</strong> more polluted<br />
effluents, e.g. industrial wastewater (e.g. Cordova Rosa et al., 2001; Tchounwou et al., 2001).<br />
Swiss Centre for Applied Ecotoxicology, Eawag/EPFL · Überl<strong>and</strong>strasse 133 · CH-8600 Dübendorf<br />
www.oekotoxzentrum.ch<br />
11
Samples used for in vivo bioassays, were tested in different dilution steps, except for the assays<br />
with P. antipodarum, L. variegatus, G. fossarum <strong>and</strong> O. mykiss, which were exposed only to<br />
undiluted wastewater samples.<br />
3.2. Sample Collection <strong>and</strong> Preparation<br />
Four large <strong>and</strong> several small measurement campaigns (MC) were carried out to assess the<br />
performance <strong>of</strong> the complementary treatments, ozonation <strong>and</strong> PAC-UF on the WWTP Vidy in<br />
Lausanne, which is built to treat municipal wastewater <strong>of</strong> 220’000 person equivalents. More<br />
specific information on technical details <strong>of</strong> the WWTP <strong>and</strong> the sampling campaigns can be found<br />
in the final report on the pilot study (Margot et al., 2011). The technical procedures were<br />
optimized in the 4 th measurement campaign.<br />
Table 2 lists the sampling dates <strong>and</strong> technical information on the respective ozone <strong>and</strong> powdered<br />
activated carbon treatments.<br />
Table 2: Ozone concentrations <strong>and</strong> powdered activated carbon types <strong>and</strong> concentrations<br />
applied in the four measurement campaigns (according to Margot et al., 2011).<br />
Sampling date Ozone dose (mg O3/g DOC)<br />
Powdered activated carbon dose<br />
(mg PAC/L wastewater)<br />
20.-27.07.09 0.5 No PAC treatment<br />
30.10.-05.11.09 0.7 10 (Norit)<br />
10.-17.03.10 0.8 12 (Sorbopor)<br />
26.05.-02.06.10 1.1 20 (Sorbopor)<br />
Samples were collected time-proportionaly using automated sampling devices for chemical<br />
analysis <strong>of</strong> micropollutants, <strong>and</strong> ecotoxicological tests described in chapter 3.1 <strong>and</strong> Table 1.<br />
Additionally classical water quality parameters were assessed: dissolved organic carbon (DOC),<br />
biological oxygen dem<strong>and</strong> (BOD), chemical oxygen dem<strong>and</strong> (COD), pH, nutrients. Details<br />
regarding the selection <strong>and</strong> analysis <strong>of</strong> micropollutants can be found in Margot et al. (2011).<br />
The samples were collected at the following points (see Figure 2):<br />
� WWTP influent (Entrée STEP, EN)<br />
� Effluent biological treatment (”old“ biology, sortie biologie, SB) (1 st measurement campaign)<br />
� Effluent moving bed biology (Sortie lit fluidisé, LF) (2 nd - 4 th measurement campaign)<br />
� Effluent ozonation (Sortie O3, OZ)<br />
� Effluent carbon filter (Sortie charbon actif granulé, CAG) (1 st <strong>and</strong> 2 nd measurement campaign)<br />
� Effluent s<strong>and</strong> filter (Sortie filtre à sable, SF) (3 rd <strong>and</strong> 4 th measurement campaign)<br />
� Effluent powdered activated carbon treatment followed by ultrafiltration (Sortie charbon actif<br />
en poudre - UF, PAC-UF) (2 nd - 4 th measurement campaign)<br />
Swiss Centre for Applied Ecotoxicology, Eawag/EPFL · Überl<strong>and</strong>strasse 133 · CH-8600 Dübendorf<br />
www.oekotoxzentrum.ch<br />
12
Figure 2 gives an overview <strong>of</strong> the different treatment steps <strong>and</strong> sampling points.<br />
<strong>Wastewater</strong><br />
Pretreatment<br />
Mechanical treatme nt<br />
EN<br />
WWTP Influent<br />
(Entrée, EN)<br />
Primary<br />
treatment<br />
Primary clarifier<br />
MC = Measurement campaign<br />
Secondary <strong>and</strong><br />
tertiary treatment<br />
Biological<br />
treatment<br />
Moving Bed<br />
biology<br />
„old“ biology<br />
(Sortie biologie, SB)<br />
Secondary<br />
clarifier SB<br />
(1. MC)<br />
Secondary<br />
clarifier<br />
LF<br />
Moving bed<br />
biology<br />
(Lit fluidise, LF)<br />
Advanced treatment <strong>of</strong><br />
micropollutants<br />
PAC-UF treatment<br />
Powdered activated carbon with<br />
Ultrafiltration<br />
(Charbon active en poudre, PAC-UF)<br />
Ozonation<br />
Ozonation<br />
(OZ)<br />
Swiss Centre for Applied Ecotoxicology, Eawag/EPFL · Überl<strong>and</strong>strasse 133 · CH-8600 Dübendorf<br />
www.oekotoxzentrum.ch<br />
PAC-UF (2.-4. MC)<br />
Carbon filter<br />
or<br />
S<strong>and</strong> filtration<br />
OZ<br />
CAG (1.-2.MC)<br />
Figure 2: Overview <strong>of</strong> the sewage treatment plant Lausanne <strong>and</strong> the different sampling points.<br />
SF (3.-4.MC)<br />
Carbon filter<br />
(CAG) or s<strong>and</strong><br />
filter (SF)<br />
The classical water quality parameters were assessed in the daily composite samples as soon<br />
as possible after collecting, usually on the same day. For bioassays, daily composite samples<br />
were collected during one week, filled in conditioned glass bottles, filtered through a glass fibre<br />
filter (1 µm, Millipore, type APFD 09050) <strong>and</strong> stored at 4°C. These samples were then<br />
proportionally combined to obtain 2, 3 or 7-day-composite samples, which were submitted to<br />
analytical chemistry <strong>and</strong> used in bioassays. Samples were transported to the responsible<br />
laboratories cooled on ice or frozen.<br />
For most in vitro bioassays focusing on specific cellular mechanisms, 7-day composite samples<br />
were enriched using solid phase extraction (SPE) at the Swiss Centre for Applied Ecotoxicology,<br />
Dübendorf, CH (see Table 1). Following st<strong>and</strong>ard operating procedures (Eawag, 2007), 250 ml<br />
(influent samples) or 500 mL (all others) were filtered using C18/EN cartridges (Supelco, Sigma-<br />
Aldrich, USA) (Escher et al., 2008b); 500 mL <strong>of</strong> Millipore water served as a blank. After extraction<br />
using 4*1 mL <strong>of</strong> Acetone <strong>and</strong> 1 mL <strong>of</strong> Methanol, 250 times (influent) or 500 times (all other<br />
sampling points) enriched samples were stored in 1 mL <strong>of</strong> a solvent mixture (~50% ethanol,<br />
~50% acetone <strong>and</strong> methanol) at -20°C until being transported on dry ice for analysis.<br />
13
4. Performance Analysis <strong>of</strong> Advanced <strong>Wastewater</strong> Treatment<br />
4.1. Toxicity Parameters<br />
Biological parameters measured in bioassays, such as mortality, number <strong>of</strong> <strong>of</strong>fspring, cell<br />
number, weight, <strong>and</strong> cellular receptor activity, are commonly referred to as ‘endpoints’. The term<br />
‘toxicity parameter’ refers to effect values, which are calculated using statistical or mathematical<br />
methods (see also Figure 3). They are defined as follows:<br />
ECx The ECx is the effective concentration (or % test/effluent sample) at which x % (e.g.<br />
10, 20 or 50 %) <strong>of</strong> its maximal effect is reached, e.g. 50 % <strong>of</strong> the test organisms show<br />
a defined effect. The calculation is done by regression analysis <strong>and</strong> gives,<br />
additionally to the respective derived toxicity parameter, a confidence interval (usually<br />
95% confidence interval), which st<strong>and</strong>s for the concentration range in which the ‘real’<br />
value lays with a probability <strong>of</strong> 95 %.<br />
The lower the ECx-value, the more toxic the evaluated substance or sample is.<br />
NOEC The no observed effect concentration (NOEC) is the highest tested concentration that<br />
does not yet cause a statistically significant effect compared to the control.<br />
LOEC The lowest observed effect concentration (LOEC) is the lowest tested concentration<br />
that elicits a statistically significant effect compared to the control.<br />
TEQ The toxic equivalent concentration (TEQ) is defined as the concentration <strong>of</strong> a<br />
reference substance, which would have the same effect as the environmental sample<br />
(see e.g. Escher et al., 2008a). The reference substances vary depending on the<br />
type <strong>of</strong> the measured specific endpoint. The TEQ allows to express toxic potency (or<br />
toxic quantity) <strong>of</strong> a mixture as concentration <strong>of</strong> a reference chemical <strong>and</strong> integrates<br />
the effects <strong>of</strong> all substances with the same mode <strong>of</strong> action.<br />
The higher the TEQ value, the more toxic the evaluated sample is.<br />
Swiss Centre for Applied Ecotoxicology, Eawag/EPFL · Überl<strong>and</strong>strasse 133 · CH-8600 Dübendorf<br />
www.oekotoxzentrum.ch<br />
14
cumulative response<br />
100 %<br />
80 %<br />
60 %<br />
40 %<br />
20 %<br />
cumulative response<br />
Reference substance<br />
Figure 3: Example for a dose response curve with the toxicity parameters NOEC, LOEC <strong>and</strong> EC50.<br />
◊ control, ◊ treatment, * significant difference to the control (top graph). The graphs below show the<br />
derivation <strong>of</strong> TEQs by comparing the effect concentration <strong>of</strong> an environmental sample with the effect<br />
concentration <strong>of</strong> a reference substance.<br />
4.2. Change Index<br />
100 %<br />
80 %<br />
60 %<br />
50 %<br />
40 %<br />
20 %<br />
TEQ<br />
log (concentration)<br />
LOEC<br />
NOEC<br />
*<br />
*<br />
EC 50 /LC 50<br />
log (concentration)<br />
Environmental Sample<br />
log (dilution/enrichment factor)<br />
For the efficiency evaluation <strong>of</strong> the different sewage treatment steps, the bioassay results <strong>and</strong><br />
calculated toxicity parameters provided a broad database. For better comparison between<br />
toxicity detected using different bioassays <strong>and</strong> native wastewater samples or enriched samples,<br />
a common parameter was used, the ‘Change Index (CI)’. The CI describes the relative change in<br />
toxicity after individual sewage treatment steps (Ratte <strong>and</strong> Ratte, 2009). It allows a direct<br />
comparison <strong>of</strong> tests with <strong>and</strong> without sample enrichment <strong>and</strong> therefore also <strong>of</strong> in vitro <strong>and</strong> in vivo<br />
bioassays.<br />
Use <strong>of</strong> the CI provides the following advantages:<br />
1) The CI enables a conclusion if <strong>and</strong> to which extent the toxicity is changed by the observed<br />
treatment step independent <strong>of</strong> the respective absolute value <strong>of</strong> a toxicity parameter.<br />
Swiss Centre for Applied Ecotoxicology, Eawag/EPFL · Überl<strong>and</strong>strasse 133 · CH-8600 Dübendorf<br />
www.oekotoxzentrum.ch<br />
*<br />
*<br />
*<br />
*<br />
* * *<br />
15
2) The CI enables a direct comparison between mechanism-oriented cellular in vitro bioassays<br />
<strong>and</strong> integrative in vivo bioassays, as it is independent <strong>of</strong> the definition/calculation <strong>of</strong> the<br />
respective toxicity parameter.<br />
The CI is analogous to elimination efficiency, <strong>and</strong> is calculated as follows:<br />
(1) CI =<br />
(2) CITEQ =<br />
Toxicity value after treatment<br />
Toxicity value before treatment<br />
Toxicity value after treatment<br />
Toxicity value before treatment<br />
Equation 1 is used for EC- <strong>and</strong> NOEC / LOEC values: Here the higher the ECx or NOEC / LOEC<br />
values, the more the toxicity <strong>of</strong> the sample is decreasing (<strong>and</strong> CI increases).<br />
Equation 2 is used for toxic equivalent concentrations (TEQs). The TEQ is the concentration <strong>of</strong> a<br />
reference substance that would have the same effect as the environmental sample. The higher<br />
the TEQ, the more toxic is the substance or environmental sample. With decreasing toxicity the<br />
TEQ decreases. Therefore the CITEQ is the inverse <strong>of</strong> equation 1.<br />
In summary, the CIs for the toxicity parameters ECx, TEQ <strong>and</strong> for values significantly different to<br />
the control indicate:<br />
Change Index CI > 1 decreased toxicity<br />
Change Index CI ~1 equal toxicity (range: 0.75 < CI < 1.25)<br />
Change Index CI < 1 increased toxicity<br />
A deviation <strong>of</strong> equal to or more than 25 % from CI = 1, i.e. CI ≥1.25 or CI≤1.25, was considered<br />
respectively a significant reduction or increase <strong>of</strong> toxicity due to a specific treatment step. This<br />
rather high tolerance level was set arbitrarily in order to address the variability <strong>of</strong> bioassay data in<br />
a common way.<br />
The following CIs were calculated for comparing the results <strong>of</strong> the bioassays:<br />
CILF/EN or CISB/EN Effect biological treatment<br />
CIOZ/LF or CIOZ/SB Effect ozonation<br />
CISF/OZ Effect s<strong>and</strong> filtration (3 rd + 4 th MC)<br />
CISF/LF Effect ozonation + s<strong>and</strong> filtration (3 rd + 4 th MC)<br />
CIPAC/LF Effect PAC-UF treatment (2 nd to 4 th MC)<br />
For four bioassays (L. variegatus, O. mykiss, P. antipodarum, G. fossarum) it was not possible to<br />
calculate toxicity parameters, because the water samples were not tested as dilution series. For<br />
these, the CI was derived by statistical comparison <strong>of</strong> effect data (e.g. number <strong>of</strong> hatched fish)<br />
for organisms exposed to undiluted water samples before <strong>and</strong> after each treatment step.<br />
Students t-test (GraphPad Prism 5, GraphPad S<strong>of</strong>tware Inc., CA, USA) followed by a Bonferroni-<br />
Swiss Centre for Applied Ecotoxicology, Eawag/EPFL · Überl<strong>and</strong>strasse 133 · CH-8600 Dübendorf<br />
www.oekotoxzentrum.ch<br />
-1<br />
16
Holm correction (Holm, 1979) to account for multiple comparisons was used to determine<br />
significant differences.<br />
In the subsequent chapter, the indicator value <strong>of</strong> the different bioassays will be compared using<br />
the CI.<br />
4.3. Comparison <strong>of</strong> Bioassay Results<br />
The following tables (Table 3 <strong>and</strong> Table 4) give an overview <strong>of</strong> the bioassay results using the CI<br />
to display the changes in toxicity following each wastewater treatment step. A quantitative<br />
analysis for the different steps is presented in chapter 4.4. More detailed results for each toxicity<br />
parameter, the CIs <strong>and</strong> elimination efficiencies can be found in the appendix (Table 7 to Table<br />
26).<br />
4.3.1. In vitro <strong>Bioassays</strong><br />
Table 3 shows the changes in specific effects based on change indices (CITEQ) resulting from in<br />
vitro bioassays.<br />
Table 3: Change indices (CITEQ) for bioassays, based on specific cellular mechanisms / in vitro bioassays with sample<br />
enrichment.<br />
Red arrows pointing up (↑, in red) mean CITEQ < 1 = increasing effects, a tilde (~, in grey) means CITEQ ~ 1 = equal effects <strong>and</strong> a<br />
green arrow pointing down (↓, in green) means CITEQ > 1 = decreasing effects in most <strong>of</strong> the measurement campaigns (≥ 3). Var.<br />
marks varying results between different measurement campaigns (in grey). Crossed out fields mean that no influent samples have<br />
been measured <strong>and</strong> therefore no effect <strong>of</strong> the biological treatment could be assessed.<br />
Bioassay Substance classes (effect<br />
parameter)<br />
YES assay Estrogens (Estradiol equivalents,<br />
ng/L)<br />
ER CALUX Estrogens (Estradiol equivalents,<br />
ng/L)<br />
AR CALUX Androgens (Dihydrotestosterone<br />
equivalents, ng/L)<br />
GR CALUX Glucocorticoids (Dexmethason<br />
equivalents, ng/L)<br />
PR CALUX Progesterones (Org-2058<br />
equivalents, ng/L)<br />
PPARg1<br />
CALUX<br />
H295R<br />
Assay<br />
Green<br />
algae<br />
Peroxisome proliferator like<br />
acting substances (Rosiglitasone<br />
equivalents, ng/L)<br />
Effect<br />
Biological<br />
treatment<br />
(CILF/EN)<br />
Effect<br />
Ozonation<br />
(CIOZ/LF)<br />
Effect S<strong>and</strong><br />
filtration<br />
(3.+4. MC)<br />
(CISF/OZ)<br />
Swiss Centre for Applied Ecotoxicology, Eawag/EPFL · Überl<strong>and</strong>strasse 133 · CH-8600 Dübendorf<br />
www.oekotoxzentrum.ch<br />
Effect<br />
Ozonation +<br />
S<strong>and</strong> filtration<br />
(3.+4. MC)<br />
(CISF/LF)<br />
Effect<br />
Powdered<br />
activated<br />
carbon – UF<br />
(CIPAC/LF)<br />
↓ ↓ var. ↓ ↓<br />
↓ ↓ var. var. ↓<br />
↓ ↓ var. ↓ ↓<br />
~ ↓ ↓ ↓ ↓<br />
↑ ↓ ↑ ↓ ↓<br />
↓ ↓ var. var. ↓<br />
Estradiol induction ↓ ~ ↓ ↓<br />
Testosterone induction ~ ~ ~ ~<br />
Herbicides (Diuron equivalents,<br />
µg/L) (Photosynthesis inhibition)<br />
General Toxicity (baseline toxic<br />
equivalent conc., mg/L) (Growth<br />
inhibition)<br />
var. ↓ ~ ↓ ↓<br />
↓ ↓ ↓ ↓ ↓<br />
17
Biological wastewater treatment presented decreased effects as indicated by most in vitro<br />
bioassays measuring effects on specific cellular mechanisms. Exceptions were progesterone-like<br />
activity, which increased. An explanation might be that this substance class was insufficiently<br />
removed during biological treatment, or that breakdown products contributed to this effect. In<br />
general, the measured concentrations <strong>of</strong> progesterone-like acting substances (e.g. progesterone,<br />
a steroid hormone involved in the menstruation cycle, pregnancy <strong>and</strong> embryogenesis <strong>of</strong> humans<br />
<strong>and</strong> other species, <strong>and</strong> medroxyprogesterone or levonorgestrel, synthetic progestogens similar<br />
to progesterone) were low <strong>and</strong> ranged from 0.11 ng/L (EN, 2 nd MC) to 2.6 ng/L (SB, 1 st MC) (see<br />
Table 13, Appendix). Those concentrations were in the same range as data from earlier studies<br />
on effluent samples <strong>and</strong> surface waters (Kolodziej <strong>and</strong> Sedlak, 2007; Van der Linden et al.,<br />
2008). Known effect concentration data <strong>of</strong> these substances for aquatic organisms are rare, <strong>and</strong><br />
ranged from 156 ng/L for the western clawed frog (Xenopus tropicalis) (Kvarnryd et al., 2011) up<br />
to 5000 μg/L for adult rainbow trout (Billard et al., 1981). Therefore, these data are difficult to<br />
interpret, <strong>and</strong> further investigation is needed before the environmental relevance <strong>of</strong> this finding<br />
can be established. The influent samples were cytotoxic to cell cultures used in the H295R<br />
steroidogenesis assay .<br />
Glucocorticoid like acting substances (i.e. steroid hormones affecting the metabolism <strong>of</strong> glucose<br />
<strong>and</strong> reducing immune activity, e.g. cortisol, corticosterone) were unaffected by biological<br />
treatment. Concentrations <strong>of</strong> those substances (expressed as dexmethasone equivalent<br />
concentrations) ranged from < 4 ng/L (PAC-UF, 2 nd -4 th MC) to 140 ng/L (LF, 2 nd MC) (see Table<br />
12, Appendix). The lowest effect concentration for aquatic organisms found in the literature was<br />
3.46 µg/L for the African clawed frog (Xenopus laevis) exposed to corticosterone (Lorenz et al.,<br />
2009), which is 24 times higher than the highest measured value in the pilot study. However as<br />
toxicity data regarding this substance class are still rare no final conclusion on the environmental<br />
relevance <strong>of</strong> the measured concentrations can be drawn.<br />
The effect <strong>of</strong> biological treatment on photosystem II inhibiting herbicides showed variable results.<br />
Ozonation <strong>and</strong> PAC-UF decreased effects as indicated by all in vitro bioassays used, with one<br />
exception. In the H295R steroidogenesis assay, the advanced treatment processes were not<br />
able to reduce the slight inhibition <strong>of</strong> testosterone production, which was present in biologically<br />
treated wastewater.<br />
S<strong>and</strong> filtration by itself showed variable results. These results are discussed in more detail in<br />
chapter 4.3.4.<br />
The net effect <strong>of</strong> ozonation plus s<strong>and</strong> filtration was a decrease in toxicity for most in vitro<br />
bioassays.<br />
Swiss Centre for Applied Ecotoxicology, Eawag/EPFL · Überl<strong>and</strong>strasse 133 · CH-8600 Dübendorf<br />
www.oekotoxzentrum.ch<br />
18
4.3.2. Laboratory In Vivo <strong>Bioassays</strong><br />
Based on the results <strong>of</strong> the laboratory in vivo bioassays, it can be summarized that no consistent<br />
toxicity increase due to ozonation by-products was found.<br />
Table 4 shows the changes in toxicity determined by in vivo bioassays performed in the<br />
laboratory.<br />
Table 4: Change indices (CI) for in vivo bioassays performed in the laboratory with wastewater in a dilution series.<br />
Red arrows pointing up (↑, in red) mean CI < 1 = increasing toxicity, a tilde (~, in grey) means CI ~ 1 = equal toxicity <strong>and</strong> a<br />
green arrow pointing down (↓, in green) means CI > 1 = decreasing toxicity in most <strong>of</strong> the measurement campaigns (≥ 3). Var.<br />
marks varying results between different measurement campaigns (in grey) <strong>and</strong> n.t. means not toxic (in white). Crossed out<br />
fields mean that no influent samples have been measured <strong>and</strong> therefore no effect <strong>of</strong> the biological treatment could be<br />
assessed. For Gammarus fossarum only the effect <strong>of</strong> ozonation + s<strong>and</strong> filtration <strong>and</strong> <strong>of</strong> PAC-UF was measured.<br />
Test organism Endpoint (Toxicity<br />
parameter)<br />
Effect<br />
Biological<br />
treatment<br />
(CILF/EN)<br />
Effect<br />
Ozonation<br />
(CIOZ/LF)<br />
Effect<br />
S<strong>and</strong><br />
filtration<br />
(3.+4. MC)<br />
(CISF/OZ)<br />
Swiss Centre for Applied Ecotoxicology, Eawag/EPFL · Überl<strong>and</strong>strasse 133 · CH-8600 Dübendorf<br />
www.oekotoxzentrum.ch<br />
Effect<br />
Ozonation +<br />
S<strong>and</strong><br />
filtration<br />
(3.+4. MC)<br />
(CISF/LF)<br />
Effect<br />
Powdered<br />
activated<br />
carbon –<br />
UF<br />
(CIPAC/LF)<br />
Vibrio fischeri Inhibition <strong>of</strong><br />
Luminescence (EC20)<br />
↓ n.t. n.t. n.t. n.t.<br />
Pseudokirchneriella<br />
subcapitata (without<br />
Cell number (EC20) ~ ~ var. var. ~<br />
nutrient addition) (EC50) ~ ~ ~ ~ ~<br />
Pseudokirchneriella<br />
subcapitata (with<br />
nutrient addition)<br />
Cell number (EC20) ↓ n.t. var. var. n.t.<br />
(EC50) ↓ n.t. n.t. n.t. n.t.<br />
Lemna minor Frond number (EC20) ↓ var. var. var. n.t.<br />
Ceriodaphnia dubia Number <strong>of</strong> <strong>of</strong>fspring<br />
(EC20)<br />
Gammarus<br />
fossarum<br />
Potamopyrgus<br />
antipodarum<br />
(EC50) var. n.t. ~ ~ n.t.<br />
↓ var. var. ↑ n.t.<br />
(EC50) ↓ n.t. var. var. n.t.<br />
Mortality (EC50) var. n.t. ~ ~ n.t.<br />
Feeding rate ~ ~<br />
Mortality ~ ~ ~ ↓<br />
Danio rerio Mortality ↓ n.t. n.t. n.t. n.t.<br />
Biological Treatment: Most in vivo bioassays performed in the lab showed a decrease in toxicity<br />
after biological treatment compared to influent samples. The resulting toxicity level was mostly<br />
non-toxic or slightly toxic.<br />
Ozonation <strong>and</strong> PAC-UF: If toxicity was still present after biological treatment, there was no<br />
additional reduction by advanced treatment. No increase or decrease in toxicity was evident after<br />
ozonation <strong>and</strong> PAC-UF. The toxicity remained on a mostly low level showing rather varying<br />
results or no changes at all. The chronic bioassay with C. dubia indicated an increase in toxicity<br />
(EC20 <strong>and</strong> fecundity) after ozonation plus s<strong>and</strong> filtration treatments. A possible explanation for<br />
19
that might be toxic substances originating from the pilot s<strong>and</strong> filter. As the 3 rd measurement<br />
campaign took place soon after the installation <strong>of</strong> the pilot s<strong>and</strong> filter, it is possible that the effects<br />
were caused by this filter. However, such effects have not been observed in common s<strong>and</strong><br />
filters. In the other in vivo bioassays no such effects were observed.<br />
The snail reproduction test with P. antipodarum did not yield reliable results due to high mortality<br />
in some samples (Maletz <strong>and</strong> Hollert, 2010). No mortality was observed in wastewater samples<br />
after PAC-UF treatment. Increased mortality after biological treatment, ozonation <strong>and</strong> s<strong>and</strong><br />
filtration may have been due to increased growth <strong>of</strong> green <strong>and</strong> brown algae during the test,<br />
<strong>and</strong>/or toxic substances still present there, which were removed by PAC-UF treatment only. No<br />
parasites were detected. At this point, no definite explanation for the increased mortality <strong>of</strong> P.<br />
antipodarum can be provided. In a similar study at the WWTP Neuss, Germany, no mortality <strong>of</strong><br />
P. antipodarum in wastewater from the different cleaning steps was reported (Stalter et al.,<br />
2010a).<br />
The feeding assay with G. fossarum did not indicate a change in wastewater toxicity due to<br />
ozonation (Schulz <strong>and</strong> Bundschuh, 2010). However, if wastewater was treated with slightly<br />
higher ozone concentrations in the laboratory the feeding rates increased, suggesting that the<br />
ozone concentrations applied at the WWTP were too low to cause a shift in toxicity detectable for<br />
these organisms. Similarly, on-site PAC treatment did not alter feeding activity This may be due<br />
to the PAC-mediated removal <strong>of</strong> trace elements (Filby et al., 2010) <strong>and</strong> a subsequent decline in<br />
activity <strong>and</strong> health <strong>of</strong> the test organisms.<br />
Swiss Centre for Applied Ecotoxicology, Eawag/EPFL · Überl<strong>and</strong>strasse 133 · CH-8600 Dübendorf<br />
www.oekotoxzentrum.ch<br />
20
4.3.3. In Situ <strong>Bioassays</strong><br />
Table 5 shows the changes in toxicity resulting from in vivo bioassays performed at the WWTP<br />
Vidy in flow-through systems under in situ conditions.<br />
Table 5: Change indices (CI) for in vivo bioassays performed at the WWTP Vidy with undiluted wastewater<br />
Red arrows pointing up (↑, in red) mean CI < 1 = increasing toxicity, a tilde (~, in grey) means CI ~ 1 = equal toxicity <strong>and</strong><br />
a green arrow pointing down (↓, in green) means CI > 1 = decreasing toxicity. No influent samples have been measured<br />
<strong>and</strong> therefore no effect <strong>of</strong> the biological treatment could be assessed.<br />
Test organism Endpoint Effect<br />
Ozonation<br />
(CIOZ/LF)<br />
Lumbriculus<br />
variegatus<br />
Oncorhynchus<br />
mykiss<br />
Effect<br />
S<strong>and</strong><br />
filtration<br />
(CISF/OZ)<br />
Effect<br />
Ozonation +<br />
S<strong>and</strong> filtration<br />
(CISF/LF)<br />
Swiss Centre for Applied Ecotoxicology, Eawag/EPFL · Überl<strong>and</strong>strasse 133 · CH-8600 Dübendorf<br />
www.oekotoxzentrum.ch<br />
Effect<br />
Powdered<br />
activated<br />
carbon – UF<br />
(CIPAC/LF)<br />
Reproduction ~ ~ ~ ~<br />
Biomass ↑ ~ ~ ↑<br />
Overall Survival ↓ ~ ↓ ↓<br />
Survival <strong>of</strong> embryos ~ ~ ~ ↓<br />
Survival <strong>of</strong> larvae <strong>and</strong><br />
juveniles<br />
↓ ~ ↓ ↓<br />
Hatching rate ~ ~ ~ ↓<br />
Swim-up <strong>of</strong> hatched larvae ↓ ~ ↓ ↓<br />
Fresh weight <strong>of</strong> larvae at<br />
end <strong>of</strong> test<br />
Length <strong>of</strong> larvae at end <strong>of</strong><br />
test<br />
↓ ~ ↓ ↓<br />
~ ↓<br />
Vitellogenin concentration ↓ ~ ↓ ↓<br />
Biological treatment: In vivo bioassays performed in flow through systems showed an increase in<br />
L. variegatus biomass after biological treatment compared to the control treatment (water <strong>of</strong> Lake<br />
Geneva) (Weil, 2010), suggesting better than normal conditions for this species.<br />
The effluent from the biological treatment step negatively affected all developmental stages <strong>of</strong><br />
trout, i.e. delayed hatching <strong>of</strong> more than 6 days, 40-50 % <strong>of</strong> overall mortality, diminished<br />
swimming ability <strong>and</strong> a significantly elevated vitellogenin concentration compared to the controls<br />
(63.1 ng/mL, measured in 69 days old larvae via ELISA (Knacker et al., 2010)). Results indicate<br />
that toxic amounts <strong>of</strong> substances that cause deleterious developmental effects <strong>and</strong> endocrine<br />
disruptors were present in biologically treated effluent.<br />
Ozonation <strong>and</strong> PAC-UF: Biomass <strong>of</strong> L. variegatus was significantly decreased after both<br />
ozonation <strong>and</strong> PAC-UF suggesting increased toxicity. For PAC-UF treatment, it is possible that<br />
the effect was caused by the reduced availability <strong>of</strong> food <strong>and</strong> nutrients in the treated wastewater.<br />
Negative effects <strong>of</strong> ozonation may be caused by reactive toxic ozonation by-products that were<br />
eliminated in the s<strong>and</strong> filtration. Similar observations were made by Stalter et al. (2010a), which<br />
prompted the recommendation to include a final filtration step with biological/bacterial activity<br />
21
such as a s<strong>and</strong> filter after ozonation. In Lausanne however a tendency for a decrease was<br />
observed in the reproduction <strong>of</strong> L. variegatus exposed to the s<strong>and</strong> filtered water as well as to<br />
water from PAC-UF, but results were not significant with Bonferroni-Holm adjustment. This effect<br />
could be due to a reduced availability <strong>of</strong> nutrients <strong>and</strong> suspended matter in the effluent <strong>of</strong> those<br />
treatments compared to the biological treatment <strong>and</strong> ozonation (Weil, 2010). Similar results have<br />
been obtained in other studies (Stalter et al., 2010a).<br />
The Fish Early Life Stage test with O. mykiss showed decreased toxic effects for 5 out <strong>of</strong> 8<br />
observed endpoints after ozonation. After ozonation <strong>and</strong> s<strong>and</strong> filtration treatment however weight<br />
<strong>and</strong> length <strong>of</strong> the fish were significantly reduced compared to the controls, as was also observed<br />
by Stalter et al. (2010b). Treatment with PAC-UF led to decreased toxicity compared to<br />
biologically treated wastewater for all the observed endpoints. Overall, organism performance<br />
after exposure to PAC-UF treated effluent was similar to controls. Both advanced treatment<br />
systems were able to decrease vitellogenin concentration in fish to control levels (10.6 ng/mL),<br />
indicating good elimination <strong>of</strong> estrogenic active substances. These effects were also observed in<br />
the YES <strong>and</strong> ER CALUX assays, where the EEQs ranged from 0.9 - 3 ng/L in the effluent <strong>of</strong><br />
biological treatment <strong>and</strong> around 0.3 ng/L in the effluent <strong>of</strong> the advanced treatments. These<br />
values are in the same range as measurements at the WWTP Wüeri (effluent ozonation-SF:<br />
0.05 - 0.33 ng/L EEQ), <strong>and</strong> up to 5 ng/L EEQ have been measured in Swiss rivers downstream<br />
<strong>of</strong> WWTPs (e.g. Burkhardt-Holm et al., 2005).<br />
It has also to be kept in mind that early life stages <strong>of</strong> salmonids are very sensitive to ammonia<br />
(e.g. U.S. Environmental Protection Agency, 2009). The measured values <strong>of</strong> 5 mg/L NH4-N (at<br />
9°C) in the test correspond to approximately 0.005 to 0.04 mg/L NH3-N for pH values between<br />
7.0 <strong>and</strong> 8.0 (Weil, 2010). In rainbow trout ammonia concentrations higher than 0.04 mg/L elicited<br />
histopathological effects after long term exposure <strong>of</strong> 5 years (Thurston et al., 1984) <strong>and</strong> the EC20<br />
for effects on growth <strong>of</strong> rainbow trout larvae <strong>and</strong> fish during a 90 day exposure was 7.72 mg/L<br />
NH3-N (Brinkman et al., 2009). Derived from all available toxicity data for aquatic freshwater<br />
organisms, the US EPA recommends a chronic quality criterion for ammonium in freshwater at<br />
pH 8 <strong>and</strong> 14°C <strong>of</strong> either 0.521 or 3.74 mg NH4-N/L, depending on whether freshwater mussels<br />
<strong>and</strong> early life stages <strong>of</strong> fish are present or absent respectively (U.S. Environmental Protection<br />
Agency, 2009). Overall, based on these data, it is unlikely that direct effects <strong>of</strong> periodically<br />
elevated ammonium concentrations on the survival <strong>and</strong> development <strong>of</strong> the fish are occurring.<br />
Swiss Centre for Applied Ecotoxicology, Eawag/EPFL · Überl<strong>and</strong>strasse 133 · CH-8600 Dübendorf<br />
www.oekotoxzentrum.ch<br />
22
4.3.4. Assessment <strong>of</strong> different filter types<br />
Based on the results obtained from bioassays, a final filtration step with biological/microbial<br />
activity after ozone treatment was recommended to prevent effects <strong>of</strong> reactive <strong>and</strong> possibly toxic<br />
by-products resulting from ozonation. At WWTP Vidy, two different filter types were assessed for<br />
this purpose: a carbon filter <strong>and</strong> a s<strong>and</strong> filter.<br />
Carbon filter (1 st <strong>and</strong> 2 nd MC)<br />
With the carbon filter, which has already been used in the WWTP for several years, increased<br />
toxicity was observed in most bioassays, in agreement with the results <strong>of</strong> the chemical analyses,<br />
which showed higher concentrations <strong>of</strong> micropollutants after passage through the filter. This was<br />
probably due to desorption <strong>of</strong> substances from this filter. Desorption results from both backwash<br />
with physico-chemically treated wastewater (not suited for micropollutant removal) <strong>and</strong> long-term<br />
operation <strong>of</strong> this filter. Therefore the continued use <strong>of</strong> this carbon filter after complementary<br />
treatment was not recommended.<br />
S<strong>and</strong> filter (3 rd <strong>and</strong> 4 th MC)<br />
After passage through the s<strong>and</strong> filter (mobile s<strong>and</strong> filter device for pilot studies) in the 3 rd MC, an<br />
increase in estrogenic <strong>and</strong> progesterone-like activity was detected. In the 4 th MC no increased<br />
effects could be observed in most in vitro bioassays, but a slightly increased toxicity was<br />
observed in some laboratory in vivo bioassays.<br />
In the 3 rd measurement campaign, a slight increase in concentrations <strong>of</strong> bisphenol A <strong>and</strong> estrone<br />
was detected by the chemical analysis, which might have been washed out from the plastics<br />
around the s<strong>and</strong> filter <strong>and</strong> may have played a role in the toxicity increase. In the 4 th measurement<br />
campaign no obvious reason for the slight toxicity increase in some laboratory in vivo bioassays<br />
was found by comparison with the results <strong>of</strong> the chemical analysis as well as with the physicochemical<br />
parameters measured. The toxicity increase might be related to differences in<br />
wastewater composition, which might not necessarily be due to micropollutants.<br />
Overall no evidence for a toxicity increase after s<strong>and</strong> filtration was observed.<br />
Swiss Centre for Applied Ecotoxicology, Eawag/EPFL · Überl<strong>and</strong>strasse 133 · CH-8600 Dübendorf<br />
www.oekotoxzentrum.ch<br />
23
4.4. Elimination efficiency <strong>of</strong> treatment steps<br />
The following figures (Figures 4 <strong>and</strong> 5) show the mean elimination efficiencies for the different<br />
treatment steps as well as the mean overall elimination efficiencies. Separate elimination<br />
efficiencies for the four measurement campaigns as well as a comparison <strong>of</strong> elimination<br />
efficiencies for the “old” biology <strong>and</strong> the moving bed biology can be found in the appendix (Figure<br />
11 - 18).<br />
Biological treatment, ozonation <strong>and</strong> s<strong>and</strong> filtration<br />
The mean elimination efficiencies for biological treatment, ozonation <strong>and</strong> s<strong>and</strong> filtration are<br />
displayed in Figure 4. Only the elimination efficiencies for the 2 nd to 4 th MCs are displayed, as in<br />
the 1 st MC another biological treatment was applied (see Figure 2, “old” biology, SB).<br />
Green algae: photosynthesis inhibition<br />
Green algae: grow th inhibition<br />
YES YES assay: estrogenic estrogenic effects effects<br />
ER CALUX: estrogenic effects<br />
AR CALUX: CALUX: <strong>and</strong>rogenic <strong>and</strong>rogenic effects<br />
GR GR CALUX: glucocorticoid glucocorticoid like like effects effects<br />
PR CALUX: CALUX: progesterone like like effects effects<br />
PPARg1 CALUX CALUX<br />
Green algae: photosynthesis inhibition<br />
Green algae: grow th inhibition<br />
YES assay: estrogenic effects<br />
ER CALUX: estrogenic effects<br />
AR CALUX: <strong>and</strong>rogenic effects<br />
GR CALUX: glucocorticoid like effects<br />
PR CALUX: progesterone like effects<br />
-385 ± 196 %<br />
-20% 0% 20% 40% 60% 80% 100%<br />
Elimination Biological Treatment<br />
PPARg1 CA LUX<br />
-20% 0% 20% 40% 60% 80% 100%<br />
Elimination<br />
Biological Treatment + Ozonation<br />
Swiss Centre for Applied Ecotoxicology, Eawag/EPFL · Überl<strong>and</strong>strasse 133 · CH-8600 Dübendorf<br />
www.oekotoxzentrum.ch<br />
X<br />
on<br />
on<br />
ts<br />
ts<br />
ts<br />
ts<br />
ts<br />
UX<br />
0% 20% 40% 60% 80% 100%<br />
Elimination Ozonation<br />
0% 20% 40% 60% 80% 100%<br />
Elimination Biological Treatment<br />
+ Ozonation + + S<strong>and</strong> filtration<br />
Figure 4: Mean elimination efficiency for specific effects measured in in vitro bioassays in the different<br />
treatment steps: biological treatment, ozonation, biological treatment + ozonation (mean ± SD <strong>of</strong> 2 nd to 4 th<br />
measurement campaign, 1 st MC excluded due to differences in biological treatment, see chapter 3.2) <strong>and</strong><br />
biological treatment plus ozonation followed by s<strong>and</strong> filtration (elimination efficiency <strong>of</strong> 4 th measurement<br />
campaign, only this MC used as here technical procedures were optimized).<br />
In the biological treatment, only 3 to 4 out <strong>of</strong> 8 specifically acting substance classes were<br />
eliminated by more than 80%. Herbicides, glucocorticoid <strong>and</strong> progesterone-like acting<br />
24
substances were not removed at all or only to a small extent. General toxic substances were<br />
eliminated by less than 80%.<br />
Ozonation additionally removed 14 to 87 % <strong>of</strong> the remaining specifically acting substances.<br />
Elimination efficiency <strong>of</strong> ozonation varied depending on the biological treatment, ozone<br />
concentration <strong>and</strong> substance classes.<br />
Biological treatment combined with ozonation removed 82 to 99 % (mean <strong>of</strong> 3 MCs) <strong>of</strong> most <strong>of</strong><br />
the specifically acting substances with exception <strong>of</strong> progesterone <strong>and</strong> glucocorticoid like acting<br />
substances. Removal <strong>of</strong> those substances was less efficient (59 ± 18 % <strong>and</strong> -24 ± 68 %<br />
respectively) with biological treatment <strong>and</strong> ozonation. For progesterone, a good degradation due<br />
to ozonation was shown in other studies (Barron et al., 2006; Labadie <strong>and</strong> Budzinski, 2005),<br />
however this was strongly dependent on the respective ozone concentrations (Barron et al.,<br />
2006). For glucocorticoid-like acting substances, no information regarding ozonation was<br />
available.<br />
For the 4 th MC the elimination efficiencies <strong>of</strong> the combination <strong>of</strong> biological treatment, ozonation<br />
<strong>and</strong> s<strong>and</strong> filtration was evaluated. The presentation <strong>of</strong> results including the s<strong>and</strong> filter is restricted<br />
to the 4 th MC as the technical procedures were optimized at this point.<br />
The overall elimination efficiencies for the 4 th measurement campaign ranged from 86 to 99 % for<br />
most specific effects. Elimination efficiency with the s<strong>and</strong> filter was slightly improved compared to<br />
the efficiency after ozonation. Only progesterone-like effects could not be reduced with the<br />
overall treatment, however as mentioned in chapter 4.3.1 the values were generally low, i.e. in<br />
the range <strong>of</strong> 0.11 to 2.6 ng/L.<br />
Swiss Centre for Applied Ecotoxicology, Eawag/EPFL · Überl<strong>and</strong>strasse 133 · CH-8600 Dübendorf<br />
www.oekotoxzentrum.ch<br />
25
Biological <strong>and</strong> powdered activated carbon –UF treatment<br />
Treatment <strong>of</strong> the wastewater with PAC-UF led to an additional 61 to 100 % elimination <strong>of</strong> the<br />
remaining specifically-acting substances when compared to the removal in the biological<br />
treatment (Figure 5).<br />
Green algae: photosynthesis inhibition<br />
Green Green algae: grow th inhibition<br />
YES YES assay: assay: estrogenic estrogenic effects effects<br />
ER ER CALUX: CALUX: estrogenic estrogenic effects effects<br />
AR AR CALUX: CALUX: <strong>and</strong>rogenic <strong>and</strong>rogenic effects<br />
GR GR CALUX: CALUX: glucocorticoid like effects<br />
PR PR CALUX: CALUX: progesterone progesterone like effects effects<br />
PPARg1 PPARg1 CALUX CALUX<br />
-385 ± 196 %<br />
-20% 0% 20% 40% 60% 80% 100%<br />
Elimination Biological Treatment<br />
Green algae: photosynthesis inhibition<br />
Green algae: grow th inhibition<br />
YES assay: estrogenic effects<br />
ER CALUX: estrogenic effects<br />
AR CALUX: <strong>and</strong>rogenic effects<br />
GR CALUX: glucocorticoid like effects<br />
PR CALUX: progesterone like effects<br />
PPARg1 CALUX<br />
0% 20% 40% 60% 80% 100%<br />
Elimination<br />
Biological + PAC-UF Treatment<br />
Swiss Centre for Applied Ecotoxicology, Eawag/EPFL · Überl<strong>and</strong>strasse 133 · CH-8600 Dübendorf<br />
www.oekotoxzentrum.ch<br />
n<br />
n<br />
s<br />
s<br />
s<br />
s<br />
s<br />
X<br />
0% 20% 40% 60% 80% 100%<br />
Elimination PAC-UF Treatment<br />
Figure 5: Mean elimination efficiency for specific effects measured in in vitro bioassays in the different<br />
treatment steps: biological, PAC-UF <strong>and</strong> biological + PAC-UF treatment (mean ± SD <strong>of</strong> 2 nd to 4 th measurement<br />
campaign).<br />
The combination <strong>of</strong> biological <strong>and</strong> PAC-UF treatments removed all <strong>of</strong> the specifically-acting<br />
substances to more than 80 % (elimination efficiencies ranged from 92 to 100 %).<br />
26
4.5. Comparison <strong>of</strong> bioassays with chemical measurements<br />
To compare the results <strong>of</strong> the chemical measurements with the bioassay results, the mean<br />
elimination efficiencies, calculated from the combined algae assay for all measured herbicides,<br />
were compared between the different sampling campaigns (Figure 6).<br />
A<br />
B<br />
Elimination Biology<br />
Elimination<br />
Ozonation<br />
Elimination PAC<br />
Total Elimination<br />
Biology, Ozonation<br />
+ SF<br />
Total Elimination<br />
Biology + PAC<br />
Elimination Biology<br />
Elimination Ozonation<br />
Elimination PAC<br />
Total Elimination<br />
Biology, Ozonation +<br />
SF<br />
Total Elimination<br />
Biology + PAC<br />
0% 20% 40% 60% 80% 100%<br />
Mean elimination efficiency<br />
-40% -20% 0% 20% 40% 60% 80% 100%<br />
Mean elimination efficieny<br />
Swiss Centre for Applied Ecotoxicology, Eawag/EPFL · Überl<strong>and</strong>strasse 133 · CH-8600 Dübendorf<br />
www.oekotoxzentrum.ch<br />
20.-27.07.09<br />
30.10.-05.11.09<br />
10.-17.03.10<br />
25.05.-02.06.10<br />
20.-27.07.09<br />
30.10.-05.11.09<br />
10.-17.03.10<br />
25.05.-02.06.10<br />
Figure 6: Mean elimination efficiencies in the different treatment steps for each <strong>of</strong> the four measurement<br />
campaigns for A: based on concentrations <strong>of</strong> herbicides from chemical analysis (mean ± SD <strong>of</strong> four 1-2<br />
day composite samples over 7 days) <strong>and</strong> B: based on diuron equivalent concentrations (DEQs) (μg/L) in<br />
the algae assay focusing on inhibition <strong>of</strong> photosynthesis (mean elimination efficiency from one composite<br />
sample over 7 days based on the mean TEQ value <strong>of</strong> three replicates in the experiment). In the 4 th<br />
measurement campaign (25.05.-02.06.10) the technical procedures were optimised.<br />
27
Compared with chemical analytics, results from the combined algae assay indicated higher<br />
elimination efficiency for herbicides acting as photosystem II inhibitors. This may be explained by<br />
the presence <strong>of</strong> additional herbicides with this mode <strong>of</strong> action, which were not included in the<br />
analytical measurements.<br />
4.6. Mutagenicity <strong>and</strong> genotoxicity<br />
No mutagenicity (Ames assay, strains TA98 <strong>and</strong> TA100) (Ames et al., 1975) (ISO 16240, 2005)<br />
<strong>and</strong> no genotoxicity (micronucleus assay, with <strong>and</strong> without S9 activation) (Reifferscheid et al.,<br />
2008) (ISO 21427-2, 2006) were detected. In the umuC assay (ISO 13829, 2000, with S9<br />
activation), genotoxic effects in the influent <strong>and</strong> after biological treatment have been detected<br />
only in highly enriched samples (EN ≥14.8 fold, LF ≥ 37 fold). In one MC slight genotoxic effects<br />
in PAC-UF (≥ 74 fold enrichment) were detected.<br />
Overall no change in genotoxicity <strong>and</strong> mutagenicity was measured following advanced<br />
treatments. This was observed in other studies as well for PAC treatment (e.g. Stalter et al.,<br />
2010a) <strong>and</strong> ozonation (e.g. Mišík et al., 2011; Petala et al., 2006; Reungoat et al., 2010;<br />
Takanashi et al., 2002). In selected studies genotoxic effects were detected after ozonation (e.g.<br />
Stalter et al., 2010a); however they were eliminated by subsequent s<strong>and</strong> filtration.<br />
We conclude that there is no evidence <strong>of</strong> higher toxicity due to the formation <strong>of</strong> stable ozonation<br />
by-products. It is, however, possible that the tests used were not sufficiently sensitive to these<br />
compounds. Because formation <strong>of</strong> reactive ozonation by-products cannot be excluded based on<br />
our results, the installation <strong>of</strong> a final filtration step with biological activity is recommended.<br />
4.7. Conclusions from the performance review<br />
A clear reduction <strong>of</strong> wastewater toxicity due to ozonation <strong>and</strong> powdered activated carbon<br />
treatment followed by ultrafiltration was demonstrated with most in vitro bioassays <strong>and</strong> with one<br />
in vivo bioassay (Fish Early Life Stage test with O. mykiss). The other applied bioassays showed<br />
either no toxicity or no change in toxicity in the course <strong>of</strong> wastewater treatment. The overall<br />
elimination efficiency for most <strong>of</strong> the assessed specific substance classes was more than 80%.<br />
However, there were differences in toxicity for different sampling time points, which presumably<br />
resulted from differences in wastewater composition. There was no evidence <strong>of</strong> increased<br />
toxicity due to a constant formation <strong>of</strong> ozonation by-products. Using in vivo bioassays performed<br />
in the lab, a slight toxicity <strong>of</strong> raw wastewater was detected. This was mostly eliminated after<br />
biological treatment. The toxicity <strong>of</strong> the wastewater observed in those in vivo assays was<br />
generally low.<br />
In general, the application <strong>of</strong> bioassays for a performance assessment <strong>of</strong> advanced wastewater<br />
treatment technologies proved to be relevant <strong>and</strong> useful, as shown in this pilot study as well as in<br />
the previous pilot study at the WWTP Wüeri in Regensdorf (Abegglen et al., 2009).<br />
However, it is important to note, that a single general bioassay for the overall assessment <strong>of</strong> the<br />
toxicity <strong>of</strong> a wastewater sample does not exist. No single bioassay covers the whole range <strong>of</strong><br />
different toxic effects in wastewater. Therefore, a set <strong>of</strong> bioassays has to be used to evaluate the<br />
performance <strong>of</strong> wastewater treatment plants.<br />
Swiss Centre for Applied Ecotoxicology, Eawag/EPFL · Überl<strong>and</strong>strasse 133 · CH-8600 Dübendorf<br />
www.oekotoxzentrum.ch<br />
28
To evaluate the efficiency <strong>of</strong> advanced treatment steps in reducing the biological effects <strong>of</strong><br />
micropollutants with specific modes <strong>of</strong> action, the use <strong>of</strong> in vitro bioassays with sample<br />
enrichment is highly promising. However, some <strong>of</strong> the available test protocols are not certified.<br />
Therefore it should be aimed for a st<strong>and</strong>ardization <strong>and</strong> certification <strong>of</strong> those tests. Additionally, a<br />
cost efficiency analysis should be performed.<br />
For an effect assessment for whole organisms, chronic in vivo bioassays are desirable. Here is a<br />
need for the development <strong>of</strong> tests especially with sensitive test organisms. For those assays the<br />
costs are <strong>of</strong>ten much higher than for small-scale / in vitro bioassays. Furthermore, the<br />
interpretation <strong>of</strong> observed effects in in vivo bioassays generally is more difficult, especially with<br />
regard to micropollutants. Regarding bioassays with vertebrates there is also a need to reduce<br />
the use <strong>of</strong> animals in experimentation.<br />
Overall the performance review with bioassays has shown that ozonation-SF <strong>and</strong> PAC-UF<br />
treatment are useful measures to reduce the effects <strong>of</strong> micropollutants in waterbodies. A broad<br />
range <strong>of</strong> micropollutants <strong>and</strong> their effects were eliminated by more than 80%, <strong>and</strong> there was no<br />
evidence for a toxicity increase due to a constant formation <strong>of</strong> stable toxic ozonation by-products.<br />
In vitro bioassays based on specific effects with sample enrichment were generally deemed<br />
more suitable for the performance assessment <strong>of</strong> advanced wastewater treatments than<br />
integrative in vivo bioassays without sample enrichment.<br />
Swiss Centre for Applied Ecotoxicology, Eawag/EPFL · Überl<strong>and</strong>strasse 133 · CH-8600 Dübendorf<br />
www.oekotoxzentrum.ch<br />
29
5. <strong>Evaluation</strong> <strong>of</strong> wastewater quality regarding micropollutants <strong>and</strong><br />
their effects<br />
In environmental risk assessment, risk quotients are used to evaluate whether measured<br />
concentrations <strong>of</strong> environmental chemicals pose a risk to the environment. Those quotients are<br />
calculated by dividing the MEC (measured environmental concentration) by the respective quality<br />
criterion (QC) (usually the annual average environmental quality st<strong>and</strong>ard, AA-EQS or the MAC-<br />
EQS), which takes into account ecotoxicological effect data for the respective substance (see<br />
below).<br />
MEC<br />
Risk quotient (RQ) � � ?<br />
QC<br />
1 intolerable risk<br />
A risk quotient lower than 1 indicates a tolerable risk, whereas a risk quotient higher than 1<br />
indicates an intolerable risk. The Annual Average-EQS (AA-EQS) is derived as a protection<br />
against the effects <strong>of</strong> long-term exposure, <strong>and</strong> the Maximum Acceptable Concentration EQS<br />
(MAC-EQS) against the effects <strong>of</strong> short-term exposure.<br />
For an assessment <strong>of</strong> the wastewater quality, risk quotients were calculated for the three priority<br />
substances dicl<strong>of</strong>enac, carbamazepin <strong>and</strong> clarithromycin using the MECs (usually the 90 th<br />
percentile) <strong>and</strong> the derived EQS (Götz et al., 2010). More detailed information on the derivation<br />
<strong>of</strong> water quality criteria as well as on the classification <strong>of</strong> risk quotients for this purpose according<br />
to Götz et al. (2010) can be found in the appendix.<br />
Swiss Centre for Applied Ecotoxicology, Eawag/EPFL · Überl<strong>and</strong>strasse 133 · CH-8600 Dübendorf<br />
www.oekotoxzentrum.ch<br />
30
5.1. Risk quotients <strong>of</strong> three relevant micropollutants during wastewater<br />
treatment<br />
Figure 7 shows results <strong>of</strong> the pilot study at the WWTP Vidy Lausanne for the three priority<br />
substances. The change <strong>of</strong> the risk quotients <strong>and</strong> quality classes during wastewater treatment for<br />
the 3 rd MC is shown. The respective quality criterion (AA-EQS) for the pain killer dicl<strong>of</strong>enac is<br />
50 ng/L, for the anticonvulsant carbamazepin 500 ng/L <strong>and</strong> for the antibiotic clarithromycin<br />
60 ng/L (Götz et al., 2010).<br />
Figure 7: Evolution <strong>of</strong> risk quotients during wastewater treatment: measured environmental<br />
concentrations (MECs) from the screening <strong>of</strong> 120 substances at the Eawag <strong>and</strong> risk quotients (RQs) <strong>of</strong><br />
three selected micropollutants during wastewater treatment in the 3 rd measurement campaign (MC).<br />
During wastewater treatment, the water quality regarding the three substances increased<br />
significantly, from poor water quality up to good quality for dicl<strong>of</strong>enac; from good to very good<br />
water quality for carbamazepin; <strong>and</strong> from insufficient to good water quality for clarithromycin in<br />
undiluted wastewater. During biological treatment the respective substance concentrations<br />
decreased between 0.9 <strong>and</strong> 1.2 fold compared to the influent, <strong>and</strong> during PAC-UF or ozonation-<br />
SF treatment the concentrations decreased additionally 7 to 46 fold compared to the biological<br />
treatment. At the Regensdorf pilot study a similar improvement <strong>of</strong> water quality was observed.<br />
In the adjacent watercourses, those values will be even lower due to the additional dilution. For<br />
rivers usually a dilution factor <strong>of</strong> 10 is assumed, <strong>and</strong> for lake Geneva an estimated 50 fold<br />
dilution showed the best correlation with the actually measured concentrations (Morasch et al.,<br />
2010).<br />
Swiss Centre for Applied Ecotoxicology, Eawag/EPFL · Überl<strong>and</strong>strasse 133 · CH-8600 Dübendorf<br />
www.oekotoxzentrum.ch<br />
31
5.2. Estrogenicity during wastewater treatment<br />
When looking at the improvement <strong>of</strong> wastewater quality regarding estrogenic substances (Figure<br />
8), a strong decrease in estrogenicity could be detected with the Yeast Estrogen Screen (YES)<br />
<strong>and</strong> the ER-CALUX assay at the Lausanne pilot study based on 17β-estradiol-equivalents<br />
(EEQ).<br />
Figure 8: Evolution <strong>of</strong> estrogenicity during wastewater treatment steps: Estradiol equivalent<br />
concentrations [ng/L] <strong>and</strong> change indices (CITEQ) from the YES <strong>and</strong> the ER-CALUX assay for the 4 th MC.<br />
CILF/EN Effect biological treatment, CIPAC/EN Overall effect biological treatment <strong>and</strong> PAC-UF treatment,<br />
CIOZ/EN Overall effect biological treatment <strong>and</strong> ozonation, CIOZ+SF/EN Overall effect biological treatment <strong>and</strong><br />
ozonation+ s<strong>and</strong> filtration.<br />
During biological treatment, estrogenicity decreased between 11 <strong>and</strong> 12 fold compared to the<br />
influent, <strong>and</strong> during PAC-UF treatment or ozonation the concentrations decreased additionally<br />
6 to 13 fold compared to the biological treatment.<br />
5.3. Conclusions for the evaluation <strong>of</strong> wastewater quality regarding<br />
micropollutants <strong>and</strong> their effects<br />
The advanced treatment steps PAC-UF <strong>and</strong> ozonation led to a substantially lowered risk<br />
potential for dicl<strong>of</strong>enac, carbamazepin <strong>and</strong> clarithromycin. Additionally both treatments lowered<br />
the estrogenicity between two or three orders <strong>of</strong> magnitude in comparison to the influent. PAC-<br />
UF treatment <strong>and</strong> ozonation led to a 6 to 13 times lower estrogenicity compared to the biological<br />
treatment.<br />
In combination with the results <strong>of</strong> the performance analysis (chapter 4), for micropollutants <strong>and</strong><br />
estrogenic substances a significant reduction <strong>of</strong> risks can be expected with advanced<br />
wastewater treatment.<br />
Swiss Centre for Applied Ecotoxicology, Eawag/EPFL · Überl<strong>and</strong>strasse 133 · CH-8600 Dübendorf<br />
www.oekotoxzentrum.ch<br />
32
6. Main conclusions<br />
From the results <strong>of</strong> the performance review (chapter 4) <strong>and</strong> the investigation <strong>of</strong> wastewater<br />
quality (chapter 5) several main conclusions were drawn <strong>and</strong> approved by the international<br />
expert group on ecotoxicology accompanying the pilot studies.<br />
Main conclusions from the pilot studies in the project “Strategy Micropoll” are:<br />
� Due to the advanced treatments in the pilot studies a broad range <strong>of</strong> micropollutants <strong>and</strong><br />
their effects were eliminated by more than 80%, as detectable in most in vitro bioassays <strong>and</strong><br />
with chemical analytics.<br />
� There was no evidence for a toxicity increase due to a constant formation <strong>of</strong> stable toxic<br />
ozonation by-products (i.e. by-products still present after s<strong>and</strong> filtration) in any test.<br />
� Ozonation should be followed by a final filtration step with biological activity in order to<br />
reduce the risk <strong>of</strong> potentially toxic, reactive transformation products being released in<br />
waterbodies. The occurrence <strong>of</strong> such products <strong>and</strong> their potential to elicit effects was shown<br />
in both pilot studies in selected in vivo bioassays (Lumbriculus reproduction assay in both<br />
pilot studies, Fish Early Life Stage assay in Regensdorf).<br />
� Overall, the quality <strong>of</strong> treated effluent was significantly improved, leading to improved<br />
surface water quality.<br />
Swiss Centre for Applied Ecotoxicology, Eawag/EPFL · Überl<strong>and</strong>strasse 133 · CH-8600 Dübendorf<br />
www.oekotoxzentrum.ch<br />
33
7. References<br />
Abegglen C, Escher B, Hollender J, Koepke S, Ort C, Peter A, Siegrist H, von Gunten U,<br />
Zimmermann S, Koch M, Niederhauser P, Schärer M, Braun C, Gälli R, Junghans M,<br />
Brocker S, Moser R, Rensch D, 2009. Ozonung von gereinigtem Abwasser<br />
Schlussbericht Pilotversuch Regensdorf. Eawag, Dübendorf. p. 80.<br />
Ames BN, McCann J, Yamasaki E, 1975. Methods for detecting carcinogens <strong>and</strong> mutagens with<br />
the Salmonella/mammalian microsome mutagenicity test. Mutation Research 31:347-<br />
364.<br />
Ashauer, in preparation. Post-ozonation in a municipal wastewater treatment plant improves<br />
water quality in receiving stream as indicated by the abundance <strong>of</strong> species at risk.<br />
Barron E, Deborde M, Rabouan S, Mazellier P, Legube B, 2006. Kinetic <strong>and</strong> mechanistic<br />
investigations <strong>of</strong> progesterone reaction with ozone. Water Research 40:2181-2189.<br />
Billard R, Breton B, Richard M, 1981. On the Inhibitory Effect <strong>of</strong> Some Steroids on<br />
Spermatogenesis in Adult Rainbow Trout (Salmo gairdneri). Canadian Journal <strong>of</strong> Zoology<br />
59:1479-1487.<br />
Brinkman SF, Woodling JD, Vajda AM, Norris DO, 2009. Chronic toxicity <strong>of</strong> ammonia to early life<br />
stage rainbow trout. Transactions <strong>of</strong> the American Fisheries Society 138:433-440.<br />
Bundschuh M, Pierstorf R, Schreiber WH, Schulz R, 2011a. Positive effects <strong>of</strong> wastewater<br />
ozonation displayed by in situ bioassays in the receiving stream. Environmental Science<br />
<strong>and</strong> Technology 45:3774-3780.<br />
Bundschuh M, Schulz R, 2011. Population response to ozone application in wastewater: an onsite<br />
microcosm study with Gammarus fossarum (Crustacea: Amphipoda). Ecotoxicology<br />
20:466-473.<br />
Bundschuh M, Zubrod JP, Schulz R, 2011b. The functional <strong>and</strong> physiological status <strong>of</strong><br />
Gammarus fossarum (Crustacea; Amphipoda) exposed to secondary treated<br />
wastewater. Environmental Pollution 159:244-249.<br />
Burkhardt-Holm P, Giger W, Guttinger H, Ochsenbein U, Peter A, Scheurer K, Segner H, Staub<br />
E, Suter MJF, 2005. Where have all the fish gone? Environmental Science & Technology<br />
39:441A-447A.<br />
Cordova Rosa EV, Simionatto EL, Sierra MMDS, Bertoli SL, Radetski CM, 2001. Toxicity-based<br />
criteria for the evaluation <strong>of</strong> textile wastewater treatment efficiency. Environmental<br />
Toxicology <strong>and</strong> Chemistry 20:839-845.<br />
Swiss Centre for Applied Ecotoxicology, Eawag/EPFL · Überl<strong>and</strong>strasse 133 · CH-8600 Dübendorf<br />
www.oekotoxzentrum.ch<br />
34
Deutsches Institut für Normung, 2003. Deutsche Einheitsverfahren zur Wasser-, Abwasser- und<br />
Schlammuntersuchung - Suborganismische Testverfahren (Gruppe T) - Teil 6:<br />
(Fischeitest). DIN 38415-6.<br />
Duft M, Tillmann M, Schulte-Oehlmann U, Markert B, Oehlmann J, 2002. Entwicklung eines<br />
Sedimentbiotests mit der Zwergdeckelschnecke Potamopyrgus antipodarum<br />
(Gastropoda: Prosobranchia). Umweltwissenschaften und Schadst<strong>of</strong>f-Forschung 14:12-<br />
17.<br />
Eawag, 2007. Festphasenextraktion mit C18/EN von Supelco.<br />
Escher BI, Bramaz N, Maurer M, Richter M, Sutter D, Von Känel C, Zschokke M, 2005.<br />
Screening test battery for pharmaceuticals in urine <strong>and</strong> wastewater. Environmental<br />
Toxicology <strong>and</strong> Chemistry 24:750-758.<br />
Escher BI, Bramaz N, Mueller JF, Quayle P, Rutishauser S, Vermeirssen ELM, 2008a. Toxic<br />
equivalent concentrations (TEQs) for baseline toxicity <strong>and</strong> specific modes <strong>of</strong> action as a<br />
tool to improve interpretation <strong>of</strong> ecotoxicity testing <strong>of</strong> environmental samples. Journal <strong>of</strong><br />
Environmental Monitoring 10:612-621.<br />
Escher BI, Bramaz N, Quayle P, Rutishauser S, Vermeirssen ELM, 2008b. Monitoring <strong>of</strong> the<br />
ecotoxicological hazard potential by polar organic micropollutants in sewage treatment<br />
plants <strong>and</strong> surface waters using a mode-<strong>of</strong>-action based test battery. Journal <strong>of</strong><br />
Environmental Monitoring 10:622-631.<br />
EU, 2010. Chemicals <strong>and</strong> the Water Framework Directive: Technical Guidance for Deriving<br />
Environmental <strong>Quality</strong> St<strong>and</strong>ards. Draft 2010. Draft version 6.0, 23 February 2010.<br />
Filby AL, Shears JA, Drage BE, Churchley JH, Tyler CR, 2010. Effects <strong>of</strong> advanced treatments<br />
<strong>of</strong> wastewater effluents on estrogenic <strong>and</strong> reproductive health impacts in fish.<br />
Environmental Science <strong>and</strong> Technology 44:4348-4354.<br />
Gälli R, Ort C, Schärer M, 2009. Mikroverunreinigungen in den Gewässern. Bewertung und<br />
Reduktion der Schadst<strong>of</strong>fbelastung aus der Siedlungsentwässerung. Umwelt-Wissen.<br />
Bundesamt für Umwelt, Bern. p. 103.<br />
Götz CW, Kase R, Hollender J, 2011. Mikroverunreinigungen - Beurteilungskonzept für<br />
organische Spurenst<strong>of</strong>fe aus kommunalem Abwasser. Studie im Auftrag des BAFU.<br />
Eawag, Dübendorf. p. 108.<br />
Götz CW, Kase R, Kienle C, Hollender J, 2010. Mikroverunreinigungen aus kommunalem<br />
Abwasser - Kombination von Expositions- und ökotoxikologischen Effektdaten. Gas,<br />
Wasser, Abwasser 7:575-585.<br />
Swiss Centre for Applied Ecotoxicology, Eawag/EPFL · Überl<strong>and</strong>strasse 133 · CH-8600 Dübendorf<br />
www.oekotoxzentrum.ch<br />
35
Gracia T, Hilscherova K, Jones PD, Newsted JL, Zhang X, Hecker M, Higley EB, S<strong>and</strong>erson JT,<br />
Yu RMK, Wu RSS, Giesy JP, 2006. The H295R system for evaluation <strong>of</strong> endocrinedisrupting<br />
effects. Ecotoxicology <strong>and</strong> Environmental Safety 65:293-305.<br />
Holm S, 1979. A simple sequentially rejective multiple test procedure. Sc<strong>and</strong>inavian Journal <strong>of</strong><br />
Statistics 6:65-75.<br />
International Organization for St<strong>and</strong>ardization, 2000. Water quality -- Determination <strong>of</strong> the<br />
genotoxicity <strong>of</strong> water <strong>and</strong> waste water using the umu-test. EN ISO 13829 (2000) <strong>and</strong><br />
38415-3 (1996).<br />
International Organization for St<strong>and</strong>ardization, 2004. Water quality -- Freshwater algal growth<br />
inhibition test with unicellular green algae. ISO 8692:2004.<br />
International Organization for St<strong>and</strong>ardization, 2005a. Water quality -- Determination <strong>of</strong> chronic<br />
toxicity to Ceriodaphnia dubia. ISO 20665:2008.<br />
International Organization for St<strong>and</strong>ardization, 2005b. Water quality -- Determination <strong>of</strong> the<br />
genotoxicity <strong>of</strong> water <strong>and</strong> waste water -- Salmonella/microsome test (Ames test). ISO<br />
16240:2005.<br />
International Organization for St<strong>and</strong>ardization, 2005c. Water quality -- Determination <strong>of</strong> the toxic<br />
effect <strong>of</strong> water constituents <strong>and</strong> waste water on duckweed (Lemna minor) -- Duckweed<br />
growth inhibition test. ISO 20079:2005.<br />
International Organization for St<strong>and</strong>ardization, 2006. Water quality -- <strong>Evaluation</strong> <strong>of</strong> genotoxicity<br />
by measurement <strong>of</strong> the induction <strong>of</strong> micronuclei -- Part 2: Mixed population method using<br />
the cell line V79. ISO 21427-2:2006.<br />
International Organization for St<strong>and</strong>ardization, 2007a. Water quality -- Determination <strong>of</strong> the acute<br />
toxicity <strong>of</strong> waste water to zebrafish eggs (Danio rerio). ISO 15088:2007.<br />
International Organization for St<strong>and</strong>ardization, 2007b. Water quality -- Determination <strong>of</strong> the<br />
inhibitory effect <strong>of</strong> water samples on the light emission <strong>of</strong> Vibrio fischeri (Luminescent<br />
bacteria test) -- Part 3: Method using freeze-dried bacteria. ISO 11348-3.<br />
Jobling S, Williams R, Johnson A, Taylor A, Gross-Sorokin M, Nolan M, Tyler CR, van Aerle R,<br />
Santos E, Brighty G, 2006. Predicted exposures to steroid estrogens in U.K. rivers<br />
correlate with widespread sexual disruption in wild fish populations. Environmental health<br />
perspectives 114 Suppl 1:32-39.<br />
Karaman G, Pinkster S, 1977. Freshwater Gammarus species from Europe, North Africa <strong>and</strong><br />
adjacent regions <strong>of</strong> Asia (Crustacea, Amphipoda). I. Gammarus pulex group <strong>and</strong> related<br />
species. Bijdragen tot de Dierkunde 47:1-97.<br />
Kase R, Eggen RIL, Junghans M, Götz C, Hollender J, 2011. Assessment <strong>of</strong> micropollutants<br />
from municipal wastewater - Combination <strong>of</strong> exposure <strong>and</strong> ecotoxicological effect data for<br />
Swiss Centre for Applied Ecotoxicology, Eawag/EPFL · Überl<strong>and</strong>strasse 133 · CH-8600 Dübendorf<br />
www.oekotoxzentrum.ch<br />
36
Switzerl<strong>and</strong>. In: Einschlag FSG, editor. Waste Water - <strong>Evaluation</strong> <strong>and</strong> Management:<br />
InTech - Open Access Publisher.<br />
Kidd KA, Blanchfield PJ, Mills KH, Palace VP, Evans RE, Lazorchak JM, Flick RW, 2007.<br />
Collapse <strong>of</strong> a fish population after exposure to a synthetic estrogen. Proceedings <strong>of</strong> the<br />
National Academy <strong>of</strong> Sciences <strong>of</strong> the United States <strong>of</strong> America 104:8897-8901.<br />
Klimisch HJ, Andreae M, Tillmann U, 1997. A systematic approach for evaluating the quality <strong>of</strong><br />
experimental toxicological <strong>and</strong> ecotoxicological data. Regulatory Toxicology <strong>and</strong><br />
Pharmacology 25:1-5.<br />
Knacker T, Boettcher M, Frische T, Rufli H, Stolzenberg HC, Teigeler M, Zok S, Braunbeck T,<br />
Schäfers C, 2010. Environmental effect assessment for sexual endocrine-disrupting<br />
chemicals: Fish testing strategy. Integrated Environmental Assessment <strong>and</strong><br />
Management 6:653-662.<br />
Kolodziej EP, Sedlak DL, 2007. Rangel<strong>and</strong> grazing as a source <strong>of</strong> steroid hormones to surface<br />
waters. Environmental Science <strong>and</strong> Technology 41:3514-3520.<br />
Kunz PY, Kienle C, Gerhardt A, 2010. Gammarus spp. in Aquatic Ecotoxicology <strong>and</strong> Water<br />
<strong>Quality</strong> Assessment: Toward Integrated Multilevel Tests. In: Albert LA, Gerba CP, Giesy<br />
J, Hutzinger O, Knaak JB, Stevens JT, Tjeerdema RS, Voogt P, Ware GW, editors.<br />
Reviews <strong>of</strong> Environmental Contamination <strong>and</strong> Toxicology: Springer New York. p. 1-76.<br />
Kvarnryd M, Grabic R, Br<strong>and</strong>t I, Berg C, 2011. Early life progestin exposure causes arrested<br />
oocyte development, oviductal agenesis <strong>and</strong> sterility in adult Xenopus tropicalis frogs.<br />
Aquatic Toxicology 103:18-24.<br />
Labadie P, Budzinski H, 2005. Determination <strong>of</strong> steroidal hormone pr<strong>of</strong>iles along the Jalle<br />
d'Eysines River (near Bordeaux, France). Environmental Science <strong>and</strong> Technology<br />
39:5113-5120.<br />
Liechti P, 2010. Methoden zur Untersuchung und Beurteilung der Fliessgewässer. Chemisch-<br />
Physikalische Erhebungen, Nährst<strong>of</strong>fe. Umwelt-Vollzug. Bundesamt für Umwelt (BAFU),<br />
Bern. p. 44.<br />
Lorenz C, Opitz R, Lutz I, Kloas W, 2009. Corticosteroids disrupt amphibian metamorphosis by<br />
complex modes <strong>of</strong> action including increased prolactin expression. Comparative<br />
Biochemistry <strong>and</strong> Physiology - C Toxicology <strong>and</strong> Pharmacology 150:314-321.<br />
Macova M, Escher BI, Reungoat J, Carswell S, Chue KL, Keller J, Mueller JF, 2010. Monitoring<br />
the biological activity <strong>of</strong> micropollutants during advanced wastewater treatment with<br />
ozonation <strong>and</strong> activated carbon filtration. Water Research 44:477-492.<br />
Swiss Centre for Applied Ecotoxicology, Eawag/EPFL · Überl<strong>and</strong>strasse 133 · CH-8600 Dübendorf<br />
www.oekotoxzentrum.ch<br />
37
Maletz S, Hollert H, 2010. Untersuchung nativer Abwasserproben aus dem MicroPoll-Projekt im<br />
Reproduktionstest mit Potamopyrgus antipodarum. Abschlussbericht. Institut für<br />
Umweltforschung, RWTH Aachen.<br />
Margot J, Magnet A, Thonney D, Chèvre N, De Alencastro LF, Rossi L, 2011. Traitement des<br />
micropolluants dans les eaux usées - Rapport final sur les essais pilotes à la STEP de<br />
Vidy (Lausanne). Ville de Lausanne.<br />
Matthiessen P, Babut M, Batley G, Douglas M, Fawell J, Hommen U, Hutchinson TH, Janssen<br />
M, Maycock D, Reiley M, Schneider U, Weltje L, 2009. Water <strong>and</strong> Sediment EQS<br />
Derivation <strong>and</strong> Application. In: Crane M, Matthiessen P, Maycock DS, Merrington G,<br />
Whitehouse P, editors. Derivation <strong>and</strong> Use <strong>of</strong> Environmental <strong>Quality</strong> <strong>and</strong> Human Health<br />
St<strong>and</strong>ards for Chemical Substances in Water <strong>and</strong> Soil: CRC Press, Boca Raton. FL.,<br />
USA. p. 47-103.<br />
Mišík M, Knasmueller S, Ferk F, Cichna-Markl M, Grummt T, Schaar H, Kreuzinger N, 2011.<br />
Impact <strong>of</strong> ozonation on the genotoxic activity <strong>of</strong> tertiary treated municipal wastewater.<br />
Water Research 45:3681-3691.<br />
Morasch B, Bonvin F, Reiser H, Gr<strong>and</strong>jean D, De Alencastro LF, Perazzolo C, Chèvre N, Kohn<br />
T, 2010. Occurrence <strong>and</strong> fate <strong>of</strong> micropollutants in the Vidy Bay <strong>of</strong> Lake Geneva,<br />
Switzerl<strong>and</strong>. Part II: Micropollutant removal between wastewater <strong>and</strong> raw drinking water.<br />
Environmental Toxicology <strong>and</strong> Chemistry 29:1658-1668.<br />
Nagel R, 2002. DarT: The Embryo Test with the Zebrafish Danio rerio - a General Model in<br />
Ecotoxicology <strong>and</strong> Toxicology. Alternatives to Animal Experimentation - ALTEX 19:38-48.<br />
NFP 50, 2008. Nationales Forschungsprogramm 50 - „Hormonaktive St<strong>of</strong>fe“. Konsensplattform<br />
„Hormonaktive St<strong>of</strong>fe in Abwasser und Gewässern“ - Schlussdokument.<br />
OECD, 1992. OECD Guideline for testing <strong>of</strong> chemicals 210: Fish, Early-life Stage Toxicity Test.<br />
OECD, 2007. OECD Guidelines for the testing <strong>of</strong> chemicals 225: Sediment-Water Lumbriculus<br />
Toxicity Test Using Spiked Sediment.<br />
Ort C, Siegrist H, Hosbach H, Studer C, Morf L, Scheringer M, 2007. Mikroverunreinigungen.<br />
Nationales St<strong>of</strong>fflussmodell. Gas, Wasser, Abwasser 87:853-859.<br />
Pascoe D, Shazili NAM, 1986. Episodic pollution - A comparison <strong>of</strong> brief <strong>and</strong> continuous<br />
exposure <strong>of</strong> rainbow trout to cadmium. Ecotoxicology <strong>and</strong> Environmental Safety 12:189-<br />
198.<br />
Pawlowski S, Ternes T, Bonerz M, Kluczka T, van der Burg B, Nau H, Erdinger L, Braunbeck T,<br />
2003. Combined in Situ <strong>and</strong> in Vitro Assessment <strong>of</strong> the Estrogenic Activity <strong>of</strong> Sewage<br />
<strong>and</strong> Surface Water Samples. Toxicological Sciences 75:57-65.<br />
Swiss Centre for Applied Ecotoxicology, Eawag/EPFL · Überl<strong>and</strong>strasse 133 · CH-8600 Dübendorf<br />
www.oekotoxzentrum.ch<br />
38
Petala M, Samaras P, Zouboulis A, Kungolos A, Sakellaropoulos G, 2006. Ecotoxicological<br />
properties <strong>of</strong> wastewater treated using tertiary methods. Environmental Toxicology<br />
21:417-424.<br />
Phipps GL, Ankley GT, Benoit DA, Mattson VR, 1993. Use <strong>of</strong> the aquatic oligochaete<br />
Lumbriculus variegatus for assessing the toxicity <strong>and</strong> bioaccumulation <strong>of</strong> sedimentassociated<br />
contaminants. Environmental Toxicology <strong>and</strong> Chemistry 12:269-279.<br />
Quayle P, Rutishauser S, Escher B, 2008. St<strong>and</strong>ard Operation Procedure (SOP): Combined<br />
Algae Test, Determination <strong>of</strong> photosynthesis inhibition by means <strong>of</strong> algae chlorophyll<br />
fluorescence with the Maxi-Imaging-PAM <strong>and</strong> growth inhibition by means <strong>of</strong> OD<br />
measurement in a microtiter plate. Eawag, Dübendorf.<br />
Ratte M, Ratte HT, 2009. Beurteilung des Effektes von Abwasserbeh<strong>and</strong>lung mittels Ozonung<br />
anh<strong>and</strong> von Toxizitätsparametern aus in vitro- und in vivo-Biotests. Daten aus Projekt<br />
„MicroPoll“ (Ozonung von gereinigtem Abwasser), Pilotversuch Regensdorf, Teil:<br />
„Effektbasierte Testsysteme mit Aufkonzentrierung“ und „St<strong>and</strong>ardisierte Testverfahren“.<br />
Reifferscheid G, Ziemann C, Fieblinger D, Dill F, Gminski R, Grummt H-J, Hafner C, Hollert H,<br />
Kunz S, Rodrigo G, Stopper H, Selke D, 2008. Measurement <strong>of</strong> genotoxicity in<br />
wastewater samples with the in vitro micronucleus test--Results <strong>of</strong> a round-robin study in<br />
the context <strong>of</strong> st<strong>and</strong>ardisation according to ISO. Mutation Research/Genetic Toxicology<br />
<strong>and</strong> Environmental Mutagenesis 649:15-27.<br />
Reungoat J, Macova M, Escher BI, Carswell S, Mueller JF, Keller J, 2010. Removal <strong>of</strong><br />
micropollutants <strong>and</strong> reduction <strong>of</strong> biological activity in a full scale reclamation plant using<br />
ozonation <strong>and</strong> activated carbon filtration. Water Research 44:625-637.<br />
Routledge EJ, Sumpter JP, 1996. Estrogenic activity <strong>of</strong> surfactants <strong>and</strong> some <strong>of</strong> their<br />
degradation products assessed using a recombinant yeast screen. Environmental<br />
Toxicology <strong>and</strong> Chemistry 15:241-248.<br />
Schärer M, Sieber U, Müller S, 2010. Weitere Massnahmen gegen Mikroverunreinigungen -<br />
Situation in der Schweiz. Gas, Wasser, Abwasser 7:563-568.<br />
Schreiber U, Müller J, Haugg A, Gademann R, 2002. New type <strong>of</strong> dual-channel PAM chlorophyll<br />
fluorometer for highly sensitive water toxicity biotests. Photosynthesis Research 74:317-<br />
330.<br />
Schulz R, Bundschuh M, 2010. Pilot experiments STEP Vidy – investigations using amphipods.<br />
Final report, to the attention <strong>of</strong> FOEN, Strategy MicroPoll. Institute for Environmental<br />
Sciences, L<strong>and</strong>au, Germany.<br />
Swiss Centre for Applied Ecotoxicology, Eawag/EPFL · Überl<strong>and</strong>strasse 133 · CH-8600 Dübendorf<br />
www.oekotoxzentrum.ch<br />
39
Stalter D, Magdeburg A, Oehlmann J, 2010a. Comparative toxicity assessment <strong>of</strong> ozone <strong>and</strong><br />
activated carbon treated sewage effluents using an in vivo test battery. Water Research<br />
44:2610-2620.<br />
Stalter D, Magdeburg A, Weil M, Knacker T, Oehlmann J, 2010b. Toxication or detoxication? In<br />
vivo toxicity assessment <strong>of</strong> ozonation as advanced wastewater treatment with the<br />
rainbow trout. Water Research 44:439-448.<br />
Sumpter JP, 1998. Xenoendocrine disrupters - Environmental impacts. Toxicology Letters 102-<br />
103:337-342.<br />
Takanashi H, Mayumi M, Kato M, Hirata M, Hano T, 2002. Removal <strong>of</strong> mutagen precursor from<br />
wastewater by activated sludge <strong>and</strong> oxidation treatment. p. 389-394.<br />
Tchounwou PB, Wilson BA, Ishaque AB, Schneider J, 2001. Toxicity tests to assess pollutants<br />
removal during wastewater treatment <strong>and</strong> the quality <strong>of</strong> receiving waters in Argentina.<br />
Environmental Toxicology 16:217-224.<br />
Thurston RV, Russo RC, Luedtke RJ, 1984. Chronic toxicity <strong>of</strong> ammonia to rainbow trout.<br />
Transactions <strong>of</strong> the American Fisheries Society 113:56-73.<br />
U.S. Environmental Protection Agency, 2002. Short-term Methods for Estimating the Chronic<br />
Toxicity <strong>of</strong> Effluents <strong>and</strong> Receiving Waters to Freshwater Organisms, Fourth Edition ed.<br />
Washington, DC.<br />
U.S. Environmental Protection Agency, 2009. Draft 2009 Update Aquatic Life Ambient Water<br />
<strong>Quality</strong> Criteria for Ammonia - Freshwater. Washington, DC.<br />
Van der Linden SC, Heringa MB, Man HY, Sonneveld E, Puijker LM, Brouwer A, Van der Burg<br />
B, 2008. Detection <strong>of</strong> multiple hormonal activities in wastewater effluents <strong>and</strong> surface<br />
water, using a panel <strong>of</strong> steroid receptor CALUX bioassays. Environmental Science <strong>and</strong><br />
Technology 42:5814-5820.<br />
Victorin K, 1992. Review <strong>of</strong> the genotoxicity <strong>of</strong> ozone. Mutation Research - Reviews in Genetic<br />
Toxicology 277:221-238.<br />
Victorin K, 1996. Genotoxicity <strong>and</strong> carcinogenicity <strong>of</strong> ozone. Sc<strong>and</strong>inavian Journal <strong>of</strong> Work,<br />
Environment <strong>and</strong> Health 22:42-51.<br />
Weil M, 2010. Final report - Ecotoxicological evaluation <strong>of</strong> waste waters from different treatments<br />
with two chronic test systems. Floersheim/Main: ECT Oekotoxikologie GmbH.<br />
Williams GM, 1989. Methods for evaluating chemical genotoxicity. Annual Review <strong>of</strong><br />
Pharmacology <strong>and</strong> Toxicology 29:189-211.<br />
Swiss Centre for Applied Ecotoxicology, Eawag/EPFL · Überl<strong>and</strong>strasse 133 · CH-8600 Dübendorf<br />
www.oekotoxzentrum.ch<br />
40
8. Figures<br />
Figure 1: Overview <strong>of</strong> test organisms <strong>and</strong> test systems used in the two pilot studies Regensdorf<br />
<strong>and</strong> Lausanne................................................................................................................................... 7<br />
Figure 2: Overview <strong>of</strong> the sewage treatment plant Lausanne <strong>and</strong> the different sampling points.<br />
........................................................................................................................................................ 13<br />
Figure 3: Example for a dose response curve with the toxicity parameters NOEC, LOEC <strong>and</strong><br />
EC50. ............................................................................................................................................... 15<br />
Figure 4: Mean elimination efficiency for specific effects measured in in vitro bioassays in the<br />
different treatment steps: biological treatment, ozonation, biological treatment + ozonation (mean<br />
± SD <strong>of</strong> 2 nd to 4 th measurement campaign, 1 st MC excluded due to differences in biological<br />
treatment, see chapter 3.2) <strong>and</strong> biological treatment plus ozonation followed by s<strong>and</strong> filtration<br />
(elimination efficiency <strong>of</strong> 4 th measurement campaign, only this MC used as here technical<br />
procedures were optimized). .......................................................................................................... 24<br />
Figure 5: Mean elimination efficiency for specific effects measured in in vitro bioassays in the<br />
different treatment steps: biological, PAC-UF <strong>and</strong> biological + PAC-UF treatment (mean ± SD <strong>of</strong><br />
2 nd to 4 th measurement campaign). ................................................................................................ 26<br />
Figure 6: Mean elimination efficiencies in the different treatment steps for each <strong>of</strong> the four<br />
measurement campaigns for A: based on concentrations <strong>of</strong> herbicides from chemical analysis<br />
(mean ± SD <strong>of</strong> four 1-2 day composite samples over 7 days) <strong>and</strong> B: based on diuron equivalent<br />
concentrations (DEQs) (μg/L) in the algae assay focusing on inhibition <strong>of</strong> photosynthesis (mean<br />
elimination efficiency from one composite sample over 7 days based on the mean TEQ value <strong>of</strong><br />
three replicates in the experiment). In the 4 th measurement campaign (25.05.-02.06.10) the<br />
technical procedures were optimised. ........................................................................................... 27<br />
Figure 7: Evolution <strong>of</strong> risk quotients during wastewater treatment: measured environmental<br />
concentrations (MECs) from the screening <strong>of</strong> 120 substances at the Eawag <strong>and</strong> risk quotients<br />
(RQs) <strong>of</strong> three selected micropollutants during wastewater treatment in the 3 rd measurement<br />
campaign (MC). .............................................................................................................................. 31<br />
Figure 8: Evolution <strong>of</strong> estrogenicity during wastewater treatment steps: Estradiol equivalent<br />
concentrations [ng/L] <strong>and</strong> change indices (CITEQ) from the YES <strong>and</strong> the ER-CALUX assay for the<br />
4 th MC. ............................................................................................................................................ 32<br />
Figure 9: Steps <strong>of</strong> the development <strong>of</strong> an EQS-proposal at the Swiss Centre for Applied<br />
Ecotoxicology (Kase et al., 2011). ................................................................................................. 45<br />
Figure 10: Comparison <strong>of</strong> predicted environmental concentrations (PEC) with annual average<br />
EQS <strong>of</strong> 543 river courses (%) (from (Götz et al., 2010). ............................................................... 47<br />
Figure 11: Elimination efficiencies (%) for the “old” biology (SB) (1 st MC) <strong>and</strong> mean elimination<br />
efficiencies (%) for the moving bed biology (LF) (2 nd to 4 th MC, mean ± SD) for specific effects<br />
measured in in vitro bioassays. ...................................................................................................... 48<br />
Swiss Centre for Applied Ecotoxicology, Eawag/EPFL · Überl<strong>and</strong>strasse 133 · CH-8600 Dübendorf<br />
www.oekotoxzentrum.ch<br />
41
Figure 12: Elimination efficiencies (%) in the biological treatments for each <strong>of</strong> the four<br />
measurement campaigns regarding specific effects measured in in vitro bioassays. .................. 48<br />
Figure 13: Elimination efficiencies (%) in the ozonation treatment with wastewater from the “old”<br />
biology (SB) (1 st MC) <strong>and</strong> from the moving bed biology (LF) (2 nd to 4 th MC, mean ± SD) for<br />
specific effects measured in in vitro bioassays. ............................................................................. 49<br />
Figure 14: Elimination efficiencies (%) in the ozonation treatments for each <strong>of</strong> the four<br />
measurement campaigns regarding specific effects measured in in vitro bioassays. .................. 49<br />
Figure 15: Elimination efficiencies (%) in the biological treatment with ozonation with wastewater<br />
from the “old” biology (SB) (1 st MC) <strong>and</strong> wastewater from the moving bed biology (LF) (2 nd to 4 th<br />
MC, mean ± SD) for specific effects measured in in vitro bioassays. ........................................... 50<br />
Figure 16: Elimination efficiencies (%) in the biological treatment + ozonation for each <strong>of</strong> the four<br />
measurement campaigns regarding specific effects measured in in vitro bioassays. .................. 50<br />
Figure 17: Elimination efficiencies (%) in the PAC-UF treatment for each <strong>of</strong> the four<br />
measurement campaigns regarding specific effects measured in in vitro bioassays. .................. 51<br />
Figure 18: Elimination efficiencies (%) in the biological <strong>and</strong> PAC-UF treatment for each <strong>of</strong> the<br />
four measurement campaigns regarding specific effects measured in in vitro bioassays. .......... 51<br />
Tables<br />
Table 1: Overview <strong>of</strong> the applied test systems, test organisms <strong>and</strong> detectable effects. ................ 8<br />
Table 2: Ozone concentrations <strong>and</strong> powdered activated carbon types <strong>and</strong> concentrations<br />
applied in the four measurement campaigns (according to Margot et al., 2011). ......................... 12<br />
Table 3: Change indices (CITEQ) for bioassays, based on specific cellular mechanisms / in vitro<br />
bioassays with sample enrichment. ............................................................................................... 17<br />
Table 4: Change indices (CI) for in vivo bioassays performed in the laboratory with wastewater in<br />
a dilution series. .............................................................................................................................. 19<br />
Table 5: Change indices (CI) for in vivo bioassays performed at the WWTP Vidy with undiluted<br />
wastewater ..................................................................................................................................... 21<br />
Table 6: Proposed classification system for risk assessment to assess the water quality<br />
regarding selected chemical substances (adapted from Götz et al., 2010; Kase et al., 2011). EC<br />
environmental concentration, AA-EQS Annual Average EQS, RQ risk quotient. ........................ 46<br />
Table 7: Pseudokirchneriella subcapitata, photosynthesis inhibition after 2h: Diuron equivalent<br />
concentrations, DEQ [μg/L] (SD in brackets), elimination efficiency [%] <strong>and</strong> change index for the<br />
respective treatment steps. EN Entrée STEP, SB Sortie biologie (1 st MC), LF Lit fluidisé (2 nd - 4 th<br />
MC), OZ Sortie O3, CAG Sortie charbon actif granulé (1 st - 2 nd MC), SF Sortie filtre à sable (3 rd - 4 th<br />
MC), PAC-UF Sortie charbon actif en poudre - Ultrafiltration (2 nd - 4 th MC). n.m. not measured. . 52<br />
Table 8: Pseudokirchneriella subcapitata, growth inhibition after 24h: Toxicity equivalent<br />
concentrations, TEQ [mg/L] (SD in brackets), elimination efficiency [%] <strong>and</strong> change index (CITEQ)<br />
for the respective treatment steps. EN Entrée STEP, SB Sortie biologie (1 st MC), LF Lit fluidisé<br />
Swiss Centre for Applied Ecotoxicology, Eawag/EPFL · Überl<strong>and</strong>strasse 133 · CH-8600 Dübendorf<br />
www.oekotoxzentrum.ch<br />
42
(2 nd - 4 th MC), OZ Sortie O3, CAG Sortie charbon actif granulé (1 st - 2 nd MC), SF Sortie filtre à sable<br />
(3 rd - 4 th MC), PAC-UF Sortie charbon actif en poudre - Ultrafiltration (2 nd - 4 th MC). n.m. not<br />
measured. ...................................................................................................................................... 52<br />
Table 9: Saccharomyces cerevisiae, estrogen receptor binding: Estradiol equivalent<br />
concentration, EEQ [ng/L] (SD in brackets), elimination efficiency [%] <strong>and</strong> change index (CITEQ)<br />
for the respective treatment steps. EN Entrée STEP, SB Sortie biologie (1 st MC), LF Lit fluidisé<br />
(2 rd - 4 th MC), OZ Sortie O3, CAG Sortie charbon actif granulé (1 st - 2 nd MC), SF Sortie filtre à sable<br />
(3 rd - 4 th MC), PAC-UF Sortie charbon actif en poudre - Ultrafiltration (2 nd - 4 th MC). n.m. not<br />
measured. ...................................................................................................................................... 53<br />
Table 10: ER CALUX, estrogen receptor binding: Estradiol equivalent concentration, EEQ [ng/L]<br />
(SD in brackets), elimination efficiency [%] <strong>and</strong> change index (CITEQ) for the respective treatment<br />
steps. LOD agonism = 0.03 ng 17ß-estradiol equivalents/l water. EN Entrée STEP, SB Sortie<br />
biologie (1 st MC), LF Lit fluidisé (2 nd - 4 th MC), OZ Sortie O3, CAG Sortie charbon actif granulé (1 st -<br />
2 nd MC), SF Sortie filtre à sable (3 rd - 4 th MC), PAC-UF Sortie charbon actif en poudre -<br />
Ultrafiltration (2 nd - 4 th MC). n.m. not measured. ............................................................................. 53<br />
Table 11: AR CALUX, <strong>and</strong>rogen receptor binding: dihydrotestosterone (DHT) equivalent<br />
concentration [ng/L] (SD in brackets), elimination efficiency [%] <strong>and</strong> change index (CITEQ) for the<br />
respective treatment steps. LOD agonism = 0.1 ng DHT equivalents/l water. EN Entrée STEP,<br />
SB Sortie biologie (1 st MC), LF Lit fluidisé (2 nd - 4 th MC), OZ Sortie O3, CAG Sortie charbon actif<br />
granulé (1 st - 2 nd MC), SF Sortie filtre à sable (3 rd - 4 th MC), PAC-UF Sortie charbon actif en poudre<br />
- Ultrafiltration (2 nd - 4 th MC). n.m. not measured. ........................................................................... 54<br />
Table 12: GR CALUX, glucocorticoid receptor binding: dexmethasone (dex) equivalent<br />
concentrations [ng/L] (SD in brackets), elimination efficiency [%] <strong>and</strong> change index (CITEQ) for the<br />
respective treatment steps. LOD agonism = 4.0 ng dex equivalents/l water. EN Entrée STEP, SB<br />
Sortie biologie (1 st MC), LF Lit fluidisé (2 nd - 4 th MC), OZ Sortie O3, CAG Sortie charbon actif<br />
granulé (1 st - 2 nd MC), SF Sortie filtre à sable (3 rd - 4 th MC), PAC-UF Sortie charbon actif en poudre<br />
- Ultrafiltration (2 nd - 4 th MC). n.m. not measured. ........................................................................... 54<br />
Table 13: PR CALUX, progesterone receptor binding: Org-2058 equivalent concentration [ng/L]<br />
(SD in brackets), elimination efficiency [%] <strong>and</strong> change index (CITEQ) for the respective treatment<br />
steps. LOD agonism = 0.10 ng Org-2058 equivalents/l water. EN Entrée STEP, SB Sortie<br />
biologie (1 st MC), LF Lit fluidisé (2 nd - 4 th MC), OZ Sortie O3, CAG Sortie charbon actif granulé (1 st -<br />
2 nd MC), SF Sortie filtre à sable (3 rd - 4 th MC), PAC-UF Sortie charbon actif en poudre -<br />
Ultrafiltration (2 nd - 4 th MC). n.m. not measured. ............................................................................. 55<br />
Table 14: PPARg1 CALUX, peroxisome proliferator like receptor binding: Rosiglitasone<br />
equivalents [ng/L], elimination efficiency [%] <strong>and</strong> change index (CITEQ) for the respective<br />
treatment steps. LOD agonism = 0.10 ng Org-2058 equivalents/l water PPARg1 CALUX, LOD<br />
agonism = 25 ng Rosiglitasone equivalents/l water. EN Entrée STEP, SB Sortie biologie (1 st<br />
MC), LF Lit fluidisé (2 nd - 4 th MC), OZ Sortie O3, CAG Sortie charbon actif granulé (1 st - 2 nd MC),<br />
SF Sortie filtre à sable (3 rd - 4 th MC), PAC-UF Sortie charbon actif en poudre - Ultrafiltration (2 nd -<br />
4 th MC). n.m. not measured. .......................................................................................................... 55<br />
Table 15: Vibrio fischeri luminescence inhibition after 30 min: EC20 [%] after 30 minutes (95%<br />
confidence interval in brackets) <strong>and</strong> change index (CI) for the respective treatment steps. ........ 56<br />
Swiss Centre for Applied Ecotoxicology, Eawag/EPFL · Überl<strong>and</strong>strasse 133 · CH-8600 Dübendorf<br />
www.oekotoxzentrum.ch<br />
43
Table 16: Pseudokirchneriella subcapitata growth inhibition without nutrient addition after 3 d:<br />
EC20 [%] (95% confidence interval in brackets) <strong>and</strong> change index (CI) for the respective<br />
treatment steps. .............................................................................................................................. 56<br />
Table 17: Pseudokirchneriella subcapitata growth inhibition without nutrient addition after 3 d:<br />
EC50 [%] (95% confidence interval in brackets) <strong>and</strong> change index (CI) for the respective<br />
treatment steps. .............................................................................................................................. 57<br />
Table 18: Pseudokirchneriella subcapitata growth inhibition with nutrient addition after 3 d: EC20<br />
[%] (95% confidence interval in brackets) <strong>and</strong> change index (CI) for the respective treatment<br />
steps. .............................................................................................................................................. 57<br />
Table 19: Pseudokirchneriella subcapitata growth inhibition with nutrient addition after 3 d: EC50<br />
[%] (95% confidence interval in brackets) <strong>and</strong> change index (CI) for the respective treatment<br />
steps. .............................................................................................................................................. 58<br />
Table 20: Lemna minor growth rate fronds after 7 d: EC20 [%] (95% confidence interval in<br />
brackets) <strong>and</strong> change index (CI) for the respective treatment steps. ........................................... 58<br />
Table 21: Lemna minor growth rate fronds after 7 d: EC50 [%] (95% confidence interval in<br />
brackets) <strong>and</strong> change index (CI) for the respective treatment steps. ........................................... 59<br />
Table 22: Ceriodaphnia dubia mortality after 7 d: LC50 [%] for number <strong>of</strong> <strong>of</strong>fspring (95%<br />
confidence interval in brackets) <strong>and</strong> change index (CI) for the respective treatment steps. ........ 59<br />
Table 23: Ceriodaphnia dubia reproduction after 7 d: EC20 [%] for number <strong>of</strong> <strong>of</strong>fspring (95%<br />
confidence interval in brackets) <strong>and</strong> change index (CI) for the respective treatment steps. ........ 60<br />
Table 24: Ceriodaphnia dubia reproduction after 7 d: EC50 [%] for number <strong>of</strong> <strong>of</strong>fspring (95%<br />
confidence interval in brackets) <strong>and</strong> change index (CI) for the respective treatment steps. ........ 60<br />
Table 25: Lumbriculus variegatus reproduction <strong>and</strong> biomass after 28 d: Mean (SD in brackets)<br />
<strong>and</strong> change index (CI) for the respective treatment steps. ........................................................... 61<br />
Table 26: Oncorhynchus mykiss survival <strong>and</strong> developmental parameters: Mean (± SD in<br />
brackets) <strong>and</strong> change index for the respective treatment steps. .................................................. 62<br />
Swiss Centre for Applied Ecotoxicology, Eawag/EPFL · Überl<strong>and</strong>strasse 133 · CH-8600 Dübendorf<br />
www.oekotoxzentrum.ch<br />
44
9. Appendix<br />
Appendix for chapter 5<br />
Derivation <strong>of</strong> water quality criteria<br />
The quality criteria for the prioritized substances were derived from ecotoxicological effect data<br />
as shown in Figure 9.<br />
Figure 9: Steps <strong>of</strong> the development <strong>of</strong> an EQS-proposal at the Swiss Centre for Applied<br />
Ecotoxicology (Kase et al., 2011).<br />
For substances for which EQS exist or existed in EU countries, only an assessment <strong>of</strong> the<br />
appropriateness <strong>of</strong> the EQS is made with respect to current ecotoxicity data. For substances for<br />
which EQS are developed at the same time in the EU <strong>and</strong> in Switzerl<strong>and</strong>, the EQS are derived in<br />
close collaboration with the appropriate experts. All effect data which were not assessed for their<br />
quality by other institutions before are assessed for their validity (Klimisch et al., 1997;<br />
Matthiessen et al., 2009) <strong>and</strong> relevance. The proposals put forward are still provisional <strong>and</strong> will<br />
undergo a further phase before they are finalized.<br />
Swiss Centre for Applied Ecotoxicology, Eawag/EPFL · Überl<strong>and</strong>strasse 133 · CH-8600 Dübendorf<br />
www.oekotoxzentrum.ch<br />
45
Classification <strong>of</strong> risk quotients for the evaluation <strong>of</strong> water quality regarding priority<br />
substances<br />
In the pilot study at the WWTP Vidy Lausanne the risk quotients were classified according to a<br />
classification system proposed by Götz et al. (2010) (Table 6).<br />
Table 6: Proposed classification system for risk assessment to assess the water quality regarding<br />
selected chemical substances (adapted from Götz et al., 2010; Kase et al., 2011). EC environmental<br />
concentration, AA-EQS Annual Average EQS, RQ risk quotient.<br />
<strong>Evaluation</strong> Condition/description<br />
very good<br />
good<br />
moderate<br />
insufficient<br />
poor<br />
The environmental concentration (EC) is<br />
100 times smaller than the quality<br />
criterion (AA-EQS)<br />
The environmental concentration (EC) is<br />
10 times smaller than the quality criterion<br />
(AA-EQS)<br />
The environmental concentration (EC) is<br />
smaller than the quality criterion (AA-<br />
EQS)<br />
The environmental concentration (EC) is<br />
smaller than the double quality criterion<br />
(AA-EQS)<br />
The environmental concentration (EC) is<br />
smaller than the tenfold quality criterion<br />
(AA-EQS)<br />
The environmental concentration (EC) is<br />
the same or greater than the tenfold<br />
quality criterion (AA-EQS)<br />
RQ < 0.01<br />
0.01 ≤ RQ < 0.1<br />
0.1 ≤ RQ < 1<br />
1 ≤ RQ < 2<br />
2 ≤ RQ < 10<br />
RQ > 10<br />
Swiss Centre for Applied Ecotoxicology, Eawag/EPFL · Überl<strong>and</strong>strasse 133 · CH-8600 Dübendorf<br />
www.oekotoxzentrum.ch<br />
Compliance<br />
with quality<br />
criterion<br />
AA-EQS<br />
passed<br />
AA-EQS<br />
exceeded<br />
The evaluation <strong>of</strong> the water quality regarding micropollutants originating from municipal<br />
wastewater was adapted according to the module ‘Physicochemical Water <strong>Quality</strong>’ (Liechti,<br />
2010) <strong>of</strong> the modular stepwise procedure for Switzerl<strong>and</strong> (www.modul-stufen-konzept.ch). This<br />
classification system reflects the water quality <strong>and</strong> not the ecological quality. However, in the<br />
European Union (EU) a connection between the ecological status <strong>and</strong> the chemical status is<br />
made in the context <strong>of</strong> the Water Framework Directive (WFD): an exceedance <strong>of</strong> the AA-EQS for<br />
one substance leads to the surpass <strong>of</strong> a good ecological status in the context <strong>of</strong> the EU-WFD<br />
(EU, 2010), as very sensitive species are possibly impacted.<br />
During the evaluation <strong>of</strong> micropollutants according to the classification based on single<br />
substances described above, it was noticed that the detection <strong>and</strong> quantification limit for the<br />
respective substances could influence the outcome. When the analytical limit <strong>of</strong> quantification for<br />
a substance is above a category limit (see Table 6), the classification results as a minimum<br />
category. For example if a substance is not detectable <strong>and</strong> if the limit <strong>of</strong> quantification is between<br />
the AA-EQS/10 <strong>and</strong> the AA-EQS, then the minimum category can be designated “good+” since<br />
the actual exposure concentration can be classified as “good” or “very good”.<br />
46
Götz et al. (2010) have evaluated effects on the concentrations <strong>of</strong> selected micropollutants in<br />
Swiss rivers due to wastewater effluents. The water quality regarding those substances was<br />
assessed using the predicted environmental concentrations (PEC) from the exposure model <strong>of</strong><br />
(Ort et al., 2007) assuming low flow conditions (Q347) <strong>and</strong> compared with the respective AA-EQS<br />
(Figure 10).<br />
Based on this assessment scheme a moderate to poor water quality regarding three <strong>of</strong> the six<br />
selected micropollutants (dicl<strong>of</strong>enac, carbamazepin <strong>and</strong> clarithromycin) was detected in 14 % <strong>of</strong><br />
the assessed 543 water courses.<br />
Figure 10: Comparison <strong>of</strong> predicted environmental concentrations (PEC) with annual average EQS <strong>of</strong><br />
543 river courses (%) (from (Götz et al., 2010).<br />
For dicl<strong>of</strong>enac, carbamazepin <strong>and</strong> clarithromycin risk quotients were derived using the quality<br />
criteria as well as the 90 th percentile <strong>of</strong> the measured concentrations (see chapter 5.1).<br />
Swiss Centre for Applied Ecotoxicology, Eawag/EPFL · Überl<strong>and</strong>strasse 133 · CH-8600 Dübendorf<br />
www.oekotoxzentrum.ch<br />
47
Figures<br />
Biological treatment<br />
Green algae: photosynthesis inhibition<br />
Green algae: growth inhibition<br />
YES assay: estrogenic effects<br />
ER CALUX: estrogenic effects<br />
AR CALUX: <strong>and</strong>rogenic effects<br />
GR CALUX: glucocorticoid like effects<br />
PR CALUX: progesterone like effects<br />
PPARg1 CALUX<br />
-95 %<br />
-385 ± 196 %<br />
-20% 0% 20% 40% 60% 80% 100%<br />
Elimination Biological Treatment<br />
'Old' biology<br />
Moving bed biology<br />
Figure 11: Elimination efficiencies (%) for the “old” biology (SB) (1 st MC) <strong>and</strong> mean elimination<br />
efficiencies (%) for the moving bed biology (LF) (2 nd to 4 th MC, mean ± SD) for specific effects<br />
measured in in vitro bioassays.<br />
Green algae: photosynthesis inhibition<br />
Green algae: growth inhibition<br />
YES assay: estrogenic effects<br />
ER CALUX: estrogenic effects<br />
AR CALUX: <strong>and</strong>rogenic effects<br />
GR CALUX: glucocorticoid like effects<br />
PR CALUX: progesterone like effects<br />
PPARg1 CALUX<br />
- 95 %<br />
- 300 %<br />
- 610 %<br />
- 246 %<br />
-40% -20% 0% 20% 40% 60% 80% 100%<br />
Elimination Biological Treatment<br />
20.-27.07.09<br />
30.10.-5.11.09<br />
10.-17.03.10<br />
25.05.-02.06.10<br />
Swiss Centre for Applied Ecotoxicology, Eawag/EPFL · Überl<strong>and</strong>strasse 133 · CH-8600 Dübendorf<br />
www.oekotoxzentrum.ch<br />
- 67 %<br />
Figure 12: Elimination efficiencies (%) in the biological treatments for each <strong>of</strong> the four<br />
measurement campaigns regarding specific effects measured in in vitro bioassays.<br />
48
Biological treatment combined with ozonation<br />
Green algae: photosynthesis inhibition<br />
Green algae: growth inhibition<br />
YES assay: estrogenic effects<br />
ER CALUX: estrogenic effects<br />
AR CALUX: <strong>and</strong>rogenic effects<br />
GR CALUX: glucocorticoid like effects<br />
PR CALUX: progesterone like effects<br />
PPARg1 CALUX<br />
-20% 0% 20% 40% 60% 80% 100%<br />
Elimination Ozonation<br />
Swiss Centre for Applied Ecotoxicology, Eawag/EPFL · Überl<strong>and</strong>strasse 133 · CH-8600 Dübendorf<br />
www.oekotoxzentrum.ch<br />
'Old' biology<br />
Moving bed biology<br />
Figure 13: Elimination efficiencies (%) in the ozonation treatment with wastewater from the “old” biology<br />
(SB) (1 st MC) <strong>and</strong> from the moving bed biology (LF) (2 nd to 4 th MC, mean ± SD) for specific effects<br />
measured in in vitro bioassays.<br />
Green algae: photosynthesis inhibition<br />
Green algae: growth inhibition<br />
YES assay: estrogenic effects<br />
ER CALUX: estrogenic effects<br />
AR CALUX: <strong>and</strong>rogenic effects<br />
GR CALUX: glucocorticoid like effects<br />
PR CALUX: progesterone like effects<br />
PPARg1 CALUX<br />
-40% -20% 0% 20% 40% 60% 80% 100%<br />
Elimination Ozonation<br />
0.5 g O3/g DOC<br />
0.7 g O3/g DOC<br />
0.8 g O3/g DOC<br />
1.1 g O3/g DOC<br />
Figure 14: Elimination efficiencies (%) in the ozonation treatments for each <strong>of</strong> the four measurement<br />
campaigns regarding specific effects measured in in vitro bioassays.<br />
49
Green algae: photosynthesis inhibition<br />
Green algae: growth inhibition<br />
YES assay: estrogenic effects<br />
ER CALUX: estrogenic effects<br />
AR CALUX: <strong>and</strong>rogenic effects<br />
GR CALUX: glucocorticoid like effects<br />
PR CALUX: progesterone like effects<br />
PPARg1 CALUX<br />
-20% 0% 20% 40% 60% 80% 100%<br />
Elimination Biological Treatment + Ozonation<br />
'Old' biology<br />
Swiss Centre for Applied Ecotoxicology, Eawag/EPFL · Überl<strong>and</strong>strasse 133 · CH-8600 Dübendorf<br />
www.oekotoxzentrum.ch<br />
Moving bed biology<br />
Figure 15: Elimination efficiencies (%) in the biological treatment with ozonation with wastewater from the<br />
“old” biology (SB) (1 st MC) <strong>and</strong> wastewater from the moving bed biology (LF) (2 nd to 4 th MC, mean ± SD)<br />
for specific effects measured in in vitro bioassays.<br />
Green algae: photosynthesis inhibition<br />
Green algae: growth inhibition<br />
YES assay: estrogenic effects<br />
ER CALUX: estrogenic effects<br />
AR CALUX: <strong>and</strong>rogenic effects<br />
GR CALUX: glucocorticoid like effects<br />
PR CALUX: progesterone like effects<br />
PPARg1 CALUX<br />
-20% 0% 20% 40% 60% 80% 100%<br />
Elimination Biological Treatment + Ozonation<br />
0.5 g O3/g DOC<br />
0.7 g O3/g DOC<br />
0.8 g O3/g DOC<br />
1.1 g O3/g DOC<br />
Figure 16: Elimination efficiencies (%) in the biological treatment + ozonation for each <strong>of</strong> the four<br />
measurement campaigns regarding specific effects measured in in vitro bioassays.<br />
50
Biological treatment combined with powdered activated carbon –UF treatment<br />
Green algae: photosynthesis inhibition<br />
Green algae: growth inhibition<br />
YES assay: estrogenic effects<br />
ER CALUX: estrogenic effects<br />
AR CALUX: <strong>and</strong>rogenic effects<br />
GR CALUX: glucocorticoid like effects<br />
PR CALUX: progesterone like effects<br />
PPARg1 CALUX<br />
0% 20% 40% 60% 80% 100%<br />
Elimination PAC-UF Treatment<br />
Swiss Centre for Applied Ecotoxicology, Eawag/EPFL · Überl<strong>and</strong>strasse 133 · CH-8600 Dübendorf<br />
www.oekotoxzentrum.ch<br />
10 mg/L (Norit)<br />
12 mg/L (Sorbopor)<br />
20 mg/L (Sorbopor)<br />
Figure 17: Elimination efficiencies (%) in the PAC-UF treatment for each <strong>of</strong> the four measurement<br />
campaigns regarding specific effects measured in in vitro bioassays.<br />
Green algae: photosynthesis inhibition<br />
Green algae: growth inhibition<br />
YES assay: estrogenic effects<br />
ER CALUX: estrogenic effects<br />
AR CALUX: <strong>and</strong>rogenic effects<br />
GR CALUX: glucocorticoid like effects<br />
PR CALUX: progesterone like effects<br />
PPARg1 CALUX<br />
0% 20% 40% 60% 80% 100%<br />
Elimination Biological + PAC-UF Treatment<br />
10 mg/L (Norit)<br />
12 mg/L (Sorbopor)<br />
20 mg/L (Sorbopor)<br />
Figure 18: Elimination efficiencies (%) in the biological <strong>and</strong> PAC-UF treatment for each <strong>of</strong> the four<br />
measurement campaigns regarding specific effects measured in in vitro bioassays.<br />
51
Tables<br />
Table 7: Pseudokirchneriella subcapitata, photosynthesis inhibition after 2h: Diuron equivalent concentrations, DEQ [μg/L] (SD in brackets), elimination efficiency [%] <strong>and</strong><br />
change index for the respective treatment steps. EN Entrée STEP, SB Sortie biologie (1 st MC), LF Lit fluidisé (2 nd - 4 th MC), OZ Sortie O3, CAG Sortie charbon actif granulé<br />
(1 st - 2 nd MC), SF Sortie filtre à sable (3 rd - 4 th MC), PAC-UF Sortie charbon actif en poudre - Ultrafiltration (2 nd - 4 th MC). n.m. not measured.<br />
Date<br />
Ozone<br />
dosage<br />
(mgO3<br />
-1<br />
gDOC )<br />
PAC conc.<br />
(mg PAC/L<br />
wastewater)<br />
EN<br />
SB<br />
LF<br />
Elimination<br />
Biology<br />
(%)<br />
Effect<br />
Biology<br />
Swiss Centre for Applied Ecotoxicology, Eawag/EPFL · Überl<strong>and</strong>strasse 133 · CH-8600 Dübendorf www.oekotoxzentrum.ch<br />
OZ<br />
Elimination<br />
OZ (%)<br />
Effect<br />
OZ<br />
CAG<br />
SF<br />
Elimination<br />
OZ + SF<br />
(%)<br />
Effect<br />
OZ +<br />
SF<br />
PAC-<br />
UF<br />
Elimination<br />
PAC-UF<br />
(%)<br />
Effect<br />
PAC-<br />
UF<br />
Overall<br />
Elimination<br />
Ozonation<br />
20.-27.07.09 0.5 No PAC 0.193 0.250 -29% 0.77 0.020 92% 12.67 0.029 88% 8.53 n.m. - - 90% -<br />
(0.031) (0.002) (0.004) (0.004)<br />
30.10.-05.11.09 0.7 10 (Norit) 0.306 0.189 38% 1.62 0.040 79% 4.70 0.088 53% 2.14 0.026 86% 7.22 87% 91%<br />
(0.007) (0.005) (0) (0.011) (0.001)<br />
10.-17.03.10 0.8 12 (Sorbopor) 0.148 0.096 35% 1.54 0.022 77% 4.30 0.024 75% 4.06 0.022 77% 4.43 85% 85%<br />
(0.002) (0.004) (0) (0) (0)<br />
25.05.-02.06.10 0.11 20 (Sorbopor) 0.305 0.398 -30% 0.77 0.032 92% 12.31 0.031 92% 12.73 0.005 99% 77.23 89% 98%<br />
(0.006) (0.027) (0) (0.001) (0.001)<br />
Overall<br />
Elimination<br />
PAC-UF<br />
Table 8: Pseudokirchneriella subcapitata, growth inhibition after 24h: Toxicity equivalent concentrations, TEQ [mg/L] (SD in brackets), elimination efficiency [%] <strong>and</strong> change<br />
index (CITEQ) for the respective treatment steps. EN Entrée STEP, SB Sortie biologie (1 st MC), LF Lit fluidisé (2 nd - 4 th MC), OZ Sortie O3, CAG Sortie charbon actif granulé<br />
(1 st - 2 nd MC), SF Sortie filtre à sable (3 rd - 4 th MC), PAC-UF Sortie charbon actif en poudre - Ultrafiltration (2 nd - 4 th MC). n.m. not measured.<br />
Date<br />
Ozone<br />
dosage<br />
(mgO3<br />
-1<br />
gDO C )<br />
PAC conc.<br />
(mg PAC/L<br />
wastewater)<br />
EN<br />
SB<br />
LF<br />
Elimination<br />
Biology<br />
(%)<br />
Effect<br />
Biology<br />
OZ<br />
Elimination<br />
OZ (%)<br />
Effect<br />
OZ<br />
CAG<br />
SF<br />
Elimination<br />
OZ + SF<br />
(%)<br />
Effect<br />
OZ +<br />
SF<br />
PAC-<br />
UF<br />
Elimination<br />
PAC-UF<br />
(%)<br />
Effect<br />
PAC-<br />
UF<br />
Overall<br />
Elimination<br />
Ozonation<br />
20.-27.07.09 0.5 No PAC 16.72 4.12 75% 4.06 0.19 95% 21.63 1.06 74% 3.88 n.m. - - 99% -<br />
(3.78) (0.56) (0.27) (0.14)<br />
30.10.-05.11.09 0.7 10 (Norit) 18.09 6.05 67% 2.99 1.30 78% 4.64 4.14 32% 1.46 1.26 79% 4.81 93% 93%<br />
12<br />
(6.84) (1.55) (0.15) (0.89) (0.06)<br />
10.-17.03.10 0.8 (Sorbopor) 31.43 6.55 79% 4.80 2.17 67% 3.02 1.17 82% 5.58 1.03 84% 6.37 93% 97%<br />
20<br />
(1.10) (0.30) (0.05) (0.13) (0.04)<br />
25.05.-02.06.10 0.11 (Sorbopor) 29.88 8.06 73% 3.71 1.54 81% 5.23 1.39 83% 5.78 0.93 88% 8.63 95% 97%<br />
(2.06) (0.21) (0.09) (0.10) (0.04)<br />
Overall<br />
Elimination<br />
PAC-UF<br />
52
Table 9: Saccharomyces cerevisiae, estrogen receptor binding: Estradiol equivalent concentration, EEQ [ng/L] (SD in brackets), elimination efficiency [%] <strong>and</strong> change index<br />
(CITEQ) for the respective treatment steps. EN Entrée STEP, SB Sortie biologie (1 st MC), LF Lit fluidisé (2 rd - 4 th MC), OZ Sortie O3, CAG Sortie charbon actif granulé (1 st - 2 nd<br />
MC), SF Sortie filtre à sable (3 rd - 4 th MC), PAC-UF Sortie charbon actif en poudre - Ultrafiltration (2 nd - 4 th MC). n.m. not measured.<br />
Date<br />
Ozone<br />
dosage<br />
(mgO3<br />
gDO C -1 )<br />
PAC conc.<br />
(mg PAC/L<br />
wastewater)<br />
EN<br />
SB<br />
LF<br />
Elimination<br />
Biology<br />
(%)<br />
Effect<br />
Biology<br />
Swiss Centre for Applied Ecotoxicology, Eawag/EPFL · Überl<strong>and</strong>strasse 133 · CH-8600 Dübendorf www.oekotoxzentrum.ch<br />
OZ<br />
Elimination<br />
OZ (%)<br />
Effect<br />
OZ<br />
CAG<br />
SF<br />
Elimination<br />
OZ + SF<br />
(%)<br />
Effect<br />
OZ +<br />
SF<br />
PAC-<br />
UF<br />
Elimination<br />
PAC-UF<br />
(%)<br />
Effect<br />
PAC-<br />
UF<br />
Overall<br />
Elimination<br />
Ozonation<br />
20.-27.07.09 0.5 No PAC 48.68 12.00 75% 4.06 0.27 98% 44.87 3.08 74% 3.89 n.m. - - 99% -<br />
(4.25) (0.88) (0.09) (0.59)<br />
30.10.-05.11.09 0.7 10 (Norit) 100.55 0.68 99% 147.04 0.10 85% 6.53 11.43 -1571% 0.06 0.29 58% 2.35 100% 100%<br />
(12.03) (0.12) (0.05) (0.56) (0.09)<br />
10.-17.03.10 0.8 12 (Sorbopor) 61.68 8.34 86% 7.39 0.65 92% 12.77 3.26 61% 2.56 1.32 84% 6.31 99% 98%<br />
(6.82) (0.47) (0.12) (0.33) (0.28)<br />
25.05.-02.06.10 0.11 20 (Sorbopor) 37.15 3.03 92% 12.25 0.27 91% 11.34 0.23 92% 13.04 0.29 90% 10.32 99% 99%<br />
(2.42) (0.51) (0.01) (0.08) (0.08)<br />
Overall<br />
Elimination<br />
PAC-UF<br />
Table 10: ER CALUX, estrogen receptor binding: Estradiol equivalent concentration, EEQ [ng/L] (SD in brackets), elimination efficiency [%] <strong>and</strong> change index (CITEQ) for the<br />
respective treatment steps. LOD agonism = 0.03 ng 17ß-estradiol equivalents/l water. EN Entrée STEP, SB Sortie biologie (1 st MC), LF Lit fluidisé (2 nd - 4 th MC), OZ Sortie<br />
O3, CAG Sortie charbon actif granulé (1 st - 2 nd MC), SF Sortie filtre à sable (3 rd - 4 th MC), PAC-UF Sortie charbon actif en poudre - Ultrafiltration (2 nd - 4 th MC). n.m. not<br />
measured.<br />
Date<br />
Ozone<br />
dosage<br />
(mgO3<br />
gDOC -1 )<br />
PAC conc.<br />
(mg PAC/L<br />
wastewater)<br />
EN<br />
SB<br />
LF<br />
Elimination<br />
Biology<br />
(%)<br />
Effect<br />
Biology<br />
OZ<br />
Eliminatio<br />
n OZ (%)<br />
Effect<br />
OZ<br />
CAG<br />
SF<br />
Eliminatio<br />
n OZ +<br />
SF (%)<br />
Effect<br />
OZ +<br />
SF<br />
PAC<br />
-UF<br />
Elimination<br />
PAC-UF<br />
(%)<br />
Effect<br />
PAC-<br />
UF<br />
Overall<br />
Elimination<br />
Ozonation<br />
Overall<br />
Elimination<br />
PAC-UF<br />
20.-27.07.09 0.5 No PAC 24.50 6.70 73% 3.66 0.14 98% 47.86 1.45 78% 4.62 n.m. - - 99% -
Table 11: AR CALUX, <strong>and</strong>rogen receptor binding: dihydrotestosterone (DHT) equivalent concentration [ng/L] (SD in brackets), elimination efficiency [%] <strong>and</strong> change index<br />
(CITEQ) for the respective treatment steps. LOD agonism = 0.1 ng DHT equivalents/l water. EN Entrée STEP, SB Sortie biologie (1 st MC), LF Lit fluidisé (2 nd - 4 th MC), OZ Sortie<br />
O3, CAG Sortie charbon actif granulé (1 st - 2 nd MC), SF Sortie filtre à sable (3 rd - 4 th MC), PAC-UF Sortie charbon actif en poudre - Ultrafiltration (2 nd - 4 th MC). n.m. not measured.<br />
Date<br />
Ozone<br />
dosage<br />
(mgO3<br />
gDOC -1 )<br />
PAC conc.<br />
(mg PAC/L<br />
wastewater)<br />
EN<br />
SB<br />
LF<br />
Elimination<br />
Biology<br />
(%)<br />
Effect<br />
Biology<br />
20.-27.07.09 0.5 No PAC 11.00 0.67 94% 16.42<br />
(1.41)<br />
Swiss Centre for Applied Ecotoxicology, Eawag/EPFL · Überl<strong>and</strong>strasse 133 · CH-8600 Dübendorf www.oekotoxzentrum.ch<br />
OZ<br />
<<br />
LOD<br />
Elimination<br />
OZ (%)<br />
Effect<br />
OZ<br />
- -<br />
CAG<br />
SF<br />
Elimination<br />
OZ + SF<br />
(%)<br />
30.10.-05.11.09 0.7 10 (Norit) 4.50 0.22 95% 20.45 0.15 32% 1.47 0.67 -205% 0.33<br />
10.-17.03.10 0.8 12 (Sorbopor) 28.00 0.48 98% 58.33 0.27 44% 1.78 0.17 65% 2.82<br />
25.05.-02.06.10 0.11 20 (Sorbopor) 18.00 0.20 99% 90.00 0.10 50% 2.00 0.13 35% 1.54<br />
<<br />
LOD<br />
Effect<br />
OZ +<br />
SF<br />
PAC-<br />
UF<br />
Elimination<br />
PAC-UF<br />
(%)<br />
Effect<br />
PAC-<br />
UF<br />
Overall<br />
Elimination<br />
Ozonation<br />
Overall<br />
Elimination<br />
PAC-UF<br />
Blank<br />
- - n.m. - - - -
Table 13: PR CALUX, progesterone receptor binding: Org-2058 equivalent concentration [ng/L] (SD in brackets), elimination efficiency [%] <strong>and</strong> change index (CITEQ) for the<br />
respective treatment steps. LOD agonism = 0.10 ng Org-2058 equivalents/l water. EN Entrée STEP, SB Sortie biologie (1 st MC), LF Lit fluidisé (2 nd - 4 th MC), OZ Sortie O3, CAG<br />
Sortie charbon actif granulé (1 st - 2 nd MC), SF Sortie filtre à sable (3 rd - 4 th MC), PAC-UF Sortie charbon actif en poudre - Ultrafiltration (2 nd - 4 th MC). n.m. not measured.<br />
Date<br />
Ozone<br />
dosage<br />
(mgO3<br />
-1<br />
gDOC )<br />
PAC conc. (mg<br />
PAC/L<br />
wastewater)<br />
EN<br />
SB<br />
LF<br />
Elimination<br />
Biology<br />
(%)<br />
Effect<br />
Biology<br />
Swiss Centre for Applied Ecotoxicology, Eawag/EPFL · Überl<strong>and</strong>strasse 133 · CH-8600 Dübendorf www.oekotoxzentrum.ch<br />
OZ<br />
Elimination<br />
OZ (%)<br />
Effect<br />
OZ<br />
CAG<br />
SF<br />
Elimination<br />
OZ + SF<br />
(%)<br />
Effect<br />
OZ +<br />
SF<br />
PAC-<br />
UF<br />
Elimination<br />
PAC-UF<br />
(%)<br />
Effect<br />
PAC-<br />
UF<br />
Overall<br />
Elimination<br />
Ozonation<br />
Overall<br />
Elimination<br />
PAC-UF<br />
20.-27.07.09 0.5 No PAC 1.34 2.60 -95% 0.51 0.34 87% 7.65 0.37 86% 7.03 n.m. - - 75% -
Table 15: Vibrio fischeri luminescence inhibition after 30 min: EC20 [%] after 30 minutes (95% confidence interval in brackets) <strong>and</strong> change index (CI) for the<br />
respective treatment steps.<br />
EN Entrée STEP, SB Sortie biologie, LF Lit fluidisé, OZ Sortie O3, CAG Sortie charbon actif granulé, SF Sortie filtre à sable, PAC-UF Sortie charbon actif<br />
en poudre - Ultrafiltration. n.t. not toxic, n.m. not measured. If e.g. only the influent sample was toxic, a surrogate EC20 <strong>of</strong> 110% (as the “real” value is<br />
>100%) was used for the not toxic samples in order to be able to calculate a change index.<br />
Date<br />
Ozone dosage<br />
-1<br />
(gO3 gDOC )<br />
PAC conc.<br />
(mg PAC/L<br />
wastewater)<br />
EN<br />
SB (1 st MC)<br />
LF (2 nd - 4 th MC)<br />
Effect<br />
Biology<br />
Swiss Centre for Applied Ecotoxicology, Eawag/EPFL · Überl<strong>and</strong>strasse 133 · CH-8600 Dübendorf www.oekotoxzentrum.ch<br />
OZ<br />
Effect<br />
OZ<br />
CAG (1 st , 2 nd MC)<br />
SF (3 rd ,4 th MC<br />
Effect<br />
OZ + SF<br />
20.-27.07.09 0.5 No PAC 42 n.t. 2.62 n.t. - n.t. - n.m. -<br />
30.10.-05.11.09 0.7 10 (Norit)<br />
(30.3-58.2)<br />
100 n.t. 1.10 n.t. - n.t. - n.t. -<br />
10.-17.03.10 0.8 12 (Sorbopor) 75.4<br />
(60.8-93.5)<br />
n.t. 1.46 n.t. - n.t. - n.t. -<br />
26.05.-02.06.10 0.11 20 (Sorbopor) 74.9<br />
(50.7-93.4)<br />
n.t. 1.47 n.t. - n.t. - n.t. -<br />
Table 16: Pseudokirchneriella subcapitata growth inhibition without nutrient addition after 3 d: EC20 [%] (95% confidence interval in brackets) <strong>and</strong> change<br />
index (CI) for the respective treatment steps.<br />
EN Entrée STEP, SB Sortie biologie, LF Lit fluidisé, OZ Sortie O3, CAG Sortie charbon actif granulé, SF Sortie filtre à sable, PAC-UF Sortie charbon actif<br />
en poudre - Ultrafiltration. n.t. not toxic, n.m. not measured. If e.g. only the influent sample was toxic, a surrogate EC20 <strong>of</strong> 110% (as the “real” value is<br />
>100%) was used for the not toxic samples in order to be able to calculate a change index.<br />
Date<br />
Ozone<br />
dosage<br />
-1<br />
(gO3 gDOC )<br />
PAC conc.<br />
(mg PAC/L<br />
wastewater)<br />
EN<br />
SB (1 st MC)<br />
LF (2 nd - 4 th MC)<br />
Effect<br />
Biology<br />
OZ<br />
Effect<br />
OZ<br />
CAG (1 st , 2 nd MC)<br />
SF (3 rd ,4 th MC<br />
Effect<br />
OZ + SF<br />
20.-27.07.09 0.5 No PAC 71.1 67.1 0.94 63 0.94 58.6 0.87 n.m. -<br />
(43.4-85.2) (59.2-74.3) (56.6-69.4) (54.2-62.8)<br />
30.10.-05.11.09 0.7 10 (Norit) 39.7 32.3 0.81 38.9 1.20 47.9 1.48 32.4 1.00<br />
(25.5-51.4) (29.2-36.2) (34.4-41.9) (43.5-53.1) (27.2-39.6)<br />
10.-17.03.10 0.8 12 (Sorbopor) 56.38 54.57 0.97 52.21 0.96 57.16 1.05 53.7 0.98<br />
(42.2-59.9) (51.8-57.0) (50.1-57.7) (54.4-59.7) (52.0-55.1)<br />
26.05.-02.06.10 0.11 20 (Sorbopor) 35.23 84.23 2.39 67.82 0.81 32.38 0.38 33.23 0.39<br />
(16.5-79.8) (70.5-93.6) (59.6-75.9) (23.1-77.6) (26.7-47.2)<br />
PAC-UF<br />
PAC-UF<br />
Effect<br />
PAC-<br />
UF<br />
Effect<br />
PAC-UF<br />
56
Table 17: Pseudokirchneriella subcapitata growth inhibition without nutrient addition after 3 d: EC50 [%] (95% confidence interval in brackets) <strong>and</strong> change<br />
index (CI) for the respective treatment steps.<br />
EN Entrée STEP, SB Sortie biologie, LF Lit fluidisé, OZ Sortie O3, CAG Sortie charbon actif granulé, SF Sortie filtre à sable, PAC-UF Sortie charbon actif en<br />
poudre - Ultrafiltration. n.t. not toxic, n.m. not measured. If e.g. only the influent sample was toxic, a surrogate EC50 <strong>of</strong> 110% (as the “real” value is >100%)<br />
was used for the not toxic samples in order to be able to calculate a change index.<br />
Date<br />
Ozone<br />
dosage<br />
-1<br />
(gO3 gDOC )<br />
PAC conc.<br />
(mg PAC/L<br />
wastewater)<br />
EN<br />
SB (1 st MC)<br />
LF (2 nd - 4 th MC)<br />
Effect<br />
Biology<br />
Swiss Centre for Applied Ecotoxicology, Eawag/EPFL · Überl<strong>and</strong>strasse 133 · CH-8600 Dübendorf www.oekotoxzentrum.ch<br />
OZ<br />
Effect<br />
OZ<br />
CAG (1 st , 2 nd MC)<br />
SF (3 rd ,4 th MC<br />
Effect<br />
OZ + SF<br />
20.-27.07.09 0.5 No PAC 84 85.4 1.02 79.3 0.93 77.7 0.91 n.m. -<br />
(71.8-142) (81-92.3) (75.2-83.8) (74.5-81.4)<br />
30.10.-05.11.09 0.7 10 (Norit) 73.9 57.6 0.78 57.8 1.00 63.9 1.11 53.7 0.93<br />
(61.2-81.5) (54.3-60) (54.6-60.2) (61.8-65.9) (51.7-55.4)<br />
10.-17.03.10 0.8 12 (Sorbopor) 72.47 79.96 1.10 77.63 0.97 78.43 0.98 72.19 0.90<br />
(65.0-75.9) (79.0-80.9) (73.9-79.5) (76.8-79.9) (70.8-73.6)<br />
26.05.-02.06.10 0.11 20 (Sorbopor) 82.62 91.5 1.11 86.77 0.95 81.6345 0.89 69.87 0.76<br />
(62.6->125) (87.3-163) (80.8-96.1) (74.1-84.6) (64.6-74.0)<br />
PAC-UF<br />
Effect<br />
PAC-UF<br />
Table 18: Pseudokirchneriella subcapitata growth inhibition with nutrient addition after 3 d: EC20 [%] (95% confidence interval in brackets) <strong>and</strong> change index<br />
(CI) for the respective treatment steps.<br />
EN Entrée STEP, SB Sortie biologie, LF Lit fluidisé, OZ Sortie O3, CAG Sortie charbon actif granulé, SF Sortie filtre à sable, PAC-UF Sortie charbon actif en<br />
poudre - Ultrafiltration. n.t. not toxic, n.m. not measured. If e.g. only the influent sample was toxic, a surrogate EC20 <strong>of</strong> 110% (as the “real” value is >100%) was<br />
used for the not toxic samples in order to be able to calculate a change index.<br />
Date<br />
Ozone<br />
dosage<br />
-1<br />
(gO3 gDOC )<br />
PAC conc.<br />
(mg PAC/L<br />
wastewater)<br />
EN<br />
SB (1 st MC)<br />
LF (2 nd - 4 th MC)<br />
Effect<br />
Biology<br />
OZ<br />
Effect<br />
OZ<br />
CAG (1 st , 2 nd<br />
MC)<br />
SF (3 rd ,4 th MC<br />
Effect<br />
OZ + SF<br />
20.-27.07.09 0.5 No PAC 76.7 n.t. 1.43 n.t. - 89.5 0.81 n.m. -<br />
(71.2-83.7) (85.9-115)<br />
30.10.-05.11.09 0.7 10 (Norit) 52.7 71.7 1.36 n.t. 1.53 n.t. 1.53 100 1.39<br />
(26.3-59.3) (61-83)<br />
10.-17.03.10 0.8 12 (Sorbopor) 48.06<br />
(18.9-60.4)<br />
n.t. 2.29 n.t. - n.t. - n.t. -<br />
26.05.-02.06.10 0.11 20 (Sorbopor) 62.98 n.t. 1.75 n.t. - 87.93 0.80 n.t. -<br />
(47.5-76.7) (66.5->125)<br />
PAC-UF<br />
Effect<br />
PAC-UF<br />
57
Table 19: Pseudokirchneriella subcapitata growth inhibition with nutrient addition after 3 d: EC50 [%] (95% confidence interval in brackets) <strong>and</strong> change index<br />
(CI) for the respective treatment steps.<br />
EN Entrée STEP, SB Sortie biologie, LF Lit fluidisé, OZ Sortie O3, CAG Sortie charbon actif granulé, SF Sortie filtre à sable, PAC-UF Sortie charbon actif en<br />
poudre - Ultrafiltration. n.t. not toxic, n.m. not measured. If e.g. only the influent sample was toxic, a surrogate EC50 <strong>of</strong> 110% (as the “real” value is >100%) was<br />
used for the not toxic samples in order to be able to calculate a change index.<br />
Date<br />
Ozone<br />
dosage<br />
-1<br />
(gO3 gDOC )<br />
PAC conc.<br />
(mg PAC/L<br />
wastewater)<br />
EN<br />
SB (1 st MC)<br />
LF (2 nd - 4 th MC)<br />
Effect<br />
Biology<br />
Swiss Centre for Applied Ecotoxicology, Eawag/EPFL · Überl<strong>and</strong>strasse 133 · CH-8600 Dübendorf www.oekotoxzentrum.ch<br />
OZ<br />
Effect<br />
OZ<br />
CAG (1 st , 2 nd MC)<br />
SF (3 rd ,4 th MC<br />
Effect<br />
OZ + SF<br />
20.-27.07.09 0.5 No PAC 86.3 n.t. 1.27 n.t. - n.t. - n.m. -<br />
30.10.-05.11.09 0.7 10 (Norit)<br />
(84.2-89.6)<br />
78.8<br />
(75.2-83.1)<br />
n.t. 1.40 n.t. - n.t. - n.t. -<br />
10.-17.03.10 0.8 12 (Sorbopor) 62.23<br />
(65.3-72.3)<br />
n.t. 1.77 n.t. - n.t. - n.t. -<br />
26.05.-02.06.10 0.11 20 (Sorbopor) 80.19<br />
(70.8-99.8)<br />
n.t. 1.37 n.t. - n.t. - n.t. -<br />
Table 20: Lemna minor growth rate fronds after 7 d: EC20 [%] (95% confidence interval in brackets) <strong>and</strong> change index (CI) for the respective treatment steps.<br />
EN Entrée STEP, SB Sortie biologie, LF Lit fluidisé, OZ Sortie O3, CAG Sortie charbon actif granulé, SF Sortie filtre à sable, PAC-UF Sortie charbon actif en<br />
poudre - Ultrafiltration. n.t. not toxic, n.m. not measured. If e.g. only the influent sample was toxic, a surrogate EC20 <strong>of</strong> 110% (as the “real” value is >100%) was<br />
used for the not toxic samples in order to be able to calculate a change index.<br />
Date<br />
Ozone<br />
dosage<br />
-1<br />
(gO3 gDOC )<br />
PAC conc.<br />
(mg PAC/L<br />
wastewater)<br />
EN<br />
SB (1 st MC)<br />
LF (2 nd - 4 th MC)<br />
Effect<br />
Biology<br />
OZ<br />
Effect<br />
OZ<br />
CAG (1 st , 2 nd MC)<br />
SF (3 rd ,4 th MC<br />
Effect<br />
OZ + SF<br />
20.-27.07.09 0.5 No PAC 20.5 36.1 1.76 53.5 1.48 64.7 1.79 n.m. -<br />
(6.7-35) (11.8-50.4) (40.9-63.8) (55.2-73.4)<br />
30.10.-05.11.09 0.7 10 (Norit) 100 n.t. 1.10 n.t. - n.t. 1.00 n.t. -<br />
10.-17.03.10 0.8 12 (Sorbopor) 47.9 95 1.98 86.92 0.91 72.42 0.76 100 1.1<br />
(24.7-67.7) (52.1-151) (42.8-95.4)<br />
26.05.-02.06.10 0.11 20 (Sorbopor) 74.94 n.t. 1.47 n.t. - 72.11 0.66 n.t. -<br />
(50.7-93.4) (61.7-80.5)<br />
PAC-UF<br />
PAC-UF<br />
Effect<br />
PAC-UF<br />
Effect<br />
PAC-UF<br />
58
Table 21: Lemna minor growth rate fronds after 7 d: EC50 [%] (95% confidence interval in brackets) <strong>and</strong> change index (CI) for the respective treatment steps.<br />
EN Entrée STEP, SB Sortie biologie, LF Lit fluidisé, OZ Sortie O3, CAG Sortie charbon actif granulé, SF Sortie filtre à sable, PAC-UF Sortie charbon actif en<br />
poudre - Ultrafiltration. n.t. not toxic, n.m. not measured. If e.g. only the influent sample was toxic, a surrogate EC50 <strong>of</strong> 110% (as the “real” value is >100%) was<br />
used for the not toxic samples in order to be able to calculate a change index.<br />
Date<br />
Ozone dosage<br />
-1<br />
(gO3 gDOC )<br />
PAC conc.<br />
(mg PAC/L<br />
wastewater)<br />
EN<br />
SB (1 st MC)<br />
LF (2 nd - 4 th MC)<br />
Effect<br />
Biology<br />
Swiss Centre for Applied Ecotoxicology, Eawag/EPFL · Überl<strong>and</strong>strasse 133 · CH-8600 Dübendorf www.oekotoxzentrum.ch<br />
OZ<br />
Effect<br />
OZ<br />
CAG (1 st , 2 nd MC)<br />
SF (3 rd ,4 th MC<br />
Effect<br />
OZ + SF<br />
20.-27.07.09 0.5 No PAC 92.7 74.4 0.80 80.3 1.08 83.1 1.12 n.m. -<br />
(68-170) (60.6-95.9) (71.7-90.7) (76.1-90.4)<br />
30.10.-05.11.09 0.7 10 (Norit) n.t. n.t. - n.t. - n.t. - n.t. -<br />
10.-17.03.10 0.8 12 (Sorbopor) 77.22 n.t. 1.42 n.t. - 94.27 0.86 n.t. -<br />
(61.7-100) (81.9-123)<br />
26.05.-02.06.10 0.11 20 (Sorbopor) 100 n.t. 1.10 n.t. - 92.16 0.84 n.t. -<br />
(92-133) (85.8-98.09<br />
PAC-UF<br />
Effect<br />
PAC-UF<br />
Table 22: Ceriodaphnia dubia mortality after 7 d: LC50 [%] for number <strong>of</strong> <strong>of</strong>fspring (95% confidence interval in brackets) <strong>and</strong> change index (CI) for the<br />
respective treatment steps.<br />
EN Entrée STEP, SB Sortie biologie, LF Lit fluidisé, OZ Sortie O3, CAG Sortie charbon actif granulé, SF Sortie filtre à sable, PAC-UF Sortie charbon actif en<br />
poudre - Ultrafiltration. n.t. not toxic, n.m. not measured. If e.g. only the influent sample was toxic, a surrogate EC50 <strong>of</strong> 110% (as the “real” value is >100%) was<br />
used for the not toxic samples in order to be able to calculate a change index.<br />
Date<br />
Ozone dosage<br />
-1<br />
(gO3 gDOC )<br />
PAC conc.<br />
(mg PAC/L<br />
wastewater)<br />
EN<br />
SB (1 st MC)<br />
LF (2 nd - 4 th MC)<br />
Effect<br />
Biology<br />
OZ<br />
Effect<br />
OZ<br />
CAG (1 st , 2 nd MC)<br />
SF (3 rd ,4 th MC<br />
20.-27.07.09 0.5 No PAC 90 54.6 0.61 83.1 1.52 73.5 1.35 n.m. -<br />
(41.9-73.6) (60-100) (60-90)<br />
30.10.-05.11.09 0.7 10 (Norit) 90 n.t. 1.22 90 0.82 n.t. - n.t -<br />
10.-17.03.10 0.8 12 (Sorbopor) 70.8 n.t. 1.55 n.t. - 90 0.82 n.t. -<br />
(60-90) (45->100)<br />
26.05.-02.06.10 0.11 20 (Sorbopor) 95.8 n.t. 1.15 n.t. - 97.3 0.88 n.t. -<br />
(95.1-97) (94.1-102)<br />
Effect<br />
OZ +<br />
SF<br />
PAC-UF<br />
Effect<br />
PAC-UF<br />
59
Table 23: Ceriodaphnia dubia reproduction after 7 d: EC20 [%] for number <strong>of</strong> <strong>of</strong>fspring (95% confidence interval in brackets) <strong>and</strong> change index (CI) for the<br />
respective treatment steps.<br />
EN Entrée STEP, SB Sortie biologie, LF Lit fluidisé, OZ Sortie O3, CAG Sortie charbon actif granulé, SF Sortie filtre à sable, PAC-UF Sortie charbon actif en<br />
poudre - Ultrafiltration. n.t. not toxic, n.m. not measured. If e.g. only the influent sample was toxic, a surrogate EC20 <strong>of</strong> 110% (as the “real” value is >100%) was<br />
used for the not toxic samples in order to be able to calculate a change index.<br />
Date<br />
Ozone dosage<br />
-1<br />
(gO3 gDOC )<br />
PAC conc.<br />
(mg PAC/L<br />
wastewater)<br />
EN<br />
SB (1 st MC)<br />
LF (2 nd - 4 th MC)<br />
Effect<br />
Biology<br />
Swiss Centre for Applied Ecotoxicology, Eawag/EPFL · Überl<strong>and</strong>strasse 133 · CH-8600 Dübendorf www.oekotoxzentrum.ch<br />
OZ<br />
Effect<br />
OZ<br />
CAG (1 st , 2 nd MC)<br />
SF (3 rd ,4 th MC<br />
Effect<br />
OZ + SF<br />
20.-27.07.09 0.5 No PAC 54.6 50.1 0.92 62.8 1.25 58.9 1.18 n.m. -<br />
(44.8-56.1) (56.2-79.5) (54.9-60.8)<br />
30.10.-05.11.09 0.7 10 (Norit) 55.4 n.t. 1.99 n.t. - n.t. - n.t. -<br />
10.-17.03.10 0.8 12 (Sorbopor) 50.246 n.t. 2.19 n.t. - 71.699 0.65 n.t. -<br />
(44.7-58.31) (31.6-88.1)<br />
26.05.-02.06.10 0.11 20 (Sorbopor) 58.199 n.t. 1.89 30 0.27 48.01 0.44 n.t. -<br />
(49.6-59.4) (42.9-54.6)<br />
PAC-<br />
UF<br />
Effect<br />
PAC-UF<br />
Table 24: Ceriodaphnia dubia reproduction after 7 d: EC50 [%] for number <strong>of</strong> <strong>of</strong>fspring (95% confidence interval in brackets) <strong>and</strong> change index (CI) for the<br />
respective treatment steps.<br />
EN Entrée STEP, SB Sortie biologie, LF Lit fluidisé, OZ Sortie O3, CAG Sortie charbon actif granulé, SF Sortie filtre à sable, PAC-UF Sortie charbon actif en<br />
poudre - Ultrafiltration. n.t. not toxic, n.m. not measured. If e.g. only the influent sample was toxic, a surrogate EC50 <strong>of</strong> 110% (as the “real” value is >100%) was<br />
used for the not toxic samples in order to be able to calculate a change index.<br />
Date<br />
Ozone dosage<br />
-1<br />
(gO3 gDOC )<br />
PAC conc.<br />
(mg PAC/L<br />
wastewater)<br />
EN<br />
SB (1 st MC)<br />
LF (2 nd - 4 th MC)<br />
Effect<br />
Biology<br />
OZ<br />
Effect<br />
OZ<br />
CAG (1 st , 2 nd MC)<br />
SF (3 rd ,4 th MC<br />
Effect<br />
OZ + SF<br />
20.-27.07.09 0.5 No PAC 67.2 63.5 0.94 71.1 1.12 62.6 0.99 n.m. -<br />
(60.2-76.2) (59.2-68.3) (63.1-82.5) (61.0-66.2)<br />
30.10.-05.11.09 0.7 10 (Norit) 67.3<br />
(58.6-78.2)<br />
n.t. 1.63 n.t. - n.t. - n.t. -<br />
10.-17.03.10 0.8 12 (Sorbopor) 58.38 n.t. 1.88 n.t. - 90.97 0.83 n.t. -<br />
(54.62-61.76) (75.2->125)<br />
26.05.-02.06.10 0.11 20 (Sorbopor) 60.37 n.t. 1.82 n.t. - 60.446 0.55 n.t. -<br />
(58.6-62.4) (56.4-65.0)<br />
PAC-<br />
UF<br />
Effect<br />
PAC-UF<br />
60
Table 25: Lumbriculus variegatus reproduction <strong>and</strong> biomass after 28 d: Mean (SD in brackets) <strong>and</strong> change index (CI) for the respective treatment steps.<br />
LF Lit fluidisé, OZ Sortie O3, CAG Sortie charbon actif granulé, SF Sortie filtre à sable, PAC-UF Sortie charbon actif en poudre - Ultrafiltration.<br />
Date<br />
Ozone<br />
dosage<br />
-1<br />
(gO3 gDOC )<br />
PAC conc. (mg<br />
PAC/L<br />
wastewater)<br />
02.04.-30.04.10 0.8 12 (Sorbopor)<br />
Control LF OZ<br />
Swiss Centre for Applied Ecotoxicology, Eawag/EPFL · Überl<strong>and</strong>strasse 133 · CH-8600 Dübendorf www.oekotoxzentrum.ch<br />
Effect<br />
OZ<br />
SF<br />
Effect<br />
OZ + SF<br />
PAC-UF<br />
Effect PAC-<br />
UF<br />
Reproduction (mean number <strong>of</strong> worms per<br />
treatment) [n] 38.9 35.5 38.5 1.08 27.5 0.77 24 0.68<br />
SD 6.31 6.81 2.08 6.45 5.89<br />
[%] 100 91.26 98.97 70.69 61.70<br />
02.04.-30.04.10 0.8 12 (Sorbopor) Mean individual biomass per treatment [mg] 0.71 0.912 0.557 0.61 0.882 0.97 0.59 0.65<br />
SD 0.12 0.03 0.17 0.18 0.11<br />
[%] 100 128.45 78.45 124.23 82.96<br />
61
Table 26: Oncorhynchus mykiss survival <strong>and</strong> developmental parameters: Mean (± SD in brackets) <strong>and</strong> change index for the respective treatment steps.<br />
LF Lit fluidisé, OZ Sortie O3, SF Sortie filtre à sable, PAC-UF Sortie charbon actif en poudre - Ultrafiltration.<br />
Date<br />
Ozone<br />
dosage<br />
-1<br />
(gO3 gDOC )<br />
PAC conc.<br />
(mg PAC/L<br />
wastewater)<br />
Swiss Centre for Applied Ecotoxicology, Eawag/EPFL · Überl<strong>and</strong>strasse 133 · CH-8600 Dübendorf www.oekotoxzentrum.ch<br />
Control LF OZ Effect OZ SF<br />
11.03.-19.05.10 0.8 12 (Sorbopor) Overall survival rate [n] 152 69 102 1.48 103 1.49 112 1.62<br />
[% <strong>of</strong> eggs at test<br />
start]<br />
95 57.5 85 85.8 100<br />
11.03.-19.05.10 0.8 12 (Sorbopor) Survival pre-hatch [n] 160 96 116 1.21 118 1.23 120 1.25<br />
[% <strong>of</strong> eggs at test<br />
start]<br />
100 80 96.7 98.3 100<br />
11.03.-19.05.10 0.8 12 (Sorbopor) Hatch [n] 160 96.0 116 1.21 118 1.23 120 1.25<br />
[% <strong>of</strong> eggs at test<br />
start]<br />
100 80 96.7 98.3 100<br />
11.03.-19.05.10 0.8 12 (Sorbopor) Survival post-hatch [n] 152 69 102 1.48 103 1.49 112 1.62<br />
[% <strong>of</strong> eggs at test<br />
start]<br />
95 71.8 88.2 87.2 93.3<br />
11.03.-19.05.10 0.8 12 (Sorbopor) Swim-up [n] 149 43 105 2.44 107 2.49 112 2.60<br />
[% <strong>of</strong> hatched] 93.1 45 90.7 90.5 93.3<br />
11.03.-19.05.10 0.8 12 (Sorbopor) Mean fresh weight <strong>of</strong> larvae at test end [mg] 337.6 158.6 273.3 1.72 267.1 1.68 332.6 2.10<br />
[%] 100.0 47.0 81.0 79.1 98.5<br />
11.03.-19.05.10 0.8 12 (Sorbopor) Mean length <strong>of</strong> larvae at test end [mm] 30.2 22.6 28.0 1.24 27.9 1.23 29.8 1.32<br />
[%] 100.0 74.8 92.7 92.4 98.7<br />
11.03.-19.05.10 0.8 12 (Sorbopor) Vitellogenin concentration [ng/mL] 10.6 63.1 9.9 6.37 14.1 4.49 10.2 6.18<br />
SD (4.7) (33.2) (7.1) (9.1) (5.8)<br />
[%] 100.0 208.8 32.8 46.5 33.8<br />
Effect<br />
OZ +<br />
SF<br />
PAC-<br />
UF<br />
Effect<br />
PAC-<br />
UF<br />
62